Embed Size (px)
Citation preview


(c) People Research on India's Consumer Economy (PRICE), 2016
Not for retail sale.
©2016, People Research on India's Consumer Economy (PRICE), New Delhi, India. All rights reserved. Developed and published in India. The contents of this publication are free for use as reference or distributed but commercial use is strictly prohibited. Reproduction or distribution in whole or in part in any media, including electronic media, is permissible upon due acknowledgment of the complete source as follows - Source: People Research on India's Consumer Economy (PRICE), New Delhi, India. Any unauthorised reproduction, distribution or translation of this publication after modification of the original content (in full or in part) is unlawful under Indian law and may result in either or both a civil claim for damages and criminal prosecution.

1
(c) People Research on India's Consumer Economy (PRICE), 2016
ICE 360o Survey, 2016
‘Household Survey on India’s Citizen Environment & Consumer Economy’
About the Survey
PRICE has completed its latest ICE 360o survey in August, 2016. This survey is larger is scope
and size, covering 300,000+ households through a household listing exercise, followed by a
more detailed survey of 60,360 households. Geographically, the sample has been drawn from
across 216 districts, 1217 villages and 487 towns spread across 25 major states. The survey is
designed to be multi-dimensional and goes beyond incomes and savings. It also takes a deeper
look at the economic and social well-being of Indian households, provides normative measures
of social, political and financial inclusion, degree of access to public goods and infrastructure
and welfare measures of the government. Special feature of the survey is that it consists of a
panel of 12,000 households which are common in both ICE 360o Survey, 2014 and ICE 360o
Survey, 2016, which will facilitate to take a longitudinal view of how the Indian consumption
landscape has evolved since the new government came to power.

2
(c) People Research on India's Consumer Economy (PRICE), 2016
Objectives
• To put more and more reliable and insightful people-level information into the public
domain that helps in better policy formulation, regulatory response and business strategy
development.
• Play a leading role in shining the light on issues that are unknown or blind spots.
• To bring the “human face” or people-centricity into India’s public policy debate and
discourse, which today is mostly focused on outlays not outcomes and on macro-economic
or supply side variables.
• To make both ECONOMIC and SOCIAL well-being of Indian citizens the end goal of policy and
business by encouraging government and corporate India to take note of people level data.
• To synchronise Indian Citizen engagement with public policy.
Content
The following themes will be explored by the survey:
Household Characteristics: Type of dwelling unit and availability and access to basic amenities, ownership of durables, intention to purchase in near future, livelihood linked seasonal migration trends, remittance behaviour, etc.
Social and Political Inclusion: Social discrimination, feeling of security within neighbourhood, areas of concern, food security, participation in social activities and political participation, membership in trade bodies, presence and usage of in trade and social networks, etc.
Access to welfare: Awareness of and participation in flagship government programs, method use to access information on current trade/occupation and schemes and benefits, degree of dependency on PDS, life cover, employment guarantee, etc.
Income and consumption: Volume of earned and unearned income in households from all sources, itemised consumption expenditure covering food and non-food items, utilities, debt servicing, non-routine expenses, etc.
Debt Situation of Households: Penetration of formal debt, purpose of debt (including consumption, production, for business expansion/seed capital), preferred source of credit, future intention and purpose for taking loan from formal and informal sources, current debt servicing costs, etc.
Financial Optimism: Perception about stability in major source of household income, level of satisfaction regarding financial situation of household, perceived economic class, expected change in household’s economic situation in next 3 years, etc.

3
(c) People Research on India's Consumer Economy (PRICE), 2016
Saving and Investment Behaviour: Cross market savings portfolios, market penetration (household) of broad investment modes, share of wallet – percentage share of total savings/investments by instruments, short and long term savings motivations, savings/investment plans for 2016-17, retirement outlook, remittances, awareness, understanding, and trust in financial instruments linked to capital markets, etc.
Labour market participation: Occupations of all members, sector of employment, job security and nature of contracting, social security and labour rights, disguised employment, etc.
Financial inclusion measure: Access to formal finance, sourcing of debt by purpose, debt servicing costs, bank account ownership, life insurance coverage, eligibility for accessing formal loan (proof of address, identity proof, availability of collateral for mortgage - real estate, gold, investments), awareness of prospect of leveraging owned assets for credit from FIs, etc.
Digital connectivity: Penetration of smart phones, degree of comfort with using VAS, access to internet and usage of internet to perform basic functions.
Access to public infrastructure: Availability and ease of access to public infrastructure, including health, education, judiciary, markets, essential commodities etc.
Citizen’s Report Card: Public opinion on direction of change of state of the nation, performance of the economy, governance, corruption, law and order, and other contemporary issues of national interest, and priority expectation from current government going forward.
Demographic Profile of all earners: Age, gender, education level, occupation of CWE, primary and secondary sources of income, unemployment by duration and profile of unemployed, etc.
Analysis Outputs
Some of the outputs envisaged from this survey and which are of interest for policy makers have been outlined below. These are by no means comprehensive and it is expected that far more data views will emerge with time.
Standard of Living and citizen’s report card
1. Rating of Indian states by their ability to provide its resident population with access to basic amenities at the household level.
2. Citizen’s report card on ‘State of the Nation’ and ‘Quality of Life’ based on perceived changes over last 3 years across critical outcomes viz. governance, law and order, economy, cost of living, women’s safety, environment and corruption.
3. Estimate and profile of India’s low income households which remain vulnerable to exploitation as they resort to risky/distress migration (without job contracts) for livelihood.

4
(c) People Research on India's Consumer Economy (PRICE), 2016
4. Whether investment in 2nd and 3rd order towns as growth magnets in last decade is reflected upon in any qualitative change in migration patterns in terms of destination points.
5. Financial outlook of Indian households - how has their family’s financial situation has changed over the last 3 years and what they expect in the next 3.
Access of public goods and social welfare
1. Extent of awareness of the Indian citizenry of the flagship welfare schemes of the present government and their reach among eligible populations.
2. Opinion on quality of implementation of welfare schemes and perceived impact on vulnerable households and overall rural transformation.
3. Estimate and profile of India’s households who remain food insecure and mapping of the volume of food insecurity by seasonality and geography.
4. Effectiveness of the public distribution system in being able to meet the production-consumption gap and reduce dependency on open market purchase.
5. Availability of LPG/piped gas, cable/dish connection, functional toilet, separate kitchen, drinking water purifier (any variety including candle/gravity filters).
6. Source of drinking water and distance from home, including year round availability.
7. Availability of electricity at home and average hours of supply during night.
8. Distance from residence to key infrastructure, viz. nearest all weather road (AWR), nearest hospital, current place of work, fair price shop, district collectorate, district court, nearest college and nearest bus stand.
9. Measuring household access to infrastructure index based on differential access to tap water within premises, LPG connection, electricity connection, toilet within premises, separate kitchen and presence of AWR within locality.
Social and financial inclusion
1. Demand and supply side issues that influence political exclusion – through an understanding of people’s inability to exercise their franchise during the last general elections, and their apathy with the electoral process.
2. Sizing our unemployment problem (by education of unemployed) and estimating total value of productive output lost due to unemployment.
3. Measuring digital connectivity by looking at penetration of smart phones and ability to use value added services (VAS); whether having used the internet (from own phone, PC or shared facility)to perform any online transaction or information download; and whether having an account in social media sites and extent of activity.
4. Measuring social inclusion of Indian households on the basis of membership in any trade association or professional body; affiliation to any self help group/thrift and credit group;
5
(c) People Research on India's Consumer Economy (PRICE), 2016
affiliation to any registered social or religious body; level of affinity with locality and feeling of security within neighbourhood; and availability of proof of citizenry, of local residence.
5. Measuring the proportion of India’s households who have experienced some form of discrimination (economic or social) at home or workplace.
6. Ranking of Indian states based on composite social inclusion index.
7. Measuring financial inclusion of households using following indicators:
Availability of bank account in his/her name.
Proof of local residence via a identity proof issued by government of India or its representative offices.
Ownership of credit card issued by a nationalized bank.
Whether currently servicing a loan taken through a Whether Chief Wage Earner (CWE) is currently servicing a loan which he/she has taken himself/herself.
Proof of employment and wage payment.
Access to collateral that can be pledged against credit, including ownership of any real estate with documentary evidence of ownership, investments in term deposits in banks/POs, and in securities and life insurance endowment plans; ownership of gold over and above what on worn on regular basis.
Extent of awareness that some forms of investments and family gold can be leveraged for accessing formal loans and attitude towards the same.
8. Estimate and profile of India’s earning population who remain ineligible for financial
inclusion because of not having a bank account, or their inability to produce the necessary documentation as proof of earning, employment or local residence, or lack of legal ownership of physical or financial collateral.
9. Potential of the underserved population – size of the potential savings pie comprising households belonging to the bottom two income quintiles, and what best way to reach out to this untapped market.
10. Total volume of business opportunity lost by bankers in providing credit to bank account holders who sourced loans from informal sources.
11. Ranking of Indian states based on a financial inclusion index.
Debt, financial behaviour and retirement
1. Estimate and profile of Indian earners who are vulnerable to income instability.
2. Estimate and profile Indian households who are consuming more than what they are earning and those who have discretionary savings after meeting all committed expenditure.
3. Expenditure of healthcare during the last fiscal year (In-patient department and out-patient department) and proportion that had insurance coverage.

6
(c) People Research on India's Consumer Economy (PRICE), 2016
4. Estimate and profile of Indian households with outstanding debt and the proportion among those who are likely to be able to repay outstanding debt based on current earnings and savings potential and highly expensive debt servicing costs on outstanding.
5. Proportion of households servicing inherited debt and purpose of borrowing and nature of debt servicing (proxy measure of bonded labour).
6. Estimate and profile of Indian households who have mortgaged collateral against outstanding debt and are at high risk of default and forfeiture owing to their low income.
7. Cross market savings and investment portfolios of Indian households and an estimation of penetration of different financial services.
8. Relative positions of savings flows into different instruments.
9. Nature of long and short term savings motivations of earners and whether current investment choices likely to yield sufficient returns to meet their needs.
10. Proportion of Indian earners with discretionary savings who remain unaware of capital markets linked investment instruments or have yet to participate.
11. Estimate and profile of the Indian working population that have no intention or means of retiring at 60.
12. What proportion of India’s earners are planning for retirement and the appropriateness of measures being taken by them to ensure old age financial security.
13. How confident are Indians about their financial security after retirement, including their expectations from their children.
Understanding occupation structures and labour market participation
1. Sizing India’s informal sector employment and the share of its output in the national Gross Domestic Product (GDP).
2. Carrying capacity of agriculture – are traditional agrarian households increasingly engaging in non-farm activities as a survival mechanism.
3. Estimate and profile of disguised unemployment in India, especially in the agriculture sector.
4. Estimate and profile of India’s formal and informal sector workforce based on social security coverage, availability of job contracts, and workplace benefits including paid leave.
5. The extent of labour rights violations at the workplace that take place in the informal sector.
6. Creation of a labour market inclusion index based on based on size of holdings (for cultivators), extent of specialization required to perform the economic activity (for self

7
(c) People Research on India's Consumer Economy (PRICE), 2016
employed); grade of employment + extent of availability of job contract, paid leave, social security (for those earning salaries or wages); and based on availability of job contract and/or paid leave (for casual labour).
7. For all CWEs we have included a question on number of days in the past 12 months have they got employment with full wages with those having gotten less than 183 days of full employment as being excluded from the labour market, and those who did get above the threshold but worked without and benefits and contracts at the lowest level of inclusion.
Income, consumption and discretionary savings
1. Primary and secondary sources of income for entire household will be captured. This will include income from both earned and unearned sources.
2. We will link income sources linked to occupation classifications for future disaggregated
analysis. 17 income sources have been scripted. 3. Under household consumption expenditure, we will be categorising food items on the basis
of frequency of purchase, viz.
Cereals and pulses (including rice, wheat/flour, other cereals, pulses and pulse products).
Non-cereal food items (including milk and milk products, fruits and vegetables, meat, fish and eggs).
Other food items (including sugar, salt, spices, edible oils, beverages for home consumption, other occasional food items including packaged foods, alcohol and tobacco).
4. For consumer services, the itemised budget heads will include education expenses,
outpatient health expenditure, premium for health insurance, telephone bill, electricity and water charges, society maintenance, (charge/salary payment for domestic help/driver/sweeper, etc.), general entertainment (including cost of newsprint, cable/dish, dining out and entertainment), and other services.
5. For non-food items, we will include house rent or regularised repayment on mortgage, any
regular debt servicing, expenditure of fuel, commuting to work, clothing and footwear, any financial investments, remittances, etc.
6. All non-routine/unusually large expenditure during the year, including purchase of
consumer durable, any vehicle, any real estate (down payment), upgrades and repairing, one-time payment made as an investment into a financial instrument, social, down payment linked to education of children, hospitalisation expenses (all In-patient department charges) and transport charges due to a medical emergency/medical procedure, expenses incurred for undertaking a holiday, and investment in gold/other precious metals.
7. Households with balance savings after deducting all expenditures from income.

8
(c) People Research on India's Consumer Economy (PRICE), 2016
Demographic details of Indian households
1. For each adult member (15 or more) in the household, we will capture age in completed
years, gender, marital status, highest completed level of education, whether currently attending school (only for 5 – 18 year olds), principal activity status, regularity of participation in any work that generates income for your family, whether adult members who are engaged in work receive any income for themselves for the work that they do
2. The outputs that can be expected from this segment include the following:
Dependency ratios of different family structures and economic positions.
Trends in single, double and more than double earner households across geographic clusters.
Relationship between number of earners and aggregate household income and per capita income (PCI). The hypothesis is that beyond a point, increasing number of earners in a family is a sign of distress and indicates a survival tactic which leads to nominal increase in household income and a sharp decline in PCI.
Work force participation rate (WFPR) (in real earner terms) by gender. Incidence of child labour as well as people engaged in economically gainful work post retirement. Incidence of disguised unemployment in the economy (specifically in the farm sector) in the context of feminization of agriculture.

9
(c) People Research on India's Consumer Economy (PRICE), 2016
Survey Features and Allocation
Feature ICE 360o Survey, 2014 ICE 360o Survey, 2016
Survey type Cross section Best mix of Baseline-Panel-Longitudinal and Cross-sectional
Sample design
Three-stage stratified random sampling Rural: District-Villages- Households Urban: Towns-UFS blocks-Households
Same as ICE360o Survey, 2014
Coverage 21 Indian states 25 major states
Unit of selection and data collection
Households Households
Sampling frame 10,01534 households 300,000 households
Sample size 20,195 households 61,000 (20,000 panel)
Method of data collection
Face-to-face interview Face-to-face interview and focus groups
Respondents Chief Wage Earner Chief Wage Earner (CWE), House wife, Youth
Collection of primary data
September-November , 2014
Listing of households (November 2015-January 2016); Main survey (March-August 2016)

10
(c) People Research on India's Consumer Economy (PRICE), 2016
Sample summary
Location Sampling Units ICE 360o Survey,
2014 ICE 360o Survey,
2016
Rural
Districts 72 165
Villages 300 1,217
Sampling Frame -Households 30,048 120,000
Main Survey -Households 5,997 25,000
Urban
Districts 81 487
Urban Blocks 710 1,801
Sampling Frame -Households 71,486 1,80,000
Main Survey -Households 14,198 36,000
ALL INDIA
Districts 110 216
Villages/ Urban Blocks 1,010 3,018
Sampling Frame -Households 10,1534 300,000
Main Survey -Households 20,195 61,000
Representativeness of sample and analysis on the national macro-economic scenario:
The data will be weighted to allow reporting at the following levels of disaggregation:
State-wise, rural/urban, independent estimates for 25 clusters (group of homogeneous districts) separately for rural & urban
Independent estimates for over 50 major cities.
Independent estimates for 5 sizes of town categories within each state.
Independent estimates for by size of villages within each state and clusters.
Many more…..

11
(c) People Research on India's Consumer Economy (PRICE), 2016
Data Validation and Reliability of Estimates
Income and expenditure surveys often tend to bring to fore certain stark trends and statistics. And invariably doubts are raised over the reliability of such data. It should be admitted that there is no full proof method by which one can establish the reliability of all the survey results. There are, however, certain procedures by which it is possible to make assessment of the degree of confidence that can be placed on the findings of the survey. The most widely used and fruitful procedure is to compare the survey estimates with the estimates generated by other reliable sources despite the difficulty to obtain estimates which are comparable from the point of view of concepts, coverage of population and period to which data refer. However, such comparison provides some basis for judging the degree of reliability and hence an attempt is made to compare the survey results with the available external data.
Demographic characteristics: Information relating to key demographic characteristics of the Indian households is available from various rounds of National Sample Surveys and Census', with which the present survey (ICE 360o Survey, 2016) results can be compared. According to the ICE 360° Survey, there are 280.6 million households in the country, of which 34.3 per cent (96.2 million) live in urban areas and the rest (184.3 million) in rural areas. Estimate of average household size from ICE 360° Survey, 2016 (4.7 members) appears consistent with the estimates obtained from NSS 68th round, 2011-12 (4.4 members) and Census 2011 (4.9 members). All the three data sources are also fairly comparable on some other parameters, such as the distribution of households by socio-religious groups. It is to be noted that the share of households across different socio-religious groups in rural India as observed in ICE 360° Survey, 2016 appears to be very similar to those obtained from NSS, 2014 (Education Survey) and Census, 2011 estimates. However, in case of urban India, ICE 360° Survey has covered a slightly higher share of hindus relative to other religions.
Demographics profile of Indian households
Census, 2011 NSS,
2011-12 ICE 360°
Survey, 2014 ICE 360°
Survey, 2016
Rural
Estimated households (Million) 168.6 172.1 179.5 184.3
Estimated population (Million) 833.7 792.1 845.0 889.5
Household size 4.94 4.60 4.71 4.83
Urban
Estimated households (Million) 80.9 78.2 90.6 96.2
Estimated population (Million) 377.1 316.9 419.9 440.3
Household size 4.66 4.05 4.63 4.58
All India
Estimated households (Million) 249.5 250.3 270.1 280.6
Estimated population (Million) 1210.8 1109.0 1264.9 1329.8
Household size 4.85 4.43 4.68 4.74

12
(c) People Research on India's Consumer Economy (PRICE), 2016
Sources of Household Income: In case of urban India, while NSSO 68th round reported a considerably higher share of salaried (41.5 per cent) as compared to labourers (24 per cent), ICE 360° Survey observed almost similar shares of households with these two sources as the principal sources of income. Share of urban households who are self-employed in non-agriculture activities are not very different across these two sources, although NSS reported a slightly higher share in 2011-12. In rural India, ICE 360° Survey has captured relatively lower shares of self-employed households as compared to NSS. However, share of casual labour households covered is similar in both the surveys.
Distribution of URBAN households by source of income
Distribution of RURAL households by source of income
34.4
41.5
24.0
30.6 32.1
37.4
30.3
35.5 34.2
0.0
10.0
20.0
30.0
40.0
50.0
Self employment in non-agriculture
Salaried Labour and others
Ho
use
ho
lds
(%
)
NSS, 2011-12 ICE 360° Survey, 2014 ICE 360° Survey, 2016
16.1
34.5 34.4
15.0 13.5
38.7
30.6
17.1
12.9
36.3
28.2
22.6
0.0
10.0
20.0
30.0
40.0
50.0
Self employment in non-agriculture
Casual wage labour Self employment in agriculture
Others
Ho
use
ho
lds
(%
)
NSS, 2011-12 ICE 360° Survey, 2014 ICE 360° Survey, 2016

13
(c) People Research on India's Consumer Economy (PRICE), 2016
The size of cultivable land owned by a household is an important indicator of the economic status of the household which is certainly more relevant in the context of rural areas as compared to urban. As per ICE 360° Survey 2016, while nearly 57 per cent of rural households in India do not possess any cultivable land, another 30 per cent are marginal farmers (0-1 hectare of land). Since share of landless households have increased over the years, we can see the proportional adjustment in distribution of households across the other land categories between 2011-12 and 2015-16.
Distribution of RURAL households by size of cultivable land category1
Estimates of Income, Expenditure and Saving: An average household in India had an annual income of 202,076 in 2015-16, and an expenditure of 133,208, leaving it with a surplus of
688,67 to save and invest.
A common problem faced in such surveys is the under-statement of economic data (income, expenditure and savings) by the respondents. The adopted concept of income in ICE 360° Survey, 2016 includes wages, salaries, bonus, business, profession, farm income and other forms of labour income, pensions, rent, interest, and dividend, the aggregate income of Indian households is estimated to be 56,697 billion, which is 56.9% of the household disposable income (HDI) estimated from National Accounts Statistics for the twelve-month period, April 2015-March 2016. An estimate of surplus income (as an indicator of savings) is arrived at by subtracting the total household expenditure from the total household income. Through this method, this survey found estimates of savings as a proportion of disposable income to be 34.1 per cent.
1 Landless: 0 hectares; Marginal farmers: 0-1 hectares; Small farmers: 1-2 hectares; Semi-medium farmers: 2-
4 hectares; Medium farmers: 4-10 hectares; Large farmers: more than 10 hectares
44.2
37.0
10.6
5.8 2.0 0.3
50.3
37.2
7.3 3.3 1.7 0.1
56.9
30.1
7.7 4.0
0.9 0.4 0.0
10.0
20.0
30.0
40.0
50.0
60.0
70.0
Landless Marginal farmers
Small farmers Semi-medium farmers
Medium farmers
Large farmers
Ho
use
ho
lds
(%
)
NSS, 2011-12 ICE 360° Survey, 2014 ICE 360° Survey, 2016

14
(c) People Research on India's Consumer Economy (PRICE), 2016
Ownership of Basic Amenities: At the all India level, the proportion of households owning different types of basic amenities such as electricity, tap water, toilet and LPG/PNG has improved significantly between 2011 and 2016. In almost all the categories the ownership increased in the range of 20 to 30 percentage points at the all India level. Among these four amenities, improvement in ownership between 2011 and 2016 has been relatively lower in case of ownership of toilet facilities within premises. Again, improvement in ownership of these amenities is higher in rural India as compared to urban, except for tap water where progress in almost similar in rural and urban areas. However, if we compare the estimates between the last 2 years from the ICE 360 surveys of 2014 and 2016, there is no noticeable improvement in ownership of these amenities except for ownership of tap water facility within the household, which is improved by 16 percentage points.
Distribution of ALL INDIA households by basic amenities
Distribution of RURAL households by basic amenities
66.2
26.4
46.3
28.1
87.3
36.5
60.1
51.1
87.6
52.6
62.7 54.5
0.0
20.0
40.0
60.0
80.0
100.0
Electricity Tap water Toilet LPG/PNG
Ho
use
ho
lds
(%
)
Census, 2011 ICE 360° Survey, 2014 ICE 360° Survey, 2016
54.8
13.9
30.6
11.3
81.8
25.2
46.6
34.6
82.6
38.5
50.8
38.8
0.0
10.0
20.0
30.0
40.0
50.0
60.0
70.0
80.0
90.0
Electricity Tap water Toilet LPG/PNG
Ho
use
ho
lds
(%
)
Census, 2011 ICE 360° Survey, 2014 ICE 360° Survey, 2016
15
(c) People Research on India's Consumer Economy (PRICE), 2016
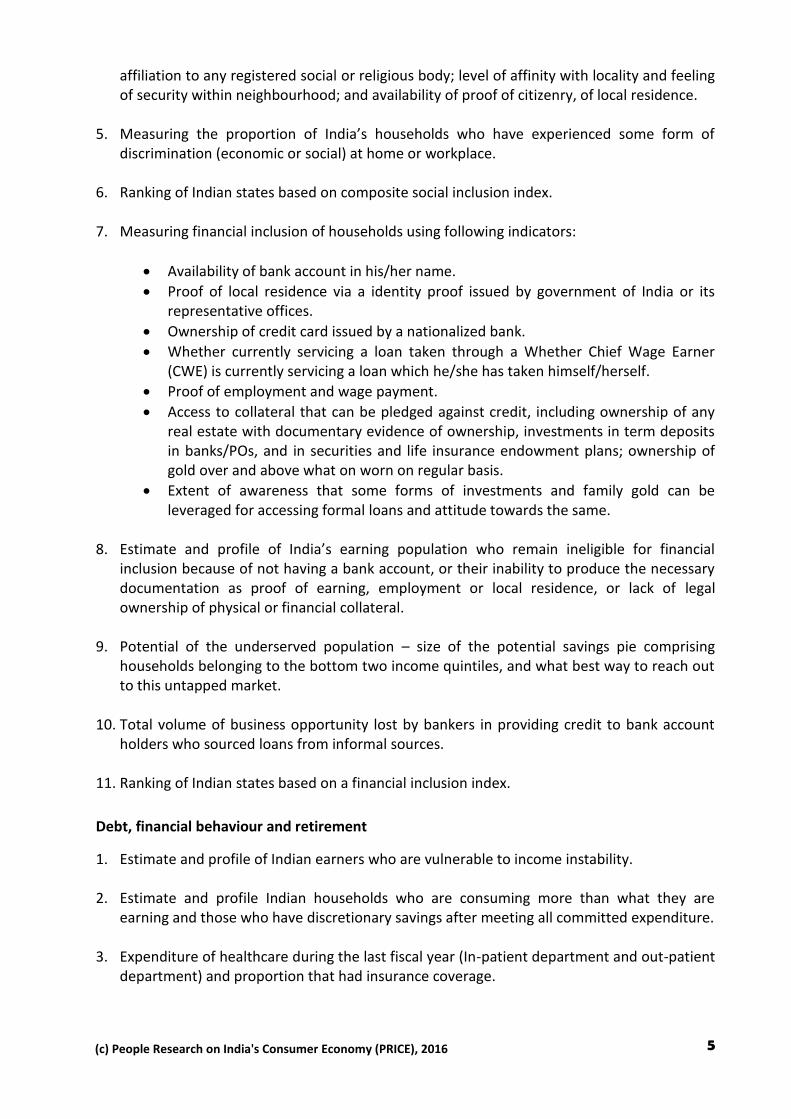
Distribution of URBAN households by basic amenities
Primary source of energy used for cooking: Compared to 2011-12 estimates from NSS, the proportion of households using LPG/Piped Gas as cooking fuel in the year 2016, as estimated from ICE 360 Survey, 2016, has increased by 17 percentage points and 9 percentage points respectively in rural and urban India. Specifically in rural India, proportion of households using firewood and dung cakes for cooking has come down significantly.
Distribution of households by primary source of energy for cooking (%)
Rural Urban All India
NSS, 2011-12
ICE 360° Survey,
2016
NSS, 2011-12
ICE 360° Survey,
2016
NSS, 2011-12
ICE 360° Survey,
2016
LPG 15.2 32.5 73.0 81.7 32.5 49.4
Firewood/dung cake 77.9 63.7 16.8 13.6 59.6 46.5
Others 6.8 3.8 10.2 4.6 7.9 4.1
Total 100.0 100.0 100.0 100.0 100.0 100.0
Ownership status of house: Ownership status of houses in India is generally observed to be quite different in rural areas as compared to urban. In rural India, the distribution of households across ownership status of their houses as estimated from ICE 360° Survey has been observed to be very similar to what was observed in 2011-12 as per NSS survey. However,
90.0
52.4
79.1
63.2
98.1
59.0
87.0 83.9
97.1
79.6 85.5 84.6
0.0
20.0
40.0
60.0
80.0
100.0
120.0
Electricity Tap water Toilet LPG/PNG
Ho
use
ho
lds
(%
) Census, 2011 ICE 360° Survey, 2014 ICE 360° Survey, 2016

16
(c) People Research on India's Consumer Economy (PRICE), 2016
in urban India it is observed that that has been a rise of around 8 percentage points in proportion of households staying in owned houses and a similar decline in the share staying in rented houses between 2011-12 and 2015-16.
Distribution of households by ownership status of house (%)
Rural Urban All India
Census, 2011
ICE 360° Survey,
2016
Census, 2011
ICE 360° Survey,
2016
Census, 2011
ICE 360° Survey,
2016
Owned 94.7 95.6 69.2 77.4 86.6 89.3
Rented 3.4 3.2 27.5 20.6 11.1 9.2
Any other 1.9 1.2 3.3 2.0 2.4 1.5
All Households 100.0 100.0 100.0 100.0 100.0 100.0
Estimates of Sampling Error: To check the data reliability, a variety of methods are used. The most common amongst them are evaluation of sampling and non-sampling errors. Sampling errors are measurable within the framework of the sample design and are also controllable by varying the size of the sample. For instance, the average per capita income is 42,635 and coefficient of variation of the estimated per capita household income for various income quintiles is consistent and within permissible limits. This generates a fair degree of confidence in the ICE 360° survey estimates.
Estimates of standard errors
Per capita income quintile % share in
households % share in
total income
Per capita income (Rs. Per annum)
Coefficient of variation
(%)
Q1 – (Bottom 20%) 15.2 7.0 14,850 46.6
Q2 17.5 10.8 23,128 42.7
Q3 20.1 15.2 32,373 44.6
Q4 21.9 22.1 47,123 45.0
Q5 – (Top 20%) 25.4 44.9 95,694 71.5
Total 100.0 100.0 42,635 85.1
17
(c) People Research on India's Consumer Economy (PRICE), 2016
Another important source of error, which can vitiate the estimates, is the non-response rate. In
the case of this survey, it was around 3 per cent and largely due to unanticipated reasons such
as the psychology of the respondent. Non-sampling errors arise mainly from three sources.
The, respondents refuse to cooperate and deny information; they supply partial information
that may not be usable; or they deliberately provide false information. Two, the interviewers
are also prone to have some preconceived notions whereby some biases creep into the
schedules. Three, respondents may not remember all the relevant numbers sought by the
interviewers. And this tends to considerably increase the margin of error in the data collected.
There is no satisfactory procedure for a precise measurement of non-sampling errors. A team
of trained interviewers (200), supervisors (52) and PRICE professionals (10) from different
language groups were engaged for about three months to undertake the task of primary data
collection. The field team was thoroughly trained through all the phases of the surveys. Every
care was taken to implement maximum possible quality control in recording of the answers of
the respondents.