Embed Size (px)
Citation preview

Not a Cycle of Violence:
An Episodic Analysis of The Israel-Gaza Conflict
Alexei Abrahams∗, Eli Berman†, Prabin Khadka‡, Esteban F. Klor§, and John Powell¶
February 2018
Does violent retaliation of state and non-state actors to violent attacks lead to deterrence
or, on the contrary, to counter-retaliation and an increase in violence? This paper studies this
issue focusing on the Gaza-Israeli conflict between 2007 and 2014 using original security reports
from the United Nations. The data include all Palestinian projectile launches (over 16,000) and
Israeli airstrikes (over 8,800) during the period at issue down to the five-minute interval at which
the action occurred. Our findings argue against the importance of cyclical counter-retaliation as
driving this persistent conflict. First, this conflict is characterized by short-lived episodes of violence
separated by quiet interludes. Violent episodes tend to last less than one day and are followed by
three and a half days without attacks. Second, 61% of violent episodes include an initial attack
that doesn’t induce a retaliation, and among the ones that do, the median number of successive
counter-retaliations is only 3. Third, violent episodes are not themselves cyclically related: 91% of
violent episodes are initiated by Gazan militants attacks and 84.9% of violent episodes end with
a Gazan militant attack. Finally, we find no evidence that episodes with counter-retaliations (i.e.,
cycles of violence) induce or deter subsequent violence. The median number of days without attacks
after cycles of violence (3.1) is almost the same to the median number of days without attacks for
all episodes (3.4). Moreover, the type of projectile launched by Gazan militants does not seem to
be affected by Israeli retaliation or the lack thereof.
∗ Harvard University, Belfer Center - Middle East Initiative; alexei [email protected]; † Department of
Economics, University of California at San Diego; [email protected];‡ Department of Politics, New York University; §
Department of Economics, The Hebrew University of Jerusalem; [email protected]; ¶ Harvard Kennedy School, Stan-
ford Graduate School of Business

1. Introduction
Whether by American drones bombing Al-Qaeda operatives in Yemen’s Hadramawt Desert, or
ISIS operatives spraying civilians with gunfire in downtown Paris, state and non-state actors are
regularly projecting violence across borders. This leads us to the main question of this paper:
How should state and non-state actors respond to violent attacks? For politician and policymakers
wishing to minimize future violence and/or seeking optimal strategies to ensure national security,
the same basic tradeoff arises. On the one hand, responding to attacks with reprisals can deter
future aggression by attaching a price tag (Schelling, 1966). On the other hand, there are many
other instances where reprisals have provoked deadly counter-reprisals or ‘blowback’ (Johnson,
2000).
The response to Hizbullah’s rocket attacks on northern Israel in the summer of 2006 is perhaps
the clearest demonstration of the deterrent logic of retaliation in recent history. The Israeli air force
(IAF) bombed southern Lebanon with cluster munitions, killing a substantial number of Hizbullah’s
soldiers while destroying bridges, roads, and other infrastructure. Though Hizbullah’s capacity to
inflict harm was not meaningfully diminished, they nonetheless became hesitant to launch further
attacks, and the two sides have remained in a peaceful equilibrium of mutual deterrence ever since
(Sobelman, 2017). On the contrary, Israel’s assassination of Hamas operative Yahya Ayyash in
January of 1996 is an example of retaliations leading to deadly counter-reprisals. Right after the
assassination Hamas observed forty days of mourning, and then carried out a series of retaliatory
suicide bombings that claimed the lives of 59 Israeli civilians (Ephron, 2015). Therefore, a clear
understanding of the deterrence-blowback tradeoff is critical for state and non-state actors that
want to avoid protracted cycles of violence.
Quantifying this tradeoff for a given context seems to be a problem well suited for social sci-
entists. Yet, preliminary efforts have so far reached contradictory conclusions. If the blowback
effect dominates, we should observe that violence follows a cyclical pattern, with reprisals giving
rise to counter-reprisals, and so on. In search of these cycles, studies have thus far focused on the
Israel-Palestine conflict, which makes sense for at least two reasons. First, among all contemporary
conflicts, the Israeli-Palestinian conflict is relatively self-contained, unlike the nebulous ‘war on ter-
ror’ waged between Western allies and groups like ISIS and Al-Qaeda. Second, among self-contained
conflicts, the Israeli-Palestinian conflict lends itself to statistical analysis via a consistently high
1

rate of violent incidents, in contrast to, say, the conflict between Israel and Hezbollah.
Not only have studies focused on the Israeli-Palestine conflict, but they have almost all relied on
a vector auto-regression (VAR) framework, which allows for causal feedback between actions and
reactions. Despite these commonalities, the results of these studies are at odds with each other.
Applying a VAR methodology to fatalities data from the Second Palestinian Uprising (2000-2005),
Jaeger and Paserman (2008) find that Israel retaliates against Palestinian attacks, but Palestinians
do not counter-retaliate. Haushofer et al. (2010) also apply a VAR framework to fatalities data
augmented with Palestinian rocket launch incidents. They find that both sides retaliate. Duggan
and Chenoweth (2012) run VAR-like regressions using different data, finding evidence that Pales-
tinians retaliate while Israeli actions are apparently unprovoked. Thus, despite using the same
methodology and restricting their focus to the Israeli-Palestinian conflict, the literature is far from
reaching a consensus on the deterrence-blowback tradeoff.
While the studies cited above use disaggregated daily data and standard econometric techniques,
we believe that the existing literature suffers from several shortcomings. The main empirical issue
is that all related studies rely on a VAR framework, which we argue may not be the appropriate
tool to establish the existence or not of cycles of violence. Whereas a VAR analysis may be helpful
to determine whether Israel retaliates to Palestinian violence, and Palestinians retaliate to Israeli
violence, the VAR analysis does not push the data far enough. While a VAR analysis allows us to
determine whether or not a protracted cycle of violence exists between the two sides, it still leaves
most of the important questions following a cycle of violence approach open: (i) How do cycles
start? (ii) How do they end? (iii) Does retaliation lead to escalation or de-escalation of violence?
and (iv) Are violent episodes linked to each other by a pattern of provocation and reprisal?
This paper addresses the questions above focusing on the protracted Gaza-Israeli conflict be-
tween 2007 and 2014. The analysis relies on daily original security reports from the United Nations
on violent incidents in the Gaza Strip between 2007 and 2014. These reports include all Palestinian
projectile launches (over 16,000) and Israeli airstrikes (over 8,800) during the period at issue down
to the five-minute interval at which the action occurred. We supplement these data with weekly
Israeli counter-terrorism reports (2009-2016). All told, our data span 111 months of conflict.
The available data allow us to cluster fluctuations on violence into violent episodes. Using a
subset of reprisals explicitly linked to earlier provocations, we find that it usually takes both sides
at most two days to retaliate to provocations. We use this upper bound to cluster violent incidents
2

into episodes, where episodes are separated from each other by at least two days of quiet.1 They
are thus unlikely to be related to each other in the sense of provocation-reprisal (for robustness, we
also create violent episodes using a longer threshold for days of quiet). We focus on these episodes
to analyze the observed patterns of attacks, retaliations, and counter-retaliations. We also analyze
how violent episodes start after periods of calm, escalate, de-escalate, and end.
The results of our analysis show that violent attacks between Israel and Gazan militants exhibit
an episodic pattern consisting of brief projectiles and airstrikes skirmishes lasting one day, and
separated by over three days of quiet. Over 90% of these episodes of violence are started by
Gazan militants and almost 85% of them are ended with a Gazan militants’ attack. In fact, in
58.7% of violent episodes only Gazan militants commit attacks. Israel tends to be patient on its
retaliation policy, and tends to wait for five or more projectiles attacks before retaliating (if at
all). On the contrary, Gazan militants retaliate to Israeli airstrikes right after one or two attacks.
Whereas a VAR analysis would lead us to believe that both sides are trapped in a protracted cycle
of violence, our episodic analysis shows that less than 30% of violent episodes actually constitute
cycles of violence, in the sense that they include an attack, a retaliation and a counter-retaliation.
Cyclical episodes are more violent (in terms of number of attacks) and last longer than non-violent
episodes. Interestingly, cyclical episodes (which include Israeli retaliations) do not seem to deter
future violence. The median number of days without attacks after an episode is almost the same
for cyclical and non-cyclical episodes. Moreover, the type of projectile launched by Gazan militants
in any given attack (mortars, Qassam rockets or Grad Rockets) does not seem to be affected by
Israeli retaliation (or the lack thereof).2
This research project, based on a careful analysis of two new data sources (which provide
unprecedented detail on up to the minute incidents previously unrecorded) presents an alternative
approach to study the pattern of violence in protracted conflicts. It focuses on violent episodes
as well as on periods of calm to study who initiates violent episodes, what leads these episodes
1This methodology is similar to clustering using the “nearest neighbor search,” which is common in computer
science. See, for example, Knuth (1973).2Mortars are indirect devices that launch projectiles to short ranges, which usually explode on open fields of
kibutzim surrounding the Gaza Strip. Qassam rockets have a longer range, up to 16km, and affect cities bordering the
Gaza Strip. Finally, Grad and Katyusha rockets can reach cities over 50km away from the Gaza Strip, like Southern
Jerusalem and Tel Aviv. Israel relates to the firing of projectiles with a longer reach against more populated cities
as an escalation in the level of violence.
3

to cycles of violence, and what brings these cycles to an end. This analysis complements previous
studies of the Israeli-Palestinian conflict using VAR analyses.3 Whereas VAR analyses tend to show
that both sides retaliate to violence, the episodic analysis of this paper clarifies how violent attacks
unfold within and between violent episodes.
Overall, this paper highlights a new type of analysis for protracted violent conflicts between
state and non-state actors that has been ignored in the literature on political conflict. We hope
that the insights of this study will provide a better understanding of protracted conflicts and their
patterns of violence, and lead to policy recommendations conducive to truces for violent conflicts
in the Middle East as well as for other protracted conflicts around the world. In addition, we hope
that paper will lead by example, encouraging researchers studying political conflict to investigate
time series data more creatively instead of directly applying off-the-shelf statistical methods like
VAR.
2. Data
Our analysis relies on high frequency original data from the United Nations. This data set consists
of daily security reports of notable violent incidents in the Gaza Strip recorded by UN observer
teams dating from October 2006 through December 2014. We begin analyzing the UN reports
on June 15th, 2007, the date on which the Islamic Resistance Movement (Hamas) seized control
of the Gaza Strip from Fatah security forces. The original reports are stored in MS Word files.
We batch-convert these to OpenOffice files, then import their text content to Python and exploit
formatting regularities to extract the date, timestamp, and location of every single violent incident
mentioned in the reports. Figure A1 in the appendix exemplifies a flowchart of data generation for
two incidents on June 25th, 2007.
The reports typically summarize each incident in two or three sentences. We exploit contextual
knowledge and verb patterns to write a Python grammar parser that extracts the attacker, target,
type and quantity of munition, and casualties associated with each violent action. Figure A2 in the
appendix illustrates how the grammar parser works using as examples two events that occurred on
August 17th, 2010. We cross-validate these data with daily human-coded aggregations of the same
3In addition to the studies cited above, see Jaeger and Paserman (2006; 2009) for another two prominent studies
of the Israeli-Palestinian conflict using a VAR-style framework.
4

reports, finding a 99% correlation for daily projectile tallies fired from Gaza towards Israel, and a
98% correlation for daily airstrike tallies fired by the Israeli Air Force (IAF).4
Figure 1 presents the daily tallies of IAF’s airstrikes and Gazans’ projectiles using UN data.
There are a total of 8,653 airstrikes and 16,473 projectiles fired between October 2006 and December
2014. This shows the high level of violence prevalent during this period. Out of 2,740 days included
in our sample, Gazan militants fired at least one projectile in 46.8% of them (for a total of 1,283
days with Gazan violence) and the IAF carried out at least one airstrike in 18.4% of them (for a
total of 504 days with an Israeli airstrike).
These numbers mask the great deal of variation on the level of violence over time. This pattern is
clearly depicted in Figure 1. The figure shows a relatively low number of daily attacks, together with
extremely violent periods occurring right before and during major violent confrontations between
Israel and Hamas. These include several major Israeli military operations, most notably Operation
Cast Lead (December 27th, 2008 until January 18th, 2009), Operation Pillar of Defense (November
14th, 2012 until November 21st, 2012) and Operation Protective Edge (June 12th, 2014 until August
26th, 2014). The figure makes evident that Gazan violence is more evenly distributed over time,
whereas Israeli violence substantially increases during its military operations. This figure also shows
that the overall level of violence substantially decreases after those operations vis-a-vis the level of
violence before the operations.
We complement the available UN data with weekly counter-terrorism reports on the Gaza Strip
compiled by The Meir Amit Intelligence and Terrorism Information Center, an Israeli think tank.
The Meir Amit’s reports on the Gaza Strip date back to April 15th 2009.5 The Meir Amit reports
are compiled by Israeli staff who are obviously not on the ground in The Gaza Strip. As a result,
their reports are not nearly as comprehensive as those compiled by the UN ground teams, and
are particularly poor when documenting major military operations. On the other hand, Meir
Amit reports draw on the IAF’s twitter feed, other social media sources, and official websites of
Palestinian militant groups to confirm, whenever possible, the main motive behind each violent
action. We human-code each violent incident recorded in these reports.
4During the period at issue Gazan militants fired mortars and rockets towards Israel. Our data set contains
detailed information on the type of weapon fired, and we use that information in our empirical analysis. In the text
of this paper, for brevity’s sake, we use the word ‘projectiles’ to refer to mortars or rockets.5These reports are freely accessible at http://www.terrorism-info.org.il/. Our analysis includes all the reports
between April 15th, 2009 until July 1st, 2016.
5

Using Meir Amit data we identify 303 Israeli airstrikes and 26 Palestinian projectiles launches
as reprisals explicitly linked to earlier recorded provocations. These figures represent 85.8% of all
Israeli airstrikes and 4.0% of all Palestinian projectile launches recorded in the Meir Amit data. The
substantial difference in terms of reprisals (85.8% versus 4.0%) could well be driven by reporting
bias: Meir Amit is based in Israel and is partly staffed by Israeli army veterans, which may lead
them to follow more feeds from Israeli sources than Palestinian sources. With that caveat in mind,
we use Meir Amit data in the body of this paper to calculate the typical delay in carrying out a
reprisal attack.
As Figures 2 and 3 suggest, both Israelis and Gazans tend to retaliate within one or two days
of the initial attack, with few exceptions. The speediness of retaliations makes sense for at least
two reasons. First, both sides have the technological capability to retaliate within hours of an
attack. Israel keeps fighter-jets ready to scramble. It also has drones in the skies over Gaza
which, according to our data, oftentimes spot and strike militant rocket crews even while they are
setting up to launch. Similarly, as already established by Haushofer et al. (2010), the technology
for launching mortars and rockets allows Gazan militants to carry out retaliations within hours
of provocation.6 Secondly, apropos the deterrence-blowback tradeoff, each side wants the other
to interpret its retaliation as a reprisal, i.e. as a price of the earlier provocation. Performing
retaliations soon after a provocation helps establish this causal linkage in the minds of internal
and external audiences. If for some reason the reprisal is delayed, the actor has added incentive
to announce publicly that this is a reprisal for the earlier provocation, thus raising the probability
that Meir Amit records it as such. We should therefore expect that our data on retaliation delays
is, if anything, biased upward by this selection issue.
6This contrasts with suicide attacks launched from the West Bank during the Second Intifada, which potentially
required weeks of planning [see Jaeger and Paserman (2008) and Brym and Araj (2006)].
6

3. Episodic Aggregation of Violent Attacks
We define a violent episode as any series of projectile launches or airstrikes preceded and followed
by at least t days of calm.7 Table 1 presents our analysis of episodic violence using the UN data.8
Following the evidence in Figures 2 and 3, Columns (1) and (2) define episodes of violence using
the threshold of at least two days of calm. Columns (3)-(4) and (5)-(6) present robustness tests
using at least 7 or 14 days of calm as the relevant thresholds, respectively. Odd numbered columns
in Table 1 take into account all projectiles launched by Gazan militants; that is, 5,189 mortars and
11,284 rockets. Even numbered columns focus exclusively on rockets launched and exclude mortars.
We do so because, due to their short range and poor precision, most mortars explode on empty
agricultural fields surrounding The Gaza Strip. Therefore, one may claim that the majority of the
Israeli public is less affected by these types of projectiles, and the IAF is less prone to retaliate to
these types of attacks.9
Let us focus first on Column (1) of Table 1, which depicts episodes’ characteristics using a ‘two
days of calm’ threshold. Using this threshold, we observe 312 episodes of violence. Panel A shows
that most violent episodes are short lived, with over 50% of them lasting less than 24 hours, and
over 75% of them lasting less than 4 days. As shown below, violent episodes lasting less than one
day consist mostly of projectile launches from Gaza without an Israeli retaliation. There are a few
violent episodes that continue for a long time. For example, the violent episode with the longest
duration lasted 129.8 days. This episode started on January 23rd, 2008 and ended on June 6th of
the same year. This episode showcases the sustained and high levels of violence that characterize
this conflict before Operation Cast Lead, which started the last week of 2008 and lasted for three
weeks (see also Figure 1).
Panel B shows that Gazan militants initiate 91% of violent episodes. Gazan militants also tend
to end violent episodes, as they launch the last attack in 84.9% of violent episodes. This provides
strong evidence that episodes are not related to each other cyclically. If they were cyclically related,
7Hamas denotes these short periods of calm with the Arabic term tahdiya. This contrast with longer and formal
ceasefires, which are called hudna.8All our analyses and results are consistent when using the Meir Amit data. We relegate those results to the
appendix because, as mentioned above, The Meir Amit data set is less reliable than the available UN data.9Note, however, that several studies show that mortar attacks are associated with localized increases on mis-
carriages (Wainstock et al., 2013), post-traumatic stress disorder (Diamond et al., 2010; Berger et al., 2012), and
depression (Goldberg et al. 2013).
7

we would expect that the side fired upon last in a given episode would be the first to fire in the
next episode. Instead, we find that Gazan militants overwhelming start and end exchanges of fire.
Moreover, we also observe that in 58.7% of all episodes projectiles launched from the Gaza Strip
go unanswered by Israel. If we add to that the episodes with only Israeli violence, we obtain that
60.9% of all violent episodes do not constitute cycles of violence because only one side commits
violent attacks.
Panels C and D presents summary statistics for the intensity of the attacks. The message
that emerges from these panels is consistent with the one obtained in Figure 1. Most days are
characterized by low levels of violence consisting of at most 2 projectiles launched from Gaza
without an Israeli retaliation (for 75% of the days in our sample the number of projectiles is less
than 6). At some point, an extremely violent episode starts, including a major military operation,
which may lead to up to 1,315 barrages of projectiles being launched from Gaza together with up
to 2,291 barrages of airstrikes by the IAF.10
Figure 4 complements the evidence of Table 1. This figure presents two superimposed his-
tograms. They depict (i) the number of projectiles attacks form Gaza until the first Israeli re-
taliation and, (ii) the number of airstrikes attacks from Israel until the first Gazan retaliation.
The figure displays a very clear pattern. Gazans react immediately to Israeli airstrikes whereas
Israel shows more patience and restraint on their reactions to Gazan attacks. Accordingly, Gazans
retaliate within two Israeli airstrikes in 21 out of the 28 episodes of violence that start with an
Israeli airstrike; there isn’t any Gazan retaliation for the remainder 7 episodes started by Israeli
violence (this corresponds to the 2.2% of episodes with only Israeli violence reported in Panel B
of Table 1). In contrast, Israel doesn’t retaliate in 183 out of the 284 episodes of violence started
with Gazan’s attacks (this corresponds to 58.7% of episodes with only Gazan militants violence
reported in Panel B of Table 1). For the remainder 101 episodes, Israel retaliates with an airstrike
within two projectiles attacks only for 50% of them.
The final panel of Table 1 shows summary statistics on tahdiya, periods of complete calm in
between violent episodes. These periods are short lived. Half of them last less than 3.4 days and
10A barrage of projectiles includes up to 5 projectiles launched at the same time. A barrage of airstrikes includes
up to 3 airstrikes that occurred simultaneously. For example, the 2,291 barrages of airstrikes reported in the table
during operation Protective Edge in July and August of 2014 correspond to 5,551 airstrikes. The 1,315 projectiles
launched from Gaza during that operation correspond to 1,326 mortars and 4,607 rockets.
8

75% of them last less than 5.3 days. That said, there was a period of over two months without any
projectile or airstrike being launched. This period started on December 23rd, 2012 and lasted until
February 23rd, 2013. This period of calm occurred a month after the ending of Pillar of Defense, a
major military operation, and during the Israeli parliamentary elections of 2013 (voting took place
on January 22nd, 2013). Probably, the duration of this period of calm was also affected by the
inauguration of Obama’s second term as president of the US.
Column (2) in Table 1 presents summary statistics when we remove mortars from the sample.
This brings about a slight increase on the number of violent episodes because we now consider
days with only mortar attacks as days of calm. In addition, eliminating mortars from the analysis
shortens the duration of violent episodes and, obviously, the number of attacks from Gazan mili-
tants. That said, even when we don’t take mortar launches into account we still observe that most
episodes of violence are started and ended by Gazan militants, and over 52% of them only include
Gazan militant violence without any Israeli attack. Therefore, even when we exclude mortars we
do not observe a cycle of violence between episodes.
Columns (3)-(4) and (5)-(6) redefine violent episodes using more stringent requirements of 7
and 14 days of calm, respectively. These columns show that the main results presented in the first
two columns are qualitative and quantitative robust to alternative definitions of violent episodes.
In particular, we continue to find that (i) Gazan militants overwhelmingly start and end violent
episodes; and (ii) in a substantial share of violent episodes we only observe Gazan militants violence.
4. Cycles of Violence
We now shift our focus to intra-episode cycles of violence. Within a violent episode, we say that a
cycle of violence occurs if we observe at least a counter-retaliation to the retaliation. For example,
neither a single rocket attack, nor a rocket attack answered only by an airstrike, are enough to
constitute a cycle of violence. For a cycle of violence to occur, we require an attack followed by
a retaliation which is itself followed by a counter-retaliation. We define the length of a cycle of
violence as the number of alternating attacks. That is, the length of a cycle of violence includes the
initial attack and all subsequent attacks that could be construed as retaliations; i.e. the number of
times that the perpetrator of violence changes sides within an episode plus the initial attack.
Consider, for example, an episode documented by the UN, beginning on November 15th, 2010
9

and ending four days later. The episode begins after dark at 11:15 PM, when unidentified Gazan
militants fire a rocket at the Israeli border town of Sderot. Over the next four days six more
rocket attacks and four mortar barrages are carried out, the last of these occurring at 1:50 PM
on the afternoon of November 19th. We classify all projectile launches from November 15th until
November 19th as part of the same episode because there aren’t two days of calm between these
attacks. Finally, at 3:15 PM on the afternoon of November 19th, the Israeli Air Force (IAF) bombs
a house under construction in the Deir al Balah area, potentially in response to the projectile
fire. Additional airstrikes follow five and fifteen minutes later, at least one of them targeting a
Palestinian Islamic Jihad (PIJ) training base west of Khan Younis Camp. Up until this point,
we have not yet witnessed a cycle of violence. As far as we know, five days of sustained rocket
and mortar attacks on southern Israel have provoked an Israeli reprisal of three airstrikes. This is
consistent with a logic of deterrence. But does it provoke blowback?
Later on the evening of November 19th at 7:25 PM, militants appear to respond to the af-
ternoon’s airstrikes with a rocket launch from Nuseirat Camp. We are now witnessing a cycle of
violence, in the sense that the Israeli reprisal in the afternoon has apparently provoked a counter-
reprisal by Gazan militants. Incidentally, the rocket explodes in mid-air. Nevertheless, a few hours
later at 11:30 PM, the IAF fires two missiles at smuggling tunnels near Rafah Crossing, as if to
counter the counter-reprisal. Finally, Gazan militants strike back at 5:30 AM with a mortar barrage
aimed at the Israeli military base adjacent to the border town of Kissufem. This concludes this
violent episode, as the next violent attack occurs nearly a week later on November 25th. Since we
witnessed three counter-reprisals within this episode (two by Gazan militants and one by the Is-
raelis), we code this cycle of violence with a length equal to 5: the initial attack by Gazan militants,
plus the Israeli reprisal, plus three counter-reprisals.
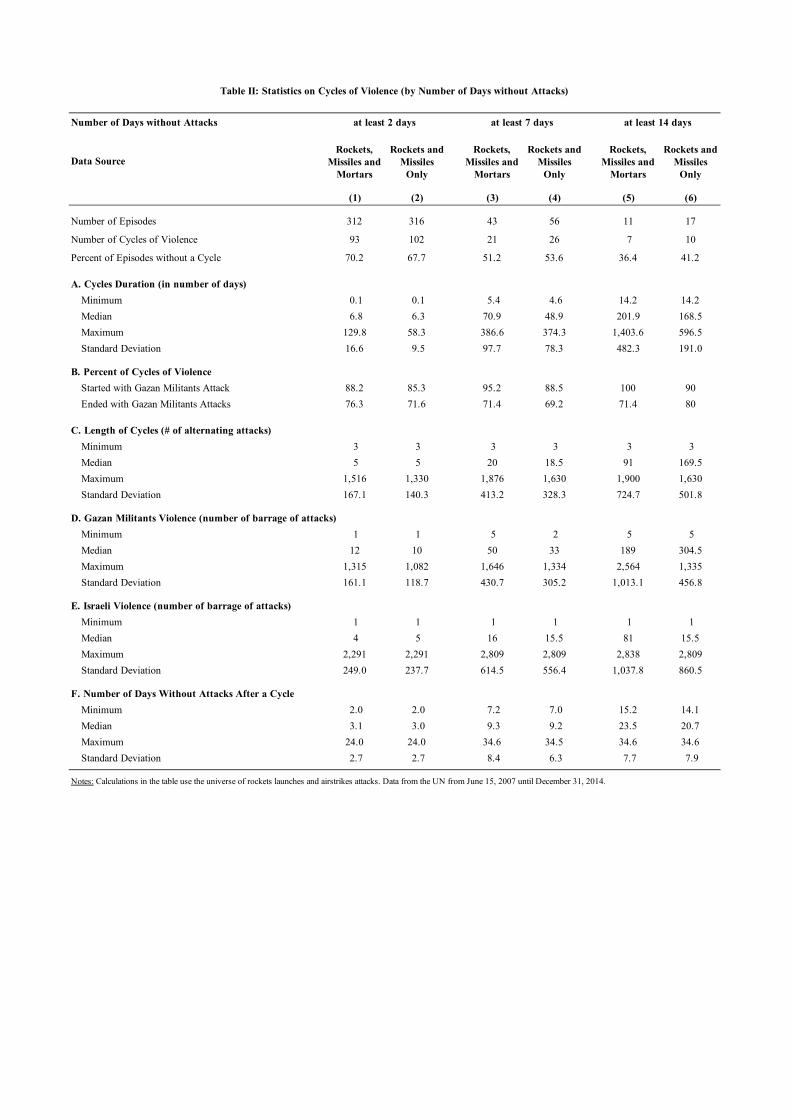
Applying this definition of cycle of violence to all episodes in the dataset, we calculate the
length of each cyclical violent episode. The results are summarized in Table 2. Consistent with the
definitions we used in Table 1, Columns (1)-(2) use a ‘2 days of calm’ threshold to define episodes
of violence. Columns (3)-(4) use a ‘7 days of calm’ threshold, whereas Columns (5)-(6) use a ‘14
days of calm’ threshold to classify violent episodes.
Let us focus first on Column 1. This column shows that less than 30% of violent episodes have
a cycle of violence (93 out of 312 violent episodes). Other than that, cyclical episodes of violence
and non-cyclical episodes of violence are very similar. Cyclical episodes of violence (i) tend to be
10

short lived, though a little longer than non-cyclical episodes. Fifty percent of them last less than
6.8 days and have a length of less than 5 alternating attacks; (ii) are mostly started and ended by
Gazan violence; (iii) show a great deal of variation in terms of their level of violence; (iv) perhaps
surprisingly, do not lead to substantially long periods of calm in their aftermath.
Result (iv) implies that cycles of violence do not deter future violent attacks for longer period
of times compared to non-cyclical episodes. As supportive evidence, an histogram on the number
of attacks until the first retaliation restricted to cyclical episodes only is very similar to Figure
4.11 Accordingly, Gazan militants react immediately to any Israeli aggression (at most after the
second Israeli attack), whereas Israelis may even wait over 10 Gazan attacks before retaliating (if at
all). Therefore, the evidence shows that Israeli retaliations to Gazan violence do not deter further
attacks within or between violent episodes. Furthermore, Israeli retaliations do not seem to lead to
the de-escalation of violence, at least in terms of the type of projectiles being launched by Gazan
militants. The probability that Gazan militants launch a rocket (compared to mortars which have
a shorter range) within a violent cycle does not seem to be affected by previous Israeli airstrikes.
In addition, after a cyclical episode Gazan militants wait on average only 6 days to launch a Grad
rocket and 4.1 days to launch a Qassam rocket, whereas they wait on average 34.6 days to launch
a Grad rocket and 5.67 days to launch a Qassam rocket after a non-cyclical episode.
To sum up, similar to non-cyclical episodes of violence, the typical cyclical episode of violence
lasts for a week, includes around 12 projectiles launched from Gaza and 4 airstrikes by the IAF, and
is followed by 3 days of calm. This is the case also if we don’t take mortar launches into account
(Column 2). When we focus on Columns 3-4 or 5-6 instead, based on a 7 or 14 days of calm
threshold, respectively, the main message is that violent cyclical episodes last longer, but still don’t
have a long lasting deterrence effect on future attacks. After cycles of violence, we observe a period
of calm that tends to last only a little over a week in Columns 3-4, and a little bit over 20 days
in Columns 5-6. That said, periods of calm after cyclical episodes tend to be shorter than periods
of calm after non-cyclical violent episodes. Therefore, regardless of the threshold chosen for days
of calm between violent episodes, we observe that cyclical episodes of violence are overwhelming
started and ended with Gazan violence, and do not lead to extended periods of calm after they end
vis-a-vis non-cyclical episodes of violence.
11This histogram is available from the authors upon request.
11

5. Impulse Response Functions and VAR Analysis
This section replicates the impulse response functions and VAR analyses of Jaeger and Paserman
(2008) and Haushofer et al. (2010) using our data and time period. Following Jaeger and Paserman
(2008) and Haushofer at al. (2010) we also focus on the daily level (or incidence) of projectiles and
airstrikes attacks. We perform these analyses to demonstrate that the conclusions we reach in the
section above are not a consequence of using a different data or focusing on a different time period.
We first compute nonparametric impulse response functions for the levels and incidences of
projectiles and airstrikes using the same methodology proposed by Jaeger and Paserman (2008).
Following Jaeger and Paserman (2008), we define the Israeli impulse response function as
IsrRFt =
(∑s:Is>0 Is∑s:Is>0 1
)−1(∑s:Is−t>0Gs∑s:Is−t>0 1
−∑
sGs
T
),
where Is is the number of Israeli airstrikes on day s and Gs is the number of projectiles launched
from Gaza on day s. Similarly, Gazan militants’ impulse response function is given by
GazRFt =
(∑s:Gs>0Gs∑s:Gs>0 1
)−1(∑s:Gs−t>0 Is∑s:Gs−t>0 1
−∑
s IsT
).
As pointed out by Jaeger and Paserman (2008), the empirical Israeli response function shows
the excess number of Israeli airstrikes t days after a projectiles attack from Gaza. Analogously, the
empirical Gazan response function depicts the excess number of projectiles launched t days after an
Israeli airstrike. Following Haushofer et al. (2010) we also calculate impulse response functions for
the incidences of airstrikes and projectiles attacks. They have a similar interpretation, but depict
the excess probability of attacks instead of excess in the number of attacks.
Figures 5 and 6 present the impulse response functions for levels of airstrikes and projectiles
attacks, whereas Figures 7 and 8 present the impulse response functions for incidences of airstrikes
and projectiles attacks. All impulse response functions include their respective 95 percent confidence
bands.
All figures show that Israelis and Gazans react in a significant and positive way to an attack by
the other side. Figure 5 suggests that the Israeli Air Force reacts immediately to projectiles attacks.
Accordingly, the excess number of airstrikes against Gaza’s targets significantly increases after a
projectile attack, and remains positive and statistically different from zero for roughly a month after
an attack. Figure 6 depicts the analogous reaction function for Gazan militants. It shows that the
12

initial excess number of projectiles attacks after an airstrike is positive and statistically different
from zero. Moreover, the increase in the excess number of projectile attacks remains statistically
different from zero for almost 50 days. Figures 7 and 8 lead us to the same conclusion while looking
at the excess probability of retaliations.
Together, these figures suggest that Israel and Hamas are locked in an endless cycle of violence,
where both sides react in a regular and predictable way to violence against them. That is, one
side’s attacks are always followed by the other side’s retaliations. These conclusions are consistent
with the results of Haushofer et al. (2010).
Following Jaeger and Paserman (2008) and Haushofer et al. (2010), we estimate a standard
VAR model using daily indicators of projectiles and airstrike attacks to quantify the findings of
Figures 5-8. The models regress daily current Israeli airstrikes and Gazan projectiles launches on
lagged values of both variables. As in Jaeger and Paserman (2008) and Haushofer et al. (2010), our
models also include 14 lags of both variables, which is 4 more lags than the amount recommended
by various information criteria (AIC, HQ, SC, FPE).12 Note also that all four time series pass the
Dickey-Fuller cointegration test.
The results of these analyses are reported in Table 3. For expositional purposes, this table
shows only the F -statistics and p-values for the joint effect of lagged attacks (or incidents) from
the rival side.13 For example, the F -statistic in the first row of column (1) (i.e., the basic model)
tests whether or not all lagged airstrikes before day t affect the number of projectiles launched
on day t. Similarly, the F -statistic in the first row of column (3) tests whether or not all lagged
projectiles launched before day t affect the number of Israeli airstrikes on day t. Columns (2) and
(4) perform the same analyses but focusing on the incidence of attacks instead of the number of
attacks. The bottom panel of Table 3 includes also as a control variable the number of attacks (or
incidence of attacks) by the other side that occurred on day t.
Table 3 shows a very clear and robust pattern whereby past Israeli airstrikes provoke Gazan’s
attacks, and past Gazan’s attacks provoke Israeli airstrikes. In other words, the results of the VAR
analyses suggest that Israel retaliates to Gazan violence and Gazan militants retaliate to Israeli
12The results of our analyses are robust to including only 10 lags of both variables. We choose to present the results
using 14 lags to directly replicate the analyses of Jaeger and Paserman (2008) and Haushofer et al. (2010).13The estimated marginal effects for each lagged variable included in the regressions are available from the authors
upon request.
13

violence. This empirical evidence may lead us to suggest that Israel and Gaza are locked in a vicious
cycle of violence. These results are robust to controlling for attacks on the same day (bottom panel
of Table 3) or to focusing on the incidence of attacks instead of their levels (Columns 2 and 4).
They are also consistent with the impulse response functions depicted in Figures 5-8.
6. Discussion
The results presented in the section above using a VAR analysis point to the existence of a cycle
of violence between Israel and Gazan militants with constant retaliations and counter-retaliations.
However, the evidence presented in Sections 3 and 4 weighs heavily against a cycle-of-violence
narrative for the Israel-Gaza conflict between 2007 and 2014. In particular, we find that exchanges
of attacks between Gaza and Israel tend to be episodic, and that these episodes are not linked to
each other via a provocation and retaliation logic. An overwhelmingly majority of violent episodes
start and end with Gazan attacks. Moreover, a majority of violent episodes consists only of Gazan
militants attacks. We also find that in less than 30% of violent episodes both sides retaliate and/or
counter-retaliate, but these cyclical episodes tend to wrap up fairly quickly.
The different conclusions of the two methodologies highlight the fundamental difference between
an episodic analysis of violence compared to a VAR or VAR-style framework. This leads us to argue
that the VAR methodology is not appropriate for analyses of cycles of violence for a number of
reasons. First, a VAR analysis is able to establish whether or not an attack that occurred on
day t-i may provoke a retaliation on day t. As such, VAR analyses may be able to let us know
that both sides tend to retaliate to violence, but are unable to determine who starts and who
ends violent confrontations. This information is crucial to policy makers trying to stop cycles of
violence. For example, if Israel uses airstrikes only to retaliate to Gazan attacks, forcing Israel to
stop attacking Gaza would not bring an end to violent attacks between the two sides. Moreover,
the VAR methodology is unable to divide cycles of violence into episodic attacks, especially when
these episodes have different durations.
Finally, VAR may generate faulty inference on episodic data generating processes. To show
this, we generate a synthetic dataset where, by construction, the violence is episodic. In particular
we generate data in Python using the following calibration:
• Step 1: On day 1, there is a Gazan projectile attack against Israel with probability 0.135.
14
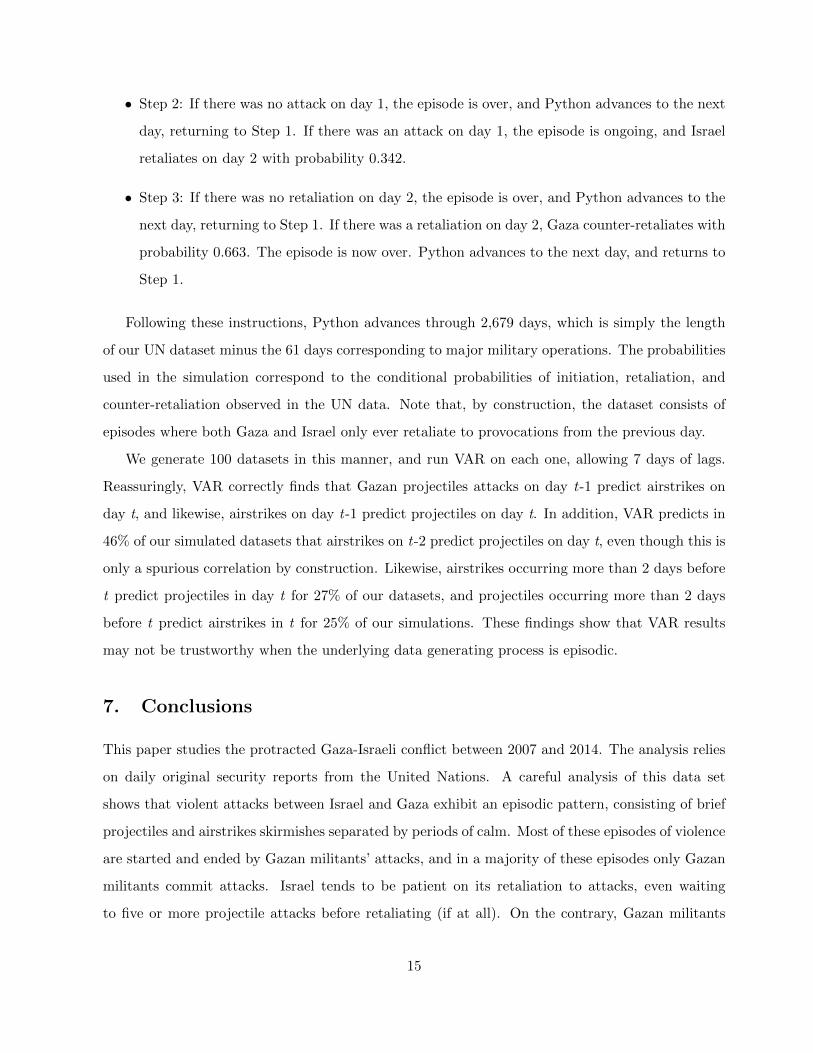
• Step 2: If there was no attack on day 1, the episode is over, and Python advances to the next
day, returning to Step 1. If there was an attack on day 1, the episode is ongoing, and Israel
retaliates on day 2 with probability 0.342.
• Step 3: If there was no retaliation on day 2, the episode is over, and Python advances to the
next day, returning to Step 1. If there was a retaliation on day 2, Gaza counter-retaliates with
probability 0.663. The episode is now over. Python advances to the next day, and returns to
Step 1.
Following these instructions, Python advances through 2,679 days, which is simply the length
of our UN dataset minus the 61 days corresponding to major military operations. The probabilities
used in the simulation correspond to the conditional probabilities of initiation, retaliation, and
counter-retaliation observed in the UN data. Note that, by construction, the dataset consists of
episodes where both Gaza and Israel only ever retaliate to provocations from the previous day.
We generate 100 datasets in this manner, and run VAR on each one, allowing 7 days of lags.
Reassuringly, VAR correctly finds that Gazan projectiles attacks on day t-1 predict airstrikes on
day t, and likewise, airstrikes on day t-1 predict projectiles on day t. In addition, VAR predicts in
46% of our simulated datasets that airstrikes on t-2 predict projectiles on day t, even though this is
only a spurious correlation by construction. Likewise, airstrikes occurring more than 2 days before
t predict projectiles in day t for 27% of our datasets, and projectiles occurring more than 2 days
before t predict airstrikes in t for 25% of our simulations. These findings show that VAR results
may not be trustworthy when the underlying data generating process is episodic.
7. Conclusions
This paper studies the protracted Gaza-Israeli conflict between 2007 and 2014. The analysis relies
on daily original security reports from the United Nations. A careful analysis of this data set
shows that violent attacks between Israel and Gaza exhibit an episodic pattern, consisting of brief
projectiles and airstrikes skirmishes separated by periods of calm. Most of these episodes of violence
are started and ended by Gazan militants’ attacks, and in a majority of these episodes only Gazan
militants commit attacks. Israel tends to be patient on its retaliation to attacks, even waiting
to five or more projectile attacks before retaliating (if at all). On the contrary, Gazan militants
15

retaliate right after one or two Israeli attacks. Israeli retaliations to Gazan attacks do not seem to
deter or de-escalate future violent attacks.
These results complement previous studies of the Israeli-Palestinian conflict using VAR analyses.
Whereas VAR analyses tend to show that both sides retaliate to violence, the episodic analysis of
this paper clarifies that these retaliations (when they occur) are all intra-episodic. Moreover, the
VAR approach completely ignores three important patterns of this violent conflict: (i) the episodic
nature of the conflict; (ii) Gazan militants tend to start and end episodes of violence; and (iii)
violent episodes are not linked to each other by a pattern of provocation and reprisal. Sure, Israeli
airstrikes do provoke some retaliatory projectile launches in the short term (1-2 days), but once
the episode of violence runs its course, the next period of calm will almost certainly be broken by
a projectile launch unprovoked by bombardment.
Our analysis shows that a VAR analysis does not push the data far enough. The VAR approach
gets snagged on answering the narrower question ‘do both sides retaliate?’ (yes, of course they
do), but when we step back from the trees to see the forest, we recognize the episodic structure
of a conflict that re-ignites over and over again for non-cyclical reasons. Therefore, we encourage
researchers investigating cycles of violence in Israel-Palestine and other conflicts to move beyond
the VAR framework and investigate time series data more creatively.
This paper shows that the main determinants of violence are non-cyclical. These determinants
may lead to Gazan militant’s attacks, where Israel sometimes retaliates to these attacks with
airstrikes and other times shows restraint. A thorough analysis of the non-cyclical determinants of
Gazans’ attacks is beyond the scope of our paper. That said, most of the related literature points
to two main reasons behind Gazan’s attacks: resisting the Israeli blockade of the Gaza Strip and
outbidding the Palestinian Authority for Palestinians’ support.
Israel has maintained strict control of its border with the Gaza Strip at least since it evacuated
its settlements on the summer of 2005. Borders control turned into an Israeli and Egyptian blockade
of the Gaza Strip after Hamas seized government institutions of the Gaza Strip from Fatah in June
2007 (Kershner, 2007).14 The blockade has been associated with the dire performance of the Gazan
economy during the last ten years. Etkes and Zimring (2015), for example, show that the Israel-
Egyptian blockade of Gaza brought about a decrease in the order of 14% to 27% on its residents
14Israel maintains that the blockade of the Gaza Strip is necessary to limit mortar and rocket attacks from the
Gaza Strip, and to prevent Hamas from obtaining more weapons.
16

welfare (as calculated using the household expenditure survey). Moreover, the Israeli-Egyptian
blockade of Gaza is associated with soaring unemployment rates and increasing rates of moderate
and severe food insecurity (UN report, 2016). Given all of the above, the blockade acts as a
longstanding grievance that motivates Gazan militants attacks against Israel.
The second determinant of violence often mentioned in the literature is related to the extant
rivalry between Palestinian militant groups. This rivalry has historically motivated attacks against
Israel as each group seeks to win new recruits, funding, and political power by proving it is more
committed to ’resistance’ than its rival groups (see, e.g., Bloom (2005), Pearlman (2014), Jaeger
et al. (2015), and Krause (2017), among many others). Spoiler and chain-ganging tactics can
therefore generate militant projectile launches even without Israeli provocation.
Thus the Palestinian movement’s internal political group competition, and long-term underlying
grievances against Israel, are likely the main determinants of mortar and rockets attacks. By getting
mixed up in VAR analysis, the cycles-of-violence literature has sidetracked itself into short-term
dynamics and an undue emphasis on short-term motives.
In conclusion, the Israel-Gaza Conflict is not an endless cycle of violence between two bitter
enemies. It is an episodic conflict, and although a minority of episodes are somewhat lengthened
by cyclical violence, the two sides seem to judge each other’s tolerance for reprisals accurately
and de-escalate in short order. Violent episodes themselves are over and over again initiated (and
terminated) by Gazan projectile launches likely motivated by long-term underlying grievances and
internal political calculus between Gazan militant factions. Until the fundamental political issues
between Israelis and Palestinians (and Egyptians) are resolved, we can expect repeated episodes of
violence between Gazan militants and the Israeli government.
References
Berger, Rony, Marc Gelkopf and Yotam Heineberg. 2012. “A Teacher-Delivered Intervention for
Adolescents Exposed to Ongoing and Intense Traumatic War-Related Stress: A Quasi-Randomized
Control Study,” The Journal of Adolescent Health, 51 (5): 453-461.
Bloom, Mia. 2005. Dying to Kill: The Allure of Suicide Terror. New York, NY: Columbia Univer-
sity Press.
Brym, Robert and Bader Araj. 2006. “Suicide Bombings as Strategy and Interaction: The Case
of the Second Intifada,” Social Forces, 84 (4): 1969-1986.
17
Diamond, Gary M., Joshua D. Lipsitz, Zvi Fajerman, and Omit Rozenblat. 2010. “Ongoing Trau-
matic Stress Response (OTSR) in Sderot, Israel,” Professional Psychology: Research and Practice,
41 (1): 19-25.
Dugan, Laura and Erica Chenoweth. 2012.“Moving Beyond Deterrence: The Effectivenes of Rais-
ing the Expected Utility of Abstaining from Terrorism in Israel,” American Sociological Review, 77
(4): 597-624.
Ephron, Dan. 2015. Killing a King: The Assassination of Yitzhak Rabin and the Remaking of
Israel. New York, NY: W.W. Northon and Company, Inc.
Etkes, Haggay and Assaf Zimring. 2015. “When Trade Stops: Lessons from the Gaza Blockade
2007-2010,” Journal of International Economics, 95 (1): 16-27.
Granger, Clive W. J. 1969. “Investigating Causal Relations by Econometric Models and Cross-
Spectral Methods,” Econometrica, 37 (3): 424-438.
Goldberg, Lital, Jacob Dreiher, Michael Friger, Alexander Levin, and Pesach Shvartzman. 2013.
“Health Services Utilization under Qassam Rocket Attacks,” Israeli Medical Association Journal,
15 (8): 482-486.
Houshofer, Johannes, Anat Biletzki and Nancy Kanwisher. 2010. “Both Sides Retaliate in the
Israeli-Palestinian Conflict,” Proceedings of the National Academy of Sciences, 107 (42): 17927-
17932.
Jaeger, David A., Esteban F. Klor, Sami H. Miaari and M. Daniele Paserman. 2015. “Can Mili-
tants Use Violence to Win Public Support? Evidence from the Second Intifada,” Journal of Conflict
Resolution, 59 (3): 528-549.
Jaeger, David A. and M. Daniele Paserman. 2006. “Israel, the Palestinian Factions and the Cycle
of Violence,” The American Economic Review, 96 (2): 45-49.
Jaeger, David A. and M. Daniele Paserman. 2008. “The Cycle of Violence? An Empirical Analysis
of Fatalities in the Palestinian-Israeli Conflict,” The American Economic Review, 98 (4): 1591-1604.
Jaeger, David A. and M. Daniele Paserman. 2009. “The Shape of Things to Come? On the Dy-
namics of Suicide Attacks and Targeted Killings,” The Quarterly Journal of Political Science, 4:
315-342.
Johnson, Chalmers. 2000. Blowback: The Costs and Consequences of American Empire. New
York, NY: Macmillan.
18

Krause, Peter. 2017. Rebel Power: Why National Movements Compete, Fight, and Win. Ithaca,
NY: Cornell University Press.
Kershner, Isabel. 2007. “Abbas’s Premier Tells Israel to Reopen Gaza,” The New York Times,
December 14th.
Knuth, Donald. 1973. The Art of Computer Programming, Volume 3. Boston, MA: Addison-
Wesley.
Pearlman, Wendy. 2014. Violence, Nonviolence, and the Palestinian National Movement. Cam-
bridge: Cambridge University Press.
Schelling, Thomas C. 1966. Arms and Influence. New Haven, CT: Yale University Press.
Sobelman, Daniel. 2017. “Learning to Deter: Deterrence Failure and Success in the Israel-
Hezbollah Conflict, 2006-2016,” International Security, 41 (3): 151-196.
United Nations Office for the Coordination of Humanitarian Affairs (OCHA). 2016. The Gaza
Strip: The Humanitarian Impact of the Blockade, November.
Wainstock, Tamar, Eyal Anteby, Saralee Glasser, Ilana Shoham-Vardi and Liat Lerner-Geva. 2013.
“The Association Between Prenatal Maternal Objective Stress, Perceived Stress, Preterm Birth
and Low Birthweight,” The Journal of Maternal-Fetal Neonatal Medicine, 26 (10): 973-977.
19

Figure 1: Gaza Projectiles and Israeli Airstrikes Attacks, 2007-2014
Note: Using UN data from October 1st, 2006 through December 31st, 2014.
20

Figure 2: Gazan Militants Retaliatory Delays
Note: Using Meir Amit data from April 15th, 2009 through July 1st, 2016.
Figure 3: Israel Air Force Retaliatory Delays
Note: Using Meir Amit data from April 15th, 2009 through July 1st, 2016.
21

Figure 4: Number of Attacks Until First Retaliation
Note: Using UN data from October 1st, 2006 through December 31st, 2014.
22

Figure 5: Israeli Impulse Response Function to Projectiles: Levels
Figure 6: Gaza Impulse Response Function to Airstrikes: Levels
23

Figure 7: Israeli Impulse Response Function to Projectiles: Incidence
Figure 8: Gaza Impulse Response Function to Airstrikes: Incidence
24

Rockets, Missiles
and Mortars
Rockets and
Missiles Only
Rockets, Missiles
and Mortars
Rockets and
Missiles Only
Rockets, Missiles
and Mortars
Rockets and
Missiles Only
(1) (2) (3) (4) (5) (6)
312 316 43 56 11 17
Minimum 0 0 0 0 0 0Median 0.9 0.5 11.5 7.2 55.3 55.3Maximum 129.8 58.3 386.6 374.3 1,403.6 596.5Standard Deviation 10.2 6.6 81.8 62.2 411.7 184.0
Started with Gazan Militants Attack 91.0 87.3 95.3 92.9 100.0 94.1Ended with Gazan Militants Attack 84.9 79.4 81.4 80.4 81.8 88.2With only Gazan Militants' Violence 58.7 52.2 44.2 46.4 36.4 41.2With only Israeli Violence 2.2 4.1 0.0 0.0 0.0 0.0
Minimum 0 0 1 1 1 1Median 2 2 5 4 24 20Maximum 1,315 1,082 1,646 1,334 2,564 1,335Standard Deviation 91.0 69.5 325.1 221.3 881.5 406.9
Minimum 0 0 0 0 0 0Median 0 0 1 1 5 5Maximum 2,291 2,291 2,809 2,809 2,838 2,809Standard Deviation 137.3 136.2 438.6 385.8 871.4 687.5
Minimum 2.0 2.0 7.2 7.0 15.2 14.1Median 3.4 3.7 10.4 11.0 25.9 22.8Maximum 62.2 62.2 62.2 62.2 62.2 62.2Standard Deviation 5.8 6.1 11.4 10.4 13.9 12.9
Table I: Episodes Statistics by Number of Days without Attacks
Number of Days without Attacks at least 2 days at least 7 days at least 14 days
Notes: Calculations in the table use the universe of rockets launches and airstrikes attacks. Data from the UN from June 15, 2007 until December 31, 2014.
E. Number of Days Without Attacks Between Episodes
Number of Episodes
A. Episode Duration (number of days)
B. Percent of Episodes
C. Gazan Militants Violence (number of barrage of attacks)
D. Israeli Violence (number of barrage of attacks)
Rockets, Missiles and
Mortars
Rockets and Missiles
Only
Rockets, Missiles and
Mortars
Rockets and Missiles
Only
Rockets, Missiles and
Mortars
Rockets and Missiles
Only
(1) (2) (3) (4) (5) (6)
312 316 43 56 11 17
93 102 21 26 7 10
70.2 67.7 51.2 53.6 36.4 41.2
Minimum 0.1 0.1 5.4 4.6 14.2 14.2Median 6.8 6.3 70.9 48.9 201.9 168.5Maximum 129.8 58.3 386.6 374.3 1,403.6 596.5Standard Deviation 16.6 9.5 97.7 78.3 482.3 191.0
Started with Gazan Militants Attack 88.2 85.3 95.2 88.5 100 90Ended with Gazan Militants Attacks 76.3 71.6 71.4 69.2 71.4 80
Minimum 3 3 3 3 3 3Median 5 5 20 18.5 91 169.5Maximum 1,516 1,330 1,876 1,630 1,900 1,630Standard Deviation 167.1 140.3 413.2 328.3 724.7 501.8
Minimum 1 1 5 2 5 5Median 12 10 50 33 189 304.5Maximum 1,315 1,082 1,646 1,334 2,564 1,335Standard Deviation 161.1 118.7 430.7 305.2 1,013.1 456.8
Minimum 1 1 1 1 1 1Median 4 5 16 15.5 81 15.5Maximum 2,291 2,291 2,809 2,809 2,838 2,809Standard Deviation 249.0 237.7 614.5 556.4 1,037.8 860.5
Minimum 2.0 2.0 7.2 7.0 15.2 14.1Median 3.1 3.0 9.3 9.2 23.5 20.7Maximum 24.0 24.0 34.6 34.5 34.6 34.6Standard Deviation 2.7 2.7 8.4 6.3 7.7 7.9
Table II: Statistics on Cycles of Violence (by Number of Days without Attacks)
Number of Days without Attacks at least 2 days at least 7 days at least 14 days
Notes: Calculations in the table use the universe of rockets launches and airstrikes attacks. Data from the UN from June 15, 2007 until December 31, 2014.
F. Number of Days Without Attacks After a Cycle
D. Gazan Militants Violence (number of barrage of attacks)
E. Israeli Violence (number of barrage of attacks)
C. Length of Cycles (# of alternating attacks)
Data Source
Number of Episodes
Number of Cycles of Violence
Percent of Episodes without a Cycle
A. Cycles Duration (in number of days)
B. Percent of Cycles of Violence

Number Incidence Number Incidence
Specification Test Statistic (1) (2) (3) (4)
Basic F statistic 34.856*** 5.064*** 5.8957*** 6.2346***
p -value <2.2E-16 8.28E-07 7.23E-09 1.70E-09
Control Same-Day Events F statistic 253.5*** 22.537*** 206.18*** 22.144***
p -value < 2.2E-16 < 2.2E-16 <2.2E-16 <2.2E-16
Table III: Gaza Projectile and Airstrike Retaliations
Gaza Projectiles Retaliating to Airstrikes
Airstrikes retaliating to Gaza Projectiles
Note: F- statistic and respective p -value test for the joint significance of the lagged coefficients of the respective other variable.

Appendix Figures and Tables:
Figure A1: Flowchart of Data Generation

Figure A2: Illustration of Python Automated Grammar Parsing


![[DL輪読会]Neural Episodic Control/Model-Free Episodic Control](https://img.dokumen.tips/doc/110x75/5a64790d7f8b9a57568b463b/dlneural-episodic-controlmodel-free-episodic-control.jpg)


