Embed Size (px)
Citation preview

Northern Tier Workforce Investment Area
What are the Northern Tier Workforce Investment Area’s (WIA) major industries?
How do the local industries compare to Pennsylvania’s?
What are the demographic issues of Northern Tier?
Ar eA SnA pShot
Understanding your local industry base by answering questions like these is one of the first steps in developing or analyzing a workforce development strategy. This report provides information that can help you direct, prioritize, and set workforce development goals. The following analysis, presented in two sections, is a snapshot of the Northern Tier Workforce Investment Area (hereafter referred to as “WIA”) industry and demographic composition. The industry overview section offers a large scale analysis of the WIA looking at Pennsylvania’s Targeted Industry Clusters as well as Green economic activity. Then, the Demographic Detail section provides information on recent unemployment trends and commuting patterns. Additionally, county profiles for each of the five counties in the Northern Tier WIA are included at the end of this document.
Center for Workforce Information & AnalysisJuly 7th, 2010

Northern Tier Workforce Investment Area
2
InduS try ov erv Iew
AMDM AFP BC BFS BM ED ENGY HC ICS LT LWP
2008 Employment 4,242 2,273 3,973 3,061 76 6,220 746 7,734 691 1,243 4,367
Employment Change (2007-2008) -124 41 -152 -105 -20 145 35 26 -6 -26 -288
Percent WIA Employment 7.8% 4.2% 7.3% 5.6% 0.1% 11.5% 1.4% 14.3% 1.3% 2.3% 8.1%
2008 Average Wage ($) $42,924 $35,113 $36,255 $34,246 $38,017 $36,627 $54,233 $39,500 $34,182 $36,894 $48,404
Location Quotient 2008 1.40 1.58 1.23 0.46 0.09 1.12 0.86 0.99 0.34 0.80 7.08
Table 1: Industry Cluster Statistics for Northern Tier WIA (2007-2008)1
Pennsylvania has identified industry clusters as a way of gauging the performance of the state and local economies within it. The following analysis uses the statewide cluster definitions, as were revised in 2007. Table 1 below depicts vital statistics for Pennsylvania’s 11 Targeted Industry Clusters within the WIA from 2007 to 2008.
Between 2007 and 2008, the Northern Tier WIA experienced employment declines in seven of the 11 targeted industry clusters. These employment drops could be the result of the current recession, as nearly every sector of the State and the National economies were impacted. Despite the negative impact of the recession, there are some positive signs for the Northern Tier WIA’s economy.
Advanced Materials & Diversified Manufacturing (AMDM) is considered by many workforce professionals to be one of the most important aspects of any economy. Although losing more than 100 jobs in the past year is significant, this cluster contains a higher concentration of employment (LQ 1.40)2 than statewide averages would predict. Additionally, this cluster pays average wages that are nearly 32% higher than the average wages paid to all workers in the WIA3.
Lumber, Wood & Paper (LWP) experienced the highest volume of job loss of any cluster in the WIA, resulting in nearly a 12% decline in cluster employment. Despite this significant drop, LWP possesses a very strong competitive advantage versus the state, indicated by an LQ of 7.08. Additionally, wages paid to individuals working in this cluster are nearly 50% more the average wage paid to all workers.
1Targeted Industry Cluster abbreviations are defined on page 6 of this document.2In this instance, Location Quotient (LQ ) is a measure of employment concentration in the WIA versus the statewide average. In
other words, an LQ of 1.40 indicates that the WIA’s labor market concentration of jobs is 40% higher than the state as a whole.3The average wages paid to all workers in the Northern Tier WIA are $32,571
Northern Tier Workforce Investment Area
3
InduS try ov erv Iew (con t Inued)
Althought there was an overall employment decline throughout the WIA, four targeted industry clusters saw employment grow from 2007 to 2008. These clusters include Agriculture & Food Production (AFP), Eduation (ED, Energy (ENGY) and Health Care (HC). ED and HC have long been considered to be more insulated from economic downturns than other industries. Thusly, the employment growth in these two clusters should not be considered an anomaly, but rather an indication that the demand for the products and services generated by business in these clusters persists despite negative trends in the economy as a whole.
ENGY experienced the largest percentage employment gain of any cluster in the WIA, adding 5% to employment. This growth can most likely be attibuted to the expansion in the natural gas operations associated with Marcellus Shale. It should be noted, however, that much of the employment growth related to Marcellus Shale may not be captured in this data, as a large portion of the growth related to this industry has occured within the past 18 months. As this industry continues to grow, the postive effect on the region’s overall economy should be strong, as individuals working in ENGY industries earn, on average, wages that are nearly 1.7 times the average for all workers in the WIA.
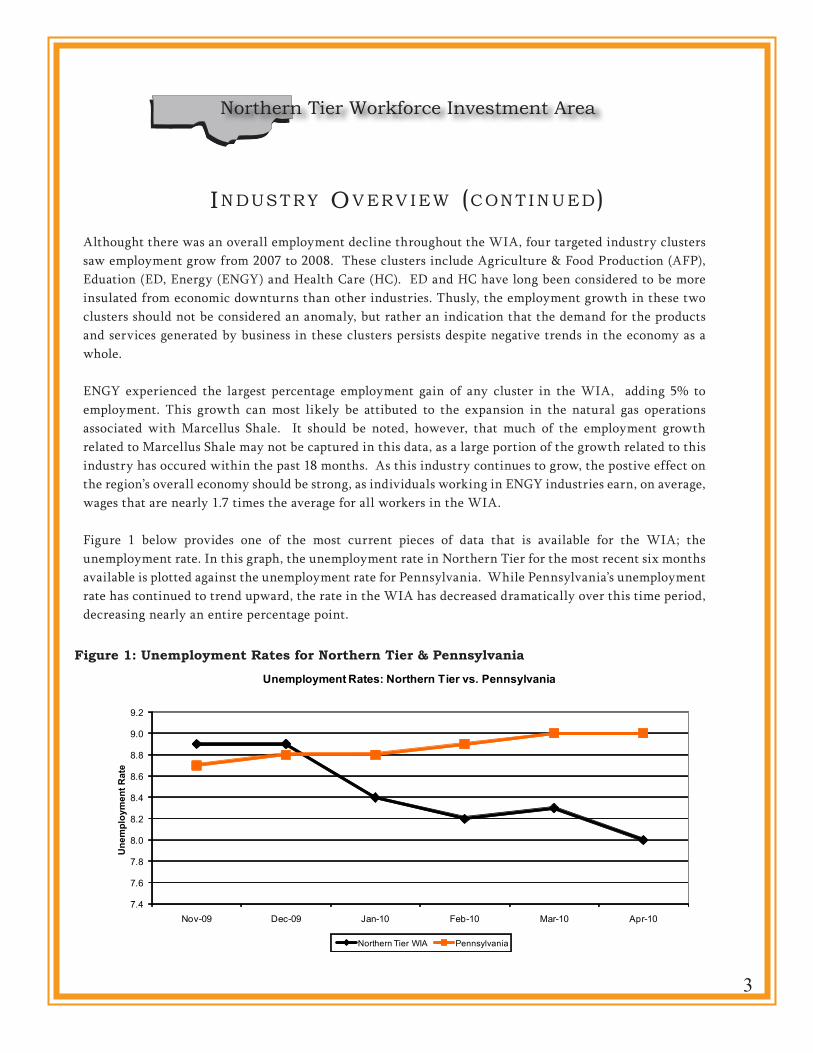
Figure 1 below provides one of the most current pieces of data that is available for the WIA; the unemployment rate. In this graph, the unemployment rate in Northern Tier for the most recent six months available is plotted against the unemployment rate for Pennsylvania. While Pennsylvania’s unemployment rate has continued to trend upward, the rate in the WIA has decreased dramatically over this time period, decreasing nearly an entire percentage point.
Figure 1: Unemployment Rates for Northern Tier & Pennsylvania
7.4
7.6
7.8
8.0
8.2
8.4
8.6
8.8
9.0
9.2
Nov-09 Dec-09 Jan-10 Feb-10 Mar-10 Apr-10
Une
mpl
oym
ent R
ate
Unemployment Rates: Northern Tier vs. Pennsylvania
Northern Tier WIA Pennsylvania

Northern Tier Workforce Investment Area
4
Green Sector Establishments EmploymentAgriculture & Resource Conservation 75 281Clean Transportation *** ***Energy Efficiency 215 968Pollution Prevention & Environmental Clean-up 42 498Renewable Energy 20 266
Total 352 2,013*** Data is not disclosable due to confidentiality restrictions
Table 2: Green Establishments and Employment by Sector in Norther Tier (2008 Annual Average)
InduS try ov erv Iew (con t Inued)Table 2 below depicts the Green employment in the Northern Tier WIA for each of the five defined green sectors.3 The distribution of Green Employment in Northern Tier follows a similar pattern to the state, as a large majority of green employment in the WIA is contained in the Energy Efficiency sector. The biggest difference between the WIA and the state, regarding green employment distibution occurs in the Clean Transportation sector. While Pennsylvania employment in this sector accounts for more than 8% of all state green employment, sector employment in Northern Tier is minimal.
Figure 2 shows the locations of potenitally green employers in the WIA.
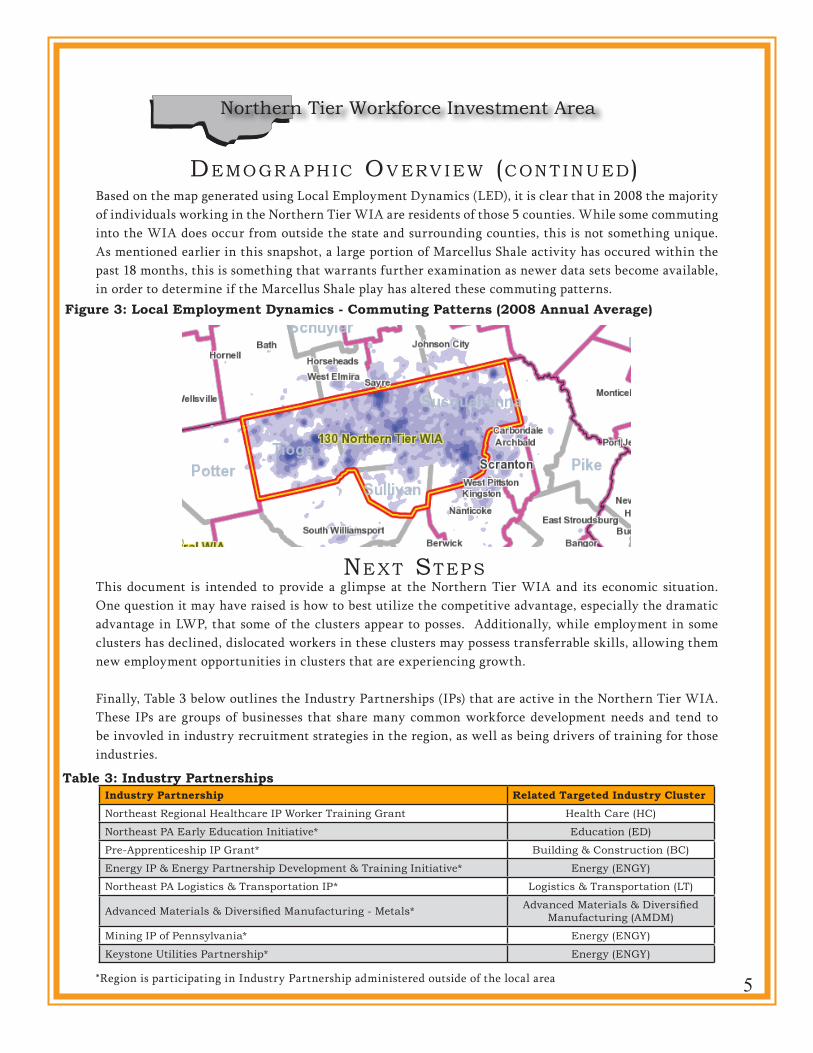
One of the biggest concerns expressed by residents of the WIA, as well as many others throughout the state, is the large percentage of Marcellus Shale workers who are residents of other states. Figure 3 on the following page depicts where individuals who are employed in the Northern Tier WIA live.
3To more effectively analyze the Green economy, the Pennsylvania Department of Labor & Industry’s Center for Workforce
Information & Analysis has identfied five Green industry sectors.
Figure 2: Locations of Potentially Green Employers in Northern Tier WIA
demogr A phIc ov erv Iew
Northern Tier Workforce Investment Area
Figure 3: Local Employment Dynamics - Commuting Patterns (2008 Annual Average)
5
demogr A phIc ov erv Iew (con t Inued)Based on the map generated using Local Employment Dynamics (LED), it is clear that in 2008 the majority of individuals working in the Northern Tier WIA are residents of those 5 counties. While some commuting into the WIA does occur from outside the state and surrounding counties, this is not something unique. As mentioned earlier in this snapshot, a large portion of Marcellus Shale activity has occured within the past 18 months, this is something that warrants further examination as newer data sets become available, in order to determine if the Marcellus Shale play has altered these commuting patterns.
This document is intended to provide a glimpse at the Northern Tier WIA and its economic situation. One question it may have raised is how to best utilize the competitive advantage, especially the dramatic advantage in LWP, that some of the clusters appear to posses. Additionally, while employment in some clusters has declined, dislocated workers in these clusters may possess transferrable skills, allowing them new employment opportunities in clusters that are experiencing growth.
Finally, Table 3 below outlines the Industry Partnerships (IPs) that are active in the Northern Tier WIA. These IPs are groups of businesses that share many common workforce development needs and tend to be invovled in industry recruitment strategies in the region, as well as being drivers of training for those industries.
*Region is participating in Industry Partnership administered outside of the local area
nex t StepS
Industry Partnership Related Targeted Industry Cluster
Northeast Regional Healthcare IP Worker Training Grant Health Care (HC)
Northeast PA Early Education Initiative* Education (ED)
Pre-Apprenticeship IP Grant* Building & Construction (BC)
Energy IP & Energy Partnership Development & Training Initiative* Energy (ENGY)
Northeast PA Logistics & Transportation IP* Logistics & Transportation (LT)
Advanced Materials & Diversified Manufacturing - Metals* Advanced Materials & Diversified Manufacturing (AMDM)
Mining IP of Pennsylvania* Energy (ENGY)
Keystone Utilities Partnership* Energy (ENGY)
Table 3: Industry Partnerships

877.4WF.DATA | www.paworkstats.state.pa.us
pennsylvaniaDEPARTMENT OF LABOR & INDUSTRY
CENTER FOR WORKFORCE INFORMATION & ANALYSIS
CWIA Contacts for Northern Pennsylvania
James Martini (717) 772 - 1386
Mike Butson (717) 772 - 1338
Pennsylvania’s Targeted Industry Clusters
AMDM - Advanced Materials & Diversified ManufacturingAFP - Agriculture & Food Production
BC - Building & ConstructionBFS - Business & Financial Services
BM - BioMedicalED - EducationENGY - Energy
HC - Health CareICS - Information & Communication Services
LT - Logistics & TransportationLWP - Lumber, Wood & Paper
Northern Tier Workforce Investment Area

Bradford County Profile July 2010
Major Employers Industry Sector
Overview
1
Population
Total Population
Male
Female
Population by Race
White
Black
Other
Hispanic Origin (all races)
Population by Age
Ages 0-14
Ages 15-19
Ages 20-34
Ages 35-49
Ages 50-64
Ages 65 and Older
County Pennsylvania
1
2
3
Labor Force County Pennsylvania
Civilian Labor Force
Employed
Unemployed
1
Unemployment Rate
Income County Pennsylvania
Per Capita Personal Income
Total Personal Income (in thousands)
Median Household Income (1999 dollars)
Median Family Income (1999 dollars)
1
2
3
4
Pennsylvania Department of Labor & Industry
651 Boas StreetRoom 220
Harrisburg, PA 17121-0001
877-4WF-DATA
www.dli.state.pa.usPA Keyword: Labor Market Information
1
2
3
4
Bureau of Economic Analysis - 2008Bureau of Economic Analysis - 2008U.S. Bureau of the Census - 2000U.S. Bureau of the Census - 2000
1 3rd Quarter 2009 - Final
1
2
3
U.S. Bureau of the Census - 2000U.S. Bureau of the Census - 2009 EstimateThe Center for Rural Pennsylvania - 2000 1 Preliminary May 2010 - Seasonally Adjusted
1 U.S. Bureau of the Census - 2009 Estimate2 U.S. Bureau of the Census - 2009 Estimate3 U.S. Bureau of the Census - 2009 Estimate
ROBERT PACKER HOSPITAL INC. Health Care and Social AssistanceCARGILL MEAT SOLUTIONS CORPORATION ManufacturingGUTHRIE CLINIC LTD Health Care and Social AssistanceGTP CORP ManufacturingBRADFORD COUNTY COMMISSIONERS Public AdministrationMEMORIAL HOS INC & SKILLED NUR UNIT Health Care and Social AssistanceE I DUPONT DE NEMOURS AND COMPANY ManufacturingCRAFTMASTER MANUFACTURING INC ManufacturingATHENS AREA SCHOOLS Educational ServicesMASCO RETAIL CABINET GRP LLC Manufacturing
1,150.7
53.1
27.8%
72.2%
Land Area in Square Miles
Persons per Square Mile
Percent Urban
Percent Rural
1
2
3
3
29,916
31,215
61,131
11,334
4,183
9,161
12,686
13,144
10,623
97.7%
0.6%
0.9%
0.9%
6,138,709
6,466,058
12,604,767
2,264,939
891,918
2,376,560
2,615,299
2,509,785
1,946,266
85.2%
10.9%
3.9%
5.1%
30,100
2,500
32,600
7.8%
5,872,000
591,000
6,463,000
9.1%
$1,807,891
$35,038
$29,536
$40,664
$499,669,401
$40,106
$39,762
$49,184
Page 1Source: Center for Workforce Information & Analysis unless otherwise noted

Bradford County Profile July 2010
Average Annual Wages by Major Occupational Group
SOC Code Major Occupational Group
1
PA Wage
Employment and Wages by Industry Sector
NAICS Industry Sector
1
County WageEmployer Units Employment
1 2008 Annual Average2 County total includes Private, Federal, State and Local Government
1 May 2008 Occupational Employment Survey
County Wage
PA Wage
00-0000 Total, All Occupations $33,970 $38,960
11-0000 Management Occupations $80,010 $90,150
13-0000 Business and Financial Operations Occupations $52,660 $60,400
15-0000 Computer and Mathematical Occupations $65,390 $67,240
17-0000 Architecture and Engineering Occupations $58,660 $64,670
19-0000 Life, Physical, and Social Science Occupations $55,230 $59,920
21-0000 Community and Social Services Occupations $37,950 $36,750
23-0000 Legal Occupations $84,180 $81,040
25-0000 Education, Training, and Library Occupations $43,830 $47,780
27-0000 Arts, Design, Entertainment, Sports, and Media Occupations $27,510 $42,700
29-0000 Healthcare Practitioners and Technical Occupations $60,270 $61,050
31-0000 Healthcare Support Occupations $21,720 $24,920
33-0000 Protective Service Occupations $37,310 $38,650
35-0000 Food Preparation and Serving Related Occupations $18,360 $19,300
37-0000 Building and Grounds Cleaning and Maintenance Occupations $21,690 $24,070
39-0000 Personal Care and Service Occupations $22,680 $22,680
41-0000 Sales and Related Occupations $29,370 $35,180
43-0000 Office and Administrative Support Occupations $27,790 $30,180
45-0000 Farming, Fishing, and Forestry Occupations $27,170 $27,760
47-0000 Construction and Extraction Occupations $31,150 $42,190
49-0000 Installation, Maintenance, and Repair Occupations $32,970 $39,060
51-0000 Production Occupations $33,130 $32,560
53-0000 Transportation and Material Moving Occupations $26,630 $30,240
55-0000 Military Specific Occupations N/A N/A
Total , All Industries 1,566 21,506 $34,7992 $44,381
Agriculture, Forestry, Fishing and Hunting 35 157 $21,20511 $27,532
Mining 31 136 $32,36921 $59,907
Utilities 7 131 $66,30622 $96,484
Construction 119 535 $32,03323 $51,928
Manufacturing 68 5,224 $44,13531-33 $51,529
Wholesale Trade 71 536 $35,10342 $63,443
Retail Trade 251 2,650 $21,14844-45 $24,399
Transportation and Warehousing 74 597 $28,84848-49 $38,121
Information 22 221 $27,51751 $59,311
Finance and Insurance 77 585 $39,33852 $71,782
Real Estate and Rental and Leasing 27 117 $27,07553 $44,688
Professional and Technical Services 76 344 $26,85354 $73,808
Management of Companies and Enterprises N/A N/A N/A55 $97,505
Admin/Support, Waste Mgmt/Remediation Srvs 31 321 $16,59856 $30,887
Educational Services 7 66 $19,92161 $45,970
Health Care and Social Assistance 263 4,520 $41,75762 $41,185
Arts, Entertainment, and Recreation 19 94 $11,41271 $26,583
Accommodation and Food Services 103 1,187 $10,19072 $14,848
Other Services, except Public Administration 131 512 $15,50981 $27,059
Unclassified N/A N/A N/A99 $40,590
Federal Government 31 204 $43,413 $63,173
State Government 12 280 $43,166 $49,166
Local Government 108 2,808 $35,100 $41,721
Page 2Source: Center for Workforce Information & Analysis unless otherwise noted
Sullivan County Profile July 2010
Major Employers Industry Sector
Overview
1
Population
Total Population
Male
Female
Population by Race
White
Black
Other
Hispanic Origin (all races)
Population by Age
Ages 0-14
Ages 15-19
Ages 20-34
Ages 35-49
Ages 50-64
Ages 65 and Older
County Pennsylvania
1
2
3
Labor Force County Pennsylvania
Civilian Labor Force
Employed
Unemployed
1
Unemployment Rate
Income County Pennsylvania
Per Capita Personal Income
Total Personal Income (in thousands)
Median Household Income (1999 dollars)
Median Family Income (1999 dollars)
1
2
3
4
Pennsylvania Department of Labor & Industry
651 Boas StreetRoom 220
Harrisburg, PA 17121-0001
877-4WF-DATA
www.dli.state.pa.usPA Keyword: Labor Market Information
1
2
3
4
Bureau of Economic Analysis - 2008Bureau of Economic Analysis - 2008U.S. Bureau of the Census - 2000U.S. Bureau of the Census - 2000
1 3rd Quarter 2009 - Final
1
2
3
U.S. Bureau of the Census - 2000U.S. Bureau of the Census - 2009 EstimateThe Center for Rural Pennsylvania - 2000 1 Preliminary May 2010 - Seasonally Adjusted
1 U.S. Bureau of the Census - 2009 Estimate2 U.S. Bureau of the Census - 2009 Estimate3 U.S. Bureau of the Census - 2009 Estimate
MANAGEMENT AND TRAINING CORPORATION Health Care and Social AssistanceSULLIVAN COUNTY SCHOOL DISTRICT Educational ServicesTHE HIGHLANDS CARE CENTER Health Care and Social AssistanceSULLIVAN COUNTY Public AdministrationBAYADA NURSES INC Health Care and Social AssistanceDARWAY ELDER CARE REHABILITATI Health Care and Social AssistanceDEPT OF CONSERV & NATRL RESOURCES Public AdministrationEAGLES MERE COUNTRY CLUB Arts, Entertainment, and RecreationPA DEPARTMENT OF TRANSPORTATION ConstructionDWIGHT LEWIS LUMBER CO INC Manufacturing
449.9
13.6
0.0%
100.0%
Land Area in Square Miles
Persons per Square Mile
Percent Urban
Percent Rural
1
2
3
3
3,076
3,064
6,140
788
567
783
1,077
1,398
1,527
94.9%
3.3%
1.0%
1.6%
6,138,709
6,466,058
12,604,767
2,264,939
891,918
2,376,560
2,615,299
2,509,785
1,946,266
85.2%
10.9%
3.9%
5.1%
2,900
300
3,200
8.7%
5,872,000
591,000
6,463,000
9.1%
$176,275
$30,279
$28,658
$37,196
$499,669,401
$40,106
$39,762
$49,184
Page 1Source: Center for Workforce Information & Analysis unless otherwise noted

Sullivan County Profile July 2010
Average Annual Wages by Major Occupational Group
SOC Code Major Occupational Group
1
PA Wage
Employment and Wages by Industry Sector
NAICS Industry Sector
1
County WageEmployer Units Employment
1 2008 Annual Average2 County total includes Private, Federal, State and Local Government
1 May 2008 Occupational Employment Survey
County Wage
PA Wage
00-0000 Total, All Occupations $32,840 $38,960
11-0000 Management Occupations $40,000 $90,150
13-0000 Business and Financial Operations Occupations $31,280 $60,400
15-0000 Computer and Mathematical Occupations $60,790 $67,240
17-0000 Architecture and Engineering Occupations $55,870 $64,670
19-0000 Life, Physical, and Social Science Occupations $51,040 $59,920
21-0000 Community and Social Services Occupations $38,090 $36,750
23-0000 Legal Occupations $55,330 $81,040
25-0000 Education, Training, and Library Occupations $46,260 $47,780
27-0000 Arts, Design, Entertainment, Sports, and Media Occupations $27,550 $42,700
29-0000 Healthcare Practitioners and Technical Occupations $84,450 $61,050
31-0000 Healthcare Support Occupations $22,200 $24,920
33-0000 Protective Service Occupations $43,640 $38,650
35-0000 Food Preparation and Serving Related Occupations $17,550 $19,300
37-0000 Building and Grounds Cleaning and Maintenance Occupations $22,900 $24,070
39-0000 Personal Care and Service Occupations $22,310 $22,680
41-0000 Sales and Related Occupations $40,990 $35,180
43-0000 Office and Administrative Support Occupations $25,700 $30,180
45-0000 Farming, Fishing, and Forestry Occupations $28,450 $27,760
47-0000 Construction and Extraction Occupations $33,160 $42,190
49-0000 Installation, Maintenance, and Repair Occupations $31,000 $39,060
51-0000 Production Occupations $29,340 $32,560
53-0000 Transportation and Material Moving Occupations $32,080 $30,240
55-0000 Military Specific Occupations N/A N/A
Total , All Industries 204 1,575 $25,7172 $44,381
Agriculture, Forestry, Fishing and Hunting 5 7 $10,93811 $27,532
Mining N/A N/A N/A21 $59,907
Utilities N/A N/A N/A22 $96,484
Construction 20 77 $25,74523 $51,928
Manufacturing N/A N/A N/A31-33 $51,529
Wholesale Trade 10 42 $23,08342 $63,443
Retail Trade 25 180 $21,86144-45 $24,399
Transportation and Warehousing N/A N/A N/A48-49 $38,121
Information 4 23 $13,59451 $59,311
Finance and Insurance 8 33 $32,06652 $71,782
Real Estate and Rental and Leasing N/A N/A N/A53 $44,688
Professional and Technical Services N/A N/A N/A54 $73,808
Admin/Support, Waste Mgmt/Remediation Srvs 6 39 $11,11356 $30,887
Educational Services N/A N/A N/A61 $45,970
Health Care and Social Assistance 26 422 $26,40762 $41,185
Arts, Entertainment, and Recreation N/A N/A N/A71 $26,583
Accommodation and Food Services 21 109 $10,58372 $14,848
Other Services, except Public Administration 15 46 $11,92981 $27,059
Federal Government 9 26 $32,509 $63,173
State Government 8 83 $46,833 $49,166
Local Government 18 255 $29,211 $41,721
Page 2Source: Center for Workforce Information & Analysis unless otherwise noted
Susquehanna County Profile July 2010
Major Employers Industry Sector
Overview
1
Population
Total Population
Male
Female
Population by Race
White
Black
Other
Hispanic Origin (all races)
Population by Age
Ages 0-14
Ages 15-19
Ages 20-34
Ages 35-49
Ages 50-64
Ages 65 and Older
County Pennsylvania
1
2
3
Labor Force County Pennsylvania
Civilian Labor Force
Employed
Unemployed
1
Unemployment Rate
Income County Pennsylvania
Per Capita Personal Income
Total Personal Income (in thousands)
Median Household Income (1999 dollars)
Median Family Income (1999 dollars)
1
2
3
4
Pennsylvania Department of Labor & Industry
651 Boas StreetRoom 220
Harrisburg, PA 17121-0001
877-4WF-DATA
www.dli.state.pa.usPA Keyword: Labor Market Information
1
2
3
4
Bureau of Economic Analysis - 2008Bureau of Economic Analysis - 2008U.S. Bureau of the Census - 2000U.S. Bureau of the Census - 2000
1 3rd Quarter 2009 - Final
1
2
3
U.S. Bureau of the Census - 2000U.S. Bureau of the Census - 2009 EstimateThe Center for Rural Pennsylvania - 2000 1 Preliminary May 2010 - Seasonally Adjusted
1 U.S. Bureau of the Census - 2009 Estimate2 U.S. Bureau of the Census - 2009 Estimate3 U.S. Bureau of the Census - 2009 Estimate
MONTROSE AREA SCHOOL DISTRICT Educational ServicesBARNES-KASSON COUNTY HOSPITAL Health Care and Social AssistanceELK LAKE SCHOOL DISTRICT Educational ServicesBLUE RIDGE SCHOOL DISTRICT Educational ServicesSUSQUEHANNA COUNTY Public AdministrationMOUNTAIN VIEW SCHOOL DISTRICT Educational ServicesMONTROSE GENERAL HOSPITAL Health Care and Social AssistanceFOREST CITY REGIONAL SCHOOL DIST Educational ServicesSUSQUEHANNA COMMUNITY SCHOOL Educational ServicesFOREST CITY NURSING AND Health Care and Social Assistance
822.9
49.4
18.5%
81.5%
Land Area in Square Miles
Persons per Square Mile
Percent Urban
Percent Rural
1
2
3
3
20,264
20,382
40,646
7,034
2,853
5,984
8,412
9,398
6,965
98.2%
0.6%
0.5%
1.2%
6,138,709
6,466,058
12,604,767
2,264,939
891,918
2,376,560
2,615,299
2,509,785
1,946,266
85.2%
10.9%
3.9%
5.1%
20,400
2,000
22,400
9.0%
5,872,000
591,000
6,463,000
9.1%
$1,262,656
$33,622
$30,876
$39,564
$499,669,401
$40,106
$39,762
$49,184
Page 1Source: Center for Workforce Information & Analysis unless otherwise noted

Susquehanna County Profile July 2010
Average Annual Wages by Major Occupational Group
SOC Code Major Occupational Group
1
PA Wage
Employment and Wages by Industry Sector
NAICS Industry Sector
1
County WageEmployer Units Employment
1 2008 Annual Average2 County total includes Private, Federal, State and Local Government
1 May 2008 Occupational Employment Survey
County Wage
PA Wage
00-0000 Total, All Occupations $31,500 $38,960
11-0000 Management Occupations $61,590 $90,150
13-0000 Business and Financial Operations Occupations $38,910 $60,400
15-0000 Computer and Mathematical Occupations $50,300 $67,240
17-0000 Architecture and Engineering Occupations $83,210 $64,670
19-0000 Life, Physical, and Social Science Occupations $38,420 $59,920
21-0000 Community and Social Services Occupations $41,740 $36,750
23-0000 Legal Occupations $52,610 $81,040
25-0000 Education, Training, and Library Occupations $44,190 $47,780
27-0000 Arts, Design, Entertainment, Sports, and Media Occupations $22,510 $42,700
29-0000 Healthcare Practitioners and Technical Occupations $41,300 $61,050
31-0000 Healthcare Support Occupations $25,040 $24,920
33-0000 Protective Service Occupations $37,480 $38,650
35-0000 Food Preparation and Serving Related Occupations $17,860 $19,300
37-0000 Building and Grounds Cleaning and Maintenance Occupations $22,230 $24,070
39-0000 Personal Care and Service Occupations $19,730 $22,680
41-0000 Sales and Related Occupations $27,310 $35,180
43-0000 Office and Administrative Support Occupations $26,350 $30,180
45-0000 Farming, Fishing, and Forestry Occupations $31,800 $27,760
47-0000 Construction and Extraction Occupations $31,890 $42,190
49-0000 Installation, Maintenance, and Repair Occupations $29,330 $39,060
51-0000 Production Occupations $28,340 $32,560
53-0000 Transportation and Material Moving Occupations $27,190 $30,240
55-0000 Military Specific Occupations N/A N/A
Total , All Industries 1,023 8,875 $26,4152 $44,381
Agriculture, Forestry, Fishing and Hunting 10 48 $22,17411 $27,532
Mining 60 393 $30,94721 $59,907
Utilities N/A N/A N/A22 $96,484
Construction 104 396 $34,52623 $51,928
Manufacturing 63 680 $27,44931-33 $51,529
Wholesale Trade 36 241 $36,16442 $63,443
Retail Trade 140 1,328 $21,11744-45 $24,399
Transportation and Warehousing 38 153 $29,46348-49 $38,121
Information 7 110 $38,62051 $59,311
Finance and Insurance 33 229 $32,24152 $71,782
Real Estate and Rental and Leasing 18 44 $20,63853 $44,688
Professional and Technical Services 49 190 $24,75854 $73,808
Management of Companies and Enterprises 3 64 $28,33755 $97,505
Admin/Support, Waste Mgmt/Remediation Srvs 33 149 $22,21956 $30,887
Educational Services N/A N/A N/A61 $45,970
Health Care and Social Assistance 139 1,338 $26,35862 $41,185
Arts, Entertainment, and Recreation N/A N/A N/A71 $26,583
Accommodation and Food Services 85 787 $10,98772 $14,848
Other Services, except Public Administration 74 282 $17,76181 $27,059
Federal Government 29 128 $35,175 $63,173
State Government 14 226 $46,087 $49,166
Local Government 69 1,783 $32,099 $41,721
Page 2Source: Center for Workforce Information & Analysis unless otherwise noted

Tioga County Profile July 2010
Major Employers Industry Sector
Overview
1
Population
Total Population
Male
Female
Population by Race
White
Black
Other
Hispanic Origin (all races)
Population by Age
Ages 0-14
Ages 15-19
Ages 20-34
Ages 35-49
Ages 50-64
Ages 65 and Older
County Pennsylvania
1
2
3
Labor Force County Pennsylvania
Civilian Labor Force
Employed
Unemployed
1
Unemployment Rate
Income County Pennsylvania
Per Capita Personal Income
Total Personal Income (in thousands)
Median Household Income (1999 dollars)
Median Family Income (1999 dollars)
1
2
3
4
Pennsylvania Department of Labor & Industry
651 Boas StreetRoom 220
Harrisburg, PA 17121-0001
877-4WF-DATA
www.dli.state.pa.usPA Keyword: Labor Market Information
1
2
3
4
Bureau of Economic Analysis - 2008Bureau of Economic Analysis - 2008U.S. Bureau of the Census - 2000U.S. Bureau of the Census - 2000
1 3rd Quarter 2009 - Final
1
2
3
U.S. Bureau of the Census - 2000U.S. Bureau of the Census - 2009 EstimateThe Center for Rural Pennsylvania - 2000 1 Preliminary May 2010 - Seasonally Adjusted
1 U.S. Bureau of the Census - 2009 Estimate2 U.S. Bureau of the Census - 2009 Estimate3 U.S. Bureau of the Census - 2009 Estimate
STATE SYSTEM OF HIGHER EDUCATION Educational ServicesSOLDIERS & SAILORS MEMORIAL Health Care and Social AssistanceWARD MANUFACTURING LLC ManufacturingNORTHERN TIOGA SCHOOL DISTRICT Educational ServicesSOUTHERN TIOGA SCHOOL DISTRICT Educational ServicesWAL-MART ASSOCIATES INC Retail TradeHITACHI METALS AUTOMOTIVE COMP ManufacturingNORTH PENN COMPREHENSIVE HEALTH SVC Health Care and Social AssistanceMETAMORA PRODUCTS CORP ManufacturingATP ENGINEERED PLASTICS INC Manufacturing
1,133.7
36.1
15.7%
84.3%
Land Area in Square Miles
Persons per Square Mile
Percent Urban
Percent Rural
1
2
3
3
19,984
20,891
40,875
6,647
3,077
7,301
7,697
8,670
7,483
97.7%
0.9%
0.7%
0.8%
6,138,709
6,466,058
12,604,767
2,264,939
891,918
2,376,560
2,615,299
2,509,785
1,946,266
85.2%
10.9%
3.9%
5.1%
19,000
1,900
20,900
9.2%
5,872,000
591,000
6,463,000
9.1%
$1,060,665
$32,020
$26,002
$37,907
$499,669,401
$40,106
$39,762
$49,184
Page 1Source: Center for Workforce Information & Analysis unless otherwise noted

Tioga County Profile July 2010
Average Annual Wages by Major Occupational Group
SOC Code Major Occupational Group
1
PA Wage
Employment and Wages by Industry Sector
NAICS Industry Sector
1
County WageEmployer Units Employment
1 2008 Annual Average2 County total includes Private, Federal, State and Local Government
1 May 2008 Occupational Employment Survey
County Wage
PA Wage
00-0000 Total, All Occupations $33,220 $38,960
11-0000 Management Occupations $76,690 $90,150
13-0000 Business and Financial Operations Occupations $46,350 $60,400
15-0000 Computer and Mathematical Occupations $60,240 $67,240
17-0000 Architecture and Engineering Occupations $41,860 $64,670
19-0000 Life, Physical, and Social Science Occupations $38,960 $59,920
21-0000 Community and Social Services Occupations $31,940 $36,750
25-0000 Education, Training, and Library Occupations $54,870 $47,780
27-0000 Arts, Design, Entertainment, Sports, and Media Occupations $31,000 $42,700
29-0000 Healthcare Practitioners and Technical Occupations $51,210 $61,050
31-0000 Healthcare Support Occupations $21,610 $24,920
33-0000 Protective Service Occupations $39,930 $38,650
35-0000 Food Preparation and Serving Related Occupations $18,560 $19,300
37-0000 Building and Grounds Cleaning and Maintenance Occupations $20,010 $24,070
39-0000 Personal Care and Service Occupations $19,880 $22,680
41-0000 Sales and Related Occupations $26,840 $35,180
43-0000 Office and Administrative Support Occupations $26,630 $30,180
45-0000 Farming, Fishing, and Forestry Occupations $28,450 $27,760
47-0000 Construction and Extraction Occupations $30,310 $42,190
49-0000 Installation, Maintenance, and Repair Occupations $34,100 $39,060
51-0000 Production Occupations $29,850 $32,560
53-0000 Transportation and Material Moving Occupations $26,130 $30,240
55-0000 Military Specific Occupations N/A N/A
Total , All Industries 1,080 12,759 $30,0662 $44,381
Agriculture, Forestry, Fishing and Hunting 20 95 $24,54911 $27,532
Mining N/A N/A N/A21 $59,907
Utilities 11 120 $66,89722 $96,484
Construction 69 297 $29,39323 $51,928
Manufacturing 43 2,497 $35,45031-33 $51,529
Wholesale Trade 29 375 $35,90342 $63,443
Retail Trade 163 1,791 $18,71044-45 $24,399
Transportation and Warehousing 45 356 $36,04348-49 $38,121
Information 21 169 $23,81051 $59,311
Finance and Insurance 39 403 $40,46252 $71,782
Real Estate and Rental and Leasing 16 52 $25,56353 $44,688
Professional and Technical Services 50 199 $35,13554 $73,808
Management of Companies and Enterprises N/A N/A N/A55 $97,505
Admin/Support, Waste Mgmt/Remediation Srvs 25 131 $37,10856 $30,887
Educational Services N/A N/A N/A61 $45,970
Health Care and Social Assistance 240 1,955 $29,41262 $41,185
Arts, Entertainment, and Recreation 14 106 $14,17071 $26,583
Accommodation and Food Services 99 1,096 $12,87872 $14,848
Other Services, except Public Administration 68 329 $14,15681 $27,059
Federal Government 26 167 $41,787 $63,173
State Government 19 767 $50,873 $49,166
Local Government 78 1,812 $31,468 $41,721
Page 2Source: Center for Workforce Information & Analysis unless otherwise noted

Wyoming County Profile July 2010
Major Employers Industry Sector
Overview
1
Population
Total Population
Male
Female
Population by Race
White
Black
Other
Hispanic Origin (all races)
Population by Age
Ages 0-14
Ages 15-19
Ages 20-34
Ages 35-49
Ages 50-64
Ages 65 and Older
County Pennsylvania
1
2
3
Labor Force County Pennsylvania
Civilian Labor Force
Employed
Unemployed
1
Unemployment Rate
Income County Pennsylvania
Per Capita Personal Income
Total Personal Income (in thousands)
Median Household Income (1999 dollars)
Median Family Income (1999 dollars)
1
2
3
4
Pennsylvania Department of Labor & Industry
651 Boas StreetRoom 220
Harrisburg, PA 17121-0001
877-4WF-DATA
www.dli.state.pa.usPA Keyword: Labor Market Information
1
2
3
4
Bureau of Economic Analysis - 2008Bureau of Economic Analysis - 2008U.S. Bureau of the Census - 2000U.S. Bureau of the Census - 2000
1 3rd Quarter 2009 - Final
1
2
3
U.S. Bureau of the Census - 2000U.S. Bureau of the Census - 2009 EstimateThe Center for Rural Pennsylvania - 2000 1 Preliminary May 2010 - Seasonally Adjusted
1 U.S. Bureau of the Census - 2009 Estimate2 U.S. Bureau of the Census - 2009 Estimate3 U.S. Bureau of the Census - 2009 Estimate
THE PROCTER & GAMBLE PAPER PRODS CO ManufacturingTUNKHANNOCK AREA SCHOOL DISTRICT Educational ServicesTYLER MEMORIAL HOSPITAL Health Care and Social AssistanceKALSTAR ENTERPRISES LLC Transportation and WarehousingLACKAWANNA TRAIL SCHOOL DISTRICT Educational ServicesWYOMING COUNTY Public AdministrationWAL-MART ASSOCIATES INC Retail TradeRONCO MACHINE AND RIGGING INC ConstructionST MICHAEL'S SCHOOL Health Care and Social AssistanceXLC PERSONNEL SERVICES LLC Admin/Support, Waste Mgmt/Remediation Srvs
397.2
70.0
15.0%
85.0%
Land Area in Square Miles
Persons per Square Mile
Percent Urban
Percent Rural
1
2
3
3
13,877
13,931
27,808
4,965
2,140
4,409
5,810
6,070
4,414
97.7%
1.0%
0.7%
1.2%
6,138,709
6,466,058
12,604,767
2,264,939
891,918
2,376,560
2,615,299
2,509,785
1,946,266
85.2%
10.9%
3.9%
5.1%
13,100
1,400
14,500
9.5%
5,872,000
591,000
6,463,000
9.1%
$871,701
$36,365
$31,254
$42,824
$499,669,401
$40,106
$39,762
$49,184
Page 1Source: Center for Workforce Information & Analysis unless otherwise noted

Wyoming County Profile July 2010
Average Annual Wages by Major Occupational Group
SOC Code Major Occupational Group
1
PA Wage
Employment and Wages by Industry Sector
NAICS Industry Sector
1
County WageEmployer Units Employment
1 2008 Annual Average2 County total includes Private, Federal, State and Local Government
1 May 2008 Occupational Employment Survey
County Wage
PA Wage
00-0000 Total, All Occupations $37,660 $38,960
11-0000 Management Occupations $96,020 $90,150
13-0000 Business and Financial Operations Occupations $53,570 $60,400
15-0000 Computer and Mathematical Occupations $70,630 $67,240
17-0000 Architecture and Engineering Occupations $53,020 $64,670
19-0000 Life, Physical, and Social Science Occupations $52,060 $59,920
21-0000 Community and Social Services Occupations $58,840 $36,750
23-0000 Legal Occupations $55,330 $81,040
25-0000 Education, Training, and Library Occupations $46,740 $47,780
27-0000 Arts, Design, Entertainment, Sports, and Media Occupations $32,250 $42,700
29-0000 Healthcare Practitioners and Technical Occupations $52,230 $61,050
31-0000 Healthcare Support Occupations $24,050 $24,920
33-0000 Protective Service Occupations $44,550 $38,650
35-0000 Food Preparation and Serving Related Occupations $19,010 $19,300
37-0000 Building and Grounds Cleaning and Maintenance Occupations $23,530 $24,070
39-0000 Personal Care and Service Occupations $22,480 $22,680
41-0000 Sales and Related Occupations $32,880 $35,180
43-0000 Office and Administrative Support Occupations $28,390 $30,180
45-0000 Farming, Fishing, and Forestry Occupations $26,980 $27,760
47-0000 Construction and Extraction Occupations $42,750 $42,190
49-0000 Installation, Maintenance, and Repair Occupations $38,330 $39,060
51-0000 Production Occupations $34,280 $32,560
53-0000 Transportation and Material Moving Occupations $28,990 $30,240
55-0000 Military Specific Occupations N/A N/A
Total , All Industries 698 9,546 $37,7432 $44,381
Agriculture, Forestry, Fishing and Hunting 16 128 $37,50311 $27,532
Mining 7 33 $25,45321 $59,907
Utilities N/A N/A N/A22 $96,484
Construction 67 528 $42,15723 $51,928
Manufacturing N/A N/A N/A31-33 $51,529
Wholesale Trade 35 357 $35,24142 $63,443
Retail Trade 103 1,124 $20,10444-45 $24,399
Transportation and Warehousing 31 610 $36,73648-49 $38,121
Information 11 121 $24,73551 $59,311
Finance and Insurance 36 210 $28,72352 $71,782
Real Estate and Rental and Leasing 9 14 $22,01653 $44,688
Professional and Technical Services 36 163 $46,31054 $73,808
Management of Companies and Enterprises 3 18 $45,89055 $97,505
Admin/Support, Waste Mgmt/Remediation Srvs 25 187 $21,92756 $30,887
Educational Services N/A N/A N/A61 $45,970
Health Care and Social Assistance 97 1,172 $34,56262 $41,185
Arts, Entertainment, and Recreation 9 63 $13,49271 $26,583
Accommodation and Food Services 53 594 $10,74472 $14,848
Other Services, except Public Administration 63 208 $23,01481 $27,059
Federal Government 12 76 $40,616 $63,173
State Government 11 134 $43,236 $49,166
Local Government 40 1,075 $33,058 $41,721
Page 2Source: Center for Workforce Information & Analysis unless otherwise noted