Embed Size (px)
Citation preview

NORTH WAMAC SCHOOL DISTRICT NO. 186
WAMAC, ILLINOIS
ANNUAL FINANCIAL REPORT
June 30, 2016

North Wamac School District No. 186
TABLE OF CONTENTS
Page
INDEPENDENT AUDITORS' REPORT ....................................................................... 1-3
INDEPENDENT AUDITORS’REPORT ON INTERNAL
CONTROL OVER FINANCIAL REPORTING AND ON
COMPLIANCE AND OTHER MATTERS BASED ON AN
AUDIT OF FINANCIAL STATEMENTS PERFORMED IN
ACCORDANCE WITH GOVERNMENT AUDITING STANDARDS ........................ 4-5
NOTES TO FINANCIAL STATEMENTS ..................................................................... 6-24
OTHER INFORMATION:
Schedule of Changes in Activity Funds .............................................................. 25
Pension Information Schedules
Schedule of Employer’s Proportionate Share
of the Net Pension Liability – TRS ................................................................ 26
Schedule of Employer Contributions - TRS ....................................................... 26
Schedule of Changes in the Net Pension Liability
and Related Ratios – IMRF ........................................................................... 27
Schedule of Employer Contributions – IMRF .................................................... 28
ANNUAL FINANCIAL REPORT (ISBE FORM 50-35) ............................................... AFR 1-AFR 33
and AFR 36

GLASS AND SHUFFETT, LTD. Certified Public Accountants Members: 1819 West McCord Associate Office
American Institute of P.O. Box 489 961 Fairfax
Certified Public Accountants Centralia, Illinois 62801 P.O. Box 322
Illinois Society of (618) 532-5683 Carlyle, Illinois 62231 Certified Public Accountants FAX (618) 532-5684 618-594-4737
INDEPENDENT AUDITORS’ REPORT
September 19, 2016
Members of the Board of Education
North Wamac School District No. 186
Centralia, Illinois 62801
Report on the Financial Statements We have audited the accompanying financial statements as shown on page 5 through 22 of the Annual
Financial Report (AFR) of North Wamac School District No. 186 (District), which comprise the
Statement of Assets and Liabilities Arising from Cash Transactions; of each fund and account group as
of June 30, 2016, and the related Statement of Revenues Received, Expenditures Disbursed, Other
Financing Sources (Uses) and Changes in Fund Balances (All Funds); Statement of Revenues
Received; and Statement of Expenditures Disbursed, Budget to Actual for the year then ended, and
related notes to the financial statements.
Management’s Responsibility for the Financial Statements Management is responsible for the preparation and fair presentation of these financial statements in
accordance with the financial reporting provisions of the Illinois State Board of Education.
Management is also responsible for the design, implementation, and maintenance of internal control
relevant to the preparation and fair presentation of financial statements that are free from material
misstatement, whether due to fraud or error.
Auditors’ Responsibility Our responsibility is to express opinions on these financial statements based on our audit. We
conducted our audit in accordance with auditing standards generally accepted in the United States of
America and the standards applicable to financial audits contained in Government Auditing Standards,
issued by the Comptroller General of the United States. Those standards require that we plan and
perform the audit to obtain reasonable assurance about whether the financial statements are free of
material misstatement.
An audit involves performing procedures to obtain audit evidence about the amounts and disclosures
in the financial statements. The procedures selected depend on the auditors’ judgment, including the
assessment of the risks of material misstatement of the financial statements, whether due to fraud or
error. In making those risk assessments, the auditor considers internal control relevant to the entity’s
preparation and fair presentation of the financial statements in order to design audit procedures that are
appropriate in the circumstances, but not for the purpose of expressing an opinion on the effectiveness
of the entity’s internal control. Accordingly, we express no such opinion. An audit also includes
evaluating the appropriateness of accounting policies used and the reasonableness of significant
accounting estimates made by management, as well as evaluating the overall presentation of the
financial statements.
We believe that the audit evidence we have obtained is sufficient and appropriate to provide a basis for
our audit opinions.
-1-

Basis for Adverse Opinion on U.S. Generally Accepted Accounting Principles
As described more fully in Note #1, the financial statements are prepared by North Wamac School
District No. 186 on the basis of the financial reporting provisions of the Illinois State Board of
Education, which is a basis of accounting other than accounting principles generally accepted in the
United States of America, to comply with the requirements of the Illinois State Board of Education.
The effects on the financial statement of the variances between the regulatory basis of accounting
described in Note #1 and accounting principles generally accepted in the United States of America,
although not reasonably determinable, are presumed to be material.
Adverse Opinion on U.S. Generally Accepted Accounting Principles
In our opinion, because of the significance of the matter discussed in the “Basis for Adverse Opinion
on U.S. Generally Accepted Accounting Principles” paragraph, the financial statements referred to in
the first paragraph do not present fairly, in accordance with accounting principles generally accepted
in the United States of America, the financial position of North Wamac School District No. 186 as of
June 30, 2016, and the respective changes in its financial position for the year then ended.
Basis for Qualified Opinion on Regulatory Basis of Accounting
The District has omitted disclosures required by Governmental Accounting Standards Board
Statement 45 Accounting and Financial Reporting for Post-Employment Benefits Other Than
Pensions. The amount by which this disclosure would affect the financial statements is not reasonably
determinable.
Qualified Opinion on Regulatory Basis of Accounting
In our opinion, except for the effects of the matter described in the “Basis for Qualified Opinion on
Regulatory Basis of Accounting” paragraph, the financial statements referred to in the first paragraph
present fairly, in accordance with accounting principles generally accepted in the United States of
America, in all material respects, the assets and liabilities arising from cash transactions of each fund
and account group of North Wamac School District No. 186 as of June 30, 2016, and their respective
revenue received and expenditures disbursed during the fiscal year then ended, on the basis of
financial reporting provisions of the Illinois State Board of Education described in Note #1.
Other Matters
Other Information
Our audit was conducted for the purpose of forming opinions on the financial statements that
collectively comprise North Wamac School District No. 186’s basic financial statements. The
Schedule of Changes in Activity Funds and Pension Information Schedules listed as Other Information
in the table of contents, and the information presented on AFR pages 2 through 4, AFR pages 23
through 33 and AFR page 36 are presented for the purposes of additional analysis and are not a
required part of the basic financial statements.
-2-

The supplementary schedules on AFR page 23 through 27 and the itemization schedule on AFR page
33 are the responsibility of management and were derived from and relate directly to the underlying
accounting and other records used to prepare the basic financial statements. Such information has
been subjected to the auditing procedures applied in the audit of the financial statements and certain
additional procedures, including comparing and reconciling such information directly to the
underlying accounting and other records used to prepare the basic financial statements or to the basic
financial statements themselves, and other additional procedures in accordance with auditing standards
generally accepted in the United States of America. In our opinion, the supplementary schedules on
AFR page 23 through 27 and the itemization schedule on AFR page 33 is fairly stated in all material
respects in relation to the financial statements taken as a whole.
The Schedule of Changes in Activity Funds and Pension Information Schedules listed as Other
Information in the table of contents, and the information presented on AFR pages 2 through 4 AFR
pages 28 through 32 and AFR page 36 have not been subjected to the auditing procedures applied in
the audit of the basic financial statements and, accordingly, we do not express an opinion or provide
any assurance on them.
Other Reporting Required by Government Auditing Standards
In accordance with Government Auditing Standards, we have also issued a report dated September 19,
2016, on our consideration of North Wamac School District No. 186’s internal control over financial
reporting and on our tests of its compliance with certain provisions of laws, regulations, contracts, and
grant agreements and other matters. The purpose of that report is to describe the scope of our testing
of internal control over financial reporting and compliance and the results of that testing and not to
provide an opinion on the internal control over financial reporting or on compliance. That report is an
integral part of an audit performed in accordance with Government Auditing Standards in considering
North Wamac School District No. 186’s internal control over financial reporting and compliance.
Respectfully submitted,
Centralia, Illinois
-3-

GLASS AND SHUFFETT, LTD. Certified Public Accountants Members: 1819 West McCord Associate Office
American Institute of P.O. Box 489 961 Fairfax
Certified Public Accountants Centralia, Illinois 62801 P.O. Box 322
Illinois Society of (618) 532-5683 Carlyle, Illinois 62231 Certified Public Accountants FAX (618) 532-5684 618-594-4737
INDEPENDENT AUDITORS’ REPORT ON INTERNAL CONTROL OVER
FINANCIAL REPORTING AND ON COMPLIANCE AND OTHER MATTERS
BASED ON AN AUDIT OF FINANCIAL STATEMENTS PERFORMED IN
ACCORDANCE WITH GOVERNMENT AUDITING STANDARDS
September 19, 2016
Members of the Board of Education
North Wamac School District No. 186
Centralia, Illinois 62801
We have audited, in accordance with auditing standards generally accepted in the United States of
America and the standards applicable to financial audits contained in Governmental Auditing
Standards, issued by the Comptroller General of the United States, the Statement of Assets and
Liabilities Arising from Cash Transactions of each fund and account group of North Wamac School
District No. 186 (District), as of June 30, 2016, and the related Statement of Revenues Received,
Expenditures Disbursed, Other Financing Sources (Uses) and Changes in Fund Balances (All Funds);
Statement of Revenues Received; and Statement of Expenditures Disbursed, Budget to Actual for the
year then ended, and the related notes to the financial statements, which collectively comprise the
District’s basic financial statements, and have issued our report thereon dated September 19, 2016.
Our opinion was adverse because the financial statements are not prepared in accordance with
generally accepted accounting principles. However, the financial statements were found to be fairly
stated, except for the effects of omitted disclosures required by Governmental Accounting Standards
Board Statement 45, Accounting and Financial Reporting for Post-Employment Benefits Other Than
Pensions, on the basis of financial reporting provisions of the Illinois State Board of Education, which
is comprehensive basis of accounting other than generally accepted accounting principles.
Internal Control Over Financial Reporting
In planning and performing our audit of the financial statements, we considered North Wamac School
District No. 186’s internal control over financial reporting (internal control) to determine the audit
procedures that are appropriate in the circumstances for the purpose of expressing our opinions on the
financial statements, but not for the purpose of expressing an opinion on the effectiveness of the North
Wamac School District No. 186’s internal control. Accordingly, we do not express an opinion on the
effectiveness of the District’s internal control.
A deficiency in internal control exists when the design or operation of a control does not allow
management or employees, in the normal course of performing their assigned functions, to prevent or
detect and correct misstatements on a timely basis. A material weakness is a deficiency, or
combination of deficiencies, in internal control such that there is a reasonable possibility that a
material misstatement of the District’s financial statements will not be prevented or detected and
corrected on a timely basis. A significant deficiency is a deficiency, or a combination of deficiencies,
in internal control that is less severe than a material weakness, yet important enough to merit attention
by those charged with governance.
-4-

Our consideration of internal control over financial reporting was for the limited purpose described in
the first paragraph of this section and was not designed to identify all deficiencies in internal control
that might be material weaknesses or significant deficiencies. Given these limitations, during our
audit we did not identify any deficiencies in internal control over financial reporting that we consider
to be material weaknesses. However, material weaknesses may exist that have not been identified.
Compliance and Other Matters
As part of obtaining reasonable assurance about whether North Wamac School District No. 186's
financial statements are free of material misstatement, we performed tests of its compliance with
certain provisions of laws, regulations, contracts and grant agreements, noncompliance with which
could have a direct and material effect on the determination of financial statement amounts. However,
providing an opinion on compliance with those provisions was not an objective of our audit and,
accordingly, we do not express such an opinion. The results of our tests disclosed no instances of
noncompliance that are required to be reported under Government Auditing Standards.
Purpose of this Report
The purpose of this report is solely to describe the scope of our testing of internal control and
compliance and the results of that testing, and not to provide an opinion on the effectiveness of the
District internal control or on compliance. This report is an integral part of an audit performed in
accordance with Government Auditing Standards in considering the District internal control and
compliance. Accordingly, this communication is not suitable for any other purpose.
Respectfully submitted,
Centralia, Illinois
-5-

NORTH WAMAC SCHOOL DISTRICT NO. 186
NOTES TO FINANCIAL STATEMENTS
JUNE 30, 2016
NOTE 1--SIGNIFICANT ACCOUNTING POLICIES
The District’s accounting policies conform to the cash basis of accounting as defined by the
Illinois State Board of Education Audit Guide.
A. Principles Used to Determine the Scope of the Reporting Entity
The District’s reporting entity includes the District’s governing board and all related
organizations for which the District exercises oversight responsibility.
The District has developed criteria to determine whether outside agencies with activities,
which benefit the citizens of the District, including joint agreements, which serve pupils from
numerous districts, should be included within its financial reporting entity. The criteria
includes, but is not limited to, whether the District exercises oversight responsibility (which
includes financial interdependency, selection of governing authority, designation of
management, ability to significantly influence operations, and accountability for fiscal
matters), scope of public service, and special financing relationships.
The District has determined that no other outside agency meets the above criteria and,
therefore, no other agency has been included as a component unit in the District’s financial
statements. In addition, the District is not aware of any entity, which would exercise such
oversight, which would result in the District being considered a component unit of the entity.
B. Basis of Presentation--Fund Accounting
The accounts of the District are organized on the basis of funds and account groups, each of
which is considered a separate accounting entity. The operations of each fund are accounted
for with a separate set of self-balancing accounts that comprise its assets and liabilities
(arising from cash transactions), fund balance, revenue received, and expenditures disbursed.
The District maintains individual funds required by the State of Illinois. District resources
are allocated to and accounted for in individual funds based upon the purposes for which they
are to be spent and the means by which spending activities are controlled. The following
fund types and account groups are used by the District:
Governmental Fund Types
Governmental Funds are those through which most governmental functions of the District are
financed. The acquisition, use and balances of the District's expendable financial resources
and the related liabilities (arising from cash transactions) are accounted for through
governmental funds. The financial statements, which focus on the measurement of spending
and determination of changes in financial position rather than upon net income determination,
reflect the cash basis of accounting.
General Funds--The General Fund, which consists of the Educational Fund and the
Operations and Maintenance Fund, is the general operating fund of the District. It is used to
-6-

NOTE 1--SIGNIFICANT ACCOUNTING POLICIES (CONTINUED)
account for all financial resources except those required to be accounted for in another fund.
Special Education is included in these funds.
Special Revenue Funds--Special Revenue Funds, which include the Transportation Fund, the
Illinois Municipal Retirement Fund, the Working Cash Fund and the Tort Fund, are used to
account for cash received from specific sources (other than those accounted for in the Debt
Service Fund or Fiduciary Funds) that are legally restricted to cash disbursements for
specified purposes. The Working Cash Fund accounts for financial resources held by the
District to be used for temporary interfund loans to other funds.
Debt Service Fund--The Debt Service Fund accounts for the accumulation of resources for,
and the payment of general long-term debt principal, interest and related costs.
Capital Projects Funds--The Capital Projects Funds (which include the Capital Projects Fund
and the Fire Prevention and Safety Fund) accounts for financial resources to be used for the
acquisition or construction of major capital facilities.
Fiduciary Fund Types
Fiduciary Funds are used to account for assets held by the District in a trustee capacity or as
an agent for individuals, private organizations, other governments or funds.
The Agency Funds (Student Activity Funds) account for assets held by the District as an
agent for the students and the teachers. These funds are custodial in nature and do not
involve the measurement of the results of operations. The amounts due to the activity fund
organizations are equal to the assets.
Governmental and Expendable Trust Funds--Measurement Focus
The financial statements of all Governmental Funds focus on the measurement of spending or
“financial flow” and the determination of changes in financial position rather than upon net
income determination. This means that only current assets and current liabilities are
generally included on their balance sheets. Their reported fund balance (net current assets) is
considered a measure of “available spendable resources.” Governmental fund operating
statements present increases (cash receipts and other financing sources) and decreases (cash
disbursements and other financing uses) in net current assets. Accordingly, they are said to
present a summary of sources and uses of “available spendable resources” during a period.
General Fixed Assets and General Long-Term Debt Account Groups
The accounting and reporting treatment applied to the fixed assets and long-term liabilities
associated with a fund are determined by its measurement focus. Fixed assets used in
governmental fund type operations are accounted for in the General Fixed Assets Account
Group, rather than in governmental funds. Long-Term liabilities expected to be financed
from governmental funds are accounted for in the General Long-Term Debt Account Group,
not in the governmental funds.
The two account groups are not “funds.” They are concerned only with the measurement of
financial position. They are not involved with measurement of results of operations.
-7-

NOTE 1--SIGNIFICANT ACCOUNTING POLICIES (CONTINUED)
C. Basis of Accounting
Basis of accounting refers to when revenues received and expenditures disbursed are
recognized in the accounts and how they are reported on the financial statements. The
District maintains its accounting records for all funds and account groups on the cash basis of
accounting under guidelines prescribed by the Illinois State Board of Education.
Accordingly, revenues are recognized and recorded in the accounts when cash is received. In
the same manner, expenditures are recognized and recorded upon the disbursement of cash.
Assets of a fund are only recorded when a right to receive cash exists, which arises from a
previous cash transaction. Liabilities of a fund, similarly, result from previous cash
transactions.
Cash basis financial statements omit recognition of receivables and payables and other
accrued and deferred items that do not arise from previous cash transactions.
Additionally, these basic financial statements are issued to comply with the regulatory
provisions prescribed by the Illinois State Board of Education, which is a comprehensive
basis of accounting other than generally accepted accounting principles. Therefore, GASB
34 financial statements are not presented.
Proceeds from sales of bonds are included as other financing sources in the appropriate fund
on the date received. Related bond principal payable in the future is recorded at the same
time in the General Long-Term Debt Account Group.
D. Budgets and Budgetary Accounting
The budget for all Governmental Fund Types is prepared on the cash basis of accounting,
which is the same basis that is used in financial reporting. This allows for comparability
between budget and actual amounts. The budget was passed on September 21, 2015, and was
amended on June 20, 2016.
For each fund, total fund expenditures disbursed may not legally exceed the budgeted
amounts. The budget lapses at the end of each fiscal year. For the year ended June 30, 2016,
expenditures disbursed in the Transportation Fund, Tort Fund and Fire Prevention and Safety
Fund exceeded budgeted amounts.
The District follows these procedures in establishing the budgetary data reflected in the
financial statements:
1. Prior to July 1, the Superintendent submits to the Board of Education a proposed
operating budget for the fiscal year. The operating budget includes proposed
expenditures disbursed and the means of financing them.
2. A public hearing is conducted to obtain taxpayer comments.
3. By September 30, the budget is legally adopted through passage of a resolution.
4. The Board of Education is authorized to transfer up to 10% of the total budget between
line items within any fund; however, any revisions that alter the total disbursements of
any fund must be approved by the Board of Education after a public hearing.
-8-

NOTE 1--SIGNIFICANT ACCOUNTING POLICIES (CONTINUED)
5. Formal budgetary integration is employed as a management control device during the
year for the General and Special Revenue Funds. Formal budgetary integration is not
employed for Debt Service and Capital Projects Funds because effective budgetary
control is alternatively achieved through general obligation provision.
6. Budgeted amounts presented are those as originally adopted, or as amended by the Board
of Education. Individual amendments were not material in relation to the original
appropriations, which were amended.
E. Cash and Cash Equivalents
The District’s cash and cash equivalents are considered to be cash on hand, demand deposits,
and short term investments with an initial maturity of twelve months or less. Separate bank
accounts are not maintained for all District funds. Certain funds maintain their uninvested
cash in a common checking account, with accounting records being maintained to show the
portion of the common bank account balance attributable to each participating fund.
F. Investments
Investments are stated at lower of cost or market. The institutions in which investments are
made must be approved by the Board of Education. At June 30, 2016, all of the District's
investments were either covered by federal insurance or were fully collateralized.
G. General Fixed Assets
General fixed assets have been acquired for general government purposes. At the time of
purchase, assets are recorded as disbursements and capitalized at cost in the General Fixed
Assets Account Group. The District’s policy is to capitalize items with a cost of $1,000 or
greater. All general fixed assets acquired prior to June 30, 1965, are stated at the estimated
original cost as determined by appraisals as of that date. Donated general fixed assets are
stated at estimated fair market value as of the date of acquisition. Depreciation accounting is
not considered applicable except to determine the per capita tuition charge, and for fiscal year
2016, totaled $44,791. Depreciation is calculated using the straight-line method with the
following estimated useful lives:
Life in
Asset Class Years
Buildings 50
Land Improvements 20
Equipment 3-10
H. Inventories
The District does not maintain inventories that would be material to the financial statements.
Inventories are expensed as they are purchased.
I. Use of Estimates The preparation of financial statements in conformity with the other comprehensive basis of
accounting requires management to make estimates and assumptions that affect the reported
-9-

NOTE 1--SIGNIFICANT ACCOUNTING POLICIES (CONTINUED)
amounts of assets and liabilities and disclosures of contingent assets and liabilities at the date
of the financial statements and reported amounts of revenues and expenses during the period.
Actual results could differ from those estimates.
J. Compensated Absences
Employees of the District are entitled to paid vacations, sick days and other time off
depending on job classification, length of service and other factors. It is impracticable to
estimate the amount of compensation for future absences and, accordingly, no liability has
been recorded in the accompanying financial statements. The District's policy is to recognize
the costs of compensated absences when paid to employees.
NOTE 2--PROPERTY TAXES
The District's property tax is levied each year on all taxable real property located in the District.
Property taxes collected during the fiscal year ended June 30, 2016, represent the 2014 levy that
was approved by the Board on December 16, 2015. The 2015 levy, which will be collected in
fiscal year 2017, was adopted by the Board on December 19, 2015. Property taxes attach as an
enforceable lien on property as of January 1, and are payable in two installments on or about July
1, and September 1, of each year. The District receives significant distributions of tax receipts
approximately one month after the due dates. Taxes are considered delinquent after the County's
collection dates.
Following are the tax rate limits permitted by the School Code and by local referendum and the
actual rates levied per $100.00 of assessed valuation:
2015 2014 2013
Combined Combined Combined
Limit Levy Levy Levy
Education 1.50000 1.44013 1.50000 1.50000
Operations and Maintenance .25000 .23950 .25000 .23842
Transportation .12000 .11495 .12000 .11443
Municipal Retirement as needed .10712 .00000 .00000
Social Security as needed .26570 .27737 .26446
Bond and Interest as needed .38289 .41818 .43766
Working Cash .05000 .04791 .05000 .04768
Tort Immunity as needed .95920 1.11316 1.06136
Fire Prevention and Safety .05000 .04791 .05000 .04768
Lease/Purchase/Rent .05000 .04791 .05000 .04768
Special Education .02000 .01917 .02000 .01908
3.67239 3.84871 3.77845
Assessed Valuation $9,335,768 $8,537,139 $8,476,897
Amount Extended $ 351,824 $ 327,918 $ 324,182
-10-

NOTE 3--FUND BALANCE REPORTING
According to Government Accounting Standards, fund balances are to be classified into five
major classifications; Nonspendable Fund Balance, Restricted Fund Balance, Committed Fund
Balance, Assigned Fund Balance, and Unassigned Fund Balance. The Regulatory Model
followed by the District, only reports Reserved and Unreserved Fund Balances. Below are
definitions of the differences and a reconciliation of how these balances are reported.
A. Nonspendable Fund Balance
The nonspendable fund balance classification includes amounts that cannot be spent
because they are either (a) not in spendable form or (b) legally or contractually required
to be maintained intact. The “not in spendable form” criterion includes items that are not
expected to be converted to cash, for example inventories and prepaid amounts. Due to
the cash basis nature of the district all such items are expensed at the time of purchase, so
there is nothing to report for this classification.
B. Restricted Fund Balance
The restricted fund balance classification refers to amounts that are subject to outside
restrictions, not controlled by the entity. Things such as restrictions imposed by
creditors, grantors, contributors, or laws and regulations of other governments, or
imposed by law through constitutional provisions or enabling legislation. Special
Revenue Funds are by definition restricted for those specified purposes. The District has
several revenue sources received within different funds that also fall into these categories:
1. Special Education
Cash receipts and the related cash disbursements of this restricted tax levy are accounted
for in the Educational Fund. Expenditures disbursed exceeded revenue received for this
purpose, resulting in no restricted fund balance.
2. Leasing Levy
Cash disbursed and the related cash receipts of this restricted tax levy are accounted for
in the Educational Fund. Expenditures disbursed exceeded revenue for this purpose,
resulting in no restricted fund balance.
3. State Grants
Proceeds from state grants and the related expenditures have been included in the
Educational and Transportation Funds. At June 30, 2016, expenditure disbursed
exceeded revenues received from state grants, resulting in no restricted fund balances.
4. Federal Grants
Proceeds from federal grants and the related expenditures have been included in the
Educational Fund. At June 30, 2016, expenditures disbursed exceeded revenue received
from federal grants, resulting in no restricted balances.
5. Social Security
Cash disbursed and the related cash receipts of this restricted tax levy are accounted for
in the Municipal Retirement/Social Security Fund. At June 30, 2016, $24,896 of this
restricted tax levy had not been expended. This balance is included in the financial
statements as reserved in the Municipal Retirement/Social Security Fund.
-11-

NOTE 3--FUND BALANCE REPORTING (CONTINUED)
C. Committed Fund Balance
The committed fund balance classification refers to amounts that can only be used for
specific purposes pursuant to constraints imposed by formal action of the government’s
highest level of decision making authority (the School Board). Those committed
amounts cannot be used for any other purpose unless the government removes or changes
the specified use by taking the same type of formal action it employed to previously
commit those amounts.
The School Board commits fund balance by making motions or passing resolutions to
adopt policy or to approve contracts. Committed fund balance also incorporates
contractual obligations to the extent that existing resources in the fund have been
specifically committed for use in satisfying those contractual requirements.
Employee contracts for services rendered during the school year for employees electing
twelve month pay schedules are recorded as disbursements in the fiscal year when such
checks are drawn. At June 30, 2016, the total amount of unpaid contracts for services
performed during the fiscal year ended June 30, 2016 amounted to $34,086. This amount
is shown as unreserved in the Educational Fund.
D. Assigned Fund Balance
The assigned fund balance classification refers to amounts that are constrained by the
government’s intent to be used for a specific purpose, but are neither restricted nor
committed. Intent may be expressed by (a) the School Board itself or (b) the finance
committee or by the Superintendent when the School Board has delegated the authority to
assign amounts to be used for specific purposes.
E. Unassigned Fund Balance
The unassigned fund balance classification is the residual classification for amounts in
the General Operating Funds for amounts that have not been restricted, committed, or
assigned to specific purposes within the General Funds. Unassigned Fund Balance
amounts are shown in the financial statements as Unreserved Fund Balances in the
Educational, Operations and Maintenance, and Working Cash Funds.
F. Regulatory - Fund Balance Definitions
Reserved Fund Balances are those balances that are reserved for a specified purpose,
other than the regular purpose of any given fund. Unreserved Fund Balances are all
balances that are reserved for a specific purpose other than the specified purpose of a
fund.
-12-

NOTE 3--FUND BALANCE REPORTING (CONTINUED)
G. Reconciliation of Fund Balance Reporting
The first five columns of the following table represent Fund Balance Reporting according
to generally accepted accounting principles. The last two columns represent Fund
Balance Reporting under the regulatory basis of accounting utilized in preparation of the
financial statements.
Generally Accepted Accounting Principles Regulatory Basis
Fund
Nonspendable
Restricted
Committed
Assigned
Unassigned
Financial
Statements-
Reserved
Financial
Statements-
Unreserved
Educational $ 0 $ 0 $34,086 $ 0 $1,379,151 $ 0 $1,413,237
Operations &
Maintenance
0
0
0
0
42,005
0
42,005
Debt Service 0 1,191 0 0 0 0 1,191
Transportation 0 0 0 0 38,739 0 38,739
Municipal
Retirement
0
52,108
0
0
0
24,896
27,212
Capital Projects 0 0 0 0 0 0 0
Working Cash 0 0 0 0 142,968 0 142,968
Tort Liability 0 109,475 0 0 0 0 109,475
Fire Prevention
and Safety
0
160,713
0
0
0
0
160,713
H. Expenditures of Fund Balance
Unless specifically identified, expenditures act to reduce restricted balances first, then
committed balances, next assigned balances, and finally act to reduce unassigned
balances. Expenditures for a specifically identified purpose will act to reduce the specific
classification of fund balance that is identified.
NOTE 4--CASH AND INVESTMENTS
The District is allowed to invest in securities as authorized by Sections 2 & 6 of the Public Funds
Investment Act (30 ILCS 235/2 and 6); and Section 8-7 of the School Code.
Custodial Credit Risk - Deposits:
Custodial credit risk is the risk that, in the event of bank failure, the District’s deposits may not be
returned to it. The District does not have a deposit policy for custodial credit risk. As of June 30,
2016, the District’s bank balances (checking and money market accounts and certificates of
deposit) totaling $1,967,626 (book balance $1,960,436) were fully insured or collateralized by
securities held in the District’s name at a third party financial institution.
-13-

NOTE 5--CAPITAL ASSETS
The following is a summary of changes in capital assets for the year ended June 30, 2016:
Beginning Ending
Balance Balance
07-01-15 Additions Deletions 06-30-16 Capital Assets, Not Being Depreciated:
Land $ 8,325 $ - $ - $ 8,325
Construction in Progress - 8,000 - 8,000
Total Capital Assets
Not Being Depreciated 8,325 8,000 - 16,325 Capital Assets Being Depreciated:
Buildings 972,672 14,621 - 987,293
Land Improvements 128,157 - - 128,157
Transportation Equipment 68,593 - - 68,593
Food Service Equipment 36,690 3,429 - 40,119
Other Equipment 425,523 15,729 - 441,252
Total Capital Assets
Being Depreciated 1,631,635 33,779 - 1,665,414
Less Accumulated Depreciation for:
Buildings 402,979 19,658 - 422,637
Land Improvements 58,934 5,391 - 64,325
Transportation Equipment 68,593 - - 68,593
Food Service Equipment 28,816 1,857 - 30,673
Other Equipment 342,116 17,885 - 360,001
Total Accumulated Depreciation 901,438 44,791 - 946,229
Total Capital Assets
Being Depreciated, Net 730,197 (11,012 ) - 719,185
Total Capital Assets, Net $ 738,522 $(3,012 ) $ - $735,510
NOTE 6--POSTEMPLOYMENT BENEFIT PLANS
The School District participates in two retirement systems: The Teachers’ Retirement System of the
State of Illinois (TRS) and the Illinois Municipal Retirement Fund (IMRF), and a postemployment
Health Care Plan - Teacher Health Insurance Security (THIS) Fund. TEACHERS’ RETIREMENT SYSTEM Plan description
The employer participates in the Teachers’ Retirement System of Illinois. TRS is a cost-sharing
multiple-employer defined benefit pension plan that was created by the Illinois legislature for the
benefit of Illinois public school teachers employed outside the City of Chicago. TRS members
include all active non-annuitants who are employed by a TRS-covered employer to provide services
for which teacher licensure is required. The Illinois Pension Code outlines the benefit provisions of
TRS, and amendments to the plan can be made only by legislative action with the Governor’s
approval. The TRS Board of Trustees is responsible for the System’s administration. TRS issues a publicly available financial report that can be obtained at http://trs.illinois.gov/pubs/cafr;
by writing to TRS at 2815 W. Washington, PO Box 19253, Springfield, IL 62794; or by calling (888)
877-0890, option 2.
-14-

NOTE 6--POSTEMPLOYMENT BENEFIT PLANS (CONTINUED)
Benefits provided
TRS provides retirement, disability, and death benefits. Tier I members have TRS or reciprocal
system service prior to January 1, 2011. Tier I members qualify for retirement at age 62 with five
years of service, at age 60 with 10 years, or age 55 with 20 years. The benefit is determined by the
average of the four highest years of creditable earnings within the last 10 years of creditable service
and the percentage of average salary to which the member is entitled. Most members retire under a
formula that provides 2.2 percent of final average salary up to a maximum of 75 percent with 34 years
of service. Disability and death benefits are also provided. Tier II members qualify for retirement benefits at age 67 with 10 years of service, or a discounted
annuity can be paid at age 62 with 10 years of service. Creditable earnings for retirement purposes
are capped and the final average salary is based on the highest consecutive eight years of creditable
service rather than the last four. Disability provisions for Tier II are identical to those of Tier I.
Death benefits are payable under a formula that is different from Tier I. Essentially all Tier I retirees receive an annual 3 percent increase in the current retirement benefit
beginning January 1 following the attainment of age 61 on January 1 following the member’s first
anniversary in retirement, whichever is later. Tier II annual increases will be the lesser of three
percent of the original benefit or one-half percent of the rate of inflation beginning January 1
following attainment of age 67 or on January 1 following the member’s first anniversary in
retirement, whichever is later.
Contributions
The state of Illinois maintains the primary responsibility for funding TRS. The Illinois Pension Code,
as amended by Public Act 88-0593 and subsequent acts, provides that for years 2010 through 2045,
the minimum contribution to the System for each fiscal year shall be an amount determined to be
sufficient to bring the total assets of the System up to 90 percent of the total actuarial liabilities of the
System by the end of fiscal year 2045.
Contributions from active members and TRS contributing employers are also required by the Illinois
Pension Code. The contribution rates are specified in the pension code. The active member
contribution rate for the year ended June 30, 2015, was 9.4 percent of creditable earnings. The
member contribution, which may be paid on behalf of employees by the employer, is submitted to
TRS by the employer.
On-behalf contributions to TRS: The state of Illinois makes employer pension contributions on
behalf of the employer. For the year ended June 30, 2016, state of Illinois contributions recognized
by the employer were based on the state’s proportionate share of the collective net pension liability
associated with the employer, and the employer recognized revenue and expenditures of $219,694 in
pension contributions from the state of Illinois.
2.2 formula contributions: Employers contribute 0.58 percent of total creditable earnings for the 2.2
formula change. This contribution rate is specified by statute. Contributions for the year ended June
30, 2016 were $14,788 and are deferred because they were paid after the June 30, 2015 measurement
date. Federal and special trust fund contributions: When TRS members are paid from federal and special
trust funds administered by the employer, there is a statutory requirement for the employer to pay an
employer pension contribution from those funds. Under a policy adopted by the TRS Board of
Trustees that has been in effect since the fiscal year ended June 30, 2006, employer contributions for
employees paid from federal and special trust funds will be the same as the state contribution rate to
TRS. Public Act 98-0674 now requires the two rates to be the same.
-15-

NOTE 6--POSTEMPLOYMENT BENEFIT PLANS (CONTINUED)
For the year ended June 30, 2016 the employer pension contribution was 36.06 percent of salaries
paid from federal and special trust funds. For the year ended June 30, 2016, salaries totaling $41,309
were paid from federal and special trust funds that required employer contributions of $14,896.
These contributions are deferred because they were paid after the June 30, 2015 measurement date. Early retirement cost contributions: Under GASB Statement No. 68, contributions that an employer
is required to pay because of a TRS member retiring are categorized as specific liability payments.
The employer is required to make a one-time contribution to TRS for members retiring under the
Early Retirement Option (ERO). The payments vary depending on the member’s age and salary. The
maximum employer ERO contribution under the current program is 146.5 percent and applies when
the member is age 55 at retirement. For the year ended June 30, 2016, the employer paid $-0- to TRS
for employer ERO contributions. The employer is also required to make a one-time contribution to TRS for members granted salary
increases over 6 percent if those salaries are used to calculate a retiree’s final average salary. A one-
time contribution is also required for members granted sick leave days in excess of the normal annual
allotment if those days are used as TRS service credit. For the year ended June 30, 2016, the
employer paid $-0- to TRS for employer contributions due on salary increases in excess of 6 percent
and $-0- for sick leave days granted in excess of the normal annual allotment.
Pension Liabilities, Pension Expense, and Deferred Outflows of Resources and Deferred Inflows of
Resources Related to Pensions At June 30, 2016, the employer reported a liability for its proportionate share of the net pension
liability (first amount shown below) that reflected a reduction for state pension support provided to
the employer. The state’s support and total are for disclosure purposes only. The amount recognized
by the employer as its proportionate share of the net pension liability, the related state support, and
the total portion of the net pension liability that was associated with the employer were as follows:
Employer’s proportionate share of the net liability $ 316,435
State’s proportionate share of the net pension liability associated with the employer 3,510,688
Total $3,827,123
The net pension liability was measured as of June 30, 2015, and the total pension liability used to
calculate the net pension liability was determined by an actuarial valuation as of June 30, 2014, and
rolled forward to June 30, 2015. The employer’s proportion of the net pension liability was based on
the employer’s share of contributions to TRS for the measurement year ended June 30, 2015, relative
to the projected contributions of all participating TRS employers and the state during that period. At
June 30, 2015, the employer’s proportion was .0004830331 percent, which was an increase (decrease)
of .0004541908 from its proportion measured as of June 30, 2014. For the year ended June 30, 2016, the employer recognized pension expense of $219,694 and revenue
of $219,694 for support provided by the state. At June 30, 2016, the employer reported deferred
outflows of resources and deferred inflows of resources related to pensions from the following
sources: Deferred Deferred
Outflows of Inflows of
Resources Resources
Difference between expected and actual experience $ 118 $ 347
Net difference between projected and actual earnings
on pension plan investments 6,267 11,081
Changes of assumptions 4,376 -
Changes in proportion and differences between employer
contributions and proportionate share of contributions 14,688 15,486
Employer contributions subsequent to the measurement date 72,579 -
Total $98,028 $26,914
-16-

NOTE 6--POSTEMPLOYMENT BENEFIT PLANS (CONTINUED)
$72,579 reported as deferred outflows of resources related to pensions resulting from employer
contributions subsequent to the measurement date will be recognized as a reduction of the net pension
liability in the reporting year ended June 30, 2017. Other amounts reported as deferred outflows of
resources and deferred inflows of resources related to pensions will be recognized in pension expense
as follows: Year ended June 30:
2017 $(2,290 )
2018 (2,290 )
2019 (2,290 )
2020 5,405
2021 -
Actuarial assumptions
The total pension liability in the June 30, 2015 actuarial valuation was determined using the following
actuarial assumptions, applied to all periods included in the measurement: Inflation 3.00 percent
Salary increases varies by amount of service credit
Investment rate of return 7.50 percent, net of pension plan investment expense, including inflation Mortality rates were based on the RP-2014 White Collar Table with adjustments as appropriate for
TRS experience. The rates are used on a fully-generational basis using projection table MP-2014. The actuarial assumptions for the years ended June 30, 2015 and 2014 were different. The actuarial
assumptions used in the June 30, 2015 valuation were based on the 2015 actuarial experience
analysis. The investment return assumption remained at 7.75 percent, salary increase assumptions
were lowered, retirement rates were increased, mortality updates were made and other assumptions
were revised. The actuarial assumptions used in the June 30, 2014 valuation were based on updates
to economic assumptions adopted in 2014 which lowered the investment return assumption from 8.0
percent to 7.5 percent. The salary increase and inflation assumptions were also lowered from their
2013 levels. The long-term expected rate of return on pension plan investments was determined using a building-
block method in which best-estimate ranges of expected future real rates of return (expected returns,
net of pension plan investment expense and inflation) are developed for each major asset class. These
ranges are combined to produce the long-term expected rate of return by weighting the expected
future real rates of return by the target asset allocation percentage and by adding expected inflation.
The target allocation and best estimates of arithmetic real rates of return for each major asset class
that were used by the actuary are summarized in the following table: Target Long-Term Expected
Asset Class Allocation Real Rate of Return
U.S. large cap 18% 7.53%
Global equity excluding U.S. 18% 7.88%
Aggregate bonds 16% 1.57%
U.S. TIPS 2% 2.82%
NCREIF 11% 5.11%
Opportunistic real estate 4% 9.09%
ARS 8% 2.57%
Risk parity 8% 4.87%
Diversified inflation strategy 1% 3.26%
Private equity 14% 12.33%
100%
-17-

NOTE 6--POSTEMPLOYMENT BENEFIT PLANS (CONTINUED)
Discount rate
At June 30, 2015, the discount rate used to measure the total pension liability was a blended rate of
7.47 percent, which was a change from the June 30, 2014 rate of 7.50 percent. The projection of cash
flows used to determine the discount rate assumed that employee contributions, employer
contributions, and state contributions will be made at the current statutorily-required rates. Based on those assumptions, TRS’s fiduciary net position at June 30, 2015 was not projected to be
available to make all projected future benefit payments of current active and inactive members and all
benefit recipients. Tier I’s liability is partially-funded by Tier II members, as the Tier II member
contribution is higher than the cost of Tier II benefits. Due to this subsidy, contributions from future
members in excess of the service cost are also included in the determination of the discount rate.
Despite the subsidy, all projected future payments were not covered, so a slightly lower long-term
expected rate of return on TRS investments was applied to all periods of projected benefit payments
to determine the total pension liability. At June 30, 2014, the discount rate used to measure the total pension liability was 7.50 percent. The
discount rate was the same as the actuarially-assumed rate of return on investments that year because
TRS’s fiduciary net position and the subsidy provided by Tier II were sufficient to cover all projected
benefit payments. Sensitivity of the employer’s proportionate share of the net pension liability to changes in the
discount rate
The following presents the employer’s proportionate share of the net pension liability calculated using
the discount rate of 7.47 percent, as well as what the employer’s proportionate share of the net
pension liability would be it were calculated using a discount rate that is 1-percentage point lower
(6.47 percent) or 1-percentage point higher (8.47 percent) than the current rate. 1% Decrease Current Discount Rate 1% Increase
(6.47%) (7.47%) (8.47%)
Employer’s proportionate share
of the net position liability $391,036 $316,435 $255,260 TRS fiduciary net position
Detailed information about the TRS’s fiduciary net positon as of June 30, 2015 is available in the
separately issued TRS Comprehensive Annual Financial Reports.
TEACHERS’ HEALTH INSURANCE SECURITY FUND THIS Fund employer contributions
The employer participates in the Teacher Health Insurance Security (THIS) Fund, a cost-sharing,
multiple-employer defined benefit post-employment healthcare plan that was established by the
Illinois legislature for the benefit of retired Illinois public school teachers employed outside the city
of Chicago. The THIS Fund provides medical, prescription and behavioral health benefits, but it does
not provide vison, dental, or life insurance benefits to annuitants of the Teachers’ Retirement System
(TRS). Annuitants not enrolled in Medicare may participate in the state-administered participating
provider option plan or choose from several managed care options. Annuitants who are enrolled in
Medicare Parts A and B may be eligible to enroll in a Medicare Advantage plan. The State Employee Group Insurance Act of 1971 (5 ILCS 375) outlines the benefit provisions of the
THIS Fund and amendments to the plan can be made only by legislative action with the Governor’s
approval. Effective July 1, 2012, in accordance with Executive Order 12-01, the plan is administered
by the Illinois Department of Central Management Services (CMS) with cooperation of TRS. Section
6.6 of the State Employees Group Insurance Act of 1971 requires all active contributors to TRS who
are not employees of the state to make a contribution to the THIS Fund.
-18-

NOTE 6--POSTEMPLOYMENT BENEFIT PLANS (CONTINUED)
The percentage of employer required contributions in the future will not exceed 105 percent of the
percentage of salary actually required to be paid in the previous year.
On behalf contributions to the THIS Fund
The state of Illinois makes employer retiree health insurance contributions on behalf of the
employer. State contributions are intended to match contributions to THIS Fund from active
members which were 1.07 percent of pay during the year ended June 30, 2016. State of Illinois
contributions were $6,519 and the employer recognized revenue and expenditures of this amount
during the year.
Employer contributions to the THIS Fund
The employer also makes contributions to the THIS Fund. The employer THIS Fund
contribution was 0.80 percent during the year ended June 30, 2016. For the year ended June 30,
2016, the employer paid $4,874 to the THIS Fund, which was 100 percent of the required
contribution.
Further information on the THIS Fund
The publicly available financial report of the THIS Fund may be found on the website of the Illinois
Auditor General: http://www.auditor.illinois.gov/Audit.Reports/ABC-List.asp. The current reports
are listed under “Central Management Services.” Prior reports are available under “Healthcare and
Family Services.”
ILLINOIS MUNICIPAL RETIREMENT FUND Plan description
The District’s defined benefit pension plan for regular employees provides retirement and disability
benefits, post-retirement increases, and death benefits to plan members and beneficiaries. The
District’s plan is managed by the Illinois Municipal Retirement Fund (IMRF), the administrator of a
multi-employer public pension fund. A summary of IMRF’s pension benefits is provided in the
“Benefits provided” section of this document. Details of all benefits are available from IMRF.
Benefit provisions are established by statute and may only be changed by the General Assembly of
the State of Illinois. IMRF issues a publicly available Comprehensive Annual Financial Report that
includes financial statements, detailed information about the pension plan’s fiduciary net position,
and required supplementary information. The report is available for download at www.imrf.org.
Benefits provided
IMRF has three benefit plans. The vast majority of IMRF members (and all District members)
participate in the Regular Plan (RP). The Sheriff’s Law Enforcement Personnel (SLEP) plan is for
sheriffs, deputy sheriffs, and selected police chiefs. Counties may adopt the Elected County Official
(ECO) plan for officials elected prior to August 8, 2011 (the ECO plan was closed to new participants
after that date).
All three IMRF benefit plans have two tiers. Employees hired before January 1, 2011, are eligible for
Tier 1 benefits. Tier 1 employees are vested for pension benefits when they have at least eight years
of qualifying service credit. Tier 1 employees who retire at age 55 (at reduced benefits) or after age
60 (at full benefits) with eight years of service are entitled to an annual retirement benefit, payable
monthly for life, in an amount equal to 1-2/3% of the final rate of earnings for the first 15 years of
service credit, plus 2% for each year of service credit after 15 years to a maximum of 75% of their
final rate of earnings. Final rate of earnings is the highest total earnings during any consecutive 48
months within the last 10 years of service, divided by 48. Under Tier 1, the pension is increased by
3% of the original amount on January 1 every year after retirement.
-19-

NOTE 6--POSTEMPLOYMENT BENEFIT PLANS
Employees hired on or after January 1, 2011, are eligible for Tier 2 benefits. For Tier 2 employees,
pension benefits vest after ten years of service. Participating employees who retire at age 62 (at
reduced benefits) or after age 67 (at full benefits) with ten years of service are entitled to an annual
retirement benefit, payable monthly for life, in an amount equal to 1-2/3% of the final rate of earnings
for the first 15 years of service credit, plus 2% for each year of service credit after 15 years to a
maximum of 75% of their final rate of earnings. Final rate of earnings is the highest total earnings
during any 96 consecutive months within the last 10 years of service, divided by 96. Under Tier 2,
the pension is increased on January 1 every year after retirement, upon reaching age 67, by the lesser
of:
3% of the original pension amount, or
1/2 of the increase in the Consumer Price Index of the original pension amount. At December 31, 2015, the following employees were covered by the benefit terms:
Retirees or beneficiaries currently receiving benefits 11
Inactive plan members entitled to but not yet receiving benefits 23
Active plan members 8
Total 42
Contributions
As set by statute, regular plan members are required to contribute 4.5% of their annual covered salary.
The statute requires employers to contribute the amount necessary, in addition to member
contributions, to finance the retirement coverage of its own employees. The District’s annual
required member contribution rate for calendar year 2015 was 11.67 percent. For the fiscal year
ended June 30, 2016, the District contributed $16,929 to the plan. The District also contributes for
disability benefits, death benefits, and supplemental retirement benefits, all of which are pooled at the
IMRF level. Contribution rates for disability and death benefits are set by the IMRF Board of
Trustees, while the supplemental retirement benefits rate is set by statute.
Net pension liability
The District’s net pension liability was measured as of December 31, 2015. The total pension
liability used to calculate the net pension liability was determined by an actuarial valuation as of that
date.
Actuarial assumptions
The following are the methods and assumptions used to determine total pension liability at December
31, 2015:
The Actuarial Cost Method used was Entry Age Normal.
The Asset Valuation Method used was Market Value of Assets.
The Inflation Rate was assumed to be 3.5%.
Salary Increases were expected to be 3.75% to 14.50%, including inflation.
The Investment Rate of Return was assumed to be 7.50%.
Projected Retirement Age was from the Experience-based Table of Rates, specific to the type of
eligibility condition, last updated for the 2014 valuation according to an experience study from
years 2011 to 2013.
The IMRF-specific rates for Mortality (for non-disabled retirees) were developed from the RP-
2014 Blue Collar Health Annuitant Mortality Table with adjustments to match current IMRF
experience.
For Disabled Retirees, an IMRF-specific mortality table was used with fully generational
projection scale MP-2014 (base year 2014). The IMRF-specific rates were developed from the
RP-2014 Disabled Retirees Mortality Table, applying the same adjustments that were applied
for non-disabled lives.
For Active Members, an IMRF-specific mortality table was used with fully generational
projection scale MP-2014 (base year 2014). The IMRF-specific rates were developed from the
RP-2014 Employee Mortality Table with adjustments to match current IMRF experience.
-20-

NOTE 6--POSTEMPLOYMENT BENEFIT PLANS
The long-term expected rate of return on pension plan investments was determined using a
building-block method in which best-estimate ranges of expected future real rates of return
(expected returns, net of pension plan investment expense, and inflation) are developed for each
major asset class. These ranges are combined to produce the long-term expected rate of return
by weighting the expected future real rates of return to the target asset allocation percentage and
adding expected inflation. The target allocation and best estimates of geometric real rates of
return for each major asset class are summarized in the following table:
Long-Term
Portfolio Expected
Target Real Rate
Asset Class Percentage
of Return
Domestic Equity 38% 7.60%
International Equity 17% 7.80%
Fixed Income 27% 3.00%
Real Estate 8% 6.15%
Alternative Investments 9% 5.25-8.50%
Cash Equivalents 1% 2.25%
Total 100%
Single Discount Rate
A Single Discount Rate of 7.45% was used to measure the total pension liability. The projection of
cash flow used to determine this Single Discount Rate assumed that the plan members’ contributions
will be made at the current contribution rate, and that employer contributions will be made at rates
equal to the difference between actuarially determined contribution rates and the member rate. The
Single Discount Rate reflects:
1. The long-term expected rate of return on pension plan investments (during the period in which
the fiduciary net position is projected to be sufficient to pay benefits), and
2. The tax-exempt municipal bond rate based on an index of 20-year general obligation bonds with
an average AA credit rating (which is published by the Federal Reserve) as of the measurement
date (to the extent that the contributions for use with the long-term expected rate of return are
not met).
For the purpose of the most recent valuation, the expected rate of return on plan investments is
7.50%, the municipal bond rate is 3.56%, and the resulting single discount rate is 7.45%. Changes in the net pension liability
Total
Pension Plan Fiduciary Net Pension
Liability Net Position Liability
(A) (B) (A) - (B)
Balances at December 31, 2014 $ 597,373
$ 547,700
$ 49,673
Changes for the year:
Service Cost 18,086 - 18,086
Interest on the Total Pension Liability 44,557 - 44,557
Changes of Benefit Terms - - -
Differences Between Expected and Actual
Experience of the Total Pension Liability (15,624) - (15,624)
Changes of Assumptions 2,328 - 2,328
Contributions - Employer - 15,504 (15,504)
Contributions - Employees - 5,858 (5,858)
Net Investment Income - 2,738 (2,738)
Benefit Payments, including Refunds
of Employee Contributions (21,467) (21,467) -
Other (Net Transfer) - (14,290) 14,290
Net Changes 27,880 (11,657) 39,537
Balances at December 31, 2015 $ 625,253 $ 536,043 $ 89,210
-21-

NOTE 6--POSTEMPLOYMENT BENEFIT PLANS
Sensitivity of the net pension liability to changes in the discount rate
The following presents the plan’s net pension liability, calculated using a single discount rate of 7.45
percent, as well as what the plan’s net pension liability would be if it were calculated using a single
discount rate that is 1-percentage-point lower or 1-percentage point higher:
1% Decrease Current Discount Rate 1% Increase
(6.45%) (7.45%) (8.45%)
Net pension liability/(asset) $174,040 $89,210 $19,527
Pension expense, deferred outflows of resources, and deferred inflows of resources related to
pensions
For the year ended June 30, 2016, the District recognized pension expense of $16,929. At June 30,
2016, the District’s deferred outflows of resources and deferred inflows of resources related to
pensions derive from the following sources: Deferred Deferred
Deferred Amounts Related to Pensions Outflows of Inflows of
Resources Resources
Deferred Amounts to be Recognized in Pension Expense in Future Periods
Differences between expected and actual experience $ - $ 5,783
Changes of assumptions 862 -
Net difference between projected and actual
earnings on pension plan investments 34,613 -
Total Deferred Amounts to be recognized in
pension expense in future periods 35,475 5,783
Pension Contributions made subsequent
to the Measurement Date 9,726 -
Total Deferred Amounts Related to Pensions $ 45,201 $ 5,783
Amounts shown above as deferred outflows of resources and deferred inflows of resources related to
pensions will be disclosed in pension expense as follows:
Year Ending Net Deferred Outflows Net Deferred Inflows
December 31 of Re source s of Re source s
2016 $ 13,823 $ -
2017 9,018 -
2018 9,017 -
2019 7,560 -
2020 - -
Thereafter - -
Total $ 39,418 $ -
Social Security
Employees not qualifying for coverage under the Illinois Downstate Teachers’ Retirement
System or the Illinois Municipal Retirement Fund are considered “non-participating employees.”
These employees and those qualifying for coverage under the Illinois Municipal Retirement Fund
are covered under Social Security. The District paid $19,114, the total required contribution for
the current fiscal year.
-22-

NOTE 6--POSTEMPLOYMENT BENEFIT PLANS (CONTINUED)
Aggregate Pension Information The District participates in two defined benefit pension plans that are administered through a trust
arrangement. The aggregate pension balances are as follows: TRS IMRF Aggregate Pension Liabilities $540,596 $625,253 $1,165,849
Pension Assets 224,161 536,043 760,204
Net Pension Liabilities 316,435 89,210 405,645
Deferred Outflows of Resources –
Related to Pensions 98,028 45,201 143,229
Deferred Inflows of Resources –
Related Pensions 26,914 5,783 32,697
Pension Expense 72,579 16,929 89,508
NOTE 7--LONG-TERM DEBT
Bonds
On March 1, 2016, the District issued $144,000 of Life Safety bonds. Principal payments are due
annually on December 1, and interest payments are due semi-annually on June 1, and December
1, at a rate of 3%.
On March 1, 2016, the District issued $138,000 of Working Cash bonds. Principal payments are
due annually on December 1, and interest payments are due semi-annually on June 1 and
December 1, at a rate of 5.8%.
The following is the annual cash flow requirements to maturity for all bond issues: Year Ended Life Safety Bonds Working Cash Bonds Total
June 30, Principal Interest Principal Interest Debt Service
2017 $ 21,000 $4,676 $ - $10,069 $ 35,745
2018 25,000 3,135 - 8,352 36,487
2019 25,000 2,385 - 8,352 35,737
2020 26,000 1,620 - 8,352 35,972
2021 27,000 825 - 8,352 36,177
2022-2026 14,000 210 144,000 23,490 181,700
$138,000 $12,851 $144,000 $66,967 $361,818
Schedule of Changes in Long-Term Debt The following is a summary of long-term debt payable for the year ended June 30, 2016: Payable at Payable at
June 30, June 30,
2015 Additions Reductions 2016
School bonds $35,000 $282,000 $35,000 $282,000
Totals $35,000 $282,000 $35,000 $282,000
NOTE 8--LEGAL DEBT MARGIN 2015 Assessed Valuation $9,335,768
Margin Rate 6.9%
Legal Debt Limit $ 644,168
Long-Term Debt June 30, 2016 $ 282,000
Debt Margin Available at June 30, 2016 $ 362,168
-23-

NOTE 9--JOINT AGREEMENT
The District participates in a joint agreement with 33 other School Districts for special education
services. Together these Districts formed the Kaskaskia Special Education District (KSED). The
purpose of KSED is to provide an administrative structure to plan, coordinate and implement
special educational related, resource and instructional services for all member public school
district students who require such assistance.
KSED’s Governing Board is composed of one school board member from each member District.
Additionally, an Executive Board, consisting of nine superintendents or their designated
administrators from member districts, meets monthly to transact business, as defined by the joint
agreement and make recommendations to the Governing Board.
The Director of KSED annually prepares a tentative budget, which is presented to the Executive
Board for approval. Each member District pays KSED for its per capita share of the administrative costs and
centralized instructional services on a quarterly basis.
During the year ended June 30, 2016, revenues received from KSED for special education
services totaled $7,876, and special education tuition paid to KSED totaled $179,643. The School District is not the administrative District for the joint agreement. The joint agreement
is separately audited and those financial statements can be obtained by contacting the KSED
administrative offices at 224 South Locust, Centralia, Illinois 62801.
NOTE 10--RISK MANAGEMENT
Significant losses are covered by commercial insurance for all major programs: property, liability
and workers’ compensation. During the year ended June 30, 2016 there were no significant
reductions in insurance coverage. Also, there have been no settlement amounts that have
exceeded insurance coverage in the last three years.
The District is insured under a retrospectively-rated policy for workers’ compensation coverage,
whereas, the initial premium may be adjusted based on actual experience. Adjustments in
premiums are recorded when paid or received. During the year ended June 30, 2016, there were
no significant adjustments in premiums based on actual experience.
NOTE 11--CONTINGENCIES
The District has received funding from state and federal grants in the current and prior years
which are subject to audits by the granting agencies. The School Board believes any adjustments
that may arise from audits will be insignificant to District operations.
-24-

North Wamac School District No. 186
OTHER INFORMATION

Balance Balance
July 1, 2015 Additions Deductions June 30, 2015
ASSETS
Cash and Investments 14,053$ 13,666$ 11,807$ 15,912$
LIABILITIES
Amount Due to Student Groups:
General 3,834$ 5,656$ 5,821$ 3,669$
PTO 8,737 7,052 5,546 10,243
Cheerleader 31 120 120 31
Student Council 790 695 242 1,243
Reading 634 - - 634
Flower Fund 27 143 78 92
Total Student Activity Funds 14,053$ 13,666$ 11,807$ 15,912$
-25-
North Wamac School District No. 186
SCHEDULE OF CHANGES IN ACTIVITY FUNDS
For the Year Ended June 30, 2016

FY15* FY14*
Employer's proportion of the net pension liability .0004830331% .0004541908%
Employer's proportionate share of the net pension liability 316,435$ 276,413$
State's proportionate share of the net pension
liability associated with the employer 3,510,688 3,191,913
Total 3,827,123$ 3,468,326$
Employer's covered employee payroll 542,188$ 517,379$
Employer's proportionate share of net pension liability
as a percentage of its covered-employee payroll 58.4% 53.4%
Plan fiduciary net position as a percentage
of the total liability 41.5% 43.0%
*The amounts presented were determined as of the prior fiscal-year end.
FY15 FY14
Statutorily-required contribution 75,699$ 67,845$
Contributions in relation to the statutorily-required contribution 72,579 61,937
Contribution deficiency (excess) 3,120$ 5,908$
Employer's covered-employee payroll 609,247$ 542,188$
Contributions as a percentage of covered-employee payroll 12.4% 12.5%
Changes of Assumptions
Amounts reported in 2015 reflect an investment rate of return of 7.5 percent, an inflation rate
of 3.0 percent and real return of 4.5 percent, and salary increases that vary by service credit.
In 2014, assumptions used were an investment rate of 7.5 percent, an inflation rate of 3.0 percent
and a real return of 4.5 percent, and salary increases of 5.75 percent.
This schedule is presented to illustrate the requirement to show information for 10 years. However, until a full 10-year trend is
compiled information is presented for those years for which information is available.
Notes to Required Supplementary Information:
North Wamac School District No. 186
SCHEDULE OF THE EMPLOYER'S PROPORTIONATE
SHARE OF THE NET PENSION LIABILITY
Teacher's Retirement System of the State of Illinois
SCHEDULE OF EMPLOYER CONTRIBUTIONS
Teacher's Retirement System of the State of Illinois
-26
-

North Wamac School District No. 186
SCHEDULE OF CHANGES IN THE NET PENSION
LIABILITY AND RELATED RATIOS - IMRF
June 30, 2016
Calendar Year Ended December 31, 2014 2015
Total Pension Liability
Service Cost $ 15,942 $ 18,086
Interest on the Total Pension Liability 40,915 44,557
Changes of Benefit Terms - -
Differences Between Expected and Actual Experience
of the Total Pension Liability (9,136 ) (15,624 )
Changes of Assumptions 22,846 2,328
Benefit Payments, including Refunds of Employee Contributions (21,517 ) (21,467 )
Net Change in Total Pension Liability 40,050 27,880
Total Pension Liability – Beginning 548,323 597,373
Total Pension Liability – Ending (A) $597,373 $625,253
Plan Fiduciary Net Position
Contributions – Employer $ 14,476 $ 15,504
Contributions – Employees 5,506 5,858
Net Investment Income 31,411 2,738
Benefit Payments, including Refunds of Employee Contributions (21,517 ) (21,467 )
Other (Net Transfer) 2,116 (14,290 )
Net Change in Plan Fiduciary Net Position 31,992 (11,657 )
Plan Fiduciary Net Position – Beginning 515,708 547,700
Plan Fiduciary Net Position – Ending (B) $547,700 $536,043
Net Pension Liability – Ending (A)-(B) $ 49,673 $ 89,210
Plan Fiduciary Net Position as a Percentage
of the Total Liability 91.68% 85.73%
Covered Valuation Payroll $145,369 $130,184
Net Pension Liability as a Percentage
of Covered Valuation Payroll 34.17% 68.53%
Notes to Schedule:
This schedule is presented to illustrate the requirement to show information for 10 years. However, until a full 10-
year trend is compiled, information is presented for those years for which information is available.
-27-

North Wamac School District No. 186
SCHEDULE OF EMPLOYER CONTRIBUTIONS - IMRF
June 30, 2016
Calendar Actual Contribution
Year Actuarially Contribution Covered as a Percentage
Ended Determined Actual Deficiency Valuation of Covered
December 31 Contribution Contribution (Excess) Payroll Valuation Payroll
2014 $15,247 $15,234 $ 13 $145,369 10.48%
2015 15,505 15,504 1 130,184 11.91%
Notes to Schedule:
Summary of Actuarial Methods and Assumptions Used in the Calculation of the 2015 Contribution Rate*
Valuation Date:
Notes Actuarially determined contribution rates are calculated as of December 31
each year, which are 12 months prior to the beginning of the fiscal year in
which contributions are reported.
Methods and Assumptions Used to Determine 2015 Contribution Rates:
Actuarial Cost Method: Aggregate entry age = normal
Amortization Method: Level percentage of payroll, closed
Remaining Amortization Period: 28-year closed period until remaining period reaches 15 years (then 15-year
rolling period)
Asset Valuation Method: 5-year smoothed market; 20% corridor
Wage Growth 4%
Price Inflation 3%, approximate; No explicit price inflation assumption is used in
this valuation.
Salary Increases: 4.40% to 16%, including inflation
Investment Rate of Return 7.50%
Retirement Age Experience-based table of rates that are specific to the type of eligibility
condition; last updated for the 2011 valuation pursuant to an experience
study of the period 2008 to 2010.
Mortality: RP-2000 Combined Healthy Mortality Table, adjusted for mortality
improvements to 2020 using projection scale AA. For men, 120% of the
table rates were used. For women, 92 percent of the table rates were used.
for disabled lives, the mortality rates are the rates applicable to
non-disabled lives set forward 10 years.
Other Information:
Notes: There were no benefit changes during the year.
*Based on Valuation Assumptions used in the December 31, 2013, actuarial valuation; note two year lag between
valuation and rate setting.
This schedule is presented to illustrate the requirement to show information for 10 years. However, until a full 10-
year trend is compiled, information is presented for those years for which information is available.
-28-

Due to ROE on Friday, October 14th
Due to ISBE on Tuesday, November 15th
SD/JA16
X School District
Joint Agreement
X CASH
School District/Joint Agreement Number: ACCRUAL Name of Auditing Firm:
County Name: Name of Audit Manager:
Name of School District/Joint Agreement: Address:
Address: City: State: Zip Code:
Submit electronic AFR directly to ISBE
City: Phone Number: Fax Number:
Email Address: IL License Number (9 digit): Expiration Date:
Zip Code: 0 Email Address:
Annual Financial Report
Type of Auditor's Report Issued: ISBE Use Only
Qualified Unqualified YES X NO Are Federal expenditures greater than $750,000?
X Adverse YES X NO Is all Single Audit Information completed and attached?
Disclaimer YES X NO Were any financial statement or federal awards findings issued?
X Reviewed by District Superintendent/Administrator Reviewed by Township Treasurer (Cook County only) Reviewed by Regional Superintendent/Cook ISC
Name of Township:
District Superintendent/Administrator Name (Type or Print): Township Treasurer Name (type or print) RegionalSuperintendent/Cook ISC Name (Type or Print):
Email Address:
Telephone: Fax Number: Telephone: Fax Number: Telephone: Fax Number:
Signature & Date: Signature & Date: Signature & Date:
* This form is based on 23 Illinois Administrative Code 100, Subtitle A, Chapter I, Subchapter C (Part 100). This form is based on 23 Illinois Administrative Code, Subtitle A, Chapter I, Subchapter C, Part 100.
ISBE Form SD50-35/JA50-60 (05/16) In some instances, use of open account codes (cells) may not be authorized by statute or administrative rule.
Each school district or joint agreement is responsible for obtaining the concurring legal opinion and/or other s
upporting authorization/documentation, as necessary, to use the applicable account code (cell).
62801
Email Address:Email Address:
Single Audit Status:
618-532-8250618-532-1826
Brad Morris
ILLINOIS STATE BOARD OF EDUCATION
School Business Services Division
June 30, 2016
Accounting Basis:
Annual Financial Report *
100 North First Street, Springfield, Illinois 62777-0001
217/785-8779
Illinois School District/Joint Agreement
Click on the Link to Submit:
Send ISBE a File
Filing Status:
North Wamac School District #186
Certified Public Accountant InformationSchool District/Joint Agreement Information
(See instructions on inside of this page.)
Centralia
1500 Case
13-014-1860-02
Clinton
Centralia
Glass and Shuffett, Ltd.
Douglas A. Ess, CPA
62801IL
1819 W. McCord, P.O. Box 489
060-001501
618-532-5683
1/1/2017
618-532-5684
Printed: 9/16/2016
Copy of N Wamac AFR 2016

TABLE OF CONTENTS
TAB Name
AFR Page
No.
Auditor's Questionnaire……………………………...………....…………………………..………..................................................... Aud Quest 2
Comments Applicable to the Auditor's Questionnaire……..……..………………. ………………….…………………………. Aud Quest 2
Financial Profile Information …………………………………………….…………………………………………….................................................. FP Info 3
Estimated Financial Profile Summary…………………………………………………………………………………………………………...... Financial Profile 4
Basic Financial Statements
Statement of Assets and Liabilities Arising from Cash Transactions/Statement of Position ………………............................................... Assets-Liab 5 - 6
Statement of Revenues Received/Revenues, Expenditures Disbursed/Expenditures, Other
Sources (Uses) and Changes in Fund Balances (All Funds)…...……………..…………………….......................................... Acct Summary 7 - 8
Statements of Revenues Received/Revenues (All Funds)………………………………………………………………................................. Revenues 9 - 14
Statements of Expenditures Disbursed/Expenditures Budget to Actual (All Funds)……………………….................................................... Expenditures 15 - 22
Supplementary Schedules
Federal Stimulus - American Recovery and Reinvestment Act (ARRA) Schedule……………………………………………. ARRA Sched 23
Schedule of Ad Valorem Tax Receipts…………………………………………………………………………………………….. Tax Sched 24
Schedule of Short-Term Debt/Long-Term Debt ………………………………………………………….................................................... Short-Term Long-Term Debt 25
Schedule of Restricted Local Tax Levies and Selected Revenue Sources/
Schedule of Tort Immunity Expenditures…………………………………..….……………….……………………..…....... Rest Tax Levies-Tort Im 26
Statistical Section
Schedule of Capital Outlay and Depreciation……………………………………………………………………................................................ Cap Outlay Deprec 27
Estimated Operating Expenditures Per Pupil and Per Capita Tuition Charge Computation…………………………… PCTC-OEPP 28 - 29
Estimated Indirect Cost Rate for Federal Programs (Section I, Section II)………………………………………………............................................. ICR Computation 30
Report on Shared Services or Outsourcing ………………………………………………................................................................................................................ Shared Outsourced Serv. 31
Administrative Cost Worksheet……………………………………………………………………….……………................................................ AC 32
Itemization Schedule…………………………………………………………………………………………………................................................ ITEMIZATION 33
Reference Page……………………………………………………………………………………………………….................................................. REF 34
Notes, Opinion Letters, etc…… Opinion-Notes 35
Deficit Reduction Calculation…… Deficit AFR Sum Calc 36
Audit Checklist/Balancing Schedule………………………………………………………………………………................................................. AUDITCHECK -
Single Audit Section
Annual Federal Compliance Report…………………………………………………………………………………............................................. Single Audit Cover - CAP 37 - 46
INSTRUCTIONS/REQUIREMENTS: For School Districts/Joint Agreements
All School Districts/Joint Agreements must complete this form (Note: joint agreement supplementary/statistical schedules may not be applicable)
Round all amounts to the nearest dollar. Do not enter cents. (Exception: 9 Month ADA on page 28, line 78)
This form complies with Part 100 (Requirements for Accounting, Budgeting, Financial Reporting, and Auditing).
23, Illinois Administrative Code 100, Subtitle A, Chapter I, Subchapter C (Part 100)
Any errors left unresolved by the Audit Checklist/Balancing Schedule must be explained in the itemization page.
Submit AFR Electronically
* The Annual Financial Reports (AFR) must be submitted directly through the Attachment Manager to the AFR Group by the Auditor or School District
designated personnel (Please see Instructions for complete submission procedures).
Attachment Manager Link
Note: CD/Disk no longer accepted.
* AFR supporting documentation must be embedded as Microsoft Word (.doc), Word Perfect (*.wpd) or Adobe (*.pdf) and inserted within tab "Opinions & Notes".
These documents include: The Audit, Management letter, Opinion letters, Compliance letters, Financial notes etc…. For embedding instructions see
"Opinions & Notes" tab of this form.
Note: Adobe Acrobat (*.pdf) files cannot be embedded if you do not have the software. Simply attach files as separate docs in the Attachment
Manager and they will be embedded for you.
Submit Paper Copy of AFR with Signatures
1) The auditor must send three paper copies of the AFR form (cover through page 8 at minimum) to the School District with the auditor signature.
Note: School Districts and Regional Superintendents may prefer a complete paper copy in lieu of an electronic file. Please comply with their requests as neccessary.
2) Upon receipt, the School District retains one copy for their records, signs, and forwards the remaining two copies to the Regional Superintendent's
office no later than October 15, annually.
3) Upon receipt, the Regional Superintendent's office retains one copy for their records, signs, and forwards the remaining paper copy to ISBE no later
than November 15, annually.
* Yellow Book, CPE, and Peer Review requirements must be met if the Auditor issues an opinion stating "Governmental Auditing Standards" were utilized.
Single Audit Act
Qualifications of Auditing Firm
* School District/Joint Agreement entities must verify the qualifications of the auditing firm by requesting the most current peer review report and the
corresponding acceptance letter from the approved peer review program, for the current peer review period.
* A school district/joint agreement who engages with an auditing firm who is not licensed and qualified will be required to complete a new audit by a qualified
auditing firm at the school district's/joint agreement's expense.
Printed: 9/16/2016
Copy of N Wamac AFR 2016

Page 2 Page 2
the box on the left, and attach the appropriate findings/comments.
PART A - FINDINGS
1. One or more school board members, administrators, certified school business officials, or other qualifying district employees failed to file economic
interest statements pursuant to the Illinois Government Ethics Act. [5 ILCS 420/4A-101]
2. One or more custodians of funds failed to comply with the bonding requirements pursuant to Sections 8-2, 10-20.19 or 19-6 of the School Code.
[105 ILCS 5/8-2; 10-20.19; 19-6]
3. One or more contracts were executed or purchases made contrary to the provisions of Section 10-20.21 of the School Code. [105 ILCS 5/10-20.21]
4. One or more violations of the Public Funds Deposit Act or the Public Funds Investment Act were noted. [30 ILCS 225/1 et. seq. and 30 ILCS 235/1 et. seq.]
5. Restricted funds were commingled in the accounting records or used for other than the purpose for which they were restricted.
6. One or more short-term loans or short-term debt instruments were executed in non-conformity with the applicable authorizing statute or without statutory Authority.
7. One or more long-term loans or long-term debt instruments were executed in non-conformity with the applicable authorizing statute or without statutory Authority.
8. Corporate Personal Property Replacement Tax monies were deposited and/or used without first satisfying the lien imposed pursuant to the State
Revenue Sharing Act. [30 ILCS 115/12]
9. One or more interfund loans were made in non-conformity with the applicable authorizing statute or without statutory authorization.
10. One or more interfund loans were outstanding beyond the term provided by statute.
11. One or more permanent transfers were made in non-conformity with the applicable authorizing statute/regulation or without statutory/regulatory authorization.
12. Substantial, or systematic misclassification of budgetary items such as, but not limited to, revenues, receipts, expenditures, disbursements or expenses
were observed.
13. The Chart of Accounts used to define and control budget and accounting records does not conform to the minimum requirements imposed by
ISBE rules pursuant to Sections 2-3.27 and 2-3.28 of the School Code. [105 ILCS 5/2-3.27; 2-3.28]
14. At least one of the following forms was filed with ISBE late: The FY15 AFR (ISBE FORM 50-35), FY15 Annual Statement of Affairs (ISBE Form 50-37)
and FY16 Budget (ISBE FORM 50-36). Explain in the comments box below.
ISBE rules pursuant to Sections 3-15.1, 10-17, and 17-1 of the School Code [105 ILCS 5/3-15.1; 5/10-17; 5/17-1]
15. The district has issued tax anticipation warrants or tax anticipation notes in anticipation of a second year's taxes when warrants or notes in
anticipation of current year taxes are still outstanding, as authorized by Sections 17-16 or 34-23 thru 34-27 of the School Code.
[105 ILCS 5/17-16 or 34-23 thru 34-27]
16. The district has issued short-term debt against two future revenue sources, such as, but not limited to, tax anticipation warrants and General State Aid
certificates or tax anticipation warrants and revenue anticipation notes.
17. The district has issued school or teacher orders for wages as permitted in Sections 8-16, 32-7.2 and 34-76 of the School Code or issued funding
bonds for this purpose pursuant to Section 19-8 of the School Code. [105 ILCS 5/8-6, 32-7.2, 34-76, and 19-8]
18. The district has for two consecutive years shown an excess of expenditures/other uses over revenues/other sources and beginning fund balances
on its annual financial report for the aggregate totals of the Educational, Operations & Maintenance, Transportation, and Working Cash Funds.
19. Student Activity Funds, Imprest Funds, or other funds maintained by the district were excluded from the audit.
20. Findings, other than those listed in Part A (above), were reported (e.g. student activity fund findings).
21. Federal Stimulus Funds were not maintained and expended in accordance with the American Recovery and Reinvestment Act (ARRA) of 2009. If checked,
an explanation must be provided.
22. Check this box if the district is subject to the Property Tax Extension Limitation Law. Effective Date: (Ex: 00/00/0000)
X 23. If the type of Auditor Report designated on the cover page is other than an unqualified opinion and is due to reason(s) other than solely Cash Basis Accounting,
please check and explain the reason(s) in the box below.
AUDITOR'S QUESTIONNAIRE
PART B - FINANCIAL DIFFICULTIES/CERTIFICATION Criteria pursuant to Section 1A-8 of the School Code [105 ILCS 5/1A-8]
PART C - OTHER ISSUES
INSTRUCTIONS: If your review and testing of State, Local, and Federal Programs revealed any of the following statements to be true, then check
Qualified opinion on regulatory basis financial statements due to lack of disclosures in accordance with GASB Statement #45.
Printed: 9/16/2016 Copy of N Wamac AFR 2016

(For School Districts who report on an Accrual/Modified Accrual Accounting Basis only)
School districts that report on the accrual/modified accrual basis of accounting must identify where late mandated categorical payments (Acct Codes 3100, 3105, 3110, 3500, and 3510)
are recorded. Depending on the accounting procedure these amounts will be used to adjust the Direct Receipts/Revenues in calculation 1 and 2 of the Financial Profile Score.
In FY2016, identify those late payments recorded as Intergovermental Receivables, Other Recievables, or Deferred Revenue & Other Current Liabilities or Direct Receipts/Revenue.
Payments should only be listed once.
24. Enter the date that the district used to accrue mandated categorical payments Date:
25. For the listed mandated categorical (Revenue Code (3110, 3500, 3510, 3100, 3105) that were vouchered prior to June 30th, but not released until after year end
as reported in ISBE FRIS system, enter the amounts that were accrued in the chart below.
3110 3500 3510 3100 3105 Total
Deferred Revenues (490)
Mandated Categoricals Payments (3110, 3500, 3510, 3100, 3105) 0
Direct Receipts/Revenue
Mandated Categoricals Payments (3110, 3500, 3510, 3100, 3105 0
Total 0
* Revenue Code (3110-Sp Ed Personnel, 3510-Sp Ed Transportation, 3500-Regular/Vocational Transportation, 3105-Sp Ed Funding for Children Requiring Services,3100-Sp Ed Private Facilities)
PART E - QUALIFICATIONS OF AUDITING FIRM
* School District/Joint Agreement entities must verify the qualifications of the auditing firm by requesting the most current peer review report and the corresponding acceptance
letter from the approved peer review program for the current peer review.
* A school district/joint agreement who engages with an auditing firm who is not licensed and qualified will be required to complete a new audit by a qualified auditing firm
at the school district's/joint agreement's expense.
Comments Applicable to the Auditor's Questionnaire:
Name of Audit Firm (print)
Signature mm/dd/yyyy
Glass & Shuffett, Ltd.
The undersigned affirms that this audit was conducted by a qualified auditing firm and in accordance with the applicable standards [23 Illinois
Administrative Code Part 100] and the scope of the audit conformed to the requirements of subsection (a) or (b) of 23 Illinois Administrative Code
Part 100 Section 110, as applicable.
PART D - EXPLANATION OF ACCOUNTING PRACTICES FOR LATE MANDATED CATEGORICAL PAYMENTS
Account Name

Page 3 Page 3
1234
56
78
9
10
1112
1314
15
16
17
1819
2021
22
23
24
252627
28
2930
31
32
33
34
35
36
37
3839
40
414243
44
45
46
47
48
49
50
51
52
53
54
55
56
575859
60
61
A B C D E F G H I J K L M
Required to be completed for School Districts only.
A. Tax Rates (Enter the tax rate - ex: .0150 for $1.50)
Tax Year 2015 Equalized Assessed Valuation (EAV): 9,335,768
EducationalOperations &
MaintenanceTransportation Combined Total Working Cash
Rate(s): 0.014401 + 0.002395 + 0.001150 = 0.017950 0.000479
B. Results of Operations *
Receipts/RevenuesDisbursements/
ExpendituresExcess/ (Deficiency) Fund Balance
1,272,049 1,215,452 56,597 1,636,949
* The numbers shown are the sum of entries on Pages 7 & 8, lines 8, 17, 20, and 81 for the Educational, Operations & Maintenance,
Transportation and Working Cash Funds.
C. Short-Term Debt **CPPRT Notes TAWs TANs TO/EMP. Orders GSA Certificates
0 + 0 + 0 + 0 + 0 +
Other Total
0 = 0
** The numbers shown are the sum of entries on page 25.
D. Long-Term Debt
Check the applicable box for long-term debt allowance by type of district.
X a. 6.9% for elementary and high school districts, 644,168
b. 13.8% for unit districts.
Long-Term Debt Outstanding:
c. Long-Term Debt (Principal only) Acct
Outstanding:……….....…………….... 511 282,000
E. Material Impact on Financial Position
If applicable, check any of the following items that may have a material impact on the entity's financial position during future reporting periods.
Attach sheets as needed explaining each item checked.
Pending Litigation
Material Decrease in EAV
Material Increase/Decrease in Enrollment
Adverse Arbitration Ruling
Passage of Referendum
Taxes Filed Under Protest
Decisions By Local Board of Review or Illinois Property Tax Appeal Board (PTAB)
Other Ongoing Concerns (Describe & Itemize)
Comments:
FINANCIAL PROFILE INFORMATION
Printed: 9/16/2016
Copy of N Wamac AFR 2016

Page 4 Page 4
1
2
3
4
5
6
7
8
910
1112131415
16171819202122
232425
26
27282930
313233
34
3536
37
38
39404142
A B C D E F G H I K L M N O P Q R
District Name: North Wamac School District #186
District Code: 13-014-1860-02
County Name: Clinton
1. Fund Balance to Revenue Ratio: Total Ratio Score 4Total Sum of Fund Balance (P8, Cells C81, D81, F81 & I81) Funds 10, 20, 40, 70 + (50 & 80 if negative) 1,636,949.00 1.287 Weight 0.35
Funds 10, 20, 40, & 70, 1,272,049.00 Value 1.40
Less: Operating Debt Pledged to Other Funds (P8, Cell C54 thru D74) Minus Funds 10 & 20 0.00
(Excluding C:D57, C:D61, C:D65, C:D69 and C:D73)
2. Expenditures to Revenue Ratio: Total Ratio Score 4Total Sum of Direct Expenditures (P7, Cell C17, D17, F17, I17) Funds 10, 20 & 40 1,215,452.00 0.956 Adjustment 0
Funds 10, 20, 40 & 70, 1,272,049.00 Weight 0.35
Less: Operating Debt Pledged to Other Funds (P8, Cell C54 thru D74) Minus Funds 10 & 20 0.00
(Excluding C:D57, C:D61, C:D65, C:D69 and C:D73) 0 Value 1.40
Possible Adjustment:
3. Days Cash on Hand: Total Days Score 4Funds 10, 20 40 & 70 1,636,949.00 484.84 Weight 0.10
Total Sum of Direct Expenditures (P7, Cell C17, D17, F17 & I17) Funds 10, 20, 40 divided by 360 3,376.26 Value 0.40
4. Percent of Short-Term Borrowing Maximum Remaining: Total Percent Score 4Tax Anticipation Warrants Borrowed (P25, Cell F6-7 & F11) Funds 10, 20 & 40 0.00 100.00 Weight 0.10
EAV x 85% x Combined Tax Rates (P3, Cell J7 and J10) (.85 x EAV) x Sum of Combined Tax Rates 142,440.48 Value 0.40
5. Percent of Long-Term Debt Margin Remaining: Total Percent Score 3Long-Term Debt Outstanding (P3, Cell H37) 282,000.00 56.22 Weight 0.10
Total Long-Term Debt Allowed (P3, Cell H31) 644,167.99 Value 0.30
Total Profile Score: 3.90 *
Estimated 2017 Financial Profile Designation: RECOGNITION
* Total Profile Score may change based on data provided on the Financial Profile
Information, page 3 and by the timing of mandated categorical payments. Final score
will be calculated by ISBE.
Total Sum of Cash & Investments (P5, Cell C4, D4, F4, I4 & C5, D5, F5 & I5)
Total Sum of Direct Revenues (P7, Cell C8, D8, F8, & I8)
Total Sum of Direct Revenues (P7, Cell C8, D8, F8 & I8)
ESTIMATED FINANCIAL PROFILE SUMMARY
(Go to the following website for reference to the Financial Profile)
www.isbe.net/sfms/p/profile.htm
Printed: 9/16/2016
Copy of N Wamac AFR 2016
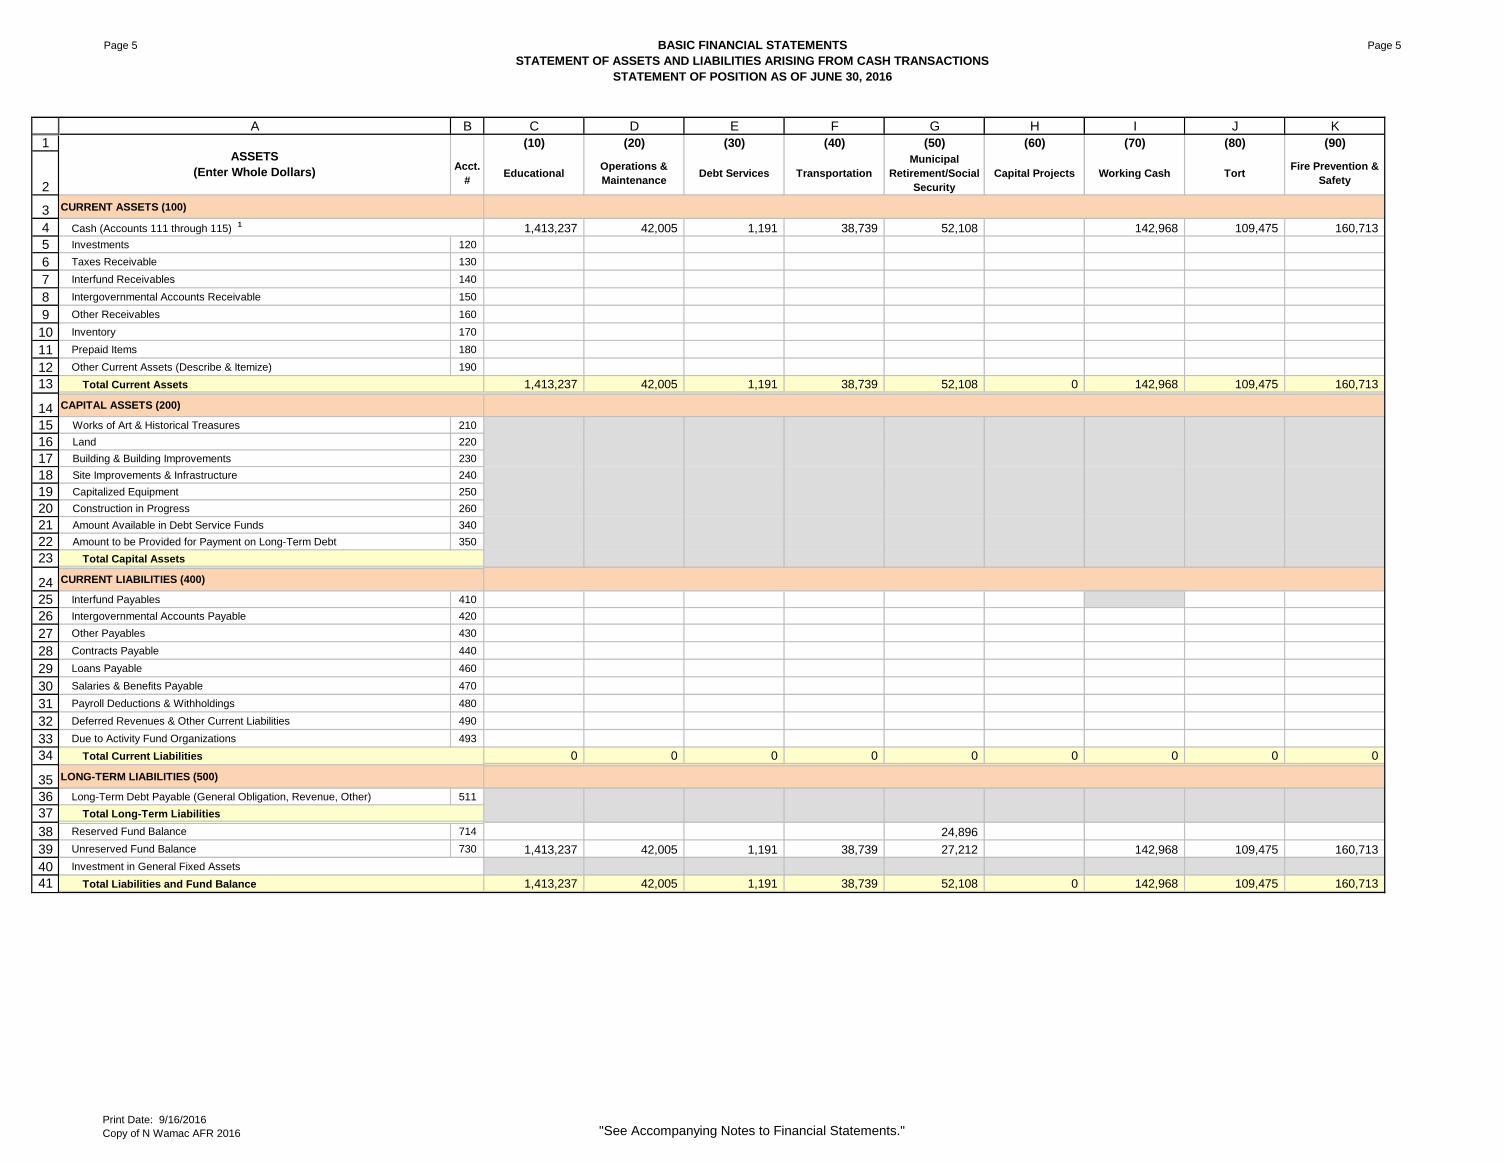
Page 5 BASIC FINANCIAL STATEMENTS
STATEMENT OF ASSETS AND LIABILITIES ARISING FROM CASH TRANSACTIONS
STATEMENT OF POSITION AS OF JUNE 30, 2016
Page 5
1
2
3
4
5
6
7
8
9
10
11
12
13
14
15
16
17
18
19
20
21
22
23
24
25
26
27
28
29
30
31
32
33
34
35
36
37
38
39
40
41
A B C D E F G H I J K
(10) (20) (30) (40) (50) (60) (70) (80) (90)
Acct.
#Educational
Operations &
MaintenanceDebt Services Transportation
Municipal
Retirement/Social
Security
Capital Projects Working Cash TortFire Prevention &
Safety
CURRENT ASSETS (100)
Cash (Accounts 111 through 115) 1 1,413,237 42,005 1,191 38,739 52,108 142,968 109,475 160,713
Investments 120
Taxes Receivable 130
Interfund Receivables 140
Intergovernmental Accounts Receivable 150
Other Receivables 160
Inventory 170
Prepaid Items 180
Other Current Assets (Describe & Itemize) 190
Total Current Assets 1,413,237 42,005 1,191 38,739 52,108 0 142,968 109,475 160,713
CAPITAL ASSETS (200)
Works of Art & Historical Treasures 210
Land 220
Building & Building Improvements 230
Site Improvements & Infrastructure 240
Capitalized Equipment 250
Construction in Progress 260
Amount Available in Debt Service Funds 340
Amount to be Provided for Payment on Long-Term Debt 350
Total Capital Assets
CURRENT LIABILITIES (400)
Interfund Payables 410
Intergovernmental Accounts Payable 420
Other Payables 430
Contracts Payable 440
Loans Payable 460
Salaries & Benefits Payable 470
Payroll Deductions & Withholdings 480
Deferred Revenues & Other Current Liabilities 490
Due to Activity Fund Organizations 493
Total Current Liabilities 0 0 0 0 0 0 0 0 0
LONG-TERM LIABILITIES (500)
Long-Term Debt Payable (General Obligation, Revenue, Other) 511
Total Long-Term Liabilities
Reserved Fund Balance 714 24,896
Unreserved Fund Balance 730 1,413,237 42,005 1,191 38,739 27,212 142,968 109,475 160,713
Investment in General Fixed Assets
Total Liabilities and Fund Balance 1,413,237 42,005 1,191 38,739 52,108 0 142,968 109,475 160,713
ASSETS
(Enter Whole Dollars)
Print Date: 9/16/2016
Copy of N Wamac AFR 2016 "See Accompanying Notes to Financial Statements."

Page 6 BASIC FINANCIAL STATEMENTS
STATEMENT OF ASSETS AND LIABILITIES ARISING FROM CASH TRANSACTIONS
STATEMENT OF POSITION AS OF JUNE 30, 2016
Page 6
1
2
3
4
5
6
7
8
9
10
11
12
13
14
15
16
17
18
19
20
21
22
23
24
25
26
27
28
29
30
31
32
33
34
35
36
37
38
39
40
41
A B
Acct.
#
CURRENT ASSETS (100)
Cash (Accounts 111 through 115) 1
Investments 120
Taxes Receivable 130
Interfund Receivables 140
Intergovernmental Accounts Receivable 150
Other Receivables 160
Inventory 170
Prepaid Items 180
Other Current Assets (Describe & Itemize) 190
Total Current Assets
CAPITAL ASSETS (200)
Works of Art & Historical Treasures 210
Land 220
Building & Building Improvements 230
Site Improvements & Infrastructure 240
Capitalized Equipment 250
Construction in Progress 260
Amount Available in Debt Service Funds 340
Amount to be Provided for Payment on Long-Term Debt 350
Total Capital Assets
CURRENT LIABILITIES (400)
Interfund Payables 410
Intergovernmental Accounts Payable 420
Other Payables 430
Contracts Payable 440
Loans Payable 460
Salaries & Benefits Payable 470
Payroll Deductions & Withholdings 480
Deferred Revenues & Other Current Liabilities 490
Due to Activity Fund Organizations 493
Total Current Liabilities
LONG-TERM LIABILITIES (500)
Long-Term Debt Payable (General Obligation, Revenue, Other) 511
Total Long-Term Liabilities
Reserved Fund Balance 714
Unreserved Fund Balance 730
Investment in General Fixed Assets
Total Liabilities and Fund Balance
ASSETS
(Enter Whole Dollars)
L M N
Account Groups
Agency Fund General Fixed
Assets
General Long-
Term Debt
15,912
15,912
0
8,325
987,293
128,157
549,964
8,000
1,191
280,809
1,681,739 282,000
15,912
15,912
282,000
282,000
1,681,739
15,912 1,681,739 282,000
Print Date: 9/16/2016
Copy of N Wamac AFR 2016 "See Accompanying Notes to Financial Statements."

Page 7 BASIC FINANCIAL STATEMENT
STATEMENT OF REVENUES RECEIVED, EXPENDITURES DISBURSED, OTHER
SOURCES (USES) AND CHANGES IN FUND BALANCE
ALL FUNDS - FOR THE YEAR ENDING JUNE 30, 2016
Page 7
1
2
3
4
5
6
7
8
9
10
11
12
13
14
15
16
17
18
19
20
21
22
23
24
25
26
27
28
29
30
31
32
33
34
35
36
37
38
39
40
41
42
43
44
45
A B C D E F G H I J K
(10) (20) (30) (40) (50) (60) (70) (80) (90)
Acct
#Educational
Operations &
MaintenanceDebt Services Transportation
Municipal
Retirement/ Social
Security
Capital Projects Working Cash TortFire Prevention &
Safety
RECEIPTS/REVENUES
LOCAL SOURCES 1000 188,150 21,309 35,239 10,263 25,077 0 4,475 94,095 4,517
FLOW-THROUGH RECEIPTS/REVENUES FROM ONE DISTRICT TO
ANOTHER DISTRICT
2000
0 0 0 0
STATE SOURCES 3000 757,290 75,000 0 23,583 0 0 0 0 0
FEDERAL SOURCES 4000 191,979 0 0 0 0 0 0 0 0
Total Direct Receipts/Revenues 1,137,419 96,309 35,239 33,846 25,077 0 4,475 94,095 4,517
Receipts/Revenues for "On Behalf" Payments 2 3998 224,240 1,973
Total Receipts/Revenues 1,361,659 96,309 35,239 35,819 25,077 0 4,475 94,095 4,517
DISBURSEMENTS/EXPENDITURES
Instruction 1000 632,789 17,322
Support Services 2000 254,853 119,611 27,824 18,552 0 73,994 15,371
Community Services 3000 0 0 0 0
Payments to Other Districts & Govermental Units 4000 180,375 0 0 0 0 0 0
Debt Service 5000 0 0 36,200 0 0 0 0
Total Direct Disbursements/Expenditures 1,068,017 119,611 36,200 27,824 35,874 0 73,994 15,371
Disbursements/Expenditures for "On Behalf" Payments 2
4180 224,240 0 0 1,973 0 0 0 0
Total Disbursements/Expenditures 1,292,257 119,611 36,200 29,797 35,874 0 73,994 15,371
Excess of Direct Receipts/Revenues Over (Under) Direct
Disbursements/Expenditures 3
69,402 (23,302) (961) 6,022 (10,797) 0 4,475 20,101 (10,854)
OTHER SOURCES/USES OF FUNDS
OTHER SOURCES OF FUNDS (7000)
PERMANENT TRANSFER FROM VARIOUS FUNDS
Abolishment of the Working Cash Fund 12 7110
Abatement of the Working Cash Fund 12 7110 46,553
Transfer of Working Cash Fund Interest 7120
Transfer Among Funds 7130
Transfer of Interest 7140
Transfer from Capital Project Fund to O&M Fund 7150
Transfer of Excess Fire Prevention & Safety Tax and Interest Proceeds to
O&M Fund 4
7160
Transfer to Excess Fire Prevention & Safety Bond and Interest Proceeds
to Debt Service Fund 5
7170
SALE OF BONDS (7200)
Principal on Bonds Sold 7210 138,000 144,000
Premium on Bonds Sold 7220
Accrued Interest on Bonds Sold 7230
Sale or Compensation for Fixed Assets 6 7300
Transfer to Debt Service to Pay Principal on Capital Leases 7400 0
Transfer to Debt Service to Pay Interest on Capital Leases 7500 0
Transfer to Debt Service to Pay Principal on Revenue Bonds 7600 0
Transfer to Debt Service Fund to Pay Interest on Revenue Bonds 7700 0
Transfer to Capital Projects Fund 7800 0
ISBE Loan Proceeds 7900
Other Sources Not Classified Elsewhere 7990
Total Other Sources of Funds 46,553 0 0 0 0 0 138,000 0 144,000
OTHER USES OF FUNDS (8000)
Description
(Enter Whole Dollars)
Print Date: 9/16/2016
Copy of N Wamac AFR 2016 "See Accompanying Notes to Financial Statements."

Page 8 BASIC FINANCIAL STATEMENT
STATEMENT OF REVENUES RECEIVED, EXPENDITURES DISBURSED, OTHER
SOURCES (USES) AND CHANGES IN FUND BALANCE
ALL FUNDS - FOR THE YEAR ENDING JUNE 30, 2016
Page 8
1
2
A B C D E F G H I J K
(10) (20) (30) (40) (50) (60) (70) (80) (90)
Acct
#Educational
Operations &
MaintenanceDebt Services Transportation
Municipal
Retirement/ Social
Security
Capital Projects Working Cash TortFire Prevention &
Safety
Description
(Enter Whole Dollars)
46
47
48
49
50
51
52
53
54
55
56
57
58
59
60
61
62
63
64
65
66
67
68
69
70
71
72
73
74
75
76
77
78
79
80
81
PERMANENT TRANSFER TO VARIOUS OTHER FUNDS (8100)
Abolishment or Abatement of the Working Cash Fund 12 8110 46,553
Transfer of Working Cash Fund Interest 12 8120 0
Transfer Among Funds 8130
Transfer of Interest 8140
Transfer from Capital Project Fund to O&M Fund 8150 0
Transfer of Excess Fire Prevention & Safety Tax & Interest Proceeds to
O&M Fund 4 8160
0
Transfer of Excess Fire Prevention & Safety Bond and Interest Proceeds
to Debt Service Fund 5 8170
0
Taxes Pledged to Pay Principal on Capital Leases 8410
Grants/Reimbursements Pledged to Pay Principal on Capital Leases 8420
Other Revenues Pledged to Pay Principal on Capital Leases 8430
Fund Balance Transfers Pledged to Pay Principal on Capital Leases 8440
Taxes Pledged to Pay Interest on Capital Leases 8510
Grants/Reimbursements Pledged to Pay Interest on Capital Leases 8520
Other Revenues Pledged to Pay Interest on Capital Leases 8530
Fund Balance Transfers Pledged to Pay Interest on Capital Leases 8540
Taxes Pledged to Pay Principal on Revenue Bonds 8610
Grants/Reimbursements Pledged to Pay Principal on Revenue Bonds 8620
Other Revenues Pledged to Pay Principal on Revenue Bonds 8630
Fund Balance Transfers Pledged to Pay Principal on Revenue Bonds 8640
Taxes Pledged to Pay Interest on Revenue Bonds 8710
Grants/Reimbursements Pledged to Pay Interest on Revenue Bonds 8720
Other Revenues Pledged to Pay Interest on Revenue Bonds 8730
Fund Balance Transfers Pledged to Pay Interest on Revenue Bonds 8740
Taxes Transferred to Pay for Capital Projects 8810
Grants/Reimbursements Pledged to Pay for Capital Projects 8820
Other Revenues Pledged to Pay for Capital Projects 8830
Fund Balance Transfers Pledged to Pay for Capital Projects 8840
Transfer to Debt Service Fund to Pay Principal on ISBE Loans 8910
Other Uses Not Classified Elsewhere 8990
Total Other Uses of Funds 0 0 0 0 0 0 46,553 0 0
Total Other Sources/Uses of Funds 46,553 0 0 0 0 0 91,447 0 144,000
115,955 (23,302) (961) 6,022 (10,797) 0 95,922 20,101 133,146
Fund Balances - July 1, 2015 1,297,282 65,307 2,152 32,717 62,905 47,046 89,374 27,567
Other Changes in Fund Balances - Increases (Decreases)
(Describe & Itemize)
Fund Balances - June 30, 2016 1,413,237 42,005 1,191 38,739 52,108 0 142,968 109,475 160,713
Excess of Receipts/Revenues and Other Sources of Funds (Over/Under)
Expenditures/Disbursements and Other Uses of Funds
Print Date: 9/16/2016
Copy of N Wamac AFR 2016 "See Accompanying Notes to Financial Statements."

Page 9 STATEMENT OF REVENUES RECEIVED
FOR THE YEAR ENDING JUNE 30, 2016
Page 9
1
2
3
4
5
6
7
8
9
10
1112
13
14
15
16
1718
19
20
21
22
23
24
25
26
27
28
29
30
31
32
33
34
35
36
37
38
3940
41
42
43
44
45
46
47
48
49
50
51
A B C D E F G H I J K
(10) (20) (30) (40) (50) (60) (70) (80) (90)
Acct
#Educational
Operations &
MaintenanceDebt Services Transportation
Municipal
Retirement/
Social Security
Capital Projects Working Cash TortFire Prevention
& Safety
RECEIPTS/REVENUES FROM LOCAL SOURCES (1000)
AD VALOREM TAXES LEVIED BY LOCAL EDUCATION AGENCY 1100
Designated Purposes Levies (1110-1120) 7
126,519 21,056 35,233 10,106 4,210 93,695 4,210
Leasing Purposes Levy 8 1130 4,210
Special Education Purposes Levy 1140 1,685
FICA/Medicare Only Purposes Levies 1150 23,355
Area Vocational Construction Purposes Levy 1160
Summer School Purposes Levy 1170
Other Tax Levies (Describe & Itemize) 1190
Total Ad Valorem Taxes Levied By District 132,414 21,056 35,233 10,106 23,355 0 4,210 93,695 4,210
PAYMENTS IN LIEU OF TAXES 1200
Mobile Home Privilege Tax 1210 3,719
Payments from Local Housing Authorities 1220
Corporate Personal Property Replacement Taxes 9
1230 35,653 1,500
Other Payments in Lieu of Taxes (Describe & Itemize) 1290
Total Payments in Lieu of Taxes 39,372 0 0 0 1,500 0 0 0 0
TUITION 1300
Regular - Tuition from Pupils or Parents (In State) 1311
Regular - Tuition from Other Districts (In State) 1312
Regular - Tuition from Other Sources (In State) 1313
Regular - Tuition from Other Sources (Out of State) 1314
Summer Sch - Tuition from Pupils or Parents (In State) 1321
Summer Sch - Tuition from Other Districts (In State) 1322
Summer Sch - Tuition from Other Sources (In State) 1323
Summer Sch - Tuition from Other Sources (Out of State) 1324
CTE - Tuition from Pupils or Parents (In State) 1331
CTE - Tuition from Other Districts (In State) 1332
CTE - Tuition from Other Sources (In State) 1333
CTE - Tuition from Other Sources (Out of State) 1334
Special Ed - Tuition from Pupils or Parents (In State) 1341
Special Ed - Tuition from Other Districts (In State) 1342
Special Ed - Tuition from Other Sources (In State) 1343
Special Ed - Tuition from Other Sources (Out of State) 1344
Adult - Tuition from Pupils or Parents (In State) 1351
Adult - Tuition from Other Districts (In State) 1352
Adult - Tuition from Other Sources (In State) 1353
Adult - Tuition from Other Sources (Out of State) 1354
Total Tuition 0
TRANSPORTATION FEES 1400
Regular -Transp Fees from Pupils or Parents (In State) 1411
Regular - Transp Fees from Other Districts (In State) 1412
Regular - Transp Fees from Other Sources (In State) 1413
Regular - Transp Fees from Co-curricular Activities (In State) 1415
Regular Transp Fees from Other Sources (Out of State) 1416
Summer Sch - Transp. Fees from Pupils or Parents (In State) 1421
Summer Sch - Transp. Fees from Other Districts (In State) 1422
Summer Sch - Transp. Fees from Other Sources (In State) 1423
Summer Sch - Transp. Fees from Other Sources (Out of State) 1424
CTE - Transp Fees from Pupils or Parents (In State) 1431
Description (Enter Whole Dollars)
Printed Date: 9/16/2016
Copy of N Wamac AFR 2016 "See Accompanying Notes to Financial Statements."

Page 10 STATEMENT OF REVENUES RECEIVED
FOR THE YEAR ENDING JUNE 30, 2016
Page 10
1
2
A B C D E F G H I J K
(10) (20) (30) (40) (50) (60) (70) (80) (90)
Acct
#Educational
Operations &
MaintenanceDebt Services Transportation
Municipal
Retirement/
Social Security
Capital Projects Working Cash TortFire Prevention
& Safety
Description (Enter Whole Dollars)
52
53
54
55
56
57
58
59
60
61
6263
64
65
6667
68
69
70
71
72
73
7475
76
77
78
79
80
8182
83
84
85
86
87
88
89
90
91
9293
94
95
96
97
98
99
100
101
CTE - Transp Fees from Other Districts (In State) 1432
CTE - Transp Fees from Other Sources (In State) 1433
CTE - Transp Fees from Other Sources (Out of State) 1434
Special Ed - Transp Fees from Pupils or Parents (In State) 1441
Special Ed - Transp Fees from Other Districts (In State) 1442
Special Ed - Transp Fees from Other Sources (In State) 1443
Special Ed - Transp Fees from Other Sources (Out of State) 1444
Adult - Transp Fees from Pupils or Parents (In State) 1451
Adult - Transp Fees from Other Districts (In State) 1452
Adult - Transp Fees from Other Sources (In State) 1453
Adult - Transp Fees from Other Sources (Out of State) 1454
Total Transportation Fees 0
EARNINGS ON INVESTMENTS 1500
Interest on Investments 1510 7,933 253 6 157 222 265 400 307
Gain or Loss on Sale of Investments 1520
Total Earnings on Investments 7,933 253 6 157 222 0 265 400 307
FOOD SERVICE 1600
Sales to Pupils - Lunch 1611
Sales to Pupils - Breakfast 1612
Sales to Pupils - A la Carte 1613
Sales to Pupils - Other (Describe & Itemize) 1614
Sales to Adults 1620 933
Other Food Service (Describe & Itemize) 1690 965
Total Food Service 1,898
DISTRICT/SCHOOL ACTIVITY INCOME 1700
Admissions - Athletic 1711 1,902
Admissions - Other (Describe & Itemize) 1719
Fees 1720
Book Store Sales 1730
Other District/School Activity Revenue (Describe & Itemize) 1790
Total District/School Activity Income 1,902 0
TEXTBOOK INCOME 1800
Rentals - Regular Textbooks 1811
Rentals - Summer School Textbooks 1812
Rentals - Adult/Continuing Education Textbooks 1813
Rentals - Other (Describe & Itemize) 1819
Sales - Regular Textbooks 1821
Sales - Summer School Textbooks 1822
Sales - Adult/Continuing Education Textbooks 1823
Sales - Other (Describe & Itemize) 1829
Other (Describe & Itemize) 1890
Total Textbook Income 0
OTHER REVENUE FROM LOCAL SOURCES 1900
Rentals 1910
Contributions and Donations from Private Sources 1920 3,849
Impact Fees from Municipal or County Governments 1930
Services Provided Other Districts 1940
Refund of Prior Years' Expenditures 1950
Payments of Surplus Moneys from TIF Districts 1960
Drivers' Education Fees 1970
Printed Date: 9/16/2016
Copy of N Wamac AFR 2016 "See Accompanying Notes to Financial Statements."

Page 11 STATEMENT OF REVENUES RECEIVED
FOR THE YEAR ENDING JUNE 30, 2016
Page 11
1
2
A B C D E F G H I J K
(10) (20) (30) (40) (50) (60) (70) (80) (90)
Acct
#Educational
Operations &
MaintenanceDebt Services Transportation
Municipal
Retirement/
Social Security
Capital Projects Working Cash TortFire Prevention
& Safety
Description (Enter Whole Dollars)
102
103
104
105
106
107108
109
110
111
112
113
114
115
116
117
118
119
120121
122
123
124
125
126
127
128
129
130131
132
133
134
135
136
137
138
139140
141
142
143144
Proceeds from Vendors' Contracts 1980
School Facility Occupation Tax Proceeds 1983
Payment from Other Districts 1991
Sale of Vocational Projects 1992
Other Local Fees (Describe & Itemize) 1993
Other Local Revenues (Describe & Itemize) 1999 782
Total Other Revenue from Local Sources 4,631 0 0 0 0 0 0 0 0
Total Receipts/Revenues from Local Sources 1000 188,150 21,309 35,239 10,263 25,077 0 4,475 94,095 4,517
FLOW-THROUGH RECEIPTS/REVENUES FROM
ONE DISTRICT TO ANOTHER DISTRICT (2000)
Flow-through Revenue from State Sources 2100
Flow-through Revenue from Federal Sources 2200
Other Flow-Through (Describe & Itemize) 2300
Total Flow-Through Receipts/Revenues from One District to Another
District
2000
0 0 0 0
RECEIPTS/REVENUES FROM STATE SOURCES (3000)
UNRESTRICTED GRANTS-IN-AID (3001-3099)
General State Aid- Sec. 18-8.05 3001 675,538 75,000 11,000
General State Aid - Hold Harmless/Supplemental 3002 35,046
Reorganization Incentives (Accounts 3005-3021) 3005
Other Unrestricted Grants-In-Aid from State Sources
(Describe & Itemize)
3099
Total Unrestricted Grants-In-Aid 710,584 75,000 0 11,000 0 0 0 0
RESTRICTED GRANTS-IN-AID (3100 - 3900)
SPECIAL EDUCATION
Special Education - Private Facility Tuition 3100
Special Education - Funding for Children Requiring Sp ED Services 3105 20,533
Special Education - Personnel 3110 25,211
Special Education - Orphanage - Individual 3120
Special Education - Orphanage - Summer Individual 3130
Special Education - Summer School 3145
Special Education - Other (Describe & Itemize) 3199
Total Special Education 45,744 0 0
CAREER AND TECHNICAL EDUCATION (CTE)
CTE - Technical Education - Tech Prep 3200
CTE - Secondary Program Improvement (CTEI) 3220
CTE - WECEP 3225
CTE - Agriculture Education 3235
CTE - Instructor Practicum 3240
CTE - Student Organizations 3270
CTE - Other (Describe & Itemize) 3299
Total Career and Technical Education 0 0 0
BILINGUAL EDUCATION
Bilingual Ed - Downstate - TPI and TBE 3305
Bilingual Education Downstate - Transitional Bilingual Education 3310
Total Bilingual Ed 0 0
Printed Date: 9/16/2016
Copy of N Wamac AFR 2016 "See Accompanying Notes to Financial Statements."

Page 12 STATEMENT OF REVENUES RECEIVED
FOR THE YEAR ENDING JUNE 30, 2016
Page 12
1
2
A B C D E F G H I J K
(10) (20) (30) (40) (50) (60) (70) (80) (90)
Acct
#Educational
Operations &
MaintenanceDebt Services Transportation
Municipal
Retirement/
Social Security
Capital Projects Working Cash TortFire Prevention
& Safety
Description (Enter Whole Dollars)
145
146
147
148
149
150
151
152
153154
155
156
157
158
159
160
161
162
163
164
165
166
167
168
169
170
171
172
173
174
175
176
177
178
179
180
181
182
183
184
185
186
187
188
State Free Lunch & Breakfast 3360 962
School Breakfast Initiative 3365
Driver Education 3370
Adult Ed (from ICCB) 3410
Adult Ed - Other (Describe & Itemize) 3499
TRANSPORTATION
Transportation - Regular and Vocational 3500 4,275
Transportation - Special Education 3510 8,308
Transportation - Other (Describe & Itemize) 3599
Total Transportation 0 0 12,583 0
Learning Improvement - Change Grants 3610
Scientific Literacy 3660
Truant Alternative/Optional Education 3695
Early Childhood - Block Grant 3705
Reading Improvement Block Grant 3715
Reading Improvement Block Grant - Reading Recovery 3720
Continued Reading Improvement Block Grant 3725
Continued Reading Improvement Block Grant (2% Set Aside) 3726
Chicago General Education Block Grant 3766
Chicago Educational Services Block Grant 3767
School Safety & Educational Improvement Block Grant 3775
Technology - Technology for Success 3780
State Charter Schools 3815
Extended Learning Opportunities - Summer Bridges 3825
Infrastructure Improvements - Planning/Construction 3920
School Infrastructure - Maintenance Projects 3925
Other Restricted Revenue from State Sources (Describe & Itemize) 3999
46,706 0 0 12,583 0 0 0 0 0
Total Receipts from State Sources 3000 757,290 75,000 0 23,583 0 0 0 0 0
RECEIPTS/REVENUES FROM FEDERAL SOURCES (4000)
Federal Impact Aid 4001
Other Unrestricted Grants-In-Aid Received Directly from the Fed Govt
(Describe & Itemize)
4009
0 0 0 0 0 0 0 0 0
Head Start 4045
Construction (Impact Aid) 4050
MAGNET 4060
Other Restricted Grants-In-Aid Received Directly from the Federal Govt
(Describe & Itemize)
4090
0 0 0 0 0 0
TITLE VI
Title VI - Innovation and Flexibility Formula 4100
Title VI - District Projects 4105
Total Restricted Grants-In-Aid
UNRESTRICTED GRANTS-IN-AID RECEIVED DIRECTLY FROM FEDERAL GOVT
(4001-4009)
RESTRICTED GRANTS-IN-AID RECEIVED FROM FEDERAL GOVT THRU
THE STATE (4100-4999)
Total Unrestricted Grants-In-Aid Received Directly
from the Federal Govt
Total Restricted Grants-In-Aid Received Directly from Federal Govt
RESTRICTED GRANTS-IN-AID RECEIVED DIRECTLY FROM FEDERAL
GOVT (4045-4090)
Printed Date: 9/16/2016
Copy of N Wamac AFR 2016 "See Accompanying Notes to Financial Statements."

Page 13 STATEMENT OF REVENUES RECEIVED
FOR THE YEAR ENDING JUNE 30, 2016
Page 13
1
2
A B C D E F G H I J K
(10) (20) (30) (40) (50) (60) (70) (80) (90)
Acct
#Educational
Operations &
MaintenanceDebt Services Transportation
Municipal
Retirement/
Social Security
Capital Projects Working Cash TortFire Prevention
& Safety
Description (Enter Whole Dollars)
189
190191
192
193
194
195
196
197
198
199
200201
202
203
204
205
206
207
208
209
210211
212
213
214
215216
217
218
219
220
221
222
223224
225
226
227228
229
230
231
232
233
234
235
236
237
238
239
240
Title VI - Rural Education Initiative (REI) 4107
Title V - Other (Describe & Itemize) 4199
Total Title V 0 0 0 0
FOOD SERVICE
Breakfast Start-Up Expansion 4200
National School Lunch Program 4210 74,649
Special Milk Program 4215
School Breakfast Program 4220 32,079
Summer Food Service Program 4225
Child Adult Care Food Program 4226
Fresh Fruits & Vegetables 4240 5,379
Food Service - Other (Describe & Itemize) 4299
Total Food Service 112,107 0
TITLE I
Title I - Low Income 4300 65,378
Title I - Low Income - Neglected, Private 4305
Title I - Comprehensive School Reform 4332
Title I - Reading First 4334
Title I - Even Start 4335
Title I - Reading First SEA Funds 4337
Title I - Migrant Education 4340
Title I - Other (Describe & Itemize) 4399
Total Title I 65,378 0 0 0
TITLE IV
Title IV - Safe & Drug Free Schools - Formula 4400
Title IV - 21st Century Comm Learning Centers 4421
Title IV - Other (Describe & Itemize) 4499
Total Title IV 0 0 0 0
FEDERAL - SPECIAL EDUCATION
Fed - Spec Education - Preschool Flow-Through 4600
Fed - Spec Education - Preschool Discretionary 4605
Fed - Spec Education - IDEA - Flow Through 4620 7,876
Fed - Spec Education - IDEA - Room & Board 4625
Fed - Spec Education - IDEA - Discretionary 4630
Fed - Spec Education - IDEA - Other (Describe & Itemize) 4699
Total Federal - Special Education 7,876 0 0 0
CTE - PERKINS
CTE - Perkins - Title IIIE - Tech Prep 4770
CTE - Other (Describe & Itemize) 4799
Total CTE - Perkins 0 0 0
Federal - Adult Education 4810
ARRA - General State Aid - Education Stabilization 4850
ARRA - Title I - Low Income 4851
ARRA - Title I - Neglected, Private 4852
ARRA - Title I - Delinquent, Private 4853
ARRA - Title I - School Improvement (Part A) 4854
ARRA - Title I - School Improvement (Section 1003g) 4855
ARRA - IDEA - Part B - Preschool 4856
ARRA - IDEA - Part B - Flow-Through 4857
ARRA - Title IID - Technology-Formula 4860
ARRA - Title IID - Technology-Competitive 4861
ARRA - McKinney - Vento Homeless Education 4862
Printed Date: 9/16/2016
Copy of N Wamac AFR 2016 "See Accompanying Notes to Financial Statements."

Page 14 STATEMENT OF REVENUES RECEIVED
FOR THE YEAR ENDING JUNE 30, 2016
Page 14
1
2
A B C D E F G H I J K
(10) (20) (30) (40) (50) (60) (70) (80) (90)
Acct
#Educational
Operations &
MaintenanceDebt Services Transportation
Municipal
Retirement/
Social Security
Capital Projects Working Cash TortFire Prevention
& Safety
Description (Enter Whole Dollars)
241
242
243
244
245
246
247
248
249
250
251
252
253
254
255
256
257
258259
260
261
262
263
264
265
266
267
268
269
270
271
272
273
274
275
ARRA - Child Nutrition Equipment Assistance 4863
Impact Aid Formula Grants 4864
Impact Aid Competitive Grants 4865
Qualified Zone Academy Bond Tax Credits 4866
Qualified School Construction Bond Credits 4867
Build America Bond Tax Credits 4868
Build America Bond Interest Reimbursement 4869
ARRA - General State Aid - Other Govt Services Stabilization 4870
Other ARRA Funds - II 4871
Other ARRA Funds - III 4872
Other ARRA Funds - IV 4873
Other ARRA Funds - V 4874
ARRA - Early Childhood 4875
Other ARRA Funds VII 4876
Other ARRA Funds VIII 4877
Other ARRA Funds IX 4878
Other ARRA Funds X 4879
Other ARRA Funds Ed Job Fund Program 4880
Total Stimulus Programs 0 0 0 0 0 0 0 0
Race to the Top Program 4901
Race to the Top - Preschool Expansion Grant 4902
Advanced Placement Fee/International Baccalaureate 4904
Title III - Immigrant Education Program (IEP) 4905
Title III - Language Inst Program - Limited Eng (LIPLEP) 4909
Learn & Serve America 4910
McKinney Education for Homeless Children 4920
Title II - Eisenhower Professional Development Formula 4930
Title II - Teacher Quality 4932 6,066
Federal Charter Schools 4960
Medicaid Matching Funds - Administrative Outreach 4991 552
Medicaid Matching Funds - Fee-for-Service Program 4992
Other Restricted Revenue from Federal Sources (Describe & Itemize) 4999
191,979 0 0 0 0 0 0 0
Total Receipts/Revenues from Federal Sources 4000 191,979 0 0 0 0 0 0 0 0
Total Direct Receipts/Revenues 1,137,419 96,309 35,239 33,846 25,077 0 4,475 94,095 4,517
Total Restricted Grants-In-Aid Received from the Federal Govt
Thru the State
Printed Date: 9/16/2016
Copy of N Wamac AFR 2016 "See Accompanying Notes to Financial Statements."

Page 15 STATEMENT OF EXPENDITURES DISBURSED BUDGET TO ACTUAL
FOR THE YEAR ENDING JUNE 30, 2016
Page 15
1
2
3
4
5
6
7
8
9
10
11
12
13
14
15
16
17
18
19
20
21
22
23
24
25
26
27
28
29
30
31
3233
34
35
36
37
38
39
40
4142
43
44
45
4647
48
49
50
51
5253
A B C D E F G H I J K L
(100) (200) (300) (400) (500) (600) (700) (800) (900)
Funct
#Salaries
Employee
Benefits
Purchased
Services
Supplies &
MaterialsCapital Outlay Other Objects
Non-Capitalized
Equipment
Termination
BenefitsTotal Budget
INSTRUCTION (ED) 1000
Regular Programs 1100 331,002 50,260 4,782 27,394 9,683 423,121 432,166
Tuition Payment to Charter Schools 1115 0 0
Pre-K Programs 1125 0 0
Special Education Programs (Functions 1200-1220) 1200 116,663 11,460 2,308 39 130,470 136,857
Special Education Programs Pre-K 1225 0 0
Remedial and Supplemental Programs K-12 1250 28,008 14,084 22,009 64,101 69,014
Remedial and Supplemental Programs Pre-K 1275 0 0
Adult/Continuing Education Programs 1300 0 0
CTE Programs 1400 0 0
Interscholastic Programs 1500 6,664 726 2,599 3,089 1,300 719 15,097 14,761
Summer School Programs 1600 0 0
Gifted Programs 1650 0 0
Driver's Education Programs 1700 0 0
Bilingual Programs 1800 0 0
Truant Alternative & Optional Programs 1900 0 0
Pre-K Programs - Private Tuition 1910 0 0
Regular K-12 Programs - Private Tuition 1911 0 0
Special Education Programs K-12 - Private Tuition 1912 0 0
Special Education Programs Pre-K - Tuition 1913 0 0
Remedial/Supplemental Programs K-12 - Private Tuition 1914 0 0
Remedial/Supplemental Programs Pre-K - Private Tuition 1915 0 0
Adult/Continuing Education Programs - Private Tuition 1916 0 0
CTE Programs - Private Tuition 1917 0 0
Interscholastic Programs - Private Tuition 1918 0 0
Summer School Programs - Private Tuition 1919 0 0
Gifted Programs - Private Tuition 1920 0 0
Bilingual Programs - Private Tuition 1921 0 0
Truants Alternative/Optional Ed Progms - Private Tuition 1922 0 0
Total Instruction 10 1000 482,337 76,530 7,381 54,800 10,983 758 0 0 632,789 652,798
SUPPORT SERVICES (ED) 2000
SUPPORT SERVICES - PUPILS
Attendance & Social Work Services 2110 0 0
Guidance Services 2120 0 0
Health Services 2130 630 664 1,294 1,250
Psychological Services 2140 0 0
Speech Pathology & Audiology Services 2150 0 0
Other Support Services - Pupils (Describe & Itemize) 2190 2,534 2,534 1,800
Total Support Services - Pupils 2100 0 0 630 3,198 0 0 0 0 3,828 3,050
SUPPORT SERVICES - INSTRUCTIONAL STAFF
Improvement of Instruction Services 2210 2,727 495 1,454 4,676 5,194
Educational Media Services 2220 0 0
Assessment & Testing 2230 0 2,500
Total Support Services - Instructional Staff 2200 2,727 495 1,454 0 0 0 0 0 4,676 7,694
SUPPORT SERVICES - GENERAL ADMINISTRATION
Board of Education Services 2310 2,620 6,098 3,141 11,859 12,406
Executive Administration Services 2320 51,295 6,709 300 1,026 5,765 65,095 64,407
Special Area Administration Services 2330 0 0
Tort Immunity Services2360 -
2370 0 0
Total Support Services - General Administration 2300 53,915 6,709 6,398 4,167 0 5,765 0 0 76,954 76,813
Description (Enter Whole Dollars)
10 - EDUCATIONAL FUND (ED)
Print Date: 9/16/2016
Copy of N Wamac AFR 2016 "See Accompanying Notes to Financial Statements."

Page 16 STATEMENT OF EXPENDITURES DISBURSED BUDGET TO ACTUAL
FOR THE YEAR ENDING JUNE 30, 2016
Page 16
1
2
A B C D E F G H I J K L
(100) (200) (300) (400) (500) (600) (700) (800) (900)
Funct
#Salaries
Employee
Benefits
Purchased
Services
Supplies &
MaterialsCapital Outlay Other Objects
Non-Capitalized
Equipment
Termination
BenefitsTotal Budget
Description (Enter Whole Dollars)
54
55
5657
58
59
60
61
62
63
6465
66
67
68
69
70
7172
73
74
75
76
77
78
79
80
81
82
83
84
85
86
87
88
89
90
91
92
93
94
95
SUPPORT SERVICES - SCHOOL ADMINISTRATION
Office of the Principal Services 2410 21,287 11,121 32,408 37,877
Other Support Services - School Admin (Describe & Itemize) 2490 0 0
Total Support Services - School Administration 2400 21,287 11,121 0 0 0 0 0 0 32,408 37,877
SUPPORT SERVICES - BUSINESS
Direction of Business Support Services 2510 0 0
Fiscal Services 2520 29,015 4,500 150 3,754 37,419 36,575
Operation & Maintenance of Plant Services 2540 16,571 16,571 16,309
Pupil Transportation Services 2550 0 0
Food Services 2560 23,643 1,167 54,708 3,429 50 82,997 79,370
Internal Services 2570 0 0
Total Support Services - Business 2500 52,658 4,500 1,317 75,033 3,429 50 0 0 136,987 132,254
SUPPORT SERVICES - CENTRAL
Direction of Central Support Services 2610 0 0
Planning, Research, Development, & Evaluation Services 2620 0 0
Information Services 2630 0 0
Staff Services 2640 0 0
Data Processing Services 2660 0 0
Total Support Services - Central 2600 0 0 0 0 0 0 0 0 0 0
Other Support Services (Describe & Itemize) 2900 0 0
Total Support Services 2000 130,587 22,825 9,799 82,398 3,429 5,815 0 0 254,853 257,688
COMMUNITY SERVICES (ED) 3000 0 0
PAYMENTS TO OTHER DISTRICTS & GOVT UNITS (ED) 4000
PAYMENTS TO OTHER GOVT UNITS (IN-STATE)
Payments for Regular Programs 4110 0 0
Payments for Special Education Programs 4120 180,375 180,375 176,644
Payments for Adult/Continuing Education Programs 4130 0 0
Payments for CTE Programs 4140 0 0
Payments for Community College Programs 4170 0 0
Other Payments to In-State Govt. Units (Describe & Itemize) 4190 0 0
Total Payments to Other Govt Units (In-State) 4100 180,375 0 180,375 176,644
Payments for Regular Programs - Tuition 4210 0 0
Payments for Special Education Programs - Tuition 4220 0 0
Payments for Adult/Continuing Education Programs - Tuition 4230 0 0
Payments for CTE Programs - Tuition 4240 0 0
Payments for Community College Programs - Tuition 4270 0 0
Payments for Other Programs - Tuition 4280 0 0
Other Payments to In-State Govt Units 4290 0 0
Total Payments to Other Govt Units -Tuition (In State) 42000 0 0
Payments for Regular Programs - Transfers 4310 0 0
Payments for Special Education Programs - Transfers 4320 0 0
Payments for Adult/Continuing Ed Programs-Transfers 4330 0 0
Print Date: 9/16/2016
Copy of N Wamac AFR 2016 "See Accompanying Notes to Financial Statements."

Page 17 STATEMENT OF EXPENDITURES DISBURSED BUDGET TO ACTUAL
FOR THE YEAR ENDING JUNE 30, 2016
Page 17
1
2
A B C D E F G H I J K L
(100) (200) (300) (400) (500) (600) (700) (800) (900)
Funct
#Salaries
Employee
Benefits
Purchased
Services
Supplies &
MaterialsCapital Outlay Other Objects
Non-Capitalized
Equipment
Termination
BenefitsTotal Budget
Description (Enter Whole Dollars)
96
97
98
99
100
101
102
103
104
105
106
107
108
109110
111
112
113
114
115116
117
118
119
120
121
122
123
124
125
126
127
128129
130
131
132
133
134
135136
137
138
139
140
141
142
Payments for CTE Programs - Transfers 4340 0 0
Payments for Community College Program - Transfers 4370 0 0
Payments for Other Programs - Transfers 4380 0 0
Other Payments to In-State Govt Units - Transfers 4390 0 0
Total Payments to Other Govt Units -Transfers (In-State)4300
0 0 0 0
Payments to Other Govt Units (Out-of-State) 4400 0 0
Total Payments to Other Govt Units 4000 180,375 0 180,375 176,644
DEBT SERVICES (ED) 5000
DEBT SERVICES - INTEREST ON SHORT-TERM DEBT
Tax Anticipation Warrants 5110 0 0
Tax Anticipation Notes 5120 0 0
Corporate Personal Prop. Repl. Tax Anticipation Notes 5130 0 0
State Aid Anticipation Certificates 5140 0 0
Other Interest on Short-Term Debt 5150 0 0
Total Interest on Short-Term Debt 5100 0 0 0
Debt Services - Interest on Long-Term Debt 5200 0 0
Total Debt Services 5000 0 0 0
PROVISIONS FOR CONTINGENCIES (ED) 6000 0
Total Direct Disbursements/Expenditures 612,924 99,355 197,555 137,198 14,412 6,573 0 0 1,068,017 1,087,130
Excess (Deficiency) of Receipts/Revenues Over
Disbursements/Expenditures 69,402
SUPPORT SERVICES (O&M) 2000
SUPPORT SERVICES - PUPILS
Other Support Services - Pupils (Describe & Itemize) 2190 0 0
SUPPORT SERVICES - BUSINESS
Direction of Business Support Services 2510 0 0
Facilities Acquisition & Construction Services 2530 0 0
Operation & Maintenance of Plant Services 2540 37,516 4,750 20,475 43,374 13,496 119,611 120,352
Pupil Transportation Services 2550 0 0
Food Services 2560 0 0
Total Support Services - Business 2500 37,516 4,750 20,475 43,374 13,496 0 0 0 119,611 120,352
Other Support Services (Describe & Itemize) 2900 0 0
Total Support Services 2000 37,516 4,750 20,475 43,374 13,496 0 0 0 119,611 120,352
COMMUNITY SERVICES (O&M) 3000 0 0
PAYMENTS TO OTHER DIST & GOVT UNITS (O&M) 4000
PAYMENTS TO OTHER GOVT UNITS (IN-STATE)
Payments for Special Education Programs 4120 0 0
Payments for CTE Programs 4140 0 0
Other Payments to In-State Govt. Units
(Describe & Itemize)
4190
0 0
Total Payments to Other Govt. Units (In-State) 4100 0 0 0 0
Payments to Other Govt. Units (Out of State) 4400 0 0
Total Payments to Other Govt Units 4000 0 0 0 0
DEBT SERVICES (O&M) 5000
DEBT SERVICES - INTEREST ON SHORT-TERM DEBT
Tax Anticipation Warrants 5110 0 0
Tax Anticipation Notes 5120 0 0
20 - OPERATIONS & MAINTENANCE FUND (O&M)
Print Date: 9/16/2016
Copy of N Wamac AFR 2016 "See Accompanying Notes to Financial Statements."

Page 18 STATEMENT OF EXPENDITURES DISBURSED BUDGET TO ACTUAL
FOR THE YEAR ENDING JUNE 30, 2016
Page 18
1
2
A B C D E F G H I J K L
(100) (200) (300) (400) (500) (600) (700) (800) (900)
Funct
#Salaries
Employee
Benefits
Purchased
Services
Supplies &
MaterialsCapital Outlay Other Objects
Non-Capitalized
Equipment
Termination
BenefitsTotal Budget
Description (Enter Whole Dollars)
143
144
145146
147148
149
150
151152
153
154
155
156
157
158
159
160
161
162
163
164
165
166
167
168
169170
171
172
173
174
175
176177
178
179
180
181
182
183
184
185
186
187188
Corporate Personal Prop. Repl. Tax Anticipation Notes 5130 0 0
State Aid Anticipation Certificates 5140 0 0
Other Interest on Short-Term Debt (Describe & Itemize) 5150 0 0
Total Debt Service - Interest on Short-Term Debt 5100 0 0 0
DEBT SERVICE - INTERST ON LONG-TERM DEBT 5200 0 0
Total Debt Services 5000 0 0 0
PROVISIONS FOR CONTINGENCIES (O&M) 6000 0
37,516 4,750 20,475 43,374 13,496 0 0 0 119,611 120,352
(23,302)
PAYMENTS TO OTHER DIST & GOVT UNITS (DS) 4000 0 0
DEBT SERVICES (DS) 5000
DEBT SERVICES - INTEREST ON SHORT-TERM DEBT
Tax Anticipation Warrants 5110 0 0
Tax Anticipation Notes 5120 0 0
Corporate Personal Prop. Repl. Tax Anticipation Notes 5130 0 0
State Aid Anticipation Certificates 5140 0 2,995
Other Interest on Short-Term Debt (Describe & Itemize) 5150 0 0
Total Debt Services - Interest On Short-Term Debt 5100 0 0 2,995
DEBT SERVICES - INTEREST ON LONG-TERM DEBT 5200 700 700
DEBT SERVICES - PAYMENTS OF PRINCIPAL ON LONG-TERM
DEBT (Lease/Purchase Principal Retired) 11
5300
35,000 35,000 35,000
DEBT SERVICES - OTHER (Describe & Itemize) 5400 500 500 0
Total Debt Services 5000 0 36,200 36,200 37,995
PROVISION FOR CONTINGENCIES (DS) 6000 0
Total Disbursements/ Expenditures 0 36,200 36,200 37,995
Excess (Deficiency) of Receipts/Revenues Over
Disbursements/Expenditures (961)
40 - TRANSPORTATION FUND (TR)
SUPPORT SERVICES (TR)
SUPPORT SERVICES - PUPILS
Other Support Services - Pupils (Describe & Itemize) 2190 0 0
SUPPORT SERVICES - BUSINESS
Pupil Transportation Services 2550 13,600 695 11,644 1,450 435 27,824 27,186
Other Support Services (Describe & Itemize) 2900 0 0
Total Support Services 2000 13,600 695 11,644 1,450 0 435 0 0 27,824 27,186
COMMUNITY SERVICES (TR) 3000 0 0
PAYMENTS TO OTHER DIST & GOVT UNITS (TR) 4000
PAYMENTS TO OTHER GOVT UNITS (IN-STATE)
Payments for Regular Programs 4110 0 0
Payments for Special Education Programs 4120 0 0
Payments for Adult/Continuing Education Programs 4130 0 0
Payments for CTE Programs 4140 0 0
Payments for Community College Programs 4170 0 0
Other Payments to In-State Govt. Units
(Describe & Itemize)
4190
0 0
Total Payments to Other Govt. Units (In-State) 4100 0 0 0 0
30 - DEBT SERVICES (DS)
Total Direct Disbursements/Expenditures
Excess (Deficiency) of Receipts/Revenues/Over Disbursements/
Expenditures
Print Date: 9/16/2016
Copy of N Wamac AFR 2016 "See Accompanying Notes to Financial Statements."

Page 19 STATEMENT OF EXPENDITURES DISBURSED BUDGET TO ACTUAL
FOR THE YEAR ENDING JUNE 30, 2016
Page 19
1
2
A B C D E F G H I J K L
(100) (200) (300) (400) (500) (600) (700) (800) (900)
Funct
#Salaries
Employee
Benefits
Purchased
Services
Supplies &
MaterialsCapital Outlay Other Objects
Non-Capitalized
Equipment
Termination
BenefitsTotal Budget
Description (Enter Whole Dollars)
189190
191
192
193
194
195
196
197
198
199
200
201202
203
204
205206
207
208
209
210
211
212
213
214
215
216
217
218
219
220
221
222223
224
225
226
227
228
229
230
231232
233
234
235
236237
PAYMENTS TO OTHER GOVT UNITS (OUT-OF-STATE) 4400 0 0
Total Payments to Other Govt Units 4000 0 0 0 0
DEBT SERVICES (TR) 5000
DEBT SERVICE - INTEREST ON SHORT-TERM DEBT
Tax Anticipation Warrants 5110 0 0
Tax Anticipation Notes 5120 0 0
Corporate Personal Prop. Repl. Tax Anticipation Notes 5130 0 0
State Aid Anticipation Certificates 5140 0 0
Other Interest on Short-Term Debt (Describe & Itemize) 5150 0 0
Total Debt Services - Interest On Short-Term Debt 5100 0 0 0
DEBT SERVICES - INTEREST ON LONG-TERM DEBT 5200 0 0
DEBT SERVICE - PAYMENTS OF PRINCIPAL ON LONG-TERM
DEBT (Lease/Purchase Principal Retired) 11
5300
0 0
DEBT SERVICES - OTHER (Describe & Itemize) 5400 0 0
Total Debt Services 5000 0 0 0
PROVISION FOR CONTINGENCIES (TR) 6000 0
Total Disbursements/ Expenditures 13,600 695 11,644 1,450 0 435 0 0 27,824 27,186
Excess (Deficiency) of Receipts/Revenues Over
Disbursements/Expenditures 6,022
INSTRUCTION (MR/SS) 1000
Regular Programs 1100 8,893 8,893 8,795
Pre-K Programs 1125 0 0
Special Education Programs (Functions 1200-1220) 1200 7,931 7,931 7,089
Special Education Programs - Pre-K 1225 0 0
Remedial and Supplemental Programs - K-12 1250 406 406 485
Remedial and Supplemental Programs - Pre-K 1275 0 0
Adult/Continuing Education Programs 1300 0 0
CTE Programs 1400 0 0
Interscholastic Programs 1500 92 92 215
Summer School Programs 1600 0 0
Gifted Programs 1650 0 0
Driver's Education Programs 1700 0 0
Bilingual Programs 1800 0 0
Truants' Alternative & Optional Programs 1900 0 0
Total Instruction 1000 17,322 17,322 16,584
SUPPORT SERVICES (MR/SS) 2000
SUPPORT SERVICES - PUPILS
Attendance & Social Work Services 2110 0 0
Guidance Services 2120 0 0
Health Services 2130 0 0
Psychological Services 2140 0 0
Speech Pathology & Audiology Services 2150 0 0
Other Support Services - Pupils (Describe & Itemize) 2190 0 0
Total Support Services - Pupils 2100 0 0 0
SUPPORT SERVICES - INSTRUCTIONAL STAFF
Improvement of Instruction Services 2210 38 38 78
Educational Media Services 2220 0 0
Assessment & Testing 2230 0 0
Total Support Services - Instructional Staff 2200 38 38 78
50 - MUNICIPAL RETIREMENT/SOCIAL SECURITY FUND
(MR/SS)
Print Date: 9/16/2016
Copy of N Wamac AFR 2016 "See Accompanying Notes to Financial Statements."

Page 20 STATEMENT OF EXPENDITURES DISBURSED BUDGET TO ACTUAL
FOR THE YEAR ENDING JUNE 30, 2016
Page 20
1
2
A B C D E F G H I J K L
(100) (200) (300) (400) (500) (600) (700) (800) (900)
Funct
#Salaries
Employee
Benefits
Purchased
Services
Supplies &
MaterialsCapital Outlay Other Objects
Non-Capitalized
Equipment
Termination
BenefitsTotal Budget
Description (Enter Whole Dollars)
238
239
240
241
242
243
244
245
246
247
248
249
250251
252
253
254255
256
257
258
259
260
261
262
263264
265
266
267268
269
270271
272273
274
275
276
277278
279
280
281
282
283
SUPPORT SERVICES - GENERAL ADMINISTRATION
Board of Education Services 2310 200 200 201
Executive Administration Services 2320 465 465 930
Service Area Administrative Services 2330 0 0
Claims Paid from Self Insurance Fund 2361 0 0
Workers' Compensation or Workers' Occupation Disease Acts
Payments
2362
0 0
Unemployment Insurance Payments 2363 0 0
Insurance Payments (Regular or Self-Insurance) 2364 0 0
Risk Management and Claims Services Payments 2365 0 0
Judgment and Settlements 2366 0 0
Educational, Inspectional, Supervisory Services Related to Loss
Prevention or Reduction
2367
1,348 1,348 1,725
Reciprocal Insurance Payments 2368 0 0
Legal Services 2369 0 0
Total Support Services - General Administration 2300 2,013 2,013 2,856
SUPPORT SERVICES - SCHOOL ADMINISTRATION
Office of the Principal Services 2410 307 307 306
Other Support Services - School Administration
(Describe & Itemize)
2490
0 0
Total Support Services - School Administration 2400 307 307 306
SUPPORT SERVICES - BUSINESS
Direction of Business Support Services 2510 0 0
Fiscal Services 2520 5,460 5,460 5,345
Facilities Acquisition & Construction Services 2530 0 0
Operation & Maintenance of Plant Services 2540 5,922 5,922 5,812
Pupil Transportation Services 2550 711 711 669
Food Services 2560 4,101 4,101 4,342
Internal Services 2570 0 0
Total Support Services - Business 2500 16,194 16,194 16,168
SUPPORT SERVICES - CENTRAL
Direction of Central Support Services 2610 0 0
Planning, Research, Development, & Evaluation Services2620
0 0
Information Services 2630 0 0
Staff Services 2640 0 0
Data Processing Services 2660 0 0
Total Support Services - Central 2600 0 0 0
Other Support Services (Describe & Itemize) 2900 0 0
Total Support Services 2000 18,552 18,552 19,408
COMMUNITY SERVICES (MR/SS) 3000 0 0
PAYMENTS TO OTHER DIST & GOVT UNITS (MR/SS) 4000
Payments for Special Education Programs 4120 0 0
Payments for CTE Programs 4140 0 0
Total Payments to Other Govt Units 4000 0 0 0
DEBT SERVICES (MR/SS) 5000
DEBT SERVICE - INTEREST ON SHORT-TERM DEBT
Tax Anticipation Warrants 5110 0 0
Tax Anticipation Notes 5120 0 0
Corporate Personal Prop. Repl. Tax Anticipation Notes 5130 0 0
Print Date: 9/16/2016
Copy of N Wamac AFR 2016 "See Accompanying Notes to Financial Statements."

Page 21 STATEMENT OF EXPENDITURES DISBURSED BUDGET TO ACTUAL
FOR THE YEAR ENDING JUNE 30, 2016
Page 21
1
2
A B C D E F G H I J K L
(100) (200) (300) (400) (500) (600) (700) (800) (900)
Funct
#Salaries
Employee
Benefits
Purchased
Services
Supplies &
MaterialsCapital Outlay Other Objects
Non-Capitalized
Equipment
Termination
BenefitsTotal Budget
Description (Enter Whole Dollars)
284
285286
287
288
289290
291
292
293
294
295296
297
298
299
300
301
302303
304
305
306307
308309
310
311
312
313
314
315
316
317
318
319
320
321
322323
324
325
326
327
State Aid Anticipation Certificates 5140 0 0
Other (Describe & Itemize) 5150 0 0
Total Debt Services - Interest 5000 0 0 0
PROVISION FOR CONTINGENCIES (MR/SS) 6000 0
35,874 0 35,874 35,992
Excess (Deficiency) of Receipts/Revenues Over
Disbursements/Expenditures (10,797)
SUPPORT SERVICES (CP) 2000
SUPPORT SERVICES - BUSINESS
Facilities Acquisition and Construction Services 2530 0 0
Other Support Services (Describe & Itemize) 2900 0 0
Total Support Services 2000 0 0 0 0 0 0 0 0 0 0
PAYMENTS TO OTHER DIST & GOVT UNITS (CP) 4000
PAYMENTS TO OTHER GOVT UNITS (In-State)
Payments to Other Govt Units (In-State) 4100 0 0
Payments for Special Education Programs 4120 0 0
Payments for CTE Programs 4140 0 0
Other Payments to In-State Govt. Units (Describe & Itemize) 4190 0 0
Total Payments to Other Govt Units 4000 0 0 0 0
PROVISION FOR CONTINGENCIES (S&C/CI) 6000 0
0 0 0 0 0 0 0 0 0 0
0
SUPPORT SERVICES - GENERAL ADMINISTRATION
Claims Paid from Self Insurance Fund 2361 0 0
Workers' Compensation or Workers' Occupation Disease Acts
Payments
2362
14,407 14,407 7,931
Unemployment Insurance Payments 2363 2,656 2,656 2,657
Insurance Payments (Regular or Self-Insurance) 2364 9,543 9,543 8,594
Risk Management and Claims Services Payments 2365 0 0
Judgment and Settlements 2366 0 0
Educational, Inspectional, Supervisory Services Related to Loss
Prevention or Reduction
2367
39,893 7,495 47,388 43,800
Reciprocal Insurance Payments 2368 0 0
Legal Services 2369 0 0
Property Insurance (Buildings & Grounds) 2371 0 0
Vehicle Insurance (Transporation) 2372 0 0
Total Support Services - General Administration 2000 39,893 7,495 26,606 0 0 0 0 0 73,994 62,982
DEBT SERVICES (TF) 5000
DEBT SERVICES - INTEREST ON SHORT-TERM DEBT
Tax Anticipation Warrants 5110 0 0
Corporate Personal Prop. Repl. Tax Anticipation Notes 5130 0 0
60 - CAPITAL PROJECTS (CP)
Excess (Deficiency) of Receipts/Revenues Over
Disbursements/Expenditures
Total Disbursements/ Expenditures
Total Disbursements/Expenditures
70 - WORKING CASH (WC)
80 - TORT FUND (TF)
Print Date: 9/16/2016
Copy of N Wamac AFR 2016 "See Accompanying Notes to Financial Statements."

Page 22 STATEMENT OF EXPENDITURES DISBURSED BUDGET TO ACTUAL
FOR THE YEAR ENDING JUNE 30, 2016
Page 22
1
2
A B C D E F G H I J K L
(100) (200) (300) (400) (500) (600) (700) (800) (900)
Funct
#Salaries
Employee
Benefits
Purchased
Services
Supplies &
MaterialsCapital Outlay Other Objects
Non-Capitalized
Equipment
Termination
BenefitsTotal Budget
Description (Enter Whole Dollars)
328
329
330
331
332333
334
335
336
337
338339
340341
342
343
344
345
346
347
348349
350
351352
353
354
355
Other Interest or Short-Term Debt 5150 0 0
Total Debt Services - Interest on Short-Term Debt 5000 0 0 0
PROVISIONS FOR CONTINGENCIES (TF) 6000 0
Total Disbursements/Expenditures 39,893 7,495 26,606 0 0 0 0 0 73,994 62,982
20,101
SUPPORT SERVICES (FP&S) 2000
SUPPORT SERVICES - BUSINESS
Facilities Acquisition & Construction Services 2530 1,500 8,000 9,500 1,000
Operation & Maintenance of Plant Services 2540 5,871 5,871 6,871
Total Support Services - Business 2500 0 0 1,500 0 13,871 0 0 0 15,371 7,871
Other Support Services (Describe & Itemize) 2900 0 0
Total Support Services 2000 0 0 1,500 0 13,871 0 0 0 15,371 7,871
PAYMENTS TO OTHER DIST & GOVT UNITS (FP&S) 4000
Other Payments to In-State Govt. Units
(Describe & Itemize)
4190
0 0
Total Payments to Other Govt Units 4000 0 0 0
DEBT SERVICES (FP&S) 5000
DEBT SERVICES- INTEREST ON SHORT-TERM DEBT
Tax Anticipation Warrants 5110 0 0
Other Interest on Short-Term Debt (Describe & Itemize) 5150 0 0
Total Debt Service - Interest on Short-Term Debt 5100 0 0 0
DEBT SERVICES - INTEREST ON LONG-TERM DEBT 5200 0 0
Debt Service - Payments of Principal on Long-Term Debt 15
(Lease/Purchase Principal Retired)
5300
0 0
Total Debt Service 5000 0 0 0
PROVISION FOR CONTINGENCIES (FP&S) 6000 0
Total Disbursements/Expenditures 0 0 1,500 0 13,871 0 0 0 15,371 7,871
Excess (Deficiency) of Receipts/Revenues Over
Disbursements/Expenditures (10,854)
90 - FIRE PREVENTION & SAFETY FUND (FP&S)
Excess (Deficiency) of Receipts/Revenues Over
Disbursements/Expenditures
Print Date: 9/16/2016
Copy of N Wamac AFR 2016 "See Accompanying Notes to Financial Statements."

Page 23
FEDERAL STIMULUS - AMERICAN RECOVERY AND REINVESTMENT ACT (ARRA) of 2009
(Detailed Schedule of Receipts and Disbursements)
Page 23
1
2
3
4
5
6
7
8
9
10
11
12
13
14
15
16
17
18
19
20
21
22
23
24
25
26
27
28
29
30
31
32
33
34
35
36
3738
39
4041
42
43
4445
46
47
48
49
50
51
52
53
54
55
56
A B C D E F G H I J K L
----RECEIPTS----
(100) (200) (300) (400) (500) (600) (700) (800) (900)
ARRA Revenue Source CodeAcct
#ARRA Receipts Salaries
Employee
Benefits
Purchased
Services
Supplies &
MaterialsCapital Outlay Other
Non-Capitalized
Equipment
Termination
Benefits
Total
Expenditures
Beginning Balance July 1, 2015 0
ARRA - General State Aid 4850 0 0
ARRA - Title I Low Income 4851 0 0
ARRA - Title I Neglected - Private 4852 0 0
ARRA - Title I Delinquent - Private 4853 0 0
ARRA - Title I School Improvement (Part A) 4854 0 0
ARRA - Title I School Improvement (Section 1003g) 4855 0 0
ARRA - IDEA Part B Preschool 4856 0 0
ARRA - IDEA Part B Flow Through 4857 0 0
ARRA - Title II D Technology Formula 4860 0 0
ARRA - Title II D Technology Competitive 4861 0 0
ARRA - McKenney - Vento Homeless Education 4862 0 0
ARRA - Child Nutrition Equipment Assistance 4863 0 0
Impact Aid Construction Formula 4864 0 0
Impact Aid Construction Competitive 4865 0 0
QZAB Tax Credits 4866 0 0
QSCB Tax Credits 4867 0 0
Build America Bonds Tax Credits 4868 0 0
Build America Bonds Interest Reimbursement 4869 0 0
ARRA - General State Aid - Other Govt Services Stabilization 4870 0 0
ARRA - Other II 4871 0 0
ARRA - Other III 4872 0 0
ARRA - Other IV 4873 0 0
ARRA - Other V 4874 0 0
ARRA - Early Childhood 4875 0 0
ARRA - Other VII 4876 0 0
ARRA - Other VIII 4877 0 0
ARRA - Other IX 4878 0 0
ARRA - Other X 4879 0 0
ARRA - Other XI 4880 0 0
Total ARRA Programs 0 0 0 0 0 0 0 0 0
Ending Balance June 30, 2016 0
1. Were any funds from the State Fiscal Stabilization Fund Program (SFSF) General State-Aid Accounts 4850, line 5 & 4870, line 23
used for the following non-allowable purposes:
Payments of maintenance costs;
Stadiums or other facilities used for athletic contests, exhibitions or other events for which admission is charged to the general public;
Purchase or upgrade of vehicles;
Improvements of stand-alone facilities whose purpose is not the education of children such as central office administrative buildings;
Financial assistance to students to attend private elementary or secondary schools unless the funds are used to provide special
education and related services to children with disabilities as authorized by the IDEA Act;
School modernization, renovation, or repair that is inconsistent with State Law.
2. If any above boxes are checked provide the total amount
of questioned costs and provide an explanation below:
-------------------------------------------------------------------------------------------DISBURSEMENTS------------------------------------------------------------------------------------District's Accounting Basis is CASH
Print Date: Copy of N Wamac AFR 2016
9/16/2016

Page 24 Page 24
1
23
4
5
6
7
8
9
10
11
12
13
14
15
16
17
18
19
20
21
22
A B C D E F
SCHEDULE OF AD VALOREM TAX RECEIPTS
Taxes Received
7-1-15 Thru 6-30-16
(from 2014 Levy &
Prior Levies) *
Taxes Received
(from the 2015 Levy)
Taxes Received
(from 2014 & Prior
Levies)
Total Estimated Taxes
(from the 2015 Levy)
Estimated Taxes Due
(from the 2015 Levy)
(Column B - C) (Column E - C)
Educational 126,519 126,519 136,160 136,160
Operations & Maintenance 21,056 21,056 22,639 22,639
Debt Services ** 35,233 35,233 39,824 39,824
Transportation 10,106 10,106 10,866 10,866
Municipal Retirement 0 0 10,208 10,208
Capital Improvements 0 0 0 0
Working Cash 4,210 4,210 4,528 4,528
Tort Immunity 93,695 93,695 91,408 91,408
Fire Prevention & Safety 4,210 4,210 4,528 4,528
Leasing Levy 4,210 4,210 4,528 4,528
Special Education 1,685 1,685 1,817 1,817
Area Vocational Construction 0 0 0 0
Social Security/Medicare Only 23,355 23,355 25,318 25,318
Summer School 0 0 0 0
Other (Describe & Itemize) 0 0 0 0
Totals 324,279 0 324,279 351,824 351,824
* The formulas in column B are unprotected to be overidden when reporting on a ACCRUAL basis.
** All tax receipts for debt service payments on bonds must be recorded on line 6 (Debt Services).
Description (Enter Whole Dollars)
Print Date: 9/16/2016
Copy of N Wamac AFR 2016

Page 25 Page 25
1
2
3
4
5
6
7
8
9
10
11
12
13
14
15
16
17
18
19
20
21
22
23
24
25
26
2728
29
30
31
3233
34
35
36
3738
39
40
4142
43
4445
4647
48
4950
5152535455
A B C D E F G H I J
Outstanding
Beginning 07/01/15
Issued 07/01/15
Through 06/30/16
Retired 07/01/15
Through 06/30/16
Outstanding
Ending 06/30/16
0
Educational Fund 0
Operations & Maintenance Fund 0
Debt Services - Construction 0
Debt Services - Working Cash 0
Debt Services - Refunding Bonds 0
Transportation Fund 0
Municipal Retirement/Social Security Fund 0
Fire Prevention & Safety Fund 0
Other - (Describe & Itemize) 0
0 0 0 0
0
0
0
0
0 0 0 0
0
0
0
Identification or Name of IssueDate of Issue
(mm/dd/yy)
Amount of Original
IssueType of Issue *
Outstanding
Beginning 07/1/15
Issued 7/1/15 thru
6/30/16
Any differences
described and
itemized
Retired 7/1/15 thru
6/30/16
Outstanding
Ending 6/30/16
Amount to be
Provided for
Payment on Long-
Term Debt
General Obligation Life Safety Bonds, Series 2006 03/01/06 290,000 4 35,000 0 35,000 0
General Obligation Life Safety Bonds, Series 2016 02/22/16 144,000 4 144,000 144,000 143,392
General Obligation Working Cash Bonds, Series 2016 02/22/16 138,000 1 138,000 138,000 137,417
0
0
0
0
0
0
0
0
0
0
0
0
0
0
0
572,000 35,000 282,000 0 35,000 282,000 280,809
* Each type of debt issued must be identified separately with the amount:
1. Working Cash Fund Bonds 7. Other
2. Funding Bonds 5. Tort Judgment Bonds 8. Other
3. Refunding Bonds 6. Building Bonds 9. Other
4. Fire Prevent, Safety, Environmental and Energy Bonds
Educational Fund
Operations & Maintenance Fund
Fire Prevention & Safety Fund
Other - (Describe & Itemize)
Total TANs
TEACHERS'/EMPLOYEES' ORDERS (T/EO)
Total T/EOs (Educational, Operations & Maintenance, &
Transportation Funds)
SCHEDULE OF LONG-TERM DEBT
GENERAL STATE-AID ANTICIPATION CERTIFICATES (GSAAC)
Total GSAACs (All Funds)
OTHER SHORT-TERM BORROWING
Total Other Short-Term Borrowing (Describe & Itemize)
SCHEDULE OF SHORT-TERM DEBT
TAX ANTICIPATION NOTES (TAN)
Description (Enter Whole Dollars)
Total CPPRT Notes
TAX ANTICIPATION WARRANTS (TAW)
Total TAWs
CORPORATE PERSONAL PROPERTY REPLACEMENT TAX
ANTICIPATION NOTES (CPPRT)
Print Date: 9/16/2016
Copy of N Wamac AFR 2016

Page 26 Schedule of Restricted Local Tax Levies and Selected Revenues Sources
Schedule of Tort Immunity Expenditures
Page 26
1
2
3
4
5
6
7
8
9
10
1112
13
14
15
16
17
18
19
2021
2223
24
25
2627
2829
30
31
323334
35
36
37
38
39
40
41
42
43
4445
46
47
48
A B C D E F G H I J K
Account No Tort Immunity a Special Education
Area Vocational
Construction
School Facility
Occupation
Taxes b
Driver Education
0 0 0 0 0
10, 20, 40 or 50-1100 1,685
Earnings on Investments 10, 20, 40, 50 or 60-1500
Drivers' Education Fees 10-1970
School Facility Occupation Tax Proceeds 30 or 60-1983
Driver Education 10 or 20-3370
--
10, 20, 40 or 60-7200
Total Receipts 0 1,685 0 0 0
10 or 50-1000 1,685
20 or 60-2530
10, 20, 40-2360-2370
DEBT SERVICE
30-5200
30-5300
30-5400
Total Debt Services 0
--
Total Disbursements 0 1,685 0 0 0
Ending Cash Basis Fund Balance as of June 30, 2016 0 0 0 0 0
Reserved Fund Balance 714 0 0 0 0 0
Unreserved Fund Balance 730 0 0 0 0 0
SCHEDULE OF TORT IMMUNITY EXPENDITURES a
Yes No X Has the entity established an insurance reserve pursuant to 745 ILCS 10/9-103?
If yes, list in the aggregate the following: Total Claims Payments:
Total Reserve Remaining:
Using the following categories, list all other Tort Immunity expenditures not
included in line 30 above. Include the total dollar amount for each category.
Expenditures:
Workers' Compensation Act and/or Workers' Occupational Disease Act
Unemployment Insurance Act
Insurance (Regular or Self-Insurance)
Risk Management and Claims Service
Judgments/Settlements
Reciprocal Insurance Payments (Insurance Code 72, 76, and 81)
Legal Services
Principal and Interest on Tort Bonds
a Schedules for Tort Immunity are to be completed only if expenditures have been reported in any fund other than the Tort Immunity Fund (80) during the fiscal year as a result of existing (restricted) fund balances
in those other funds that are being spent down. Cell G6 above should include interest earnings only from these restricted tort immunity monies and only if reported in a fund other than Tort Immunity Fund (80).
b 55 ILCS 5/5-1006.7
SCHEDULE OF RESTRICTED LOCAL TAX LEVIES AND SELECTED REVENUE SOURCES
Ad Valorem Taxes Received by District
Sale of Bonds
Other Receipts (Describe & Itemize on tab "Itemization 32")
Instruction
Facilities Acquisition & Construction Services
Tort Immunity Services
Other Disbursements (Describe & Itemize on tab "Itemization 32")
Debt Services - Payments of Principal on Long-Term Debt
(Lease/Purchase Principal Retired)
Debt Services Other (Describe & Itemize on tab "Itemization 32")
Educational, Inspectional, Supervisory Services Related to Loss Prevention and/or Reduction
Description (Enter Whole Dollars)
Cash Basis Fund Balance as of July 1, 2015
RECEIPTS:
DISBURSEMENTS:
Debt Services - Interest on Long-Term Debt
Print Date: 9/16/2016
Copy of N Wamac AFR 2016

Page 27 Page 27
1
2
3
4
5
6
7
8
9
10
11
12
13
14
15
16
17
18
A B C D E F G H I J K L
Schedule of Capital Outlay and Depreciation
Description of Assets (Enter Whole Dollars)
Acct
#
Cost
Beginning
7/1/15
Add:
Additions
2015-2016
Less:
Deletions
2015-2016
Cost Ending
6/30/16
Life In
Years
Accumulated
Depreciation
Beginning
7/1/15
Add:
Depreciation
Allowable
2015-2016
Less:
Depreciation
Deletions
2015-2016
Accumulated
Depreciation
Ending
6/30/16
Ending Balance
Undepreciated
6/30/16
Works of Art & Historical Treasures 210 0 0 0 0 0 0 0 0 0
Land 220
Non-Depreciable Land 221 8,325 0 0 8,325 8,325
Depreciable Land 222 0 0 0 0 50 0 0 0 0 0
Buildings 230
Permanent Buildings 231 972,672 14,621 0 987,293 50 402,979 19,658 0 422,637 564,656
Temporary Buildings 232 0 0 0 0 20 0 0 0 0 0
Improvements Other than Buildings
(Infrastructure)240
128,157 0 0 128,15720
58,934 5,391 064,325 63,832
Capitalized Equipment 250
10 Yr Schedule 251 462,213 19,158 0 481,371 10 370,932 19,742 0 390,674 90,697
5 Yr Schedule 252 68,593 0 0 68,593 5 68,593 0 0 68,593 0
3 Yr Schedule 253 0 0 0 0 3 0 0 0 0 0
Construction in Progress 260 0 8,000 0 8,000 -- 8,000
Total Capital Assets 200 1,639,960 41,779 0 1,681,739 901,438 44,791 0 946,229 735,510
Non-Capitalized Equipment 700 0 10 0
Allowable Depreciation 44,791
Print Date: 9/16/2016
Copy of N Wamac AFR 2016

Page 28 Page 28
1
2
3
4
5
6
7
89
10
1112
1314
15
1617
18
19
2021
22
2324
25
26
2728
29
30
31
3233
34
3536
37
38
3940
41
42
43
4445
46
47
4849
50
5152
53
54
55
5657
58
59
6061
62
6364
65
66
67
6869
70
71
7273
7475
76
7778
79
A B C D E F G
Fund Sheet, Row ACCOUNT NO - TITLE Amount
EXPENDITURES:
ED Expenditures 15-22, L114 Total Expenditures $ 1,068,017
O&M Expenditures 15-22, L150 Total Expenditures 119,611
DS Expenditures 15-22, L168 Total Expenditures 36,200
TR Expenditures 15-22, L204 Total Expenditures 27,824
MR/SS Expenditures 15-22, L288 Total Expenditures 35,874
TORT Expenditures 15-22, L331 Total Expenditures 73,994
Total Expenditures $ 1,361,520
LESS RECEIPTS/REVENUES OR DISBURSEMENTS/EXPENDITURES NOT APPLICABLE TO THE REGULAR K-12 PROGRAM:
TR Revenues 9-14, L43, Col F 1412 Regular - Transp Fees from Other Districts (In State) $ 0
TR Revenues 9-14, L47, Col F 1421 Summer Sch - Transp. Fees from Pupils or Parents (In State) 0
TR Revenues 9-14, L48, Col F 1422 Summer Sch - Transp. Fees from Other Districts (In State) 0
TR Revenues 9-14, L49, Col F 1423 Summer Sch - Transp. Fees from Other Sources (In State) 0
TR Revenues 9-14, L50 Col F 1424 Summer Sch - Transp. Fees from Other Sources (Out of State) 0
TR Revenues 9-14, L52, Col F 1432 CTE - Transp Fees from Other Districts (In State) 0
TR Revenues 9-14, L56, Col F 1442 Special Ed - Transp Fees from Other Districts (In State) 0
TR Revenues 9-14, L59, Col F 1451 Adult - Transp Fees from Pupils or Parents (In State) 0
TR Revenues 9-14, L60, Col F 1452 Adult - Transp Fees from Other Districts (In State) 0
TR Revenues 9-14, L61, Col F 1453 Adult - Transp Fees from Other Sources (In State) 0
TR Revenues 9-14, L62, Col F 1454 Adult - Transp Fees from Other Sources (Out of State) 0
O&M Revenues 9-14, L148, Col D 3410 Adult Ed (from ICCB) 0
O&M-TR Revenues 9-14, L149, Col D & F 3499 Adult Ed - Other (Describe & Itemize) 0
O&M-TR Revenues 9-14, L218, Col D,F 4600 Fed - Spec Education - Preschool Flow-Through 0
O&M-TR Revenues 9-14, L219, Col D,F 4605 Fed - Spec Education - Preschool Discretionary 0
O&M Revenues 9-14, L229, Col D 4810 Federal - Adult Education 0
ED Expenditures 15-22, L7, Col K - (G+I) 1125 Pre-K Programs 0
ED Expenditures 15-22, L9, Col K - (G+I) 1225 Special Education Programs Pre-K 0
ED Expenditures 15-22, L11, Col K - (G+I) 1275 Remedial and Supplemental Programs Pre-K 0
ED Expenditures 15-22, L12, Col K - (G+I) 1300 Adult/Continuing Education Programs 0
ED Expenditures 15-22, L15, Col K - (G+I) 1600 Summer School Programs 0
ED Expenditures 15-22, L20, Col K 1910 Pre-K Programs - Private Tuition 0
ED Expenditures 15-22, L21, Col K 1911 Regular K-12 Programs - Private Tuition 0
ED Expenditures 15-22, L22, Col K 1912 Special Education Programs K-12 - Private Tuition 0
ED Expenditures 15-22, L23, Col K 1913 Special Education Programs Pre-K - Tuition 0
ED Expenditures 15-22, L24, Col K 1914 Remedial/Supplemental Programs K-12 - Private Tuition 0
ED Expenditures 15-22, L25, Col K 1915 Remedial/Supplemental Programs Pre-K - Private Tuition 0
ED Expenditures 15-22, L26, Col K 1916 Adult/Continuing Education Programs - Private Tuition 0
ED Expenditures 15-22, L27, Col K 1917 CTE Programs - Private Tuition 0
ED Expenditures 15-22, L28, Col K 1918 Interscholastic Programs - Private Tuition 0
ED Expenditures 15-22, L29, Col K 1919 Summer School Programs - Private Tuition 0
ED Expenditures 15-22, L30, Col K 1920 Gifted Programs - Private Tuition 0
ED Expenditures 15-22, L31, Col K 1921 Bilingual Programs - Private Tuition 0
ED Expenditures 15-22, L32, Col K 1922 Truants Alternative/Optional Ed Progms - Private Tuition 0
ED Expenditures 15-22, L75, Col K - (G+I) 3000 Community Services 0
ED Expenditures 15-22, L102, Col K 4000 Total Payments to Other Govt Units 180,375
ED Expenditures 15-22, L114, Col G - Capital Outlay 14,412
ED Expenditures 15-22, L114, Col I - Non-Capitalized Equipment 0
O&M Expenditures 15-22, L130, Col K - (G+I) 3000 Community Services 0
O&M Expenditures 15-22, L138, Col K 4000 Total Payments to Other Govt Units 0
O&M Expenditures 15-22, L150, Col G - Capital Outlay 13,496
O&M Expenditures 15-22, L150, Col I - Non-Capitalized Equipment 0
DS Expenditures 15-22, L154, Col K 4000 Payments to Other Dist & Govt Units 0
DS Expenditures 15-22, L164, Col K 5300 Debt Service - Payments of Principal on Long-Term Debt 35,000
TR Expenditures 15-22, L179, Col K - (G+I) 3000 Community Services 0
TR Expenditures 15-22, L190, Col K 4000 Total Payments to Other Govt Units 0
TR Expenditures 15-22, L200, Col K 5300 Debt Service - Payments of Principal on Long-Term Debt 0
TR Expenditures 15-22, L204, Col G - Capital Outlay 0
TR Expenditures 15-22, L204, Col I - Non-Capitalized Equipment 0
MR/SS Expenditures 15-22, L210, Col K 1125 Pre-K Programs 0
MR/SS Expenditures 15-22, L212, Col K 1225 Special Education Programs - Pre-K 0
MR/SS Expenditures 15-22, L214, Col K 1275 Remedial and Supplemental Programs - Pre-K 0
MR/SS Expenditures 15-22, L215, Col K 1300 Adult/Continuing Education Programs 0
MR/SS Expenditures 15-22, L218, Col K 1600 Summer School Programs 0
MR/SS Expenditures 15-22, L274, Col K 3000 Community Services 0
MR/SS Expenditures 15-22, L278, Col K 4000 Total Payments to Other Govt Units 0
Total Deductions for OEPP Computation (Sum of Lines 18 - 73) $ 243,283
Total Operating Expenses Regular K-12 (Line 14 minus Line 75) 1,118,237
9 Mo ADA from the General State Aid Claimable for 2015-2016 and Payable in 2016-2017 (ISBE 54-33), L12 139.74
Estimated OEPP (Line 76 divided by Line 77) $ 8,002.27
OPERATING EXPENSE PER PUPIL
ESTIMATED OPERATING EXPENSE PER PUPIL (OEPP)/PER CAPITA TUITION CHARGE (PCTC) COMPUTATIONS (2015-2016)
This schedule is completed for school districts only.
Print Date: 9/16/2016
Copy of N Wamac AFR 2016

Page 29 Page 29
1
2
3
4
5
A B C D E F G
Fund Sheet, Row ACCOUNT NO - TITLE Amount
ESTIMATED OPERATING EXPENSE PER PUPIL (OEPP)/PER CAPITA TUITION CHARGE (PCTC) COMPUTATIONS (2015-2016)
This schedule is completed for school districts only.
80
8182
83
8485
86
87
8889
90
91
92
9394
95
9697
98
99
100101
102
103
104
105106
107
108109
110
111
112113
114
115
116
117118
119
120
121122
123
124125
126
127
128
129130
131
132
133134135160161162
163164
165
166
167
168169
170
171172173174175
176177
178
179180
181
182
LESS OFFSETTING RECEIPTS/REVENUES:
TR Revenues 9-14, L42, Col F 1411 Regular -Transp Fees from Pupils or Parents (In State) $ 0
TR Revenues 9-14, L44, Col F 1413 Regular - Transp Fees from Other Sources (In State) 0
TR Revenues 9-14, L45, Col F 1415 Regular - Transp Fees from Co-curricular Activities (In State) 0
TR Revenues 9-14, L46, Col F 1416 Regular Transp Fees from Other Sources (Out of State) 0
TR Revenues 9-14, L51, Col F 1431 CTE - Transp Fees from Pupils or Parents (In State) 0
TR Revenues 9-14, L53, Col F 1433 CTE - Transp Fees from Other Sources (In State) 0
TR Revenues 9-14, L54, Col F 1434 CTE - Transp Fees from Other Sources (Out of State) 0
TR Revenues 9-14, L55, Col F 1441 Special Ed - Transp Fees from Pupils or Parents (In State) 0
TR Revenues 9-14, L57, Col F 1443 Special Ed - Transp Fees from Other Sources (In State) 0
TR Revenues 9-14, L58, Col F 1444 Special Ed - Transp Fees from Other Sources (Out of State) 0
ED Revenues 9-14, L75, Col C 1600 Total Food Service 1,898
ED-O&M Revenues 9-14, L82, Col C,D 1700 Total District/School Activity Income 1,902
ED Revenues 9-14, L84, Col C 1811 Rentals - Regular Textbooks 0
ED Revenues 9-14, L87, Col C 1819 Rentals - Other (Describe & Itemize) 0
ED Revenues 9-14, L88, Col C 1821 Sales - Regular Textbooks 0
ED Revenues 9-14, L91, Col C 1829 Sales - Other (Describe & Itemize) 0
ED Revenues 9-14, L92, Col C 1890 Other (Describe & Itemize) 0
ED-O&M Revenues 9-14, L95, Col C,D 1910 Rentals 0
ED-O&M-TR Revenues 9-14, L98, Col C,D,F 1940 Services Provided Other Districts 0
ED-O&M-DS-TR-MR/SS Revenues 9-14, L104, Col C,D,E,F,G 1991 Payment from Other Districts 0
ED Revenues 9-14, L106, Col C 1993 Other Local Fees (Describe & Itemize) 0
ED-O&M-TR Revenues 9-14, L131, Col C,D,F 3100 Total Special Education 45,744
ED-O&M-MR/SS Revenues 9-14, L140, Col C,D,G 3200 Total Career and Technical Education 0
ED-MR/SS Revenues 9-14, L144, Col C,G 3300 Total Bilingual Ed 0
ED Revenues 9-14, L145, Col C 3360 State Free Lunch & Breakfast 962
ED-O&M-MR/SS Revenues 9-14, L146, Col C,D,G 3365 School Breakfast Initiative 0
ED-O&M Revenues 9-14, L147,Col C,D 3370 Driver Education 0
ED-O&M-TR-MR/SS Revenues 9-14, L154, Col C,D,F,G 3500 Total Transportation 12,583
ED Revenues 9-14, L155, Col C 3610 Learning Improvement - Change Grants 0
ED-O&M-TR-MR/SS Revenues 9-14, L156, Col C,D,F,G 3660 Scientific Literacy 0
ED-TR-MR/SS Revenues 9-14, L157, Col C,F,G 3695 Truant Alternative/Optional Education 0
ED-TR-MR/SS Revenues 9-14, L159, Col C,F,G 3715 Reading Improvement Block Grant 0
ED-TR-MR/SS Revenues 9-14, L160, Col C,F,G 3720 Reading Improvement Block Grant - Reading Recovery 0
ED-TR-MR/SS Revenues 9-14, L161, Col C,F,G 3725 Continued Reading Improvement Block Grant 0
ED-TR-MR/SS Revenues 9-14, L162, Col C,F,G 3726 Continued Reading Improvement Block Grant (2% Set Aside) 0
ED-O&M-TR-MR/SS Revenues 9-14, L163, Col C,D,F,G 3766 Chicago General Education Block Grant 0
ED-O&M-TR-MR/SS Revenues 9-14, L164, Col C,D,F,G 3767 Chicago Educational Services Block Grant 0
ED-O&M-DS-TR-MR/SS Revenues 9-14, L165, Col C,D,E,F,G 3775 School Safety & Educational Improvement Block Grant 0
ED-O&M-DS-TR-MR/SS Revenues 9-14, L166, Col C,D,E,F,G 3780 Technology - Technology for Success 0
ED-TR Revenues 9-14, L167, Col C,F 3815 State Charter Schools 0
O&M Revenues 9-14, L170, Col D 3925 School Infrastructure - Maintenance Projects 0
ED-O&M-DS-TR-MR/SS-Tort Revenues 9-14, L171, Col C-G,J 3999 Other Restricted Revenue from State Sources 0
ED Revenues 9-14, L180, Col C 4045 Head Start (Subtract) 0
ED-O&M-TR-MR/SS Revenues 9-14, L184, Col C,D,F,G - Total Restricted Grants-In-Aid Received Directly from Federal Govt 0
ED-O&M-TR-MR/SS Revenues 9-14, L191, Col C,D,F,G - Total Title V 0
ED-MR/SS Revenues 9-14, L201, Col C,G - Total Food Service 112,107
ED-O&M-TR-MR/SS Revenues 9-14, L211, Col C,D,F,G - Total Title I 65,378
ED-O&M-TR-MR/SS Revenues 9-14, L216, Col C,D,F,G - Total Title IV 0
ED-O&M-TR-MR/SS Revenues 9-14, L220, Col C,D,F,G 4620 Fed - Spec Education - IDEA - Flow Through 7,876
ED-O&M-TR-MR/SS Revenues 9-14, L221, Col C,D,F,G 4625 Fed - Spec Education - IDEA - Room & Board 0
ED-O&M-TR-MR/SS Revenues 9-14, L222, Col C,D,F,G 4630 Fed - Spec Education - IDEA - Discretionary 0
ED-O&M-TR-MR/SS Revenues 9-14, L223, Col C,D,F,G 4699 Fed - Spec Education - IDEA - Other (Describe & Itemize) 0
ED-O&M-MR/SS Revenues 9-14, L228, Col C,D,G 4700 Total CTE - Perkins 0
ED-O&M-DS-TR-MR/SS-Tort Revenue Adjustments (C231 thru J258) 4800 Total ARRA Program Adjustments 0
ED Revenues 9-14, L260, Col C 4901 Race to the Top 0
ED-O&M-DS-TR-MR/SS-Tort Revenues 9-14, L261, Col C-G,J 4902 Race to the Top-Preschool Expansion Grant 0
ED,O&M,MR/SS Revenues 9-14, L262, Col C,D,G 4904 Advanced Placement Fee/International Baccalaureate 0
ED-TR-MR/SS Revenues 9-14, L263, Col C,F,G 4905 Title III - Immigrant Education Program (IEP) 0
ED-TR-MR/SS Revenues 9-14, L264, Col C,F,G 4909 Title III - Language Inst Program - Limited Eng (LIPLEP) 0
ED-TR-MR/SS Revenues 9-14, L265, Col C,F,G 4910 Learn & Serve America 0
ED-O&M-TR-MR/SS Revenues 9-14, L266, Col C,D,F,G 4920 McKinney Education for Homeless Children 0
ED-O&M-TR-MR/SS Revenues 9-14, L267, Col C,D,F,G 4930 Title II - Eisenhower Professional Development Formula 0
ED-O&M-TR-MR/SS Revenues 9-14, L268, Col C,D,F,G 4932 Title II - Teacher Quality 6,066
ED-O&M-TR-MR/SS Revenues 9-14, L269, Col C,D,F,G 4960 Federal Charter Schools 0
ED-O&M-TR-MR/SS Revenues 9-14, L270, Col C,D,F,G 4991 Medicaid Matching Funds - Administrative Outreach 552
ED-O&M-TR-MR/SS Revenues 9-14, L271, Col C,D,F,G 4992 Medicaid Matching Funds - Fee-for-Service Program 0
ED-O&M-TR-MR/SS Revenues 9-14, L272, Col C,D,F,G 4999 Other Restricted Revenue from Federal Sources (Describe & Itemize) 0
Total Deductions for PCTC Computation Line 83 through Line 173 $ 255,068
Net Operating Expense for Tuition Computation (Line 76 minus Line 175) 863,169
Total Depreciation Allowance (from page 27, Col I) 44,791
Total Allowance for PCTC Computation (Line 176 minus Line 177) 907,960
9 Month ADA (from the GSA Claimable for 2015-2016 Payable in 2016-2017 (ISBE form 54-33, Line 12)) 139.74
Total Estimated PCTC (Line 178 divided by Line 179) * $ 6,497.50
* The total OEPP/PCTC may change based on the data provided. The final amounts will be calculated by ISBE
PER CAPITA TUITION CHARGE
Print Date: 9/16/2016
Copy of N Wamac AFR 2016

Page 30
ESTIMATED INDIRECT COST DATA
Page 30
1
234
5
678910
1112131415
16171819202122232425262728293031323334353637383940
41424344
45
A B C D E F G H
ESTIMATED INDIRECT COST RATE DATA
SECTION I
Financial Data To Assist Indirect Cost Rate Determination
(Source document for the computation of the Indirect Cost Rate is found in the "Expenditures 15-22" tab.)
Support Services - Direct Costs (1-2000) and (5-2000)
Direction of Business Support Services (1-2510) and (5-2510)
Fiscal Services (1-2520) and (5-2520)
Operation and Maintenance of Plant Services (1, 2, and 5-2540)
Food Services (1-2560) Must be less than (P16, Col E-F, L62) 55,875
6,580
Internal Services (1-2570) and (5-2570)
Staff Services (1-2640) and (5-2640)
Data Processing Services (1-2660) and (5-2660)
SECTION II
Estimated Indirect Cost Rate for Federal Programs
Restricted Program Unrestricted Program
Function Indirect Costs Direct Costs Indirect Costs Direct Costs
Instruction 1000 639,128 639,128
Support Services:
Pupil 2100 3,828 3,828
Instructional Staff 2200 4,714 4,714
General Admin. 2300 152,961 152,961
School Admin 2400 32,715 32,715
Business:
Direction of Business Spt. Srv. 2510 0 0 0 0
Fiscal Services 2520 42,879 0 42,879 0
Oper. & Maint. Plant Services 2540 128,608 128,608 0
Pupil Transportation 2550 28,535 28,535
Food Services 2560 27,794 27,794
Internal Services 2570 0 0 0 0
Central:
Direction of Central Spt. Srv. 2610 0 0
Plan, Rsrch, Dvlp, Eval. Srv. 2620 0 0
Information Services 2630 0 0
Staff Services 2640 0 0 0 0
Data Processing Services 2660 0 0 0 0
Other: 2900 0 0
Community Services 3000 0 0
Total 42,879 1,018,283 171,487 889,675
Unrestricted Rate
Total Indirect Costs: 42,879 Total Indirect costs: 171,487
Total Direct Costs: 1,018,283 Total Direct Costs: 889,675
= 4.21% = 19.28%
ALL OBJECTS EXCLUDE CAPITAL OUTLAY. With the exception of line 11, enter the disbursements/expenditures included within the following functions charged directly to and reimbursed from
federal grant programs. Also, include all amounts paid to or for other employees within each function that work with specific federal grant programs in the same capacity as those charged to and
reimbursed from the same federal grant programs. For example, if a district received funding for a Title I clerk, all other salaries for Title I clerks performing like duties in that function must be
included. Include any benefits and/or purchased services paid on or to persons whose salaries are classified as direct costs in the function listed.
Restricted Rate
Value of Commodities Received for Fiscal Year 2016 (Include the value of commodities when determining if a Single
Audit is required) .
Print Date: 9/16/2016
Copy of N Wamac AFR 2016

1
2
34
567
8
9
1011121314151617181920212223242526
2728293031323334
35363738404142
43
A B C D E F G
REPORT ON SHARED SERVICES OR OUTSOURCING
School Code, Section 17-1.1 (Public Act 97-0357 )
Fiscal Year Ending June 30, 2016
Check if the schedule is not applicable.Prior
Fiscal Year
Current
Fiscal YearNext Fiscal Year
Name of the Local Education Agency (LEA) Participating in the Joint
Agreement, Cooperative or Shared Service.#####
Indicate with an (X) If Deficit Reduction Plan Is Required in the Budget
Service or Function ( Check all that apply )Barriers to
Implementation (Limit text to 200 characters, for additional space use line 33 and 38)
Curriculum Planning
Custodial Services
Educational Shared Programs
Employee Benefits
Energy Purchasing
Food Services
Grant Writing
Grounds Maintenance Services
Insurance
Investment Pools
Legal Services
Maintenance Services
Personnel Recruitment
Professional Development
Shared Personnel
Special Education Cooperatives X X X Kaskaskia Special Education District
STEM (science, technology, engineering and math) Program Offerings
Supply & Equipment Purchasing
Technology Services
Transportation
Vocational Education Cooperatives
All Other Joint/Cooperative Agreements
Other
Additional space for Column (D) - Barriers to Implementation:
Additional space for Column (E) - Name of LEA :
Complete the following for attempts to improve fiscal efficiency through shared services or outsourcing in the prior, current and next fiscal years.
00
Page 31

Page 32 Page 32
ILLINOIS STATE BOARD OF EDUCATION
School Business Services Division (N-330)
100 North First Street
Springfield, IL 62777-0001
LIMITATION OF ADMINISTRATIVE COSTS WORKSHEET School District Name:
RCDT Number:
Actual Expenditures, Fiscal Year 2016 Budgeted Expenditures, Fiscal Year 2017
(10) (20) (10) (20)
Funct.
No.Educational Fund
Operations &
Maintenance FundTotal Educational Fund
Operations &
Maintenance FundTotal
1. Executive Administration Services 2320 65,095 65,095 63,986 63,986
2. Special Area Administration Services 2330 0 0 0
3. Other Support Services - School Administration 2490 0 0 0
4. Direction of Business Support Services 2510 0 0 0 0
5. Internal Services 2570 0 0 0
6. Direction of Central Support Services 2610 0 0 0
7.0 0
8. Totals 65,095 0 65,095 63,986 0 63,986
9. -2%
CERTIFICATIONI certify that the amounts shown above as "Actual Expenditures, Fiscal Year 2016" agree with the amounts on the district's Annual Financial Report for Fiscal Year 2016.
I also certify that the amounts shown above as "Budgeted Expenditures, Fiscal Year 2017" agree with the amounts on the budget adopted by the Board of Education.
Signature of Superintendent
Contact Name
If line 9 is greater than 5% please check one box below.
The district will amend their budget to become in compliance with the limitation. Budget amendments must be adopted no later than June 30.
The District is ranked by ISBE in the lowest 25th percentile of like districts in administrative expenditures per student (4th quartile) and will waive the limitation by board action,
subsequent to a public hearing. Waiver resolution must be adopted no later than June 30.
The district is unable to waive the limitation by board action and will be requesting a waiver from the General Assembly pursuant to the procedures in Chapter 105 ILCS 5/2-3.25g.
Waiver applications must be postmarked by August 12, 2016 to ensure inclusion in the Fall 2016 report, postmarked by January 13, 2017 to ensure inclusion in the Spring 2017
report, or postmarked by August 11, 2017 to ensure inclusion in the Fall 2017 report. Information on the waiver process can be found at www.isbe.net/isbewaivers/default.htm.
North Wamac School District #186
(Section 17-1.5 of the School Code) 13-014-1860-02
Description
Deduct - Early Retirement or other pension obligations required
by state law and included above.
Percent Increase (Decrease) for FY2017 (Budgeted) over
FY2016 (Actual)
Date
Contact Telephone Number

Page 33 Page 33
Page 10, Line 74:
Educational:
Vending Machines 965$
Page 11, Line 107:
Educational:
Box Tops 378$
Commodity Credit 145
Grandparent Breakfast 135
Other 124
782$
Page 15, Line 41:
Student Activity Awards 2,534$
Page 18, Line 165:
Bond Agent Fees 500$
NOTE REGARDING PUBLIC ACT 99-0523 - DISTRICT REQUIRED FY2016 GSA EXPENDITURES FOR SPECIAL EDUCATION SERVICES
$678 of special education line item #1200 was paid with revenue code 3001, general state aid.
North Wamac School District #186
13-014-1860-02

Page 36 Page 36
1
2
3
4
5
6
7
8
9
10
11
12
13
A B C D E F G H
DescriptionEDUCATIONAL
FUND (10)
OPERATIONS &
MAINTENANCE
FUND (20)
TRANSPORTATION
FUND (40)
WORKING CASH
FUND (70)TOTAL
Direct Revenues 1,137,419 96,309 33,846 4,475 1,272,049
Direct Expenditures 1,068,017 119,611 27,824 1,215,452
Difference 69,402 (23,302) 6,022 4,475 56,597
Fund Balance - June 30, 2016 1,413,237 42,005 38,739 142,968 1,636,949
DEFICIT ANNUAL FINANCIAL REPORT (AFR) SUMMARY INFORMATION
New Provisions in the School Code, Section 17-1 (105 ILCS 5/17-1)
Balanced - no deficit reduction plan is required.
Instructions: If the Annual Financial Report (AFR) reflects that a "deficit reduction plan" is required as calculated below, then the school district is to complete the "deficit
reduction plan" in the annual budget and submit the plan to Illinois State Board of Education (ISBE) within 30 days after accepting the audit report. This may require the FY2017
annual budget to be amended to include a "deficit reduction plan" and narrative.
The "deficit reduction plan" is developed using ISBE guidelines and format in the School District Budget Form 50-36. A plan is required when the operating funds listed below
result in direct revenues (line 7) being less than direct expenditures (line 8) by an amount equal to or greater than one-third (1/3) of the ending fund balance (line 10). That is, if
the ending fund balance is less than three times the deficit spending, the district must adopt and submit an original budget/amended budget with ISBE that provides a "deficit
reduction plan" to balance the shortfall within the next three years.
DEFICIT AFR SUMMARY INFORMATION - Operating Funds Only
(All AFR pages must be completed to generate the following calculation)