Embed Size (px)
Citation preview
Nordic Customer Survey 2018
Total Tables Report
Sentio Research AS Report 15.11.2018
Table of content page
How do you receive your electricity bill? 1
Gender 2
Type of resident: 3
Do you use electricity to heat your home? 4
Approximately how many kilowatt-hours do you use each year? 5
How much money do you spend on electricity in total (supplier cost, network cost and taxes) in an
average winter month? 6
My electricity supplier is determined by where I live 7
As a customer I can choose my own electricity supplier 8
If I switch to another supplier, my meter has to be changed 9
If I switch to another supplier, it can effect the number of power cuts 10
If I switch to another supplier, the new supplier will be in charge of meter reading 11
Name the company that operates the power lines to your home 12
Who is the electricity supplierin your home 13
Can you name two other electricity suppliers? 14
Knowledge of electricity suppliers (TOTAL) 15
Knowledge of electicity market (TOTAL) 16
Have you ever signed a contract with an electricity supplier? 17
When did you last sign a contract with an electricity supplier? 18
Why did you sign a new electricity contract? 20
Have you ever compared your current electricity contract to other contracts? 21
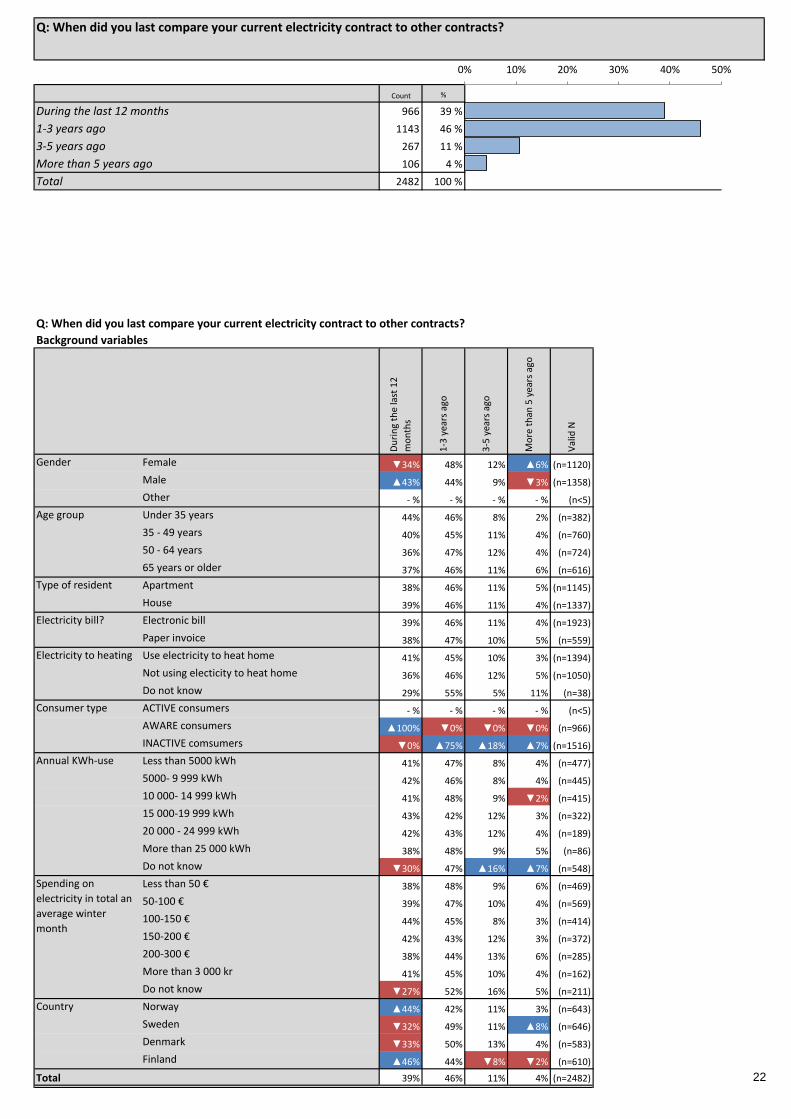
When did you last compare your current electricity contract to other contracts? 22
You have compared different offers but decided to stay in your current contract. Why? 24
Why have you not switched or compared contracts more often? 26
Why have you never switched or compared contracts? 28
Who initiated the signing of your current contract? 29
How did they contact you? 30
How did you go about choosing electricity contract? 31
[How your electricity price is set] When you think of your current electricity contract, are you aware of: 33
[If the price can change during the contract term] When you think of your current electricity contract,
are you aware of: 34
[The binding period (Binding period is the time that you will have to stay with the same supplier)] When
you think of your current electricity contract, are you aware of: 35
[The notice period of the contract (Notice period is the time that you have to stay with the supplier
after you have given a notice of termination)] When you think of your current electricity contract, are
you aware of: 36
[The consequence if you terminate the contract before the binding period expires] When you think of
your current electricity contract, are you aware of: 37
[If the contract is green (electricity from renewable energy sources, for example hydro, solar or wind)]
When you think of your current electricity contract, are you aware of: 38
[The effective unit rate where all fixed and variable fees are included] When you think of your current
electricity contract, are you aware of: 39
It was easy to find trustworthy information and necessary advice 40
It was easy and straightforward to sign an electricity contract 42
I could easily compare different electricity contracts with each other 44
I trusted the information and advice from sellers 46
There were many different electricity suppliers to choose from that meet my needs 48
There were many different products/contracts to choose from that meet my needs 50
It was easy to understand what is included in the price / agreement 52
I was well-informed 54
When you signed/compared your current electricity contract, did you visit an online comparison tool? 56
What comparison tool(s) did you visit online? 57
It will be easy to find trustworthy information and necessary advice 59

It will be easy and straightforward to sign an electricity contract 61
It will be easy to compare different electricity contracts with each other 63
I will trust the information and advice from sellers 65
There will be many different electricity suppliers to choose from that meet my needs 67
There will be many different contracts to choose from that meet my needs 69
It will be easy to understand what is included in the price / agreement 71
I will be well-informed 73
Do you know of any online comparison tools for electricity contracts? 75
What comparison tool(s) have you visited online? 76
It is easy to switch supplier 78
I regularly compare electricity contracts 80
I can save money by switching electricity contract 82
I would like to be better informed about the price I pay for electricity 84
My bill is simple and easy to understand 86
It is important to have a green electricity contract (electricity from renewable energy sources, for
example hydro, solar or wind) 88
I want to get updated information about my consumption (e.g. online or in an app) 90
I would prefer to get all my electricity costs on one bill instead of two separate bills from the supplier
and the network company 92
If you should switch supplier, how important would it be to get all electricity costs on one bill instead of
two separate bills from the supplier and the network company? 94
Do you read the information presented on your electricity bill? 95
[I look at the total amount I have to pay] What information do you read on your electricity bill? 96
[I look at the specification of the different price elements that my electricity cost is based on?] What
information do you read on your electricity bill? 97
[I look at the specification of the electricity consumption that my bill is based on] What information do
you read on your electricity bill? 98
[I look at the date when my contract expires] What information do you read on your electricity bill? 99
[I look at my estimated yearly consumption] What information do you read on your electricity bill? 100
[I look at my historical consumption] What information do you read on your electricity bill? 101
[I look at the information on how my electricity is produced (for example, hydro, nuclear, wind, fossil)]
What information do you read on your electricity bill? 102
[I look for notifications of changes that affect my electricity price] What information do you read on
your electricity bill? 103
[I look at the information about which bodies I can turn to for independent user advice, dispute
resolution or if I have complaints] What information do you read on your electricity bill? 104
[Other] What information do you read on your electricity bill? 105
How do you prefer to get information from your electricity supplier? 106
Count %
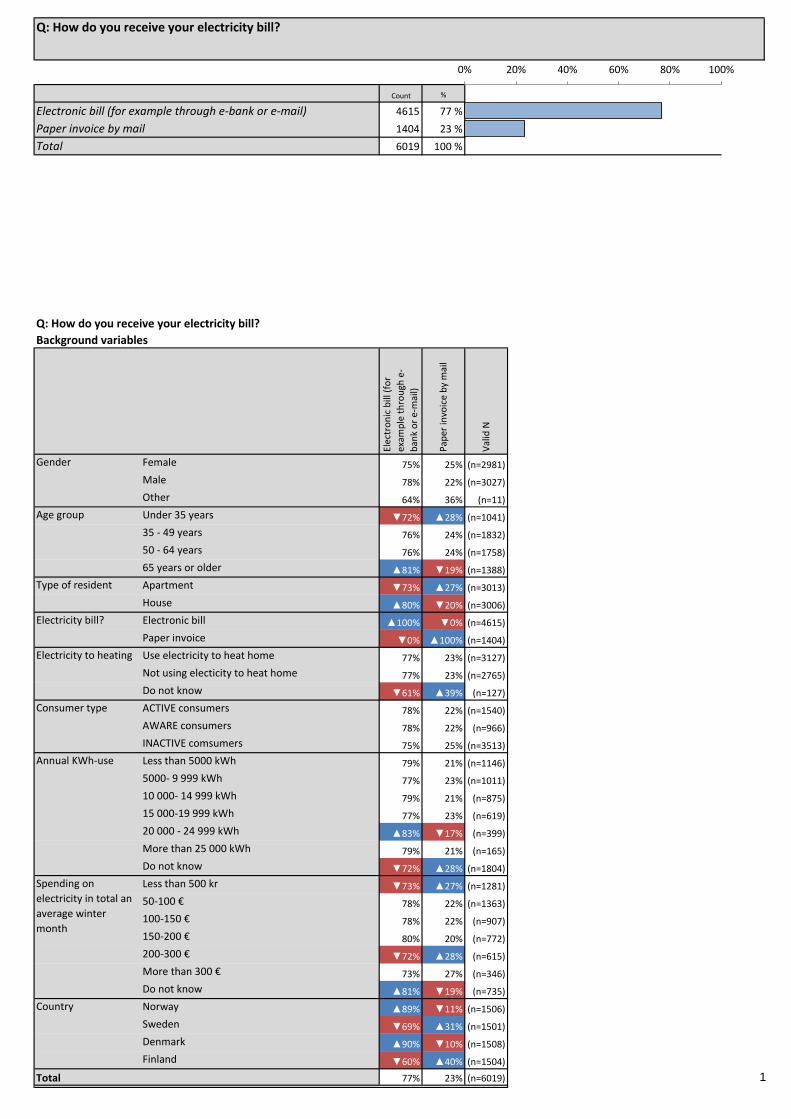
Electronic bill (for example through e-bank or e-mail) 4615 77 % 77 %
Paper invoice by mail 1404 23 % 23 %
Total 6019 100 % #N/A
#N/A #N/A #N/A
#N/A #N/A #N/A
#N/A #N/A #N/A
#N/A #N/A #N/A
#N/A #N/A #N/A
#N/A #N/A #N/A
#N/A #N/A #N/A
#N/A #N/A #N/A
Gender Female 75% 25% (n=2981) #N/A #N/A #N/A #N/A #N/A #N/A
Male 78% 22% (n=3027) #N/A #N/A #N/A #N/A #N/A #N/A
Other 64% 36% (n=11) #N/A #N/A #N/A #N/A #N/A #N/A
Age group Under 35 years ▼72% ▲28% (n=1041) #N/A #N/A #N/A #N/A #N/A #N/A
35 - 49 years 76% 24% (n=1832) #N/A #N/A #N/A #N/A #N/A #N/A
50 - 64 years 76% 24% (n=1758) #N/A #N/A #N/A #N/A #N/A #N/A
65 years or older ▲81% ▼19% (n=1388) #N/A #N/A #N/A #N/A #N/A #N/A
Type of resident Apartment ▼73% ▲27% (n=3013) #N/A #N/A #N/A #N/A #N/A #N/A
House ▲80% ▼20% (n=3006) #N/A #N/A #N/A #N/A #N/A #N/A
Electricity bill? Electronic bill ▲100% ▼0% (n=4615) #N/A #N/A #N/A #N/A #N/A #N/A
Paper invoice ▼0% ▲100% (n=1404) #N/A #N/A #N/A #N/A #N/A #N/A
Electricity to heating Use electricity to heat home 77% 23% (n=3127) #N/A #N/A #N/A #N/A #N/A #N/A
Not using electicity to heat home 77% 23% (n=2765) #N/A #N/A #N/A #N/A #N/A #N/A
Do not know ▼61% ▲39% (n=127) #N/A #N/A #N/A #N/A #N/A #N/A
Consumer type ACTIVE consumers 78% 22% (n=1540) #N/A #N/A #N/A #N/A #N/A #N/A
AWARE consumers 78% 22% (n=966) #N/A #N/A #N/A #N/A #N/A #N/A
INACTIVE comsumers 75% 25% (n=3513) #N/A #N/A #N/A #N/A #N/A #N/A
Less than 5000 kWh 79% 21% (n=1146) #N/A #N/A #N/A #N/A #N/A #N/A
5000- 9 999 kWh 77% 23% (n=1011) #N/A #N/A #N/A #N/A #N/A #N/A
10 000- 14 999 kWh 79% 21% (n=875) #N/A #N/A #N/A #N/A #N/A #N/A
15 000-19 999 kWh 77% 23% (n=619) #N/A #N/A #N/A #N/A #N/A #N/A
20 000 - 24 999 kWh ▲83% ▼17% (n=399) #N/A #N/A #N/A #N/A #N/A #N/A
More than 25 000 kWh 79% 21% (n=165) #N/A #N/A #N/A #N/A #N/A #N/A
Do not know ▼72% ▲28% (n=1804) #N/A #N/A #N/A #N/A #N/A #N/A
Less than 500 kr ▼73% ▲27% (n=1281) #N/A #N/A #N/A #N/A #N/A #N/A
50-100 € 78% 22% (n=1363) #N/A #N/A #N/A #N/A #N/A #N/A
100-150 € 78% 22% (n=907) #N/A #N/A #N/A #N/A #N/A #N/A
150-200 € 80% 20% (n=772) #N/A #N/A #N/A #N/A #N/A #N/A
200-300 € ▼72% ▲28% (n=615) #N/A #N/A #N/A #N/A #N/A #N/A
More than 300 € 73% 27% (n=346) #N/A #N/A #N/A #N/A #N/A #N/A
Do not know ▲81% ▼19% (n=735) #N/A #N/A #N/A #N/A #N/A #N/A
Country Norway ▲89% ▼11% (n=1506) #N/A #N/A #N/A #N/A #N/A #N/A
Sweden ▼69% ▲31% (n=1501) #N/A #N/A #N/A #N/A #N/A #N/A
Denmark ▲90% ▼10% (n=1508) #N/A #N/A #N/A #N/A #N/A #N/A
Finland ▼60% ▲40% (n=1504) #N/A #N/A #N/A #N/A #N/A #N/A
Total 77% 23% (n=6019) #N/A #N/A #N/A #N/A #N/A #N/A
Spending on
electricity in total an
average winter
month
Annual KWh-use
#N/A
#N/A
#N/A
Q: How do you receive your electricity bill?
Q: How do you receive your electricity bill?
Background variables
Elec
tro
nic
bill
(fo
r
exam
ple
th
rou
gh e
-
ban
k o
r e-
mai
l)
Pap
er in
voic
e b
y m
ail
Val
id N
#N/A
#N/A
#N/A
0% 20% 40% 60% 80% 100%
1
Count %
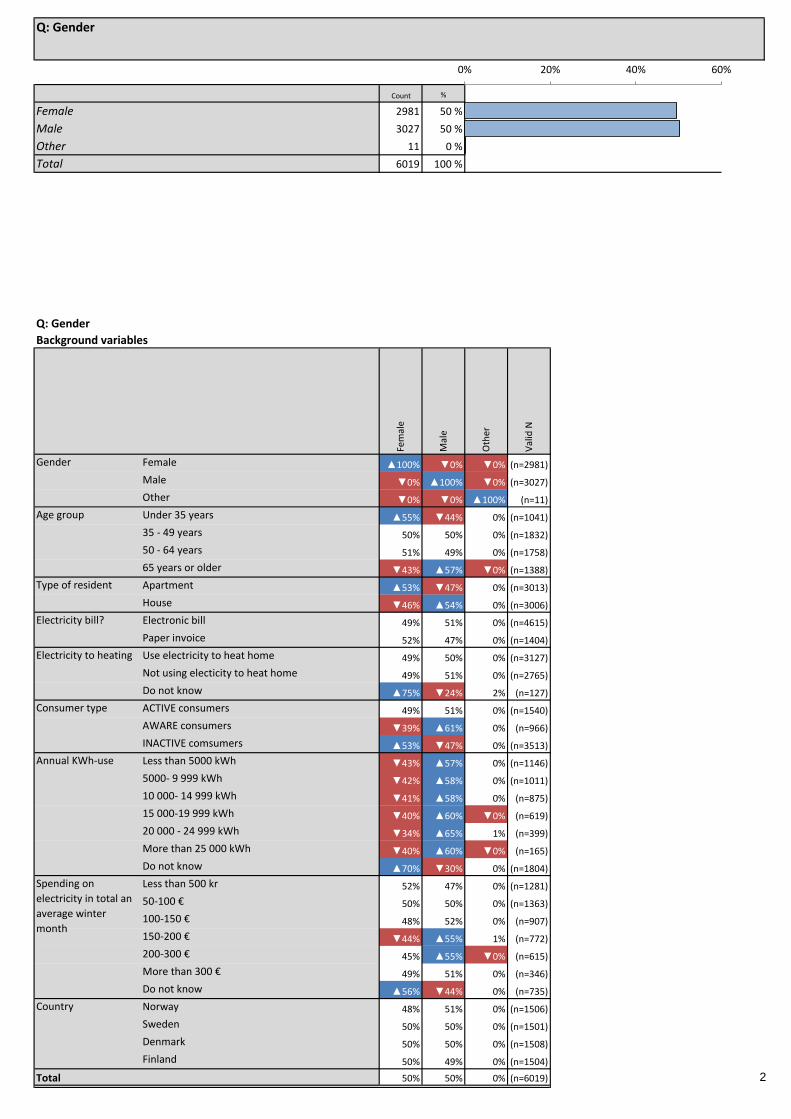
Female 2981 50 % 50 %
Male 3027 50 % 50 %
Other 11 0 % 0 %
Total 6019 100 % #N/A
#N/A #N/A #N/A
#N/A #N/A #N/A
#N/A #N/A #N/A
#N/A #N/A #N/A
#N/A #N/A #N/A
#N/A #N/A #N/A
#N/A #N/A #N/A
Gender Female ▲100% ▼0% ▼0% (n=2981) #N/A #N/A #N/A #N/A #N/A
Male ▼0% ▲100% ▼0% (n=3027) #N/A #N/A #N/A #N/A #N/A
Other ▼0% ▼0% ▲100% (n=11) #N/A #N/A #N/A #N/A #N/A
Age group Under 35 years ▲55% ▼44% 0% (n=1041) #N/A #N/A #N/A #N/A #N/A
35 - 49 years 50% 50% 0% (n=1832) #N/A #N/A #N/A #N/A #N/A
50 - 64 years 51% 49% 0% (n=1758) #N/A #N/A #N/A #N/A #N/A
65 years or older ▼43% ▲57% ▼0% (n=1388) #N/A #N/A #N/A #N/A #N/A
Type of resident Apartment ▲53% ▼47% 0% (n=3013) #N/A #N/A #N/A #N/A #N/A
House ▼46% ▲54% 0% (n=3006) #N/A #N/A #N/A #N/A #N/A
Electricity bill? Electronic bill 49% 51% 0% (n=4615) #N/A #N/A #N/A #N/A #N/A
Paper invoice 52% 47% 0% (n=1404) #N/A #N/A #N/A #N/A #N/A
Electricity to heating Use electricity to heat home 49% 50% 0% (n=3127) #N/A #N/A #N/A #N/A #N/A
Not using electicity to heat home 49% 51% 0% (n=2765) #N/A #N/A #N/A #N/A #N/A
Do not know ▲75% ▼24% 2% (n=127) #N/A #N/A #N/A #N/A #N/A
Consumer type ACTIVE consumers 49% 51% 0% (n=1540) #N/A #N/A #N/A #N/A #N/A
AWARE consumers ▼39% ▲61% 0% (n=966) #N/A #N/A #N/A #N/A #N/A
INACTIVE comsumers ▲53% ▼47% 0% (n=3513) #N/A #N/A #N/A #N/A #N/A
Less than 5000 kWh ▼43% ▲57% 0% (n=1146) #N/A #N/A #N/A #N/A #N/A
5000- 9 999 kWh ▼42% ▲58% 0% (n=1011) #N/A #N/A #N/A #N/A #N/A
10 000- 14 999 kWh ▼41% ▲58% 0% (n=875) #N/A #N/A #N/A #N/A #N/A
15 000-19 999 kWh ▼40% ▲60% ▼0% (n=619) #N/A #N/A #N/A #N/A #N/A
20 000 - 24 999 kWh ▼34% ▲65% 1% (n=399) #N/A #N/A #N/A #N/A #N/A
More than 25 000 kWh ▼40% ▲60% ▼0% (n=165) #N/A #N/A #N/A #N/A #N/A
Do not know ▲70% ▼30% 0% (n=1804) #N/A #N/A #N/A #N/A #N/A
Less than 500 kr 52% 47% 0% (n=1281) #N/A #N/A #N/A #N/A #N/A
50-100 € 50% 50% 0% (n=1363) #N/A #N/A #N/A #N/A #N/A
100-150 € 48% 52% 0% (n=907) #N/A #N/A #N/A #N/A #N/A
150-200 € ▼44% ▲55% 1% (n=772) #N/A #N/A #N/A #N/A #N/A
200-300 € 45% ▲55% ▼0% (n=615) #N/A #N/A #N/A #N/A #N/A
More than 300 € 49% 51% 0% (n=346) #N/A #N/A #N/A #N/A #N/A
Do not know ▲56% ▼44% 0% (n=735) #N/A #N/A #N/A #N/A #N/A
Country Norway 48% 51% 0% (n=1506) #N/A #N/A #N/A #N/A #N/A
Sweden 50% 50% 0% (n=1501) #N/A #N/A #N/A #N/A #N/A
Denmark 50% 50% 0% (n=1508) #N/A #N/A #N/A #N/A #N/A
Finland 50% 49% 0% (n=1504) #N/A #N/A #N/A #N/A #N/A
Total 50% 50% 0% (n=6019) #N/A #N/A #N/A #N/A #N/A
Spending on
electricity in total an
average winter
month
Annual KWh-use
#N/A
#N/A
#N/A
Q: Gender
Q: Gender
Background variables
Fem
ale
Mal
e
Oth
er
Val
id N
#N/A
#N/A
0% 20% 40% 60%
2

Count %
Apartment 3013 50 % 50 %
House 3006 50 % 50 %
Total 6019 100 % #N/A
#N/A #N/A #N/A
#N/A #N/A #N/A
#N/A #N/A #N/A
#N/A #N/A #N/A
#N/A #N/A #N/A
#N/A #N/A #N/A
#N/A #N/A #N/A
#N/A #N/A #N/A
Gender Female ▲54% ▼46% (n=2981) #N/A #N/A #N/A #N/A #N/A #N/A
Male ▼46% ▲54% (n=3027) #N/A #N/A #N/A #N/A #N/A #N/A
Other 55% 45% (n=11) #N/A #N/A #N/A #N/A #N/A #N/A
Age group Under 35 years ▲66% ▼34% (n=1041) #N/A #N/A #N/A #N/A #N/A #N/A
35 - 49 years 50% 50% (n=1832) #N/A #N/A #N/A #N/A #N/A #N/A
50 - 64 years 48% 52% (n=1758) #N/A #N/A #N/A #N/A #N/A #N/A
65 years or older ▼42% ▲58% (n=1388) #N/A #N/A #N/A #N/A #N/A #N/A
Type of resident Apartment ▲100% ▼0% (n=3013) #N/A #N/A #N/A #N/A #N/A #N/A
House ▼0% ▲100% (n=3006) #N/A #N/A #N/A #N/A #N/A #N/A
Electricity bill? Electronic bill ▼48% ▲52% (n=4615) #N/A #N/A #N/A #N/A #N/A #N/A
Paper invoice ▲57% ▼43% (n=1404) #N/A #N/A #N/A #N/A #N/A #N/A
Electricity to heating Use electricity to heat home ▼40% ▲60% (n=3127) #N/A #N/A #N/A #N/A #N/A #N/A
Not using electicity to heat home ▲59% ▼41% (n=2765) #N/A #N/A #N/A #N/A #N/A #N/A
Do not know ▲87% ▼13% (n=127) #N/A #N/A #N/A #N/A #N/A #N/A
Consumer type ACTIVE consumers ▲53% ▼47% (n=1540) #N/A #N/A #N/A #N/A #N/A #N/A
AWARE consumers ▼45% ▲55% (n=966) #N/A #N/A #N/A #N/A #N/A #N/A
INACTIVE comsumers 50% 50% (n=3513) #N/A #N/A #N/A #N/A #N/A #N/A
Less than 5000 kWh ▲73% ▼27% (n=1146) #N/A #N/A #N/A #N/A #N/A #N/A
5000- 9 999 kWh 53% 47% (n=1011) #N/A #N/A #N/A #N/A #N/A #N/A
10 000- 14 999 kWh ▼40% ▲60% (n=875) #N/A #N/A #N/A #N/A #N/A #N/A
15 000-19 999 kWh ▼23% ▲77% (n=619) #N/A #N/A #N/A #N/A #N/A #N/A
20 000 - 24 999 kWh ▼11% ▲89% (n=399) #N/A #N/A #N/A #N/A #N/A #N/A
More than 25 000 kWh ▼7% ▲93% (n=165) #N/A #N/A #N/A #N/A #N/A #N/A
Do not know ▲61% ▼39% (n=1804) #N/A #N/A #N/A #N/A #N/A #N/A
Less than 500 kr ▲87% ▼13% (n=1281) #N/A #N/A #N/A #N/A #N/A #N/A
50-100 € ▲63% ▼37% (n=1363) #N/A #N/A #N/A #N/A #N/A #N/A
100-150 € ▼42% ▲58% (n=907) #N/A #N/A #N/A #N/A #N/A #N/A
150-200 € ▼26% ▲74% (n=772) #N/A #N/A #N/A #N/A #N/A #N/A
200-300 € ▼19% ▲81% (n=615) #N/A #N/A #N/A #N/A #N/A #N/A
More than 300 € ▼11% ▲89% (n=346) #N/A #N/A #N/A #N/A #N/A #N/A
Do not know ▼41% ▲59% (n=735) #N/A #N/A #N/A #N/A #N/A #N/A
Country Norway ▼42% ▲58% (n=1506) #N/A #N/A #N/A #N/A #N/A #N/A
Sweden ▲54% ▼46% (n=1501) #N/A #N/A #N/A #N/A #N/A #N/A
Denmark ▼39% ▲61% (n=1508) #N/A #N/A #N/A #N/A #N/A #N/A
Finland ▲65% ▼35% (n=1504) #N/A #N/A #N/A #N/A #N/A #N/A
Total 50% 50% (n=6019) #N/A #N/A #N/A #N/A #N/A #N/A
Spending on
electricity in total an
average winter
month
Annual KWh-use
#N/A
#N/A
#N/A
Q: Type of resident:
Q: Type of resident:
Background variables
Ap
artm
ent
Ho
use
Val
id N
#N/A
#N/A
#N/A
0% 20% 40% 60%
3
Count %
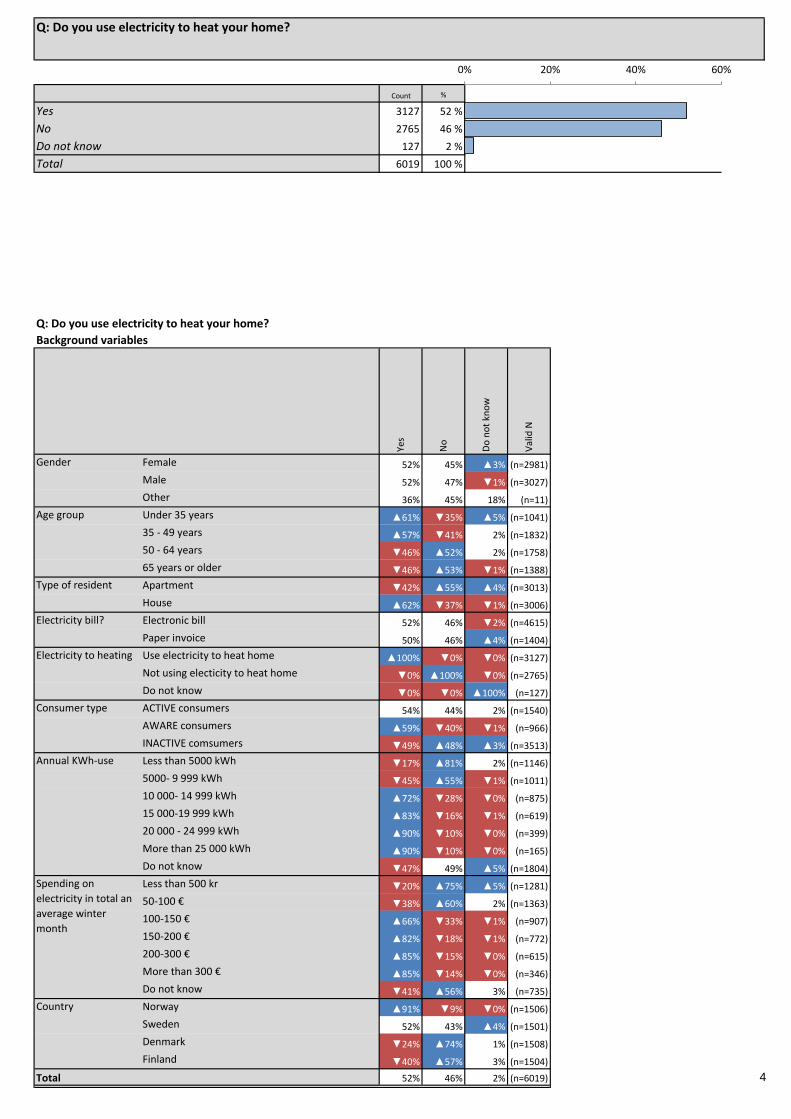
Yes 3127 52 % 52 %
No 2765 46 % 46 %
Do not know 127 2 % 2 %
Total 6019 100 % #N/A
#N/A #N/A #N/A
#N/A #N/A #N/A
#N/A #N/A #N/A
#N/A #N/A #N/A
#N/A #N/A #N/A
#N/A #N/A #N/A
#N/A #N/A #N/A
Gender Female 52% 45% ▲3% (n=2981) #N/A #N/A #N/A #N/A #N/A
Male 52% 47% ▼1% (n=3027) #N/A #N/A #N/A #N/A #N/A
Other 36% 45% 18% (n=11) #N/A #N/A #N/A #N/A #N/A
Age group Under 35 years ▲61% ▼35% ▲5% (n=1041) #N/A #N/A #N/A #N/A #N/A
35 - 49 years ▲57% ▼41% 2% (n=1832) #N/A #N/A #N/A #N/A #N/A
50 - 64 years ▼46% ▲52% 2% (n=1758) #N/A #N/A #N/A #N/A #N/A
65 years or older ▼46% ▲53% ▼1% (n=1388) #N/A #N/A #N/A #N/A #N/A
Type of resident Apartment ▼42% ▲55% ▲4% (n=3013) #N/A #N/A #N/A #N/A #N/A
House ▲62% ▼37% ▼1% (n=3006) #N/A #N/A #N/A #N/A #N/A
Electricity bill? Electronic bill 52% 46% ▼2% (n=4615) #N/A #N/A #N/A #N/A #N/A
Paper invoice 50% 46% ▲4% (n=1404) #N/A #N/A #N/A #N/A #N/A
Electricity to heating Use electricity to heat home ▲100% ▼0% ▼0% (n=3127) #N/A #N/A #N/A #N/A #N/A
Not using electicity to heat home ▼0% ▲100% ▼0% (n=2765) #N/A #N/A #N/A #N/A #N/A
Do not know ▼0% ▼0% ▲100% (n=127) #N/A #N/A #N/A #N/A #N/A
Consumer type ACTIVE consumers 54% 44% 2% (n=1540) #N/A #N/A #N/A #N/A #N/A
AWARE consumers ▲59% ▼40% ▼1% (n=966) #N/A #N/A #N/A #N/A #N/A
INACTIVE comsumers ▼49% ▲48% ▲3% (n=3513) #N/A #N/A #N/A #N/A #N/A
Less than 5000 kWh ▼17% ▲81% 2% (n=1146) #N/A #N/A #N/A #N/A #N/A
5000- 9 999 kWh ▼45% ▲55% ▼1% (n=1011) #N/A #N/A #N/A #N/A #N/A
10 000- 14 999 kWh ▲72% ▼28% ▼0% (n=875) #N/A #N/A #N/A #N/A #N/A
15 000-19 999 kWh ▲83% ▼16% ▼1% (n=619) #N/A #N/A #N/A #N/A #N/A
20 000 - 24 999 kWh ▲90% ▼10% ▼0% (n=399) #N/A #N/A #N/A #N/A #N/A
More than 25 000 kWh ▲90% ▼10% ▼0% (n=165) #N/A #N/A #N/A #N/A #N/A
Do not know ▼47% 49% ▲5% (n=1804) #N/A #N/A #N/A #N/A #N/A
Less than 500 kr ▼20% ▲75% ▲5% (n=1281) #N/A #N/A #N/A #N/A #N/A
50-100 € ▼38% ▲60% 2% (n=1363) #N/A #N/A #N/A #N/A #N/A
100-150 € ▲66% ▼33% ▼1% (n=907) #N/A #N/A #N/A #N/A #N/A
150-200 € ▲82% ▼18% ▼1% (n=772) #N/A #N/A #N/A #N/A #N/A
200-300 € ▲85% ▼15% ▼0% (n=615) #N/A #N/A #N/A #N/A #N/A
More than 300 € ▲85% ▼14% ▼0% (n=346) #N/A #N/A #N/A #N/A #N/A
Do not know ▼41% ▲56% 3% (n=735) #N/A #N/A #N/A #N/A #N/A
Country Norway ▲91% ▼9% ▼0% (n=1506) #N/A #N/A #N/A #N/A #N/A
Sweden 52% 43% ▲4% (n=1501) #N/A #N/A #N/A #N/A #N/A
Denmark ▼24% ▲74% 1% (n=1508) #N/A #N/A #N/A #N/A #N/A
Finland ▼40% ▲57% 3% (n=1504) #N/A #N/A #N/A #N/A #N/A
Total 52% 46% 2% (n=6019) #N/A #N/A #N/A #N/A #N/A
Spending on
electricity in total an
average winter
month
Annual KWh-use
#N/A
#N/A
#N/A
Q: Do you use electricity to heat your home?
Q: Do you use electricity to heat your home?
Background variables
Yes
No
Do
no
t kn
ow
Val
id N
#N/A
#N/A
0% 20% 40% 60%
4
Count %
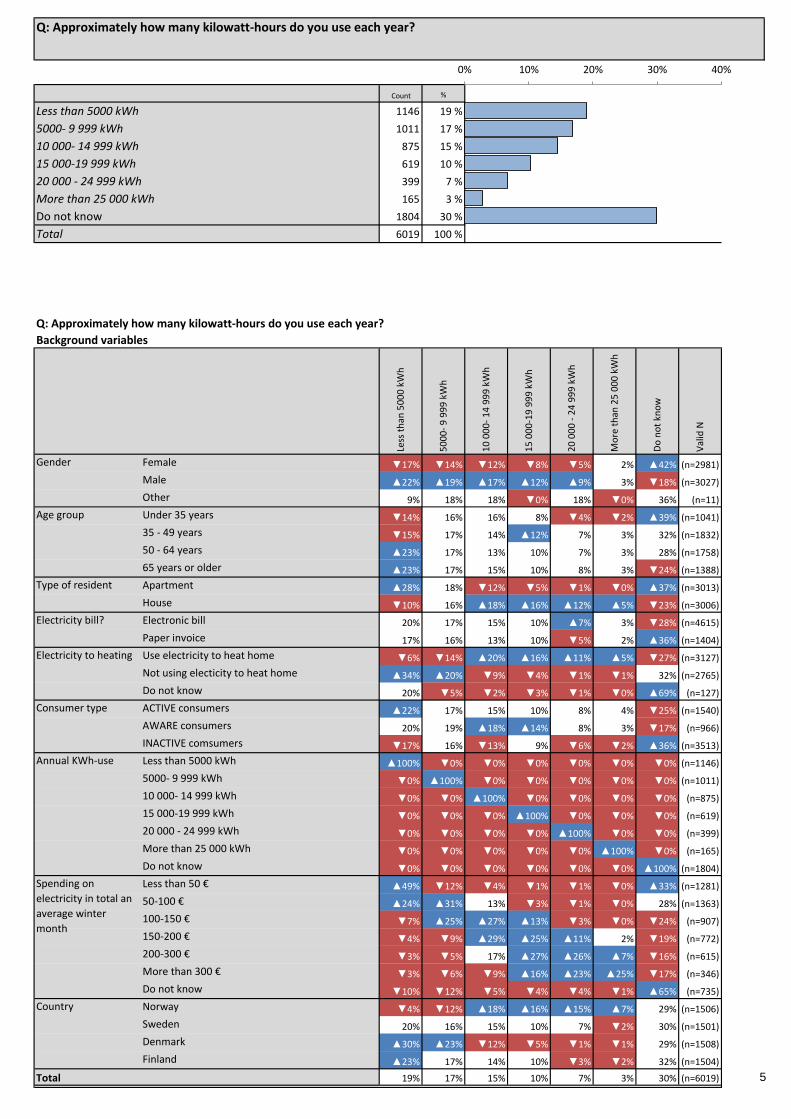
Less than 5000 kWh 1146 19 % 19 %
5000- 9 999 kWh 1011 17 % 17 %
10 000- 14 999 kWh 875 15 % 15 %
15 000-19 999 kWh 619 10 % 10 %
20 000 - 24 999 kWh 399 7 % 7 %
More than 25 000 kWh 165 3 % 3 %
Do not know 1804 30 % 30 %
Total 6019 100 % #N/A
#N/A #N/A #N/A
#N/A #N/A #N/A
#N/A #N/A #N/A
Gender Female ▼17% ▼14% ▼12% ▼8% ▼5% 2% ▲42% (n=2981) #N/A
Male ▲22% ▲19% ▲17% ▲12% ▲9% 3% ▼18% (n=3027) #N/A
Other 9% 18% 18% ▼0% 18% ▼0% 36% (n=11) #N/A
Age group Under 35 years ▼14% 16% 16% 8% ▼4% ▼2% ▲39% (n=1041) #N/A
35 - 49 years ▼15% 17% 14% ▲12% 7% 3% 32% (n=1832) #N/A
50 - 64 years ▲23% 17% 13% 10% 7% 3% 28% (n=1758) #N/A
65 years or older ▲23% 17% 15% 10% 8% 3% ▼24% (n=1388) #N/A
Type of resident Apartment ▲28% 18% ▼12% ▼5% ▼1% ▼0% ▲37% (n=3013) #N/A
House ▼10% 16% ▲18% ▲16% ▲12% ▲5% ▼23% (n=3006) #N/A
Electricity bill? Electronic bill 20% 17% 15% 10% ▲7% 3% ▼28% (n=4615) #N/A
Paper invoice 17% 16% 13% 10% ▼5% 2% ▲36% (n=1404) #N/A
Electricity to heating Use electricity to heat home ▼6% ▼14% ▲20% ▲16% ▲11% ▲5% ▼27% (n=3127) #N/A
Not using electicity to heat home ▲34% ▲20% ▼9% ▼4% ▼1% ▼1% 32% (n=2765) #N/A
Do not know 20% ▼5% ▼2% ▼3% ▼1% ▼0% ▲69% (n=127) #N/A
Consumer type ACTIVE consumers ▲22% 17% 15% 10% 8% 4% ▼25% (n=1540) #N/A
AWARE consumers 20% 19% ▲18% ▲14% 8% 3% ▼17% (n=966) #N/A
INACTIVE comsumers ▼17% 16% ▼13% 9% ▼6% ▼2% ▲36% (n=3513) #N/A
Less than 5000 kWh ▲100% ▼0% ▼0% ▼0% ▼0% ▼0% ▼0% (n=1146) #N/A
5000- 9 999 kWh ▼0% ▲100% ▼0% ▼0% ▼0% ▼0% ▼0% (n=1011) #N/A
10 000- 14 999 kWh ▼0% ▼0% ▲100% ▼0% ▼0% ▼0% ▼0% (n=875) #N/A
15 000-19 999 kWh ▼0% ▼0% ▼0% ▲100% ▼0% ▼0% ▼0% (n=619) #N/A
20 000 - 24 999 kWh ▼0% ▼0% ▼0% ▼0% ▲100% ▼0% ▼0% (n=399) #N/A
More than 25 000 kWh ▼0% ▼0% ▼0% ▼0% ▼0% ▲100% ▼0% (n=165) #N/A
Do not know ▼0% ▼0% ▼0% ▼0% ▼0% ▼0% ▲100% (n=1804) #N/A
Less than 50 € ▲49% ▼12% ▼4% ▼1% ▼1% ▼0% ▲33% (n=1281) #N/A
50-100 € ▲24% ▲31% 13% ▼3% ▼1% ▼0% 28% (n=1363) #N/A
100-150 € ▼7% ▲25% ▲27% ▲13% ▼3% ▼0% ▼24% (n=907) #N/A
150-200 € ▼4% ▼9% ▲29% ▲25% ▲11% 2% ▼19% (n=772) #N/A
200-300 € ▼3% ▼5% 17% ▲27% ▲26% ▲7% ▼16% (n=615) #N/A
More than 300 € ▼3% ▼6% ▼9% ▲16% ▲23% ▲25% ▼17% (n=346) #N/A
Do not know ▼10% ▼12% ▼5% ▼4% ▼4% ▼1% ▲65% (n=735) #N/A
Country Norway ▼4% ▼12% ▲18% ▲16% ▲15% ▲7% 29% (n=1506) #N/A
Sweden 20% 16% 15% 10% 7% ▼2% 30% (n=1501) #N/A
Denmark ▲30% ▲23% ▼12% ▼5% ▼1% ▼1% 29% (n=1508) #N/A
Finland ▲23% 17% 14% 10% ▼3% ▼2% 32% (n=1504) #N/A
Total 19% 17% 15% 10% 7% 3% 30% (n=6019) #N/A
Spending on
electricity in total an
average winter
month
Annual KWh-use
Do
no
t kn
ow
Val
id N
#N/A
Q: Approximately how many kilowatt-hours do you use each year?
Q: Approximately how many kilowatt-hours do you use each year?
Background variables
Less
th
an 5
00
0 k
Wh
50
00
- 9
99
9 k
Wh
10
00
0-
14
99
9 k
Wh
15
00
0-1
9 9
99
kW
h
20
00
0 -
24
99
9 k
Wh
Mo
re t
han
25
00
0 k
Wh
0% 10% 20% 30% 40%
5

Count %
Less than 50 € 1281 21 % 21 %
50-100 € 1363 23 % 23 %
100-150 € 907 15 % 15 %
150-200 € 772 13 % 13 %
200-300 € 615 10 % 10 %
More than 300 € 346 6 % 6 %
Do not know 735 12 % 12 %
Total 6019 100 % #N/A
#N/A #N/A #N/A
#N/A #N/A #N/A
#N/A #N/A #N/A
Gender Female 23% 23% 14% ▼11% 9% 6% ▲14% (n=2981) #N/A
Male 20% 23% 16% ▲14% 11% 6% ▼11% (n=3027) #N/A
Other 18% 18% 9% 36% ▼0% 9% 9% (n=11) #N/A
Age group Under 35 years ▲25% 24% 15% 12% 10% 5% ▼10% (n=1041) #N/A
35 - 49 years ▼18% 22% 16% 14% 12% 6% 12% (n=1832) #N/A
50 - 64 years 23% 22% 15% 11% 9% 6% 13% (n=1758) #N/A
65 years or older 20% 23% 14% 13% 10% 6% 14% (n=1388) #N/A
Type of resident Apartment ▲37% ▲29% ▼13% ▼7% ▼4% ▼1% ▼10% (n=3013) #N/A
House ▼5% ▼17% ▲18% ▲19% ▲17% ▲10% ▲15% (n=3006) #N/A
Electricity bill? Electronic bill ▼20% 23% 15% 13% ▼10% 5% ▲13% (n=4615) #N/A
Paper invoice ▲24% 22% 14% 11% ▲12% 7% ▼10% (n=1404) #N/A
Electricity to heating Use electricity to heat home ▼8% ▼17% ▲19% ▲20% ▲17% ▲9% ▼10% (n=3127) #N/A
Not using electicity to heat home ▲35% ▲29% ▼11% ▼5% ▼3% ▼2% ▲15% (n=2765) #N/A
Do not know ▲46% 21% ▼7% ▼4% ▼2% ▼1% 19% (n=127) #N/A
Consumer type ACTIVE consumers 23% 23% 14% 12% 11% 7% ▼10% (n=1540) #N/A
AWARE consumers ▼18% 23% ▲19% ▲16% 11% 7% ▼6% (n=966) #N/A
INACTIVE comsumers 22% 22% 15% 12% 9% ▼5% ▲15% (n=3513) #N/A
Less than 5000 kWh ▲55% ▲29% ▼5% ▼3% ▼2% ▼1% ▼6% (n=1146) #N/A
5000- 9 999 kWh ▼15% ▲42% ▲23% ▼7% ▼3% ▼2% ▼8% (n=1011) #N/A
10 000- 14 999 kWh ▼6% 20% ▲28% ▲26% 12% ▼4% ▼5% (n=875) #N/A
15 000-19 999 kWh ▼3% ▼7% ▲20% ▲31% ▲27% ▲9% ▼4% (n=619) #N/A
20 000 - 24 999 kWh ▼2% ▼3% ▼8% ▲22% ▲40% ▲20% ▼7% (n=399) #N/A
More than 25 000 kWh ▼0% ▼3% ▼1% 10% ▲27% ▲53% ▼5% (n=165) #N/A
Do not know ▲24% 21% ▼12% ▼8% ▼5% ▼3% ▲26% (n=1804) #N/A
Less than 50 € ▲100% ▼0% ▼0% ▼0% ▼0% ▼0% ▼0% (n=1281) #N/A
50-100 € ▼0% ▲100% ▼0% ▼0% ▼0% ▼0% ▼0% (n=1363) #N/A
100-150 € ▼0% ▼0% ▲100% ▼0% ▼0% ▼0% ▼0% (n=907) #N/A
150-200 € ▼0% ▼0% ▼0% ▲100% ▼0% ▼0% ▼0% (n=772) #N/A
200-300 € ▼0% ▼0% ▼0% ▼0% ▲100% ▼0% ▼0% (n=615) #N/A
More than 300 € ▼0% ▼0% ▼0% ▼0% ▼0% ▲100% ▼0% (n=346) #N/A
Do not know ▼0% ▼0% ▼0% ▼0% ▼0% ▼0% ▲100% (n=735) #N/A
Country Norway ▼5% ▼17% ▲23% ▲21% ▲16% ▲9% ▼10% (n=1506) #N/A
Sweden ▲27% 22% ▼11% 12% 12% 6% ▼10% (n=1501) #N/A
Denmark 22% ▲28% 14% ▼8% ▼5% ▼2% ▲21% (n=1508) #N/A
Finland ▲31% 25% ▼12% ▼10% 9% 5% ▼8% (n=1504) #N/A
Total 21% 23% 15% 13% 10% 6% 12% (n=6019) #N/A
Spending on
electricity in total an
average winter
month
Annual KWh-use
Do
no
t kn
ow
Val
id N
#N/A
Q: How much money do you spend on electricity in total (supplier cost, network cost and taxes) in an average winter month?
Q: How much money do you spend on electricity in total (supplier cost, network cost and taxes) in an average winter month?
Background variables
Less
th
an 5
0 €
50
-10
0 €
10
0-1
50
€
15
0-2
00
€
20
0-3
00
€
Mo
re t
han
30
0 €
0% 5% 10% 15% 20% 25%
6
Count %
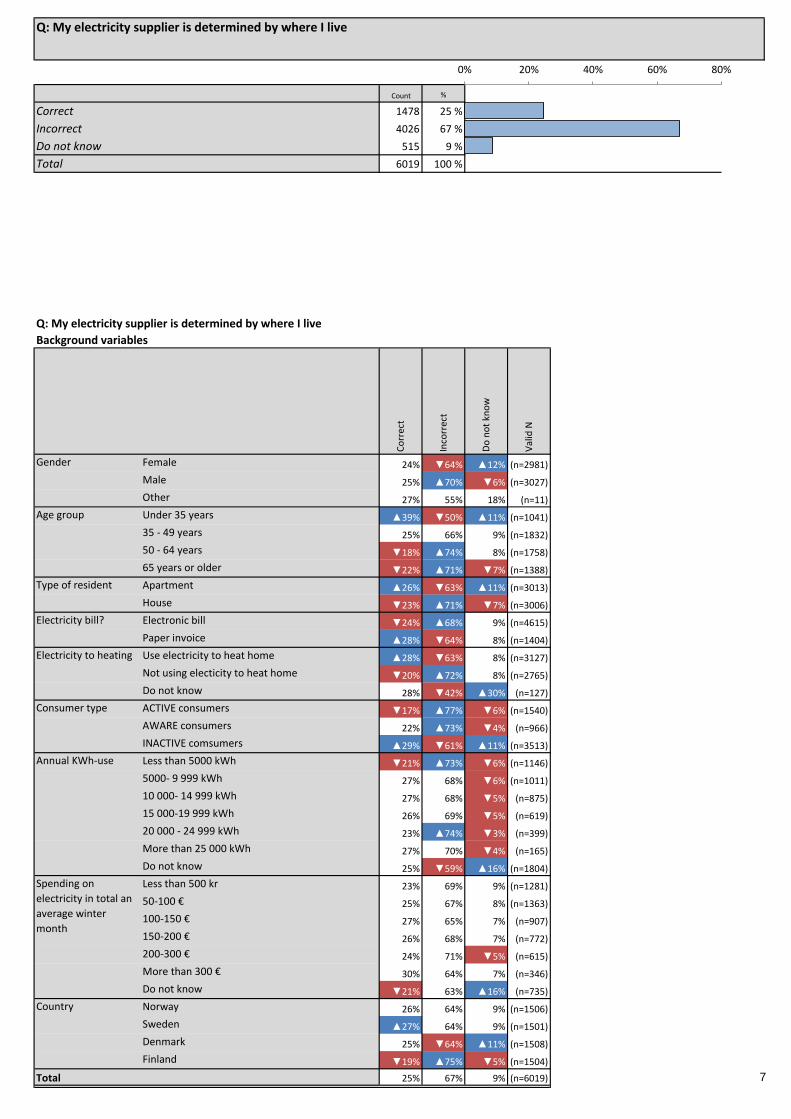
Correct 1478 25 % 25 %
Incorrect 4026 67 % 67 %
Do not know 515 9 % 9 %
Total 6019 100 % #N/A
#N/A #N/A #N/A
#N/A #N/A #N/A
#N/A #N/A #N/A
#N/A #N/A #N/A
#N/A #N/A #N/A
#N/A #N/A #N/A
#N/A #N/A #N/A
Gender Female 24% ▼64% ▲12% (n=2981) #N/A #N/A #N/A #N/A #N/A
Male 25% ▲70% ▼6% (n=3027) #N/A #N/A #N/A #N/A #N/A
Other 27% 55% 18% (n=11) #N/A #N/A #N/A #N/A #N/A
Age group Under 35 years ▲39% ▼50% ▲11% (n=1041) #N/A #N/A #N/A #N/A #N/A
35 - 49 years 25% 66% 9% (n=1832) #N/A #N/A #N/A #N/A #N/A
50 - 64 years ▼18% ▲74% 8% (n=1758) #N/A #N/A #N/A #N/A #N/A
65 years or older ▼22% ▲71% ▼7% (n=1388) #N/A #N/A #N/A #N/A #N/A
Type of resident Apartment ▲26% ▼63% ▲11% (n=3013) #N/A #N/A #N/A #N/A #N/A
House ▼23% ▲71% ▼7% (n=3006) #N/A #N/A #N/A #N/A #N/A
Electricity bill? Electronic bill ▼24% ▲68% 9% (n=4615) #N/A #N/A #N/A #N/A #N/A
Paper invoice ▲28% ▼64% 8% (n=1404) #N/A #N/A #N/A #N/A #N/A
Electricity to heating Use electricity to heat home ▲28% ▼63% 8% (n=3127) #N/A #N/A #N/A #N/A #N/A
Not using electicity to heat home ▼20% ▲72% 8% (n=2765) #N/A #N/A #N/A #N/A #N/A
Do not know 28% ▼42% ▲30% (n=127) #N/A #N/A #N/A #N/A #N/A
Consumer type ACTIVE consumers ▼17% ▲77% ▼6% (n=1540) #N/A #N/A #N/A #N/A #N/A
AWARE consumers 22% ▲73% ▼4% (n=966) #N/A #N/A #N/A #N/A #N/A
INACTIVE comsumers ▲29% ▼61% ▲11% (n=3513) #N/A #N/A #N/A #N/A #N/A
Less than 5000 kWh ▼21% ▲73% ▼6% (n=1146) #N/A #N/A #N/A #N/A #N/A
5000- 9 999 kWh 27% 68% ▼6% (n=1011) #N/A #N/A #N/A #N/A #N/A
10 000- 14 999 kWh 27% 68% ▼5% (n=875) #N/A #N/A #N/A #N/A #N/A
15 000-19 999 kWh 26% 69% ▼5% (n=619) #N/A #N/A #N/A #N/A #N/A
20 000 - 24 999 kWh 23% ▲74% ▼3% (n=399) #N/A #N/A #N/A #N/A #N/A
More than 25 000 kWh 27% 70% ▼4% (n=165) #N/A #N/A #N/A #N/A #N/A
Do not know 25% ▼59% ▲16% (n=1804) #N/A #N/A #N/A #N/A #N/A
Less than 500 kr 23% 69% 9% (n=1281) #N/A #N/A #N/A #N/A #N/A
50-100 € 25% 67% 8% (n=1363) #N/A #N/A #N/A #N/A #N/A
100-150 € 27% 65% 7% (n=907) #N/A #N/A #N/A #N/A #N/A
150-200 € 26% 68% 7% (n=772) #N/A #N/A #N/A #N/A #N/A
200-300 € 24% 71% ▼5% (n=615) #N/A #N/A #N/A #N/A #N/A
More than 300 € 30% 64% 7% (n=346) #N/A #N/A #N/A #N/A #N/A
Do not know ▼21% 63% ▲16% (n=735) #N/A #N/A #N/A #N/A #N/A
Country Norway 26% 64% 9% (n=1506) #N/A #N/A #N/A #N/A #N/A
Sweden ▲27% 64% 9% (n=1501) #N/A #N/A #N/A #N/A #N/A
Denmark 25% ▼64% ▲11% (n=1508) #N/A #N/A #N/A #N/A #N/A
Finland ▼19% ▲75% ▼5% (n=1504) #N/A #N/A #N/A #N/A #N/A
Total 25% 67% 9% (n=6019) #N/A #N/A #N/A #N/A #N/A
Spending on
electricity in total an
average winter
month
Annual KWh-use
#N/A
#N/A
#N/A
Q: My electricity supplier is determined by where I live
Q: My electricity supplier is determined by where I live
Background variables
Co
rrec
t
Inco
rrec
t
Do
no
t kn
ow
Val
id N
#N/A
#N/A
0% 20% 40% 60% 80%
7
Count %
Correct 5464 91 % 91 %
Incorrect 336 6 % 6 %
Do not know 219 4 % 4 %
Total 6019 100 % #N/A
#N/A #N/A #N/A
#N/A #N/A #N/A
#N/A #N/A #N/A
#N/A #N/A #N/A
#N/A #N/A #N/A
#N/A #N/A #N/A
#N/A #N/A #N/A
Gender Female 90% 5% 4% (n=2981) #N/A #N/A #N/A #N/A #N/A
Male 91% 6% 3% (n=3027) #N/A #N/A #N/A #N/A #N/A
Other 91% ▼0% 9% (n=11) #N/A #N/A #N/A #N/A #N/A
Age group Under 35 years ▼82% ▲11% ▲7% (n=1041) #N/A #N/A #N/A #N/A #N/A
35 - 49 years 91% 6% 4% (n=1832) #N/A #N/A #N/A #N/A #N/A
50 - 64 years ▲93% ▼4% 3% (n=1758) #N/A #N/A #N/A #N/A #N/A
65 years or older ▲94% ▼4% ▼2% (n=1388) #N/A #N/A #N/A #N/A #N/A
Type of resident Apartment ▼89% ▲7% 4% (n=3013) #N/A #N/A #N/A #N/A #N/A
House ▲92% ▼5% 3% (n=3006) #N/A #N/A #N/A #N/A #N/A
Electricity bill? Electronic bill ▲91% ▼5% 4% (n=4615) #N/A #N/A #N/A #N/A #N/A
Paper invoice ▼89% ▲7% 4% (n=1404) #N/A #N/A #N/A #N/A #N/A
Electricity to heating Use electricity to heat home ▼90% ▲7% 4% (n=3127) #N/A #N/A #N/A #N/A #N/A
Not using electicity to heat home ▲92% ▼4% 4% (n=2765) #N/A #N/A #N/A #N/A #N/A
Do not know ▼83% 9% 8% (n=127) #N/A #N/A #N/A #N/A #N/A
Consumer type ACTIVE consumers ▲95% ▼3% ▼2% (n=1540) #N/A #N/A #N/A #N/A #N/A
AWARE consumers ▲93% 6% ▼1% (n=966) #N/A #N/A #N/A #N/A #N/A
INACTIVE comsumers ▼88% ▲7% ▲5% (n=3513) #N/A #N/A #N/A #N/A #N/A
Less than 5000 kWh ▲93% 5% ▼2% (n=1146) #N/A #N/A #N/A #N/A #N/A
5000- 9 999 kWh 91% 6% 3% (n=1011) #N/A #N/A #N/A #N/A #N/A
10 000- 14 999 kWh 91% 7% ▼2% (n=875) #N/A #N/A #N/A #N/A #N/A
15 000-19 999 kWh 91% 6% 3% (n=619) #N/A #N/A #N/A #N/A #N/A
20 000 - 24 999 kWh ▲94% 4% ▼2% (n=399) #N/A #N/A #N/A #N/A #N/A
More than 25 000 kWh 94% 5% ▼1% (n=165) #N/A #N/A #N/A #N/A #N/A
Do not know ▼88% 5% ▲7% (n=1804) #N/A #N/A #N/A #N/A #N/A
Less than 500 kr 92% 5% 3% (n=1281) #N/A #N/A #N/A #N/A #N/A
50-100 € 91% 6% 3% (n=1363) #N/A #N/A #N/A #N/A #N/A
100-150 € 90% ▲8% 3% (n=907) #N/A #N/A #N/A #N/A #N/A
150-200 € 92% 6% 3% (n=772) #N/A #N/A #N/A #N/A #N/A
200-300 € 92% 6% 2% (n=615) #N/A #N/A #N/A #N/A #N/A
More than 300 € 91% 7% 2% (n=346) #N/A #N/A #N/A #N/A #N/A
Do not know 89% ▼3% ▲9% (n=735) #N/A #N/A #N/A #N/A #N/A
Country Norway ▲93% ▼4% 3% (n=1506) #N/A #N/A #N/A #N/A #N/A
Sweden ▼87% ▲9% 4% (n=1501) #N/A #N/A #N/A #N/A #N/A
Denmark 89% 6% ▲5% (n=1508) #N/A #N/A #N/A #N/A #N/A
Finland ▲94% ▼4% ▼2% (n=1504) #N/A #N/A #N/A #N/A #N/A
Total 91% 6% 4% (n=6019) #N/A #N/A #N/A #N/A #N/A
Spending on
electricity in total an
average winter
month
Annual KWh-use
#N/A
#N/A
#N/A
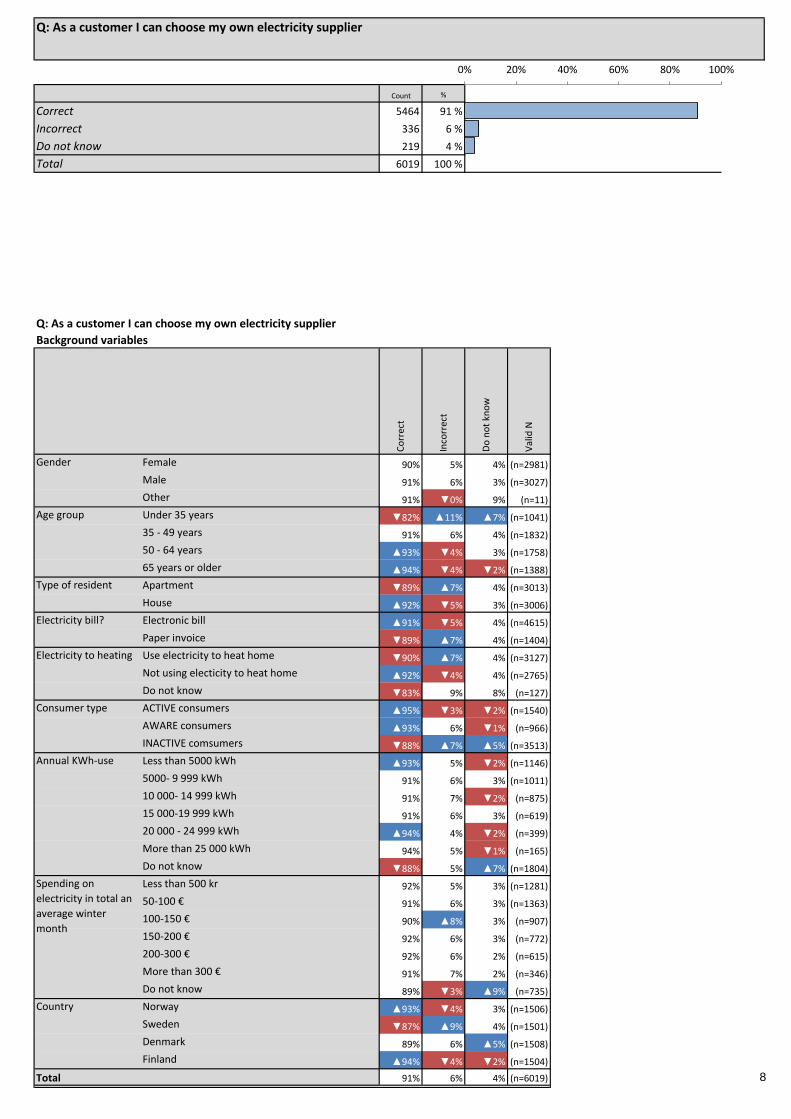
Q: As a customer I can choose my own electricity supplier
Q: As a customer I can choose my own electricity supplier
Background variables
Co
rrec
t
Inco
rrec
t
Do
no
t kn
ow
Val
id N
#N/A
#N/A
0% 20% 40% 60% 80% 100%
8

Count %
Correct 304 5 % 5 %
Incorrect 4915 82 % 82 %
Do not know 800 13 % 13 %
Total 6019 100 % #N/A
#N/A #N/A #N/A
#N/A #N/A #N/A
#N/A #N/A #N/A
#N/A #N/A #N/A
#N/A #N/A #N/A
#N/A #N/A #N/A
#N/A #N/A #N/A
Gender Female ▼4% ▼79% ▲17% (n=2981) #N/A #N/A #N/A #N/A #N/A
Male ▲6% ▲84% ▼10% (n=3027) #N/A #N/A #N/A #N/A #N/A
Other 18% 73% 9% (n=11) #N/A #N/A #N/A #N/A #N/A
Age group Under 35 years ▲12% ▼66% ▲21% (n=1041) #N/A #N/A #N/A #N/A #N/A
35 - 49 years ▲6% 81% 13% (n=1832) #N/A #N/A #N/A #N/A #N/A
50 - 64 years ▼2% ▲87% ▼10% (n=1758) #N/A #N/A #N/A #N/A #N/A
65 years or older ▼1% ▲87% 12% (n=1388) #N/A #N/A #N/A #N/A #N/A
Type of resident Apartment 6% ▼79% ▲16% (n=3013) #N/A #N/A #N/A #N/A #N/A
House 5% ▲85% ▼11% (n=3006) #N/A #N/A #N/A #N/A #N/A
Electricity bill? Electronic bill 5% ▲83% ▼12% (n=4615) #N/A #N/A #N/A #N/A #N/A
Paper invoice 5% ▼77% ▲18% (n=1404) #N/A #N/A #N/A #N/A #N/A
Electricity to heating Use electricity to heat home ▲7% 81% ▼12% (n=3127) #N/A #N/A #N/A #N/A #N/A
Not using electicity to heat home ▼3% ▲84% 14% (n=2765) #N/A #N/A #N/A #N/A #N/A
Do not know ▼2% ▼61% ▲38% (n=127) #N/A #N/A #N/A #N/A #N/A
Consumer type ACTIVE consumers ▼3% ▲91% ▼6% (n=1540) #N/A #N/A #N/A #N/A #N/A
AWARE consumers 6% ▲87% ▼7% (n=966) #N/A #N/A #N/A #N/A #N/A
INACTIVE comsumers 6% ▼76% ▲18% (n=3513) #N/A #N/A #N/A #N/A #N/A
Less than 5000 kWh 4% ▲86% ▼10% (n=1146) #N/A #N/A #N/A #N/A #N/A
5000- 9 999 kWh 5% 83% 12% (n=1011) #N/A #N/A #N/A #N/A #N/A
10 000- 14 999 kWh ▲8% 84% ▼9% (n=875) #N/A #N/A #N/A #N/A #N/A
15 000-19 999 kWh ▲8% 84% ▼7% (n=619) #N/A #N/A #N/A #N/A #N/A
20 000 - 24 999 kWh 5% ▲90% ▼5% (n=399) #N/A #N/A #N/A #N/A #N/A
More than 25 000 kWh 8% 87% ▼5% (n=165) #N/A #N/A #N/A #N/A #N/A
Do not know ▼3% ▼74% ▲23% (n=1804) #N/A #N/A #N/A #N/A #N/A
Less than 500 kr ▼3% 82% 15% (n=1281) #N/A #N/A #N/A #N/A #N/A
50-100 € 4% 82% 14% (n=1363) #N/A #N/A #N/A #N/A #N/A
100-150 € ▲7% 82% 11% (n=907) #N/A #N/A #N/A #N/A #N/A
150-200 € ▲8% 83% ▼9% (n=772) #N/A #N/A #N/A #N/A #N/A
200-300 € 7% 85% ▼8% (n=615) #N/A #N/A #N/A #N/A #N/A
More than 300 € 7% 82% 10% (n=346) #N/A #N/A #N/A #N/A #N/A
Do not know 3% ▼75% ▲22% (n=735) #N/A #N/A #N/A #N/A #N/A
Country Norway ▼4% ▲87% ▼9% (n=1506) #N/A #N/A #N/A #N/A #N/A
Sweden 6% ▼75% ▲19% (n=1501) #N/A #N/A #N/A #N/A #N/A
Denmark ▲8% ▼78% 14% (n=1508) #N/A #N/A #N/A #N/A #N/A
Finland ▼3% ▲86% ▼11% (n=1504) #N/A #N/A #N/A #N/A #N/A
Total 5% 82% 13% (n=6019) #N/A #N/A #N/A #N/A #N/A
Spending on
electricity in total an
average winter
month
Annual KWh-use
#N/A
#N/A
#N/A
Q: If I switch to another supplier, my meter has to be changed
Q: If I switch to another supplier, my meter has to be changed
Background variables
Co
rrec
t
Inco
rrec
t
Do
no
t kn
ow
Val
id N
#N/A
#N/A
0% 20% 40% 60% 80% 100%
9

Count %
Correct 524 9 % 9 %
Incorrect 4439 74 % 74 %
Do not know 1056 18 % 18 %
Total 6019 100 % #N/A
#N/A #N/A #N/A
#N/A #N/A #N/A
#N/A #N/A #N/A
#N/A #N/A #N/A
#N/A #N/A #N/A
#N/A #N/A #N/A
#N/A #N/A #N/A
Gender Female 8% ▼70% ▲22% (n=2981) #N/A #N/A #N/A #N/A #N/A
Male 9% ▲78% ▼13% (n=3027) #N/A #N/A #N/A #N/A #N/A
Other 18% 45% 36% (n=11) #N/A #N/A #N/A #N/A #N/A
Age group Under 35 years ▲17% ▼57% ▲25% (n=1041) #N/A #N/A #N/A #N/A #N/A
35 - 49 years 10% 72% 18% (n=1832) #N/A #N/A #N/A #N/A #N/A
50 - 64 years ▼6% ▲80% ▼14% (n=1758) #N/A #N/A #N/A #N/A #N/A
65 years or older ▼5% ▲80% ▼15% (n=1388) #N/A #N/A #N/A #N/A #N/A
Type of resident Apartment ▲10% ▼70% ▲20% (n=3013) #N/A #N/A #N/A #N/A #N/A
House ▼7% ▲78% ▼15% (n=3006) #N/A #N/A #N/A #N/A #N/A
Electricity bill? Electronic bill ▼8% ▲76% ▼17% (n=4615) #N/A #N/A #N/A #N/A #N/A
Paper invoice ▲12% ▼68% ▲20% (n=1404) #N/A #N/A #N/A #N/A #N/A
Electricity to heating Use electricity to heat home ▲11% 73% ▼16% (n=3127) #N/A #N/A #N/A #N/A #N/A
Not using electicity to heat home ▼7% 75% 18% (n=2765) #N/A #N/A #N/A #N/A #N/A
Do not know 9% ▼52% ▲39% (n=127) #N/A #N/A #N/A #N/A #N/A
Consumer type ACTIVE consumers ▼6% ▲82% ▼11% (n=1540) #N/A #N/A #N/A #N/A #N/A
AWARE consumers 10% ▲79% ▼11% (n=966) #N/A #N/A #N/A #N/A #N/A
INACTIVE comsumers 9% ▼69% ▲22% (n=3513) #N/A #N/A #N/A #N/A #N/A
Less than 5000 kWh 8% ▲78% ▼14% (n=1146) #N/A #N/A #N/A #N/A #N/A
5000- 9 999 kWh 9% 75% 16% (n=1011) #N/A #N/A #N/A #N/A #N/A
10 000- 14 999 kWh 10% 76% ▼13% (n=875) #N/A #N/A #N/A #N/A #N/A
15 000-19 999 kWh 11% 78% ▼11% (n=619) #N/A #N/A #N/A #N/A #N/A
20 000 - 24 999 kWh 9% ▲84% ▼7% (n=399) #N/A #N/A #N/A #N/A #N/A
More than 25 000 kWh 9% ▲83% ▼8% (n=165) #N/A #N/A #N/A #N/A #N/A
Do not know ▼7% ▼65% ▲28% (n=1804) #N/A #N/A #N/A #N/A #N/A
Less than 500 kr 8% 73% 19% (n=1281) #N/A #N/A #N/A #N/A #N/A
50-100 € 8% 74% 18% (n=1363) #N/A #N/A #N/A #N/A #N/A
100-150 € 11% 75% ▼15% (n=907) #N/A #N/A #N/A #N/A #N/A
150-200 € 10% ▲78% ▼12% (n=772) #N/A #N/A #N/A #N/A #N/A
200-300 € 10% 77% ▼13% (n=615) #N/A #N/A #N/A #N/A #N/A
More than 300 € 12% 75% 14% (n=346) #N/A #N/A #N/A #N/A #N/A
Do not know ▼6% ▼65% ▲29% (n=735) #N/A #N/A #N/A #N/A #N/A
Country Norway ▼5% ▲80% ▼15% (n=1506) #N/A #N/A #N/A #N/A #N/A
Sweden ▲11% ▼66% ▲22% (n=1501) #N/A #N/A #N/A #N/A #N/A
Denmark 8% 72% 19% (n=1508) #N/A #N/A #N/A #N/A #N/A
Finland 10% 76% ▼14% (n=1504) #N/A #N/A #N/A #N/A #N/A
Total 9% 74% 18% (n=6019) #N/A #N/A #N/A #N/A #N/A
Spending on
electricity in total an
average winter
month
Annual KWh-use
#N/A
#N/A
#N/A
Q: If I switch to another supplier, it can effect the number of power cuts
Q: If I switch to another supplier, it can effect the number of power cuts
Background variables
Co
rrec
t
Inco
rrec
t
Do
no
t kn
ow
Val
id N
#N/A
#N/A
0% 20% 40% 60% 80%
10
Count %
Correct 2948 49 % 49 %
Incorrect 1512 25 % 25 %
Do not know 1559 26 % 26 %
Total 6019 100 % #N/A
#N/A #N/A #N/A
#N/A #N/A #N/A
#N/A #N/A #N/A
#N/A #N/A #N/A
#N/A #N/A #N/A
#N/A #N/A #N/A
#N/A #N/A #N/A
Gender Female ▼46% ▼23% ▲31% (n=2981) #N/A #N/A #N/A #N/A #N/A
Male ▲51% ▲28% ▼21% (n=3027) #N/A #N/A #N/A #N/A #N/A
Other 73% 18% 9% (n=11) #N/A #N/A #N/A #N/A #N/A
Age group Under 35 years ▼45% ▼20% ▲35% (n=1041) #N/A #N/A #N/A #N/A #N/A
35 - 49 years 48% 25% 27% (n=1832) #N/A #N/A #N/A #N/A #N/A
50 - 64 years 49% 27% 24% (n=1758) #N/A #N/A #N/A #N/A #N/A
65 years or older ▲54% 27% ▼20% (n=1388) #N/A #N/A #N/A #N/A #N/A
Type of resident Apartment ▲51% ▼20% ▲28% (n=3013) #N/A #N/A #N/A #N/A #N/A
House ▼47% ▲30% ▼23% (n=3006) #N/A #N/A #N/A #N/A #N/A
Electricity bill? Electronic bill 48% ▲26% 25% (n=4615) #N/A #N/A #N/A #N/A #N/A
Paper invoice 51% ▼21% 28% (n=1404) #N/A #N/A #N/A #N/A #N/A
Electricity to heating Use electricity to heat home 49% ▲28% ▼23% (n=3127) #N/A #N/A #N/A #N/A #N/A
Not using electicity to heat home 49% ▼23% ▲28% (n=2765) #N/A #N/A #N/A #N/A #N/A
Do not know 46% ▼6% ▲47% (n=127) #N/A #N/A #N/A #N/A #N/A
Consumer type ACTIVE consumers ▲53% ▲28% ▼19% (n=1540) #N/A #N/A #N/A #N/A #N/A
AWARE consumers ▲53% 28% ▼19% (n=966) #N/A #N/A #N/A #N/A #N/A
INACTIVE comsumers ▼46% ▼23% ▲31% (n=3513) #N/A #N/A #N/A #N/A #N/A
Less than 5000 kWh 51% 24% 25% (n=1146) #N/A #N/A #N/A #N/A #N/A
5000- 9 999 kWh 52% ▲29% ▼19% (n=1011) #N/A #N/A #N/A #N/A #N/A
10 000- 14 999 kWh 52% 29% ▼19% (n=875) #N/A #N/A #N/A #N/A #N/A
15 000-19 999 kWh 51% 29% ▼20% (n=619) #N/A #N/A #N/A #N/A #N/A
20 000 - 24 999 kWh 50% ▲34% ▼16% (n=399) #N/A #N/A #N/A #N/A #N/A
More than 25 000 kWh 41% ▲42% ▼17% (n=165) #N/A #N/A #N/A #N/A #N/A
Do not know ▼44% ▼17% ▲38% (n=1804) #N/A #N/A #N/A #N/A #N/A
Less than 500 kr 49% ▼19% ▲32% (n=1281) #N/A #N/A #N/A #N/A #N/A
50-100 € 52% 25% ▼23% (n=1363) #N/A #N/A #N/A #N/A #N/A
100-150 € 51% 28% ▼20% (n=907) #N/A #N/A #N/A #N/A #N/A
150-200 € 49% 28% 23% (n=772) #N/A #N/A #N/A #N/A #N/A
200-300 € 50% ▲30% ▼20% (n=615) #N/A #N/A #N/A #N/A #N/A
More than 300 € 50% 28% 21% (n=346) #N/A #N/A #N/A #N/A #N/A
Do not know ▼39% 22% ▲39% (n=735) #N/A #N/A #N/A #N/A #N/A
Country Norway ▼43% ▲34% ▼23% (n=1506) #N/A #N/A #N/A #N/A #N/A
Sweden 51% ▼18% ▲31% (n=1501) #N/A #N/A #N/A #N/A #N/A
Denmark ▼45% ▲29% 27% (n=1508) #N/A #N/A #N/A #N/A #N/A
Finland ▲57% ▼20% 23% (n=1504) #N/A #N/A #N/A #N/A #N/A
Total 49% 25% 26% (n=6019) #N/A #N/A #N/A #N/A #N/A
Spending on
electricity in total an
average winter
month
Annual KWh-use
#N/A
#N/A
#N/A
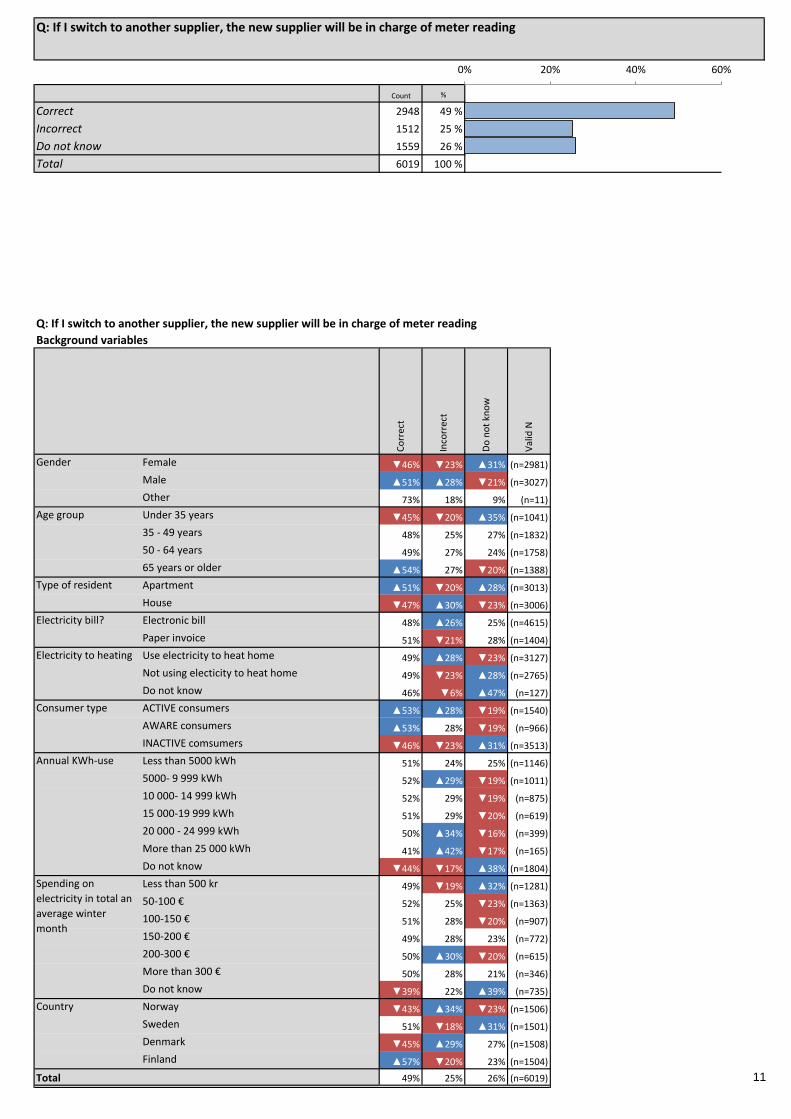
Q: If I switch to another supplier, the new supplier will be in charge of meter reading
Q: If I switch to another supplier, the new supplier will be in charge of meter reading
Background variables
Co
rrec
t
Inco
rrec
t
Do
no
t kn
ow
Val
id N
#N/A
#N/A
0% 20% 40% 60%
11

Count %
Correct 3203 53 % 53 %
Not a grid company 2118 35 % 35 %
Do not know 698 12 % 12 %
Total 6019 100 % #N/A
#N/A #N/A #N/A
#N/A #N/A #N/A
#N/A #N/A #N/A
#N/A #N/A #N/A
#N/A #N/A #N/A
#N/A #N/A #N/A
#N/A #N/A #N/A
Gender Female 52% 35% ▲13% (n=2981) #N/A #N/A #N/A #N/A #N/A
Male 55% 35% ▼10% (n=3027) #N/A #N/A #N/A #N/A #N/A
Other 45% 18% 36% (n=11) #N/A #N/A #N/A #N/A #N/A
Age group Under 35 years ▼43% 39% ▲18% (n=1041) #N/A #N/A #N/A #N/A #N/A
35 - 49 years 54% 33% 13% (n=1832) #N/A #N/A #N/A #N/A #N/A
50 - 64 years 55% 35% ▼10% (n=1758) #N/A #N/A #N/A #N/A #N/A
65 years or older ▲57% 35% ▼7% (n=1388) #N/A #N/A #N/A #N/A #N/A
Type of resident Apartment 55% ▼32% ▲13% (n=3013) #N/A #N/A #N/A #N/A #N/A
House 52% ▲38% ▼10% (n=3006) #N/A #N/A #N/A #N/A #N/A
Electricity bill? Electronic bill ▼52% 36% 12% (n=4615) #N/A #N/A #N/A #N/A #N/A
Paper invoice ▲56% 33% 11% (n=1404) #N/A #N/A #N/A #N/A #N/A
Electricity to heating Use electricity to heat home ▲59% ▼30% 11% (n=3127) #N/A #N/A #N/A #N/A #N/A
Not using electicity to heat home ▼46% ▲41% 13% (n=2765) #N/A #N/A #N/A #N/A #N/A
Do not know 53% 30% 17% (n=127) #N/A #N/A #N/A #N/A #N/A
Consumer type ACTIVE consumers ▲59% ▼32% ▼9% (n=1540) #N/A #N/A #N/A #N/A #N/A
AWARE consumers ▲58% 33% 10% (n=966) #N/A #N/A #N/A #N/A #N/A
INACTIVE comsumers ▼49% ▲37% ▲13% (n=3513) #N/A #N/A #N/A #N/A #N/A
Less than 5000 kWh 50% ▲40% 10% (n=1146) #N/A #N/A #N/A #N/A #N/A
5000- 9 999 kWh ▼47% ▲42% 11% (n=1011) #N/A #N/A #N/A #N/A #N/A
10 000- 14 999 kWh 57% 35% ▼9% (n=875) #N/A #N/A #N/A #N/A #N/A
15 000-19 999 kWh ▲62% ▼30% ▼8% (n=619) #N/A #N/A #N/A #N/A #N/A
20 000 - 24 999 kWh ▲69% ▼25% ▼6% (n=399) #N/A #N/A #N/A #N/A #N/A
More than 25 000 kWh ▲67% ▼26% ▼7% (n=165) #N/A #N/A #N/A #N/A #N/A
Do not know ▼50% 33% ▲17% (n=1804) #N/A #N/A #N/A #N/A #N/A
Less than 500 kr 56% 33% 10% (n=1281) #N/A #N/A #N/A #N/A #N/A
50-100 € ▼49% ▲40% 11% (n=1363) #N/A #N/A #N/A #N/A #N/A
100-150 € 53% 36% 11% (n=907) #N/A #N/A #N/A #N/A #N/A
150-200 € ▲60% 32% ▼9% (n=772) #N/A #N/A #N/A #N/A #N/A
200-300 € ▲63% ▼31% ▼6% (n=615) #N/A #N/A #N/A #N/A #N/A
More than 300 € ▲60% 30% 10% (n=346) #N/A #N/A #N/A #N/A #N/A
Do not know ▼38% 38% ▲23% (n=735) #N/A #N/A #N/A #N/A #N/A
Country Norway ▲71% ▼22% ▼7% (n=1506) #N/A #N/A #N/A #N/A #N/A
Sweden ▲68% ▼22% 10% (n=1501) #N/A #N/A #N/A #N/A #N/A
Denmark ▼15% ▲64% ▲21% (n=1508) #N/A #N/A #N/A #N/A #N/A
Finland ▲60% 33% ▼7% (n=1504) #N/A #N/A #N/A #N/A #N/A
Total 53% 35% 12% (n=6019) #N/A #N/A #N/A #N/A #N/A
Spending on
electricity in total an
average winter
month
Annual KWh-use
#N/A
#N/A
#N/A
Q: Name the company that operates the power lines to your home
Q: Name the company that operates the power lines to your home
Background variables
Co
rrec
t
No
t a
grid
co
mp
any
Do
no
t kn
ow
Val
id N
#N/A
#N/A
0% 20% 40% 60%
12

Count %
An electricity supplier 5024 84 % 84 %
Not an electricity supplier 398 7 % 7 %
Do not know 592 10 % 10 %
Total 6014 100 % #N/A
#N/A #N/A #N/A
#N/A #N/A #N/A
#N/A #N/A #N/A
#N/A #N/A #N/A
#N/A #N/A #N/A
#N/A #N/A #N/A
#N/A #N/A #N/A
Gender Female 83% 6% 10% (n=2980) #N/A #N/A #N/A #N/A #N/A
Male 84% 7% 9% (n=3023) #N/A #N/A #N/A #N/A #N/A
Other 64% ▼0% 36% (n=11) #N/A #N/A #N/A #N/A #N/A
Age group Under 35 years ▼75% 8% ▲16% (n=1039) #N/A #N/A #N/A #N/A #N/A
35 - 49 years 84% 6% 10% (n=1831) #N/A #N/A #N/A #N/A #N/A
50 - 64 years 85% 7% ▼8% (n=1757) #N/A #N/A #N/A #N/A #N/A
65 years or older ▲87% 6% ▼7% (n=1387) #N/A #N/A #N/A #N/A #N/A
Type of resident Apartment 84% 6% 10% (n=3010) #N/A #N/A #N/A #N/A #N/A
House 83% 7% 9% (n=3004) #N/A #N/A #N/A #N/A #N/A
Electricity bill? Electronic bill 84% 6% 10% (n=4610) #N/A #N/A #N/A #N/A #N/A
Paper invoice 82% 7% 10% (n=1404) #N/A #N/A #N/A #N/A #N/A
Electricity to heating Use electricity to heat home 84% 6% 10% (n=3124) #N/A #N/A #N/A #N/A #N/A
Not using electicity to heat home 83% 7% 10% (n=2763) #N/A #N/A #N/A #N/A #N/A
Do not know 76% 6% ▲17% (n=127) #N/A #N/A #N/A #N/A #N/A
Consumer type ACTIVE consumers ▲88% ▼5% ▼7% (n=1539) #N/A #N/A #N/A #N/A #N/A
AWARE consumers ▲86% 6% ▼8% (n=964) #N/A #N/A #N/A #N/A #N/A
INACTIVE comsumers ▼81% ▲7% ▲12% (n=3511) #N/A #N/A #N/A #N/A #N/A
Less than 5000 kWh ▲87% 6% ▼7% (n=1145) #N/A #N/A #N/A #N/A #N/A
5000- 9 999 kWh 82% 8% 9% (n=1009) #N/A #N/A #N/A #N/A #N/A
10 000- 14 999 kWh 86% 5% 9% (n=874) #N/A #N/A #N/A #N/A #N/A
15 000-19 999 kWh 84% 8% 9% (n=619) #N/A #N/A #N/A #N/A #N/A
20 000 - 24 999 kWh 87% 7% ▼6% (n=399) #N/A #N/A #N/A #N/A #N/A
More than 25 000 kWh 84% 8% 7% (n=165) #N/A #N/A #N/A #N/A #N/A
Do not know ▼80% 6% ▲14% (n=1803) #N/A #N/A #N/A #N/A #N/A
Less than 500 kr ▲87% 6% ▼7% (n=1278) #N/A #N/A #N/A #N/A #N/A
50-100 € 83% 8% 9% (n=1362) #N/A #N/A #N/A #N/A #N/A
100-150 € 84% 6% 10% (n=907) #N/A #N/A #N/A #N/A #N/A
150-200 € 84% 6% 10% (n=771) #N/A #N/A #N/A #N/A #N/A
200-300 € ▲87% 6% ▼7% (n=615) #N/A #N/A #N/A #N/A #N/A
More than 300 € 85% 9% ▼6% (n=346) #N/A #N/A #N/A #N/A #N/A
Do not know ▼73% 6% ▲20% (n=735) #N/A #N/A #N/A #N/A #N/A
Country Norway ▲90% ▼4% ▼6% (n=1506) #N/A #N/A #N/A #N/A #N/A
Sweden 84% 7% 8% (n=1499) #N/A #N/A #N/A #N/A #N/A
Denmark ▼73% ▲9% ▲17% (n=1507) #N/A #N/A #N/A #N/A #N/A
Finland ▲87% 6% ▼8% (n=1502) #N/A #N/A #N/A #N/A #N/A
Total 84% 7% 10% (n=6014) #N/A #N/A #N/A #N/A #N/A
Spending on
electricity in total an
average winter
month
Annual KWh-use
#N/A
#N/A
#N/A
Q: Who is the electricity supplierin your home
Q: Who is the electricity supplierin your home
Background variables
An
ele
ctri
city
su
pp
lier
No
t an
ele
ctri
city
sup
plie
r
Do
no
t kn
ow
Val
id N
#N/A
#N/A
0% 20% 40% 60% 80% 100%
13

Count %
No 1842 31 % 31 %
One other supplier 1317 22 % 22 %
Two other suppliers 2860 48 % 48 %
Total 6019 100 % #N/A
#N/A #N/A #N/A
#N/A #N/A #N/A
#N/A #N/A #N/A
#N/A #N/A #N/A
#N/A #N/A #N/A
#N/A #N/A #N/A
#N/A #N/A #N/A
Gender Female 32% 23% ▼45% (n=2981) #N/A #N/A #N/A #N/A #N/A
Male 30% 21% ▲50% (n=3027) #N/A #N/A #N/A #N/A #N/A
Other 45% 9% 45% (n=11) #N/A #N/A #N/A #N/A #N/A
Age group Under 35 years ▲38% 21% ▼41% (n=1041) #N/A #N/A #N/A #N/A #N/A
35 - 49 years 29% 23% 48% (n=1832) #N/A #N/A #N/A #N/A #N/A
50 - 64 years 29% 22% 49% (n=1758) #N/A #N/A #N/A #N/A #N/A
65 years or older 29% 21% 50% (n=1388) #N/A #N/A #N/A #N/A #N/A
Type of resident Apartment 31% 23% 47% (n=3013) #N/A #N/A #N/A #N/A #N/A
House 31% 21% 48% (n=3006) #N/A #N/A #N/A #N/A #N/A
Electricity bill? Electronic bill 31% 21% 48% (n=4615) #N/A #N/A #N/A #N/A #N/A
Paper invoice 30% 23% 47% (n=1404) #N/A #N/A #N/A #N/A #N/A
Electricity to heating Use electricity to heat home ▼27% 21% ▲52% (n=3127) #N/A #N/A #N/A #N/A #N/A
Not using electicity to heat home ▲34% 23% ▼43% (n=2765) #N/A #N/A #N/A #N/A #N/A
Do not know 36% 21% 43% (n=127) #N/A #N/A #N/A #N/A #N/A
Consumer type ACTIVE consumers ▼17% 20% ▲63% (n=1540) #N/A #N/A #N/A #N/A #N/A
AWARE consumers ▼23% 22% ▲55% (n=966) #N/A #N/A #N/A #N/A #N/A
INACTIVE comsumers ▲39% 23% ▼39% (n=3513) #N/A #N/A #N/A #N/A #N/A
Less than 5000 kWh 29% 22% 49% (n=1146) #N/A #N/A #N/A #N/A #N/A
5000- 9 999 kWh ▲34% 21% 44% (n=1011) #N/A #N/A #N/A #N/A #N/A
10 000- 14 999 kWh ▼26% 19% ▲54% (n=875) #N/A #N/A #N/A #N/A #N/A
15 000-19 999 kWh ▼20% 21% ▲59% (n=619) #N/A #N/A #N/A #N/A #N/A
20 000 - 24 999 kWh ▼17% 20% ▲63% (n=399) #N/A #N/A #N/A #N/A #N/A
More than 25 000 kWh ▼21% 16% ▲63% (n=165) #N/A #N/A #N/A #N/A #N/A
Do not know ▲39% ▲25% ▼36% (n=1804) #N/A #N/A #N/A #N/A #N/A
Less than 500 kr ▼27% 24% 49% (n=1281) #N/A #N/A #N/A #N/A #N/A
50-100 € ▲34% 22% ▼44% (n=1363) #N/A #N/A #N/A #N/A #N/A
100-150 € 31% 22% 47% (n=907) #N/A #N/A #N/A #N/A #N/A
150-200 € ▼26% 21% ▲53% (n=772) #N/A #N/A #N/A #N/A #N/A
200-300 € ▼21% 20% ▲59% (n=615) #N/A #N/A #N/A #N/A #N/A
More than 300 € ▼21% 23% ▲57% (n=346) #N/A #N/A #N/A #N/A #N/A
Do not know ▲48% 20% ▼32% (n=735) #N/A #N/A #N/A #N/A #N/A
Country Norway ▼24% 21% ▲55% (n=1506) #N/A #N/A #N/A #N/A #N/A
Sweden ▼23% 20% ▲57% (n=1501) #N/A #N/A #N/A #N/A #N/A
Denmark ▲55% 22% ▼23% (n=1508) #N/A #N/A #N/A #N/A #N/A
Finland ▼21% 24% ▲55% (n=1504) #N/A #N/A #N/A #N/A #N/A
Total 31% 22% 48% (n=6019) #N/A #N/A #N/A #N/A #N/A
Spending on
electricity in total an
average winter
month
Annual KWh-use
#N/A
#N/A
#N/A
Q: Can you name two other electricity suppliers?
Q: Can you name two other electricity suppliers?
Background variables
No
On
e o
ther
su
pp
lier
Two
oth
er s
up
plie
rs
Val
id N
#N/A
#N/A
0% 10% 20% 30% 40% 50%
14

Count %
Can name one's own electricity supplier 1271 21 % 21 %
Can name one's own and one other electricity supplier 1144 19 % 19 %
Can name one's own and two other electricity suppliers 2609 43 % 43 %
Other 995 17 % 17 %
Total 6019 100 % #N/A
#N/A #N/A #N/A
#N/A #N/A #N/A
#N/A #N/A #N/A
#N/A #N/A #N/A
#N/A #N/A #N/A
#N/A #N/A #N/A
Gender Female 22% 20% ▼41% 17% (n=2981) #N/A #N/A #N/A #N/A
Male 20% 18% ▲46% 16% (n=3027) #N/A #N/A #N/A #N/A
Other 18% 9% 36% 36% (n=11) #N/A #N/A #N/A #N/A
Age group Under 35 years 21% 18% ▼36% ▲25% (n=1041) #N/A #N/A #N/A #N/A
35 - 49 years 20% 20% 44% 16% (n=1832) #N/A #N/A #N/A #N/A
50 - 64 years 21% 19% 45% 15% (n=1758) #N/A #N/A #N/A #N/A
65 years or older 23% 19% 46% ▼13% (n=1388) #N/A #N/A #N/A #N/A
Type of resident Apartment 21% 20% 43% 16% (n=3013) #N/A #N/A #N/A #N/A
House 21% 18% 44% 17% (n=3006) #N/A #N/A #N/A #N/A
Electricity bill? Electronic bill 21% 19% 44% 16% (n=4615) #N/A #N/A #N/A #N/A
Paper invoice 20% 20% 42% 18% (n=1404) #N/A #N/A #N/A #N/A
Electricity to heating Use electricity to heat home ▼18% 19% ▲48% 16% (n=3127) #N/A #N/A #N/A #N/A
Not using electicity to heat home ▲25% 20% ▼39% 17% (n=2765) #N/A #N/A #N/A #N/A
Do not know 23% 17% 37% 24% (n=127) #N/A #N/A #N/A #N/A
Consumer type ACTIVE consumers ▼13% 18% ▲58% ▼12% (n=1540) #N/A #N/A #N/A #N/A
AWARE consumers ▼15% 20% ▲52% ▼14% (n=966) #N/A #N/A #N/A #N/A
INACTIVE comsumers ▲27% 19% ▼35% ▲19% (n=3513) #N/A #N/A #N/A #N/A
Less than 5000 kWh 23% 19% 46% ▼13% (n=1146) #N/A #N/A #N/A #N/A
5000- 9 999 kWh 24% 19% 40% 18% (n=1011) #N/A #N/A #N/A #N/A
10 000- 14 999 kWh ▼17% 18% ▲51% 14% (n=875) #N/A #N/A #N/A #N/A
15 000-19 999 kWh ▼11% 18% ▲54% 16% (n=619) #N/A #N/A #N/A #N/A
20 000 - 24 999 kWh ▼11% 17% ▲59% 13% (n=399) #N/A #N/A #N/A #N/A
More than 25 000 kWh ▼13% ▼12% ▲59% 16% (n=165) #N/A #N/A #N/A #N/A
Do not know ▲27% 21% ▼32% ▲20% (n=1804) #N/A #N/A #N/A #N/A
Less than 500 kr 21% 21% 45% ▼13% (n=1281) #N/A #N/A #N/A #N/A
50-100 € ▲24% 19% ▼40% 17% (n=1363) #N/A #N/A #N/A #N/A
100-150 € 21% 20% 44% 16% (n=907) #N/A #N/A #N/A #N/A
150-200 € ▼17% 18% ▲49% 16% (n=772) #N/A #N/A #N/A #N/A
200-300 € ▼15% 18% ▲54% ▼13% (n=615) #N/A #N/A #N/A #N/A
More than 300 € ▼14% 20% ▲52% 15% (n=346) #N/A #N/A #N/A #N/A
Do not know ▲29% 16% ▼29% ▲27% (n=735) #N/A #N/A #N/A #N/A
Country Norway 19% 20% ▲51% ▼10% (n=1506) #N/A #N/A #N/A #N/A
Sweden ▼16% 17% ▲51% 16% (n=1501) #N/A #N/A #N/A #N/A
Denmark ▲36% 18% ▼19% ▲27% (n=1508) #N/A #N/A #N/A #N/A
Finland ▼14% 21% ▲51% ▼13% (n=1504) #N/A #N/A #N/A #N/A
Total 21% 19% 43% 17% (n=6019) #N/A #N/A #N/A #N/A
Spending on
electricity in total an
average winter
month
Annual KWh-use
#N/A
#N/A
#N/A
Q: Knowledge of electricity suppliers (TOTAL)
Q: Knowledge of electricity suppliers (TOTAL)
Background variables
Can
nam
e o
ne'
s o
wn
elec
tric
ity
sup
plie
r
Can
nam
e o
ne'
s o
wn
and
on
e o
ther
elec
tric
ity
sup
plie
r
Can
nam
e o
ne'
s o
wn
and
tw
o o
ther
elec
tric
ity
sup
plie
rs
Oth
er
Val
id N
#N/A
0% 10% 20% 30% 40% 50%
15

Count %
Can name grid company and one's own electricity supplier 557 9 % 9 %
Can name grid company, one's own and one other supplier 614 10 % 10 %
Can name grid company, one's own and two other suppliers 1757 29 % 29 %
Other 3091 51 % 51 %
Total 6019 100 % #N/A
#N/A #N/A #N/A
#N/A #N/A #N/A
#N/A #N/A #N/A
#N/A #N/A #N/A
#N/A #N/A #N/A
#N/A #N/A #N/A
Gender Female 9% 11% ▼26% 53% (n=2981) #N/A #N/A #N/A #N/A
Male 9% 9% ▲32% 50% (n=3027) #N/A #N/A #N/A #N/A
Other 9% 9% 27% 55% (n=11) #N/A #N/A #N/A #N/A
Age group Under 35 years 7% 9% ▼22% ▲61% (n=1041) #N/A #N/A #N/A #N/A
35 - 49 years 9% 11% 29% 51% (n=1832) #N/A #N/A #N/A #N/A
50 - 64 years 9% 10% 31% 50% (n=1758) #N/A #N/A #N/A #N/A
65 years or older 11% 11% 32% ▼46% (n=1388) #N/A #N/A #N/A #N/A
Type of resident Apartment 10% 11% 29% 50% (n=3013) #N/A #N/A #N/A #N/A
House 9% 9% 30% 53% (n=3006) #N/A #N/A #N/A #N/A
Electricity bill? Electronic bill 9% 10% 29% 52% (n=4615) #N/A #N/A #N/A #N/A
Paper invoice 10% 12% 29% 49% (n=1404) #N/A #N/A #N/A #N/A
Electricity to heating Use electricity to heat home 9% 11% ▲35% ▼45% (n=3127) #N/A #N/A #N/A #N/A
Not using electicity to heat home 9% 9% ▼23% ▲58% (n=2765) #N/A #N/A #N/A #N/A
Do not know 8% 9% 28% 54% (n=127) #N/A #N/A #N/A #N/A
Consumer type ACTIVE consumers ▼6% 10% ▲39% ▼45% (n=1540) #N/A #N/A #N/A #N/A
AWARE consumers 8% 11% ▲35% ▼46% (n=966) #N/A #N/A #N/A #N/A
INACTIVE comsumers ▲11% 10% ▼23% ▲56% (n=3513) #N/A #N/A #N/A #N/A
Less than 5000 kWh 8% 9% 29% 54% (n=1146) #N/A #N/A #N/A #N/A
5000- 9 999 kWh 9% 9% ▼24% ▲58% (n=1011) #N/A #N/A #N/A #N/A
10 000- 14 999 kWh 9% 9% ▲35% ▼47% (n=875) #N/A #N/A #N/A #N/A
15 000-19 999 kWh ▼5% 11% ▲40% ▼43% (n=619) #N/A #N/A #N/A #N/A
20 000 - 24 999 kWh 7% 12% ▲45% ▼36% (n=399) #N/A #N/A #N/A #N/A
More than 25 000 kWh 7% 8% ▲47% ▼38% (n=165) #N/A #N/A #N/A #N/A
Do not know ▲13% 11% ▼20% ▲55% (n=1804) #N/A #N/A #N/A #N/A
Less than 500 kr 8% 12% 32% 49% (n=1281) #N/A #N/A #N/A #N/A
50-100 € 11% 9% ▼24% ▲56% (n=1363) #N/A #N/A #N/A #N/A
100-150 € 10% 11% 29% 50% (n=907) #N/A #N/A #N/A #N/A
150-200 € 9% 11% ▲34% ▼45% (n=772) #N/A #N/A #N/A #N/A
200-300 € 8% 11% ▲39% ▼41% (n=615) #N/A #N/A #N/A #N/A
More than 300 € 6% 12% ▲37% 45% (n=346) #N/A #N/A #N/A #N/A
Do not know 10% ▼6% ▼17% ▲66% (n=735) #N/A #N/A #N/A #N/A
Country Norway ▲13% ▲14% ▲40% ▼33% (n=1506) #N/A #N/A #N/A #N/A
Sweden 10% 12% ▲40% ▼39% (n=1501) #N/A #N/A #N/A #N/A
Denmark ▼5% ▼3% ▼3% ▲89% (n=1508) #N/A #N/A #N/A #N/A
Finland 9% ▲13% ▲34% ▼44% (n=1504) #N/A #N/A #N/A #N/A
Total 9% 10% 29% 51% (n=6019) #N/A #N/A #N/A #N/A
Spending on
electricity in total an
average winter
month
Annual KWh-use
#N/A
#N/A
#N/A
Q: Knowledge of electicity market (TOTAL)
Q: Knowledge of electicity market (TOTAL)
Background variables
Can
nam
e gr
id c
om
pan
y
and
on
e's
ow
n
elec
tric
ity
sup
plie
r
Can
nam
e gr
id
com
pan
y, o
ne'
s o
wn
and
on
e o
ther
su
pp
lier
Can
nam
e gr
id
com
pan
y, o
ne'
s o
wn
and
tw
o o
ther
su
pp
liers
Oth
er
Val
id N
#N/A
0% 20% 40% 60%
16
Count %
Yes 4697 78 % 78 %
No 1108 18 % 18 %
Do not know 214 4 % 4 %
Total 6019 100 % #N/A
#N/A #N/A #N/A
#N/A #N/A #N/A
#N/A #N/A #N/A
#N/A #N/A #N/A
#N/A #N/A #N/A
#N/A #N/A #N/A
#N/A #N/A #N/A
Gender Female ▼75% ▲20% ▲5% (n=2981) #N/A #N/A #N/A #N/A #N/A
Male ▲81% ▼17% ▼2% (n=3027) #N/A #N/A #N/A #N/A #N/A
Other 64% 9% 27% (n=11) #N/A #N/A #N/A #N/A #N/A
Age group Under 35 years ▼72% 21% ▲7% (n=1041) #N/A #N/A #N/A #N/A #N/A
35 - 49 years 77% 19% 4% (n=1832) #N/A #N/A #N/A #N/A #N/A
50 - 64 years 80% 18% ▼3% (n=1758) #N/A #N/A #N/A #N/A #N/A
65 years or older ▲82% ▼16% 3% (n=1388) #N/A #N/A #N/A #N/A #N/A
Type of resident Apartment 79% 17% ▲4% (n=3013) #N/A #N/A #N/A #N/A #N/A
House 78% 20% ▼3% (n=3006) #N/A #N/A #N/A #N/A #N/A
Electricity bill? Electronic bill 79% 19% ▼3% (n=4615) #N/A #N/A #N/A #N/A #N/A
Paper invoice 76% 17% ▲6% (n=1404) #N/A #N/A #N/A #N/A #N/A
Electricity to heating Use electricity to heat home ▲83% ▼14% 3% (n=3127) #N/A #N/A #N/A #N/A #N/A
Not using electicity to heat home ▼73% ▲23% 3% (n=2765) #N/A #N/A #N/A #N/A #N/A
Do not know ▼61% 25% ▲13% (n=127) #N/A #N/A #N/A #N/A #N/A
Consumer type ACTIVE consumers ▲100% ▼0% ▼0% (n=1540) #N/A #N/A #N/A #N/A #N/A
AWARE consumers ▲83% ▼14% 3% (n=966) #N/A #N/A #N/A #N/A #N/A
INACTIVE comsumers ▼67% ▲28% ▲5% (n=3513) #N/A #N/A #N/A #N/A #N/A
Less than 5000 kWh 78% 19% 3% (n=1146) #N/A #N/A #N/A #N/A #N/A
5000- 9 999 kWh 77% 21% 2% (n=1011) #N/A #N/A #N/A #N/A #N/A
10 000- 14 999 kWh ▲83% ▼14% ▼2% (n=875) #N/A #N/A #N/A #N/A #N/A
15 000-19 999 kWh ▲86% ▼12% ▼2% (n=619) #N/A #N/A #N/A #N/A #N/A
20 000 - 24 999 kWh ▲89% ▼9% 2% (n=399) #N/A #N/A #N/A #N/A #N/A
More than 25 000 kWh ▲89% ▼8% 2% (n=165) #N/A #N/A #N/A #N/A #N/A
Do not know ▼70% ▲24% ▲6% (n=1804) #N/A #N/A #N/A #N/A #N/A
Less than 500 kr 77% 19% 4% (n=1281) #N/A #N/A #N/A #N/A #N/A
50-100 € ▼75% ▲22% 3% (n=1363) #N/A #N/A #N/A #N/A #N/A
100-150 € 80% 17% 3% (n=907) #N/A #N/A #N/A #N/A #N/A
150-200 € ▲84% ▼14% ▼2% (n=772) #N/A #N/A #N/A #N/A #N/A
200-300 € ▲84% ▼14% ▼2% (n=615) #N/A #N/A #N/A #N/A #N/A
More than 300 € ▲88% ▼9% 3% (n=346) #N/A #N/A #N/A #N/A #N/A
Do not know ▼66% ▲25% ▲9% (n=735) #N/A #N/A #N/A #N/A #N/A
Country Norway ▲86% ▼13% ▼2% (n=1506) #N/A #N/A #N/A #N/A #N/A
Sweden ▲81% ▼14% ▲5% (n=1501) #N/A #N/A #N/A #N/A #N/A
Denmark ▼58% ▲38% 4% (n=1508) #N/A #N/A #N/A #N/A #N/A
Finland ▲87% ▼10% 3% (n=1504) #N/A #N/A #N/A #N/A #N/A
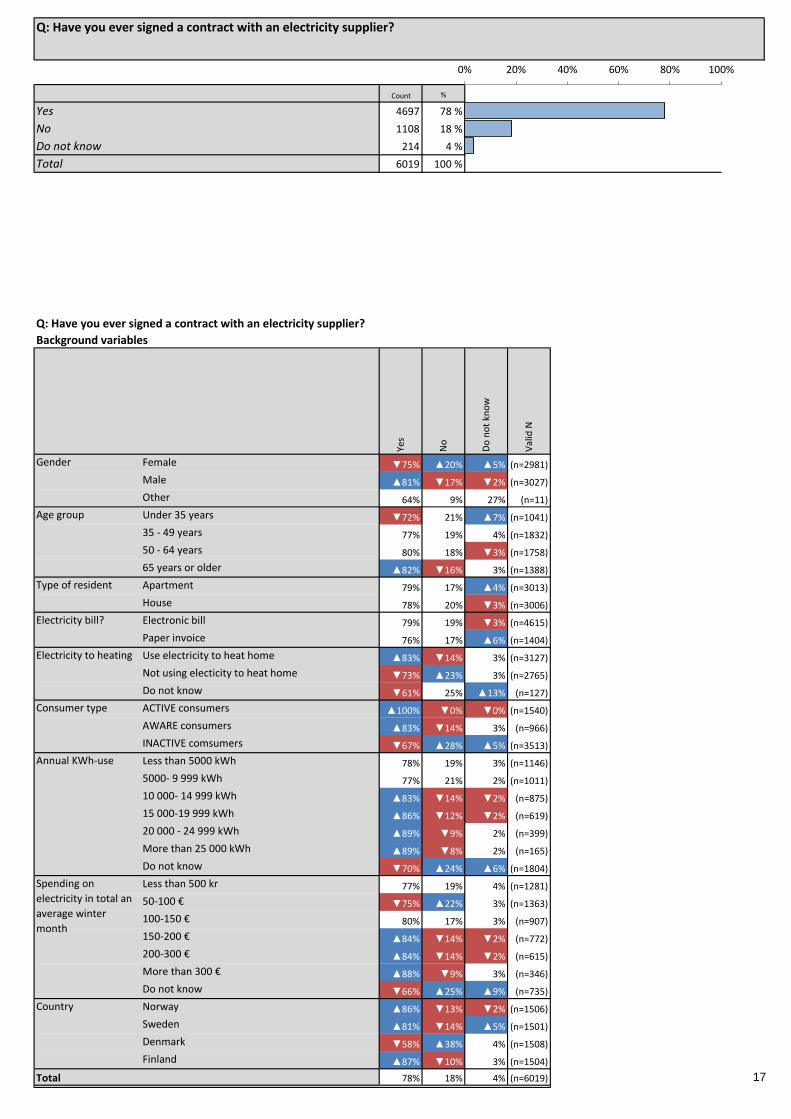
Total 78% 18% 4% (n=6019) #N/A #N/A #N/A #N/A #N/A
Spending on
electricity in total an
average winter
month
Annual KWh-use
#N/A
#N/A
#N/A
Q: Have you ever signed a contract with an electricity supplier?
Q: Have you ever signed a contract with an electricity supplier?
Background variables
Yes
No
Do
no
t kn
ow
Val
id N
#N/A
#N/A
0% 20% 40% 60% 80% 100%
17

Count %
During the last 12 months 1540 33 % 33 %
1-3 years ago 1559 33 % 33 %
3-5 years ago 669 14 % 14 %
More than 5 years ago 929 20 % 20 %
Total 4697 100 % #N/A
#N/A #N/A #N/A
#N/A #N/A #N/A
#N/A #N/A #N/A
#N/A #N/A #N/A
#N/A #N/A #N/A
#N/A #N/A #N/A
Gender Female 34% ▼31% 15% 21% (n=2239) #N/A #N/A #N/A #N/A
Male 32% ▲35% 14% 19% (n=2451) #N/A #N/A #N/A #N/A
Other 57% 14% ▼0% 29% (n=7) #N/A #N/A #N/A #N/A
Age group Under 35 years ▲37% ▲40% 15% ▼8% (n=750) #N/A #N/A #N/A #N/A
35 - 49 years 31% 32% ▲17% 20% (n=1415) #N/A #N/A #N/A #N/A
50 - 64 years 34% 31% 13% ▲23% (n=1398) #N/A #N/A #N/A #N/A
65 years or older 31% 34% 13% ▲23% (n=1134) #N/A #N/A #N/A #N/A
Type of resident Apartment 35% 34% ▼12% 20% (n=2367) #N/A #N/A #N/A #N/A
House 31% 33% ▲17% 20% (n=2330) #N/A #N/A #N/A #N/A
Electricity bill? Electronic bill 33% 33% 14% 19% (n=3626) #N/A #N/A #N/A #N/A
Paper invoice 31% 33% 14% 22% (n=1071) #N/A #N/A #N/A #N/A
Electricity to heating Use electricity to heat home 32% 33% 15% 19% (n=2594) #N/A #N/A #N/A #N/A
Not using electicity to heat home 34% 33% 13% 20% (n=2025) #N/A #N/A #N/A #N/A
Do not know 33% 35% 12% 21% (n=78) #N/A #N/A #N/A #N/A
Consumer type ACTIVE consumers ▲100% ▼0% ▼0% ▼0% (n=1540) #N/A #N/A #N/A #N/A
AWARE consumers ▼0% ▲64% 16% 20% (n=803) #N/A #N/A #N/A #N/A
INACTIVE comsumers ▼0% ▲44% ▲23% ▲33% (n=2354) #N/A #N/A #N/A #N/A
Less than 5000 kWh ▲38% 36% ▼10% ▼16% (n=892) #N/A #N/A #N/A #N/A
5000- 9 999 kWh 33% 34% 14% 19% (n=776) #N/A #N/A #N/A #N/A
10 000- 14 999 kWh 32% 35% 15% 17% (n=730) #N/A #N/A #N/A #N/A
15 000-19 999 kWh 29% 36% 17% 18% (n=534) #N/A #N/A #N/A #N/A
20 000 - 24 999 kWh 34% ▼27% 16% 23% (n=355) #N/A #N/A #N/A #N/A
More than 25 000 kWh 37% 32% 16% 16% (n=147) #N/A #N/A #N/A #N/A
Do not know 30% 31% 14% ▲25% (n=1263) #N/A #N/A #N/A #N/A
Less than 500 kr 35% 34% ▼11% 20% (n=991) #N/A #N/A #N/A #N/A
50-100 € 35% 34% 14% 18% (n=1025) #N/A #N/A #N/A #N/A
100-150 € 29% ▲39% 13% 18% (n=727) #N/A #N/A #N/A #N/A
150-200 € 29% 34% ▲18% 19% (n=646) #N/A #N/A #N/A #N/A
200-300 € 34% 29% 14% 22% (n=516) #N/A #N/A #N/A #N/A
More than 300 € 35% 31% ▲19% 15% (n=304) #N/A #N/A #N/A #N/A
Do not know 32% ▼26% 15% ▲27% (n=488) #N/A #N/A #N/A #N/A
Country Norway 30% ▼30% 15% ▲25% (n=1289) #N/A #N/A #N/A #N/A
Sweden 32% 32% 15% 20% (n=1219) #N/A #N/A #N/A #N/A
Denmark ▼28% 37% ▲19% ▼16% (n=880) #N/A #N/A #N/A #N/A
Finland ▲39% 35% ▼10% ▼16% (n=1309) #N/A #N/A #N/A #N/A
Total 33% 33% 14% 20% (n=4697) #N/A #N/A #N/A #N/A
Spending on
electricity in total an
average winter
month
Annual KWh-use
#N/A
#N/A
#N/A
Q: When did you last sign a contract with an electricity supplier?
Q: When did you last sign a contract with an electricity supplier?
Background variables
Du
rin
g th
e la
st 1
2
mo
nth
s
1-3
yea
rs a
go
3-5
yea
rs a
go
Mo
re t
han
5 y
ears
ago
Val
id N
#N/A
0% 10% 20% 30% 40%
18

Count %
To save money 1440 46 % 46 % 46 %
To get better terms (other than price) 532 17 % 17 % 17 %
I wanted a green contract (electricity from renewable energy sources) 281 9 % 9 % 9 %
My previous contract expired 671 22 % 22 % 22 %
I was approached by a salesperson 491 16 % 16 % 16 %
Bad experience with my previous contract 191 6 % 6 % 6 %
Change in life situation (moving, etc) 520 17 % 17 % 17 %
To get a local supplier 152 5 % 5 % 5 %
Other reasons 126 4 % 4 % 4 %
Do not know 24 1 % 1 % 1 %
Total 3099
#N/A #N/A #N/A
#N/A #N/A #N/A
#N/A #N/A #N/A
#N/A #N/A #N/A
#N/A #N/A #N/A
#N/A #N/A #N/A
#N/A #N/A #N/A
#N/A #N/A #N/A
Q: Why did you sign a new electricity contract?
Several answers possible.
0% 20% 40% 60%
19

Gender Female ▼43% 16% 8% ▼19% 17% 6% ▲21% ▼3% 4% 1% (n=1444)
Male ▲49% 18% 10% ▲24% 15% 6% ▼13% ▲6% 4% 1% (n=1650)
Other 60% 20% 40% 20% 20% ▼0% 20% ▼0% ▼0% ▼0% (n=5)
Age group Under 35 years ▼39% 16% 11% ▼13% 15% ▲10% ▲33% 7% 4% 1% (n=576)
35 - 49 years ▲51% 19% 10% ▼18% ▼13% 6% 20% ▼3% 4% 1% (n=893)
50 - 64 years 46% 15% 8% ▲25% 17% 6% ▼13% 5% 4% 1% (n=897)
65 years or older 48% 18% 8% ▲28% 18% ▼4% ▼5% 6% 4% 0% (n=733)
Type of resident Apartment ▼42% 16% 10% 20% 17% 6% ▲23% 5% 4% 1% (n=1613)
House ▲51% 18% 8% 23% 15% 6% ▼10% 5% 4% 1% (n=1486)
Electricity bill? Electronic bill ▲49% 17% 10% ▼20% 16% 6% 16% 5% 4% 1% (n=2417)
Paper invoice ▼36% 16% 7% ▲29% 17% 5% 19% 5% 4% 1% (n=682)
Electricity to heating Use electricity to heat home 48% ▲20% 8% 20% 16% ▲8% 17% ▲6% 4% ▼0% (n=1692)
Not using electicity to heat home 45% ▼14% 10% 24% 16% ▼4% 16% ▼4% 4% 1% (n=1354)
Do not know ▼32% ▼8% 11% 21% 17% 6% 26% 2% ▼0% 8% (n=53)
Consumer type ACTIVE consumers 47% 17% 9% ▲25% 17% 5% 16% ▼4% 5% 0% (n=1540)
AWARE consumers ▲53% 19% 11% ▼17% ▼12% 8% 16% 6% 4% 1% (n=516)
INACTIVE comsumers ▼42% 16% 9% 19% 16% 6% 19% 6% 3% 1% (n=1043)
Annual KWh-use Less than 5000 kWh 50% 15% ▲12% 24% 15% 6% 15% 4% 4% 0% (n=659)
5000- 9 999 kWh 45% 18% 12% 23% 15% 6% 15% 6% 3% 1% (n=516)
10 000- 14 999 kWh 45% ▲23% 9% 23% 14% 8% 16% 6% 5% 0% (n=491)
15 000-19 999 kWh 52% 18% 6% ▲28% ▼11% 8% ▼12% 8% 2% 0% (n=344)
20 000 - 24 999 kWh ▲56% 20% ▼5% 24% 17% 4% ▼10% 5% 3% ▼0% (n=218)
More than 25 000 kWh 53% 13% 7% 19% ▲26% ▼2% ▼4% 8% 8% ▼0% (n=101)
Do not know ▼39% ▼14% 7% ▼15% ▲19% 5% ▲25% ▼3% 5% ▲2% (n=770)
Less than 50 € 44% ▼14% 10% 24% 13% 5% ▲22% ▼3% 5% 0% (n=684)
50-100 € 46% 17% ▲13% 20% 17% 6% 15% 5% 3% 1% (n=704)
100-150 € 46% 17% 8% 21% 13% 6% 18% 6% 3% 1% (n=496)
150-200 € 47% ▲22% 7% 23% 16% 7% 15% 6% 4% 0% (n=407)
200-300 € 51% 21% 6% 26% 16% 9% ▼11% 6% 4% ▼0% (n=326)
More than 300 € 51% 16% 10% 28% 21% 7% ▼11% 7% 5% ▼0% (n=198)
Do not know 45% 15% 7% ▼12% 19% ▼3% 19% 3% 5% ▲4% (n=284)
Country Norway ▲52% 17% ▼4% ▼6% ▲20% 7% ▲20% 6% ▲6% 1% (n=774)
Sweden ▼39% ▲25% ▼7% ▲32% ▼10% 5% 15% 4% 4% 1% (n=788)
Denmark ▲51% 15% ▲21% ▼7% ▲22% ▲11% 14% 6% 5% ▲2% (n=570)
Finland 45% ▼12% 8% ▲34% 14% ▼4% 17% 4% ▼2% 0% (n=967)
Total 46% 17% 9% 22% 16% 6% 17% 5% 4% 1% (n=3099)
Do
no
t kn
ow
Val
id N
Spending on electricity in
total an average winter
month
Q: Why did you sign a new electricity contract?
Several answers possible.
Background
To s
ave
mo
ney
To g
et b
ette
r te
rms
(oth
er t
han
pri
ce)
I wan
ted
a g
reen
co
ntr
act
(ele
ctri
city
fro
m r
enew
able
en
ergy
sou
rces
)
My
pre
vio
us
con
trac
t ex
pir
ed
I was
ap
pro
ach
ed b
y a
sale
sper
son
Bad
exp
erie
nce
wit
h m
y p
revi
ou
s
con
trac
t
Ch
ange
in li
fe s
itu
atio
n (
mo
vin
g,
etc)
To g
et a
loca
l su
pp
lier
Oth
er r
easo
ns
20
Count %
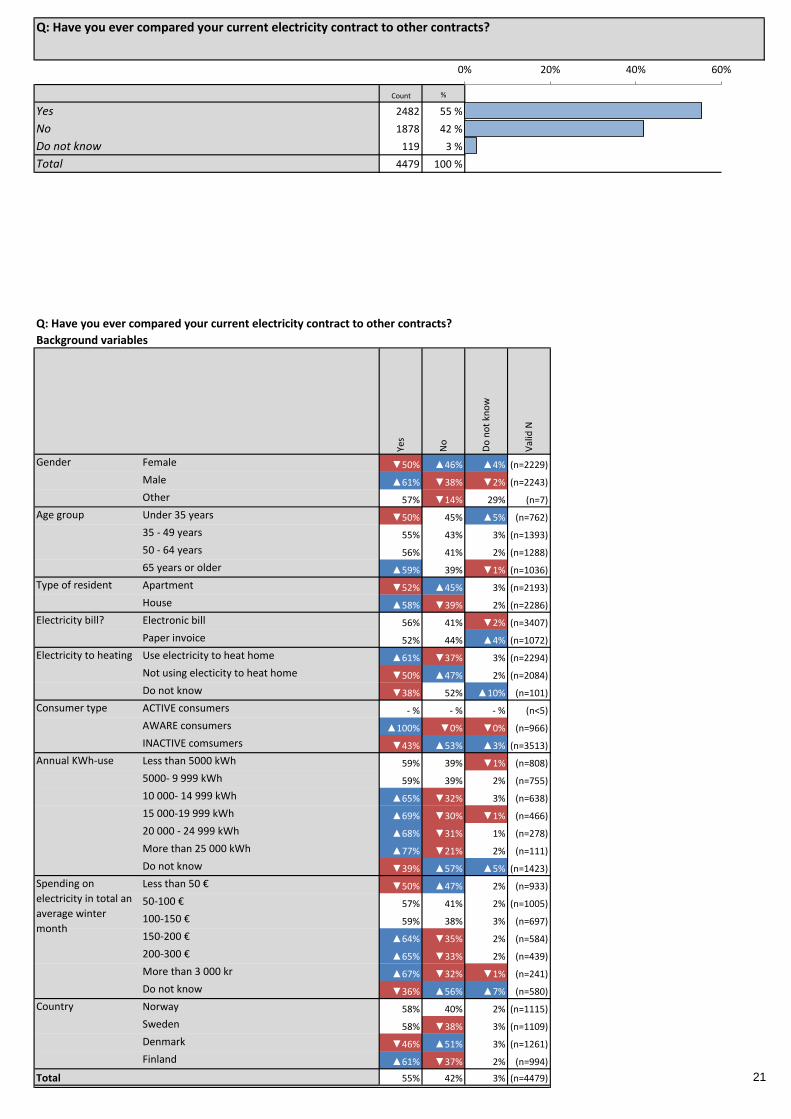
Yes 2482 55 % 55 %
No 1878 42 % 42 %
Do not know 119 3 % 3 %
Total 4479 100 % #N/A
#N/A #N/A #N/A
#N/A #N/A #N/A
#N/A #N/A #N/A
#N/A #N/A #N/A
#N/A #N/A #N/A
#N/A #N/A #N/A
#N/A #N/A #N/A
Gender Female ▼50% ▲46% ▲4% (n=2229) #N/A #N/A #N/A #N/A #N/A
Male ▲61% ▼38% ▼2% (n=2243) #N/A #N/A #N/A #N/A #N/A
Other 57% ▼14% 29% (n=7) #N/A #N/A #N/A #N/A #N/A
Age group Under 35 years ▼50% 45% ▲5% (n=762) #N/A #N/A #N/A #N/A #N/A
35 - 49 years 55% 43% 3% (n=1393) #N/A #N/A #N/A #N/A #N/A
50 - 64 years 56% 41% 2% (n=1288) #N/A #N/A #N/A #N/A #N/A
65 years or older ▲59% 39% ▼1% (n=1036) #N/A #N/A #N/A #N/A #N/A
Type of resident Apartment ▼52% ▲45% 3% (n=2193) #N/A #N/A #N/A #N/A #N/A
House ▲58% ▼39% 2% (n=2286) #N/A #N/A #N/A #N/A #N/A
Electricity bill? Electronic bill 56% 41% ▼2% (n=3407) #N/A #N/A #N/A #N/A #N/A
Paper invoice 52% 44% ▲4% (n=1072) #N/A #N/A #N/A #N/A #N/A
Electricity to heating Use electricity to heat home ▲61% ▼37% 3% (n=2294) #N/A #N/A #N/A #N/A #N/A
Not using electicity to heat home ▼50% ▲47% 2% (n=2084) #N/A #N/A #N/A #N/A #N/A
Do not know ▼38% 52% ▲10% (n=101) #N/A #N/A #N/A #N/A #N/A
Consumer type ACTIVE consumers - % - % - % (n<5) #N/A #N/A #N/A #N/A #N/A
AWARE consumers ▲100% ▼0% ▼0% (n=966) #N/A #N/A #N/A #N/A #N/A
INACTIVE comsumers ▼43% ▲53% ▲3% (n=3513) #N/A #N/A #N/A #N/A #N/A
Less than 5000 kWh 59% 39% ▼1% (n=808) #N/A #N/A #N/A #N/A #N/A
5000- 9 999 kWh 59% 39% 2% (n=755) #N/A #N/A #N/A #N/A #N/A
10 000- 14 999 kWh ▲65% ▼32% 3% (n=638) #N/A #N/A #N/A #N/A #N/A
15 000-19 999 kWh ▲69% ▼30% ▼1% (n=466) #N/A #N/A #N/A #N/A #N/A
20 000 - 24 999 kWh ▲68% ▼31% 1% (n=278) #N/A #N/A #N/A #N/A #N/A
More than 25 000 kWh ▲77% ▼21% 2% (n=111) #N/A #N/A #N/A #N/A #N/A
Do not know ▼39% ▲57% ▲5% (n=1423) #N/A #N/A #N/A #N/A #N/A
Less than 50 € ▼50% ▲47% 2% (n=933) #N/A #N/A #N/A #N/A #N/A
50-100 € 57% 41% 2% (n=1005) #N/A #N/A #N/A #N/A #N/A
100-150 € 59% 38% 3% (n=697) #N/A #N/A #N/A #N/A #N/A
150-200 € ▲64% ▼35% 2% (n=584) #N/A #N/A #N/A #N/A #N/A
200-300 € ▲65% ▼33% 2% (n=439) #N/A #N/A #N/A #N/A #N/A
More than 3 000 kr ▲67% ▼32% ▼1% (n=241) #N/A #N/A #N/A #N/A #N/A
Do not know ▼36% ▲56% ▲7% (n=580) #N/A #N/A #N/A #N/A #N/A
Country Norway 58% 40% 2% (n=1115) #N/A #N/A #N/A #N/A #N/A
Sweden 58% ▼38% 3% (n=1109) #N/A #N/A #N/A #N/A #N/A
Denmark ▼46% ▲51% 3% (n=1261) #N/A #N/A #N/A #N/A #N/A
Finland ▲61% ▼37% 2% (n=994) #N/A #N/A #N/A #N/A #N/A
Total 55% 42% 3% (n=4479) #N/A #N/A #N/A #N/A #N/A
Spending on
electricity in total an
average winter
month
Annual KWh-use
#N/A
#N/A
#N/A
Q: Have you ever compared your current electricity contract to other contracts?
Q: Have you ever compared your current electricity contract to other contracts?
Background variables
Yes
No
Do
no
t kn
ow
Val
id N
#N/A
#N/A
0% 20% 40% 60%
21
Count %
During the last 12 months 966 39 % 39 %
1-3 years ago 1143 46 % 46 %
3-5 years ago 267 11 % 11 %
More than 5 years ago 106 4 % 4 %
Total 2482 100 % #N/A
#N/A #N/A #N/A
#N/A #N/A #N/A
#N/A #N/A #N/A
#N/A #N/A #N/A
#N/A #N/A #N/A
#N/A #N/A #N/A
Gender Female ▼34% 48% 12% ▲6% (n=1120) #N/A #N/A #N/A #N/A
Male ▲43% 44% 9% ▼3% (n=1358) #N/A #N/A #N/A #N/A
Other - % - % - % - % (n<5) #N/A #N/A #N/A #N/A
Age group Under 35 years 44% 46% 8% 2% (n=382) #N/A #N/A #N/A #N/A
35 - 49 years 40% 45% 11% 4% (n=760) #N/A #N/A #N/A #N/A
50 - 64 years 36% 47% 12% 4% (n=724) #N/A #N/A #N/A #N/A
65 years or older 37% 46% 11% 6% (n=616) #N/A #N/A #N/A #N/A
Type of resident Apartment 38% 46% 11% 5% (n=1145) #N/A #N/A #N/A #N/A
House 39% 46% 11% 4% (n=1337) #N/A #N/A #N/A #N/A
Electricity bill? Electronic bill 39% 46% 11% 4% (n=1923) #N/A #N/A #N/A #N/A
Paper invoice 38% 47% 10% 5% (n=559) #N/A #N/A #N/A #N/A
Electricity to heating Use electricity to heat home 41% 45% 10% 3% (n=1394) #N/A #N/A #N/A #N/A
Not using electicity to heat home 36% 46% 12% 5% (n=1050) #N/A #N/A #N/A #N/A
Do not know 29% 55% 5% 11% (n=38) #N/A #N/A #N/A #N/A
Consumer type ACTIVE consumers - % - % - % - % (n<5) #N/A #N/A #N/A #N/A
AWARE consumers ▲100% ▼0% ▼0% ▼0% (n=966) #N/A #N/A #N/A #N/A
INACTIVE comsumers ▼0% ▲75% ▲18% ▲7% (n=1516) #N/A #N/A #N/A #N/A
Less than 5000 kWh 41% 47% 8% 4% (n=477) #N/A #N/A #N/A #N/A
5000- 9 999 kWh 42% 46% 8% 4% (n=445) #N/A #N/A #N/A #N/A
10 000- 14 999 kWh 41% 48% 9% ▼2% (n=415) #N/A #N/A #N/A #N/A
15 000-19 999 kWh 43% 42% 12% 3% (n=322) #N/A #N/A #N/A #N/A
20 000 - 24 999 kWh 42% 43% 12% 4% (n=189) #N/A #N/A #N/A #N/A
More than 25 000 kWh 38% 48% 9% 5% (n=86) #N/A #N/A #N/A #N/A
Do not know ▼30% 47% ▲16% ▲7% (n=548) #N/A #N/A #N/A #N/A
Less than 50 € 38% 48% 9% 6% (n=469) #N/A #N/A #N/A #N/A
50-100 € 39% 47% 10% 4% (n=569) #N/A #N/A #N/A #N/A
100-150 € 44% 45% 8% 3% (n=414) #N/A #N/A #N/A #N/A
150-200 € 42% 43% 12% 3% (n=372) #N/A #N/A #N/A #N/A
200-300 € 38% 44% 13% 6% (n=285) #N/A #N/A #N/A #N/A
More than 3 000 kr 41% 45% 10% 4% (n=162) #N/A #N/A #N/A #N/A
Do not know ▼27% 52% 16% 5% (n=211) #N/A #N/A #N/A #N/A
Country Norway ▲44% 42% 11% 3% (n=643) #N/A #N/A #N/A #N/A
Sweden ▼32% 49% 11% ▲8% (n=646) #N/A #N/A #N/A #N/A
Denmark ▼33% 50% 13% 4% (n=583) #N/A #N/A #N/A #N/A
Finland ▲46% 44% ▼8% ▼2% (n=610) #N/A #N/A #N/A #N/A
Total 39% 46% 11% 4% (n=2482) #N/A #N/A #N/A #N/A
Spending on
electricity in total an
average winter
month
Annual KWh-use
#N/A
#N/A
#N/A
Q: When did you last compare your current electricity contract to other contracts?
Q: When did you last compare your current electricity contract to other contracts?
Background variables
Du
rin
g th
e la
st 1
2
mo
nth
s
1-3
yea
rs a
go
3-5
yea
rs a
go
Mo
re t
han
5 y
ears
ago
Val
id N
#N/A
0% 10% 20% 30% 40% 50%
22

Count %
The switching process was too complicated 125 6 % 6 % 6 %
There was little or no saving from switching 904 43 % 43 % 43 %
I was satisfied with my current contract 1085 51 % 51 % 51 %
It was difficult to find relevant information 164 8 % 8 % 8 %
It was difficult to understand the differences between the contracts 301 14 % 14 % 14 %
I was unable to switch (for example because the supplier made it difficult) 83 4 % 4 % 4 %
The binding period for my current contract had not expired 222 11 % 11 % 11 %
I wanted to keep my supplier as it is a local supplier 300 14 % 14 % 14 %
Other reason 98 5 % 5 % 5 %
Do not know 38 2 % 2 % 2 %
Total 2109
#N/A #N/A #N/A
#N/A #N/A #N/A
#N/A #N/A #N/A
#N/A #N/A #N/A
#N/A #N/A #N/A
#N/A #N/A #N/A
#N/A #N/A #N/A
#N/A #N/A #N/A
Q: You have compared different offers but decided to stay in your current contract. Why?
Several answers possible.
0% 20% 40% 60%
23

Gender Female 6% ▼39% 49% 7% 16% ▼3% 10% ▼12% 5% 3% (n=917)
Male 6% ▲46% 53% 8% 13% ▲5% 11% ▲16% 4% 1% (n=1188)
Other - % - % - % - % - % - % - % - % - % - % (n<5)
Age group Under 35 years ▲13% 38% ▼43% 11% ▲19% ▲11% 11% 15% ▼2% 3% (n=344)
35 - 49 years 7% 45% 47% 8% 15% 5% 10% 14% 5% 2% (n=647)
50 - 64 years 4% 44% 54% 6% 12% ▼1% 9% 14% 5% 1% (n=602)
65 years or older ▼3% 41% ▲59% 7% 13% ▼1% 12% 15% 5% 1% (n=516)
Type of resident Apartment ▲8% 41% 52% 8% 14% ▲5% 11% 14% 4% 2% (n=966)
House ▼4% 44% 51% 8% 15% ▼3% 10% 14% 5% 2% (n=1143)
Electricity bill? Electronic bill 5% 44% 53% 8% 15% 3% 10% 13% 5% ▼1% (n=1634)
Paper invoice 8% 38% 47% 7% 12% 5% 13% 18% 4% ▲4% (n=475)
Electricity to heating Use electricity to heat home 6% 41% 49% 9% 15% ▲5% 12% 15% 5% 2% (n=1206)
Not using electicity to heat home 5% 45% 54% 7% 13% ▼2% 9% 14% 4% 2% (n=871)
Do not know 9% 28% 66% 6% 9% 3% 9% 6% ▼0% 9% (n=32)
Consumer type ACTIVE consumers - % - % - % - % - % - % - % - % - % - % (n<5)
AWARE consumers 6% 45% 51% 8% 13% 4% 12% 12% 5% ▼1% (n=966)
INACTIVE comsumers 6% 41% 52% 8% 15% 4% 9% 16% 4% ▲3% (n=1143)
Annual KWh-use Less than 5000 kWh 4% 47% 51% 6% 12% ▼2% 10% 12% 4% 2% (n=420)
5000- 9 999 kWh 4% 45% 54% 9% 14% 3% 11% 15% 6% ▼1% (n=392)
10 000- 14 999 kWh 6% 42% 49% 10% 16% ▲7% 14% 16% 4% 1% (n=370)
15 000-19 999 kWh 7% 45% 50% 6% 13% 5% 13% ▲21% 4% 1% (n=272)
20 000 - 24 999 kWh ▼1% 46% 57% 9% 16% 3% 9% 14% 5% 1% (n=160)
More than 25 000 kWh 3% 46% 46% 8% ▼7% 7% 15% 12% 12% 3% (n=74)
Do not know ▲10% ▼34% 51% 7% 16% 4% ▼6% ▼10% 4% ▲4% (n=421)
Less than 50 € 7% 40% 56% 6% 13% ▼2% 9% 13% 4% 1% (n=399)
50-100 € 5% 45% 53% 7% 16% 3% 9% 14% 5% 2% (n=488)
100-150 € 4% 43% 50% 10% 12% 5% 10% 16% 4% 2% (n=369)
150-200 € 7% 45% 51% 8% 16% 5% 15% 15% 5% 2% (n=316)
200-300 € 6% 45% 49% 10% 16% 7% 13% 17% 6% 1% (n=231)
More than 300 € 5% 37% 45% 9% 17% 4% 15% 14% 6% 2% (n=139)
Do not know 7% 41% 50% 6% 10% 3% ▼5% ▼8% 5% 5% (n=167)
Country Norway ▼3% ▲50% ▲58% 7% 15% 3% ▼4% 13% 6% 1% (n=553)
Sweden 6% ▼33% ▼46% ▼4% 12% 3% ▲15% 13% 5% 2% (n=520)
Denmark ▲9% 48% 56% ▲14% ▲21% 5% ▼7% 14% ▼3% 1% (n=486)
Finland 6% 41% ▼46% 7% ▼10% 5% ▲17% 17% 5% 2% (n=550)
Total 6% 43% 51% 8% 14% 4% 11% 14% 5% 2% (n=2109)
Do
no
t kn
ow
Val
id N
Spending on electricity in
total an average winter
month
Q: You have compared different offers but decided to stay in your current contract. Why?
Several answers possible.
Background
The
swit
chin
g p
roce
ss w
as t
oo
com
plic
ated
Ther
e w
as li
ttle
or
no
sav
ing
fro
m
swit
chin
g
I was
sat
isfi
ed w
ith
my
curr
ent
con
trac
t
It w
as d
iffi
cult
to
fin
d r
elev
ant
info
rmat
ion
It w
as d
iffi
cult
to
un
der
stan
d t
he
dif
fere
nce
s b
etw
een
th
e co
ntr
acts
I was
un
able
to
sw
itch
(fo
r ex
amp
le
bec
ause
th
e su
pp
lier
mad
e it
dif
ficu
lt)
The
bin
din
g p
erio
d f
or
my
curr
ent
con
trac
t h
ad n
ot
exp
ired
I wan
ted
to
kee
p m
y su
pp
lier
as it
is
a lo
cal s
up
plie
r
Oth
er r
easo
n
24

Count %
The switching process is too complicated 37 10 % 10 % 10 %
There is little or no saving from switching 153 41 % 41 % 41 %
I am satisfied with my current contract 203 54 % 54 % 54 %
It is difficult to find relevant information 41 11 % 11 % 11 %
It is difficult to understand the differences between the contracts 92 25 % 25 % 25 %
The binding period for my current contract has not expired 19 5 % 5 % 5 %
I want to keep my supplier as it is a local supplier 65 17 % 17 % 17 %
I do not care about my electricity contract 12 3 % 3 % 3 %
Other reason 27 7 % 7 % 7 %
Do not know 11 3 % 3 % 3 %
Total 373
#N/A #N/A #N/A
#N/A #N/A #N/A
#N/A #N/A #N/A
#N/A #N/A #N/A
#N/A #N/A #N/A
#N/A #N/A #N/A
#N/A #N/A #N/A
#N/A #N/A #N/A
Q: Why have you not switched or compared contracts more often?
Several answers possible.
0% 20% 40% 60%
25

Gender Female 9% ▼34% 56% ▼7% 26% 4% 16% 2% 7% ▲5% (n=203)
Male 11% ▲49% 53% ▲16% 23% 6% 19% 5% 7% ▼1% (n=170)
Other - % - % - % - % - % - % - % - % - % - % (n<5)
Age group Under 35 years 8% 29% 42% 16% 29% 8% 18% 8% 5% 5% (n=38)
35 - 49 years 14% 46% 45% 16% 29% 5% 15% 4% 9% 4% (n=113)
50 - 64 years 10% 42% 60% 8% 26% 5% 22% 4% 8% 3% (n=122)
65 years or older 6% 39% 63% 7% 16% 4% 14% ▼0% 5% 1% (n=100)
Type of resident Apartment ▲16% 41% 51% 11% 26% 6% 17% 4% 7% 3% (n=179)
House ▼5% 41% 57% 11% 24% 4% 18% 3% 7% 3% (n=194)
Electricity bill? Electronic bill 8% 39% 57% 11% 24% 4% 16% 3% 8% 2% (n=289)
Paper invoice 15% 46% 46% 12% 26% 8% 21% 4% 5% 6% (n=84)
Electricity to heating Use electricity to heat home 10% ▼34% 53% 14% 27% 6% 22% 4% 6% 3% (n=188)
Not using electicity to heat home 11% ▲49% 58% 8% 22% 4% 13% 3% 8% 2% (n=179)
Do not know ▼0% 33% ▼17% ▼0% 17% ▼0% ▼0% ▼0% ▼0% ▲50% (n=6)
Consumer type ACTIVE consumers - % - % - % - % - % - % - % - % - % - % (n<5)
AWARE consumers - % - % - % - % - % - % - % - % - % - % (n<5)
INACTIVE comsumers 10% 41% 54% 11% 25% 5% 17% 3% 7% 3% (n=373)
Annual KWh-use Less than 5000 kWh 7% 53% 56% 7% 21% 5% 16% 4% 11% ▼0% (n=57)
5000- 9 999 kWh 8% 42% 55% 11% 23% 4% 9% ▼0% 9% 4% (n=53)
10 000- 14 999 kWh 7% 38% 42% 13% 18% 7% 27% 4% 4% 2% (n=45)
15 000-19 999 kWh 20% 44% 52% 18% 36% 10% 18% ▼0% 10% ▼0% (n=50)
20 000 - 24 999 kWh ▼0% 38% 52% 17% 21% 10% 28% ▼0% 3% ▼0% (n=29)
More than 25 000 kWh ▼0% 42% 50% 8% 25% ▼0% 17% 8% ▼0% 8% (n=12)
Do not know 13% 36% 60% 8% 26% 2% 16% 6% 6% 6% (n=127)
Less than 50 € 13% 47% 53% 7% 17% 6% 13% 6% 9% 3% (n=70)
50-100 € 11% 49% 65% 9% 23% 4% 10% ▼0% 6% ▼0% (n=81)
100-150 € 9% 36% 44% 11% 22% 4% 24% 2% 9% 4% (n=45)
150-200 € 11% 34% 48% 14% 30% 5% 20% 4% 2% ▼0% (n=56)
200-300 € 7% 37% 48% 13% 33% 11% ▲35% 4% 9% 4% (n=54)
More than 300 € 9% 48% 52% 17% 30% 4% 13% ▼0% 9% 4% (n=23)
Do not know 7% 32% 64% 11% 20% ▼0% 9% 7% 9% 9% (n=44)
Country Norway 6% 30% 61% 14% 27% ▼0% 17% 4% 11% 2% (n=90)
Sweden 10% 42% 52% 12% 19% ▲10% 15% 2% 5% 1% (n=126)
Denmark 11% 53% 51% 10% 29% ▼1% ▼9% 2% 8% 6% (n=97)
Finland 13% 37% 57% 5% 27% 8% ▲37% 7% 5% 3% (n=60)
Total 10% 41% 54% 11% 25% 5% 17% 3% 7% 3% (n=373)
Do
no
t kn
ow
Val
id N
Spending on electricity in
total an average winter
month
Q: Why have you not switched or compared contracts more often?
Several answers possible.
Background
The
swit
chin
g p
roce
ss is
to
o
com
plic
ated
Ther
e is
litt
le o
r n
o s
avin
g fr
om
swit
chin
g
I am
sat
isfi
ed w
ith
my
curr
ent
con
trac
t
It is
dif
ficu
lt t
o f
ind
rel
evan
t
info
rmat
ion
It is
dif
ficu
lt t
o u
nd
erst
and
th
e
dif
fere
nce
s b
etw
een
th
e co
ntr
acts
The
bin
din
g p
erio
d f
or
my
curr
ent
con
trac
t h
as n
ot
exp
ired
I wan
t to
kee
p m
y su
pp
lier
as it
is a
loca
l su
pp
lier
I do
no
t ca
re a
bo
ut
my
elec
tric
ity
con
trac
t
Oth
er r
easo
n
26

Count %
The switching process is too complicated 99 12 % 12 % 12 %
There is little or no saving from switching 204 24 % 24 % 24 %
I am satisfied with my current contract 325 39 % 39 % 39 %
It is difficult to find relevant informationn 111 13 % 13 % 13 %
It is difficult to understand the differences between the contracts 208 25 % 25 % 25 %
The binding period for my current contract has not expired 24 3 % 3 % 3 %
I want to keep my supplier as it is a local supplier 105 12 % 12 % 12 %
I did not know it was possible 40 5 % 5 % 5 %
I do not care about my electricity contract 60 7 % 7 % 7 %
Other reason 36 4 % 4 % 4 %
Do not know 90 11 % 11 %
Total 844
#N/A #N/A #N/A
#N/A #N/A #N/A
#N/A #N/A #N/A
#N/A #N/A #N/A
#N/A #N/A #N/A
#N/A #N/A #N/A
#N/A #N/A #N/A
Q: Why have you never switched or compared contracts?
Several answers possible.
0% 20% 40% 60%
27

Gender Female 13% ▼19% 42% 11% 26% 2% 11% 4% ▼5% 6% 13% (n=484)
Male 10% ▲31% 35% 16% 22% 4% 14% 5% 10% 2% 8% (n=358)
Other - % - % - % - % - % - % - % - % - % - % - % (n<5)
Age group Under 35 years 15% ▼13% 32% 12% 23% 4% 11% ▲10% 9% 3% 15% (n=189)
35 - 49 years 13% 23% ▼28% 16% 29% 3% ▼7% 4% 10% 7% 11% (n=261)
50 - 64 years 9% 27% 42% 12% 24% 2% 15% 3% ▼3% 4% 12% (n=234)
65 years or older 10% ▲34% ▲59% 11% 19% 1% 18% 3% 6% 2% 3% (n=160)
Type of resident Apartment 15% ▼20% 37% 12% 24% 4% 14% 5% 8% 3% 14% (n=420)
House 9% ▲28% 40% 14% 25% 1% 11% 4% 6% 5% 8% (n=424)
Electricity bill? Electronic bill ▼9% 25% 40% 13% 24% 3% ▼11% 4% 6% 4% 11% (n=638)
Paper invoice ▲20% 21% 33% 13% 27% 4% ▲18% 7% 9% 4% 10% (n=206)
Electricity to heating Use electricity to heat home 15% ▼17% 34% 12% 22% 4% 14% 7% 6% 5% 13% (n=320)
Not using electicity to heat home 9% ▲29% 42% 14% 26% 2% 11% 3% 8% 4% 8% (n=492)
Do not know 16% 13% 34% 9% 28% 3% 13% 6% 6% ▼0% 25% (n=32)
Consumer type ACTIVE consumers - % - % - % - % - % - % - % - % - % - % - % (n<5)
AWARE consumers - % - % - % - % - % - % - % - % - % - % - % (n<5)
INACTIVE comsumers 12% 24% 39% 13% 25% 3% 12% 5% 7% 4% 11% (n=844)
Annual KWh-use Less than 5000 kWh 8% ▲38% 44% 11% 19% 1% 8% 3% 7% 3% 7% (n=144)
5000- 9 999 kWh 11% 30% 40% 18% 26% 6% 12% 7% 6% 2% 3% (n=141)
10 000- 14 999 kWh 12% 21% 35% 16% 30% ▼0% 21% 8% 9% ▼0% 9% (n=86)
15 000-19 999 kWh 13% 16% 36% ▼4% 16% 9% 11% 9% 11% 7% 7% (n=45)
20 000 - 24 999 kWh 10% 35% 50% 10% 25% 5% 25% ▼0% 5% ▼0% 5% (n=20)
More than 25 000 kWh ▼0% ▼0% ▲80% 40% 40% 20% ▲60% ▼0% 20% ▼0% 0% (n=5)
Do not know 13% ▼19% 36% 12% 26% 2% 11% 3% 6% 6% 16% (n=403)
Less than 50 € 11% 31% 44% 11% 21% 3% 17% 5% 9% 3% 8% (n=188)
50-100 € 11% 22% 40% 16% 30% 3% 10% 6% 9% 4% 7% (n=203)
100-150 € 14% 27% 34% 12% 21% 4% 12% 6% 3% ▼1% 9% (n=116)
150-200 € 10% 29% 40% 16% 24% 3% 16% 4% 6% 6% 7% (n=70)
200-300 € 19% ▼9% 34% 15% 30% ▼0% 25% 6% 9% 6% 11% (n=53)
More than 300 € 17% 11% 33% 11% 39% 11% 11% 17% ▼0% 6% 0% (n=18)
Do not know 10% 22% 36% 11% 23% 1% ▼6% ▼2% 7% 7% 19% (n=196)
Country Norway 10% 17% 41% 11% ▼16% 1% 16% 3% 7% 8% 14% (n=143)
Sweden ▲18% ▼17% 35% 12% 21% ▲9% 13% 7% 9% 4% 14% (n=181)
Denmark ▼9% ▲30% 40% 14% 28% ▼1% ▼7% 4% 6% 3% 9% (n=431)
Finland 16% 24% 33% 17% 31% 3% ▲31% 4% 6% 2% 9% (n=89)
Total 12% 24% 39% 13% 25% 3% 12% 5% 7% 4% 11% (n=844)
Oth
er r
easo
n
Do
no
t kn
ow
Val
id N
Spending on electricity in
total an average winter
month
Q: Why have you never switched or compared contracts?
Several answers possible.
Background
The
swit
chin
g p
roce
ss is
to
o
com
plic
ated
Ther
e is
litt
le o
r n
o s
avin
g fr
om
swit
chin
g
I am
sat
isfi
ed w
ith
my
curr
ent
con
trac
t
It is
dif
ficu
lt t
o f
ind
rel
evan
t
info
rmat
ion
n
I did
no
t kn
ow
it w
as p
oss
ible
I do
no
t ca
re a
bo
ut
my
elec
tric
ity
con
trac
t
It is
dif
ficu
lt t
o u
nd
erst
and
th
e
dif
fere
nce
s b
etw
een
th
e co
ntr
acts
The
bin
din
g p
erio
d f
or
my
curr
ent
con
trac
t h
as n
ot
exp
ired
I wan
t to
kee
p m
y su
pp
lier
as it
is a
loca
l su
pp
lier
28

Count %
I did 3795 63 % 63 %
Someone else in my household did 597 10 % 10 %
The supplier or sales representatives on behalf of supplier 739 12 % 12 %
Broker (a company that with a power of attorney from the customer signs a contract for the customer with a supplier)176 3 % 3 %
A cooperative/union I am member of (for example labour union) 75 1 % 1 %
Other 121 2 % 2 %
Can not remember / Do not know 516 9 % 9 %
Total 6019 100 % #N/A
#N/A #N/A #N/A
#N/A #N/A #N/A
#N/A #N/A #N/A
Gender Female ▼57% ▲14% 12% 2% 1% ▲3% ▲10% (n=2981) #N/A
Male ▲69% ▼6% 12% 3% 1% ▼1% ▼7% (n=3027) #N/A
Other ▼27% 27% 18% 9% 9% ▼0% 9% (n=11) #N/A
Age group Under 35 years ▼55% ▲15% 13% ▲5% 2% 3% 7% (n=1041) #N/A
35 - 49 years 62% ▲12% ▼11% 3% 2% 2% 9% (n=1832) #N/A
50 - 64 years ▲66% ▼8% 12% ▼2% 1% 2% 10% (n=1758) #N/A
65 years or older ▲67% ▼6% 14% ▼2% 1% 2% 9% (n=1388) #N/A
Type of resident Apartment ▲65% ▼7% 13% 3% 1% ▲3% ▼7% (n=3013) #N/A
House ▼61% ▲13% 12% 3% 1% ▼1% ▲10% (n=3006) #N/A
Electricity bill? Electronic bill ▲64% ▼9% 12% 3% 1% 2% 9% (n=4615) #N/A
Paper invoice ▼59% ▲14% 12% 3% 1% 2% 8% (n=1404) #N/A
Electricity to heating Use electricity to heat home 63% ▲11% 13% 3% 1% 2% ▼6% (n=3127) #N/A
Not using electicity to heat home 63% ▼8% 12% 2% 1% 2% ▲12% (n=2765) #N/A
Do not know 59% 9% 17% 4% 1% 2% 9% (n=127) #N/A
Consumer type ACTIVE consumers ▲71% ▼5% ▲20% ▼2% 1% ▼0% ▼1% (n=1540) #N/A
AWARE consumers ▲75% 9% ▼8% 3% 1% 1% ▼3% (n=966) #N/A
INACTIVE comsumers ▼56% ▲12% ▼10% ▲3% ▲2% ▲3% ▲13% (n=3513) #N/A
Less than 5000 kWh ▲71% ▼5% 12% 3% 1% 2% 7% (n=1146) #N/A
5000- 9 999 kWh 66% 8% 13% 3% 1% ▼1% 7% (n=1011) #N/A
10 000- 14 999 kWh 64% 12% 13% 4% 1% ▼1% ▼5% (n=875) #N/A
15 000-19 999 kWh ▲68% 11% 10% 5% 1% 2% ▼4% (n=619) #N/A
20 000 - 24 999 kWh ▲70% 7% 13% 3% 2% ▼1% ▼5% (n=399) #N/A
More than 25 000 kWh 63% 8% 19% 4% ▼0% 3% ▼4% (n=165) #N/A
Do not know ▼52% ▲14% 13% 2% 1% ▲3% ▲15% (n=1804) #N/A
Less than 50 € ▲69% ▼5% 12% 2% 1% 3% 8% (n=1281) #N/A
50-100 € 63% 9% 13% 3% 2% 3% ▲8% (n=1363) #N/A
100-150 € 66% ▲13% 14% 4% 2% 1% (n=856) #N/A #N/A
150-200 € ▲68% 11% 13% 5% 1% 2% (n=728) #N/A #N/A
200-300 € 72% 12% 11% 2% 1% 2% (n=585) #N/A #N/A
More than 3 000 kr 64% ▲16% 15% 3% ▼0% 2% (n=329) #N/A #N/A
Do not know ▼48% 13% 12% 2% 1% 2% (n=735) #N/A #N/A
Country Norway ▲68% 10% ▲15% 2% 2% 3% (n=1421) #N/A #N/A
Sweden ▲67% 11% ▼10% 4% ▼1% 2% ▼6% (n=1501) #N/A
Denmark ▼53% ▼8% 11% 4% ▲2% ▲3% ▲19% (n=1508) #N/A
Finland ▲68% 11% 14% ▼2% ▼0% ▼1% ▼3% (n=1504) #N/A
Total 63% 10% 12% 3% 1% 2% 9% (n=6019) #N/A
Spending on
electricity in total an
average winter
month
Annual KWh-use
Can
no
t re
mem
ber
/ D
o
no
t kn
ow
Val
id N
#N/A
Q: Who initiated the signing of your current contract?
Q: Who initiated the signing of your current contract?
Background variables
I did
Som
eon
e el
se in
my
ho
use
ho
ld d
id
The
sup
plie
r o
r sa
les
rep
rese
nta
tive
s o
n
beh
alf
of
sup
plie
r
Bro
ker
(a c
om
pan
y th
at
wit
h a
po
wer
of
atto
rney
fro
m t
he
A c
oo
per
ativ
e/u
nio
n I
am m
emb
er o
f (f
or
exam
ple
lab
ou
r u
nio
n)
Oth
er
0% 20% 40% 60% 80%
29
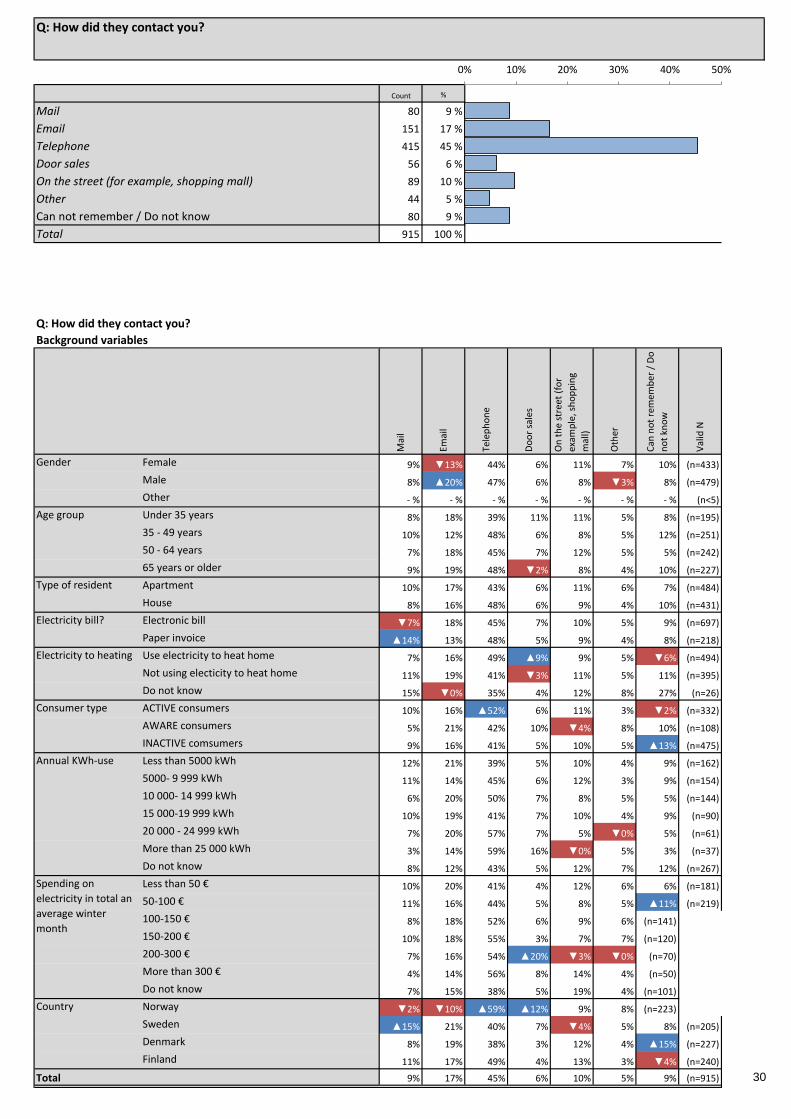
Count %
Mail 80 9 % 9 %
Email 151 17 % 17 %
Telephone 415 45 % 45 %
Door sales 56 6 % 6 %
On the street (for example, shopping mall) 89 10 % 10 %
Other 44 5 % 5 %
Can not remember / Do not know 80 9 % 9 %
Total 915 100 % #N/A
#N/A #N/A #N/A
#N/A #N/A #N/A
#N/A #N/A #N/A
Gender Female 9% ▼13% 44% 6% 11% 7% 10% (n=433) #N/A
Male 8% ▲20% 47% 6% 8% ▼3% 8% (n=479) #N/A
Other - % - % - % - % - % - % - % (n<5) #N/A
Age group Under 35 years 8% 18% 39% 11% 11% 5% 8% (n=195) #N/A
35 - 49 years 10% 12% 48% 6% 8% 5% 12% (n=251) #N/A
50 - 64 years 7% 18% 45% 7% 12% 5% 5% (n=242) #N/A
65 years or older 9% 19% 48% ▼2% 8% 4% 10% (n=227) #N/A
Type of resident Apartment 10% 17% 43% 6% 11% 6% 7% (n=484) #N/A
House 8% 16% 48% 6% 9% 4% 10% (n=431) #N/A
Electricity bill? Electronic bill ▼7% 18% 45% 7% 10% 5% 9% (n=697) #N/A
Paper invoice ▲14% 13% 48% 5% 9% 4% 8% (n=218) #N/A
Electricity to heating Use electricity to heat home 7% 16% 49% ▲9% 9% 5% ▼6% (n=494) #N/A
Not using electicity to heat home 11% 19% 41% ▼3% 11% 5% 11% (n=395) #N/A
Do not know 15% ▼0% 35% 4% 12% 8% 27% (n=26) #N/A
Consumer type ACTIVE consumers 10% 16% ▲52% 6% 11% 3% ▼2% (n=332) #N/A
AWARE consumers 5% 21% 42% 10% ▼4% 8% 10% (n=108) #N/A
INACTIVE comsumers 9% 16% 41% 5% 10% 5% ▲13% (n=475) #N/A
Less than 5000 kWh 12% 21% 39% 5% 10% 4% 9% (n=162) #N/A
5000- 9 999 kWh 11% 14% 45% 6% 12% 3% 9% (n=154) #N/A
10 000- 14 999 kWh 6% 20% 50% 7% 8% 5% 5% (n=144) #N/A
15 000-19 999 kWh 10% 19% 41% 7% 10% 4% 9% (n=90) #N/A
20 000 - 24 999 kWh 7% 20% 57% 7% 5% ▼0% 5% (n=61) #N/A
More than 25 000 kWh 3% 14% 59% 16% ▼0% 5% 3% (n=37) #N/A
Do not know 8% 12% 43% 5% 12% 7% 12% (n=267) #N/A
Less than 50 € 10% 20% 41% 4% 12% 6% 6% (n=181) #N/A
50-100 € 11% 16% 44% 5% 8% 5% ▲11% (n=219) #N/A
100-150 € 8% 18% 52% 6% 9% 6% (n=141) #N/A #N/A
150-200 € 10% 18% 55% 3% 7% 7% (n=120) #N/A #N/A
200-300 € 7% 16% 54% ▲20% ▼3% ▼0% (n=70) #N/A #N/A
More than 300 € 4% 14% 56% 8% 14% 4% (n=50) #N/A #N/A
Do not know 7% 15% 38% 5% 19% 4% (n=101) #N/A #N/A
Country Norway ▼2% ▼10% ▲59% ▲12% 9% 8% (n=223) #N/A #N/A
Sweden ▲15% 21% 40% 7% ▼4% 5% 8% (n=205) #N/A
Denmark 8% 19% 38% 3% 12% 4% ▲15% (n=227) #N/A
Finland 11% 17% 49% 4% 13% 3% ▼4% (n=240) #N/A
Total 9% 17% 45% 6% 10% 5% 9% (n=915) #N/A
Spending on
electricity in total an
average winter
month
Annual KWh-use
Can
no
t re
mem
ber
/ D
o
no
t kn
ow
Val
id N
#N/A
Q: How did they contact you?
Q: How did they contact you?
Background variables
Mai
l
Emai
l
Tele
ph
on
e
Do
or
sale
s
On
th
e st
reet
(fo
r
exam
ple
, sh
op
pin
g
mal
l)
Oth
er
0% 10% 20% 30% 40% 50%
30
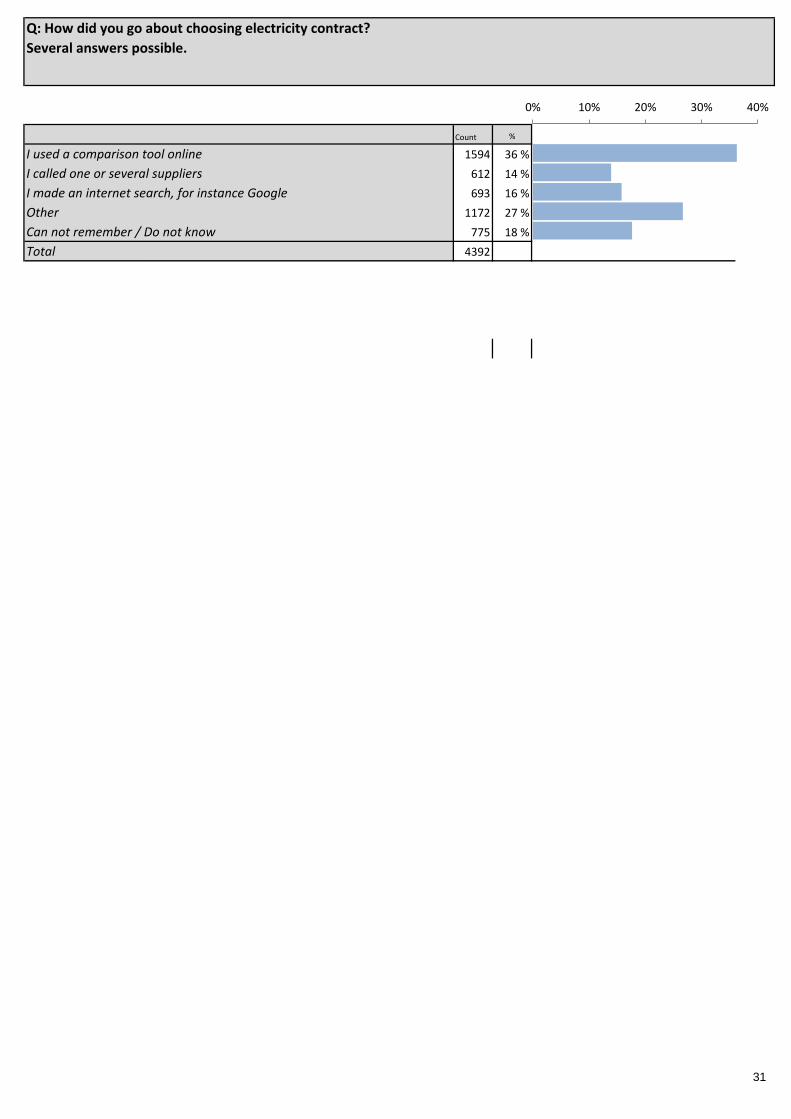
Count %
I used a comparison tool online 1594 36 % 36 % 36 %
I called one or several suppliers 612 14 % 14 % 14 %
I made an internet search, for instance Google 693 16 % 16 % 16 %
Other 1172 27 % 27 % 27 %
Can not remember / Do not know 775 18 % 18 % 18 %
Total 4392
#N/A #N/A #N/A
#N/A #N/A #N/A
#N/A #N/A #N/A
#N/A #N/A #N/A
#N/A #N/A
#N/A #N/A #N/A
#N/A #N/A #N/A
#N/A #N/A #N/A
#N/A #N/A #N/A
#N/A #N/A #N/A
#N/A #N/A #N/A
#N/A #N/A #N/A
#N/A #N/A #N/A
Q: How did you go about choosing electricity contract?
Several answers possible.
0% 10% 20% 30% 40%
31

Gender Female ▼31% 14% ▼14% ▲29% ▲21% (n=2135) #N/A #N/A #N/A #N/A #N/A
Male ▲41% 14% ▲17% ▼24% ▼15% (n=2251) #N/A #N/A #N/A #N/A #N/A
Other 33% 17% 33% 50% ▼0% (n=6) #N/A #N/A #N/A #N/A #N/A
Age group Under 35 years 37% 16% ▲23% 26% ▼14% (n=728) #N/A #N/A #N/A #N/A #N/A
35 - 49 years 39% 15% 17% ▼24% 16% (n=1355) #N/A #N/A #N/A #N/A #N/A
50 - 64 years 34% 13% 14% 28% 20% (n=1306) #N/A #N/A #N/A #N/A #N/A
65 years or older 35% 12% ▼11% 29% 19% (n=1003) #N/A #N/A #N/A #N/A #N/A
Type of resident Apartment 34% ▼12% 16% ▲30% 18% (n=2188) #N/A #N/A #N/A #N/A #N/A
House 38% ▲16% 16% ▼23% 17% (n=2204) #N/A #N/A #N/A #N/A #N/A
Electricity bill? Electronic bill ▲38% 14% 17% ▼26% ▼17% (n=3363) #N/A #N/A #N/A #N/A #N/A
Paper invoice ▼30% 14% 13% ▲30% ▲21% (n=1029) #N/A #N/A #N/A #N/A #N/A
Electricity to heating Use electricity to heat home ▲41% 14% ▲18% ▼24% 16% (n=2341) #N/A #N/A #N/A #N/A #N/A
Not using electicity to heat home ▼32% 14% ▼13% ▲29% 19% (n=1964) #N/A #N/A #N/A #N/A #N/A
Do not know ▼21% ▼5% 17% 33% 26% (n=87) #N/A #N/A #N/A #N/A #N/A
Consumer type ACTIVE consumers ▲49% 14% 15% 27% ▼7% (n=1169) #N/A #N/A #N/A #N/A #N/A
AWARE consumers ▲52% 12% ▲21% ▼19% ▼10% (n=812) #N/A #N/A #N/A #N/A #N/A
INACTIVE comsumers ▼25% 14% 15% ▲29% ▲25% (n=2411) #N/A #N/A #N/A #N/A #N/A
Annual KWh-use Less than 5000 kWh 39% ▼11% 17% 27% 15% (n=864) #N/A #N/A #N/A #N/A #N/A
5000- 9 999 kWh 39% 16% 17% 26% 15% (n=757) #N/A #N/A #N/A #N/A #N/A
10 000- 14 999 kWh ▲44% 15% 19% 23% ▼12% (n=667) #N/A #N/A #N/A #N/A #N/A
15 000-19 999 kWh ▲46% 17% 17% ▼21% ▼13% (n=487) #N/A #N/A #N/A #N/A #N/A
20 000 - 24 999 kWh 42% 13% 16% 25% 15% (n=309) #N/A #N/A #N/A #N/A #N/A
More than 25 000 kWh ▲48% 20% 17% 19% ▼10% (n=117) #N/A #N/A #N/A #N/A #N/A
Do not know ▼22% 13% ▼12% ▲33% ▲28% (n=1191) #N/A #N/A #N/A #N/A #N/A
Less than 50 € ▼32% 11% 15% ▲31% 18% (n=951) #N/A #N/A #N/A #N/A #N/A
50-100 € 37% 14% 16% 28% 16% (n=984) #N/A #N/A #N/A #N/A #N/A
100-150 € 39% 16% 16% 27% ▼14% (n=675) #N/A #N/A #N/A #N/A #N/A
150-200 € 40% 15% 18% 25% ▼13% (n=577) #N/A #N/A #N/A #N/A #N/A
200-300 € ▲43% 11% 15% 25% 17% (n=492) #N/A #N/A #N/A #N/A #N/A
More than 300 € 43% 19% 17% 23% ▼12% (n=265) #N/A #N/A #N/A #N/A #N/A
Do not know ▼25% 14% 13% ▼21% ▲36% (n=448) #N/A #N/A #N/A #N/A #N/A
Country Norway 36% 13% 17% 26% 18% (n=1113) #N/A #N/A #N/A #N/A #N/A
Sweden ▲40% 12% 15% 24% 18% (n=1168) #N/A #N/A #N/A #N/A #N/A
Denmark ▼24% ▲24% 17% 26% ▲21% (n=912) #N/A #N/A #N/A #N/A #N/A
Finland ▲42% ▼9% 14% ▲30% ▼15% (n=1199) #N/A #N/A #N/A #N/A #N/A
Total 36% 14% 16% 27% 18% (n=4392) #N/A #N/A #N/A #N/A #N/A
#N/A
#N/A
Spending on electricity in
total an average winter
month
Q: How did you go about choosing electricity contract?
Several answers possible.
Background
I use
d a
co
mp
aris
on
to
ol o
nlin
e
I cal
led
on
e o
r se
vera
l su
pp
liers
I mad
e an
inte
rnet
sea
rch
, fo
r
inst
ance
Go
ogl
e
Oth
er
Can
no
t re
mem
ber
/ D
o n
ot
kno
w
Val
id N
#N/A
#N/A
#N/A
32

Count %
Yes 3912 65 % 65 %
No 2107 35 % 35 %
Total 6019 100 % #N/A
#N/A #N/A #N/A
#N/A #N/A #N/A
#N/A #N/A #N/A
#N/A #N/A #N/A
#N/A #N/A #N/A
#N/A #N/A #N/A
#N/A #N/A #N/A
#N/A #N/A #N/A
Gender Female ▼59% ▲41% (n=2981) #N/A #N/A #N/A #N/A #N/A #N/A
Male ▲71% ▼29% (n=3027) #N/A #N/A #N/A #N/A #N/A #N/A
Other 55% 45% (n=11) #N/A #N/A #N/A #N/A #N/A #N/A
Age group Under 35 years 62% 38% (n=1041) #N/A #N/A #N/A #N/A #N/A #N/A
35 - 49 years ▼60% ▲40% (n=1832) #N/A #N/A #N/A #N/A #N/A #N/A
50 - 64 years 67% 33% (n=1758) #N/A #N/A #N/A #N/A #N/A #N/A
65 years or older ▲71% ▼29% (n=1388) #N/A #N/A #N/A #N/A #N/A #N/A
Type of resident Apartment 65% 35% (n=3013) #N/A #N/A #N/A #N/A #N/A #N/A
House 65% 35% (n=3006) #N/A #N/A #N/A #N/A #N/A #N/A
Electricity bill? Electronic bill 65% 35% (n=4615) #N/A #N/A #N/A #N/A #N/A #N/A
Paper invoice 66% 34% (n=1404) #N/A #N/A #N/A #N/A #N/A #N/A
Electricity to heating Use electricity to heat home ▲67% ▼33% (n=3127) #N/A #N/A #N/A #N/A #N/A #N/A
Not using electicity to heat home 63% 37% (n=2765) #N/A #N/A #N/A #N/A #N/A #N/A
Do not know ▼49% ▲51% (n=127) #N/A #N/A #N/A #N/A #N/A #N/A
Consumer type ACTIVE consumers ▲78% ▼22% (n=1540) #N/A #N/A #N/A #N/A #N/A #N/A
AWARE consumers ▲81% ▼19% (n=966) #N/A #N/A #N/A #N/A #N/A #N/A
INACTIVE comsumers ▼55% ▲45% (n=3513) #N/A #N/A #N/A #N/A #N/A #N/A
Less than 5000 kWh ▲73% ▼27% (n=1146) #N/A #N/A #N/A #N/A #N/A #N/A
5000- 9 999 kWh ▲71% ▼29% (n=1011) #N/A #N/A #N/A #N/A #N/A #N/A
10 000- 14 999 kWh ▲71% ▼29% (n=875) #N/A #N/A #N/A #N/A #N/A #N/A
15 000-19 999 kWh ▲74% ▼26% (n=619) #N/A #N/A #N/A #N/A #N/A #N/A
20 000 - 24 999 kWh ▲75% ▼25% (n=399) #N/A #N/A #N/A #N/A #N/A #N/A
More than 25 000 kWh ▲78% ▼22% (n=165) #N/A #N/A #N/A #N/A #N/A #N/A
Do not know ▼47% ▲53% (n=1804) #N/A #N/A #N/A #N/A #N/A #N/A
Less than 50 € 66% 34% (n=1281) #N/A #N/A #N/A #N/A #N/A #N/A
50-100 € 66% 34% (n=1363) #N/A #N/A #N/A #N/A #N/A #N/A
100-150 € 67% 33% (n=907) #N/A #N/A #N/A #N/A #N/A #N/A
150-200 € 67% 33% (n=772) #N/A #N/A #N/A #N/A #N/A #N/A
200-300 € ▲72% ▼28% (n=615) #N/A #N/A #N/A #N/A #N/A #N/A
More than 300 € ▲72% ▼28% (n=346) #N/A #N/A #N/A #N/A #N/A #N/A
Do not know ▼46% ▲54% (n=735) #N/A #N/A #N/A #N/A #N/A #N/A
Country Norway ▼62% ▲38% (n=1506) #N/A #N/A #N/A #N/A #N/A #N/A
Sweden ▼62% ▲38% (n=1501) #N/A #N/A #N/A #N/A #N/A #N/A
Denmark ▼53% ▲47% (n=1508) #N/A #N/A #N/A #N/A #N/A #N/A
Finland ▲83% ▼17% (n=1504) #N/A #N/A #N/A #N/A #N/A #N/A
Total 65% 35% (n=6019) #N/A #N/A #N/A #N/A #N/A #N/A
Spending on
electricity in total an
average winter
month
Annual KWh-use
#N/A
#N/A
#N/A
Q: [How your electricity price is set] When you think of your current electricity contract, are you aware of:
Q: [How your electricity price is set] When you think of your current electricity contract, are you aware of:
Background variables
Yes
No
Val
id N
#N/A
#N/A
#N/A
0% 20% 40% 60% 80%
33

Count %
Yes 3837 64 % 64 %
No 2182 36 % 36 %
Total 6019 100 % #N/A
#N/A #N/A #N/A
#N/A #N/A #N/A
#N/A #N/A #N/A
#N/A #N/A #N/A
#N/A #N/A #N/A
#N/A #N/A #N/A
#N/A #N/A #N/A
#N/A #N/A #N/A
Gender Female ▼61% ▲39% (n=2981) #N/A #N/A #N/A #N/A #N/A #N/A
Male ▲66% ▼34% (n=3027) #N/A #N/A #N/A #N/A #N/A #N/A
Other 64% 36% (n=11) #N/A #N/A #N/A #N/A #N/A #N/A
Age group Under 35 years ▼60% ▲40% (n=1041) #N/A #N/A #N/A #N/A #N/A #N/A
35 - 49 years 64% 36% (n=1832) #N/A #N/A #N/A #N/A #N/A #N/A
50 - 64 years 65% 35% (n=1758) #N/A #N/A #N/A #N/A #N/A #N/A
65 years or older 64% 36% (n=1388) #N/A #N/A #N/A #N/A #N/A #N/A
Type of resident Apartment ▼61% ▲39% (n=3013) #N/A #N/A #N/A #N/A #N/A #N/A
House ▲66% ▼34% (n=3006) #N/A #N/A #N/A #N/A #N/A #N/A
Electricity bill? Electronic bill ▲66% ▼34% (n=4615) #N/A #N/A #N/A #N/A #N/A #N/A
Paper invoice ▼57% ▲43% (n=1404) #N/A #N/A #N/A #N/A #N/A #N/A
Electricity to heating Use electricity to heat home ▲68% ▼32% (n=3127) #N/A #N/A #N/A #N/A #N/A #N/A
Not using electicity to heat home ▼59% ▲41% (n=2765) #N/A #N/A #N/A #N/A #N/A #N/A
Do not know 56% 44% (n=127) #N/A #N/A #N/A #N/A #N/A #N/A
Consumer type ACTIVE consumers 64% 36% (n=1540) #N/A #N/A #N/A #N/A #N/A #N/A
AWARE consumers ▲72% ▼28% (n=966) #N/A #N/A #N/A #N/A #N/A #N/A
INACTIVE comsumers ▼61% ▲39% (n=3513) #N/A #N/A #N/A #N/A #N/A #N/A
Less than 5000 kWh 65% 35% (n=1146) #N/A #N/A #N/A #N/A #N/A #N/A
5000- 9 999 kWh 67% 33% (n=1011) #N/A #N/A #N/A #N/A #N/A #N/A
10 000- 14 999 kWh ▲69% ▼31% (n=875) #N/A #N/A #N/A #N/A #N/A #N/A
15 000-19 999 kWh ▲70% ▼30% (n=619) #N/A #N/A #N/A #N/A #N/A #N/A
20 000 - 24 999 kWh ▲75% ▼25% (n=399) #N/A #N/A #N/A #N/A #N/A #N/A
More than 25 000 kWh ▲75% ▼25% (n=165) #N/A #N/A #N/A #N/A #N/A #N/A
Do not know ▼53% ▲47% (n=1804) #N/A #N/A #N/A #N/A #N/A #N/A
Less than 50 € 61% 39% (n=1281) #N/A #N/A #N/A #N/A #N/A #N/A
50-100 € 64% 36% (n=1363) #N/A #N/A #N/A #N/A #N/A #N/A
100-150 € 66% 34% (n=907) #N/A #N/A #N/A #N/A #N/A #N/A
150-200 € 66% 34% (n=772) #N/A #N/A #N/A #N/A #N/A #N/A
200-300 € ▲72% ▼28% (n=615) #N/A #N/A #N/A #N/A #N/A #N/A
More than 300 € ▲70% ▼30% (n=346) #N/A #N/A #N/A #N/A #N/A #N/A
Do not know ▼54% ▲46% (n=735) #N/A #N/A #N/A #N/A #N/A #N/A
Country Norway ▲75% ▼25% (n=1506) #N/A #N/A #N/A #N/A #N/A #N/A
Sweden ▲69% ▼31% (n=1501) #N/A #N/A #N/A #N/A #N/A #N/A
Denmark ▼59% ▲41% (n=1508) #N/A #N/A #N/A #N/A #N/A #N/A
Finland ▼51% ▲49% (n=1504) #N/A #N/A #N/A #N/A #N/A #N/A
Total 64% 36% (n=6019) #N/A #N/A #N/A #N/A #N/A #N/A
Spending on
electricity in total an
average winter
month
Annual KWh-use
#N/A
#N/A
#N/A
Q: [If the price can change during the contract term] When you think of your current electricity contract, are you aware of:
Q: [If the price can change during the contract term] When you think of your current electricity contract, are you aware of:
Background variables
Yes
No
Val
id N
#N/A
#N/A
#N/A
0% 20% 40% 60% 80%
34

Count %
Yes 4311 72 % 72 %
No 1708 28 % 28 %
Total 6019 100 % #N/A
#N/A #N/A #N/A
#N/A #N/A #N/A
#N/A #N/A #N/A
#N/A #N/A #N/A
#N/A #N/A #N/A
#N/A #N/A #N/A
#N/A #N/A #N/A
#N/A #N/A #N/A
Gender Female ▼68% ▲32% (n=2981) #N/A #N/A #N/A #N/A #N/A #N/A
Male ▲75% ▼25% (n=3027) #N/A #N/A #N/A #N/A #N/A #N/A
Other 64% 36% (n=11) #N/A #N/A #N/A #N/A #N/A #N/A
Age group Under 35 years ▼65% ▲35% (n=1041) #N/A #N/A #N/A #N/A #N/A #N/A
35 - 49 years 70% 30% (n=1832) #N/A #N/A #N/A #N/A #N/A #N/A
50 - 64 years ▲75% ▼25% (n=1758) #N/A #N/A #N/A #N/A #N/A #N/A
65 years or older ▲75% ▼25% (n=1388) #N/A #N/A #N/A #N/A #N/A #N/A
Type of resident Apartment 71% 29% (n=3013) #N/A #N/A #N/A #N/A #N/A #N/A
House 72% 28% (n=3006) #N/A #N/A #N/A #N/A #N/A #N/A
Electricity bill? Electronic bill 72% 28% (n=4615) #N/A #N/A #N/A #N/A #N/A #N/A
Paper invoice 72% 28% (n=1404) #N/A #N/A #N/A #N/A #N/A #N/A
Electricity to heating Use electricity to heat home ▲73% ▼27% (n=3127) #N/A #N/A #N/A #N/A #N/A #N/A
Not using electicity to heat home 70% 30% (n=2765) #N/A #N/A #N/A #N/A #N/A #N/A
Do not know ▼60% ▲40% (n=127) #N/A #N/A #N/A #N/A #N/A #N/A
Consumer type ACTIVE consumers ▲85% ▼15% (n=1540) #N/A #N/A #N/A #N/A #N/A #N/A
AWARE consumers ▲84% ▼16% (n=966) #N/A #N/A #N/A #N/A #N/A #N/A
INACTIVE comsumers ▼62% ▲38% (n=3513) #N/A #N/A #N/A #N/A #N/A #N/A
Less than 5000 kWh ▲79% ▼21% (n=1146) #N/A #N/A #N/A #N/A #N/A #N/A
5000- 9 999 kWh ▲76% ▼24% (n=1011) #N/A #N/A #N/A #N/A #N/A #N/A
10 000- 14 999 kWh ▲77% ▼23% (n=875) #N/A #N/A #N/A #N/A #N/A #N/A
15 000-19 999 kWh ▲77% ▼23% (n=619) #N/A #N/A #N/A #N/A #N/A #N/A
20 000 - 24 999 kWh ▲81% ▼19% (n=399) #N/A #N/A #N/A #N/A #N/A #N/A
More than 25 000 kWh ▲81% ▼19% (n=165) #N/A #N/A #N/A #N/A #N/A #N/A
Do not know ▼57% ▲43% (n=1804) #N/A #N/A #N/A #N/A #N/A #N/A
Less than 50 € 74% 26% (n=1281) #N/A #N/A #N/A #N/A #N/A #N/A
50-100 € 73% 27% (n=1363) #N/A #N/A #N/A #N/A #N/A #N/A
100-150 € 71% 29% (n=907) #N/A #N/A #N/A #N/A #N/A #N/A
150-200 € 75% 25% (n=772) #N/A #N/A #N/A #N/A #N/A #N/A
200-300 € ▲78% ▼22% (n=615) #N/A #N/A #N/A #N/A #N/A #N/A
More than 300 € ▲77% ▼23% (n=346) #N/A #N/A #N/A #N/A #N/A #N/A
Do not know ▼55% ▲45% (n=735) #N/A #N/A #N/A #N/A #N/A #N/A
Country Norway 69% 31% (n=1506) #N/A #N/A #N/A #N/A #N/A #N/A
Sweden ▲78% ▼22% (n=1501) #N/A #N/A #N/A #N/A #N/A #N/A
Denmark ▼53% ▲47% (n=1508) #N/A #N/A #N/A #N/A #N/A #N/A
Finland ▲86% ▼14% (n=1504) #N/A #N/A #N/A #N/A #N/A #N/A
Total 72% 28% (n=6019) #N/A #N/A #N/A #N/A #N/A #N/A
Spending on
electricity in total an
average winter
month
Annual KWh-use
#N/A
#N/A
#N/A
Q: [The binding period (Binding period is the time that you will have to stay with the same supplier)] When you think of your
current electricity contract, are you aware of:
Q: [The binding period (Binding period is the time that you will have to stay with the same supplier)] When you think of your
current electricity contract, are you aware of:
Background variables
Yes
No
Val
id N
#N/A
#N/A
#N/A
0% 20% 40% 60% 80%
35

Count %
Yes 3664 61 % 61 %
No 2355 39 % 39 %
Total 6019 100 % #N/A
#N/A #N/A #N/A
#N/A #N/A #N/A
#N/A #N/A #N/A
#N/A #N/A #N/A
#N/A #N/A #N/A
#N/A #N/A #N/A
#N/A #N/A #N/A
#N/A #N/A #N/A
Gender Female ▼56% ▲44% (n=2981) #N/A #N/A #N/A #N/A #N/A #N/A
Male ▲65% ▼35% (n=3027) #N/A #N/A #N/A #N/A #N/A #N/A
Other 73% 27% (n=11) #N/A #N/A #N/A #N/A #N/A #N/A
Age group Under 35 years ▼57% ▲43% (n=1041) #N/A #N/A #N/A #N/A #N/A #N/A
35 - 49 years ▼58% ▲42% (n=1832) #N/A #N/A #N/A #N/A #N/A #N/A
50 - 64 years 63% 37% (n=1758) #N/A #N/A #N/A #N/A #N/A #N/A
65 years or older ▲65% ▼35% (n=1388) #N/A #N/A #N/A #N/A #N/A #N/A
Type of resident Apartment 60% 40% (n=3013) #N/A #N/A #N/A #N/A #N/A #N/A
House 61% 39% (n=3006) #N/A #N/A #N/A #N/A #N/A #N/A
Electricity bill? Electronic bill 61% 39% (n=4615) #N/A #N/A #N/A #N/A #N/A #N/A
Paper invoice 60% 40% (n=1404) #N/A #N/A #N/A #N/A #N/A #N/A
Electricity to heating Use electricity to heat home ▲64% ▼36% (n=3127) #N/A #N/A #N/A #N/A #N/A #N/A
Not using electicity to heat home ▼59% ▲41% (n=2765) #N/A #N/A #N/A #N/A #N/A #N/A
Do not know ▼39% ▲61% (n=127) #N/A #N/A #N/A #N/A #N/A #N/A
Consumer type ACTIVE consumers ▲75% ▼25% (n=1540) #N/A #N/A #N/A #N/A #N/A #N/A
AWARE consumers ▲76% ▼24% (n=966) #N/A #N/A #N/A #N/A #N/A #N/A
INACTIVE comsumers ▼50% ▲50% (n=3513) #N/A #N/A #N/A #N/A #N/A #N/A
Less than 5000 kWh ▲65% ▼35% (n=1146) #N/A #N/A #N/A #N/A #N/A #N/A
5000- 9 999 kWh ▲66% ▼34% (n=1011) #N/A #N/A #N/A #N/A #N/A #N/A
10 000- 14 999 kWh ▲68% ▼32% (n=875) #N/A #N/A #N/A #N/A #N/A #N/A
15 000-19 999 kWh ▲68% ▼32% (n=619) #N/A #N/A #N/A #N/A #N/A #N/A
20 000 - 24 999 kWh ▲70% ▼30% (n=399) #N/A #N/A #N/A #N/A #N/A #N/A
More than 25 000 kWh ▲72% ▼28% (n=165) #N/A #N/A #N/A #N/A #N/A #N/A
Do not know ▼46% ▲54% (n=1804) #N/A #N/A #N/A #N/A #N/A #N/A
Less than 50 € 61% 39% (n=1281) #N/A #N/A #N/A #N/A #N/A #N/A
50-100 € 62% 38% (n=1363) #N/A #N/A #N/A #N/A #N/A #N/A
100-150 € 64% 36% (n=907) #N/A #N/A #N/A #N/A #N/A #N/A
150-200 € 63% 37% (n=772) #N/A #N/A #N/A #N/A #N/A #N/A
200-300 € ▲68% ▼32% (n=615) #N/A #N/A #N/A #N/A #N/A #N/A
More than 300 € 65% 35% (n=346) #N/A #N/A #N/A #N/A #N/A #N/A
Do not know ▼44% ▲56% (n=735) #N/A #N/A #N/A #N/A #N/A #N/A
Country Norway 60% 40% (n=1506) #N/A #N/A #N/A #N/A #N/A #N/A
Sweden ▲66% ▼34% (n=1501) #N/A #N/A #N/A #N/A #N/A #N/A
Denmark ▼46% ▲54% (n=1508) #N/A #N/A #N/A #N/A #N/A #N/A
Finland ▲72% ▼28% (n=1504) #N/A #N/A #N/A #N/A #N/A #N/A
Total 61% 39% (n=6019) #N/A #N/A #N/A #N/A #N/A #N/A
Spending on
electricity in total an
average winter
month
Annual KWh-use
#N/A
#N/A
#N/A
Q: [The notice period of the contract (Notice period is the time that you have to stay with the supplier after you have given a
notice of termination)] When you think of your current electricity contract, are you aware of:
Q: [The notice period of the contract (Notice period is the time that you have to stay with the supplier after you have given a
notice of termination)] When you think of your current electricity contract, are you aware of:
Background variables
Yes
No
Val
id N
#N/A
#N/A
#N/A
0% 20% 40% 60% 80%
36

Count %
Yes 2848 47 % 47 %
No 3171 53 % 53 %
Total 6019 100 % #N/A
#N/A #N/A #N/A
#N/A #N/A #N/A
#N/A #N/A #N/A
#N/A #N/A #N/A
#N/A #N/A #N/A
#N/A #N/A #N/A
#N/A #N/A #N/A
#N/A #N/A #N/A
Gender Female ▼42% ▲58% (n=2981) #N/A #N/A #N/A #N/A #N/A #N/A
Male ▲53% ▼47% (n=3027) #N/A #N/A #N/A #N/A #N/A #N/A
Other 45% 55% (n=11) #N/A #N/A #N/A #N/A #N/A #N/A
Age group Under 35 years 46% 54% (n=1041) #N/A #N/A #N/A #N/A #N/A #N/A
35 - 49 years 45% 55% (n=1832) #N/A #N/A #N/A #N/A #N/A #N/A
50 - 64 years 48% 52% (n=1758) #N/A #N/A #N/A #N/A #N/A #N/A
65 years or older 49% 51% (n=1388) #N/A #N/A #N/A #N/A #N/A #N/A
Type of resident Apartment 47% 53% (n=3013) #N/A #N/A #N/A #N/A #N/A #N/A
House 48% 52% (n=3006) #N/A #N/A #N/A #N/A #N/A #N/A
Electricity bill? Electronic bill ▲49% ▼51% (n=4615) #N/A #N/A #N/A #N/A #N/A #N/A
Paper invoice ▼43% ▲57% (n=1404) #N/A #N/A #N/A #N/A #N/A #N/A
Electricity to heating Use electricity to heat home ▲52% ▼48% (n=3127) #N/A #N/A #N/A #N/A #N/A #N/A
Not using electicity to heat home ▼43% ▲57% (n=2765) #N/A #N/A #N/A #N/A #N/A #N/A
Do not know ▼25% ▲75% (n=127) #N/A #N/A #N/A #N/A #N/A #N/A
Consumer type ACTIVE consumers ▲59% ▼41% (n=1540) #N/A #N/A #N/A #N/A #N/A #N/A
AWARE consumers ▲63% ▼37% (n=966) #N/A #N/A #N/A #N/A #N/A #N/A
INACTIVE comsumers ▼38% ▲62% (n=3513) #N/A #N/A #N/A #N/A #N/A #N/A
Less than 5000 kWh 50% 50% (n=1146) #N/A #N/A #N/A #N/A #N/A #N/A
5000- 9 999 kWh ▲52% ▼48% (n=1011) #N/A #N/A #N/A #N/A #N/A #N/A
10 000- 14 999 kWh ▲54% ▼46% (n=875) #N/A #N/A #N/A #N/A #N/A #N/A
15 000-19 999 kWh ▲55% ▼45% (n=619) #N/A #N/A #N/A #N/A #N/A #N/A
20 000 - 24 999 kWh ▲59% ▼41% (n=399) #N/A #N/A #N/A #N/A #N/A #N/A
More than 25 000 kWh ▲67% ▼33% (n=165) #N/A #N/A #N/A #N/A #N/A #N/A
Do not know ▼33% ▲67% (n=1804) #N/A #N/A #N/A #N/A #N/A #N/A
Less than 50 € 44% 56% (n=1281) #N/A #N/A #N/A #N/A #N/A #N/A
50-100 € 47% 53% (n=1363) #N/A #N/A #N/A #N/A #N/A #N/A
100-150 € ▲52% ▼48% (n=907) #N/A #N/A #N/A #N/A #N/A #N/A
150-200 € ▲52% ▼48% (n=772) #N/A #N/A #N/A #N/A #N/A #N/A
200-300 € ▲53% ▼47% (n=615) #N/A #N/A #N/A #N/A #N/A #N/A
More than 300 € ▲55% ▼45% (n=346) #N/A #N/A #N/A #N/A #N/A #N/A
Do not know ▼34% ▲66% (n=735) #N/A #N/A #N/A #N/A #N/A #N/A
Country Norway ▲53% ▼47% (n=1506) #N/A #N/A #N/A #N/A #N/A #N/A
Sweden 47% 53% (n=1501) #N/A #N/A #N/A #N/A #N/A #N/A
Denmark ▼37% ▲63% (n=1508) #N/A #N/A #N/A #N/A #N/A #N/A
Finland ▲53% ▼47% (n=1504) #N/A #N/A #N/A #N/A #N/A #N/A
Total 47% 53% (n=6019) #N/A #N/A #N/A #N/A #N/A #N/A
Spending on
electricity in total an
average winter
month
Annual KWh-use
#N/A
#N/A
#N/A
Q: [The consequence if you terminate the contract before the binding period expires] When you think of your current electricity
contract, are you aware of:
Q: [The consequence if you terminate the contract before the binding period expires] When you think of your current electricity
contract, are you aware of:
Background variables
Yes
No
Val
id N
#N/A
#N/A
#N/A
0% 20% 40% 60%
37

Count %
Yes 3030 50 % 50 %
No 2989 50 % 50 %
Total 6019 100 % #N/A
#N/A #N/A #N/A
#N/A #N/A #N/A
#N/A #N/A #N/A
#N/A #N/A #N/A
#N/A #N/A #N/A
#N/A #N/A #N/A
#N/A #N/A #N/A
#N/A #N/A #N/A
Gender Female ▼47% ▲53% (n=2981) #N/A #N/A #N/A #N/A #N/A #N/A
Male ▲53% ▼47% (n=3027) #N/A #N/A #N/A #N/A #N/A #N/A
Other 73% 27% (n=11) #N/A #N/A #N/A #N/A #N/A #N/A
Age group Under 35 years 51% 49% (n=1041) #N/A #N/A #N/A #N/A #N/A #N/A
35 - 49 years 50% 50% (n=1832) #N/A #N/A #N/A #N/A #N/A #N/A
50 - 64 years 51% 49% (n=1758) #N/A #N/A #N/A #N/A #N/A #N/A
65 years or older 49% 51% (n=1388) #N/A #N/A #N/A #N/A #N/A #N/A
Type of resident Apartment 51% 49% (n=3013) #N/A #N/A #N/A #N/A #N/A #N/A
House 50% 50% (n=3006) #N/A #N/A #N/A #N/A #N/A #N/A
Electricity bill? Electronic bill ▲52% ▼48% (n=4615) #N/A #N/A #N/A #N/A #N/A #N/A
Paper invoice ▼44% ▲56% (n=1404) #N/A #N/A #N/A #N/A #N/A #N/A
Electricity to heating Use electricity to heat home 50% 50% (n=3127) #N/A #N/A #N/A #N/A #N/A #N/A
Not using electicity to heat home 51% 49% (n=2765) #N/A #N/A #N/A #N/A #N/A #N/A
Do not know ▼40% ▲60% (n=127) #N/A #N/A #N/A #N/A #N/A #N/A
Consumer type ACTIVE consumers ▲58% ▼42% (n=1540) #N/A #N/A #N/A #N/A #N/A #N/A
AWARE consumers ▲59% ▼41% (n=966) #N/A #N/A #N/A #N/A #N/A #N/A
INACTIVE comsumers ▼44% ▲56% (n=3513) #N/A #N/A #N/A #N/A #N/A #N/A
Less than 5000 kWh ▲58% ▼42% (n=1146) #N/A #N/A #N/A #N/A #N/A #N/A
5000- 9 999 kWh ▲56% ▼44% (n=1011) #N/A #N/A #N/A #N/A #N/A #N/A
10 000- 14 999 kWh ▲56% ▼44% (n=875) #N/A #N/A #N/A #N/A #N/A #N/A
15 000-19 999 kWh 52% 48% (n=619) #N/A #N/A #N/A #N/A #N/A #N/A
20 000 - 24 999 kWh 56% 44% (n=399) #N/A #N/A #N/A #N/A #N/A #N/A
More than 25 000 kWh 52% 48% (n=165) #N/A #N/A #N/A #N/A #N/A #N/A
Do not know ▼38% ▲62% (n=1804) #N/A #N/A #N/A #N/A #N/A #N/A
Less than 50 € 52% 48% (n=1281) #N/A #N/A #N/A #N/A #N/A #N/A
50-100 € 52% 48% (n=1363) #N/A #N/A #N/A #N/A #N/A #N/A
100-150 € 52% 48% (n=907) #N/A #N/A #N/A #N/A #N/A #N/A
150-200 € 53% 47% (n=772) #N/A #N/A #N/A #N/A #N/A #N/A
200-300 € 52% 48% (n=615) #N/A #N/A #N/A #N/A #N/A #N/A
More than 300 € 47% 53% (n=346) #N/A #N/A #N/A #N/A #N/A #N/A
Do not know ▼41% ▲59% (n=735) #N/A #N/A #N/A #N/A #N/A #N/A
Country Norway ▼44% ▲56% (n=1506) #N/A #N/A #N/A #N/A #N/A #N/A
Sweden ▲59% ▼41% (n=1501) #N/A #N/A #N/A #N/A #N/A #N/A
Denmark 52% 48% (n=1508) #N/A #N/A #N/A #N/A #N/A #N/A
Finland ▼46% ▲54% (n=1504) #N/A #N/A #N/A #N/A #N/A #N/A
Total 50% 50% (n=6019) #N/A #N/A #N/A #N/A #N/A #N/A
Spending on
electricity in total an
average winter
month
Annual KWh-use
#N/A
#N/A
#N/A
Q: [If the contract is green (electricity from renewable energy sources, for example hydro, solar or wind)] When you think of
your current electricity contract, are you aware of:
Q: [If the contract is green (electricity from renewable energy sources, for example hydro, solar or wind)] When you think of your
current electricity contract, are you aware of:
Background variables
Yes
No
Val
id N
#N/A
#N/A
#N/A
0% 20% 40% 60%
38

Count %
Yes 1757 58 % 58 %
No 1252 42 % 42 %
Total 3009 100 % #N/A
#N/A #N/A #N/A
#N/A #N/A #N/A
#N/A #N/A #N/A
#N/A #N/A #N/A
#N/A #N/A #N/A
#N/A #N/A #N/A
#N/A #N/A #N/A
#N/A #N/A #N/A
Gender Female ▼53% ▲47% (n=1492) #N/A #N/A #N/A #N/A #N/A #N/A
Male ▲64% ▼36% (n=1512) #N/A #N/A #N/A #N/A #N/A #N/A
Other 80% 20% (n=5) #N/A #N/A #N/A #N/A #N/A #N/A
Age group Under 35 years 55% 45% (n=535) #N/A #N/A #N/A #N/A #N/A #N/A
35 - 49 years ▼54% ▲46% (n=879) #N/A #N/A #N/A #N/A #N/A #N/A
50 - 64 years 60% 40% (n=877) #N/A #N/A #N/A #N/A #N/A #N/A
65 years or older ▲64% ▼36% (n=718) #N/A #N/A #N/A #N/A #N/A #N/A
Type of resident Apartment ▼54% ▲46% (n=1399) #N/A #N/A #N/A #N/A #N/A #N/A
House ▲62% ▼38% (n=1610) #N/A #N/A #N/A #N/A #N/A #N/A
Electricity bill? Electronic bill 60% 40% (n=2385) #N/A #N/A #N/A #N/A #N/A #N/A
Paper invoice 54% 46% (n=624) #N/A #N/A #N/A #N/A #N/A #N/A
Electricity to heating Use electricity to heat home ▲62% ▼38% (n=1152) #N/A #N/A #N/A #N/A #N/A #N/A
Not using electicity to heat home 57% 43% (n=1773) #N/A #N/A #N/A #N/A #N/A #N/A
Do not know ▼43% ▲57% (n=84) #N/A #N/A #N/A #N/A #N/A #N/A
Consumer type ACTIVE consumers ▲72% ▼28% (n=639) #N/A #N/A #N/A #N/A #N/A #N/A
AWARE consumers ▲80% ▼20% (n=401) #N/A #N/A #N/A #N/A #N/A #N/A
INACTIVE comsumers ▼50% ▲50% (n=1969) #N/A #N/A #N/A #N/A #N/A #N/A
Less than 5000 kWh ▲67% ▼33% (n=745) #N/A #N/A #N/A #N/A #N/A #N/A
5000- 9 999 kWh ▲67% ▼33% (n=574) #N/A #N/A #N/A #N/A #N/A #N/A
10 000- 14 999 kWh ▲68% ▼32% (n=405) #N/A #N/A #N/A #N/A #N/A #N/A
15 000-19 999 kWh ▲68% ▼32% (n=231) #N/A #N/A #N/A #N/A #N/A #N/A
20 000 - 24 999 kWh ▲76% ▼24% (n=128) #N/A #N/A #N/A #N/A #N/A #N/A
More than 25 000 kWh ▲77% ▼23% (n=35) #N/A #N/A #N/A #N/A #N/A #N/A
Do not know ▼36% ▲64% (n=891) #N/A #N/A #N/A #N/A #N/A #N/A
Less than 50 € 55% 45% (n=746) #N/A #N/A #N/A #N/A #N/A #N/A
50-100 € 61% 39% (n=738) #N/A #N/A #N/A #N/A #N/A #N/A
100-150 € 63% 37% (n=381) #N/A #N/A #N/A #N/A #N/A #N/A
150-200 € ▲66% ▼34% (n=300) #N/A #N/A #N/A #N/A #N/A #N/A
200-300 € ▲67% ▼33% (n=246) #N/A #N/A #N/A #N/A #N/A #N/A
More than 300 € ▲71% ▼29% (n=128) #N/A #N/A #N/A #N/A #N/A #N/A
Do not know ▼44% ▲56% (n=470) #N/A #N/A #N/A #N/A #N/A #N/A
Country Norway - % - % (n<5) #N/A #N/A #N/A #N/A #N/A #N/A
Sweden 60% 40% (n=1501) #N/A #N/A #N/A #N/A #N/A #N/A
Denmark 56% 44% (n=1508) #N/A #N/A #N/A #N/A #N/A #N/A
Finland - % - % (n<5) #N/A #N/A #N/A #N/A #N/A #N/A
Total 58% 42% (n=3009) #N/A #N/A #N/A #N/A #N/A #N/A
Spending on
electricity in total an
average winter
month
Annual KWh-use
#N/A
#N/A
#N/A
Q: [The effective unit rate where all fixed and variable fees are included] When you think of your current electricity contract,
are you aware of:
Q: [The effective unit rate where all fixed and variable fees are included] When you think of your current electricity contract, are
you aware of:
Background variables
Yes
No
Val
id N
#N/A
#N/A
#N/A
0% 20% 40% 60% 80%
39
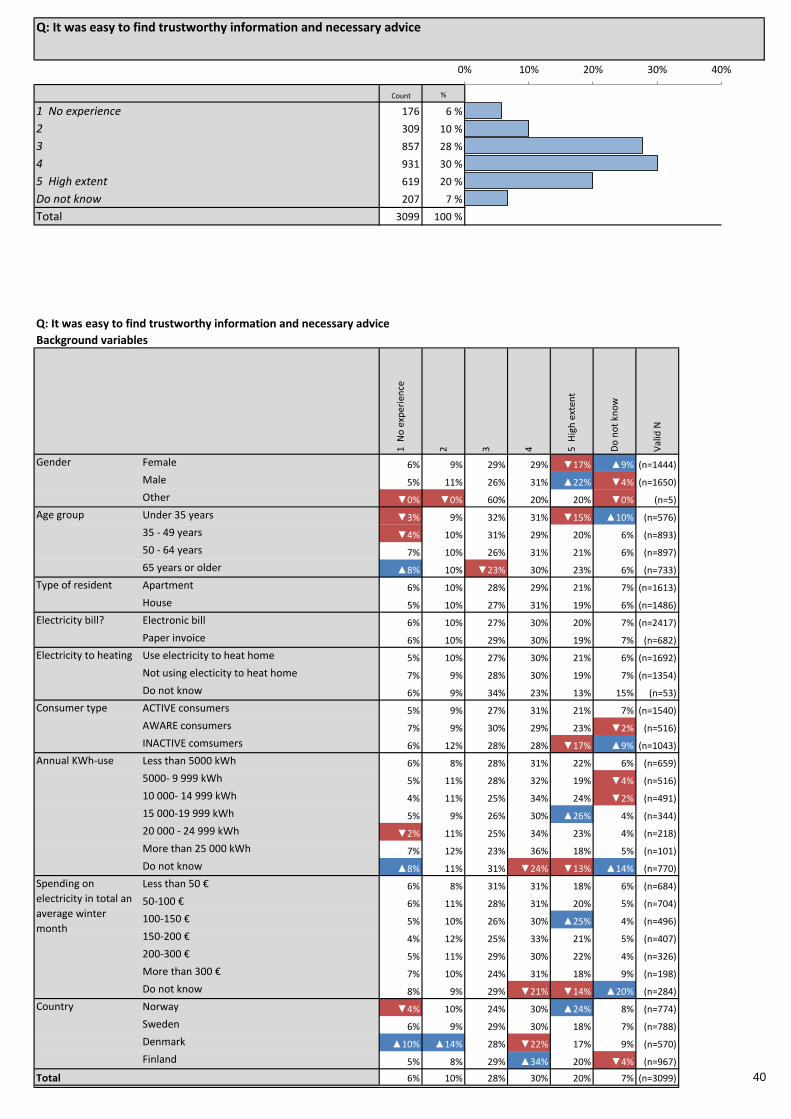
Count %
1 No experience 176 6 % 6 %
2 309 10 % 10 %
3 857 28 % 28 %
4 931 30 % 30 %
5 High extent 619 20 % 20 %
Do not know 207 7 % 7 %
Total 3099 100 % #N/A
#N/A #N/A #N/A
#N/A #N/A #N/A
#N/A #N/A #N/A
#N/A #N/A #N/A
Gender Female 6% 9% 29% 29% ▼17% ▲9% (n=1444) #N/A #N/A
Male 5% 11% 26% 31% ▲22% ▼4% (n=1650) #N/A #N/A
Other ▼0% ▼0% 60% 20% 20% ▼0% (n=5) #N/A #N/A
Age group Under 35 years ▼3% 9% 32% 31% ▼15% ▲10% (n=576) #N/A #N/A
35 - 49 years ▼4% 10% 31% 29% 20% 6% (n=893) #N/A #N/A
50 - 64 years 7% 10% 26% 31% 21% 6% (n=897) #N/A #N/A
65 years or older ▲8% 10% ▼23% 30% 23% 6% (n=733) #N/A #N/A
Type of resident Apartment 6% 10% 28% 29% 21% 7% (n=1613) #N/A #N/A
House 5% 10% 27% 31% 19% 6% (n=1486) #N/A #N/A
Electricity bill? Electronic bill 6% 10% 27% 30% 20% 7% (n=2417) #N/A #N/A
Paper invoice 6% 10% 29% 30% 19% 7% (n=682) #N/A #N/A
Electricity to heating Use electricity to heat home 5% 10% 27% 30% 21% 6% (n=1692) #N/A #N/A
Not using electicity to heat home 7% 9% 28% 30% 19% 7% (n=1354) #N/A #N/A
Do not know 6% 9% 34% 23% 13% 15% (n=53) #N/A #N/A
Consumer type ACTIVE consumers 5% 9% 27% 31% 21% 7% (n=1540) #N/A #N/A
AWARE consumers 7% 9% 30% 29% 23% ▼2% (n=516) #N/A #N/A
INACTIVE comsumers 6% 12% 28% 28% ▼17% ▲9% (n=1043) #N/A #N/A
Less than 5000 kWh 6% 8% 28% 31% 22% 6% (n=659) #N/A #N/A
5000- 9 999 kWh 5% 11% 28% 32% 19% ▼4% (n=516) #N/A #N/A
10 000- 14 999 kWh 4% 11% 25% 34% 24% ▼2% (n=491) #N/A #N/A
15 000-19 999 kWh 5% 9% 26% 30% ▲26% 4% (n=344) #N/A #N/A
20 000 - 24 999 kWh ▼2% 11% 25% 34% 23% 4% (n=218) #N/A #N/A
More than 25 000 kWh 7% 12% 23% 36% 18% 5% (n=101) #N/A #N/A
Do not know ▲8% 11% 31% ▼24% ▼13% ▲14% (n=770) #N/A #N/A
Less than 50 € 6% 8% 31% 31% 18% 6% (n=684) #N/A #N/A
50-100 € 6% 11% 28% 31% 20% 5% (n=704) #N/A #N/A
100-150 € 5% 10% 26% 30% ▲25% 4% (n=496) #N/A #N/A
150-200 € 4% 12% 25% 33% 21% 5% (n=407) #N/A #N/A
200-300 € 5% 11% 29% 30% 22% 4% (n=326) #N/A #N/A
More than 300 € 7% 10% 24% 31% 18% 9% (n=198) #N/A #N/A
Do not know 8% 9% 29% ▼21% ▼14% ▲20% (n=284) #N/A #N/A
Country Norway ▼4% 10% 24% 30% ▲24% 8% (n=774) #N/A #N/A
Sweden 6% 9% 29% 30% 18% 7% (n=788) #N/A #N/A
Denmark ▲10% ▲14% 28% ▼22% 17% 9% (n=570) #N/A #N/A
Finland 5% 8% 29% ▲34% 20% ▼4% (n=967) #N/A #N/A
Total 6% 10% 28% 30% 20% 7% (n=3099) #N/A #N/A
Spending on
electricity in total an
average winter
month
Annual KWh-use
Val
id N
#N/A
#N/A
Q: It was easy to find trustworthy information and necessary advice
Q: It was easy to find trustworthy information and necessary advice
Background variables
1 N
o e
xper
ien
ce
2 3 4 5 H
igh
ext
ent
Do
no
t kn
ow
0% 10% 20% 30% 40%
40

Count Mean Significant higherSignificant lower scoreNo difference
Gender Female (n=1310) ▼61 61,5
Male (n=1577) 64 64,4
Other (n=5) 65 65
Age group Under 35 years (n=521) 63 62,9
35 - 49 years (n=837) 64 63,6
50 - 64 years (n=842) 63 62,8
65 years or older (n=692) 63 62,8
Type of resident Apartment (n=1498) 63 63,1
House (n=1394) 63 63
Electricity bill? Electronic bill (n=2256) 63 63,3
Paper invoice (n=636) 62 62,2
Electricity to heating Use electricity to heat home (n=1586) 64 64,2
Not using electicity to heat home (n=1261) 62 61,7
Do not know (n=45) 58 58,3
Consumer type ACTIVE consumers (n=1436) ▲65 64,6
AWARE consumers (n=504) 64 63,5
INACTIVE comsumers (n=952) ▼60 60,4
Less than 5000 kWh (n=620) 65 64,6
5000- 9 999 kWh (n=494) 63 62,7
10 000- 14 999 kWh (n=481) 66 65,9
15 000-19 999 kWh (n=329) ▲67 66,8
20 000 - 24 999 kWh (n=209) ▲67 67,3
More than 25 000 kWh (n=96) 62 62
Do not know (n=663) ▼57 56,6
Less than 50 € (n=641) 62 62,5
50-100 € (n=668) 63 62,9
100-150 € (n=474) 66 65,7
150-200 € (n=388) 64 64,1
200-300 € (n=313) 64 63,8
More than 300 € (n=180) 62 61,9
Do not know (n=228) ▼57 57,5
Country Norway (n=714) ▲66 66,4
Sweden (n=729) 62 62,4
Denmark (n=519) ▼56 56,4
Finland (n=930) 65 64,7
Total (n=2892) 63 63
Annual KWh-use
Spending on electricity
in total an average
winter month
Q: It was easy to find trustworthy information and necessary advice
Standardized mean score: 0 =1 No experience and 100 = 5 High extent. 'Do not know' is not in the calculation.
0 25 50 75 100
Significant higher
Significant lower score
No difference
41

Count %
1 No experience 93 3 % 3 %
2 139 4 % 4 %
3 409 13 % 13 %
4 953 31 % 31 %
5 High extent 1419 46 % 46 %
Do not know 86 3 % 3 %
Total 3099 100 % #N/A
#N/A #N/A #N/A
#N/A #N/A #N/A
#N/A #N/A #N/A
#N/A #N/A #N/A
Gender Female 3% 5% 12% 30% 45% ▲4% (n=1444) #N/A #N/A
Male 3% 4% 14% 31% 46% ▼2% (n=1650) #N/A #N/A
Other ▼0% 20% 20% 20% 40% ▼0% (n=5) #N/A #N/A
Age group Under 35 years 2% 5% ▲18% 34% ▼37% 5% (n=576) #N/A #N/A
35 - 49 years 2% 6% 15% 29% 45% 3% (n=893) #N/A #N/A
50 - 64 years 3% 3% 12% 30% ▲50% 2% (n=897) #N/A #N/A
65 years or older 5% 3% ▼10% 31% 49% 2% (n=733) #N/A #N/A
Type of resident Apartment 3% 5% 13% 30% 45% 4% (n=1613) #N/A #N/A
House 3% 4% 13% 32% 47% 2% (n=1486) #N/A #N/A
Electricity bill? Electronic bill 3% 4% 13% 31% 47% 3% (n=2417) #N/A #N/A
Paper invoice 3% 5% 15% 31% 42% 4% (n=682) #N/A #N/A
Electricity to heating Use electricity to heat home 3% 5% 13% 30% 46% 2% (n=1692) #N/A #N/A
Not using electicity to heat home 3% 5% 13% 32% 46% 3% (n=1354) #N/A #N/A
Do not know 4% ▼0% ▲28% 19% 45% 4% (n=53) #N/A #N/A
Consumer type ACTIVE consumers 3% 4% 12% 29% ▲50% 3% (n=1540) #N/A #N/A
AWARE consumers 3% 5% 14% 31% 46% ▼1% (n=516) #N/A #N/A
INACTIVE comsumers 3% 5% 15% 34% ▼40% 4% (n=1043) #N/A #N/A
Less than 5000 kWh 2% 4% 14% 31% 47% 2% (n=659) #N/A #N/A
5000- 9 999 kWh 3% 6% 13% 30% 44% 2% (n=516) #N/A #N/A
10 000- 14 999 kWh 2% 4% 14% 32% 48% ▼1% (n=491) #N/A #N/A
15 000-19 999 kWh 2% 5% 13% 31% 48% ▼1% (n=344) #N/A #N/A
20 000 - 24 999 kWh 2% 4% 9% 32% 52% ▼1% (n=218) #N/A #N/A
More than 25 000 kWh 5% ▼1% 13% 35% 45% 2% (n=101) #N/A #N/A
Do not know 5% 4% 14% 30% 42% ▲6% (n=770) #N/A #N/A
Less than 50 € 2% 4% 13% 32% 46% 2% (n=684) #N/A #N/A
50-100 € 3% 5% 16% 29% 45% 2% (n=704) #N/A #N/A
100-150 € 3% 5% 10% 32% 48% 3% (n=496) #N/A #N/A
150-200 € 3% 5% 14% 29% 48% 1% (n=407) #N/A #N/A
200-300 € 2% 5% 12% 33% 47% ▼1% (n=326) #N/A #N/A
More than 300 € 5% 3% 15% 31% 44% 2% (n=198) #N/A #N/A
Do not know 3% 4% 12% 31% 40% ▲10% (n=284) #N/A #N/A
Country Norway 3% 3% ▼9% 27% ▲54% 3% (n=774) #N/A #N/A
Sweden 4% 6% ▲18% 30% ▼40% 3% (n=788) #N/A #N/A
Denmark 3% 5% 16% 30% ▼41% 5% (n=570) #N/A #N/A
Finland 2% 4% 11% ▲34% 47% ▼2% (n=967) #N/A #N/A
Total 3% 4% 13% 31% 46% 3% (n=3099) #N/A #N/A
Spending on
electricity in total an
average winter
month
Annual KWh-use
Val
id N
#N/A
#N/A
Q: It was easy and straightforward to sign an electricity contract
Q: It was easy and straightforward to sign an electricity contract
Background variables
1 N
o e
xper
ien
ce
2 3 4 5 H
igh
ext
ent
Do
no
t kn
ow
0% 10% 20% 30% 40% 50%
42
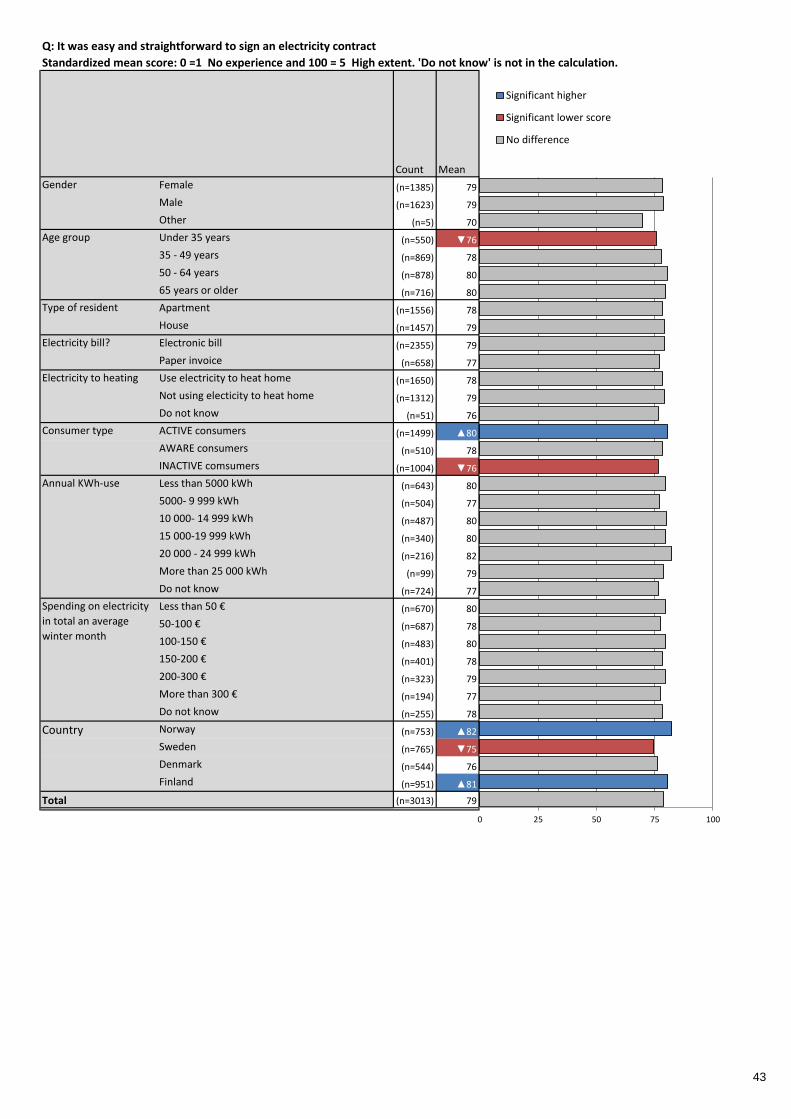
Count Mean Significant higherSignificant lower scoreNo difference
Gender Female (n=1385) 79 78,6
Male (n=1623) 79 78,9
Other (n=5) 70 70
Age group Under 35 years (n=550) ▼76 75,7
35 - 49 years (n=869) 78 78,1
50 - 64 years (n=878) 80 80,4
65 years or older (n=716) 80 79,9
Type of resident Apartment (n=1556) 78 78,3
House (n=1457) 79 79,2
Electricity bill? Electronic bill (n=2355) 79 79,3
Paper invoice (n=658) 77 77
Electricity to heating Use electricity to heat home (n=1650) 78 78,4
Not using electicity to heat home (n=1312) 79 79,3
Do not know (n=51) 76 76,5
Consumer type ACTIVE consumers (n=1499) ▲80 80,5
AWARE consumers (n=510) 78 78,3
INACTIVE comsumers (n=1004) ▼76 76,4
Less than 5000 kWh (n=643) 80 79,8
5000- 9 999 kWh (n=504) 77 77
10 000- 14 999 kWh (n=487) 80 80,2
15 000-19 999 kWh (n=340) 80 79,9
20 000 - 24 999 kWh (n=216) 82 82,3
More than 25 000 kWh (n=99) 79 78,8
Do not know (n=724) 77 76,6
Less than 50 € (n=670) 80 79,6
50-100 € (n=687) 78 77,6
100-150 € (n=483) 80 79,8
150-200 € (n=401) 78 78,5
200-300 € (n=323) 79 79,5
More than 300 € (n=194) 77 77,5
Do not know (n=255) 78 78,2
Country Norway (n=753) ▲82 82,4
Sweden (n=765) ▼75 74,7
Denmark (n=544) 76 76,2
Finland (n=951) ▲81 80,6
Total (n=3013) 79 78,8
Annual KWh-use
Spending on electricity
in total an average
winter month
Q: It was easy and straightforward to sign an electricity contract
Standardized mean score: 0 =1 No experience and 100 = 5 High extent. 'Do not know' is not in the calculation.
0 25 50 75 100
Significant higher
Significant lower score
No difference
43

Count %
1 No experience 229 7 % 7 %
2 401 13 % 13 %
3 781 25 % 25 %
4 842 27 % 27 %
5 High extent 618 20 % 20 %
Do not know 228 7 % 7 %
Total 3099 100 % #N/A
#N/A #N/A #N/A
#N/A #N/A #N/A
#N/A #N/A #N/A
#N/A #N/A #N/A
Gender Female 8% 14% 24% 26% ▼18% ▲10% (n=1444) #N/A #N/A
Male 6% 12% 27% 28% ▲22% ▼5% (n=1650) #N/A #N/A
Other ▼0% 20% 40% 20% 20% ▼0% (n=5) #N/A #N/A
Age group Under 35 years ▼4% 15% ▲30% 27% 16% 8% (n=576) #N/A #N/A
35 - 49 years 6% 12% 25% 27% 22% 7% (n=893) #N/A #N/A
50 - 64 years 9% 13% 26% 27% 18% 7% (n=897) #N/A #N/A
65 years or older 9% 11% ▼21% 28% 23% 7% (n=733) #N/A #N/A
Type of resident Apartment 7% 13% 26% 27% 20% 8% (n=1613) #N/A #N/A
House 8% 13% 25% 27% 20% 7% (n=1486) #N/A #N/A
Electricity bill? Electronic bill 7% 12% 25% 27% 21% 7% (n=2417) #N/A #N/A
Paper invoice 8% 15% 24% 28% 17% 8% (n=682) #N/A #N/A
Electricity to heating Use electricity to heat home 7% 12% 25% 28% 21% 7% (n=1692) #N/A #N/A
Not using electicity to heat home 8% 13% 26% 26% 19% 8% (n=1354) #N/A #N/A
Do not know 11% 19% 25% 28% 11% 6% (n=53) #N/A #N/A
Consumer type ACTIVE consumers 7% 11% 25% 27% 21% 8% (n=1540) #N/A #N/A
AWARE consumers 6% 13% 23% 29% ▲26% ▼3% (n=516) #N/A #N/A
INACTIVE comsumers 9% 15% 26% 26% ▼15% ▲9% (n=1043) #N/A #N/A
Less than 5000 kWh 6% 11% 27% 28% 22% 5% (n=659) #N/A #N/A
5000- 9 999 kWh 7% 14% 23% ▲32% 20% 5% (n=516) #N/A #N/A
10 000- 14 999 kWh 5% 12% 25% 30% ▲25% ▼2% (n=491) #N/A #N/A
15 000-19 999 kWh 7% 11% 24% 28% 25% 5% (n=344) #N/A #N/A
20 000 - 24 999 kWh 5% 10% 28% 30% 22% 6% (n=218) #N/A #N/A
More than 25 000 kWh 11% 14% 21% 26% 22% 7% (n=101) #N/A #N/A
Do not know ▲11% 16% 26% ▼21% ▼12% ▲15% (n=770) #N/A #N/A
Less than 50 € 7% 13% 26% 27% 19% 7% (n=684) #N/A #N/A
50-100 € 6% 14% 28% 27% 19% 6% (n=704) #N/A #N/A
100-150 € 6% 12% 23% 32% 22% 6% (n=496) #N/A #N/A
150-200 € 9% 12% 23% 30% 20% 6% (n=407) #N/A #N/A
200-300 € 7% 13% 28% 25% 22% 5% (n=326) #N/A #N/A
More than 300 € 9% 12% 23% 27% 20% 9% (n=198) #N/A #N/A
Do not know 10% 15% 21% ▼19% 16% ▲19% (n=284) #N/A #N/A
Country Norway 6% 11% 24% 27% 23% 9% (n=774) #N/A #N/A
Sweden 6% 13% 28% 26% 20% 8% (n=788) #N/A #N/A
Denmark ▲13% ▲17% 25% ▼21% ▼14% 10% (n=570) #N/A #N/A
Finland 6% 12% 24% ▲32% 21% ▼4% (n=967) #N/A #N/A
Total 7% 13% 25% 27% 20% 7% (n=3099) #N/A #N/A
Spending on
electricity in total an
average winter
month
Annual KWh-use
Val
id N
#N/A
#N/A
Q: I could easily compare different electricity contracts with each other
Q: I could easily compare different electricity contracts with each other
Background variables
1 N
o e
xper
ien
ce
2 3 4 5 H
igh
ext
ent
Do
no
t kn
ow
0% 10% 20% 30%
44

Count Mean Significant higherSignificant lower scoreNo difference
Gender Female (n=1295) ▼58 58,4
Male (n=1571) ▲62 62,4
Other (n=5) 60 60
Age group Under 35 years (n=530) 60 60,1
35 - 49 years (n=828) 62 62,4
50 - 64 years (n=833) ▼58 58,2
65 years or older (n=680) 62 61,8
Type of resident Apartment (n=1484) 61 60,8
House (n=1387) 60 60,4
Electricity bill? Electronic bill (n=2244) 61 61,2
Paper invoice (n=627) 59 58,6
Electricity to heating Use electricity to heat home (n=1575) 62 61,9
Not using electicity to heat home (n=1246) 59 59,3
Do not know (n=50) 53 52,5
Consumer type ACTIVE consumers (n=1423) ▲62 62,3
AWARE consumers (n=503) ▲64 64,5
INACTIVE comsumers (n=945) ▼56 56,1
Less than 5000 kWh (n=623) 63 62,9
5000- 9 999 kWh (n=488) 62 61,7
10 000- 14 999 kWh (n=479) ▲65 64,9
15 000-19 999 kWh (n=327) 64 63,8
20 000 - 24 999 kWh (n=206) 64 64,1
More than 25 000 kWh (n=94) 59 59
Do not know (n=654) ▼52 52,1
Less than 50 € (n=636) 60 60,4
50-100 € (n=664) 60 60,3
100-150 € (n=468) 64 63,6
150-200 € (n=384) 61 60,8
200-300 € (n=309) 61 61,3
More than 300 € (n=180) 60 60,4
Do not know (n=230) ▼55 54,9
Country Norway (n=701) ▲63 63,5
Sweden (n=724) 61 61,2
Denmark (n=514) ▼51 51,4
Finland (n=932) ▲63 63,1
Total (n=2871) 61 60,6
Annual KWh-use
Spending on electricity
in total an average
winter month
Q: I could easily compare different electricity contracts with each other
Standardized mean score: 0 =1 No experience and 100 = 5 High extent. 'Do not know' is not in the calculation.
0 25 50 75 100
Significant higher
Significant lower score
No difference
45

Count %
1 No experience 213 7 % 7 %
2 250 8 % 8 %
3 783 25 % 25 %
4 916 30 % 30 %
5 High extent 665 21 % 21 %
Do not know 272 9 % 9 %
Total 3099 100 % #N/A
#N/A #N/A #N/A
#N/A #N/A #N/A
#N/A #N/A #N/A
#N/A #N/A #N/A
Gender Female ▼5% 7% ▼23% ▲32% 23% ▲11% (n=1444) #N/A #N/A
Male ▲9% 9% ▲28% ▼27% 21% ▼7% (n=1650) #N/A #N/A
Other 20% 40% 20% 20% ▼0% ▼0% (n=5) #N/A #N/A
Age group Under 35 years 5% 10% 29% 29% 18% 9% (n=576) #N/A #N/A
35 - 49 years 7% 9% 26% 28% 19% 11% (n=893) #N/A #N/A
50 - 64 years 6% 8% 23% 31% 24% 8% (n=897) #N/A #N/A
65 years or older ▲9% 6% 24% 29% 24% 7% (n=733) #N/A #N/A
Type of resident Apartment ▼5% 8% 25% 29% ▲24% 9% (n=1613) #N/A #N/A
House ▲8% 8% 26% 31% ▼19% 8% (n=1486) #N/A #N/A
Electricity bill? Electronic bill ▲8% 9% 25% 29% ▼20% 9% (n=2417) #N/A #N/A
Paper invoice ▼4% 6% 26% 30% ▲26% 7% (n=682) #N/A #N/A
Electricity to heating Use electricity to heat home 7% 8% 25% 29% 22% 8% (n=1692) #N/A #N/A
Not using electicity to heat home 7% 8% 25% 29% 21% 9% (n=1354) #N/A #N/A
Do not know ▼2% 9% 19% 42% 19% 9% (n=53) #N/A #N/A
Consumer type ACTIVE consumers 6% ▼7% 23% 31% 24% 9% (n=1540) #N/A #N/A
AWARE consumers ▲12% 9% 29% 25% 18% 7% (n=516) #N/A #N/A
INACTIVE comsumers ▼5% 9% 27% 29% 20% 9% (n=1043) #N/A #N/A
Less than 5000 kWh 7% 7% 26% 29% 22% 9% (n=659) #N/A #N/A
5000- 9 999 kWh 8% 7% 29% 30% 20% 7% (n=516) #N/A #N/A
10 000- 14 999 kWh 7% 9% 23% 32% 24% ▼5% (n=491) #N/A #N/A
15 000-19 999 kWh 8% 6% 28% 30% 20% 9% (n=344) #N/A #N/A
20 000 - 24 999 kWh 6% 9% 25% 31% 20% 8% (n=218) #N/A #N/A
More than 25 000 kWh 12% 6% 23% 30% 24% 6% (n=101) #N/A #N/A
Do not know 5% 10% 22% 28% 21% ▲12% (n=770) #N/A #N/A
Less than 50 € 7% 8% 25% 30% 22% 9% (n=684) #N/A #N/A
50-100 € 6% 9% 28% 29% 20% 8% (n=704) #N/A #N/A
100-150 € 5% 8% 24% 30% 23% 9% (n=496) #N/A #N/A
150-200 € ▲11% 9% 26% 32% 17% ▼6% (n=407) #N/A #N/A
200-300 € 6% 10% 24% 30% 22% 9% (n=326) #N/A #N/A
More than 300 € 7% ▼4% 26% 28% 28% 6% (n=198) #N/A #N/A
Do not know 8% 8% 21% 27% 19% ▲16% (n=284) #N/A #N/A
Country Norway 9% 7% 24% 29% 22% 10% (n=774) #N/A #N/A
Sweden 8% ▲11% 27% ▼25% ▼18% ▲12% (n=788) #N/A #N/A
Denmark 9% 10% 25% 25% 19% 11% (n=570) #N/A #N/A
Finland ▼3% ▼6% 25% ▲37% ▲25% ▼4% (n=967) #N/A #N/A
Total 7% 8% 25% 30% 21% 9% (n=3099) #N/A #N/A
Spending on
electricity in total an
average winter
month
Annual KWh-use
Val
id N
#N/A
#N/A
Q: I trusted the information and advice from sellers
Q: I trusted the information and advice from sellers
Background variables
1 N
o e
xper
ien
ce
2 3 4 5 H
igh
ext
ent
Do
no
t kn
ow
0% 10% 20% 30% 40%
46

Count Mean Significant higherSignificant lower scoreNo difference
Gender Female (n=1291) ▲67 66,8
Male (n=1531) ▼62 61,5
Other (n=5) 35 35
Age group Under 35 years (n=523) 62 62,3
35 - 49 years (n=796) 62 61,9
50 - 64 years (n=825) ▲67 66,6
65 years or older (n=683) 64 64,1
Type of resident Apartment (n=1463) ▲66 65,8
House (n=1364) ▼62 61,9
Electricity bill? Electronic bill (n=2196) ▼63 62,7
Paper invoice (n=631) ▲68 67,9
Electricity to heating Use electricity to heat home (n=1549) 64 64
Not using electicity to heat home (n=1230) 64 63,6
Do not know (n=48) 68 68,2
Consumer type ACTIVE consumers (n=1402) ▲66 66,2
AWARE consumers (n=481) ▼57 57,1
INACTIVE comsumers (n=944) 64 64
Less than 5000 kWh (n=599) 64 64,2
5000- 9 999 kWh (n=479) 62 62,5
10 000- 14 999 kWh (n=465) 65 65,5
15 000-19 999 kWh (n=314) 63 63,5
20 000 - 24 999 kWh (n=200) 63 63,3
More than 25 000 kWh (n=95) 63 62,6
Do not know (n=675) 64 64,1
Less than 50 € (n=624) 65 64,7
50-100 € (n=647) 63 63,4
100-150 € (n=450) 66 66
150-200 € (n=384) ▼59 59,1
200-300 € (n=298) 65 64,9
More than 300 € (n=186) 68 67,7
Do not know (n=238) 63 62,6
Country Norway (n=698) 63 63,1
Sweden (n=693) ▼59 59,5
Denmark (n=510) ▼60 60
Finland (n=926) ▲70 69,9
Total (n=2827) 64 63,9
Annual KWh-use
Spending on electricity
in total an average
winter month
Q: I trusted the information and advice from sellers
Standardized mean score: 0 =1 No experience and 100 = 5 High extent. 'Do not know' is not in the calculation.
0 25 50 75 100
Significant higher
Significant lower score
No difference
47
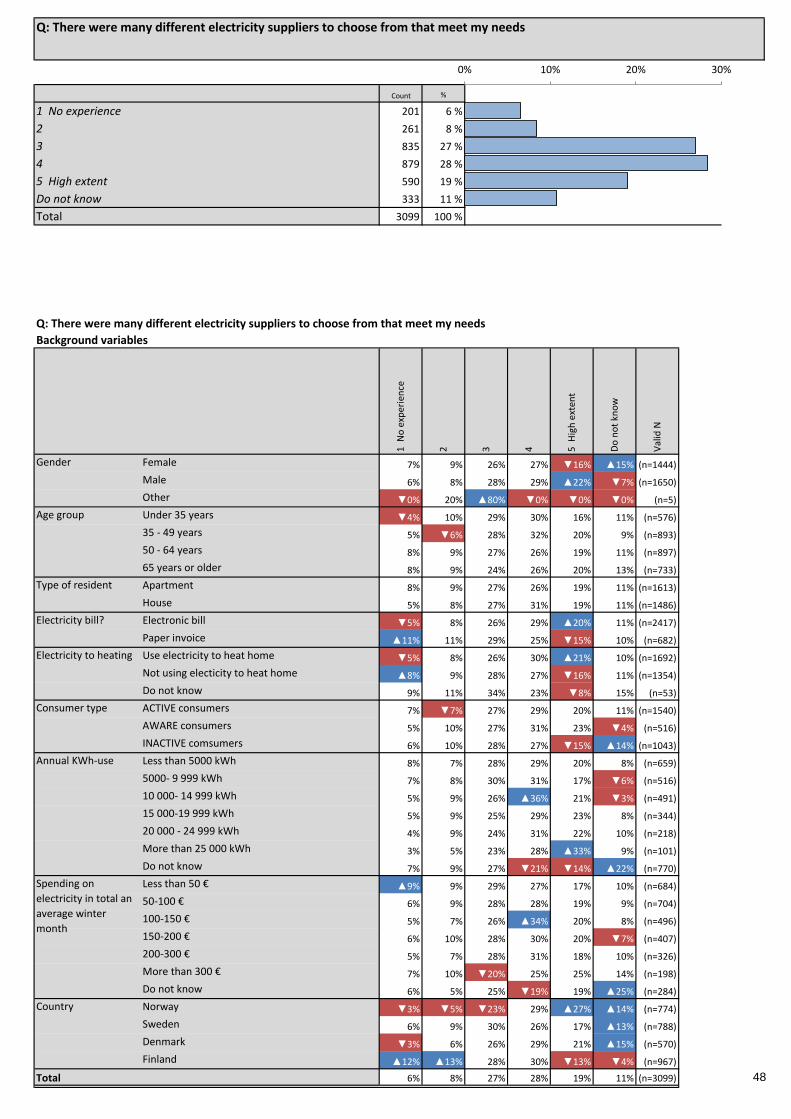
Count %
1 No experience 201 6 % 6 %
2 261 8 % 8 %
3 835 27 % 27 %
4 879 28 % 28 %
5 High extent 590 19 % 19 %
Do not know 333 11 % 11 %
Total 3099 100 % #N/A
#N/A #N/A #N/A
#N/A #N/A #N/A
#N/A #N/A #N/A
#N/A #N/A #N/A
Gender Female 7% 9% 26% 27% ▼16% ▲15% (n=1444) #N/A #N/A
Male 6% 8% 28% 29% ▲22% ▼7% (n=1650) #N/A #N/A
Other ▼0% 20% ▲80% ▼0% ▼0% ▼0% (n=5) #N/A #N/A
Age group Under 35 years ▼4% 10% 29% 30% 16% 11% (n=576) #N/A #N/A
35 - 49 years 5% ▼6% 28% 32% 20% 9% (n=893) #N/A #N/A
50 - 64 years 8% 9% 27% 26% 19% 11% (n=897) #N/A #N/A
65 years or older 8% 9% 24% 26% 20% 13% (n=733) #N/A #N/A
Type of resident Apartment 8% 9% 27% 26% 19% 11% (n=1613) #N/A #N/A
House 5% 8% 27% 31% 19% 11% (n=1486) #N/A #N/A
Electricity bill? Electronic bill ▼5% 8% 26% 29% ▲20% 11% (n=2417) #N/A #N/A
Paper invoice ▲11% 11% 29% 25% ▼15% 10% (n=682) #N/A #N/A
Electricity to heating Use electricity to heat home ▼5% 8% 26% 30% ▲21% 10% (n=1692) #N/A #N/A
Not using electicity to heat home ▲8% 9% 28% 27% ▼16% 11% (n=1354) #N/A #N/A
Do not know 9% 11% 34% 23% ▼8% 15% (n=53) #N/A #N/A
Consumer type ACTIVE consumers 7% ▼7% 27% 29% 20% 11% (n=1540) #N/A #N/A
AWARE consumers 5% 10% 27% 31% 23% ▼4% (n=516) #N/A #N/A
INACTIVE comsumers 6% 10% 28% 27% ▼15% ▲14% (n=1043) #N/A #N/A
Less than 5000 kWh 8% 7% 28% 29% 20% 8% (n=659) #N/A #N/A
5000- 9 999 kWh 7% 8% 30% 31% 17% ▼6% (n=516) #N/A #N/A
10 000- 14 999 kWh 5% 9% 26% ▲36% 21% ▼3% (n=491) #N/A #N/A
15 000-19 999 kWh 5% 9% 25% 29% 23% 8% (n=344) #N/A #N/A
20 000 - 24 999 kWh 4% 9% 24% 31% 22% 10% (n=218) #N/A #N/A
More than 25 000 kWh 3% 5% 23% 28% ▲33% 9% (n=101) #N/A #N/A
Do not know 7% 9% 27% ▼21% ▼14% ▲22% (n=770) #N/A #N/A
Less than 50 € ▲9% 9% 29% 27% 17% 10% (n=684) #N/A #N/A
50-100 € 6% 9% 28% 28% 19% 9% (n=704) #N/A #N/A
100-150 € 5% 7% 26% ▲34% 20% 8% (n=496) #N/A #N/A
150-200 € 6% 10% 28% 30% 20% ▼7% (n=407) #N/A #N/A
200-300 € 5% 7% 28% 31% 18% 10% (n=326) #N/A #N/A
More than 300 € 7% 10% ▼20% 25% 25% 14% (n=198) #N/A #N/A
Do not know 6% 5% 25% ▼19% 19% ▲25% (n=284) #N/A #N/A
Country Norway ▼3% ▼5% ▼23% 29% ▲27% ▲14% (n=774) #N/A #N/A
Sweden 6% 9% 30% 26% 17% ▲13% (n=788) #N/A #N/A
Denmark ▼3% 6% 26% 29% 21% ▲15% (n=570) #N/A #N/A
Finland ▲12% ▲13% 28% 30% ▼13% ▼4% (n=967) #N/A #N/A
Total 6% 8% 27% 28% 19% 11% (n=3099) #N/A #N/A
Spending on
electricity in total an
average winter
month
Annual KWh-use
Val
id N
#N/A
#N/A
Q: There were many different electricity suppliers to choose from that meet my needs
Q: There were many different electricity suppliers to choose from that meet my needs
Background variables
1 N
o e
xper
ien
ce
2 3 4 5 H
igh
ext
ent
Do
no
t kn
ow
0% 10% 20% 30%
48
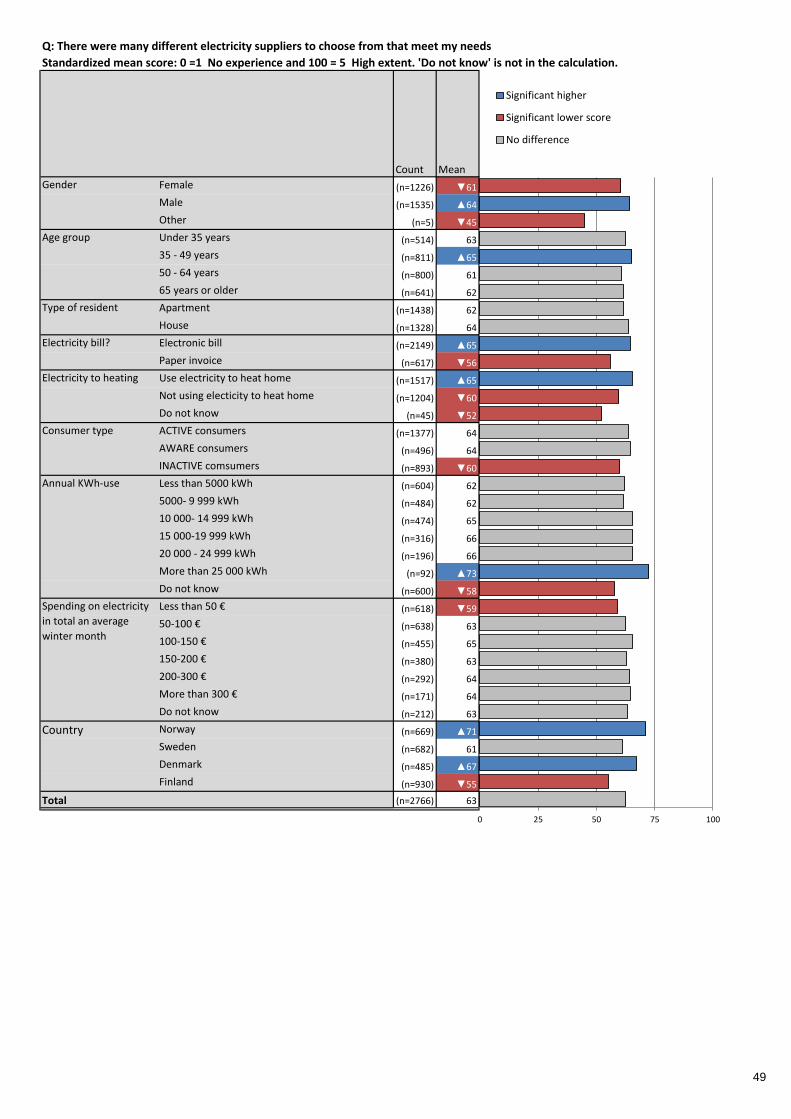
Count Mean Significant higherSignificant lower scoreNo difference
Gender Female (n=1226) ▼61 60,6
Male (n=1535) ▲64 64,3
Other (n=5) ▼45 45
Age group Under 35 years (n=514) 63 62,5
35 - 49 years (n=811) ▲65 65,3
50 - 64 years (n=800) 61 60,8
65 years or older (n=641) 62 61,6
Type of resident Apartment (n=1438) 62 61,5
House (n=1328) 64 63,8
Electricity bill? Electronic bill (n=2149) ▲65 64,5
Paper invoice (n=617) ▼56 55,9
Electricity to heating Use electricity to heat home (n=1517) ▲65 65,3
Not using electicity to heat home (n=1204) ▼60 59,6
Do not know (n=45) ▼52 52,2
Consumer type ACTIVE consumers (n=1377) 64 63,7
AWARE consumers (n=496) 64 64,5
INACTIVE comsumers (n=893) ▼60 60
Less than 5000 kWh (n=604) 62 62
5000- 9 999 kWh (n=484) 62 61,5
10 000- 14 999 kWh (n=474) 65 65,4
15 000-19 999 kWh (n=316) 66 65,6
20 000 - 24 999 kWh (n=196) 66 65,7
More than 25 000 kWh (n=92) ▲73 72,6
Do not know (n=600) ▼58 57,8
Less than 50 € (n=618) ▼59 59
50-100 € (n=638) 63 62,7
100-150 € (n=455) 65 65,3
150-200 € (n=380) 63 62,9
200-300 € (n=292) 64 64,1
More than 300 € (n=171) 64 64,5
Do not know (n=212) 63 63,2
Country Norway (n=669) ▲71 71,2
Sweden (n=682) 61 61,2
Denmark (n=485) ▲67 67,2
Finland (n=930) ▼55 55,1
Total (n=2766) 63 62,6
Annual KWh-use
Spending on electricity
in total an average
winter month
Q: There were many different electricity suppliers to choose from that meet my needs
Standardized mean score: 0 =1 No experience and 100 = 5 High extent. 'Do not know' is not in the calculation.
0 25 50 75 100
Significant higher
Significant lower score
No difference
49
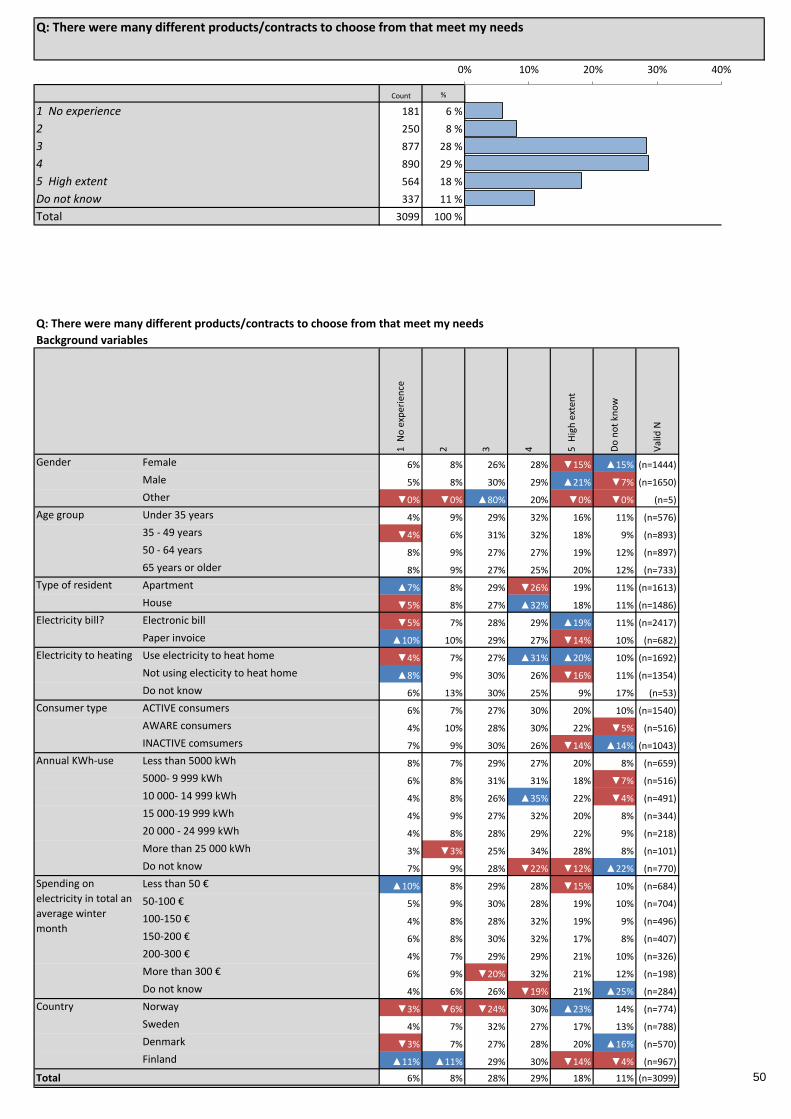
Count %
1 No experience 181 6 % 6 %
2 250 8 % 8 %
3 877 28 % 28 %
4 890 29 % 29 %
5 High extent 564 18 % 18 %
Do not know 337 11 % 11 %
Total 3099 100 % #N/A
#N/A #N/A #N/A
#N/A #N/A #N/A
#N/A #N/A #N/A
#N/A #N/A #N/A
Gender Female 6% 8% 26% 28% ▼15% ▲15% (n=1444) #N/A #N/A
Male 5% 8% 30% 29% ▲21% ▼7% (n=1650) #N/A #N/A
Other ▼0% ▼0% ▲80% 20% ▼0% ▼0% (n=5) #N/A #N/A
Age group Under 35 years 4% 9% 29% 32% 16% 11% (n=576) #N/A #N/A
35 - 49 years ▼4% 6% 31% 32% 18% 9% (n=893) #N/A #N/A
50 - 64 years 8% 9% 27% 27% 19% 12% (n=897) #N/A #N/A
65 years or older 8% 9% 27% 25% 20% 12% (n=733) #N/A #N/A
Type of resident Apartment ▲7% 8% 29% ▼26% 19% 11% (n=1613) #N/A #N/A
House ▼5% 8% 27% ▲32% 18% 11% (n=1486) #N/A #N/A
Electricity bill? Electronic bill ▼5% 7% 28% 29% ▲19% 11% (n=2417) #N/A #N/A
Paper invoice ▲10% 10% 29% 27% ▼14% 10% (n=682) #N/A #N/A
Electricity to heating Use electricity to heat home ▼4% 7% 27% ▲31% ▲20% 10% (n=1692) #N/A #N/A
Not using electicity to heat home ▲8% 9% 30% 26% ▼16% 11% (n=1354) #N/A #N/A
Do not know 6% 13% 30% 25% 9% 17% (n=53) #N/A #N/A
Consumer type ACTIVE consumers 6% 7% 27% 30% 20% 10% (n=1540) #N/A #N/A
AWARE consumers 4% 10% 28% 30% 22% ▼5% (n=516) #N/A #N/A
INACTIVE comsumers 7% 9% 30% 26% ▼14% ▲14% (n=1043) #N/A #N/A
Less than 5000 kWh 8% 7% 29% 27% 20% 8% (n=659) #N/A #N/A
5000- 9 999 kWh 6% 8% 31% 31% 18% ▼7% (n=516) #N/A #N/A
10 000- 14 999 kWh 4% 8% 26% ▲35% 22% ▼4% (n=491) #N/A #N/A
15 000-19 999 kWh 4% 9% 27% 32% 20% 8% (n=344) #N/A #N/A
20 000 - 24 999 kWh 4% 8% 28% 29% 22% 9% (n=218) #N/A #N/A
More than 25 000 kWh 3% ▼3% 25% 34% 28% 8% (n=101) #N/A #N/A
Do not know 7% 9% 28% ▼22% ▼12% ▲22% (n=770) #N/A #N/A
Less than 50 € ▲10% 8% 29% 28% ▼15% 10% (n=684) #N/A #N/A
50-100 € 5% 9% 30% 28% 19% 10% (n=704) #N/A #N/A
100-150 € 4% 8% 28% 32% 19% 9% (n=496) #N/A #N/A
150-200 € 6% 8% 30% 32% 17% 8% (n=407) #N/A #N/A
200-300 € 4% 7% 29% 29% 21% 10% (n=326) #N/A #N/A
More than 300 € 6% 9% ▼20% 32% 21% 12% (n=198) #N/A #N/A
Do not know 4% 6% 26% ▼19% 21% ▲25% (n=284) #N/A #N/A
Country Norway ▼3% ▼6% ▼24% 30% ▲23% 14% (n=774) #N/A #N/A
Sweden 4% 7% 32% 27% 17% 13% (n=788) #N/A #N/A
Denmark ▼3% 7% 27% 28% 20% ▲16% (n=570) #N/A #N/A
Finland ▲11% ▲11% 29% 30% ▼14% ▼4% (n=967) #N/A #N/A
Total 6% 8% 28% 29% 18% 11% (n=3099) #N/A #N/A
Spending on
electricity in total an
average winter
month
Annual KWh-use
Val
id N
#N/A
#N/A
Q: There were many different products/contracts to choose from that meet my needs
Q: There were many different products/contracts to choose from that meet my needs
Background variables
1 N
o e
xper
ien
ce
2 3 4 5 H
igh
ext
ent
Do
no
t kn
ow
0% 10% 20% 30% 40%
50

Count Mean Significant higherSignificant lower scoreNo difference
Gender Female (n=1221) 61 61,1
Male (n=1536) 64 64
Other (n=5) 55 55
Age group Under 35 years (n=514) 63 62,9
35 - 49 years (n=809) 65 64,8
50 - 64 years (n=791) 61 61,3
65 years or older (n=648) 62 61,8
Type of resident Apartment (n=1436) 61 61,5
House (n=1326) 64 64,1
Electricity bill? Electronic bill (n=2149) ▲64 64,3
Paper invoice (n=613) ▼57 57,1
Electricity to heating Use electricity to heat home (n=1517) ▲65 65,4
Not using electicity to heat home (n=1201) ▼60 59,6
Do not know (n=44) 56 55,7
Consumer type ACTIVE consumers (n=1379) 64 64,2
AWARE consumers (n=491) 65 64,5
INACTIVE comsumers (n=892) ▼60 59,5
Less than 5000 kWh (n=603) 62 61,8
5000- 9 999 kWh (n=481) 63 62,6
10 000- 14 999 kWh (n=471) ▲66 66
15 000-19 999 kWh (n=316) 65 65,2
20 000 - 24 999 kWh (n=199) 66 65,7
More than 25 000 kWh (n=93) ▲72 71,8
Do not know (n=599) ▼57 57,5
Less than 50 € (n=615) ▼58 58,3
50-100 € (n=637) 63 62,8
100-150 € (n=453) 65 64,7
150-200 € (n=375) 63 62,7
200-300 € (n=295) 65 65,3
More than 300 € (n=174) 65 65,2
Do not know (n=213) 66 65,6
Country Norway (n=669) ▲69 69,1
Sweden (n=687) 63 63
Denmark (n=481) ▲66 66,5
Finland (n=925) ▼56 56
Total (n=2762) 63 62,7
Annual KWh-use
Spending on electricity
in total an average
winter month
Q: There were many different products/contracts to choose from that meet my needs
Standardized mean score: 0 =1 No experience and 100 = 5 High extent. 'Do not know' is not in the calculation.
0 25 50 75 100
Significant higher
Significant lower score
No difference
51
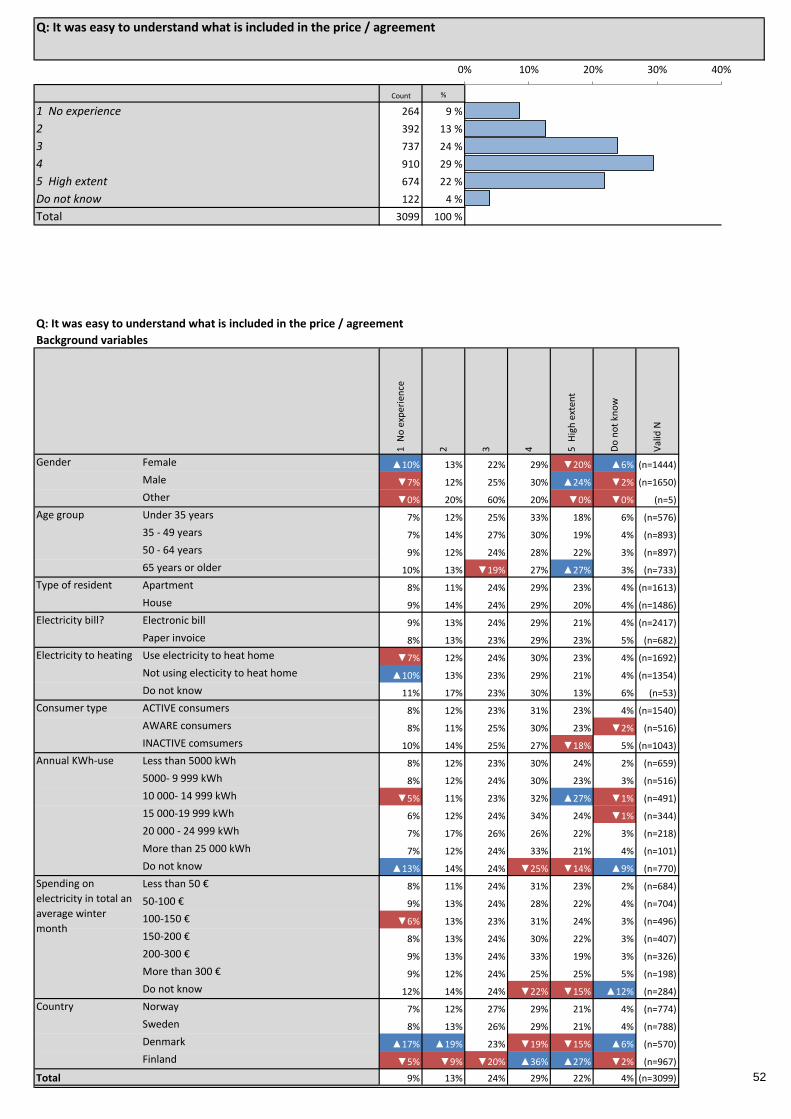
Count %
1 No experience 264 9 % 9 %
2 392 13 % 13 %
3 737 24 % 24 %
4 910 29 % 29 %
5 High extent 674 22 % 22 %
Do not know 122 4 % 4 %
Total 3099 100 % #N/A
#N/A #N/A #N/A
#N/A #N/A #N/A
#N/A #N/A #N/A
#N/A #N/A #N/A
Gender Female ▲10% 13% 22% 29% ▼20% ▲6% (n=1444) #N/A #N/A
Male ▼7% 12% 25% 30% ▲24% ▼2% (n=1650) #N/A #N/A
Other ▼0% 20% 60% 20% ▼0% ▼0% (n=5) #N/A #N/A
Age group Under 35 years 7% 12% 25% 33% 18% 6% (n=576) #N/A #N/A
35 - 49 years 7% 14% 27% 30% 19% 4% (n=893) #N/A #N/A
50 - 64 years 9% 12% 24% 28% 22% 3% (n=897) #N/A #N/A
65 years or older 10% 13% ▼19% 27% ▲27% 3% (n=733) #N/A #N/A
Type of resident Apartment 8% 11% 24% 29% 23% 4% (n=1613) #N/A #N/A
House 9% 14% 24% 29% 20% 4% (n=1486) #N/A #N/A
Electricity bill? Electronic bill 9% 13% 24% 29% 21% 4% (n=2417) #N/A #N/A
Paper invoice 8% 13% 23% 29% 23% 5% (n=682) #N/A #N/A
Electricity to heating Use electricity to heat home ▼7% 12% 24% 30% 23% 4% (n=1692) #N/A #N/A
Not using electicity to heat home ▲10% 13% 23% 29% 21% 4% (n=1354) #N/A #N/A
Do not know 11% 17% 23% 30% 13% 6% (n=53) #N/A #N/A
Consumer type ACTIVE consumers 8% 12% 23% 31% 23% 4% (n=1540) #N/A #N/A
AWARE consumers 8% 11% 25% 30% 23% ▼2% (n=516) #N/A #N/A
INACTIVE comsumers 10% 14% 25% 27% ▼18% 5% (n=1043) #N/A #N/A
Less than 5000 kWh 8% 12% 23% 30% 24% 2% (n=659) #N/A #N/A
5000- 9 999 kWh 8% 12% 24% 30% 23% 3% (n=516) #N/A #N/A
10 000- 14 999 kWh ▼5% 11% 23% 32% ▲27% ▼1% (n=491) #N/A #N/A
15 000-19 999 kWh 6% 12% 24% 34% 24% ▼1% (n=344) #N/A #N/A
20 000 - 24 999 kWh 7% 17% 26% 26% 22% 3% (n=218) #N/A #N/A
More than 25 000 kWh 7% 12% 24% 33% 21% 4% (n=101) #N/A #N/A
Do not know ▲13% 14% 24% ▼25% ▼14% ▲9% (n=770) #N/A #N/A
Less than 50 € 8% 11% 24% 31% 23% 2% (n=684) #N/A #N/A
50-100 € 9% 13% 24% 28% 22% 4% (n=704) #N/A #N/A
100-150 € ▼6% 13% 23% 31% 24% 3% (n=496) #N/A #N/A
150-200 € 8% 13% 24% 30% 22% 3% (n=407) #N/A #N/A
200-300 € 9% 13% 24% 33% 19% 3% (n=326) #N/A #N/A
More than 300 € 9% 12% 24% 25% 25% 5% (n=198) #N/A #N/A
Do not know 12% 14% 24% ▼22% ▼15% ▲12% (n=284) #N/A #N/A
Country Norway 7% 12% 27% 29% 21% 4% (n=774) #N/A #N/A
Sweden 8% 13% 26% 29% 21% 4% (n=788) #N/A #N/A
Denmark ▲17% ▲19% 23% ▼19% ▼15% ▲6% (n=570) #N/A #N/A
Finland ▼5% ▼9% ▼20% ▲36% ▲27% ▼2% (n=967) #N/A #N/A
Total 9% 13% 24% 29% 22% 4% (n=3099) #N/A #N/A
Spending on
electricity in total an
average winter
month
Annual KWh-use
Val
id N
#N/A
#N/A
Q: It was easy to understand what is included in the price / agreement
Q: It was easy to understand what is included in the price / agreement
Background variables
1 N
o e
xper
ien
ce
2 3 4 5 H
igh
ext
ent
Do
no
t kn
ow
0% 10% 20% 30% 40%
52

Count Mean Significant higherSignificant lower scoreNo difference
Gender Female (n=1357) ▼59 59,2
Male (n=1615) ▲63 63
Other (n=5) 50 50
Age group Under 35 years (n=544) 62 61,6
35 - 49 years (n=859) 60 60,2
50 - 64 years (n=866) 61 60,9
65 years or older (n=708) 63 62,6
Type of resident Apartment (n=1544) 62 62,5
House (n=1433) 60 59,9
Electricity bill? Electronic bill (n=2328) 61 61
Paper invoice (n=649) 62 62,1
Electricity to heating Use electricity to heat home (n=1625) ▲63 62,7
Not using electicity to heat home (n=1302) 60 59,6
Do not know (n=50) 55 54,5
Consumer type ACTIVE consumers (n=1481) ▲63 63,1
AWARE consumers (n=506) 63 62,7
INACTIVE comsumers (n=990) ▼58 57,8
Less than 5000 kWh (n=643) 62 62,5
5000- 9 999 kWh (n=500) 63 62,8
10 000- 14 999 kWh (n=485) ▲67 66,7
15 000-19 999 kWh (n=340) 65 64,6
20 000 - 24 999 kWh (n=212) 60 60
More than 25 000 kWh (n=97) 63 62,6
Do not know (n=700) ▼54 53,8
Less than 50 € (n=667) 63 63
50-100 € (n=679) 60 60,1
100-150 € (n=480) 64 64,1
150-200 € (n=395) 62 61,5
200-300 € (n=317) 60 60,5
More than 300 € (n=189) 62 62,2
Do not know (n=250) ▼54 53,9
Country Norway (n=740) 62 62,3
Sweden (n=756) 61 60,8
Denmark (n=535) ▼49 48,7
Finland (n=946) ▲68 67,9
Total (n=2977) 61 61,2
Annual KWh-use
Spending on electricity
in total an average
winter month
Q: It was easy to understand what is included in the price / agreement
Standardized mean score: 0 =1 No experience and 100 = 5 High extent. 'Do not know' is not in the calculation.
0 25 50 75 100
Significant higher
Significant lower score
No difference
53

Count %
1 No experience 182 6 % 6 %
2 290 9 % 9 %
3 887 29 % 29 %
4 1017 33 % 33 %
5 High extent 591 19 % 19 %
Do not know 132 4 % 4 %
Total 3099 100 % #N/A
#N/A #N/A #N/A
#N/A #N/A #N/A
#N/A #N/A #N/A
#N/A #N/A #N/A
Gender Female ▲7% 10% 29% 31% ▼16% ▲6% (n=1444) #N/A #N/A
Male ▼5% 9% 29% 34% ▲21% ▼3% (n=1650) #N/A #N/A
Other ▼0% 20% 40% 40% ▼0% ▼0% (n=5) #N/A #N/A
Age group Under 35 years 6% 11% 30% 34% ▼13% 6% (n=576) #N/A #N/A
35 - 49 years 5% 10% 31% 34% 17% 3% (n=893) #N/A #N/A
50 - 64 years 6% 9% 27% 34% 20% 4% (n=897) #N/A #N/A
65 years or older 6% 8% 26% 29% ▲25% 5% (n=733) #N/A #N/A
Type of resident Apartment ▲7% 9% 28% 32% 19% 5% (n=1613) #N/A #N/A
House ▼5% 9% 29% 34% 19% 4% (n=1486) #N/A #N/A
Electricity bill? Electronic bill 5% 9% 29% 33% 20% 4% (n=2417) #N/A #N/A
Paper invoice 7% 11% 29% 32% 16% 5% (n=682) #N/A #N/A
Electricity to heating Use electricity to heat home 5% 9% 29% 34% 19% 4% (n=1692) #N/A #N/A
Not using electicity to heat home 6% 10% 28% 31% 20% 5% (n=1354) #N/A #N/A
Do not know 11% 21% 19% 34% 13% 2% (n=53) #N/A #N/A
Consumer type ACTIVE consumers 5% 9% 28% 34% 21% 4% (n=1540) #N/A #N/A
AWARE consumers 5% ▼6% 30% 36% 22% ▼1% (n=516) #N/A #N/A
INACTIVE comsumers ▲8% ▲12% 29% 30% ▼16% ▲6% (n=1043) #N/A #N/A
Less than 5000 kWh 4% ▼6% 29% 34% ▲24% 3% (n=659) #N/A #N/A
5000- 9 999 kWh 5% 10% 30% 33% 19% 3% (n=516) #N/A #N/A
10 000- 14 999 kWh ▼3% 8% 30% 35% 23% ▼2% (n=491) #N/A #N/A
15 000-19 999 kWh 5% 9% 26% ▲40% 20% ▼1% (n=344) #N/A #N/A
20 000 - 24 999 kWh 5% 8% 27% 35% 24% ▼2% (n=218) #N/A #N/A
More than 25 000 kWh 4% 8% 29% 38% 19% 3% (n=101) #N/A #N/A
Do not know ▲11% ▲13% 29% ▼26% ▼11% ▲9% (n=770) #N/A #N/A
Less than 50 € 5% 9% 28% 35% 20% 4% (n=684) #N/A #N/A
50-100 € 6% 8% 31% 32% 19% 3% (n=704) #N/A #N/A
100-150 € 5% 10% 25% 36% 20% 3% (n=496) #N/A #N/A
150-200 € 5% 9% 32% 34% 16% 3% (n=407) #N/A #N/A
200-300 € 5% 11% 27% 33% 21% 3% (n=326) #N/A #N/A
More than 300 € 7% 10% 28% 30% 20% 5% (n=198) #N/A #N/A
Do not know 8% 11% 27% ▼24% 16% ▲12% (n=284) #N/A #N/A
Country Norway 4% 8% 29% 35% 18% 5% (n=774) #N/A #N/A
Sweden 6% 7% 28% 33% 22% 4% (n=788) #N/A #N/A
Denmark 8% 12% 30% ▼28% 17% 5% (n=570) #N/A #N/A
Finland 7% 11% 28% 33% 19% 3% (n=967) #N/A #N/A
Total 6% 9% 29% 33% 19% 4% (n=3099) #N/A #N/A
Spending on
electricity in total an
average winter
month
Annual KWh-use
Val
id N
#N/A
#N/A
Q: I was well-informed
Q: I was well-informed
Background variables
1 N
o e
xper
ien
ce
2 3 4 5 H
igh
ext
ent
Do
no
t kn
ow
0% 10% 20% 30% 40%
54
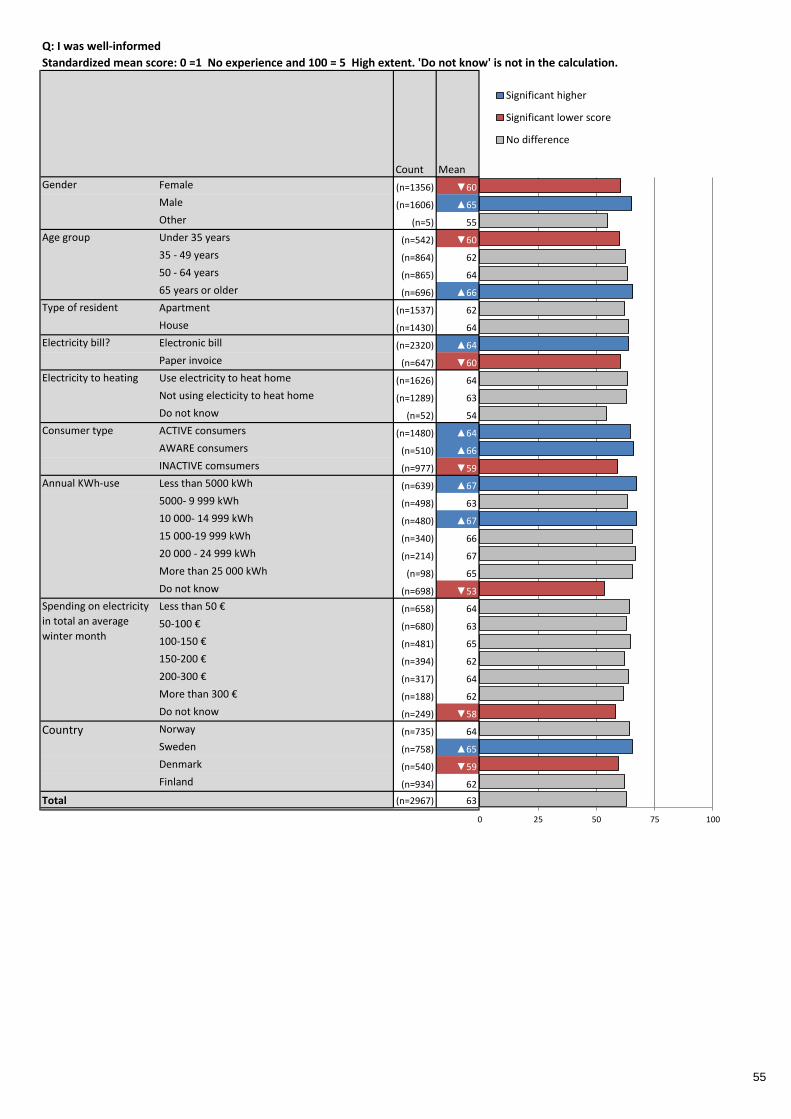
Count Mean Significant higherSignificant lower scoreNo difference
Gender Female (n=1356) ▼60 60,4
Male (n=1606) ▲65 65,2
Other (n=5) 55 55
Age group Under 35 years (n=542) ▼60 59,8
35 - 49 years (n=864) 62 62,4
50 - 64 years (n=865) 64 63,6
65 years or older (n=696) ▲66 65,6
Type of resident Apartment (n=1537) 62 62,1
House (n=1430) 64 64
Electricity bill? Electronic bill (n=2320) ▲64 63,8
Paper invoice (n=647) ▼60 60,3
Electricity to heating Use electricity to heat home (n=1626) 64 63,5
Not using electicity to heat home (n=1289) 63 62,7
Do not know (n=52) 54 54,3
Consumer type ACTIVE consumers (n=1480) ▲64 64,5
AWARE consumers (n=510) ▲66 66,1
INACTIVE comsumers (n=977) ▼59 59,2
Less than 5000 kWh (n=639) ▲67 67,3
5000- 9 999 kWh (n=498) 63 63,2
10 000- 14 999 kWh (n=480) ▲67 67,3
15 000-19 999 kWh (n=340) 66 65,6
20 000 - 24 999 kWh (n=214) 67 66,8
More than 25 000 kWh (n=98) 65 65,3
Do not know (n=698) ▼53 53,3
Less than 50 € (n=658) 64 64,4
50-100 € (n=680) 63 62,8
100-150 € (n=481) 65 64,7
150-200 € (n=394) 62 62,2
200-300 € (n=317) 64 63,7
More than 300 € (n=188) 62 61,8
Do not know (n=249) ▼58 58,1
Country Norway (n=735) 64 64,4
Sweden (n=758) ▲65 65,4
Denmark (n=540) ▼59 59,4
Finland (n=934) 62 62,1
Total (n=2967) 63 63
Annual KWh-use
Spending on electricity
in total an average
winter month
Q: I was well-informed
Standardized mean score: 0 =1 No experience and 100 = 5 High extent. 'Do not know' is not in the calculation.
0 25 50 75 100
Significant higher
Significant lower score
No difference
55

Count %
Yes 1455 47 % 47 %
No 1538 50 % 50 %
Do not know 106 3 % 3 %
Total 3099 100 % #N/A
#N/A #N/A #N/A
#N/A #N/A #N/A
#N/A #N/A #N/A
#N/A #N/A #N/A
#N/A #N/A #N/A
#N/A #N/A #N/A
#N/A #N/A #N/A
Gender Female ▼43% ▲53% ▲5% (n=1444) #N/A #N/A #N/A #N/A #N/A
Male ▲51% ▼47% ▼2% (n=1650) #N/A #N/A #N/A #N/A #N/A
Other 20% 60% 20% (n=5) #N/A #N/A #N/A #N/A #N/A
Age group Under 35 years 51% 45% 4% (n=576) #N/A #N/A #N/A #N/A #N/A
35 - 49 years ▲52% ▼44% 4% (n=893) #N/A #N/A #N/A #N/A #N/A
50 - 64 years ▼42% ▲55% 3% (n=897) #N/A #N/A #N/A #N/A #N/A
65 years or older 44% 53% 3% (n=733) #N/A #N/A #N/A #N/A #N/A
Type of resident Apartment ▼44% ▲53% 3% (n=1613) #N/A #N/A #N/A #N/A #N/A
House ▲50% ▼46% 4% (n=1486) #N/A #N/A #N/A #N/A #N/A
Electricity bill? Electronic bill 48% 49% 3% (n=2417) #N/A #N/A #N/A #N/A #N/A
Paper invoice 44% 53% 3% (n=682) #N/A #N/A #N/A #N/A #N/A
Electricity to heating Use electricity to heat home ▲51% ▼45% 4% (n=1692) #N/A #N/A #N/A #N/A #N/A
Not using electicity to heat home ▼42% ▲55% 3% (n=1354) #N/A #N/A #N/A #N/A #N/A
Do not know ▼26% ▲70% 4% (n=53) #N/A #N/A #N/A #N/A #N/A
Consumer type ACTIVE consumers 47% 50% ▼2% (n=1540) #N/A #N/A #N/A #N/A #N/A
AWARE consumers ▲64% ▼34% 2% (n=516) #N/A #N/A #N/A #N/A #N/A
INACTIVE comsumers ▼38% ▲56% ▲6% (n=1043) #N/A #N/A #N/A #N/A #N/A
Less than 5000 kWh ▲53% ▼45% 3% (n=659) #N/A #N/A #N/A #N/A #N/A
5000- 9 999 kWh ▲53% 45% 3% (n=516) #N/A #N/A #N/A #N/A #N/A
10 000- 14 999 kWh ▲54% ▼44% 2% (n=491) #N/A #N/A #N/A #N/A #N/A
15 000-19 999 kWh ▲58% ▼41% ▼1% (n=344) #N/A #N/A #N/A #N/A #N/A
20 000 - 24 999 kWh 51% 45% 3% (n=218) #N/A #N/A #N/A #N/A #N/A
More than 25 000 kWh 50% 46% 4% (n=101) #N/A #N/A #N/A #N/A #N/A
Do not know ▼27% ▲66% ▲6% (n=770) #N/A #N/A #N/A #N/A #N/A
Less than 50 € 45% 53% ▼2% (n=684) #N/A #N/A #N/A #N/A #N/A
50-100 € 46% 51% 3% (n=704) #N/A #N/A #N/A #N/A #N/A
100-150 € 48% 48% 4% (n=496) #N/A #N/A #N/A #N/A #N/A
150-200 € 50% 47% 3% (n=407) #N/A #N/A #N/A #N/A #N/A
200-300 € ▲55% ▼42% 3% (n=326) #N/A #N/A #N/A #N/A #N/A
More than 300 € 55% ▼41% 4% (n=198) #N/A #N/A #N/A #N/A #N/A
Do not know ▼33% ▲58% ▲9% (n=284) #N/A #N/A #N/A #N/A #N/A
Country Norway ▼41% ▲55% 4% (n=774) #N/A #N/A #N/A #N/A #N/A
Sweden ▲54% ▼44% 3% (n=788) #N/A #N/A #N/A #N/A #N/A
Denmark ▼38% ▲57% 5% (n=570) #N/A #N/A #N/A #N/A #N/A
Finland ▲52% 46% ▼2% (n=967) #N/A #N/A #N/A #N/A #N/A
Total 47% 50% 3% (n=3099) #N/A #N/A #N/A #N/A #N/A
Spending on
electricity in total an
average winter
month
Annual KWh-use
#N/A
#N/A
#N/A
Q: When you signed/compared your current electricity contract, did you visit an online comparison tool?
Q: When you signed/compared your current electricity contract, did you visit an online comparison tool?
Background variables
Yes
No
Do
no
t kn
ow
Val
id N
#N/A
#N/A
0% 20% 40% 60%
56

Count %
Elpris.dk 153 11 % 11 % 11 %
Energiaviraston ylläpitämä sähkön hintavertailusivusto (sahkonhinta.fi) 321 22 % 22 % 22 %
Strømpris.no (fra Forbrukerrådet) 173 12 % 12 % 12 %
Elskling 317 22 % 22 % 22 %
Forbrukernet 28 2 % 2 % 2 %
Elpriskollen 98 7 % 7 % 7 %
Compricer 152 10 % 10 % 10 %
Vertaa.fi 11 1 % 1 % 1 %
kilpailuttaja.fi 17 1 % 1 % 1 %
Other 78 5 % 5 % 5 %
Can not remember 305 21 % 21 %
Total 1455
#N/A #N/A #N/A
#N/A #N/A #N/A
#N/A #N/A #N/A
#N/A #N/A #N/A
#N/A #N/A #N/A
#N/A #N/A #N/A
#N/A #N/A #N/A
Q: What comparison tool(s) did you visit online?
Several answers possible.
0% 10% 20% 30%
57
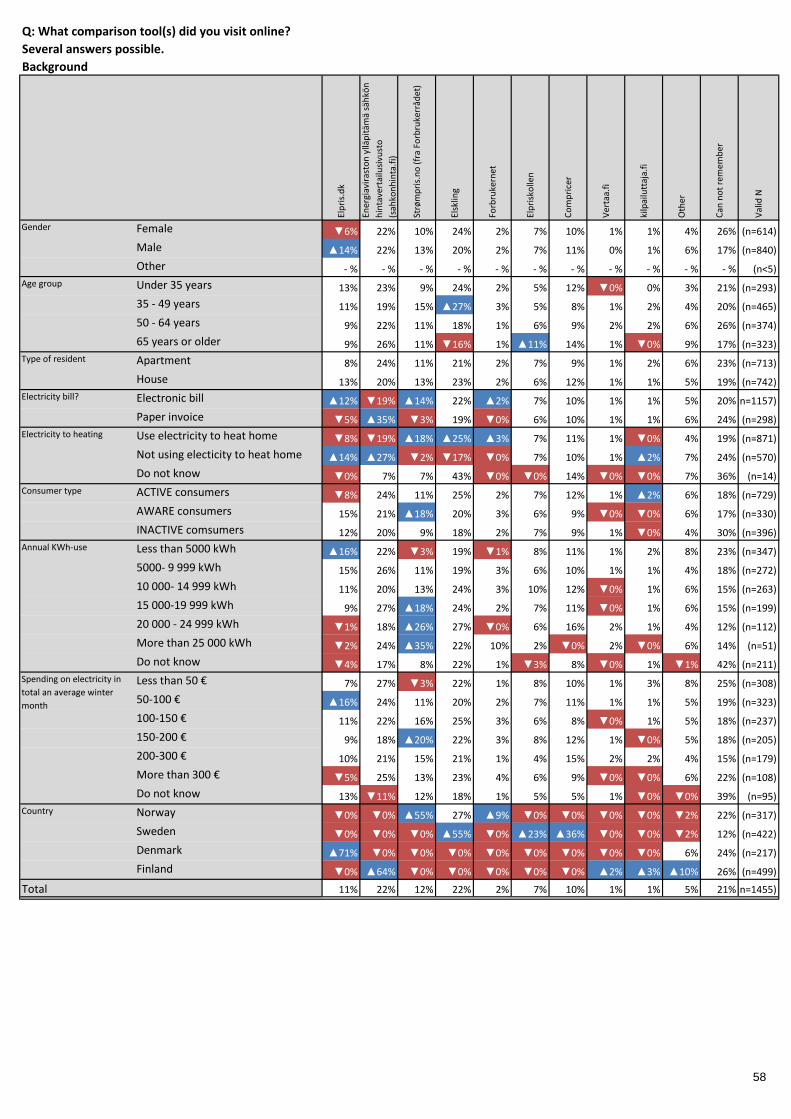
Gender Female ▼6% 22% 10% 24% 2% 7% 10% 1% 1% 4% 26% (n=614)
Male ▲14% 22% 13% 20% 2% 7% 11% 0% 1% 6% 17% (n=840)
Other - % - % - % - % - % - % - % - % - % - % - % (n<5)
Age group Under 35 years 13% 23% 9% 24% 2% 5% 12% ▼0% 0% 3% 21% (n=293)
35 - 49 years 11% 19% 15% ▲27% 3% 5% 8% 1% 2% 4% 20% (n=465)
50 - 64 years 9% 22% 11% 18% 1% 6% 9% 2% 2% 6% 26% (n=374)
65 years or older 9% 26% 11% ▼16% 1% ▲11% 14% 1% ▼0% 9% 17% (n=323)
Type of resident Apartment 8% 24% 11% 21% 2% 7% 9% 1% 2% 6% 23% (n=713)
House 13% 20% 13% 23% 2% 6% 12% 1% 1% 5% 19% (n=742)
Electricity bill? Electronic bill ▲12% ▼19% ▲14% 22% ▲2% 7% 10% 1% 1% 5% 20%(n=1157)
Paper invoice ▼5% ▲35% ▼3% 19% ▼0% 6% 10% 1% 1% 6% 24% (n=298)
Electricity to heating Use electricity to heat home ▼8% ▼19% ▲18% ▲25% ▲3% 7% 11% 1% ▼0% 4% 19% (n=871)
Not using electicity to heat home ▲14% ▲27% ▼2% ▼17% ▼0% 7% 10% 1% ▲2% 7% 24% (n=570)
Do not know ▼0% 7% 7% 43% ▼0% ▼0% 14% ▼0% ▼0% 7% 36% (n=14)
Consumer type ACTIVE consumers ▼8% 24% 11% 25% 2% 7% 12% 1% ▲2% 6% 18% (n=729)
AWARE consumers 15% 21% ▲18% 20% 3% 6% 9% ▼0% ▼0% 6% 17% (n=330)
INACTIVE comsumers 12% 20% 9% 18% 2% 7% 9% 1% ▼0% 4% 30% (n=396)
Annual KWh-use Less than 5000 kWh ▲16% 22% ▼3% 19% ▼1% 8% 11% 1% 2% 8% 23% (n=347)
5000- 9 999 kWh 15% 26% 11% 19% 3% 6% 10% 1% 1% 4% 18% (n=272)
10 000- 14 999 kWh 11% 20% 13% 24% 3% 10% 12% ▼0% 1% 6% 15% (n=263)
15 000-19 999 kWh 9% 27% ▲18% 24% 2% 7% 11% ▼0% 1% 6% 15% (n=199)
20 000 - 24 999 kWh ▼1% 18% ▲26% 27% ▼0% 6% 16% 2% 1% 4% 12% (n=112)
More than 25 000 kWh ▼2% 24% ▲35% 22% 10% 2% ▼0% 2% ▼0% 6% 14% (n=51)
Do not know ▼4% 17% 8% 22% 1% ▼3% 8% ▼0% 1% ▼1% 42% (n=211)
Less than 50 € 7% 27% ▼3% 22% 1% 8% 10% 1% 3% 8% 25% (n=308)
50-100 € ▲16% 24% 11% 20% 2% 7% 11% 1% 1% 5% 19% (n=323)
100-150 € 11% 22% 16% 25% 3% 6% 8% ▼0% 1% 5% 18% (n=237)
150-200 € 9% 18% ▲20% 22% 3% 8% 12% 1% ▼0% 5% 18% (n=205)
200-300 € 10% 21% 15% 21% 1% 4% 15% 2% 2% 4% 15% (n=179)
More than 300 € ▼5% 25% 13% 23% 4% 6% 9% ▼0% ▼0% 6% 22% (n=108)
Do not know 13% ▼11% 12% 18% 1% 5% 5% 1% ▼0% ▼0% 39% (n=95)
Country Norway ▼0% ▼0% ▲55% 27% ▲9% ▼0% ▼0% ▼0% ▼0% ▼2% 22% (n=317)
Sweden ▼0% ▼0% ▼0% ▲55% ▼0% ▲23% ▲36% ▼0% ▼0% ▼2% 12% (n=422)
Denmark ▲71% ▼0% ▼0% ▼0% ▼0% ▼0% ▼0% ▼0% ▼0% 6% 24% (n=217)
Finland ▼0% ▲64% ▼0% ▼0% ▼0% ▼0% ▼0% ▲2% ▲3% ▲10% 26% (n=499)
Total 11% 22% 12% 22% 2% 7% 10% 1% 1% 5% 21%(n=1455)
Oth
er
Can
no
t re
mem
ber
Val
id N
Spending on electricity in
total an average winter
month
Q: What comparison tool(s) did you visit online?
Several answers possible.
Background
Elp
ris.
dk
Ener
giav
iras
ton
yllä
pit
ämä
säh
kön
hin
tave
rtai
lusi
vust
o
(sah
kon
hin
ta.f
i)
Strø
mp
ris.
no
(fr
a Fo
rbru
kerr
ådet
)
Elsk
ling
Forb
ruke
rnet
Elp
risk
olle
n
Co
mp
rice
r
Ver
taa.
fi
kilp
ailu
ttaj
a.fi
58

Count %
1 Fully disagree 357 12 % 12 %
2 367 13 % 13 %
3 Neutral 896 31 % 31 %
4 535 18 % 18 %
5 Fully agree 487 17 % 17 %
Do not know 278 10 % 10 %
Total 2920 100 % #N/A
#N/A #N/A #N/A
#N/A #N/A #N/A
#N/A #N/A #N/A
#N/A #N/A #N/A
Gender Female 13% 14% 30% 17% 15% ▲12% (n=1537) #N/A #N/A
Male 11% 11% 31% 20% 19% ▼7% (n=1377) #N/A #N/A
Other 17% 17% 33% 33% ▼0% ▼0% (n=6) #N/A #N/A
Age group Under 35 years ▼8% 12% 30% ▲25% 16% 9% (n=465) #N/A #N/A
35 - 49 years 10% 13% 33% ▲21% 15% 8% (n=939) #N/A #N/A
50 - 64 years 14% 13% 30% 16% 16% 11% (n=861) #N/A #N/A
65 years or older ▲16% 13% 28% ▼13% ▲20% 10% (n=655) #N/A #N/A
Type of resident Apartment 11% 13% 30% 19% 17% 10% (n=1400) #N/A #N/A
House 13% 12% 32% 18% 16% 10% (n=1520) #N/A #N/A
Electricity bill? Electronic bill 13% 12% 31% 18% 16% 9% (n=2198) #N/A #N/A
Paper invoice 11% 13% 29% 19% 18% 10% (n=722) #N/A #N/A
Electricity to heating Use electricity to heat home ▼9% 11% 29% ▲23% ▲20% 9% (n=1435) #N/A #N/A
Not using electicity to heat home ▲16% 14% 33% ▼14% ▼14% 9% (n=1411) #N/A #N/A
Do not know 7% 19% 27% 11% 14% ▲23% (n=74) #N/A #N/A
Consumer type ACTIVE consumers - % - % - % - % - % - % (n<5) #N/A #N/A
AWARE consumers 9% 12% 26% ▲25% ▲25% ▼3% (n=450) #N/A #N/A
INACTIVE comsumers 13% 13% 32% ▼17% ▼15% ▲11% (n=2470) #N/A #N/A
Less than 5000 kWh 15% 15% 32% ▼14% 15% 9% (n=487) #N/A #N/A
5000- 9 999 kWh 13% 14% 33% 19% 16% ▼5% (n=495) #N/A #N/A
10 000- 14 999 kWh 9% 10% 33% ▲24% 18% ▼5% (n=384) #N/A #N/A
15 000-19 999 kWh 11% ▼8% 29% ▲25% ▲23% ▼4% (n=275) #N/A #N/A
20 000 - 24 999 kWh 8% 12% 28% 20% ▲25% 7% (n=181) #N/A #N/A
More than 25 000 kWh 11% 9% 36% 13% 28% ▼3% (n=64) #N/A #N/A
Do not know 13% 14% 29% 16% ▼14% ▲15% (n=1034) #N/A #N/A
Less than 50 € 13% 14% 29% 18% 16% 10% (n=597) #N/A #N/A
50-100 € 11% 15% 33% 19% 15% ▼7% (n=659) #N/A #N/A
100-150 € 13% 11% 31% 23% 16% 7% (n=411) #N/A #N/A
150-200 € 9% 12% 28% 23% 20% 8% (n=365) #N/A #N/A
200-300 € 10% 11% 31% 18% 21% 8% (n=289) #N/A #N/A
More than 300 € 14% 9% 26% 16% ▲28% 7% (n=148) #N/A #N/A
Do not know 15% 10% 32% ▼10% 13% ▲20% (n=451) #N/A #N/A
Country Norway ▼7% 10% 32% 21% ▲21% 10% (n=732) #N/A #N/A
Sweden ▼7% ▼9% 33% 20% 19% 11% (n=713) #N/A #N/A
Denmark ▲20% 15% 34% ▼11% ▼10% 11% (n=938) #N/A #N/A
Finland 12% ▲17% ▼21% ▲26% 20% ▼5% (n=537) #N/A #N/A
Total 12% 13% 31% 18% 17% 10% (n=2920) #N/A #N/A
Spending on
electricity in total an
average winter
month
Annual KWh-use
Val
id N
#N/A
#N/A
Q: It will be easy to find trustworthy information and necessary advice
Q: It will be easy to find trustworthy information and necessary advice
Background variables
1 F
ully
dis
agre
e
2 3 N
eutr
al
4 5 F
ully
agr
ee
Do
no
t kn
ow
0% 10% 20% 30% 40%
59

Count Mean Significant higherSignificant lower scoreNo difference
Gender Female (n=1357) ▼52 52,1
Male (n=1279) ▲56 56,2
Other (n=6) 46 45,8
Age group Under 35 years (n=423) ▲58 58
35 - 49 years (n=863) 55 54,7
50 - 64 years (n=768) 52 52,4
65 years or older (n=588) 52 52,4
Type of resident Apartment (n=1267) 55 54,7
House (n=1375) 53 53,5
Electricity bill? Electronic bill (n=1991) 54 53,5
Paper invoice (n=651) 56 55,7
Electricity to heating Use electricity to heat home (n=1307) ▲59 59,2
Not using electicity to heat home (n=1278) ▼49 48,9
Do not know (n=57) 52 51,8
Consumer type ACTIVE consumers (n<5) -
AWARE consumers (n=437) ▲62 61,5
INACTIVE comsumers (n=2205) ▼53 52,6
Less than 5000 kWh (n=442) ▼50 49,8
5000- 9 999 kWh (n=468) 53 52,6
10 000- 14 999 kWh (n=364) ▲58 58,4
15 000-19 999 kWh (n=263) ▲61 60,9
20 000 - 24 999 kWh (n=169) ▲61 61,4
More than 25 000 kWh (n=62) 60 59,7
Do not know (n=874) ▼51 51,3
Less than 50 € (n=540) 52 52,4
50-100 € (n=615) 53 52,8
100-150 € (n=383) 55 54,6
150-200 € (n=337) ▲59 59,1
200-300 € (n=267) 58 57,7
More than 300 € (n=137) 60 59,7
Do not know (n=363) ▼49 48,7
Country Norway (n=660) ▲60 60,4
Sweden (n=636) ▲60 60,3
Denmark (n=838) ▼43 42,8
Finland (n=508) 57 56,6
Total (n=2642) 54 54,1
Annual KWh-use
Spending on electricity
in total an average
winter month
Q: It will be easy to find trustworthy information and necessary advice
Standardized mean score: 0 =1 Fully disagree and 100 = 5 Fully agree. 'Do not know' is not in the calculation.
0 25 50 75 100
Significant higher
Significant lower score
No difference
60

Count %
1 Fully disagree 207 7 % 7 %
2 246 8 % 8 %
3 Neutral 753 26 % 26 %
4 658 23 % 23 %
5 Fully agree 788 27 % 27 %
Do not know 268 9 % 9 %
Total 2920 100 % #N/A
#N/A #N/A #N/A
#N/A #N/A #N/A
#N/A #N/A #N/A
#N/A #N/A #N/A
Gender Female 8% 9% 25% 21% 25% ▲12% (n=1537) #N/A #N/A
Male 6% 7% 27% 24% 29% ▼7% (n=1377) #N/A #N/A
Other ▼0% ▼0% 17% 50% 17% 17% (n=6) #N/A #N/A
Age group Under 35 years ▼4% 10% 27% ▲28% ▼21% 10% (n=465) #N/A #N/A
35 - 49 years 7% 10% 26% 24% 24% 8% (n=939) #N/A #N/A
50 - 64 years 7% 8% 27% 22% 27% 9% (n=861) #N/A #N/A
65 years or older ▲10% 7% 23% ▼16% ▲35% 10% (n=655) #N/A #N/A
Type of resident Apartment 7% 10% 26% 21% 27% 9% (n=1400) #N/A #N/A
House 7% 7% 26% 24% 27% 9% (n=1520) #N/A #N/A
Electricity bill? Electronic bill 7% 8% 26% 23% 27% 9% (n=2198) #N/A #N/A
Paper invoice 7% 9% 25% 22% 28% 9% (n=722) #N/A #N/A
Electricity to heating Use electricity to heat home 6% 8% 24% 24% ▲31% 8% (n=1435) #N/A #N/A
Not using electicity to heat home ▲9% 9% 28% 21% ▼24% 10% (n=1411) #N/A #N/A
Do not know 4% 11% 23% 22% ▼16% ▲24% (n=74) #N/A #N/A
Consumer type ACTIVE consumers - % - % - % - % - % - % (n<5) #N/A #N/A
AWARE consumers 6% ▼5% ▼18% 26% ▲41% ▼3% (n=450) #N/A #N/A
INACTIVE comsumers 7% ▲9% ▲27% 22% ▼24% ▲10% (n=2470) #N/A #N/A
Less than 5000 kWh 7% 8% 28% 21% 26% 10% (n=487) #N/A #N/A
5000- 9 999 kWh 6% 9% 27% 23% 28% ▼6% (n=495) #N/A #N/A
10 000- 14 999 kWh ▼4% 6% 29% 26% 29% ▼6% (n=384) #N/A #N/A
15 000-19 999 kWh 7% ▼5% 21% ▲30% 33% ▼5% (n=275) #N/A #N/A
20 000 - 24 999 kWh 8% 10% ▼17% 23% ▲38% ▼4% (n=181) #N/A #N/A
More than 25 000 kWh 11% ▼3% 17% 28% 36% 5% (n=64) #N/A #N/A
Do not know 8% 10% 27% ▼19% ▼22% ▲14% (n=1034) #N/A #N/A
Less than 50 € 8% 11% 24% 24% 25% 8% (n=597) #N/A #N/A
50-100 € 6% 9% 26% 23% 27% 8% (n=659) #N/A #N/A
100-150 € 5% 7% 30% 23% 27% 8% (n=411) #N/A #N/A
150-200 € 6% 7% 22% ▲28% 31% ▼6% (n=365) #N/A #N/A
200-300 € 9% 7% 22% 23% ▲34% ▼6% (n=289) #N/A #N/A
More than 300 € 6% 5% 19% 26% ▲36% 7% (n=148) #N/A #N/A
Do not know 9% 8% ▲31% ▼14% ▼20% ▲18% (n=451) #N/A #N/A
Country Norway ▼5% 7% 23% 23% ▲35% 8% (n=732) #N/A #N/A
Sweden 5% 6% 28% 24% 27% 9% (n=713) #N/A #N/A
Denmark ▲9% ▲11% ▲32% ▼19% ▼17% ▲13% (n=938) #N/A #N/A
Finland 9% 9% ▼16% ▲28% ▲34% ▼4% (n=537) #N/A #N/A
Total 7% 8% 26% 23% 27% 9% (n=2920) #N/A #N/A
Spending on
electricity in total an
average winter
month
Annual KWh-use
Val
id N
#N/A
#N/A
Q: It will be easy and straightforward to sign an electricity contract
Q: It will be easy and straightforward to sign an electricity contract
Background variables
1 F
ully
dis
agre
e
2 3 N
eutr
al
4 5 F
ully
agr
ee
Do
no
t kn
ow
0% 10% 20% 30%
61

Count Mean Significant higherSignificant lower scoreNo difference
Gender Female (n=1360) ▼63 62,9
Male (n=1287) ▲67 66,8
Other (n=5) 75 75
Age group Under 35 years (n=418) 64 64,1
35 - 49 years (n=861) 64 63,6
50 - 64 years (n=781) 66 65,6
65 years or older (n=592) 66 66,1
Type of resident Apartment (n=1275) 64 64
House (n=1377) 66 65,6
Electricity bill? Electronic bill (n=1994) 65 64,7
Paper invoice (n=658) 65 65,1
Electricity to heating Use electricity to heat home (n=1324) ▲68 68,1
Not using electicity to heat home (n=1272) ▼62 61,6
Do not know (n=56) 62 61,6
Consumer type ACTIVE consumers (n<5) -
AWARE consumers (n=437) ▲74 73,5
INACTIVE comsumers (n=2215) ▼63 63,1
Less than 5000 kWh (n=439) 64 64,3
5000- 9 999 kWh (n=464) 65 65,1
10 000- 14 999 kWh (n=362) ▲68 68,4
15 000-19 999 kWh (n=261) ▲70 70,3
20 000 - 24 999 kWh (n=173) 69 68,9
More than 25 000 kWh (n=61) 70 69,7
Do not know (n=892) ▼61 60,8
Less than 50 € (n=547) 63 62,8
50-100 € (n=605) 65 65
100-150 € (n=377) 66 65,9
150-200 € (n=343) ▲69 69
200-300 € (n=273) 67 67,5
More than 300 € (n=137) ▲72 71,9
Do not know (n=370) ▼58 58,1
Country Norway (n=674) ▲71 70,8
Sweden (n=646) 67 66,6
Denmark (n=816) ▼57 56,5
Finland (n=516) 68 68
Total (n=2652) 65 64,8
Annual KWh-use
Spending on electricity
in total an average
winter month
Q: It will be easy and straightforward to sign an electricity contract
Standardized mean score: 0 =1 Fully disagree and 100 = 5 Fully agree. 'Do not know' is not in the calculation.
0 25 50 75 100
Significant higher
Significant lower score
No difference
62

Count %
1 Fully disagree 380 13 % 13 %
2 439 15 % 15 %
3 Neutral 771 26 % 26 %
4 560 19 % 19 %
5 Fully agree 490 17 % 17 %
Do not know 280 10 % 10 %
Total 2920 100 % #N/A
#N/A #N/A #N/A
#N/A #N/A #N/A
#N/A #N/A #N/A
#N/A #N/A #N/A
Gender Female 15% 15% 25% 19% 16% ▲11% (n=1537) #N/A #N/A
Male 11% 15% 28% 19% 18% ▼8% (n=1377) #N/A #N/A
Other 17% 17% 17% 33% ▼0% 17% (n=6) #N/A #N/A
Age group Under 35 years ▼5% 14% 26% ▲27% 18% 11% (n=465) #N/A #N/A
35 - 49 years 12% 17% 27% 21% 15% 8% (n=939) #N/A #N/A
50 - 64 years 15% 16% 27% 17% 16% 9% (n=861) #N/A #N/A
65 years or older ▲18% 13% 25% ▼15% 19% 11% (n=655) #N/A #N/A
Type of resident Apartment 13% 16% 26% 18% 17% 10% (n=1400) #N/A #N/A
House 13% 14% 27% 20% 16% 9% (n=1520) #N/A #N/A
Electricity bill? Electronic bill 14% 15% 26% 20% 16% 10% (n=2198) #N/A #N/A
Paper invoice 10% 16% 28% 18% 18% 9% (n=722) #N/A #N/A
Electricity to heating Use electricity to heat home ▼9% ▼13% 26% ▲22% ▲20% 9% (n=1435) #N/A #N/A
Not using electicity to heat home ▲17% 17% 27% ▼16% ▼13% 9% (n=1411) #N/A #N/A
Do not know 7% 20% 24% 16% 12% ▲20% (n=74) #N/A #N/A
Consumer type ACTIVE consumers - % - % - % - % - % - % (n<5) #N/A #N/A
AWARE consumers 10% 14% ▼19% ▲26% ▲28% ▼3% (n=450) #N/A #N/A
INACTIVE comsumers 14% 15% ▲28% ▼18% ▼15% ▲11% (n=2470) #N/A #N/A
Less than 5000 kWh 17% 19% 26% ▼15% 14% 9% (n=487) #N/A #N/A
5000- 9 999 kWh 14% 16% 27% 20% 17% 7% (n=495) #N/A #N/A
10 000- 14 999 kWh 10% 15% 28% 23% 18% ▼6% (n=384) #N/A #N/A
15 000-19 999 kWh 11% 13% 22% ▲26% ▲23% ▼5% (n=275) #N/A #N/A
20 000 - 24 999 kWh 8% 12% 24% 23% ▲25% 7% (n=181) #N/A #N/A
More than 25 000 kWh 14% 14% 20% 19% ▲30% ▼3% (n=64) #N/A #N/A
Do not know 13% 14% 28% 17% ▼14% ▲14% (n=1034) #N/A #N/A
Less than 50 € 14% 19% 24% 17% 16% 10% (n=597) #N/A #N/A
50-100 € 12% 16% 28% 19% 16% 8% (n=659) #N/A #N/A
100-150 € 12% 15% 26% 23% 17% 7% (n=411) #N/A #N/A
150-200 € 11% 12% 24% 24% 21% 9% (n=365) #N/A #N/A
200-300 € 10% 16% 26% 21% 20% 7% (n=289) #N/A #N/A
More than 300 € 13% 15% 22% 21% 24% 6% (n=148) #N/A #N/A
Do not know 16% ▼11% 31% ▼13% ▼11% ▲18% (n=451) #N/A #N/A
Country Norway ▼8% ▼11% 26% ▲23% ▲22% 10% (n=732) #N/A #N/A
Sweden ▼8% ▼12% 29% 22% 19% 11% (n=713) #N/A #N/A
Denmark ▲21% 17% 28% ▼13% ▼10% 11% (n=938) #N/A #N/A
Finland 13% ▲22% 22% 20% 18% ▼5% (n=537) #N/A #N/A
Total 13% 15% 26% 19% 17% 10% (n=2920) #N/A #N/A
Spending on
electricity in total an
average winter
month
Annual KWh-use
Val
id N
#N/A
#N/A
Q: It will be easy to compare different electricity contracts with each other
Q: It will be easy to compare different electricity contracts with each other
Background variables
1 F
ully
dis
agre
e
2 3 N
eutr
al
4 5 F
ully
agr
ee
Do
no
t kn
ow
0% 10% 20% 30%
63

Count Mean Significant higherSignificant lower scoreNo difference
Gender Female (n=1365) 52 51,8
Male (n=1270) 55 54,8
Other (n=5) 45 45
Age group Under 35 years (n=414) ▲61 61,1
35 - 49 years (n=862) 53 52,9
50 - 64 years (n=783) 51 50,9
65 years or older (n=581) 51 51,3
Type of resident Apartment (n=1263) 53 53,3
House (n=1377) 53 53,2
Electricity bill? Electronic bill (n=1984) 53 52,8
Paper invoice (n=656) 55 54,6
Electricity to heating Use electricity to heat home (n=1304) ▲59 58,7
Not using electicity to heat home (n=1277) ▼48 47,7
Do not know (n=59) 52 52,1
Consumer type ACTIVE consumers (n<5) -
AWARE consumers (n=437) ▲62 62,2
INACTIVE comsumers (n=2203) ▼51 51,4
Less than 5000 kWh (n=441) ▼48 47,5
5000- 9 999 kWh (n=460) 52 52,3
10 000- 14 999 kWh (n=360) 57 56,7
15 000-19 999 kWh (n=261) ▲60 60,3
20 000 - 24 999 kWh (n=168) ▲62 61,9
More than 25 000 kWh (n=62) 59 59,3
Do not know (n=888) 51 51
Less than 50 € (n=540) 51 50,7
50-100 € (n=606) 53 52,9
100-150 € (n=382) 55 54,6
150-200 € (n=333) ▲59 58,7
200-300 € (n=270) 57 56,8
More than 300 € (n=139) 57 57,4
Do not know (n=370) ▼47 47,1
Country Norway (n=657) ▲61 60,9
Sweden (n=636) ▲59 59,2
Denmark (n=836) ▼43 43,2
Finland (n=511) 52 52,4
Total (n=2640) 53 53,2
Annual KWh-use
Spending on electricity
in total an average
winter month
Q: It will be easy to compare different electricity contracts with each other
Standardized mean score: 0 =1 Fully disagree and 100 = 5 Fully agree. 'Do not know' is not in the calculation.
0 25 50 75 100
Significant higher
Significant lower score
No difference
64

Count %
1 Fully disagree 492 17 % 17 %
2 533 18 % 18 %
3 Neutral 1002 34 % 34 %
4 422 14 % 14 %
5 Fully agree 237 8 % 8 %
Do not know 234 8 % 8 %
Total 2920 100 % #N/A
#N/A #N/A #N/A
#N/A #N/A #N/A
#N/A #N/A #N/A
#N/A #N/A #N/A
Gender Female 16% 18% 34% 14% 8% ▲10% (n=1537) #N/A #N/A
Male 18% 18% 35% 15% 8% ▼6% (n=1377) #N/A #N/A
Other 17% ▼0% 50% 17% 17% ▼0% (n=6) #N/A #N/A
Age group Under 35 years ▼8% 17% 36% 18% ▲13% 9% (n=465) #N/A #N/A
35 - 49 years 16% 20% 33% 16% 7% 6% (n=939) #N/A #N/A
50 - 64 years ▲20% 17% 32% 14% 8% 9% (n=861) #N/A #N/A
65 years or older 20% 17% 38% ▼10% 7% 9% (n=655) #N/A #N/A
Type of resident Apartment 15% 17% 34% 16% 9% 9% (n=1400) #N/A #N/A
House 18% 20% 34% 13% 7% 7% (n=1520) #N/A #N/A
Electricity bill? Electronic bill ▲18% 19% 34% 14% ▼7% 8% (n=2198) #N/A #N/A
Paper invoice ▼13% 16% 34% 17% ▲11% 8% (n=722) #N/A #N/A
Electricity to heating Use electricity to heat home ▼15% 17% 35% 16% 9% 7% (n=1435) #N/A #N/A
Not using electicity to heat home ▲19% 19% 33% 13% 7% 8% (n=1411) #N/A #N/A
Do not know 14% 12% 34% 12% 7% ▲22% (n=74) #N/A #N/A
Consumer type ACTIVE consumers - % - % - % - % - % - % (n<5) #N/A #N/A
AWARE consumers 18% 19% 32% 17% 10% ▼3% (n=450) #N/A #N/A
INACTIVE comsumers 17% 18% 35% 14% 8% ▲9% (n=2470) #N/A #N/A
Less than 5000 kWh 21% 19% 34% 14% ▼4% 8% (n=487) #N/A #N/A
5000- 9 999 kWh 18% 20% 34% 15% 7% 6% (n=495) #N/A #N/A
10 000- 14 999 kWh 14% 20% 38% 16% 8% ▼5% (n=384) #N/A #N/A
15 000-19 999 kWh 15% 16% 35% 18% 12% ▼5% (n=275) #N/A #N/A
20 000 - 24 999 kWh 16% 23% 28% 17% 10% 6% (n=181) #N/A #N/A
More than 25 000 kWh 19% 20% 42% ▼3% 13% 3% (n=64) #N/A #N/A
Do not know 16% 16% 34% 13% 9% ▲12% (n=1034) #N/A #N/A
Less than 50 € 17% 18% 33% 15% 10% 8% (n=597) #N/A #N/A
50-100 € 17% 19% 36% 16% ▼6% 6% (n=659) #N/A #N/A
100-150 € 17% 19% 35% 16% 7% 6% (n=411) #N/A #N/A
150-200 € 16% 19% 33% 17% 8% 8% (n=365) #N/A #N/A
200-300 € 16% 20% 33% 12% 12% 7% (n=289) #N/A #N/A
More than 300 € 14% 20% 35% 16% 11% 5% (n=148) #N/A #N/A
Do not know 19% 15% 35% ▼10% 8% ▲14% (n=451) #N/A #N/A
Country Norway 17% 19% 37% 13% 6% 7% (n=732) #N/A #N/A
Sweden 14% 15% 38% 13% 9% 10% (n=713) #N/A #N/A
Denmark ▲22% 19% 32% 12% ▼5% 9% (n=938) #N/A #N/A
Finland ▼11% 19% ▼29% ▲23% ▲14% ▼4% (n=537) #N/A #N/A
Total 17% 18% 34% 14% 8% 8% (n=2920) #N/A #N/A
Spending on
electricity in total an
average winter
month
Annual KWh-use
Val
id N
#N/A
#N/A
Q: I will trust the information and advice from sellers
Q: I will trust the information and advice from sellers
Background variables
1 F
ully
dis
agre
e
2 3 N
eutr
al
4 5 F
ully
agr
ee
Do
no
t kn
ow
0% 10% 20% 30% 40%
65

Count Mean Significant higherSignificant lower scoreNo difference
Gender Female (n=1388) 45 44,7
Male (n=1292) 44 43,7
Other (n=6) 54 54,2
Age group Under 35 years (n=425) ▲53 52,8
35 - 49 years (n=879) 44 44,3
50 - 64 years (n=784) 42 42
65 years or older (n=598) ▼41 41
Type of resident Apartment (n=1278) ▲46 46,4
House (n=1408) ▼42 42,2
Electricity bill? Electronic bill (n=2024) ▼43 42,7
Paper invoice (n=662) ▲49 48,9
Electricity to heating Use electricity to heat home (n=1330) ▲46 46,5
Not using electicity to heat home (n=1298) ▼42 41,9
Do not know (n=58) 46 45,7
Consumer type ACTIVE consumers (n<5) -
AWARE consumers (n=435) 45 45,4
INACTIVE comsumers (n=2251) 44 44
Less than 5000 kWh (n=447) ▼40 39,6
5000- 9 999 kWh (n=465) 43 43
10 000- 14 999 kWh (n=366) 46 45,7
15 000-19 999 kWh (n=262) ▲49 48,8
20 000 - 24 999 kWh (n=171) 45 45,5
More than 25 000 kWh (n=62) 42 42,3
Do not know (n=913) 45 45,1
Less than 50 € (n=547) 45 45,4
50-100 € (n=618) 43 43,1
100-150 € (n=386) 43 43,4
150-200 € (n=337) 45 45,1
200-300 € (n=270) 46 46,2
More than 300 € (n=141) 47 47,2
Do not know (n=387) 42 41,9
Country Norway (n=678) 42 42,4
Sweden (n=640) 46 46,4
Denmark (n=855) ▼39 39,1
Finland (n=513) ▲52 52,4
Total (n=2686) 44 44,2
Annual KWh-use
Spending on electricity
in total an average
winter month
Q: I will trust the information and advice from sellers
Standardized mean score: 0 =1 Fully disagree and 100 = 5 Fully agree. 'Do not know' is not in the calculation.
0 25 50 75 100
Significant higher
Significant lower score
No difference
66

Count %
1 Fully disagree 104 4 % 4 %
2 155 5 % 5 %
3 Neutral 905 31 % 31 %
4 763 26 % 26 %
5 Fully agree 650 22 % 22 %
Do not know 343 12 % 12 %
Total 2920 100 % #N/A
#N/A #N/A #N/A
#N/A #N/A #N/A
#N/A #N/A #N/A
#N/A #N/A #N/A
Gender Female 4% 5% 30% 26% 21% ▲14% (n=1537) #N/A #N/A
Male 3% 6% 32% 26% 24% ▼9% (n=1377) #N/A #N/A
Other 17% ▼0% ▼0% ▲67% ▼0% 17% (n=6) #N/A #N/A
Age group Under 35 years 3% 6% 32% 27% 21% 12% (n=465) #N/A #N/A
35 - 49 years 3% 6% 31% 29% 21% 10% (n=939) #N/A #N/A
50 - 64 years 4% ▼3% 30% 27% 23% 13% (n=861) #N/A #N/A
65 years or older 5% 6% 32% ▼20% 24% 14% (n=655) #N/A #N/A
Type of resident Apartment 4% 6% 31% 27% 22% 11% (n=1400) #N/A #N/A
House 3% 5% 31% 26% 23% 12% (n=1520) #N/A #N/A
Electricity bill? Electronic bill 3% 5% 31% 26% 23% 12% (n=2198) #N/A #N/A
Paper invoice 5% 7% 30% 27% 21% 10% (n=722) #N/A #N/A
Electricity to heating Use electricity to heat home 3% 5% 29% 28% ▲25% 11% (n=1435) #N/A #N/A
Not using electicity to heat home 4% 6% 33% 25% ▼20% 12% (n=1411) #N/A #N/A
Do not know 4% 4% 35% 26% ▼11% 20% (n=74) #N/A #N/A
Consumer type ACTIVE consumers - % - % - % - % - % - % (n<5) #N/A #N/A
AWARE consumers 4% 5% ▼23% ▲32% ▲31% ▼5% (n=450) #N/A #N/A
INACTIVE comsumers 3% 5% ▲32% ▼25% ▼21% ▲13% (n=2470) #N/A #N/A
Less than 5000 kWh 6% 6% 31% 26% 20% 10% (n=487) #N/A #N/A
5000- 9 999 kWh 4% 6% 32% 26% 24% ▼8% (n=495) #N/A #N/A
10 000- 14 999 kWh 3% 6% 32% 26% 26% 8% (n=384) #N/A #N/A
15 000-19 999 kWh 4% 5% 26% 29% 27% 9% (n=275) #N/A #N/A
20 000 - 24 999 kWh 2% 7% 24% 27% ▲34% ▼7% (n=181) #N/A #N/A
More than 25 000 kWh 3% 3% 28% 27% 30% 9% (n=64) #N/A #N/A
Do not know 3% 5% 33% 25% ▼17% ▲17% (n=1034) #N/A #N/A
Less than 50 € 5% 7% 30% 28% 20% 11% (n=597) #N/A #N/A
50-100 € 3% 5% 31% 29% 21% 10% (n=659) #N/A #N/A
100-150 € 3% 5% 34% 29% 20% 9% (n=411) #N/A #N/A
150-200 € 3% 5% 27% 24% ▲28% 12% (n=365) #N/A #N/A
200-300 € 4% 6% 27% 24% ▲29% 10% (n=289) #N/A #N/A
More than 300 € 3% 4% 28% 27% 28% 9% (n=148) #N/A #N/A
Do not know 4% 5% 35% ▼19% ▼17% ▲20% (n=451) #N/A #N/A
Country Norway 2% ▼3% 27% 29% ▲27% 11% (n=732) #N/A #N/A
Sweden 4% 5% 33% 24% 22% 12% (n=713) #N/A #N/A
Denmark 4% 6% ▲35% ▼22% ▼17% ▲15% (n=938) #N/A #N/A
Finland 4% 8% ▼26% ▲31% 25% ▼5% (n=537) #N/A #N/A
Total 4% 5% 31% 26% 22% 12% (n=2920) #N/A #N/A
Spending on
electricity in total an
average winter
month
Annual KWh-use
Val
id N
#N/A
#N/A
Q: There will be many different electricity suppliers to choose from that meet my needs
Q: There will be many different electricity suppliers to choose from that meet my needs
Background variables
1 F
ully
dis
agre
e
2 3 N
eutr
al
4 5 F
ully
agr
ee
Do
no
t kn
ow
0% 10% 20% 30% 40%
67
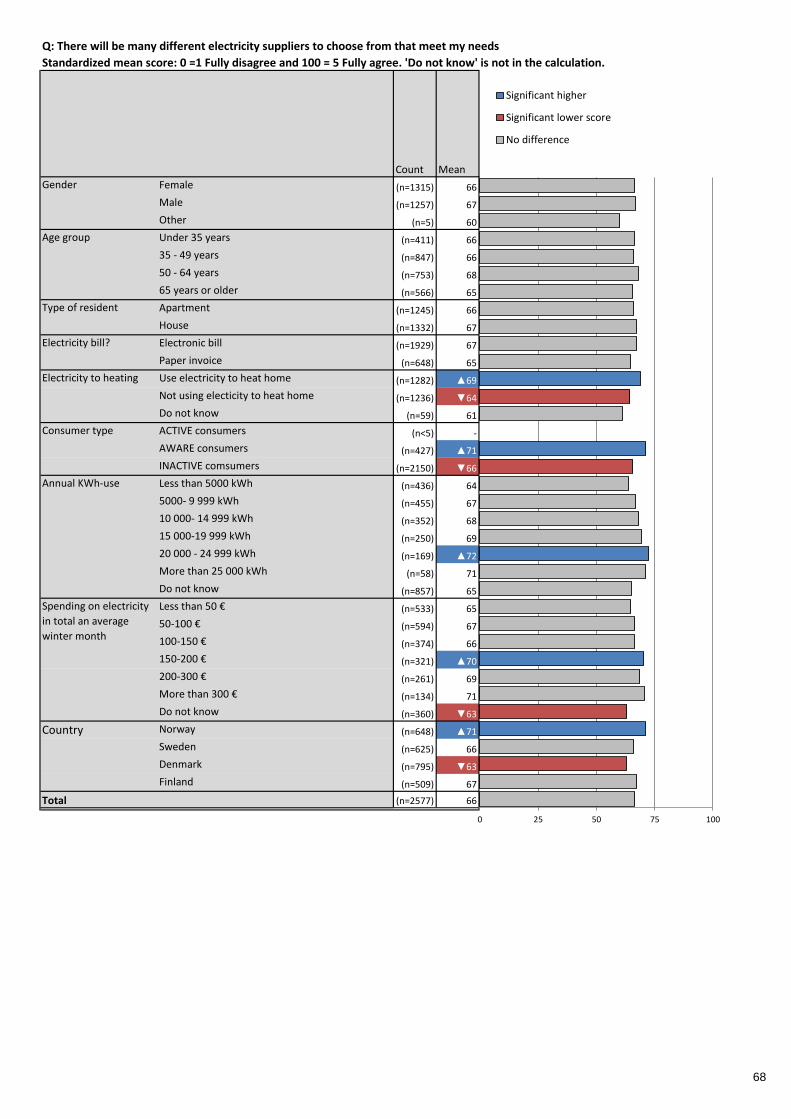
Count Mean Significant higherSignificant lower scoreNo difference
Gender Female (n=1315) 66 66,4
Male (n=1257) 67 66,7
Other (n=5) 60 60
Age group Under 35 years (n=411) 66 66,3
35 - 49 years (n=847) 66 66
50 - 64 years (n=753) 68 67,9
65 years or older (n=566) 65 65,5
Type of resident Apartment (n=1245) 66 65,9
House (n=1332) 67 67,1
Electricity bill? Electronic bill (n=1929) 67 67,1
Paper invoice (n=648) 65 64,7
Electricity to heating Use electricity to heat home (n=1282) ▲69 68,8
Not using electicity to heat home (n=1236) ▼64 64,4
Do not know (n=59) 61 61
Consumer type ACTIVE consumers (n<5) -
AWARE consumers (n=427) ▲71 71
INACTIVE comsumers (n=2150) ▼66 65,6
Less than 5000 kWh (n=436) 64 63,7
5000- 9 999 kWh (n=455) 67 66,7
10 000- 14 999 kWh (n=352) 68 68,2
15 000-19 999 kWh (n=250) 69 69,2
20 000 - 24 999 kWh (n=169) ▲72 72,3
More than 25 000 kWh (n=58) 71 71,1
Do not know (n=857) 65 64,9
Less than 50 € (n=533) 65 64,7
50-100 € (n=594) 67 66,5
100-150 € (n=374) 66 66,2
150-200 € (n=321) ▲70 70,2
200-300 € (n=261) 69 68,7
More than 300 € (n=134) 71 70,5
Do not know (n=360) ▼63 63
Country Norway (n=648) ▲71 71
Sweden (n=625) 66 65,8
Denmark (n=795) ▼63 62,8
Finland (n=509) 67 67,3
Total (n=2577) 66 66,5
Annual KWh-use
Spending on electricity
in total an average
winter month
Q: There will be many different electricity suppliers to choose from that meet my needs
Standardized mean score: 0 =1 Fully disagree and 100 = 5 Fully agree. 'Do not know' is not in the calculation.
0 25 50 75 100
Significant higher
Significant lower score
No difference
68

Count %
1 Fully disagree 101 3 % 3 %
2 161 6 % 6 %
3 Neutral 885 30 % 30 %
4 811 28 % 28 %
5 Fully agree 591 20 % 20 %
Do not know 371 13 % 13 %
Total 2920 100 % #N/A
#N/A #N/A #N/A
#N/A #N/A #N/A
#N/A #N/A #N/A
#N/A #N/A #N/A
Gender Female 3% 5% 29% 28% 19% ▲16% (n=1537) #N/A #N/A
Male 4% 6% 32% 27% 22% ▼9% (n=1377) #N/A #N/A
Other 33% ▼0% ▼0% 33% 17% 17% (n=6) #N/A #N/A
Age group Under 35 years 3% 7% 28% 32% 18% 13% (n=465) #N/A #N/A
35 - 49 years 3% 6% 31% 31% 18% ▼10% (n=939) #N/A #N/A
50 - 64 years 3% 4% 31% 27% 21% 13% (n=861) #N/A #N/A
65 years or older 5% 5% 30% ▼22% 23% 15% (n=655) #N/A #N/A
Type of resident Apartment 4% 6% 30% 28% 20% 12% (n=1400) #N/A #N/A
House 3% 5% 31% 27% 20% 13% (n=1520) #N/A #N/A
Electricity bill? Electronic bill 3% 5% 30% 28% 20% 13% (n=2198) #N/A #N/A
Paper invoice 4% 7% 30% 28% 20% 11% (n=722) #N/A #N/A
Electricity to heating Use electricity to heat home 3% 5% 28% 30% ▲23% 11% (n=1435) #N/A #N/A
Not using electicity to heat home ▲5% 6% 33% 26% ▼18% 14% (n=1411) #N/A #N/A
Do not know ▼0% 8% 32% 26% ▼11% 23% (n=74) #N/A #N/A
Consumer type ACTIVE consumers - % - % - % - % - % - % (n<5) #N/A #N/A
AWARE consumers 3% 4% ▼24% ▲35% ▲28% ▼5% (n=450) #N/A #N/A
INACTIVE comsumers 4% 6% ▲31% ▼26% ▼19% ▲14% (n=2470) #N/A #N/A
Less than 5000 kWh 6% 5% 31% 27% 19% 13% (n=487) #N/A #N/A
5000- 9 999 kWh 3% 6% 31% 28% 23% ▼9% (n=495) #N/A #N/A
10 000- 14 999 kWh 3% 5% 33% 28% 23% ▼8% (n=384) #N/A #N/A
15 000-19 999 kWh 3% 5% 27% 30% 26% 10% (n=275) #N/A #N/A
20 000 - 24 999 kWh 2% 8% ▼22% 33% 27% ▼8% (n=181) #N/A #N/A
More than 25 000 kWh 3% 6% 28% 28% 28% 6% (n=64) #N/A #N/A
Do not know 3% 5% 32% 27% ▼15% ▲18% (n=1034) #N/A #N/A
Less than 50 € 4% 7% 29% 29% 19% 12% (n=597) #N/A #N/A
50-100 € 4% 5% 31% 30% 19% 11% (n=659) #N/A #N/A
100-150 € 3% 5% 32% 31% 19% 10% (n=411) #N/A #N/A
150-200 € 3% 5% 32% 27% 23% 11% (n=365) #N/A #N/A
200-300 € 4% 5% 28% 27% ▲27% 10% (n=289) #N/A #N/A
More than 300 € 1% 8% 24% 30% 24% 11% (n=148) #N/A #N/A
Do not know 4% 4% 32% ▼20% 16% ▲23% (n=451) #N/A #N/A
Country Norway 2% ▼3% 27% 29% ▲26% 12% (n=732) #N/A #N/A
Sweden 3% 6% 31% 27% 19% 13% (n=713) #N/A #N/A
Denmark 5% 6% ▲34% ▼23% ▼15% ▲17% (n=938) #N/A #N/A
Finland 3% 7% 26% ▲34% 23% ▼6% (n=537) #N/A #N/A
Total 3% 6% 30% 28% 20% 13% (n=2920) #N/A #N/A
Spending on
electricity in total an
average winter
month
Annual KWh-use
Val
id N
#N/A
#N/A
Q: There will be many different contracts to choose from that meet my needs
Q: There will be many different contracts to choose from that meet my needs
Background variables
1 F
ully
dis
agre
e
2 3 N
eutr
al
4 5 F
ully
agr
ee
Do
no
t kn
ow
0% 10% 20% 30% 40%
69

Count Mean Significant higherSignificant lower scoreNo difference
Gender Female (n=1291) 66 66,1
Male (n=1253) 66 65,9
Other (n=5) 50 50
Age group Under 35 years (n=405) 66 66,1
35 - 49 years (n=842) 65 65,5
50 - 64 years (n=746) 67 66,8
65 years or older (n=556) 66 65,7
Type of resident Apartment (n=1234) 66 65,7
House (n=1315) 66 66,3
Electricity bill? Electronic bill (n=1906) 66 66,4
Paper invoice (n=643) 65 64,7
Electricity to heating Use electricity to heat home (n=1275) ▲68 68,5
Not using electicity to heat home (n=1217) ▼64 63,6
Do not know (n=57) 63 62,7
Consumer type ACTIVE consumers (n<5) -
AWARE consumers (n=429) ▲71 71,4
INACTIVE comsumers (n=2120) ▼65 64,9
Less than 5000 kWh (n=424) 64 63,8
5000- 9 999 kWh (n=451) 67 66,7
10 000- 14 999 kWh (n=354) 67 66,8
15 000-19 999 kWh (n=248) 70 69,8
20 000 - 24 999 kWh (n=167) 70 70,2
More than 25 000 kWh (n=60) 69 69,2
Do not know (n=845) 64 64,2
Less than 50 € (n=527) 65 64,8
50-100 € (n=586) 66 65,6
100-150 € (n=371) 66 66,3
150-200 € (n=326) 67 67,5
200-300 € (n=260) 69 68,9
More than 300 € (n=131) 69 69,3
Do not know (n=348) 63 63,4
Country Norway (n=644) ▲71 70,8
Sweden (n=622) 65 65,3
Denmark (n=778) ▼61 61,5
Finland (n=505) 68 67,7
Total (n=2549) 66 66
Annual KWh-use
Spending on electricity
in total an average
winter month
Q: There will be many different contracts to choose from that meet my needs
Standardized mean score: 0 =1 Fully disagree and 100 = 5 Fully agree. 'Do not know' is not in the calculation.
0 25 50 75 100
Significant higher
Significant lower score
No difference
70

Count %
1 Fully disagree 419 14 % 14 %
2 545 19 % 19 %
3 Neutral 819 28 % 28 %
4 516 18 % 18 %
5 Fully agree 334 11 % 11 %
Do not know 287 10 % 10 %
Total 2920 100 % #N/A
#N/A #N/A #N/A
#N/A #N/A #N/A
#N/A #N/A #N/A
#N/A #N/A #N/A
Gender Female 15% 19% 26% ▼15% 11% ▲12% (n=1537) #N/A #N/A
Male 13% 18% 30% ▲20% 12% ▼7% (n=1377) #N/A #N/A
Other 17% ▼0% 33% 50% ▼0% ▼0% (n=6) #N/A #N/A
Age group Under 35 years ▼6% 17% 29% ▲23% 14% 11% (n=465) #N/A #N/A
35 - 49 years 12% 21% 28% ▲21% 10% 8% (n=939) #N/A #N/A
50 - 64 years 16% 18% 30% 15% 12% 9% (n=861) #N/A #N/A
65 years or older ▲20% 18% 26% ▼13% 11% 12% (n=655) #N/A #N/A
Type of resident Apartment 13% 19% 28% 18% 12% 10% (n=1400) #N/A #N/A
House 15% 18% 28% 18% 11% 10% (n=1520) #N/A #N/A
Electricity bill? Electronic bill 15% 19% 28% 17% 11% 10% (n=2198) #N/A #N/A
Paper invoice 12% 17% 28% 20% 13% 10% (n=722) #N/A #N/A
Electricity to heating Use electricity to heat home ▼11% 17% 28% ▲20% ▲13% 10% (n=1435) #N/A #N/A
Not using electicity to heat home ▲17% 20% 28% ▼15% ▼9% 9% (n=1411) #N/A #N/A
Do not know 12% 16% 26% 12% 11% ▲23% (n=74) #N/A #N/A
Consumer type ACTIVE consumers - % - % - % - % - % - % (n<5) #N/A #N/A
AWARE consumers ▼11% 20% 26% ▲23% ▲17% ▼4% (n=450) #N/A #N/A
INACTIVE comsumers ▲15% 19% 29% ▼17% ▼10% ▲11% (n=2470) #N/A #N/A
Less than 5000 kWh 17% 20% 29% 16% 9% 9% (n=487) #N/A #N/A
5000- 9 999 kWh 15% 22% 29% 16% 13% ▼5% (n=495) #N/A #N/A
10 000- 14 999 kWh ▼10% 17% 29% ▲24% 13% 7% (n=384) #N/A #N/A
15 000-19 999 kWh 13% 16% 25% ▲26% 14% 7% (n=275) #N/A #N/A
20 000 - 24 999 kWh 12% 14% 26% 24% 17% 7% (n=181) #N/A #N/A
More than 25 000 kWh 19% 19% 25% 14% 17% 6% (n=64) #N/A #N/A
Do not know 15% 19% 28% ▼14% 10% ▲15% (n=1034) #N/A #N/A
Less than 50 € 14% ▲23% 26% 16% 12% 9% (n=597) #N/A #N/A
50-100 € 14% 20% 32% 18% 10% ▼7% (n=659) #N/A #N/A
100-150 € 14% 19% 24% ▲24% 10% 9% (n=411) #N/A #N/A
150-200 € 12% 18% 25% 20% 15% 10% (n=365) #N/A #N/A
200-300 € 15% 16% 28% 19% 14% 8% (n=289) #N/A #N/A
More than 300 € 15% 19% ▼20% 19% ▲19% 9% (n=148) #N/A #N/A
Do not know 17% ▼12% ▲34% ▼11% ▼8% ▲18% (n=451) #N/A #N/A
Country Norway ▼10% 16% 30% 21% 12% 11% (n=732) #N/A #N/A
Sweden ▼11% 16% 30% 19% 13% 12% (n=713) #N/A #N/A
Denmark ▲21% 21% 29% ▼11% ▼7% 11% (n=938) #N/A #N/A
Finland 13% 22% ▼23% ▲24% ▲16% ▼3% (n=537) #N/A #N/A
Total 14% 19% 28% 18% 11% 10% (n=2920) #N/A #N/A
Spending on
electricity in total an
average winter
month
Annual KWh-use
Val
id N
#N/A
#N/A
Q: It will be easy to understand what is included in the price / agreement
Q: It will be easy to understand what is included in the price / agreement
Background variables
1 F
ully
dis
agre
e
2 3 N
eutr
al
4 5 F
ully
agr
ee
Do
no
t kn
ow
0% 10% 20% 30%
71
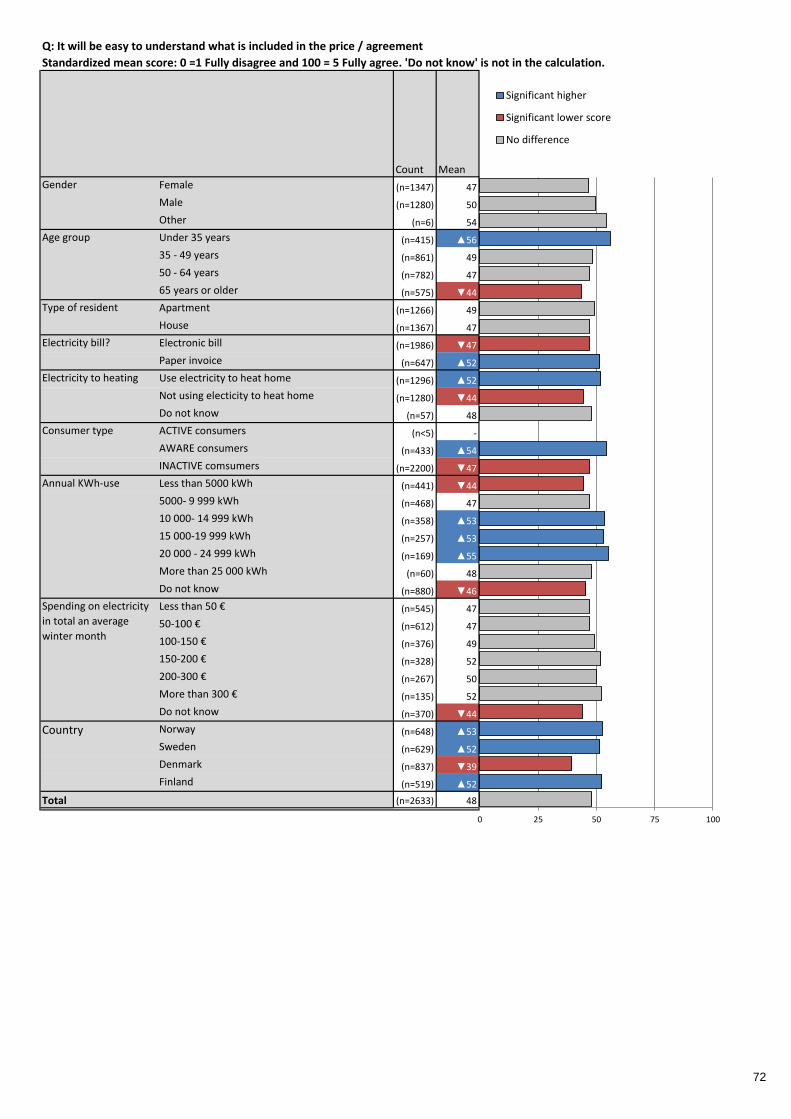
Count Mean Significant higherSignificant lower scoreNo difference
Gender Female (n=1347) 47 46,7
Male (n=1280) 50 49,6
Other (n=6) 54 54,2
Age group Under 35 years (n=415) ▲56 55,8
35 - 49 years (n=861) 49 48,6
50 - 64 years (n=782) 47 46,9
65 years or older (n=575) ▼44 43,5
Type of resident Apartment (n=1266) 49 49,2
House (n=1367) 47 47,1
Electricity bill? Electronic bill (n=1986) ▼47 47
Paper invoice (n=647) ▲52 51,6
Electricity to heating Use electricity to heat home (n=1296) ▲52 51,9
Not using electicity to heat home (n=1280) ▼44 44,3
Do not know (n=57) 48 47,8
Consumer type ACTIVE consumers (n<5) -
AWARE consumers (n=433) ▲54 54,3
INACTIVE comsumers (n=2200) ▼47 46,9
Less than 5000 kWh (n=441) ▼44 44,4
5000- 9 999 kWh (n=468) 47 47,1
10 000- 14 999 kWh (n=358) ▲53 53,4
15 000-19 999 kWh (n=257) ▲53 53,2
20 000 - 24 999 kWh (n=169) ▲55 55
More than 25 000 kWh (n=60) 48 47,9
Do not know (n=880) ▼46 45,5
Less than 50 € (n=545) 47 47
50-100 € (n=612) 47 47,1
100-150 € (n=376) 49 49,2
150-200 € (n=328) 52 52
200-300 € (n=267) 50 50,2
More than 300 € (n=135) 52 52,2
Do not know (n=370) ▼44 43,9
Country Norway (n=648) ▲53 52,6
Sweden (n=629) ▲52 51,5
Denmark (n=837) ▼39 39,5
Finland (n=519) ▲52 52,4
Total (n=2633) 48 48,1
Annual KWh-use
Spending on electricity
in total an average
winter month
Q: It will be easy to understand what is included in the price / agreement
Standardized mean score: 0 =1 Fully disagree and 100 = 5 Fully agree. 'Do not know' is not in the calculation.
0 25 50 75 100
Significant higher
Significant lower score
No difference
72

Count %
1 Fully disagree 202 7 % 7 %
2 289 10 % 10 %
3 Neutral 1023 35 % 35 %
4 611 21 % 21 %
5 Fully agree 527 18 % 18 %
Do not know 268 9 % 9 %
Total 2920 100 % #N/A
#N/A #N/A #N/A
#N/A #N/A #N/A
#N/A #N/A #N/A
#N/A #N/A #N/A
Gender Female 8% 11% 33% 20% 17% ▲11% (n=1537) #N/A #N/A
Male 6% 9% 37% 22% 20% ▼7% (n=1377) #N/A #N/A
Other ▼0% 17% 33% 33% 17% ▼0% (n=6) #N/A #N/A
Age group Under 35 years ▼3% 12% 35% 25% 16% 10% (n=465) #N/A #N/A
35 - 49 years 8% 11% 35% 24% 15% 7% (n=939) #N/A #N/A
50 - 64 years 7% 8% 34% 21% 19% 11% (n=861) #N/A #N/A
65 years or older 8% 10% 36% ▼15% ▲22% 9% (n=655) #N/A #N/A
Type of resident Apartment 7% 10% 37% 21% 16% 9% (n=1400) #N/A #N/A
House 7% 10% 33% 21% 20% 9% (n=1520) #N/A #N/A
Electricity bill? Electronic bill 7% 10% 35% 21% 19% 9% (n=2198) #N/A #N/A
Paper invoice 6% 10% 36% 22% 16% 9% (n=722) #N/A #N/A
Electricity to heating Use electricity to heat home 6% 11% 34% 22% 18% 9% (n=1435) #N/A #N/A
Not using electicity to heat home 8% 9% 36% 20% 18% 9% (n=1411) #N/A #N/A
Do not know 3% 14% 36% 16% 14% 18% (n=74) #N/A #N/A
Consumer type ACTIVE consumers - % - % - % - % - % - % (n<5) #N/A #N/A
AWARE consumers ▼4% 9% ▼30% ▲26% ▲27% ▼4% (n=450) #N/A #N/A
INACTIVE comsumers ▲7% 10% ▲36% ▼20% ▼16% ▲10% (n=2470) #N/A #N/A
Less than 5000 kWh 7% 8% 35% 21% 19% 9% (n=487) #N/A #N/A
5000- 9 999 kWh 6% 10% 35% 23% 21% ▼6% (n=495) #N/A #N/A
10 000- 14 999 kWh 5% 8% 37% 24% 20% 6% (n=384) #N/A #N/A
15 000-19 999 kWh 5% 11% 31% ▲28% 21% ▼5% (n=275) #N/A #N/A
20 000 - 24 999 kWh 4% 11% 31% 25% 23% 6% (n=181) #N/A #N/A
More than 25 000 kWh 9% 6% 38% 13% 30% 5% (n=64) #N/A #N/A
Do not know ▲9% 11% 36% ▼17% ▼13% ▲14% (n=1034) #N/A #N/A
Less than 50 € 8% 10% 36% 20% 17% 9% (n=597) #N/A #N/A
50-100 € 6% 9% 36% 24% 19% ▼6% (n=659) #N/A #N/A
100-150 € 6% 10% 37% 23% 15% 9% (n=411) #N/A #N/A
150-200 € 6% 10% 34% 23% 19% 8% (n=365) #N/A #N/A
200-300 € 7% 9% 33% 23% 21% 7% (n=289) #N/A #N/A
More than 300 € 6% 9% 30% 18% ▲27% 9% (n=148) #N/A #N/A
Do not know 10% 11% 34% ▼14% 15% ▲16% (n=451) #N/A #N/A
Country Norway 5% 10% 35% 23% 15% 11% (n=732) #N/A #N/A
Sweden 5% 9% 38% 22% 17% 9% (n=713) #N/A #N/A
Denmark 9% 9% 33% ▼17% ▲22% 10% (n=938) #N/A #N/A
Finland 8% 12% 35% 22% 17% ▼5% (n=537) #N/A #N/A
Total 7% 10% 35% 21% 18% 9% (n=2920) #N/A #N/A
Spending on
electricity in total an
average winter
month
Annual KWh-use
Val
id N
#N/A
#N/A
Q: I will be well-informed
Q: I will be well-informed
Background variables
1 F
ully
dis
agre
e
2 3 N
eutr
al
4 5 F
ully
agr
ee
Do
no
t kn
ow
0% 10% 20% 30% 40%
73
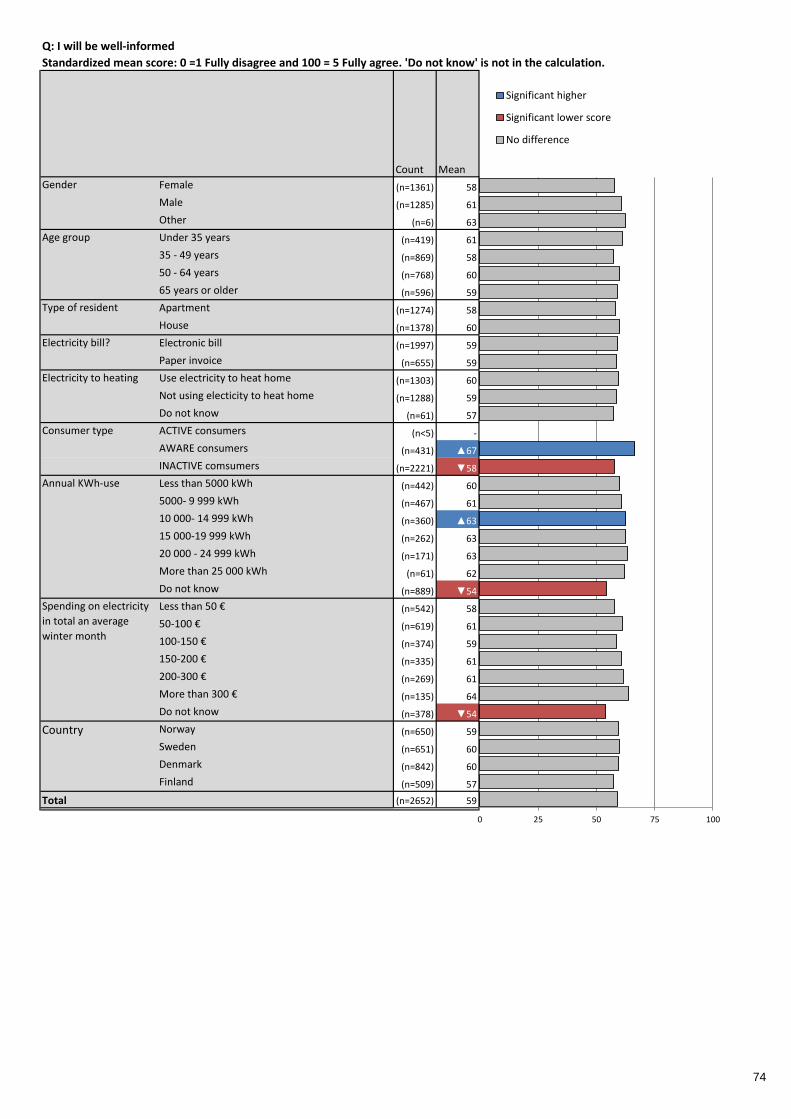
Count Mean Significant higherSignificant lower scoreNo difference
Gender Female (n=1361) 58 57,7
Male (n=1285) 61 60,7
Other (n=6) 63 62,5
Age group Under 35 years (n=419) 61 61,1
35 - 49 years (n=869) 58 57,6
50 - 64 years (n=768) 60 60,1
65 years or older (n=596) 59 58,9
Type of resident Apartment (n=1274) 58 58,1
House (n=1378) 60 60,1
Electricity bill? Electronic bill (n=1997) 59 59,3
Paper invoice (n=655) 59 58,8
Electricity to heating Use electricity to heat home (n=1303) 60 59,7
Not using electicity to heat home (n=1288) 59 58,7
Do not know (n=61) 57 57,4
Consumer type ACTIVE consumers (n<5) -
AWARE consumers (n=431) ▲67 66,6
INACTIVE comsumers (n=2221) ▼58 57,7
Less than 5000 kWh (n=442) 60 60,1
5000- 9 999 kWh (n=467) 61 60,9
10 000- 14 999 kWh (n=360) ▲63 62,6
15 000-19 999 kWh (n=262) 63 62,7
20 000 - 24 999 kWh (n=171) 63 63,3
More than 25 000 kWh (n=61) 62 62,3
Do not know (n=889) ▼54 54,3
Less than 50 € (n=542) 58 57,8
50-100 € (n=619) 61 61,1
100-150 € (n=374) 59 58,6
150-200 € (n=335) 61 60,6
200-300 € (n=269) 61 61,4
More than 300 € (n=135) 64 63,9
Do not know (n=378) ▼54 54
Country Norway (n=650) 59 59,3
Sweden (n=651) 60 59,9
Denmark (n=842) 60 59,7
Finland (n=509) 57 57,3
Total (n=2652) 59 59,2
Annual KWh-use
Spending on electricity
in total an average
winter month
Q: I will be well-informed
Standardized mean score: 0 =1 Fully disagree and 100 = 5 Fully agree. 'Do not know' is not in the calculation.
0 25 50 75 100
Significant higher
Significant lower score
No difference
74

Count %
Yes 1118 38 % 38 %
No 1802 62 % 62 %
Total 2920 100 % #N/A
#N/A #N/A #N/A
#N/A #N/A #N/A
#N/A #N/A #N/A
#N/A #N/A #N/A
#N/A #N/A #N/A
#N/A #N/A #N/A
#N/A #N/A #N/A
#N/A #N/A #N/A
Gender Female ▼35% ▲65% (n=1537) #N/A #N/A #N/A #N/A #N/A #N/A
Male ▲42% ▼58% (n=1377) #N/A #N/A #N/A #N/A #N/A #N/A
Other 50% 50% (n=6) #N/A #N/A #N/A #N/A #N/A #N/A
Age group Under 35 years 40% 60% (n=465) #N/A #N/A #N/A #N/A #N/A #N/A
35 - 49 years 40% 60% (n=939) #N/A #N/A #N/A #N/A #N/A #N/A
50 - 64 years 38% 62% (n=861) #N/A #N/A #N/A #N/A #N/A #N/A
65 years or older ▼34% ▲66% (n=655) #N/A #N/A #N/A #N/A #N/A #N/A
Type of resident Apartment 37% 63% (n=1400) #N/A #N/A #N/A #N/A #N/A #N/A
House 40% 60% (n=1520) #N/A #N/A #N/A #N/A #N/A #N/A
Electricity bill? Electronic bill 40% 60% (n=2198) #N/A #N/A #N/A #N/A #N/A #N/A
Paper invoice 34% 66% (n=722) #N/A #N/A #N/A #N/A #N/A #N/A
Electricity to heating Use electricity to heat home ▲44% ▼56% (n=1435) #N/A #N/A #N/A #N/A #N/A #N/A
Not using electicity to heat home ▼33% ▲67% (n=1411) #N/A #N/A #N/A #N/A #N/A #N/A
Do not know ▼20% ▲80% (n=74) #N/A #N/A #N/A #N/A #N/A #N/A
Consumer type ACTIVE consumers - % - % (n<5) #N/A #N/A #N/A #N/A #N/A #N/A
AWARE consumers ▲66% ▼34% (n=450) #N/A #N/A #N/A #N/A #N/A #N/A
INACTIVE comsumers ▼33% ▲67% (n=2470) #N/A #N/A #N/A #N/A #N/A #N/A
Less than 5000 kWh 40% 60% (n=487) #N/A #N/A #N/A #N/A #N/A #N/A
5000- 9 999 kWh 42% 58% (n=495) #N/A #N/A #N/A #N/A #N/A #N/A
10 000- 14 999 kWh 43% 57% (n=384) #N/A #N/A #N/A #N/A #N/A #N/A
15 000-19 999 kWh ▲52% ▼48% (n=275) #N/A #N/A #N/A #N/A #N/A #N/A
20 000 - 24 999 kWh ▲55% ▼45% (n=181) #N/A #N/A #N/A #N/A #N/A #N/A
More than 25 000 kWh ▲55% ▼45% (n=64) #N/A #N/A #N/A #N/A #N/A #N/A
Do not know ▼27% ▲73% (n=1034) #N/A #N/A #N/A #N/A #N/A #N/A
Less than 50 € ▼32% ▲68% (n=597) #N/A #N/A #N/A #N/A #N/A #N/A
50-100 € 40% 60% (n=659) #N/A #N/A #N/A #N/A #N/A #N/A
100-150 € 42% 58% (n=411) #N/A #N/A #N/A #N/A #N/A #N/A
150-200 € ▲47% ▼53% (n=365) #N/A #N/A #N/A #N/A #N/A #N/A
200-300 € ▲48% ▼52% (n=289) #N/A #N/A #N/A #N/A #N/A #N/A
More than 300 € 45% 55% (n=148) #N/A #N/A #N/A #N/A #N/A #N/A
Do not know ▼25% ▲75% (n=451) #N/A #N/A #N/A #N/A #N/A #N/A
Country Norway ▲43% ▼57% (n=732) #N/A #N/A #N/A #N/A #N/A #N/A
Sweden ▲43% ▼57% (n=713) #N/A #N/A #N/A #N/A #N/A #N/A
Denmark ▼33% ▲67% (n=938) #N/A #N/A #N/A #N/A #N/A #N/A
Finland 34% 66% (n=537) #N/A #N/A #N/A #N/A #N/A #N/A
Total 38% 62% (n=2920) #N/A #N/A #N/A #N/A #N/A #N/A
Spending on
electricity in total an
average winter
month
Annual KWh-use
#N/A
#N/A
#N/A
Q: Do you know of any online comparison tools for electricity contracts?
Q: Do you know of any online comparison tools for electricity contracts?
Background variables
Yes
No
Val
id N
#N/A
#N/A
#N/A
0% 20% 40% 60% 80%
75

Count %
Elpris.dk 220 20 % 20 % 20 %
Energiaviraston ylläpitämä sähkön hintavertailusivusto (sahkonhinta.fi) 161 14 % 14 % 14 %
Strømpris.no (fra Forbrukerrådet) 201 18 % 18 % 18 %
Elskling 348 31 % 31 % 31 %
Forbrukernet 52 5 % 5 % 5 %
Elpriskollen 96 9 % 9 % 9 %
Compricer 142 13 % 13 % 13 %
Other 119 11 % 11 % 11 %
Don't remember 24 2 % 2 % 2 %
Have not visited any 27 2 % 2 % 2 %
Total 1118
#N/A #N/A #N/A
#N/A #N/A #N/A
#N/A #N/A #N/A
#N/A #N/A #N/A
#N/A #N/A #N/A
#N/A #N/A #N/A
#N/A #N/A #N/A
#N/A #N/A #N/A
Q: What comparison tool(s) have you visited online?
Several answers possible.
0% 10% 20% 30% 40%
76

Gender Female 20% 13% 15% 30% 4% 8% 13% 12% ▲4% 2% (n=532)
Male 20% 16% 20% 32% 5% 9% 12% 9% ▼1% 2% (n=583)
Other - % - % - % - % - % - % - % - % - % - % (n<5)
Age group Under 35 years 26% 16% ▼10% 35% 3% 9% 13% 7% ▼0% 2% (n=187)
35 - 49 years 17% 14% 20% ▲38% 5% 7% 12% 9% 3% 2% (n=379)
50 - 64 years 19% 16% 18% ▼25% 5% 7% 12% 14% 3% 3% (n=330)
65 years or older 20% 11% 22% 25% 5% 12% 15% 11% 2% 3% (n=222)
Type of resident Apartment ▼16% ▲22% ▼12% 29% 4% 9% 14% 11% 3% 2% (n=516)
House ▲23% ▼8% ▲23% 33% 5% 8% 11% 11% 2% 3% (n=602)
Electricity bill? Electronic bill ▲23% ▼11% ▲21% 29% 5% 8% 12% 11% 2% 3% (n=870)
Paper invoice ▼8% ▲27% ▼8% 37% 3% 12% 17% 9% 1% 2% (n=248)
Electricity to heating Use electricity to heat home ▼12% ▼11% ▲30% ▲38% ▲8% 8% 12% ▼5% 1% 2% (n=631)
Not using electicity to heat home ▲29% ▲19% ▼2% ▼22% ▼1% 9% 13% ▲18% 3% 3% (n=472)
Do not know 33% 7% 7% 27% ▼0% 7% 20% 20% ▼0% ▼0% (n=15)
Consumer type ACTIVE consumers - % - % - % - % - % - % - % - % - % - % (n<5)
AWARE consumers 16% ▲26% ▲23% 33% 7% 9% 16% 8% 1% ▼0% (n=295)
INACTIVE comsumers 21% ▼10% ▼16% 30% 4% 9% 12% 11% 2% ▲3% (n=823)
Annual KWh-use Less than 5000 kWh ▲32% 17% ▼4% ▼18% ▼1% 7% 13% ▲18% 4% 4% (n=193)
5000- 9 999 kWh ▲28% 17% 13% 26% ▼2% 11% 14% 10% ▼0% ▼0% (n=209)
10 000- 14 999 kWh 22% 16% 20% 35% 8% 9% 12% ▼5% 1% 1% (n=164)
15 000-19 999 kWh 13% 16% ▲29% 35% 7% 13% 12% ▼5% 2% 1% (n=143)
20 000 - 24 999 kWh ▼2% ▼6% ▲40% ▲55% 9% 10% 13% 5% 1% 1% (n=99)
More than 25 000 kWh 9% 11% ▲46% 26% 11% 6% 11% ▼3% ▼0% ▼0% (n=35)
Do not know 15% 13% 13% 32% 4% 6% 13% ▲16% 4% ▲5% (n=275)
Less than 50 € 23% ▲24% ▼3% ▼22% ▼1% 9% 17% 15% 3% 3% (n=194)
50-100 € 26% 16% ▼10% ▼24% 2% 9% 13% 15% 2% 3% (n=262)
100-150 € 25% ▼9% 25% 36% 9% 5% 8% 7% 2% 1% (n=174)
150-200 € ▼13% 14% ▲32% 38% 7% 6% 10% 7% 1% ▼0% (n=173)
200-300 € ▼12% 14% ▲28% 38% 9% 14% 12% ▼1% ▼0% 2% (n=138)
More than 300 € ▼5% 11% ▲35% 42% 3% 15% 15% ▼3% 3% 2% (n=66)
Do not know 23% ▼5% ▼10% 32% 3% 6% 14% ▲19% 5% 7% (n=111)
Country Norway ▼0% ▼0% ▲63% ▲47% ▲16% ▼0% ▼0% ▼2% 1% 3% (n=317)
Sweden ▼0% ▼0% ▼0% ▲65% ▼0% ▲31% ▲46% ▼4% 1% 2% (n=310)
Denmark ▲72% ▼0% ▼0% ▼0% ▼0% ▼0% ▼0% ▲24% 4% 4% (n=306)
Finland ▼0% ▲87% ▼0% ▼0% ▼0% ▼0% ▼0% 16% 4% ▼0% (n=185)
Total 20% 14% 18% 31% 5% 9% 13% 11% 2% 2% (n=1118)
Hav
e n
ot
visi
ted
an
y
Val
id N
Spending on electricity in
total an average winter
month
Q: What comparison tool(s) have you visited online?
Several answers possible.
Background
Elp
ris.
dk
Ener
giav
iras
ton
yllä
pit
ämä
säh
kön
hin
tave
rtai
lusi
vust
o
(sah
kon
hin
ta.f
i)
Strø
mp
ris.
no
(fr
a Fo
rbru
kerr
ådet
)
Elsk
ling
Forb
ruke
rnet
Elp
risk
olle
n
Co
mp
rice
r
Oth
er
Do
n't
rem
emb
er
77

Count %
1 Fully disagree 266 4 % 4 %
2 325 5 % 5 %
3 Neutral 1220 20 % 20 %
4 1321 22 % 22 %
5 Fully agree 2369 39 % 39 %
Do not know 518 9 % 9 %
Total 6019 100 % #N/A
#N/A #N/A #N/A
#N/A #N/A #N/A
#N/A #N/A #N/A
#N/A #N/A #N/A
Gender Female 5% ▲7% 20% 21% ▼36% ▲11% (n=2981) #N/A #N/A
Male 4% ▼4% 20% 23% ▲43% ▼6% (n=3027) #N/A #N/A
Other 9% ▼0% 27% 36% 27% ▼0% (n=11) #N/A #N/A
Age group Under 35 years 4% ▲8% ▲26% ▲26% ▼27% 9% (n=1041) #N/A #N/A
35 - 49 years 5% 6% 20% 23% ▼37% 9% (n=1832) #N/A #N/A
50 - 64 years 4% 4% 19% 21% ▲43% 8% (n=1758) #N/A #N/A
65 years or older 5% ▼3% ▼18% ▼18% ▲48% 9% (n=1388) #N/A #N/A
Type of resident Apartment ▲5% 6% 20% 22% ▼38% 9% (n=3013) #N/A #N/A
House ▼4% 5% 20% 22% ▲41% 8% (n=3006) #N/A #N/A
Electricity bill? Electronic bill 4% ▼5% ▼19% 22% ▲42% 8% (n=4615) #N/A #N/A
Paper invoice 5% ▲8% ▲24% 22% ▼32% 9% (n=1404) #N/A #N/A
Electricity to heating Use electricity to heat home 4% 6% 19% 22% ▲43% ▼7% (n=3127) #N/A #N/A
Not using electicity to heat home 5% 5% 21% 22% ▼36% ▲10% (n=2765) #N/A #N/A
Do not know 2% 9% 25% 24% ▼18% ▲20% (n=127) #N/A #N/A
Consumer type ACTIVE consumers 3% ▼3% ▼14% 20% ▲57% ▼4% (n=1540) #N/A #N/A
AWARE consumers 4% 5% ▼17% 24% ▲48% ▼3% (n=966) #N/A #N/A
INACTIVE comsumers ▲5% ▲7% ▲24% 22% ▼29% ▲12% (n=3513) #N/A #N/A
Less than 5000 kWh 5% ▼4% 20% 23% 41% 7% (n=1146) #N/A #N/A
5000- 9 999 kWh 5% 6% 19% 24% 40% ▼6% (n=1011) #N/A #N/A
10 000- 14 999 kWh 3% 7% 20% 21% ▲44% ▼5% (n=875) #N/A #N/A
15 000-19 999 kWh 4% 5% 20% 23% ▲44% ▼4% (n=619) #N/A #N/A
20 000 - 24 999 kWh 3% 5% ▼15% 22% ▲51% ▼5% (n=399) #N/A #N/A
More than 25 000 kWh 4% ▼1% 15% 20% ▲57% ▼2% (n=165) #N/A #N/A
Do not know 5% 6% ▲23% 20% ▼30% ▲16% (n=1804) #N/A #N/A
Less than 50 € 5% 6% 20% 25% 36% 9% (n=1281) #N/A #N/A
50-100 € 5% 5% 20% 23% 39% 8% (n=1363) #N/A #N/A
100-150 € 4% 5% 18% 22% 43% 7% (n=907) #N/A #N/A
150-200 € ▼3% 6% 21% 22% 43% ▼6% (n=772) #N/A #N/A
200-300 € 6% 5% 19% 23% 42% ▼5% (n=615) #N/A #N/A
More than 300 € 5% 4% 16% 20% ▲48% 6% (n=346) #N/A #N/A
Do not know 4% 4% ▲25% ▼17% ▼32% ▲18% (n=735) #N/A #N/A
Country Norway ▼2% ▼2% ▼14% 21% ▲53% ▼6% (n=1506) #N/A #N/A
Sweden 5% 7% ▲29% 22% ▼28% 10% (n=1501) #N/A #N/A
Denmark ▲6% 6% ▲23% ▼19% ▼32% ▲13% (n=1508) #N/A #N/A
Finland 4% 7% ▼15% ▲26% ▲44% ▼4% (n=1504) #N/A #N/A
Total 4% 5% 20% 22% 39% 9% (n=6019) #N/A #N/A
Spending on
electricity in total an
average winter
month
Annual KWh-use
Val
id N
#N/A
#N/A
Q: It is easy to switch supplier
Q: It is easy to switch supplier
Background variables
1 F
ully
dis
agre
e
2 3 N
eutr
al
4 5 F
ully
agr
ee
Do
no
t kn
ow
0% 10% 20% 30% 40% 50%
78

Count Mean Significant higherSignificant lower scoreNo difference
Gender Female (n=2642) ▼71 71,4
Male (n=2848) ▲76 75,8
Other (n=11) 68 68,2
Age group Under 35 years (n=951) ▼67 67,1
35 - 49 years (n=1669) 72 72,2
50 - 64 years (n=1617) ▲76 75,8
65 years or older (n=1264) ▲78 77,7
Type of resident Apartment (n=2745) ▼72 72,1
House (n=2756) ▲75 75,2
Electricity bill? Electronic bill (n=4223) ▲75 75,2
Paper invoice (n=1278) ▼68 68,5
Electricity to heating Use electricity to heat home (n=2921) ▲75 75,1
Not using electicity to heat home (n=2479) ▼72 72,3
Do not know (n=101) ▼65 64,6
Consumer type ACTIVE consumers (n=1484) ▲82 82,1
AWARE consumers (n=938) ▲78 77,6
INACTIVE comsumers (n=3079) ▼68 68,3
Less than 5000 kWh (n=1064) 75 74,9
5000- 9 999 kWh (n=948) 73 73,1
10 000- 14 999 kWh (n=830) 76 75,6
15 000-19 999 kWh (n=594) 76 76
20 000 - 24 999 kWh (n=381) ▲80 79,7
More than 25 000 kWh (n=161) ▲82 81,8
Do not know (n=1523) ▼69 68,8
Less than 50 € (n=1166) 72 72,5
50-100 € (n=1252) 73 73,2
100-150 € (n=842) 75 75,3
150-200 € (n=729) 75 75,5
200-300 € (n=584) 74 73,8
More than 300 € (n=324) 77 76,7
Do not know (n=604) ▼71 70,7
Country Norway (n=1409) ▲82 82,2
Sweden (n=1346) ▼67 67,1
Denmark (n=1306) ▼69 68,5
Finland (n=1440) ▲76 76
Total (n=5501) 74 73,6
Annual KWh-use
Spending on electricity
in total an average
winter month
Q: It is easy to switch supplier
Standardized mean score: 0 =1 Fully disagree and 100 = 5 Fully agree. 'Do not know' is not in the calculation.
0 25 50 75 100
Significant higher
Significant lower score
No difference
79

Count %
1 Fully disagree 799 19 % 19 %
2 794 19 % 19 %
3 Neutral 1211 29 % 29 %
4 716 17 % 17 %
5 Fully agree 546 13 % 13 %
Do not know 75 2 % 2 %
Total 4141 100 % #N/A
#N/A #N/A #N/A
#N/A #N/A #N/A
#N/A #N/A #N/A
#N/A #N/A #N/A
Gender Female ▲23% 20% 28% 16% ▼11% 2% (n=1952) #N/A #N/A
Male ▼16% 18% 30% 19% ▲16% 1% (n=2179) #N/A #N/A
Other 10% 50% 30% ▼0% ▼0% 10% (n=10) #N/A #N/A
Age group Under 35 years 17% 19% 29% 19% 12% ▲3% (n=700) #N/A #N/A
35 - 49 years ▼17% 20% 28% ▲20% 14% 2% (n=1237) #N/A #N/A
50 - 64 years 22% 20% 29% 15% 13% 1% (n=1225) #N/A #N/A
65 years or older 22% 17% 31% 15% 14% 1% (n=979) #N/A #N/A
Type of resident Apartment 21% 20% 29% ▼16% 13% 2% (n=2031) #N/A #N/A
House 18% 18% 29% ▲19% 14% 2% (n=2110) #N/A #N/A
Electricity bill? Electronic bill 19% ▼18% 30% 17% 14% 2% (n=3207) #N/A #N/A
Paper invoice 19% ▲22% 27% 17% 11% 3% (n=934) #N/A #N/A
Electricity to heating Use electricity to heat home ▼17% 18% 30% ▲19% ▲15% 2% (n=2288) #N/A #N/A
Not using electicity to heat home ▲23% 21% 28% 16% ▼11% 2% (n=1779) #N/A #N/A
Do not know 26% 16% 36% ▼8% 7% 7% (n=74) #N/A #N/A
Consumer type ACTIVE consumers 19% ▼17% ▼26% ▲20% ▲17% 1% (n=1540) #N/A #N/A
AWARE consumers ▼9% ▼16% 31% ▲25% ▲18% ▼1% (n=966) #N/A #N/A
INACTIVE comsumers ▲25% ▲23% 31% ▼10% ▼7% ▲3% (n=1635) #N/A #N/A
Less than 5000 kWh 19% 19% 28% 19% 14% 1% (n=827) #N/A #N/A
5000- 9 999 kWh ▼15% 19% 32% 18% 15% 1% (n=714) #N/A #N/A
10 000- 14 999 kWh ▼12% 19% 29% ▲22% ▲17% ▼1% (n=669) #N/A #N/A
15 000-19 999 kWh 17% 18% 25% 20% ▲21% ▼1% (n=480) #N/A #N/A
20 000 - 24 999 kWh ▼14% ▼13% 33% 21% 17% 1% (n=313) #N/A #N/A
More than 25 000 kWh 15% 15% 35% 19% 15% ▼0% (n=142) #N/A #N/A
Do not know ▲31% ▲23% 28% ▼9% ▼4% ▲4% (n=996) #N/A #N/A
Less than 50 € ▲24% 22% 27% 15% 11% 2% (n=839) #N/A #N/A
50-100 € 18% 20% 29% 18% 13% 1% (n=946) #N/A #N/A
100-150 € ▼14% 19% 30% 20% 15% 1% (n=642) #N/A #N/A
150-200 € ▼14% 18% 30% 21% 16% 1% (n=569) #N/A #N/A
200-300 € 19% 16% 27% 19% 17% 1% (n=468) #N/A #N/A
More than 300 € 16% 16% 33% 19% 16% ▼0% (n=269) #N/A #N/A
Do not know ▲29% 18% 33% ▼9% ▼5% ▲6% (n=408) #N/A #N/A
Country Norway 19% 18% ▲35% 16% 11% 2% (n=1061) #N/A #N/A
Sweden 22% 17% 29% 16% 15% 2% (n=1076) #N/A #N/A
Denmark ▲23% 19% 32% ▼13% ▼10% 3% (n=865) #N/A #N/A
Finland ▼14% ▲23% ▼22% ▲24% ▲16% 1% (n=1139) #N/A #N/A
Total 19% 19% 29% 17% 13% 2% (n=4141) #N/A #N/A
Spending on
electricity in total an
average winter
month
Annual KWh-use
Val
id N
#N/A
#N/A
Q: I regularly compare electricity contracts
Q: I regularly compare electricity contracts
Background variables
1 F
ully
dis
agre
e
2 3 N
eutr
al
4 5 F
ully
agr
ee
Do
no
t kn
ow
0% 10% 20% 30% 40%
80

Count Mean Significant higherSignificant lower scoreNo difference
Gender Female (n=1909) ▼42 42,5
Male (n=2148) ▲50 50
Other (n=9) ▼31 30,6
Age group Under 35 years (n=676) 48 47,6
35 - 49 years (n=1215) 48 48,3
50 - 64 years (n=1207) 44 44,4
65 years or older (n=968) 46 45,7
Type of resident Apartment (n=1991) ▼45 44,8
House (n=2075) ▲48 47,9
Electricity bill? Electronic bill (n=3157) 47 46,9
Paper invoice (n=909) 45 44,7
Electricity to heating Use electricity to heat home (n=2252) ▲50 49,7
Not using electicity to heat home (n=1745) ▼43 42,5
Do not know (n=69) ▼38 37,7
Consumer type ACTIVE consumers (n=1518) ▲50 49,6
AWARE consumers (n=958) ▲57 56,6
INACTIVE comsumers (n=1590) ▼37 37,2
Less than 5000 kWh (n=817) 47 46,9
5000- 9 999 kWh (n=705) ▲50 49,8
10 000- 14 999 kWh (n=664) ▲53 53,5
15 000-19 999 kWh (n=477) ▲52 52,4
20 000 - 24 999 kWh (n=309) ▲53 53,2
More than 25 000 kWh (n=142) 51 50,5
Do not know (n=952) ▼33 32,8
Less than 50 € (n=824) ▼42 41,7
50-100 € (n=932) 47 46,7
100-150 € (n=634) ▲51 50,5
150-200 € (n=562) ▲51 51,3
200-300 € (n=463) 49 49,4
More than 300 € (n=268) ▲51 51,2
Do not know (n=383) ▼35 34,9
Country Norway (n=1043) 46 45,9
Sweden (n=1057) 46 46,2
Denmark (n=840) ▼41 41,5
Finland (n=1126) ▲51 50,8
Total (n=4066) 46 46,4
Annual KWh-use
Spending on electricity
in total an average
winter month
Q: I regularly compare electricity contracts
Standardized mean score: 0 =1 Fully disagree and 100 = 5 Fully agree. 'Do not know' is not in the calculation.
0 25 50 75 100
Significant higher
Significant lower score
No difference
81

Count %
1 Fully disagree 317 5 % 5 %
2 457 8 % 8 %
3 Neutral 1648 27 % 27 %
4 1421 24 % 24 %
5 Fully agree 1549 26 % 26 %
Do not know 627 10 % 10 %
Total 6019 100 % #N/A
#N/A #N/A #N/A
#N/A #N/A #N/A
#N/A #N/A #N/A
#N/A #N/A #N/A
Gender Female 5% ▼7% ▼25% 24% 26% ▲14% (n=2981) #N/A #N/A
Male 5% ▲9% ▲30% 24% 26% ▼7% (n=3027) #N/A #N/A
Other 9% 9% ▼9% 45% 18% 9% (n=11) #N/A #N/A
Age group Under 35 years ▼3% 6% ▼23% ▲31% 25% 11% (n=1041) #N/A #N/A
35 - 49 years ▼4% 7% 27% 25% 28% 9% (n=1832) #N/A #N/A
50 - 64 years ▲7% 8% 27% 21% 26% 10% (n=1758) #N/A #N/A
65 years or older 6% 8% ▲32% ▼19% ▼23% 12% (n=1388) #N/A #N/A
Type of resident Apartment 6% 7% 26% 24% 26% 11% (n=3013) #N/A #N/A
House 5% 8% 28% 23% 25% 10% (n=3006) #N/A #N/A
Electricity bill? Electronic bill 5% 8% 28% 23% 25% 11% (n=4615) #N/A #N/A
Paper invoice 5% 8% 25% 26% 27% 9% (n=1404) #N/A #N/A
Electricity to heating Use electricity to heat home ▼3% ▼6% ▼26% ▲26% ▲30% ▼9% (n=3127) #N/A #N/A
Not using electicity to heat home ▲7% 9% ▲29% ▼21% ▼21% ▲12% (n=2765) #N/A #N/A
Do not know 4% 13% 24% 18% 22% ▲19% (n=127) #N/A #N/A
Consumer type ACTIVE consumers ▼3% ▼3% ▼19% 26% ▲42% ▼6% (n=1540) #N/A #N/A
AWARE consumers 5% 10% 28% 25% 28% ▼4% (n=966) #N/A #N/A
INACTIVE comsumers ▲6% ▲9% ▲31% ▼22% ▼18% ▲14% (n=3513) #N/A #N/A
Less than 5000 kWh ▲8% 9% 28% ▼20% 25% 10% (n=1146) #N/A #N/A
5000- 9 999 kWh 6% ▲10% 28% 23% 25% 9% (n=1011) #N/A #N/A
10 000- 14 999 kWh 4% 7% 26% ▲27% ▲30% ▼6% (n=875) #N/A #N/A
15 000-19 999 kWh 5% 6% 24% 26% ▲32% ▼6% (n=619) #N/A #N/A
20 000 - 24 999 kWh ▼3% 6% 27% 24% ▲34% ▼6% (n=399) #N/A #N/A
More than 25 000 kWh 4% ▼4% 29% 23% 33% 8% (n=165) #N/A #N/A
Do not know 5% 7% 28% 24% ▼20% ▲17% (n=1804) #N/A #N/A
Less than 50 € ▲7% 9% ▼24% 25% 25% 11% (n=1281) #N/A #N/A
50-100 € 5% 7% ▲30% 23% 24% 10% (n=1363) #N/A #N/A
100-150 € 4% 7% 31% 25% 26% ▼8% (n=907) #N/A #N/A
150-200 € 4% 8% 26% 25% 28% 9% (n=772) #N/A #N/A
200-300 € 5% 7% ▼21% 26% ▲32% 9% (n=615) #N/A #N/A
More than 300 € 4% ▼4% 22% 26% ▲35% 8% (n=346) #N/A #N/A
Do not know 6% 8% ▲32% ▼17% ▼18% ▲19% (n=735) #N/A #N/A
Country Norway ▼3% 7% ▲31% 24% 25% 10% (n=1506) #N/A #N/A
Sweden 5% ▼6% ▼24% 25% ▲30% 9% (n=1501) #N/A #N/A
Denmark ▲8% ▲10% ▲36% ▼15% ▼12% ▲18% (n=1508) #N/A #N/A
Finland 5% 8% ▼18% ▲30% ▲35% ▼4% (n=1504) #N/A #N/A
Total 5% 8% 27% 24% 26% 10% (n=6019) #N/A #N/A
Spending on
electricity in total an
average winter
month
Annual KWh-use
Val
id N
#N/A
#N/A
Q: I can save money by switching electricity contract
Q: I can save money by switching electricity contract
Background variables
1 F
ully
dis
agre
e
2 3 N
eutr
al
4 5 F
ully
agr
ee
Do
no
t kn
ow
0% 10% 20% 30%
82

Count Mean Significant higherSignificant lower scoreNo difference
Gender Female (n=2569) 67 66,9
Male (n=2813) 65 65
Other (n=10) 65 65
Age group Under 35 years (n=926) ▲69 69,4
35 - 49 years (n=1658) ▲68 68,1
50 - 64 years (n=1587) 64 64,2
65 years or older (n=1221) ▼62 62,4
Type of resident Apartment (n=2689) 66 66,3
House (n=2703) 65 65,5
Electricity bill? Electronic bill (n=4121) 66 65,6
Paper invoice (n=1271) 67 66,9
Electricity to heating Use electricity to heat home (n=2861) ▲70 69,6
Not using electicity to heat home (n=2428) ▼62 61,6
Do not know (n=103) 63 62,6
Consumer type ACTIVE consumers (n=1449) ▲77 76,9
AWARE consumers (n=929) 66 65,9
INACTIVE comsumers (n=3014) ▼61 60,6
Less than 5000 kWh (n=1036) ▼63 62,6
5000- 9 999 kWh (n=925) 64 64,1
10 000- 14 999 kWh (n=823) ▲69 69,1
15 000-19 999 kWh (n=580) ▲70 69,9
20 000 - 24 999 kWh (n=374) ▲71 71,3
More than 25 000 kWh (n=152) ▲71 71,1
Do not know (n=1502) ▼64 64,1
Less than 50 € (n=1146) 64 64,2
50-100 € (n=1232) 65 64,9
100-150 € (n=837) 67 67
150-200 € (n=706) 68 67,6
200-300 € (n=560) ▲70 70
More than 300 € (n=318) ▲73 72,7
Do not know (n=593) ▼60 60,2
Country Norway (n=1354) 67 67,2
Sweden (n=1362) ▲70 69,6
Denmark (n=1233) ▼54 54,1
Finland (n=1443) ▲71 71,3
Total (n=5392) 66 65,9
Annual KWh-use
Spending on electricity
in total an average
winter month
Q: I can save money by switching electricity contract
Standardized mean score: 0 =1 Fully disagree and 100 = 5 Fully agree. 'Do not know' is not in the calculation.
0 25 50 75 100
Significant higher
Significant lower score
No difference
83
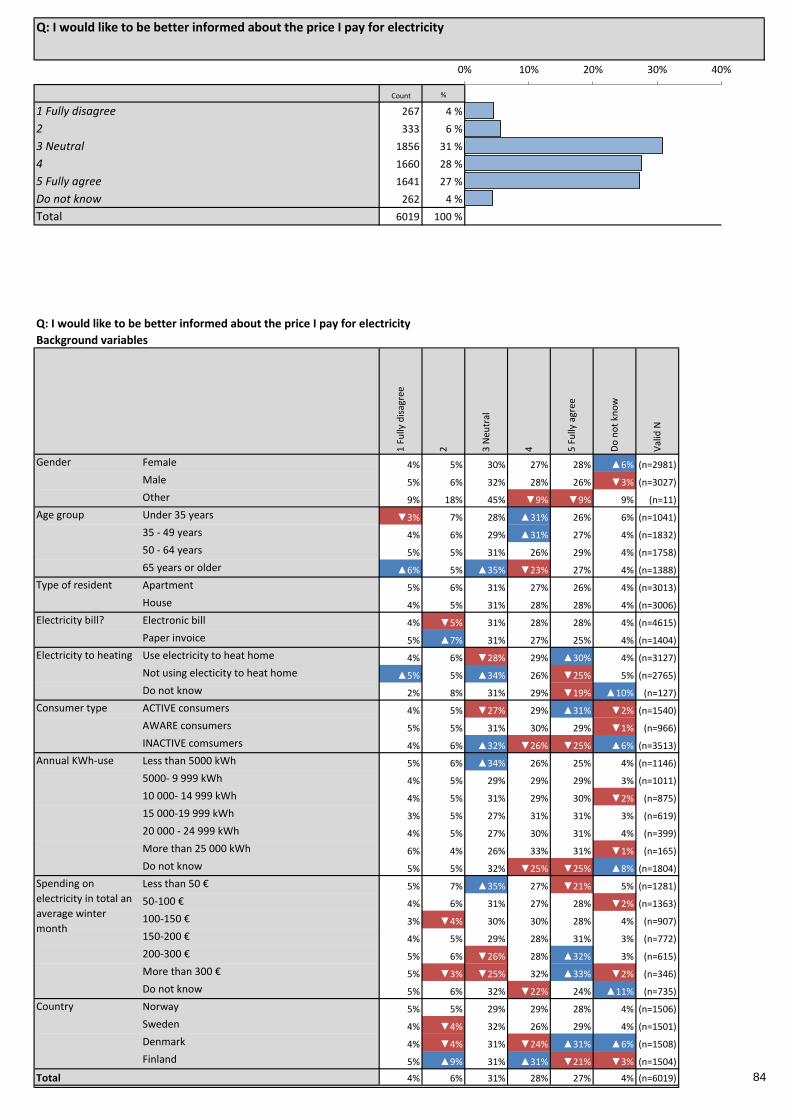
Count %
1 Fully disagree 267 4 % 4 %
2 333 6 % 6 %
3 Neutral 1856 31 % 31 %
4 1660 28 % 28 %
5 Fully agree 1641 27 % 27 %
Do not know 262 4 % 4 %
Total 6019 100 % #N/A
#N/A #N/A #N/A
#N/A #N/A #N/A
#N/A #N/A #N/A
#N/A #N/A #N/A
Gender Female 4% 5% 30% 27% 28% ▲6% (n=2981) #N/A #N/A
Male 5% 6% 32% 28% 26% ▼3% (n=3027) #N/A #N/A
Other 9% 18% 45% ▼9% ▼9% 9% (n=11) #N/A #N/A
Age group Under 35 years ▼3% 7% 28% ▲31% 26% 6% (n=1041) #N/A #N/A
35 - 49 years 4% 6% 29% ▲31% 27% 4% (n=1832) #N/A #N/A
50 - 64 years 5% 5% 31% 26% 29% 4% (n=1758) #N/A #N/A
65 years or older ▲6% 5% ▲35% ▼23% 27% 4% (n=1388) #N/A #N/A
Type of resident Apartment 5% 6% 31% 27% 26% 4% (n=3013) #N/A #N/A
House 4% 5% 31% 28% 28% 4% (n=3006) #N/A #N/A
Electricity bill? Electronic bill 4% ▼5% 31% 28% 28% 4% (n=4615) #N/A #N/A
Paper invoice 5% ▲7% 31% 27% 25% 4% (n=1404) #N/A #N/A
Electricity to heating Use electricity to heat home 4% 6% ▼28% 29% ▲30% 4% (n=3127) #N/A #N/A
Not using electicity to heat home ▲5% 5% ▲34% 26% ▼25% 5% (n=2765) #N/A #N/A
Do not know 2% 8% 31% 29% ▼19% ▲10% (n=127) #N/A #N/A
Consumer type ACTIVE consumers 4% 5% ▼27% 29% ▲31% ▼2% (n=1540) #N/A #N/A
AWARE consumers 5% 5% 31% 30% 29% ▼1% (n=966) #N/A #N/A
INACTIVE comsumers 4% 6% ▲32% ▼26% ▼25% ▲6% (n=3513) #N/A #N/A
Less than 5000 kWh 5% 6% ▲34% 26% 25% 4% (n=1146) #N/A #N/A
5000- 9 999 kWh 4% 5% 29% 29% 29% 3% (n=1011) #N/A #N/A
10 000- 14 999 kWh 4% 5% 31% 29% 30% ▼2% (n=875) #N/A #N/A
15 000-19 999 kWh 3% 5% 27% 31% 31% 3% (n=619) #N/A #N/A
20 000 - 24 999 kWh 4% 5% 27% 30% 31% 4% (n=399) #N/A #N/A
More than 25 000 kWh 6% 4% 26% 33% 31% ▼1% (n=165) #N/A #N/A
Do not know 5% 5% 32% ▼25% ▼25% ▲8% (n=1804) #N/A #N/A
Less than 50 € 5% 7% ▲35% 27% ▼21% 5% (n=1281) #N/A #N/A
50-100 € 4% 6% 31% 27% 28% ▼2% (n=1363) #N/A #N/A
100-150 € 3% ▼4% 30% 30% 28% 4% (n=907) #N/A #N/A
150-200 € 4% 5% 29% 28% 31% 3% (n=772) #N/A #N/A
200-300 € 5% 6% ▼26% 28% ▲32% 3% (n=615) #N/A #N/A
More than 300 € 5% ▼3% ▼25% 32% ▲33% ▼2% (n=346) #N/A #N/A
Do not know 5% 6% 32% ▼22% 24% ▲11% (n=735) #N/A #N/A
Country Norway 5% 5% 29% 29% 28% 4% (n=1506) #N/A #N/A
Sweden 4% ▼4% 32% 26% 29% 4% (n=1501) #N/A #N/A
Denmark 4% ▼4% 31% ▼24% ▲31% ▲6% (n=1508) #N/A #N/A
Finland 5% ▲9% 31% ▲31% ▼21% ▼3% (n=1504) #N/A #N/A
Total 4% 6% 31% 28% 27% 4% (n=6019) #N/A #N/A
Spending on
electricity in total an
average winter
month
Annual KWh-use
Val
id N
#N/A
#N/A
Q: I would like to be better informed about the price I pay for electricity
Q: I would like to be better informed about the price I pay for electricity
Background variables
1 F
ully
dis
agre
e
2 3 N
eutr
al
4 5 F
ully
agr
ee
Do
no
t kn
ow
0% 10% 20% 30% 40%
84

Count Mean Significant higherSignificant lower scoreNo difference
Gender Female (n=2814) 68 68,4
Male (n=2933) 67 67,1
Other (n=10) 48 47,5
Age group Under 35 years (n=980) 69 69
35 - 49 years (n=1758) 68 68,4
50 - 64 years (n=1687) 68 67,8
65 years or older (n=1332) ▼66 65,7
Type of resident Apartment (n=2878) 67 66,9
House (n=2879) 69 68,5
Electricity bill? Electronic bill (n=4416) 68 68,2
Paper invoice (n=1341) 66 66,1
Electricity to heating Use electricity to heat home (n=3004) ▲70 69,7
Not using electicity to heat home (n=2639) ▼66 65,6
Do not know (n=114) 65 65,1
Consumer type ACTIVE consumers (n=1502) ▲70 70,1
AWARE consumers (n=953) 69 68,6
INACTIVE comsumers (n=3302) ▼66 66,3
Less than 5000 kWh (n=1102) ▼65 65,1
5000- 9 999 kWh (n=976) 69 68,7
10 000- 14 999 kWh (n=861) 69 69,1
15 000-19 999 kWh (n=602) ▲71 71,1
20 000 - 24 999 kWh (n=384) 70 70,3
More than 25 000 kWh (n=164) 70 69,8
Do not know (n=1668) ▼66 66,1
Less than 50 € (n=1223) ▼64 63,8
50-100 € (n=1329) 68 67,9
100-150 € (n=872) ▲70 69,9
150-200 € (n=747) ▲70 70
200-300 € (n=595) 70 69,8
More than 300 € (n=339) ▲72 71,7
Do not know (n=652) ▼65 65
Country Norway (n=1442) 69 68,5
Sweden (n=1439) 69 68,9
Denmark (n=1411) ▲70 69,9
Finland (n=1465) ▼64 63,6
Total (n=5757) 68 67,7
Annual KWh-use
Spending on electricity
in total an average
winter month
Q: I would like to be better informed about the price I pay for electricity
Standardized mean score: 0 =1 Fully disagree and 100 = 5 Fully agree. 'Do not know' is not in the calculation.
0 25 50 75 100
Significant higher
Significant lower score
No difference
85
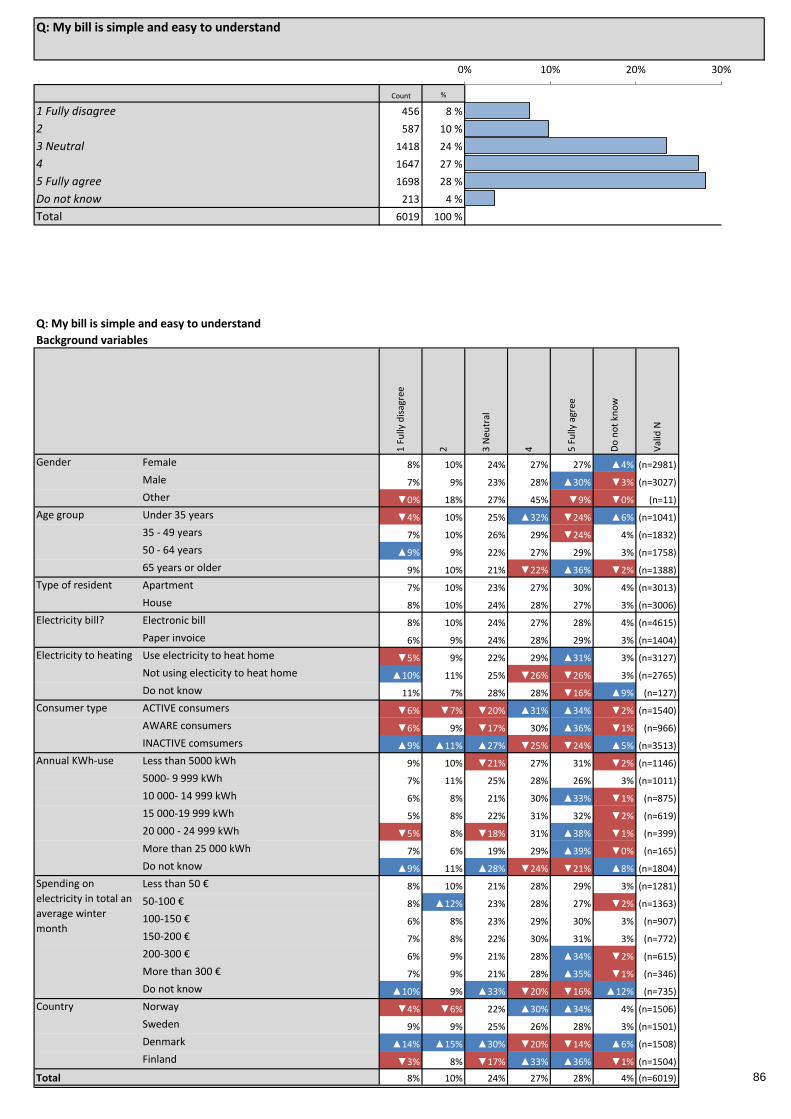
Count %
1 Fully disagree 456 8 % 8 %
2 587 10 % 10 %
3 Neutral 1418 24 % 24 %
4 1647 27 % 27 %
5 Fully agree 1698 28 % 28 %
Do not know 213 4 % 4 %
Total 6019 100 % #N/A
#N/A #N/A #N/A
#N/A #N/A #N/A
#N/A #N/A #N/A
#N/A #N/A #N/A
Gender Female 8% 10% 24% 27% 27% ▲4% (n=2981) #N/A #N/A
Male 7% 9% 23% 28% ▲30% ▼3% (n=3027) #N/A #N/A
Other ▼0% 18% 27% 45% ▼9% ▼0% (n=11) #N/A #N/A
Age group Under 35 years ▼4% 10% 25% ▲32% ▼24% ▲6% (n=1041) #N/A #N/A
35 - 49 years 7% 10% 26% 29% ▼24% 4% (n=1832) #N/A #N/A
50 - 64 years ▲9% 9% 22% 27% 29% 3% (n=1758) #N/A #N/A
65 years or older 9% 10% 21% ▼22% ▲36% ▼2% (n=1388) #N/A #N/A
Type of resident Apartment 7% 10% 23% 27% 30% 4% (n=3013) #N/A #N/A
House 8% 10% 24% 28% 27% 3% (n=3006) #N/A #N/A
Electricity bill? Electronic bill 8% 10% 24% 27% 28% 4% (n=4615) #N/A #N/A
Paper invoice 6% 9% 24% 28% 29% 3% (n=1404) #N/A #N/A
Electricity to heating Use electricity to heat home ▼5% 9% 22% 29% ▲31% 3% (n=3127) #N/A #N/A
Not using electicity to heat home ▲10% 11% 25% ▼26% ▼26% 3% (n=2765) #N/A #N/A
Do not know 11% 7% 28% 28% ▼16% ▲9% (n=127) #N/A #N/A
Consumer type ACTIVE consumers ▼6% ▼7% ▼20% ▲31% ▲34% ▼2% (n=1540) #N/A #N/A
AWARE consumers ▼6% 9% ▼17% 30% ▲36% ▼1% (n=966) #N/A #N/A
INACTIVE comsumers ▲9% ▲11% ▲27% ▼25% ▼24% ▲5% (n=3513) #N/A #N/A
Less than 5000 kWh 9% 10% ▼21% 27% 31% ▼2% (n=1146) #N/A #N/A
5000- 9 999 kWh 7% 11% 25% 28% 26% 3% (n=1011) #N/A #N/A
10 000- 14 999 kWh 6% 8% 21% 30% ▲33% ▼1% (n=875) #N/A #N/A
15 000-19 999 kWh 5% 8% 22% 31% 32% ▼2% (n=619) #N/A #N/A
20 000 - 24 999 kWh ▼5% 8% ▼18% 31% ▲38% ▼1% (n=399) #N/A #N/A
More than 25 000 kWh 7% 6% 19% 29% ▲39% ▼0% (n=165) #N/A #N/A
Do not know ▲9% 11% ▲28% ▼24% ▼21% ▲8% (n=1804) #N/A #N/A
Less than 50 € 8% 10% 21% 28% 29% 3% (n=1281) #N/A #N/A
50-100 € 8% ▲12% 23% 28% 27% ▼2% (n=1363) #N/A #N/A
100-150 € 6% 8% 23% 29% 30% 3% (n=907) #N/A #N/A
150-200 € 7% 8% 22% 30% 31% 3% (n=772) #N/A #N/A
200-300 € 6% 9% 21% 28% ▲34% ▼2% (n=615) #N/A #N/A
More than 300 € 7% 9% 21% 28% ▲35% ▼1% (n=346) #N/A #N/A
Do not know ▲10% 9% ▲33% ▼20% ▼16% ▲12% (n=735) #N/A #N/A
Country Norway ▼4% ▼6% 22% ▲30% ▲34% 4% (n=1506) #N/A #N/A
Sweden 9% 9% 25% 26% 28% 3% (n=1501) #N/A #N/A
Denmark ▲14% ▲15% ▲30% ▼20% ▼14% ▲6% (n=1508) #N/A #N/A
Finland ▼3% 8% ▼17% ▲33% ▲36% ▼1% (n=1504) #N/A #N/A
Total 8% 10% 24% 27% 28% 4% (n=6019) #N/A #N/A
Spending on
electricity in total an
average winter
month
Annual KWh-use
Val
id N
#N/A
#N/A
Q: My bill is simple and easy to understand
Q: My bill is simple and easy to understand
Background variables
1 F
ully
dis
agre
e
2 3 N
eutr
al
4 5 F
ully
agr
ee
Do
no
t kn
ow
0% 10% 20% 30%
86
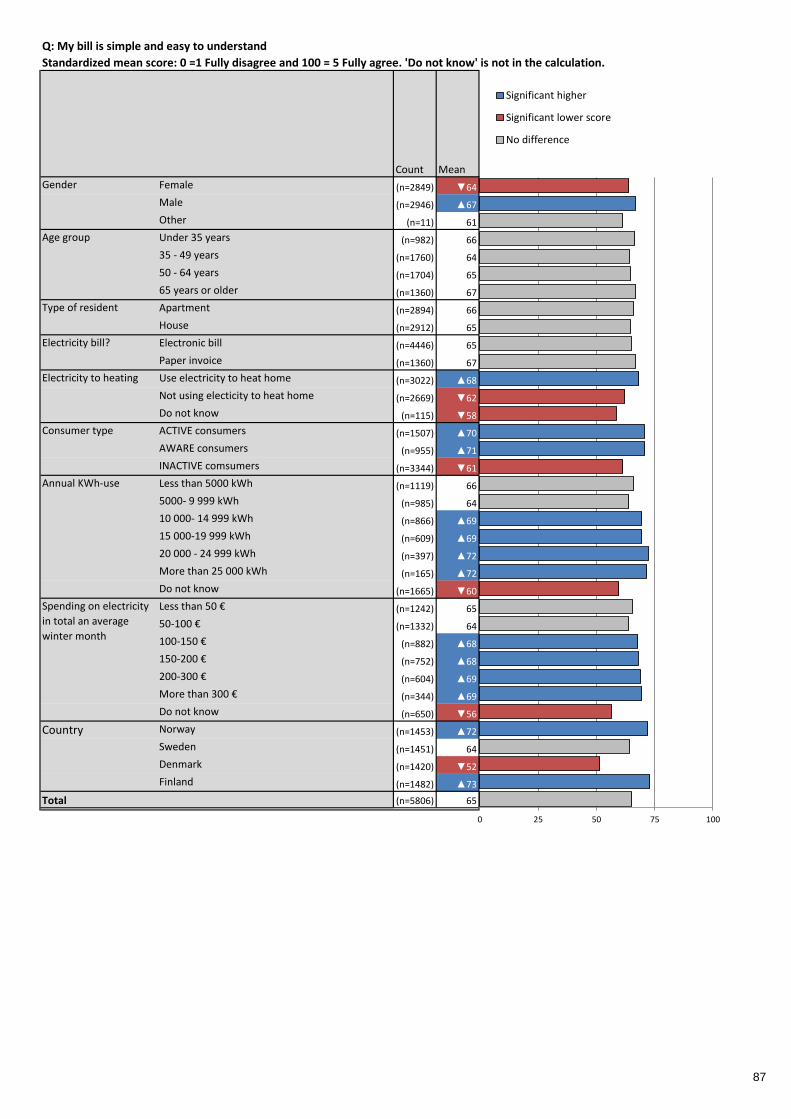
Count Mean Significant higherSignificant lower scoreNo difference
Gender Female (n=2849) ▼64 63,9
Male (n=2946) ▲67 66,6
Other (n=11) 61 61,4
Age group Under 35 years (n=982) 66 66,5
35 - 49 years (n=1760) 64 64,1
50 - 64 years (n=1704) 65 64,6
65 years or older (n=1360) 67 66,7
Type of resident Apartment (n=2894) 66 66
House (n=2912) 65 64,5
Electricity bill? Electronic bill (n=4446) 65 64,8
Paper invoice (n=1360) 67 66,6
Electricity to heating Use electricity to heat home (n=3022) ▲68 68,3
Not using electicity to heat home (n=2669) ▼62 62,1
Do not know (n=115) ▼58 58,5
Consumer type ACTIVE consumers (n=1507) ▲70 70,5
AWARE consumers (n=955) ▲71 70,7
INACTIVE comsumers (n=3344) ▼61 61,4
Less than 5000 kWh (n=1119) 66 65,8
5000- 9 999 kWh (n=985) 64 64
10 000- 14 999 kWh (n=866) ▲69 69,4
15 000-19 999 kWh (n=609) ▲69 69,4
20 000 - 24 999 kWh (n=397) ▲72 72,2
More than 25 000 kWh (n=165) ▲72 71,5
Do not know (n=1665) ▼60 59,7
Less than 50 € (n=1242) 65 65,4
50-100 € (n=1332) 64 63,7
100-150 € (n=882) ▲68 67,8
150-200 € (n=752) ▲68 67,9
200-300 € (n=604) ▲69 68,8
More than 300 € (n=344) ▲69 69,3
Do not know (n=650) ▼56 56,4
Country Norway (n=1453) ▲72 72
Sweden (n=1451) 64 64,1
Denmark (n=1420) ▼52 51,6
Finland (n=1482) ▲73 72,9
Total (n=5806) 65 65,3
Annual KWh-use
Spending on electricity
in total an average
winter month
Q: My bill is simple and easy to understand
Standardized mean score: 0 =1 Fully disagree and 100 = 5 Fully agree. 'Do not know' is not in the calculation.
0 25 50 75 100
Significant higher
Significant lower score
No difference
87
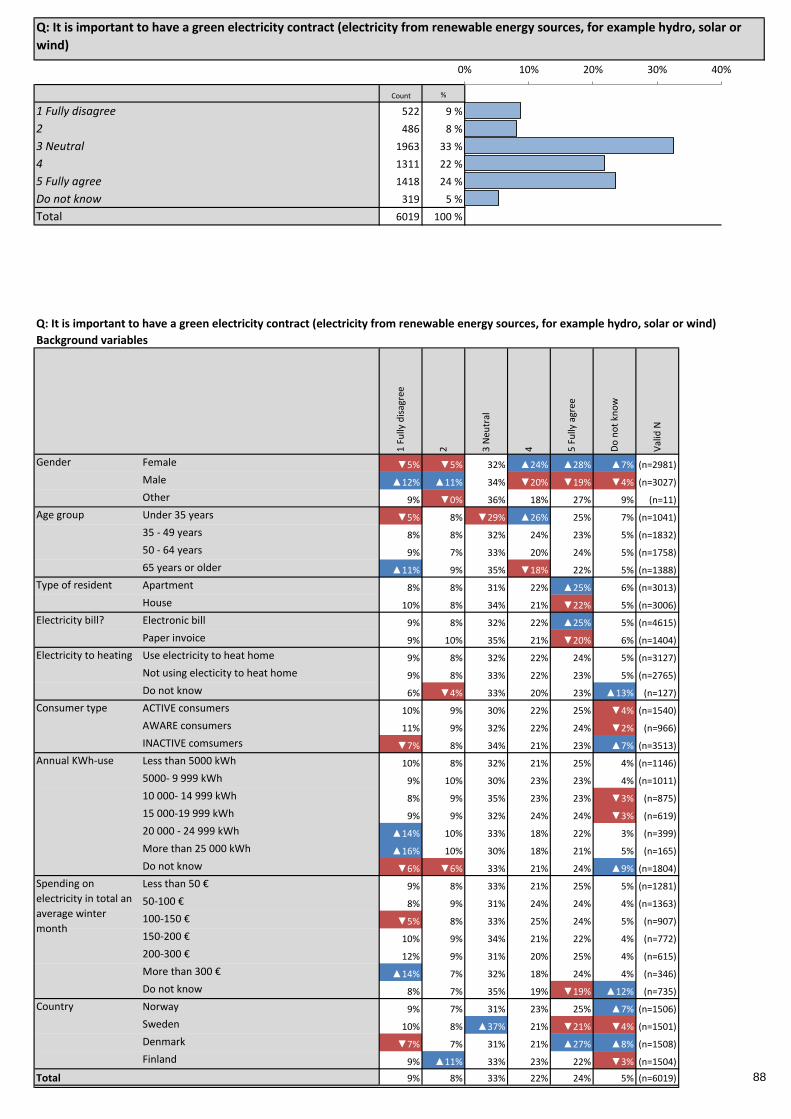
Count %
1 Fully disagree 522 9 % 9 %
2 486 8 % 8 %
3 Neutral 1963 33 % 33 %
4 1311 22 % 22 %
5 Fully agree 1418 24 % 24 %
Do not know 319 5 % 5 %
Total 6019 100 % #N/A
#N/A #N/A #N/A
#N/A #N/A #N/A
#N/A #N/A #N/A
#N/A #N/A #N/A
Gender Female ▼5% ▼5% 32% ▲24% ▲28% ▲7% (n=2981) #N/A #N/A
Male ▲12% ▲11% 34% ▼20% ▼19% ▼4% (n=3027) #N/A #N/A
Other 9% ▼0% 36% 18% 27% 9% (n=11) #N/A #N/A
Age group Under 35 years ▼5% 8% ▼29% ▲26% 25% 7% (n=1041) #N/A #N/A
35 - 49 years 8% 8% 32% 24% 23% 5% (n=1832) #N/A #N/A
50 - 64 years 9% 7% 33% 20% 24% 5% (n=1758) #N/A #N/A
65 years or older ▲11% 9% 35% ▼18% 22% 5% (n=1388) #N/A #N/A
Type of resident Apartment 8% 8% 31% 22% ▲25% 6% (n=3013) #N/A #N/A
House 10% 8% 34% 21% ▼22% 5% (n=3006) #N/A #N/A
Electricity bill? Electronic bill 9% 8% 32% 22% ▲25% 5% (n=4615) #N/A #N/A
Paper invoice 9% 10% 35% 21% ▼20% 6% (n=1404) #N/A #N/A
Electricity to heating Use electricity to heat home 9% 8% 32% 22% 24% 5% (n=3127) #N/A #N/A
Not using electicity to heat home 9% 8% 33% 22% 23% 5% (n=2765) #N/A #N/A
Do not know 6% ▼4% 33% 20% 23% ▲13% (n=127) #N/A #N/A
Consumer type ACTIVE consumers 10% 9% 30% 22% 25% ▼4% (n=1540) #N/A #N/A
AWARE consumers 11% 9% 32% 22% 24% ▼2% (n=966) #N/A #N/A
INACTIVE comsumers ▼7% 8% 34% 21% 23% ▲7% (n=3513) #N/A #N/A
Less than 5000 kWh 10% 8% 32% 21% 25% 4% (n=1146) #N/A #N/A
5000- 9 999 kWh 9% 10% 30% 23% 23% 4% (n=1011) #N/A #N/A
10 000- 14 999 kWh 8% 9% 35% 23% 23% ▼3% (n=875) #N/A #N/A
15 000-19 999 kWh 9% 9% 32% 24% 24% ▼3% (n=619) #N/A #N/A
20 000 - 24 999 kWh ▲14% 10% 33% 18% 22% 3% (n=399) #N/A #N/A
More than 25 000 kWh ▲16% 10% 30% 18% 21% 5% (n=165) #N/A #N/A
Do not know ▼6% ▼6% 33% 21% 24% ▲9% (n=1804) #N/A #N/A
Less than 50 € 9% 8% 33% 21% 25% 5% (n=1281) #N/A #N/A
50-100 € 8% 9% 31% 24% 24% 4% (n=1363) #N/A #N/A
100-150 € ▼5% 8% 33% 25% 24% 5% (n=907) #N/A #N/A
150-200 € 10% 9% 34% 21% 22% 4% (n=772) #N/A #N/A
200-300 € 12% 9% 31% 20% 25% 4% (n=615) #N/A #N/A
More than 300 € ▲14% 7% 32% 18% 24% 4% (n=346) #N/A #N/A
Do not know 8% 7% 35% 19% ▼19% ▲12% (n=735) #N/A #N/A
Country Norway 9% 7% 31% 23% 25% ▲7% (n=1506) #N/A #N/A
Sweden 10% 8% ▲37% 21% ▼21% ▼4% (n=1501) #N/A #N/A
Denmark ▼7% 7% 31% 21% ▲27% ▲8% (n=1508) #N/A #N/A
Finland 9% ▲11% 33% 23% 22% ▼3% (n=1504) #N/A #N/A
Total 9% 8% 33% 22% 24% 5% (n=6019) #N/A #N/A
Spending on
electricity in total an
average winter
month
Annual KWh-use
Val
id N
#N/A
#N/A
Q: It is important to have a green electricity contract (electricity from renewable energy sources, for example hydro, solar or
wind)
Q: It is important to have a green electricity contract (electricity from renewable energy sources, for example hydro, solar or wind)
Background variables
1 F
ully
dis
agre
e
2 3 N
eutr
al
4 5 F
ully
agr
ee
Do
no
t kn
ow
0% 10% 20% 30% 40%
88

Count Mean Significant higherSignificant lower scoreNo difference
Gender Female (n=2782) ▲67 67,3
Male (n=2908) ▼56 55,9
Other (n=10) 65 65
Age group Under 35 years (n=968) ▲65 65,3
35 - 49 years (n=1744) 62 61,8
50 - 64 years (n=1672) 61 61,3
65 years or older (n=1316) ▼58 58,4
Type of resident Apartment (n=2844) ▲63 63,1
House (n=2856) ▼60 59,8
Electricity bill? Electronic bill (n=4374) ▲62 62,2
Paper invoice (n=1326) ▼59 59,1
Electricity to heating Use electricity to heat home (n=2970) 62 61,6
Not using electicity to heat home (n=2620) 61 61,2
Do not know (n=110) 64 64,3
Consumer type ACTIVE consumers (n=1483) 61 60,9
AWARE consumers (n=944) 60 60,1
INACTIVE comsumers (n=3273) 62 62,1
Less than 5000 kWh (n=1098) 61 60,9
5000- 9 999 kWh (n=969) 61 61
10 000- 14 999 kWh (n=852) 61 61,2
15 000-19 999 kWh (n=603) 62 61,7
20 000 - 24 999 kWh (n=386) ▼56 56,4
More than 25 000 kWh (n=157) ▼55 54,6
Do not know (n=1635) ▲64 64,1
Less than 50 € (n=1223) 62 62,2
50-100 € (n=1303) 63 62,5
100-150 € (n=858) ▲64 64,2
150-200 € (n=742) 60 59,5
200-300 € (n=591) 60 59,9
More than 300 € (n=333) 58 58,2
Do not know (n=650) 60 59,8
Country Norway (n=1401) 63 62,8
Sweden (n=1445) ▼59 58,9
Denmark (n=1391) ▲65 64,6
Finland (n=1463) 60 59,8
Total (n=5700) 61 61,5
Annual KWh-use
Spending on electricity
in total an average
winter month
Q: It is important to have a green electricity contract (electricity from renewable energy sources, for example hydro, solar or wind)
Standardized mean score: 0 =1 Fully disagree and 100 = 5 Fully agree. 'Do not know' is not in the calculation.
0 25 50 75 100
Significant higher
Significant lower score
No difference
89

Count %
1 Fully disagree 394 7 % 7 %
2 440 7 % 7 %
3 Neutral 1628 27 % 27 %
4 1454 24 % 24 %
5 Fully agree 1840 31 % 31 %
Do not know 263 4 % 4 %
Total 6019 100 % #N/A
#N/A #N/A #N/A
#N/A #N/A #N/A
#N/A #N/A #N/A
#N/A #N/A #N/A
Gender Female 7% 7% 25% 24% 31% ▲5% (n=2981) #N/A #N/A
Male 6% 8% ▲29% 25% 30% ▼3% (n=3027) #N/A #N/A
Other ▼0% 18% ▼0% 45% 27% 9% (n=11) #N/A #N/A
Age group Under 35 years ▼4% 9% 25% ▲29% 27% 5% (n=1041) #N/A #N/A
35 - 49 years 6% 7% 27% ▲27% 30% 4% (n=1832) #N/A #N/A
50 - 64 years ▲8% 7% 28% 23% 30% 4% (n=1758) #N/A #N/A
65 years or older 7% 7% 27% ▼19% ▲35% 4% (n=1388) #N/A #N/A
Type of resident Apartment 7% ▲9% 28% 25% ▼28% 4% (n=3013) #N/A #N/A
House 6% ▼6% 27% 24% ▲33% 4% (n=3006) #N/A #N/A
Electricity bill? Electronic bill 6% ▼7% 26% 24% ▲33% 4% (n=4615) #N/A #N/A
Paper invoice 8% ▲10% 29% 26% ▼22% 5% (n=1404) #N/A #N/A
Electricity to heating Use electricity to heat home ▼5% 6% ▼24% ▲26% ▲35% 4% (n=3127) #N/A #N/A
Not using electicity to heat home ▲9% 8% ▲30% ▼22% ▼26% 5% (n=2765) #N/A #N/A
Do not know 9% 8% 36% 20% ▼18% 9% (n=127) #N/A #N/A
Consumer type ACTIVE consumers 5% 7% ▼24% ▲27% ▲34% ▼2% (n=1540) #N/A #N/A
AWARE consumers 5% 6% 25% 25% ▲37% ▼2% (n=966) #N/A #N/A
INACTIVE comsumers ▲7% 8% ▲29% ▼23% ▼27% ▲6% (n=3513) #N/A #N/A
Less than 5000 kWh 8% 8% 28% 23% 29% 4% (n=1146) #N/A #N/A
5000- 9 999 kWh 6% 7% 28% 23% 31% 4% (n=1011) #N/A #N/A
10 000- 14 999 kWh 5% 8% ▼23% ▲29% 32% ▼2% (n=875) #N/A #N/A
15 000-19 999 kWh ▼4% 6% ▼22% 28% ▲38% ▼2% (n=619) #N/A #N/A
20 000 - 24 999 kWh ▼3% ▼4% 25% 24% ▲42% 3% (n=399) #N/A #N/A
More than 25 000 kWh 4% 5% 25% 24% ▲41% ▼1% (n=165) #N/A #N/A
Do not know ▲8% 8% ▲30% ▼22% ▼24% ▲8% (n=1804) #N/A #N/A
Less than 50 € ▲9% ▲10% 29% 24% ▼24% 5% (n=1281) #N/A #N/A
50-100 € 6% 7% 28% 26% 29% ▼3% (n=1363) #N/A #N/A
100-150 € 5% 8% 26% 25% 32% 4% (n=907) #N/A #N/A
150-200 € ▼4% 6% 24% 25% ▲37% 4% (n=772) #N/A #N/A
200-300 € ▼4% 6% ▼21% 25% ▲41% 3% (n=615) #N/A #N/A
More than 300 € 6% ▼4% 23% 27% ▲38% ▼2% (n=346) #N/A #N/A
Do not know 9% 7% ▲34% ▼17% ▼24% ▲10% (n=735) #N/A #N/A
Country Norway ▼4% ▼6% ▼24% 24% ▲38% 5% (n=1506) #N/A #N/A
Sweden 7% 7% 30% 23% 29% 4% (n=1501) #N/A #N/A
Denmark ▲9% 7% 29% ▼20% 28% ▲6% (n=1508) #N/A #N/A
Finland 6% ▲9% 26% ▲29% ▼28% ▼2% (n=1504) #N/A #N/A
Total 7% 7% 27% 24% 31% 4% (n=6019) #N/A #N/A
Spending on
electricity in total an
average winter
month
Annual KWh-use
Val
id N
#N/A
#N/A
Q: I want to get updated information about my consumption (e.g. online or in an app)
Q: I want to get updated information about my consumption (e.g. online or in an app)
Background variables
1 F
ully
dis
agre
e
2 3 N
eutr
al
4 5 F
ully
agr
ee
Do
no
t kn
ow
0% 10% 20% 30% 40%
90

Count Mean Significant higherSignificant lower scoreNo difference
Gender Female (n=2820) 67 67,3
Male (n=2926) 67 66,7
Other (n=10) 73 72,5
Age group Under 35 years (n=984) 68 67,6
35 - 49 years (n=1761) 67 67,4
50 - 64 years (n=1682) 66 65,6
65 years or older (n=1329) 68 67,6
Type of resident Apartment (n=2878) ▼65 65,1
House (n=2878) ▲69 68,8
Electricity bill? Electronic bill (n=4422) ▲69 68,5
Paper invoice (n=1334) ▼62 61,9
Electricity to heating Use electricity to heat home (n=3004) ▲71 70,9
Not using electicity to heat home (n=2637) ▼63 62,9
Do not know (n=115) ▼58 58,5
Consumer type ACTIVE consumers (n=1504) ▲70 69,5
AWARE consumers (n=949) ▲71 70,9
INACTIVE comsumers (n=3303) ▼65 64,7
Less than 5000 kWh (n=1099) 65 65
5000- 9 999 kWh (n=971) 67 67,3
10 000- 14 999 kWh (n=861) 69 69,1
15 000-19 999 kWh (n=608) ▲73 73
20 000 - 24 999 kWh (n=389) ▲75 74,9
More than 25 000 kWh (n=164) ▲74 73,6
Do not know (n=1664) ▼62 62,3
Less than 50 € (n=1222) ▼62 61,7
50-100 € (n=1321) 66 66,4
100-150 € (n=873) 69 68,7
150-200 € (n=742) ▲72 72
200-300 € (n=598) ▲74 73,8
More than 300 € (n=340) ▲72 71,7
Do not know (n=660) ▼61 61,2
Country Norway (n=1437) ▲73 72,6
Sweden (n=1437) 66 65,5
Denmark (n=1411) ▼64 63,8
Finland (n=1471) 66 65,9
Total (n=5756) 67 67
Annual KWh-use
Spending on electricity
in total an average
winter month
Q: I want to get updated information about my consumption (e.g. online or in an app)
Standardized mean score: 0 =1 Fully disagree and 100 = 5 Fully agree. 'Do not know' is not in the calculation.
0 25 50 75 100
Significant higher
Significant lower score
No difference
91
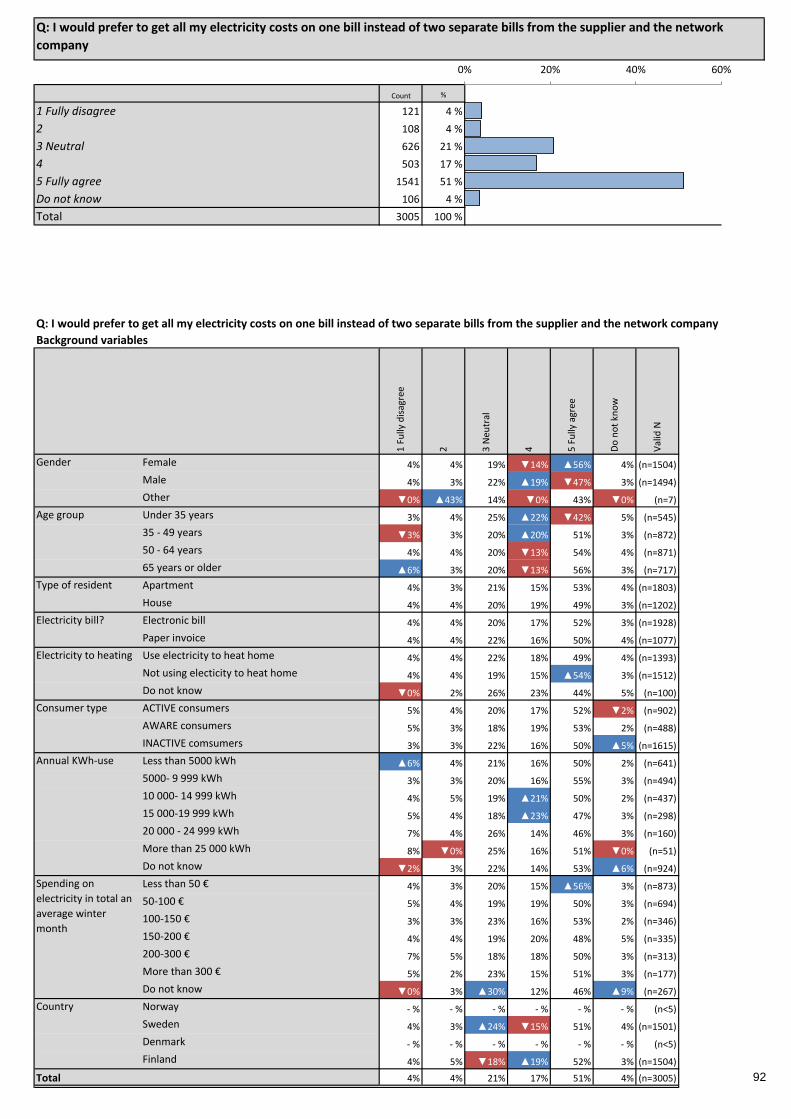
Count %
1 Fully disagree 121 4 % 4 %
2 108 4 % 4 %
3 Neutral 626 21 % 21 %
4 503 17 % 17 %
5 Fully agree 1541 51 % 51 %
Do not know 106 4 % 4 %
Total 3005 100 % #N/A
#N/A #N/A #N/A
#N/A #N/A #N/A
#N/A #N/A #N/A
#N/A #N/A #N/A
Gender Female 4% 4% 19% ▼14% ▲56% 4% (n=1504) #N/A #N/A
Male 4% 3% 22% ▲19% ▼47% 3% (n=1494) #N/A #N/A
Other ▼0% ▲43% 14% ▼0% 43% ▼0% (n=7) #N/A #N/A
Age group Under 35 years 3% 4% 25% ▲22% ▼42% 5% (n=545) #N/A #N/A
35 - 49 years ▼3% 3% 20% ▲20% 51% 3% (n=872) #N/A #N/A
50 - 64 years 4% 4% 20% ▼13% 54% 4% (n=871) #N/A #N/A
65 years or older ▲6% 3% 20% ▼13% 56% 3% (n=717) #N/A #N/A
Type of resident Apartment 4% 3% 21% 15% 53% 4% (n=1803) #N/A #N/A
House 4% 4% 20% 19% 49% 3% (n=1202) #N/A #N/A
Electricity bill? Electronic bill 4% 4% 20% 17% 52% 3% (n=1928) #N/A #N/A
Paper invoice 4% 4% 22% 16% 50% 4% (n=1077) #N/A #N/A
Electricity to heating Use electricity to heat home 4% 4% 22% 18% 49% 4% (n=1393) #N/A #N/A
Not using electicity to heat home 4% 4% 19% 15% ▲54% 3% (n=1512) #N/A #N/A
Do not know ▼0% 2% 26% 23% 44% 5% (n=100) #N/A #N/A
Consumer type ACTIVE consumers 5% 4% 20% 17% 52% ▼2% (n=902) #N/A #N/A
AWARE consumers 5% 3% 18% 19% 53% 2% (n=488) #N/A #N/A
INACTIVE comsumers 3% 3% 22% 16% 50% ▲5% (n=1615) #N/A #N/A
Less than 5000 kWh ▲6% 4% 21% 16% 50% 2% (n=641) #N/A #N/A
5000- 9 999 kWh 3% 3% 20% 16% 55% 3% (n=494) #N/A #N/A
10 000- 14 999 kWh 4% 5% 19% ▲21% 50% 2% (n=437) #N/A #N/A
15 000-19 999 kWh 5% 4% 18% ▲23% 47% 3% (n=298) #N/A #N/A
20 000 - 24 999 kWh 7% 4% 26% 14% 46% 3% (n=160) #N/A #N/A
More than 25 000 kWh 8% ▼0% 25% 16% 51% ▼0% (n=51) #N/A #N/A
Do not know ▼2% 3% 22% 14% 53% ▲6% (n=924) #N/A #N/A
Less than 50 € 4% 3% 20% 15% ▲56% 3% (n=873) #N/A #N/A
50-100 € 5% 4% 19% 19% 50% 3% (n=694) #N/A #N/A
100-150 € 3% 3% 23% 16% 53% 2% (n=346) #N/A #N/A
150-200 € 4% 4% 19% 20% 48% 5% (n=335) #N/A #N/A
200-300 € 7% 5% 18% 18% 50% 3% (n=313) #N/A #N/A
More than 300 € 5% 2% 23% 15% 51% 3% (n=177) #N/A #N/A
Do not know ▼0% 3% ▲30% 12% 46% ▲9% (n=267) #N/A #N/A
Country Norway - % - % - % - % - % - % (n<5) #N/A #N/A
Sweden 4% 3% ▲24% ▼15% 51% 4% (n=1501) #N/A #N/A
Denmark - % - % - % - % - % - % (n<5) #N/A #N/A
Finland 4% 5% ▼18% ▲19% 52% 3% (n=1504) #N/A #N/A
Total 4% 4% 21% 17% 51% 4% (n=3005) #N/A #N/A
Spending on
electricity in total an
average winter
month
Annual KWh-use
Val
id N
#N/A
#N/A
Q: I would prefer to get all my electricity costs on one bill instead of two separate bills from the supplier and the network
company
Q: I would prefer to get all my electricity costs on one bill instead of two separate bills from the supplier and the network company
Background variables
1 F
ully
dis
agre
e
2 3 N
eutr
al
4 5 F
ully
agr
ee
Do
no
t kn
ow
0% 20% 40% 60%
92

Count Mean Significant higherSignificant lower scoreNo difference
Gender Female (n=1450) ▲80 79,7
Male (n=1442) ▼76 76,1
Other (n=7) 61 60,7
Age group Under 35 years (n=518) 75 75,3
35 - 49 years (n=846) 79 79,2
50 - 64 years (n=836) 78 78,2
65 years or older (n=699) 78 77,9
Type of resident Apartment (n=1737) 78 78,5
House (n=1162) 77 77
Electricity bill? Electronic bill (n=1867) 78 78,1
Paper invoice (n=1032) 78 77,5
Electricity to heating Use electricity to heat home (n=1343) 77 77
Not using electicity to heat home (n=1461) 79 78,6
Do not know (n=95) 79 78,7
Consumer type ACTIVE consumers (n=884) 77 77,3
AWARE consumers (n=476) 79 78,6
INACTIVE comsumers (n=1539) 78 78
Less than 5000 kWh (n=627) 76 75,6
5000- 9 999 kWh (n=481) 80 79,8
10 000- 14 999 kWh (n=429) 77 77,5
15 000-19 999 kWh (n=290) 76 76,5
20 000 - 24 999 kWh (n=156) 73 72,6
More than 25 000 kWh (n=51) 75 75,5
Do not know (n=865) ▲80 80,4
Less than 50 € (n=851) 80 79,7
50-100 € (n=673) 77 77
100-150 € (n=340) 79 78,7
150-200 € (n=318) 77 77,3
200-300 € (n=303) 75 75,4
More than 300 € (n=171) 77 77,1
Do not know (n=243) 78 77,6
Country Norway (n<5) -
Sweden (n=1440) 78 77,6
Denmark (n<5) -
Finland (n=1459) 78 78,2
Total (n=2899) 78 77,9
Annual KWh-use
Spending on electricity
in total an average
winter month
Q: I would prefer to get all my electricity costs on one bill instead of two separate bills from the supplier and the network company
Standardized mean score: 0 =1 Fully disagree and 100 = 5 Fully agree. 'Do not know' is not in the calculation.
0 25 50 75 100
Significant higher
Significant lower score
No difference
93

Count %
Not important at all 163 11 % 11 %
A bit important 242 16 % 16 %
Fairly important 460 31 % 31 %
Very important 585 39 % 39 %
Do not know 56 4 % 4 %
Total 1506 100 % #N/A
#N/A #N/A #N/A
#N/A #N/A #N/A
#N/A #N/A #N/A
#N/A #N/A #N/A
#N/A #N/A #N/A
Gender Female 9% 16% 31% 39% 4% (n=730) #N/A #N/A #N/A
Male 12% 16% 30% 39% 3% (n=774) #N/A #N/A #N/A
Other - % - % - % - % - % (n<5) #N/A #N/A #N/A
Age group Under 35 years ▼3% 21% 34% 35% 7% (n=244) #N/A #N/A #N/A
35 - 49 years 10% 17% 31% 37% 4% (n=533) #N/A #N/A #N/A
50 - 64 years 13% 14% 31% 39% 3% (n=407) #N/A #N/A #N/A
65 years or older ▲16% 13% 25% 43% 2% (n=322) #N/A #N/A #N/A
Type of resident Apartment 10% 15% 30% 41% 4% (n=629) #N/A #N/A #N/A
House 12% 17% 31% 38% 3% (n=877) #N/A #N/A #N/A
Electricity bill? Electronic bill ▲11% 16% 30% 39% 3% (n=1335) #N/A #N/A #N/A
Paper invoice ▼6% 17% 35% 36% 7% (n=171) #N/A #N/A #N/A
Electricity to heating Use electricity to heat home 11% 16% 31% 39% 4% (n=1370) #N/A #N/A #N/A
Not using electicity to heat home 11% 18% 27% 40% 5% (n=131) #N/A #N/A #N/A
Do not know ▼0% 20% 20% 40% 20% (n=5) #N/A #N/A #N/A
Consumer type ACTIVE consumers 9% 15% 31% 41% 4% (n=391) #N/A #N/A #N/A
AWARE consumers ▲19% 17% 27% 36% ▼1% (n=283) #N/A #N/A #N/A
INACTIVE comsumers 9% 16% 32% 39% 5% (n=832) #N/A #N/A #N/A
Less than 5000 kWh 22% 15% 25% 37% 2% (n=60) #N/A #N/A #N/A
5000- 9 999 kWh 13% 12% 29% 43% 2% (n=177) #N/A #N/A #N/A
10 000- 14 999 kWh 9% 16% 33% 40% 3% (n=264) #N/A #N/A #N/A
15 000-19 999 kWh 11% 19% 30% 40% ▼1% (n=245) #N/A #N/A #N/A
20 000 - 24 999 kWh 14% 13% 30% 43% ▼0% (n=220) #N/A #N/A #N/A
More than 25 000 kWh 18% 19% 23% 38% ▼1% (n=103) #N/A #N/A #N/A
Do not know ▼6% 17% 33% 35% ▲9% (n=437) #N/A #N/A #N/A
Less than 50 € 21% 16% 23% 36% 4% (n=73) #N/A #N/A #N/A
50-100 € 12% 14% 34% 37% 3% (n=254) #N/A #N/A #N/A
100-150 € 9% 19% 29% 39% 4% (n=344) #N/A #N/A #N/A
150-200 € 10% 15% 33% 39% 3% (n=319) #N/A #N/A #N/A
200-300 € 11% 13% 31% 44% 2% (n=234) #N/A #N/A #N/A
More than 300 € 14% 18% 24% 44% ▼0% (n=136) #N/A #N/A #N/A
Do not know 8% 16% 32% 31% ▲13% (n=146) #N/A #N/A #N/A
Country Norway 11% 16% 31% 39% 4% (n=1506) #N/A #N/A #N/A
Sweden - % - % - % - % - % (n<5) #N/A #N/A #N/A
Denmark - % - % - % - % - % (n<5) #N/A #N/A #N/A
Finland - % - % - % - % - % (n<5) #N/A #N/A #N/A
Total 11% 16% 31% 39% 4% (n=1506) #N/A #N/A #N/A
Spending on
electricity in total an
average winter
month
Annual KWh-use
#N/A
#N/A
#N/A
Q: If you should switch supplier, how important would it be to get all electricity costs on one bill instead of two separate bills
from the supplier and the network company?
Q: If you should switch supplier, how important would it be to get all electricity costs on one bill instead of two separate bills from
the supplier and the network company?
Background variables
No
t im
po
rtan
t at
all
A b
it im
po
rtan
t
Fair
ly im
po
rtan
t
Ver
y im
po
rtan
t
Do
no
t kn
ow
Val
id N
0% 10% 20% 30% 40% 50%
94

Count %
Yes 4818 80 % 80 %
No 1201 20 % 20 %
Total 6019 100 % #N/A
#N/A #N/A #N/A
#N/A #N/A #N/A
#N/A #N/A #N/A
#N/A #N/A #N/A
#N/A #N/A #N/A
#N/A #N/A #N/A
#N/A #N/A #N/A
#N/A #N/A #N/A
Gender Female ▼78% ▲22% (n=2981) #N/A #N/A #N/A #N/A #N/A #N/A
Male ▲83% ▼17% (n=3027) #N/A #N/A #N/A #N/A #N/A #N/A
Other 64% 36% (n=11) #N/A #N/A #N/A #N/A #N/A #N/A
Age group Under 35 years ▼73% ▲27% (n=1041) #N/A #N/A #N/A #N/A #N/A #N/A
35 - 49 years ▼75% ▲25% (n=1832) #N/A #N/A #N/A #N/A #N/A #N/A
50 - 64 years ▲83% ▼17% (n=1758) #N/A #N/A #N/A #N/A #N/A #N/A
65 years or older ▲89% ▼11% (n=1388) #N/A #N/A #N/A #N/A #N/A #N/A
Type of resident Apartment ▼78% ▲22% (n=3013) #N/A #N/A #N/A #N/A #N/A #N/A
House ▲82% ▼18% (n=3006) #N/A #N/A #N/A #N/A #N/A #N/A
Electricity bill? Electronic bill 80% 20% (n=4615) #N/A #N/A #N/A #N/A #N/A #N/A
Paper invoice 81% 19% (n=1404) #N/A #N/A #N/A #N/A #N/A #N/A
Electricity to heating Use electricity to heat home ▲83% ▼17% (n=3127) #N/A #N/A #N/A #N/A #N/A #N/A
Not using electicity to heat home ▼78% ▲22% (n=2765) #N/A #N/A #N/A #N/A #N/A #N/A
Do not know ▼65% ▲35% (n=127) #N/A #N/A #N/A #N/A #N/A #N/A
Consumer type ACTIVE consumers ▲87% ▼13% (n=1540) #N/A #N/A #N/A #N/A #N/A #N/A
AWARE consumers ▲91% ▼9% (n=966) #N/A #N/A #N/A #N/A #N/A #N/A
INACTIVE comsumers ▼74% ▲26% (n=3513) #N/A #N/A #N/A #N/A #N/A #N/A
Less than 5000 kWh ▲85% ▼15% (n=1146) #N/A #N/A #N/A #N/A #N/A #N/A
5000- 9 999 kWh ▲84% ▼16% (n=1011) #N/A #N/A #N/A #N/A #N/A #N/A
10 000- 14 999 kWh ▲86% ▼14% (n=875) #N/A #N/A #N/A #N/A #N/A #N/A
15 000-19 999 kWh ▲88% ▼12% (n=619) #N/A #N/A #N/A #N/A #N/A #N/A
20 000 - 24 999 kWh ▲88% ▼12% (n=399) #N/A #N/A #N/A #N/A #N/A #N/A
More than 25 000 kWh ▲92% ▼8% (n=165) #N/A #N/A #N/A #N/A #N/A #N/A
Do not know ▼66% ▲34% (n=1804) #N/A #N/A #N/A #N/A #N/A #N/A
Less than 50 € 77% 23% (n=1281) #N/A #N/A #N/A #N/A #N/A #N/A
50-100 € 82% 18% (n=1363) #N/A #N/A #N/A #N/A #N/A #N/A
100-150 € 81% 19% (n=907) #N/A #N/A #N/A #N/A #N/A #N/A
150-200 € ▲84% ▼16% (n=772) #N/A #N/A #N/A #N/A #N/A #N/A
200-300 € ▲87% ▼13% (n=615) #N/A #N/A #N/A #N/A #N/A #N/A
More than 300 € ▲87% ▼13% (n=346) #N/A #N/A #N/A #N/A #N/A #N/A
Do not know ▼67% ▲33% (n=735) #N/A #N/A #N/A #N/A #N/A #N/A
Country Norway ▲84% ▼16% (n=1506) #N/A #N/A #N/A #N/A #N/A #N/A
Sweden ▼76% ▲24% (n=1501) #N/A #N/A #N/A #N/A #N/A #N/A
Denmark ▼75% ▲25% (n=1508) #N/A #N/A #N/A #N/A #N/A #N/A
Finland ▲85% ▼15% (n=1504) #N/A #N/A #N/A #N/A #N/A #N/A
Total 80% 20% (n=6019) #N/A #N/A #N/A #N/A #N/A #N/A
Spending on
electricity in total an
average winter
month
Annual KWh-use
#N/A
#N/A
#N/A
Q: Do you read the information presented on your electricity bill?
Q: Do you read the information presented on your electricity bill?
Background variables
Yes
No
Val
id N
#N/A
#N/A
#N/A
0% 20% 40% 60% 80% 100%
95

Count %
Yes 4679 97 % 97 %
No 109 2 % 2 %
I don't believe, that this information is on my bill 30 1 % 1 %
Total 4818 100 % #N/A
#N/A #N/A #N/A
#N/A #N/A #N/A
#N/A #N/A #N/A
#N/A #N/A #N/A
#N/A #N/A #N/A
#N/A #N/A #N/A
#N/A #N/A #N/A
Gender Female 98% ▼2% 1% (n=2312) #N/A #N/A #N/A #N/A #N/A
Male 97% ▲3% 1% (n=2499) #N/A #N/A #N/A #N/A #N/A
Other ▲100% ▼0% ▼0% (n=7) #N/A #N/A #N/A #N/A #N/A
Age group Under 35 years ▼93% ▲6% 1% (n=758) #N/A #N/A #N/A #N/A #N/A
35 - 49 years 97% 3% 0% (n=1376) #N/A #N/A #N/A #N/A #N/A
50 - 64 years 98% ▼1% 1% (n=1455) #N/A #N/A #N/A #N/A #N/A
65 years or older ▲99% ▼1% 1% (n=1229) #N/A #N/A #N/A #N/A #N/A
Type of resident Apartment 97% 3% 1% (n=2346) #N/A #N/A #N/A #N/A #N/A
House 98% 2% 1% (n=2472) #N/A #N/A #N/A #N/A #N/A
Electricity bill? Electronic bill 97% 2% 1% (n=3684) #N/A #N/A #N/A #N/A #N/A
Paper invoice 97% 3% 1% (n=1134) #N/A #N/A #N/A #N/A #N/A
Electricity to heating Use electricity to heat home 97% ▲3% 1% (n=2580) #N/A #N/A #N/A #N/A #N/A
Not using electicity to heat home ▲98% ▼1% 1% (n=2156) #N/A #N/A #N/A #N/A #N/A
Do not know 95% 4% 1% (n=82) #N/A #N/A #N/A #N/A #N/A
Consumer type ACTIVE consumers ▲99% ▼1% 0% (n=1339) #N/A #N/A #N/A #N/A #N/A
AWARE consumers 97% 3% 1% (n=882) #N/A #N/A #N/A #N/A #N/A
INACTIVE comsumers ▼96% 3% 1% (n=2597) #N/A #N/A #N/A #N/A #N/A
Less than 5000 kWh 97% 2% 0% (n=973) #N/A #N/A #N/A #N/A #N/A
5000- 9 999 kWh 97% 3% 1% (n=848) #N/A #N/A #N/A #N/A #N/A
10 000- 14 999 kWh 96% 3% 1% (n=752) #N/A #N/A #N/A #N/A #N/A
15 000-19 999 kWh 97% 2% 1% (n=544) #N/A #N/A #N/A #N/A #N/A
20 000 - 24 999 kWh 97% 2% 0% (n=353) #N/A #N/A #N/A #N/A #N/A
More than 25 000 kWh 97% 1% 1% (n=151) #N/A #N/A #N/A #N/A #N/A
Do not know 98% 2% 1% (n=1197) #N/A #N/A #N/A #N/A #N/A
Less than 50 € ▲98% ▼1% 0% (n=992) #N/A #N/A #N/A #N/A #N/A
50-100 € 97% 3% 1% (n=1118) #N/A #N/A #N/A #N/A #N/A
100-150 € 96% 3% 1% (n=737) #N/A #N/A #N/A #N/A #N/A
150-200 € 97% 3% 1% (n=648) #N/A #N/A #N/A #N/A #N/A
200-300 € 97% 3% 0% (n=533) #N/A #N/A #N/A #N/A #N/A
More than 300 € 98% 1% 1% (n=301) #N/A #N/A #N/A #N/A #N/A
Do not know 97% 2% 1% (n=489) #N/A #N/A #N/A #N/A #N/A
Country Norway 97% 2% 1% (n=1266) #N/A #N/A #N/A #N/A #N/A
Sweden 97% 3% 0% (n=1148) #N/A #N/A #N/A #N/A #N/A
Denmark ▼96% ▲4% 1% (n=1127) #N/A #N/A #N/A #N/A #N/A
Finland ▲98% ▼1% 0% (n=1277) #N/A #N/A #N/A #N/A #N/A
Total 97% 2% 1% (n=4818) #N/A #N/A #N/A #N/A #N/A
Spending on
electricity in total an
average winter
month
Annual KWh-use
#N/A
#N/A
#N/A
Q: [I look at the total amount I have to pay] What information do you read on your electricity bill?
Q: [I look at the total amount I have to pay] What information do you read on your electricity bill?
Background variables
Yes
No
I do
n't
bel
ieve
, th
at t
his
info
rmat
ion
is o
n m
y
bill
Val
id N
#N/A
#N/A
0% 50% 100% 150%
96

Count %
Yes 4107 85 % 85 %
No 568 12 % 12 %
I don't believe, that this information is on my bill 143 3 % 3 %
Total 4818 100 % #N/A
#N/A #N/A #N/A
#N/A #N/A #N/A
#N/A #N/A #N/A
#N/A #N/A #N/A
#N/A #N/A #N/A
#N/A #N/A #N/A
#N/A #N/A #N/A
Gender Female 86% 11% 3% (n=2312) #N/A #N/A #N/A #N/A #N/A
Male 85% 13% 3% (n=2499) #N/A #N/A #N/A #N/A #N/A
Other 86% 14% ▼0% (n=7) #N/A #N/A #N/A #N/A #N/A
Age group Under 35 years ▼78% ▲18% 4% (n=758) #N/A #N/A #N/A #N/A #N/A
35 - 49 years 85% 12% 3% (n=1376) #N/A #N/A #N/A #N/A #N/A
50 - 64 years 87% 11% ▼2% (n=1455) #N/A #N/A #N/A #N/A #N/A
65 years or older ▲88% ▼9% 3% (n=1229) #N/A #N/A #N/A #N/A #N/A
Type of resident Apartment 84% 12% 4% (n=2346) #N/A #N/A #N/A #N/A #N/A
House 86% 11% 2% (n=2472) #N/A #N/A #N/A #N/A #N/A
Electricity bill? Electronic bill 86% 12% 3% (n=3684) #N/A #N/A #N/A #N/A #N/A
Paper invoice 84% 12% 4% (n=1134) #N/A #N/A #N/A #N/A #N/A
Electricity to heating Use electricity to heat home 85% 12% 3% (n=2580) #N/A #N/A #N/A #N/A #N/A
Not using electicity to heat home 86% 12% 3% (n=2156) #N/A #N/A #N/A #N/A #N/A
Do not know 83% 13% 4% (n=82) #N/A #N/A #N/A #N/A #N/A
Consumer type ACTIVE consumers ▲89% ▼8% 2% (n=1339) #N/A #N/A #N/A #N/A #N/A
AWARE consumers ▲89% ▼8% 2% (n=882) #N/A #N/A #N/A #N/A #N/A
INACTIVE comsumers ▼82% ▲15% ▲4% (n=2597) #N/A #N/A #N/A #N/A #N/A
Less than 5000 kWh ▲88% ▼9% 2% (n=973) #N/A #N/A #N/A #N/A #N/A
5000- 9 999 kWh 88% ▼9% 3% (n=848) #N/A #N/A #N/A #N/A #N/A
10 000- 14 999 kWh 85% 12% 3% (n=752) #N/A #N/A #N/A #N/A #N/A
15 000-19 999 kWh 86% 12% 2% (n=544) #N/A #N/A #N/A #N/A #N/A
20 000 - 24 999 kWh 89% 9% 2% (n=353) #N/A #N/A #N/A #N/A #N/A
More than 25 000 kWh 87% 10% 3% (n=151) #N/A #N/A #N/A #N/A #N/A
Do not know ▼79% ▲16% ▲4% (n=1197) #N/A #N/A #N/A #N/A #N/A
Less than 50 € 86% 11% 3% (n=992) #N/A #N/A #N/A #N/A #N/A
50-100 € 87% 10% 3% (n=1118) #N/A #N/A #N/A #N/A #N/A
100-150 € 85% 12% 3% (n=737) #N/A #N/A #N/A #N/A #N/A
150-200 € 83% 13% 4% (n=648) #N/A #N/A #N/A #N/A #N/A
200-300 € 85% 13% 2% (n=533) #N/A #N/A #N/A #N/A #N/A
More than 300 € ▲91% ▼7% 2% (n=301) #N/A #N/A #N/A #N/A #N/A
Do not know ▼80% ▲17% 4% (n=489) #N/A #N/A #N/A #N/A #N/A
Country Norway 85% 11% 4% (n=1266) #N/A #N/A #N/A #N/A #N/A
Sweden 83% 14% 3% (n=1148) #N/A #N/A #N/A #N/A #N/A
Denmark 84% 14% 3% (n=1127) #N/A #N/A #N/A #N/A #N/A
Finland ▲89% ▼9% 2% (n=1277) #N/A #N/A #N/A #N/A #N/A
Total 85% 12% 3% (n=4818) #N/A #N/A #N/A #N/A #N/A
Spending on
electricity in total an
average winter
month
Annual KWh-use
#N/A
#N/A
#N/A
Q: [I look at the specification of the different price elements that my electricity cost is based on?] What information do you
read on your electricity bill?
Q: [I look at the specification of the different price elements that my electricity cost is based on?] What information do you read
on your electricity bill?
Background variables
Yes
No
I do
n't
bel
ieve
, th
at t
his
info
rmat
ion
is o
n m
y
bill
Val
id N
#N/A
#N/A
0% 20% 40% 60% 80% 100%
97
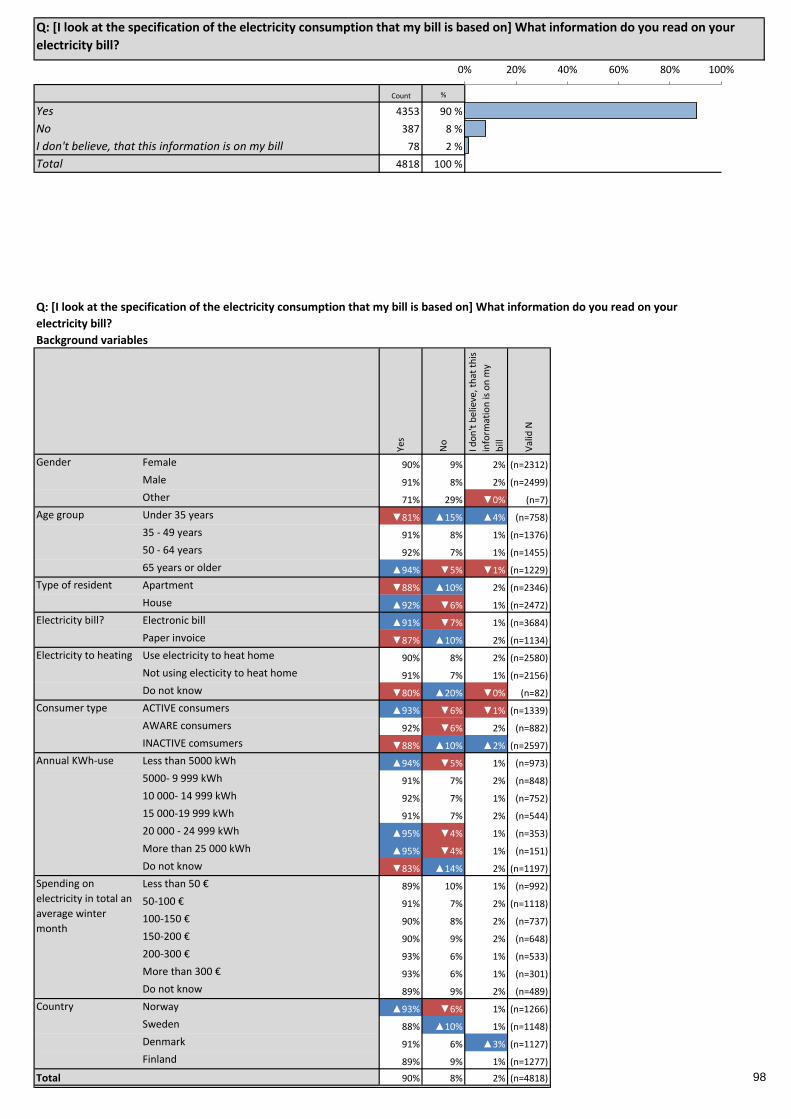
Count %
Yes 4353 90 % 90 %
No 387 8 % 8 %
I don't believe, that this information is on my bill 78 2 % 2 %
Total 4818 100 % #N/A
#N/A #N/A #N/A
#N/A #N/A #N/A
#N/A #N/A #N/A
#N/A #N/A #N/A
#N/A #N/A #N/A
#N/A #N/A #N/A
#N/A #N/A #N/A
Gender Female 90% 9% 2% (n=2312) #N/A #N/A #N/A #N/A #N/A
Male 91% 8% 2% (n=2499) #N/A #N/A #N/A #N/A #N/A
Other 71% 29% ▼0% (n=7) #N/A #N/A #N/A #N/A #N/A
Age group Under 35 years ▼81% ▲15% ▲4% (n=758) #N/A #N/A #N/A #N/A #N/A
35 - 49 years 91% 8% 1% (n=1376) #N/A #N/A #N/A #N/A #N/A
50 - 64 years 92% 7% 1% (n=1455) #N/A #N/A #N/A #N/A #N/A
65 years or older ▲94% ▼5% ▼1% (n=1229) #N/A #N/A #N/A #N/A #N/A
Type of resident Apartment ▼88% ▲10% 2% (n=2346) #N/A #N/A #N/A #N/A #N/A
House ▲92% ▼6% 1% (n=2472) #N/A #N/A #N/A #N/A #N/A
Electricity bill? Electronic bill ▲91% ▼7% 1% (n=3684) #N/A #N/A #N/A #N/A #N/A
Paper invoice ▼87% ▲10% 2% (n=1134) #N/A #N/A #N/A #N/A #N/A
Electricity to heating Use electricity to heat home 90% 8% 2% (n=2580) #N/A #N/A #N/A #N/A #N/A
Not using electicity to heat home 91% 7% 1% (n=2156) #N/A #N/A #N/A #N/A #N/A
Do not know ▼80% ▲20% ▼0% (n=82) #N/A #N/A #N/A #N/A #N/A
Consumer type ACTIVE consumers ▲93% ▼6% ▼1% (n=1339) #N/A #N/A #N/A #N/A #N/A
AWARE consumers 92% ▼6% 2% (n=882) #N/A #N/A #N/A #N/A #N/A
INACTIVE comsumers ▼88% ▲10% ▲2% (n=2597) #N/A #N/A #N/A #N/A #N/A
Less than 5000 kWh ▲94% ▼5% 1% (n=973) #N/A #N/A #N/A #N/A #N/A
5000- 9 999 kWh 91% 7% 2% (n=848) #N/A #N/A #N/A #N/A #N/A
10 000- 14 999 kWh 92% 7% 1% (n=752) #N/A #N/A #N/A #N/A #N/A
15 000-19 999 kWh 91% 7% 2% (n=544) #N/A #N/A #N/A #N/A #N/A
20 000 - 24 999 kWh ▲95% ▼4% 1% (n=353) #N/A #N/A #N/A #N/A #N/A
More than 25 000 kWh ▲95% ▼4% 1% (n=151) #N/A #N/A #N/A #N/A #N/A
Do not know ▼83% ▲14% 2% (n=1197) #N/A #N/A #N/A #N/A #N/A
Less than 50 € 89% 10% 1% (n=992) #N/A #N/A #N/A #N/A #N/A
50-100 € 91% 7% 2% (n=1118) #N/A #N/A #N/A #N/A #N/A
100-150 € 90% 8% 2% (n=737) #N/A #N/A #N/A #N/A #N/A
150-200 € 90% 9% 2% (n=648) #N/A #N/A #N/A #N/A #N/A
200-300 € 93% 6% 1% (n=533) #N/A #N/A #N/A #N/A #N/A
More than 300 € 93% 6% 1% (n=301) #N/A #N/A #N/A #N/A #N/A
Do not know 89% 9% 2% (n=489) #N/A #N/A #N/A #N/A #N/A
Country Norway ▲93% ▼6% 1% (n=1266) #N/A #N/A #N/A #N/A #N/A
Sweden 88% ▲10% 1% (n=1148) #N/A #N/A #N/A #N/A #N/A
Denmark 91% 6% ▲3% (n=1127) #N/A #N/A #N/A #N/A #N/A
Finland 89% 9% 1% (n=1277) #N/A #N/A #N/A #N/A #N/A
Total 90% 8% 2% (n=4818) #N/A #N/A #N/A #N/A #N/A
Spending on
electricity in total an
average winter
month
Annual KWh-use
#N/A
#N/A
#N/A
Q: [I look at the specification of the electricity consumption that my bill is based on] What information do you read on your
electricity bill?
Q: [I look at the specification of the electricity consumption that my bill is based on] What information do you read on your
electricity bill?
Background variables
Yes
No
I do
n't
bel
ieve
, th
at t
his
info
rmat
ion
is o
n m
y
bill
Val
id N
#N/A
#N/A
0% 20% 40% 60% 80% 100%
98
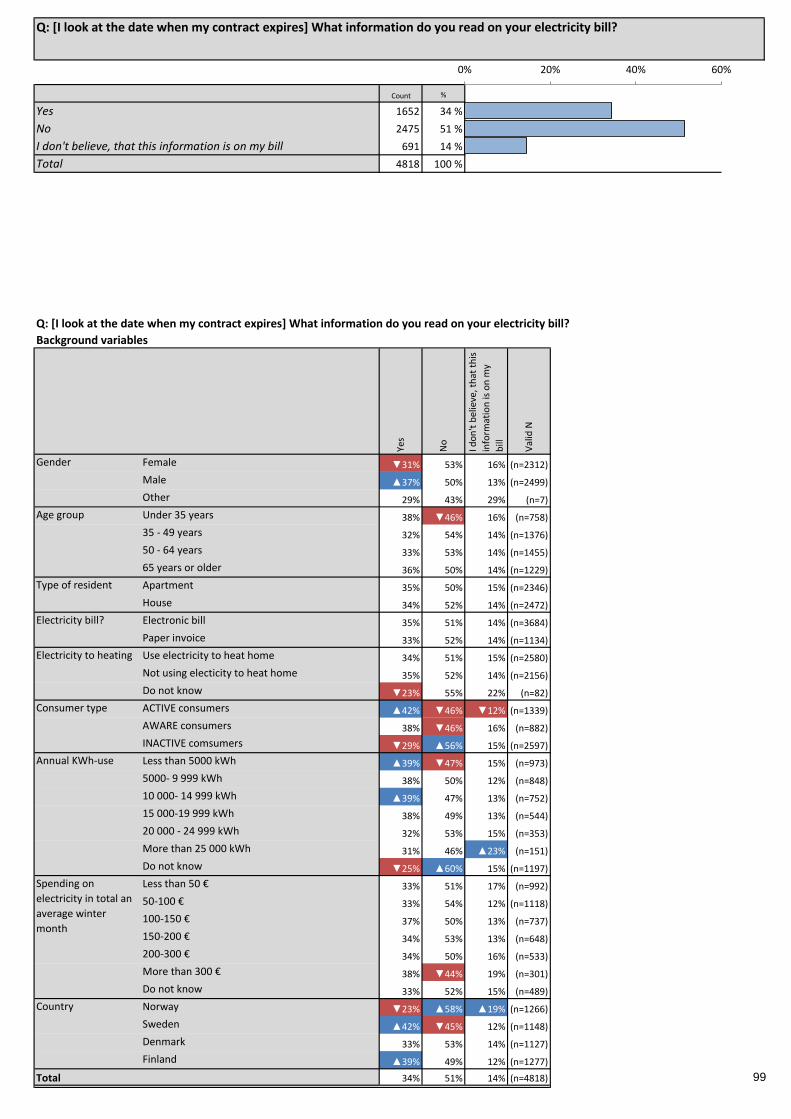
Count %
Yes 1652 34 % 34 %
No 2475 51 % 51 %
I don't believe, that this information is on my bill 691 14 % 14 %
Total 4818 100 % #N/A
#N/A #N/A #N/A
#N/A #N/A #N/A
#N/A #N/A #N/A
#N/A #N/A #N/A
#N/A #N/A #N/A
#N/A #N/A #N/A
#N/A #N/A #N/A
Gender Female ▼31% 53% 16% (n=2312) #N/A #N/A #N/A #N/A #N/A
Male ▲37% 50% 13% (n=2499) #N/A #N/A #N/A #N/A #N/A
Other 29% 43% 29% (n=7) #N/A #N/A #N/A #N/A #N/A
Age group Under 35 years 38% ▼46% 16% (n=758) #N/A #N/A #N/A #N/A #N/A
35 - 49 years 32% 54% 14% (n=1376) #N/A #N/A #N/A #N/A #N/A
50 - 64 years 33% 53% 14% (n=1455) #N/A #N/A #N/A #N/A #N/A
65 years or older 36% 50% 14% (n=1229) #N/A #N/A #N/A #N/A #N/A
Type of resident Apartment 35% 50% 15% (n=2346) #N/A #N/A #N/A #N/A #N/A
House 34% 52% 14% (n=2472) #N/A #N/A #N/A #N/A #N/A
Electricity bill? Electronic bill 35% 51% 14% (n=3684) #N/A #N/A #N/A #N/A #N/A
Paper invoice 33% 52% 14% (n=1134) #N/A #N/A #N/A #N/A #N/A
Electricity to heating Use electricity to heat home 34% 51% 15% (n=2580) #N/A #N/A #N/A #N/A #N/A
Not using electicity to heat home 35% 52% 14% (n=2156) #N/A #N/A #N/A #N/A #N/A
Do not know ▼23% 55% 22% (n=82) #N/A #N/A #N/A #N/A #N/A
Consumer type ACTIVE consumers ▲42% ▼46% ▼12% (n=1339) #N/A #N/A #N/A #N/A #N/A
AWARE consumers 38% ▼46% 16% (n=882) #N/A #N/A #N/A #N/A #N/A
INACTIVE comsumers ▼29% ▲56% 15% (n=2597) #N/A #N/A #N/A #N/A #N/A
Less than 5000 kWh ▲39% ▼47% 15% (n=973) #N/A #N/A #N/A #N/A #N/A
5000- 9 999 kWh 38% 50% 12% (n=848) #N/A #N/A #N/A #N/A #N/A
10 000- 14 999 kWh ▲39% 47% 13% (n=752) #N/A #N/A #N/A #N/A #N/A
15 000-19 999 kWh 38% 49% 13% (n=544) #N/A #N/A #N/A #N/A #N/A
20 000 - 24 999 kWh 32% 53% 15% (n=353) #N/A #N/A #N/A #N/A #N/A
More than 25 000 kWh 31% 46% ▲23% (n=151) #N/A #N/A #N/A #N/A #N/A
Do not know ▼25% ▲60% 15% (n=1197) #N/A #N/A #N/A #N/A #N/A
Less than 50 € 33% 51% 17% (n=992) #N/A #N/A #N/A #N/A #N/A
50-100 € 33% 54% 12% (n=1118) #N/A #N/A #N/A #N/A #N/A
100-150 € 37% 50% 13% (n=737) #N/A #N/A #N/A #N/A #N/A
150-200 € 34% 53% 13% (n=648) #N/A #N/A #N/A #N/A #N/A
200-300 € 34% 50% 16% (n=533) #N/A #N/A #N/A #N/A #N/A
More than 300 € 38% ▼44% 19% (n=301) #N/A #N/A #N/A #N/A #N/A
Do not know 33% 52% 15% (n=489) #N/A #N/A #N/A #N/A #N/A
Country Norway ▼23% ▲58% ▲19% (n=1266) #N/A #N/A #N/A #N/A #N/A
Sweden ▲42% ▼45% 12% (n=1148) #N/A #N/A #N/A #N/A #N/A
Denmark 33% 53% 14% (n=1127) #N/A #N/A #N/A #N/A #N/A
Finland ▲39% 49% 12% (n=1277) #N/A #N/A #N/A #N/A #N/A
Total 34% 51% 14% (n=4818) #N/A #N/A #N/A #N/A #N/A
Spending on
electricity in total an
average winter
month
Annual KWh-use
#N/A
#N/A
#N/A
Q: [I look at the date when my contract expires] What information do you read on your electricity bill?
Q: [I look at the date when my contract expires] What information do you read on your electricity bill?
Background variables
Yes
No
I do
n't
bel
ieve
, th
at t
his
info
rmat
ion
is o
n m
y
bill
Val
id N
#N/A
#N/A
0% 20% 40% 60%
99
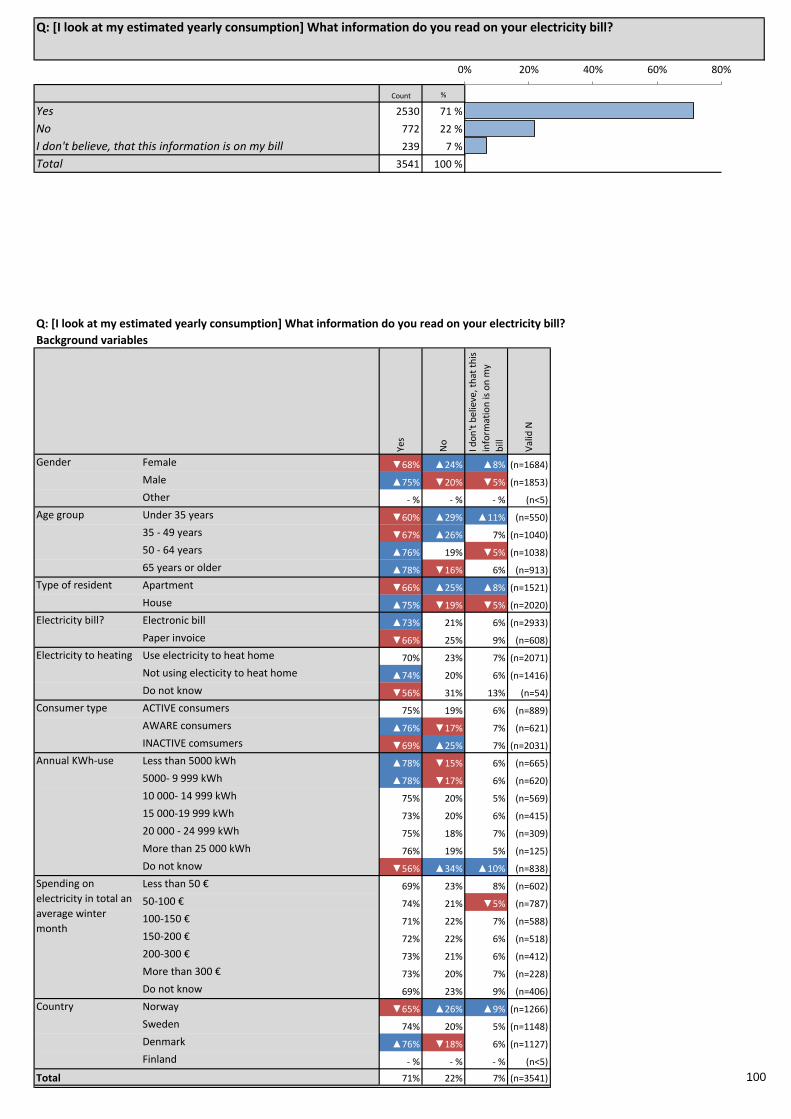
Count %
Yes 2530 71 % 71 %
No 772 22 % 22 %
I don't believe, that this information is on my bill 239 7 % 7 %
Total 3541 100 % #N/A
#N/A #N/A #N/A
#N/A #N/A #N/A
#N/A #N/A #N/A
#N/A #N/A #N/A
#N/A #N/A #N/A
#N/A #N/A #N/A
#N/A #N/A #N/A
Gender Female ▼68% ▲24% ▲8% (n=1684) #N/A #N/A #N/A #N/A #N/A
Male ▲75% ▼20% ▼5% (n=1853) #N/A #N/A #N/A #N/A #N/A
Other - % - % - % (n<5) #N/A #N/A #N/A #N/A #N/A
Age group Under 35 years ▼60% ▲29% ▲11% (n=550) #N/A #N/A #N/A #N/A #N/A
35 - 49 years ▼67% ▲26% 7% (n=1040) #N/A #N/A #N/A #N/A #N/A
50 - 64 years ▲76% 19% ▼5% (n=1038) #N/A #N/A #N/A #N/A #N/A
65 years or older ▲78% ▼16% 6% (n=913) #N/A #N/A #N/A #N/A #N/A
Type of resident Apartment ▼66% ▲25% ▲8% (n=1521) #N/A #N/A #N/A #N/A #N/A
House ▲75% ▼19% ▼5% (n=2020) #N/A #N/A #N/A #N/A #N/A
Electricity bill? Electronic bill ▲73% 21% 6% (n=2933) #N/A #N/A #N/A #N/A #N/A
Paper invoice ▼66% 25% 9% (n=608) #N/A #N/A #N/A #N/A #N/A
Electricity to heating Use electricity to heat home 70% 23% 7% (n=2071) #N/A #N/A #N/A #N/A #N/A
Not using electicity to heat home ▲74% 20% 6% (n=1416) #N/A #N/A #N/A #N/A #N/A
Do not know ▼56% 31% 13% (n=54) #N/A #N/A #N/A #N/A #N/A
Consumer type ACTIVE consumers 75% 19% 6% (n=889) #N/A #N/A #N/A #N/A #N/A
AWARE consumers ▲76% ▼17% 7% (n=621) #N/A #N/A #N/A #N/A #N/A
INACTIVE comsumers ▼69% ▲25% 7% (n=2031) #N/A #N/A #N/A #N/A #N/A
Less than 5000 kWh ▲78% ▼15% 6% (n=665) #N/A #N/A #N/A #N/A #N/A
5000- 9 999 kWh ▲78% ▼17% 6% (n=620) #N/A #N/A #N/A #N/A #N/A
10 000- 14 999 kWh 75% 20% 5% (n=569) #N/A #N/A #N/A #N/A #N/A
15 000-19 999 kWh 73% 20% 6% (n=415) #N/A #N/A #N/A #N/A #N/A
20 000 - 24 999 kWh 75% 18% 7% (n=309) #N/A #N/A #N/A #N/A #N/A
More than 25 000 kWh 76% 19% 5% (n=125) #N/A #N/A #N/A #N/A #N/A
Do not know ▼56% ▲34% ▲10% (n=838) #N/A #N/A #N/A #N/A #N/A
Less than 50 € 69% 23% 8% (n=602) #N/A #N/A #N/A #N/A #N/A
50-100 € 74% 21% ▼5% (n=787) #N/A #N/A #N/A #N/A #N/A
100-150 € 71% 22% 7% (n=588) #N/A #N/A #N/A #N/A #N/A
150-200 € 72% 22% 6% (n=518) #N/A #N/A #N/A #N/A #N/A
200-300 € 73% 21% 6% (n=412) #N/A #N/A #N/A #N/A #N/A
More than 300 € 73% 20% 7% (n=228) #N/A #N/A #N/A #N/A #N/A
Do not know 69% 23% 9% (n=406) #N/A #N/A #N/A #N/A #N/A
Country Norway ▼65% ▲26% ▲9% (n=1266) #N/A #N/A #N/A #N/A #N/A
Sweden 74% 20% 5% (n=1148) #N/A #N/A #N/A #N/A #N/A
Denmark ▲76% ▼18% 6% (n=1127) #N/A #N/A #N/A #N/A #N/A
Finland - % - % - % (n<5) #N/A #N/A #N/A #N/A #N/A
Total 71% 22% 7% (n=3541) #N/A #N/A #N/A #N/A #N/A
Spending on
electricity in total an
average winter
month
Annual KWh-use
#N/A
#N/A
#N/A
Q: [I look at my estimated yearly consumption] What information do you read on your electricity bill?
Q: [I look at my estimated yearly consumption] What information do you read on your electricity bill?
Background variables
Yes
No
I do
n't
bel
ieve
, th
at t
his
info
rmat
ion
is o
n m
y
bill
Val
id N
#N/A
#N/A
0% 20% 40% 60% 80%
100

Count %
Yes 3333 69 % 69 %
No 1071 22 % 22 %
I don't believe, that this information is on my bill 414 9 % 9 %
Total 4818 100 % #N/A
#N/A #N/A #N/A
#N/A #N/A #N/A
#N/A #N/A #N/A
#N/A #N/A #N/A
#N/A #N/A #N/A
#N/A #N/A #N/A
#N/A #N/A #N/A
Gender Female ▼64% ▲25% ▲10% (n=2312) #N/A #N/A #N/A #N/A #N/A
Male ▲74% ▼19% ▼7% (n=2499) #N/A #N/A #N/A #N/A #N/A
Other 43% 43% 14% (n=7) #N/A #N/A #N/A #N/A #N/A
Age group Under 35 years ▼59% ▲29% ▲11% (n=758) #N/A #N/A #N/A #N/A #N/A
35 - 49 years 71% 20% 9% (n=1376) #N/A #N/A #N/A #N/A #N/A
50 - 64 years 71% 21% 8% (n=1455) #N/A #N/A #N/A #N/A #N/A
65 years or older 71% 22% 8% (n=1229) #N/A #N/A #N/A #N/A #N/A
Type of resident Apartment ▼64% ▲26% 10% (n=2346) #N/A #N/A #N/A #N/A #N/A
House ▲74% ▼19% 8% (n=2472) #N/A #N/A #N/A #N/A #N/A
Electricity bill? Electronic bill ▲71% ▼21% ▼8% (n=3684) #N/A #N/A #N/A #N/A #N/A
Paper invoice ▼62% ▲27% ▲11% (n=1134) #N/A #N/A #N/A #N/A #N/A
Electricity to heating Use electricity to heat home ▲73% ▼19% 8% (n=2580) #N/A #N/A #N/A #N/A #N/A
Not using electicity to heat home ▼66% ▲25% 9% (n=2156) #N/A #N/A #N/A #N/A #N/A
Do not know ▼43% ▲39% ▲18% (n=82) #N/A #N/A #N/A #N/A #N/A
Consumer type ACTIVE consumers ▲74% ▼19% 8% (n=1339) #N/A #N/A #N/A #N/A #N/A
AWARE consumers ▲75% ▼18% 7% (n=882) #N/A #N/A #N/A #N/A #N/A
INACTIVE comsumers ▼65% ▲25% 10% (n=2597) #N/A #N/A #N/A #N/A #N/A
Less than 5000 kWh 70% 21% 9% (n=973) #N/A #N/A #N/A #N/A #N/A
5000- 9 999 kWh 71% 21% 8% (n=848) #N/A #N/A #N/A #N/A #N/A
10 000- 14 999 kWh ▲73% 21% ▼6% (n=752) #N/A #N/A #N/A #N/A #N/A
15 000-19 999 kWh ▲76% ▼17% 6% (n=544) #N/A #N/A #N/A #N/A #N/A
20 000 - 24 999 kWh ▲78% ▼14% 8% (n=353) #N/A #N/A #N/A #N/A #N/A
More than 25 000 kWh ▲87% ▼7% 6% (n=151) #N/A #N/A #N/A #N/A #N/A
Do not know ▼57% ▲32% ▲12% (n=1197) #N/A #N/A #N/A #N/A #N/A
Less than 50 € ▼60% ▲28% ▲12% (n=992) #N/A #N/A #N/A #N/A #N/A
50-100 € 68% 25% 7% (n=1118) #N/A #N/A #N/A #N/A #N/A
100-150 € ▲76% ▼18% ▼6% (n=737) #N/A #N/A #N/A #N/A #N/A
150-200 € ▲73% 20% 7% (n=648) #N/A #N/A #N/A #N/A #N/A
200-300 € 72% 19% 9% (n=533) #N/A #N/A #N/A #N/A #N/A
More than 300 € ▲76% ▼14% 10% (n=301) #N/A #N/A #N/A #N/A #N/A
Do not know 67% 21% 11% (n=489) #N/A #N/A #N/A #N/A #N/A
Country Norway ▲83% ▼13% ▼4% (n=1266) #N/A #N/A #N/A #N/A #N/A
Sweden ▼64% ▲27% 9% (n=1148) #N/A #N/A #N/A #N/A #N/A
Denmark 68% 23% 9% (n=1127) #N/A #N/A #N/A #N/A #N/A
Finland ▼62% ▲27% ▲12% (n=1277) #N/A #N/A #N/A #N/A #N/A
Total 69% 22% 9% (n=4818) #N/A #N/A #N/A #N/A #N/A
Spending on
electricity in total an
average winter
month
Annual KWh-use
#N/A
#N/A
#N/A
Q: [I look at my historical consumption] What information do you read on your electricity bill?
Q: [I look at my historical consumption] What information do you read on your electricity bill?
Background variables
Yes
No
I do
n't
bel
ieve
, th
at t
his
info
rmat
ion
is o
n m
y
bill
Val
id N
#N/A
#N/A
0% 20% 40% 60% 80%
101

Count %
Yes 1484 31 % 31 %
No 2343 49 % 49 %
I don't believe, that this information is on my bill 991 21 % 21 %
Total 4818 100 % #N/A
#N/A #N/A #N/A
#N/A #N/A #N/A
#N/A #N/A #N/A
#N/A #N/A #N/A
#N/A #N/A #N/A
#N/A #N/A #N/A
#N/A #N/A #N/A
Gender Female 29% ▼46% ▲24% (n=2312) #N/A #N/A #N/A #N/A #N/A
Male 32% ▲51% ▼17% (n=2499) #N/A #N/A #N/A #N/A #N/A
Other 57% ▼14% 29% (n=7) #N/A #N/A #N/A #N/A #N/A
Age group Under 35 years ▲37% ▼40% 23% (n=758) #N/A #N/A #N/A #N/A #N/A
35 - 49 years 30% 48% 21% (n=1376) #N/A #N/A #N/A #N/A #N/A
50 - 64 years 29% ▲52% 19% (n=1455) #N/A #N/A #N/A #N/A #N/A
65 years or older 29% 50% 20% (n=1229) #N/A #N/A #N/A #N/A #N/A
Type of resident Apartment ▲33% 47% 20% (n=2346) #N/A #N/A #N/A #N/A #N/A
House ▼29% 50% 21% (n=2472) #N/A #N/A #N/A #N/A #N/A
Electricity bill? Electronic bill 30% 49% 21% (n=3684) #N/A #N/A #N/A #N/A #N/A
Paper invoice 32% 47% 21% (n=1134) #N/A #N/A #N/A #N/A #N/A
Electricity to heating Use electricity to heat home 30% 47% ▲23% (n=2580) #N/A #N/A #N/A #N/A #N/A
Not using electicity to heat home 32% 50% ▼18% (n=2156) #N/A #N/A #N/A #N/A #N/A
Do not know 22% 50% 28% (n=82) #N/A #N/A #N/A #N/A #N/A
Consumer type ACTIVE consumers ▲34% 49% ▼17% (n=1339) #N/A #N/A #N/A #N/A #N/A
AWARE consumers 34% 45% 21% (n=882) #N/A #N/A #N/A #N/A #N/A
INACTIVE comsumers ▼28% 50% ▲22% (n=2597) #N/A #N/A #N/A #N/A #N/A
Less than 5000 kWh ▲36% 46% 18% (n=973) #N/A #N/A #N/A #N/A #N/A
5000- 9 999 kWh 34% 48% 18% (n=848) #N/A #N/A #N/A #N/A #N/A
10 000- 14 999 kWh 32% 47% 20% (n=752) #N/A #N/A #N/A #N/A #N/A
15 000-19 999 kWh 33% 49% 18% (n=544) #N/A #N/A #N/A #N/A #N/A
20 000 - 24 999 kWh 26% 50% 24% (n=353) #N/A #N/A #N/A #N/A #N/A
More than 25 000 kWh 26% 45% 28% (n=151) #N/A #N/A #N/A #N/A #N/A
Do not know ▼24% ▲52% ▲23% (n=1197) #N/A #N/A #N/A #N/A #N/A
Less than 50 € 32% 49% 19% (n=992) #N/A #N/A #N/A #N/A #N/A
50-100 € 31% 50% 19% (n=1118) #N/A #N/A #N/A #N/A #N/A
100-150 € 32% 48% 20% (n=737) #N/A #N/A #N/A #N/A #N/A
150-200 € 27% 51% 22% (n=648) #N/A #N/A #N/A #N/A #N/A
200-300 € 31% 46% 23% (n=533) #N/A #N/A #N/A #N/A #N/A
More than 300 € 32% 43% 26% (n=301) #N/A #N/A #N/A #N/A #N/A
Do not know 29% 48% 22% (n=489) #N/A #N/A #N/A #N/A #N/A
Country Norway ▼18% 51% ▲31% (n=1266) #N/A #N/A #N/A #N/A #N/A
Sweden ▲38% 47% ▼15% (n=1148) #N/A #N/A #N/A #N/A #N/A
Denmark 33% 48% 19% (n=1127) #N/A #N/A #N/A #N/A #N/A
Finland ▲35% 48% ▼17% (n=1277) #N/A #N/A #N/A #N/A #N/A
Total 31% 49% 21% (n=4818) #N/A #N/A #N/A #N/A #N/A
Spending on
electricity in total an
average winter
month
Annual KWh-use
#N/A
#N/A
#N/A
Q: [I look at the information on how my electricity is produced (for example, hydro, nuclear, wind, fossil)] What information do
you read on your electricity bill?
Q: [I look at the information on how my electricity is produced (for example, hydro, nuclear, wind, fossil)] What information do
you read on your electricity bill?
Background variables
Yes
No
I do
n't
bel
ieve
, th
at t
his
info
rmat
ion
is o
n m
y
bill
Val
id N
#N/A
#N/A
0% 20% 40% 60%
102

Count %
Yes 2857 59 % 59 %
No 1297 27 % 27 %
I don't believe, that this information is on my bill 664 14 % 14 %
Total 4818 100 % #N/A
#N/A #N/A #N/A
#N/A #N/A #N/A
#N/A #N/A #N/A
#N/A #N/A #N/A
#N/A #N/A #N/A
#N/A #N/A #N/A
#N/A #N/A #N/A
Gender Female ▼56% 27% ▲17% (n=2312) #N/A #N/A #N/A #N/A #N/A
Male ▲62% 27% ▼11% (n=2499) #N/A #N/A #N/A #N/A #N/A
Other 29% 57% 14% (n=7) #N/A #N/A #N/A #N/A #N/A
Age group Under 35 years 56% 27% 16% (n=758) #N/A #N/A #N/A #N/A #N/A
35 - 49 years 59% 27% 13% (n=1376) #N/A #N/A #N/A #N/A #N/A
50 - 64 years 60% 28% 12% (n=1455) #N/A #N/A #N/A #N/A #N/A
65 years or older 60% 25% 15% (n=1229) #N/A #N/A #N/A #N/A #N/A
Type of resident Apartment 59% 27% 13% (n=2346) #N/A #N/A #N/A #N/A #N/A
House 59% 27% 14% (n=2472) #N/A #N/A #N/A #N/A #N/A
Electricity bill? Electronic bill 60% 26% 14% (n=3684) #N/A #N/A #N/A #N/A #N/A
Paper invoice 56% 29% 15% (n=1134) #N/A #N/A #N/A #N/A #N/A
Electricity to heating Use electricity to heat home 60% 26% 15% (n=2580) #N/A #N/A #N/A #N/A #N/A
Not using electicity to heat home 59% 28% 13% (n=2156) #N/A #N/A #N/A #N/A #N/A
Do not know 49% 30% 21% (n=82) #N/A #N/A #N/A #N/A #N/A
Consumer type ACTIVE consumers 62% 27% ▼11% (n=1339) #N/A #N/A #N/A #N/A #N/A
AWARE consumers ▲67% ▼21% 12% (n=882) #N/A #N/A #N/A #N/A #N/A
INACTIVE comsumers ▼55% ▲29% ▲16% (n=2597) #N/A #N/A #N/A #N/A #N/A
Less than 5000 kWh ▲64% ▼23% 13% (n=973) #N/A #N/A #N/A #N/A #N/A
5000- 9 999 kWh 63% 26% ▼11% (n=848) #N/A #N/A #N/A #N/A #N/A
10 000- 14 999 kWh 61% 25% 14% (n=752) #N/A #N/A #N/A #N/A #N/A
15 000-19 999 kWh 63% 25% 12% (n=544) #N/A #N/A #N/A #N/A #N/A
20 000 - 24 999 kWh 60% 25% 15% (n=353) #N/A #N/A #N/A #N/A #N/A
More than 25 000 kWh 54% 30% 17% (n=151) #N/A #N/A #N/A #N/A #N/A
Do not know ▼51% ▲33% ▲16% (n=1197) #N/A #N/A #N/A #N/A #N/A
Less than 50 € 58% 28% 14% (n=992) #N/A #N/A #N/A #N/A #N/A
50-100 € 62% 26% 12% (n=1118) #N/A #N/A #N/A #N/A #N/A
100-150 € 62% 25% 13% (n=737) #N/A #N/A #N/A #N/A #N/A
150-200 € 58% 29% 13% (n=648) #N/A #N/A #N/A #N/A #N/A
200-300 € 61% 24% 15% (n=533) #N/A #N/A #N/A #N/A #N/A
More than 300 € 53% 26% ▲21% (n=301) #N/A #N/A #N/A #N/A #N/A
Do not know 55% 31% 14% (n=489) #N/A #N/A #N/A #N/A #N/A
Country Norway ▼55% 28% ▲17% (n=1266) #N/A #N/A #N/A #N/A #N/A
Sweden ▲63% 24% 13% (n=1148) #N/A #N/A #N/A #N/A #N/A
Denmark 61% 26% 13% (n=1127) #N/A #N/A #N/A #N/A #N/A
Finland 58% ▲30% 12% (n=1277) #N/A #N/A #N/A #N/A #N/A
Total 59% 27% 14% (n=4818) #N/A #N/A #N/A #N/A #N/A
Spending on
electricity in total an
average winter
month
Annual KWh-use
#N/A
#N/A
#N/A
Q: [I look for notifications of changes that affect my electricity price] What information do you read on your electricity bill?
Q: [I look for notifications of changes that affect my electricity price] What information do you read on your electricity bill?
Background variables
Yes
No
I do
n't
bel
ieve
, th
at t
his
info
rmat
ion
is o
n m
y
bill
Val
id N
#N/A
#N/A
0% 20% 40% 60% 80%
103
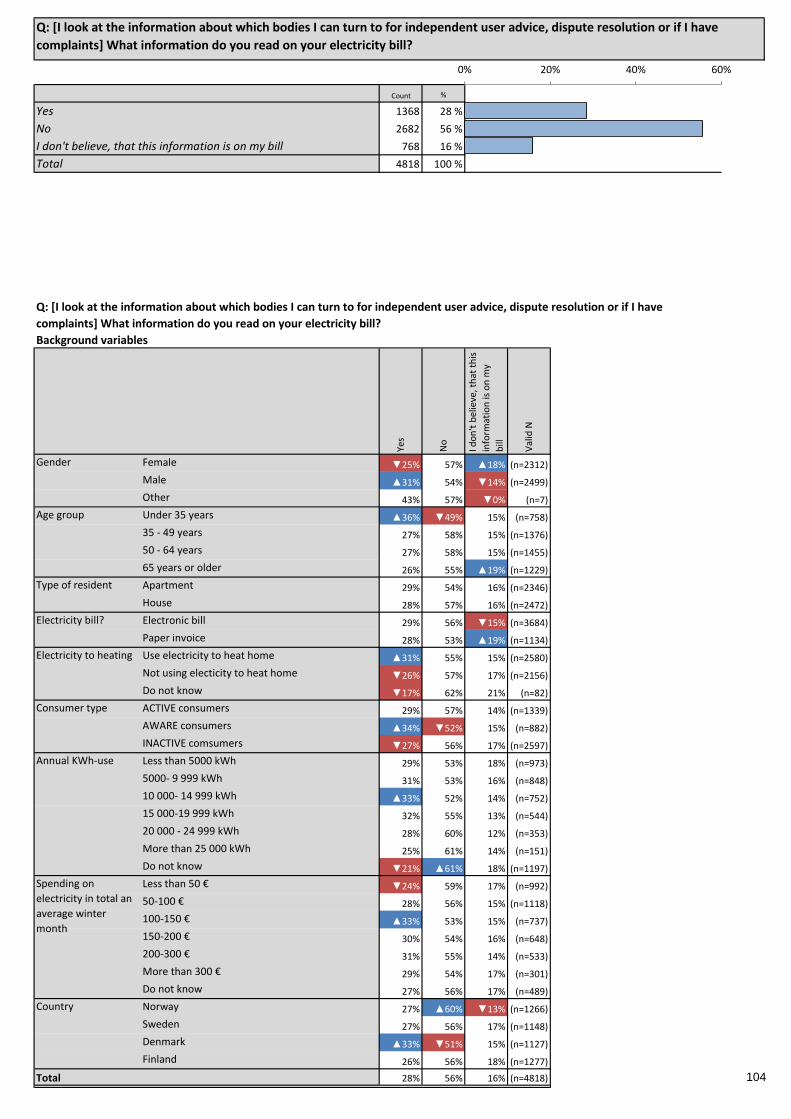
Count %
Yes 1368 28 % 28 %
No 2682 56 % 56 %
I don't believe, that this information is on my bill 768 16 % 16 %
Total 4818 100 % #N/A
#N/A #N/A #N/A
#N/A #N/A #N/A
#N/A #N/A #N/A
#N/A #N/A #N/A
#N/A #N/A #N/A
#N/A #N/A #N/A
#N/A #N/A #N/A
Gender Female ▼25% 57% ▲18% (n=2312) #N/A #N/A #N/A #N/A #N/A
Male ▲31% 54% ▼14% (n=2499) #N/A #N/A #N/A #N/A #N/A
Other 43% 57% ▼0% (n=7) #N/A #N/A #N/A #N/A #N/A
Age group Under 35 years ▲36% ▼49% 15% (n=758) #N/A #N/A #N/A #N/A #N/A
35 - 49 years 27% 58% 15% (n=1376) #N/A #N/A #N/A #N/A #N/A
50 - 64 years 27% 58% 15% (n=1455) #N/A #N/A #N/A #N/A #N/A
65 years or older 26% 55% ▲19% (n=1229) #N/A #N/A #N/A #N/A #N/A
Type of resident Apartment 29% 54% 16% (n=2346) #N/A #N/A #N/A #N/A #N/A
House 28% 57% 16% (n=2472) #N/A #N/A #N/A #N/A #N/A
Electricity bill? Electronic bill 29% 56% ▼15% (n=3684) #N/A #N/A #N/A #N/A #N/A
Paper invoice 28% 53% ▲19% (n=1134) #N/A #N/A #N/A #N/A #N/A
Electricity to heating Use electricity to heat home ▲31% 55% 15% (n=2580) #N/A #N/A #N/A #N/A #N/A
Not using electicity to heat home ▼26% 57% 17% (n=2156) #N/A #N/A #N/A #N/A #N/A
Do not know ▼17% 62% 21% (n=82) #N/A #N/A #N/A #N/A #N/A
Consumer type ACTIVE consumers 29% 57% 14% (n=1339) #N/A #N/A #N/A #N/A #N/A
AWARE consumers ▲34% ▼52% 15% (n=882) #N/A #N/A #N/A #N/A #N/A
INACTIVE comsumers ▼27% 56% 17% (n=2597) #N/A #N/A #N/A #N/A #N/A
Less than 5000 kWh 29% 53% 18% (n=973) #N/A #N/A #N/A #N/A #N/A
5000- 9 999 kWh 31% 53% 16% (n=848) #N/A #N/A #N/A #N/A #N/A
10 000- 14 999 kWh ▲33% 52% 14% (n=752) #N/A #N/A #N/A #N/A #N/A
15 000-19 999 kWh 32% 55% 13% (n=544) #N/A #N/A #N/A #N/A #N/A
20 000 - 24 999 kWh 28% 60% 12% (n=353) #N/A #N/A #N/A #N/A #N/A
More than 25 000 kWh 25% 61% 14% (n=151) #N/A #N/A #N/A #N/A #N/A
Do not know ▼21% ▲61% 18% (n=1197) #N/A #N/A #N/A #N/A #N/A
Less than 50 € ▼24% 59% 17% (n=992) #N/A #N/A #N/A #N/A #N/A
50-100 € 28% 56% 15% (n=1118) #N/A #N/A #N/A #N/A #N/A
100-150 € ▲33% 53% 15% (n=737) #N/A #N/A #N/A #N/A #N/A
150-200 € 30% 54% 16% (n=648) #N/A #N/A #N/A #N/A #N/A
200-300 € 31% 55% 14% (n=533) #N/A #N/A #N/A #N/A #N/A
More than 300 € 29% 54% 17% (n=301) #N/A #N/A #N/A #N/A #N/A
Do not know 27% 56% 17% (n=489) #N/A #N/A #N/A #N/A #N/A
Country Norway 27% ▲60% ▼13% (n=1266) #N/A #N/A #N/A #N/A #N/A
Sweden 27% 56% 17% (n=1148) #N/A #N/A #N/A #N/A #N/A
Denmark ▲33% ▼51% 15% (n=1127) #N/A #N/A #N/A #N/A #N/A
Finland 26% 56% 18% (n=1277) #N/A #N/A #N/A #N/A #N/A
Total 28% 56% 16% (n=4818) #N/A #N/A #N/A #N/A #N/A
Spending on
electricity in total an
average winter
month
Annual KWh-use
#N/A
#N/A
#N/A
Q: [I look at the information about which bodies I can turn to for independent user advice, dispute resolution or if I have
complaints] What information do you read on your electricity bill?
Q: [I look at the information about which bodies I can turn to for independent user advice, dispute resolution or if I have
complaints] What information do you read on your electricity bill?
Background variables
Yes
No
I do
n't
bel
ieve
, th
at t
his
info
rmat
ion
is o
n m
y
bill
Val
id N
#N/A
#N/A
0% 20% 40% 60%
104
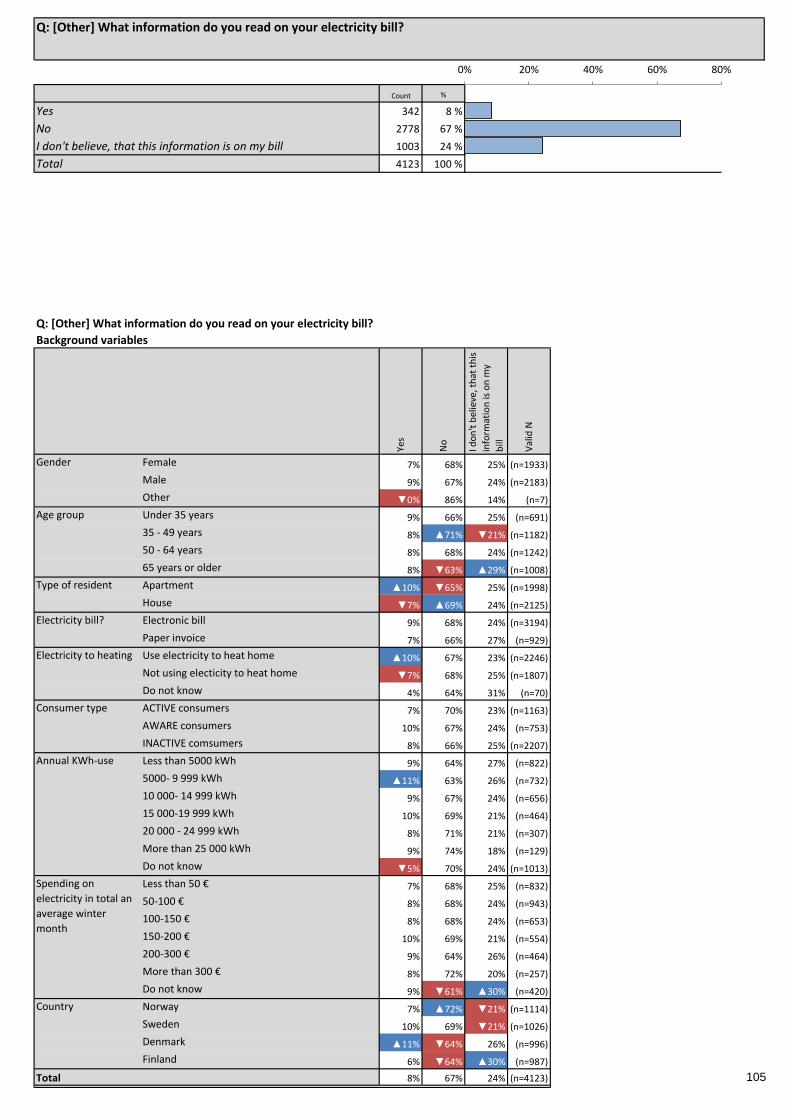
Count %
Yes 342 8 % 8 %
No 2778 67 % 67 %
I don't believe, that this information is on my bill 1003 24 % 24 %
Total 4123 100 % #N/A
#N/A #N/A #N/A
#N/A #N/A #N/A
#N/A #N/A #N/A
#N/A #N/A #N/A
#N/A #N/A #N/A
#N/A #N/A #N/A
#N/A #N/A #N/A
Gender Female 7% 68% 25% (n=1933) #N/A #N/A #N/A #N/A #N/A
Male 9% 67% 24% (n=2183) #N/A #N/A #N/A #N/A #N/A
Other ▼0% 86% 14% (n=7) #N/A #N/A #N/A #N/A #N/A
Age group Under 35 years 9% 66% 25% (n=691) #N/A #N/A #N/A #N/A #N/A
35 - 49 years 8% ▲71% ▼21% (n=1182) #N/A #N/A #N/A #N/A #N/A
50 - 64 years 8% 68% 24% (n=1242) #N/A #N/A #N/A #N/A #N/A
65 years or older 8% ▼63% ▲29% (n=1008) #N/A #N/A #N/A #N/A #N/A
Type of resident Apartment ▲10% ▼65% 25% (n=1998) #N/A #N/A #N/A #N/A #N/A
House ▼7% ▲69% 24% (n=2125) #N/A #N/A #N/A #N/A #N/A
Electricity bill? Electronic bill 9% 68% 24% (n=3194) #N/A #N/A #N/A #N/A #N/A
Paper invoice 7% 66% 27% (n=929) #N/A #N/A #N/A #N/A #N/A
Electricity to heating Use electricity to heat home ▲10% 67% 23% (n=2246) #N/A #N/A #N/A #N/A #N/A
Not using electicity to heat home ▼7% 68% 25% (n=1807) #N/A #N/A #N/A #N/A #N/A
Do not know 4% 64% 31% (n=70) #N/A #N/A #N/A #N/A #N/A
Consumer type ACTIVE consumers 7% 70% 23% (n=1163) #N/A #N/A #N/A #N/A #N/A
AWARE consumers 10% 67% 24% (n=753) #N/A #N/A #N/A #N/A #N/A
INACTIVE comsumers 8% 66% 25% (n=2207) #N/A #N/A #N/A #N/A #N/A
Less than 5000 kWh 9% 64% 27% (n=822) #N/A #N/A #N/A #N/A #N/A
5000- 9 999 kWh ▲11% 63% 26% (n=732) #N/A #N/A #N/A #N/A #N/A
10 000- 14 999 kWh 9% 67% 24% (n=656) #N/A #N/A #N/A #N/A #N/A
15 000-19 999 kWh 10% 69% 21% (n=464) #N/A #N/A #N/A #N/A #N/A
20 000 - 24 999 kWh 8% 71% 21% (n=307) #N/A #N/A #N/A #N/A #N/A
More than 25 000 kWh 9% 74% 18% (n=129) #N/A #N/A #N/A #N/A #N/A
Do not know ▼5% 70% 24% (n=1013) #N/A #N/A #N/A #N/A #N/A
Less than 50 € 7% 68% 25% (n=832) #N/A #N/A #N/A #N/A #N/A
50-100 € 8% 68% 24% (n=943) #N/A #N/A #N/A #N/A #N/A
100-150 € 8% 68% 24% (n=653) #N/A #N/A #N/A #N/A #N/A
150-200 € 10% 69% 21% (n=554) #N/A #N/A #N/A #N/A #N/A
200-300 € 9% 64% 26% (n=464) #N/A #N/A #N/A #N/A #N/A
More than 300 € 8% 72% 20% (n=257) #N/A #N/A #N/A #N/A #N/A
Do not know 9% ▼61% ▲30% (n=420) #N/A #N/A #N/A #N/A #N/A
Country Norway 7% ▲72% ▼21% (n=1114) #N/A #N/A #N/A #N/A #N/A
Sweden 10% 69% ▼21% (n=1026) #N/A #N/A #N/A #N/A #N/A
Denmark ▲11% ▼64% 26% (n=996) #N/A #N/A #N/A #N/A #N/A
Finland 6% ▼64% ▲30% (n=987) #N/A #N/A #N/A #N/A #N/A
Total 8% 67% 24% (n=4123) #N/A #N/A #N/A #N/A #N/A
Spending on
electricity in total an
average winter
month
Annual KWh-use
#N/A
#N/A
#N/A
Q: [Other] What information do you read on your electricity bill?
Q: [Other] What information do you read on your electricity bill?
Background variables
Yes
No
I do
n't
bel
ieve
, th
at t
his
info
rmat
ion
is o
n m
y
bill
Val
id N
#N/A
#N/A
0% 20% 40% 60% 80%
105
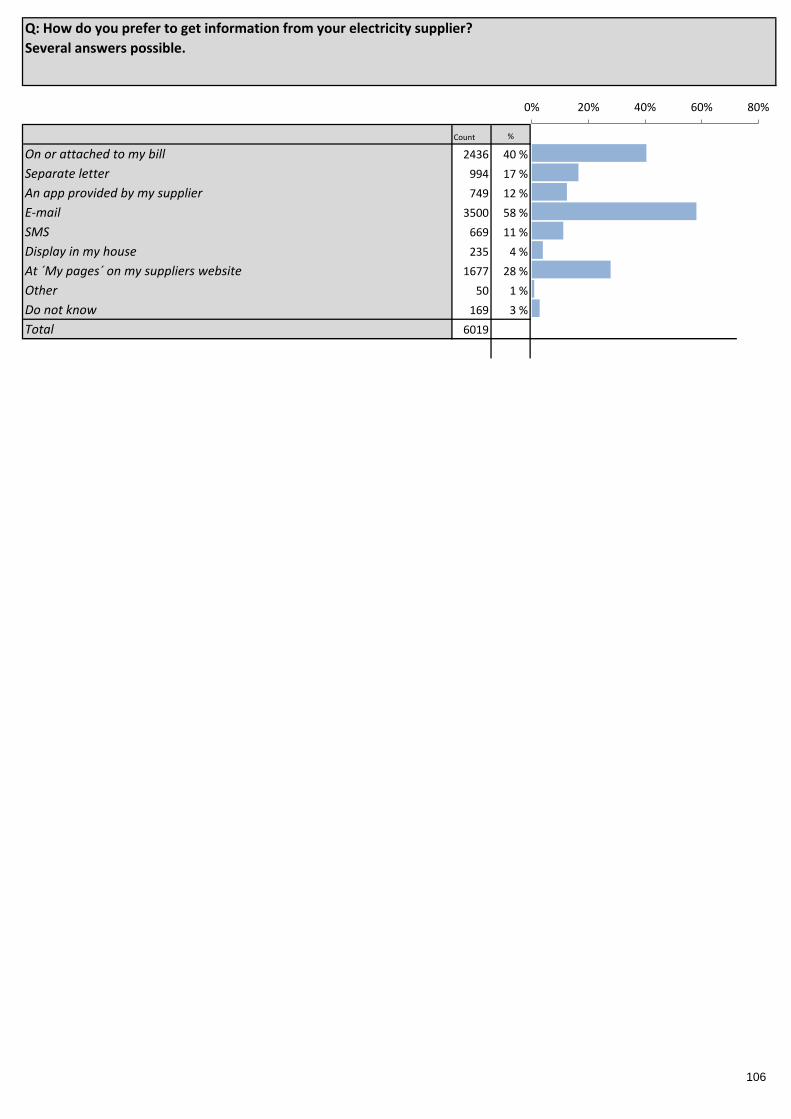
Count %
On or attached to my bill 2436 40 % 40 % 40 %
Separate letter 994 17 % 17 % 17 %
An app provided by my supplier 749 12 % 12 % 12 %
E-mail 3500 58 % 58 % 58 %
SMS 669 11 % 11 % 11 %
Display in my house 235 4 % 4 % 4 %
At ´My pages´ on my suppliers website 1677 28 % 28 % 28 %
Other 50 1 % 1 % 1 %
Do not know 169 3 % 3 % 3 %
Total 6019
#N/A #N/A
#N/A #N/A #N/A
#N/A #N/A #N/A
#N/A #N/A #N/A
#N/A #N/A #N/A
#N/A #N/A #N/A
#N/A #N/A #N/A
#N/A #N/A #N/A
#N/A #N/A #N/A
Q: How do you prefer to get information from your electricity supplier?
Several answers possible.
0% 20% 40% 60% 80%
106

Gender Female 42% 18% ▼11% ▼56% 11% ▼3% ▼26% 1% ▲3% (n=2981) #N/A
Male 39% ▼15% ▲14% ▲60% 11% ▲5% ▲30% 1% ▼2% (n=3027) #N/A
Other 45% 27% 9% 55% ▼0% ▼0% 45% ▼0% 9% (n=11) #N/A
Age group Under 35 years 39% 18% ▲19% ▼54% ▲17% ▲7% 28% 0% 4% (n=1041) #N/A
35 - 49 years 39% 17% ▲16% 57% ▲13% 5% 29% 1% 4% (n=1832) #N/A
50 - 64 years 41% 17% ▼10% 59% 9% ▼3% 28% 1% 3% (n=1758) #N/A
65 years or older 43% 15% ▼6% ▲62% ▼6% ▼2% 26% 0% ▼1% (n=1388) #N/A
Type of resident Apartment 41% ▲20% 11% 57% 11% ▼3% 26% 1% 3% (n=3013) #N/A
House 40% ▼14% 14% 59% 12% ▲5% 29% 1% 3% (n=3006) #N/A
Electricity bill? Electronic bill ▼36% ▼12% ▲14% ▲63% 11% 4% ▲31% 1% 3% (n=4615) #N/A
Paper invoice ▲54% ▲31% ▼8% ▼41% 13% 4% ▼19% 1% 3% (n=1404) #N/A
Electricity to heating Use electricity to heat home 40% ▼15% ▲14% 58% ▲13% 4% ▲29% 1% 2% (n=3127) #N/A
Not using electicity to heat home 41% 18% ▼11% 59% ▼9% 3% 27% 1% 3% (n=2765) #N/A
Do not know 46% ▲28% 9% 49% 6% 4% ▼19% ▼0% 7% (n=127) #N/A
Consumer type ACTIVE consumers ▲44% 16% 11% 60% 12% 3% 29% 1% ▼2% (n=1540) #N/A
AWARE consumers 43% 16% 14% ▲63% 13% 4% ▲35% 1% ▼1% (n=966) #N/A
INACTIVE comsumers ▼38% 17% 12% ▼56% 10% 4% ▼25% 1% ▲4% (n=3513) #N/A
Annual KWh-use Less than 5000 kWh 42% 17% 11% ▲62% ▼9% 3% 29% 1% 2% (n=1146) #N/A
5000- 9 999 kWh 38% 15% 13% 60% 11% 4% 29% 1% ▼1% (n=1011) #N/A
10 000- 14 999 kWh 43% 16% 14% 58% 12% 5% 29% 1% ▼1% (n=875) #N/A
15 000-19 999 kWh 43% 17% 15% 57% 12% 5% 31% 1% 2% (n=619) #N/A
20 000 - 24 999 kWh 41% ▼12% ▲17% 62% 14% 5% 32% 0% ▼1% (n=399) #N/A
More than 25 000 kWh 48% 13% 19% 59% ▲19% 5% 33% ▼0% 1% (n=165) #N/A
Do not know ▼38% 19% ▼9% ▼54% 11% 3% ▼24% 1% ▲6% (n=1804) #N/A
Less than 50 € 43% ▲20% ▼9% 58% ▼9% ▼2% 26% 1% 3% (n=1281) #N/A
50-100 € 40% 15% 14% 59% 11% 5% 28% 1% ▼2% (n=1363) #N/A
100-150 € 39% 15% 13% ▲62% 12% 5% 28% 1% ▼1% (n=907) #N/A
150-200 € 43% 15% 13% 62% ▲14% 4% 30% ▼0% 2% (n=772) #N/A
200-300 € 43% 18% ▲18% ▼51% 14% 5% 32% 1% 2% (n=615) #N/A
More than 300 € 41% 16% 12% 58% 13% 5% 32% 0% ▼1% (n=346) #N/A
Do not know ▼33% 16% 10% 55% 9% ▼2% ▼24% 1% ▲9% (n=735) #N/A
Country Norway 41% ▼9% ▲15% ▲65% ▲15% 3% ▲31% 0% ▼2% (n=1506) #N/A
Sweden ▲44% 19% ▼10% ▼47% ▼9% 4% 26% 1% 4% (n=1501) #N/A
Denmark ▼29% ▼11% ▲17% ▲62% 10% 5% 31% 1% 3% (n=1508) #N/A
Finland ▲48% ▲28% ▼8% 58% 10% 3% ▼24% 1% 2% (n=1504) #N/A
Total 40% 17% 12% 58% 11% 4% 28% 1% 3% (n=6019) #N/A
Val
id N
#N/A
Spending on electricity in
total an average winter
month
Q: How do you prefer to get information from your electricity supplier?
Several answers possible.
Background
On
or
atta
ched
to
my
bill
Sep
arat
e le
tter
An
ap
p p
rovi
ded
by
my
sup
plie
r
E-m
ail
SMS
Dis
pla
y in
my
ho
use
At
´My
pag
es´
on
my
sup
plie
rs
web
site
Oth
er
Do
no
t kn
ow
107