Embed Size (px)
Citation preview

Nordic Customer Survey 2018
Consumer behavior in the Nordic electricity market
Sentio Research AS Main Report 15.11.2018

1
Content List of Figures ........................................................................................................................................... 2
Introduction ............................................................................................................................................. 6
Background .......................................................................................................................................... 6
About the report ................................................................................................................................. 6
Executive summary ................................................................................................................................. 6
Method .................................................................................................................................................... 7
Questionnaire ...................................................................................................................................... 7
Data collection ..................................................................................................................................... 7
The sample .......................................................................................................................................... 8
Main findings ........................................................................................................................................... 9
Presentation of the Sample ................................................................................................................... 13
Customer profiles .............................................................................................................................. 14
Differences and Similarities between the Nordic countries.................................................................. 15
The Nordic Customers’ presence in the electricity market ............................................................... 15
The Nordic Customers’ knowledge of the electricity market ........................................................... 18
The Nordic Customers’ participation in the electricity market ......................................................... 23
The Nordic Customers’ attitudes towards the electricity market ..................................................... 46
The Danish Customers ........................................................................................................................... 53
The Danish Customers’ presence in the electricity market .............................................................. 53
The Danish Customers’ knowledge of the electricity market ........................................................... 55
The Danish Customers’ participation in the electricity market......................................................... 59
The Danish Customers’ attitudes towards the electricity market .................................................... 74
The Finnish Customers .......................................................................................................................... 80
The Finnish Customers’ presence in the electricity market .............................................................. 80
The Finnish Customers’ knowledge of the electricity market ........................................................... 82
The Finnish Customers’ participation in the electricity market ........................................................ 86
The Finnish Customers’ attitudes towards the electricity market .................................................. 102
The Norwegian Customers .................................................................................................................. 108
The Norwegian Customers’ presence in the electricity market ...................................................... 108
The Norwegian Customers’ knowledge of the electricity market ................................................... 110
The Norwegian Customers’ participation in the electricity market ................................................ 114
The Norwegian Customers’ attitudes towards the electricity market ............................................ 131
The Swedish Customers ...................................................................................................................... 138
The Swedish Customers’ presence in the electricity market .......................................................... 138

2
The Swedish Customers’ knowledge of the electricity market ....................................................... 140
The Swedish Customers’ participation in the electricity market .................................................... 144
The Swedish Customers’ attitudes towards the electricity market ................................................ 160
List of Figures Figure 1: Margins of error. ................................................................................................................................................................................. 8
Figure 2: Background. ...................................................................................................................................................................................... 13
Figure 3: Costumer profiles. ............................................................................................................................................................................. 14
Figure 4: Do you use electricity to heat your home? N=6019. ......................................................................................................................... 15
Figure 5: Approximately how many kilowatt-hours do you use each year? N=6019. ...................................................................................... 16
Figure 6: How much money do you spend on electricity in total (supplier cost, grid cost and taxes) an average winter month? N=6019. .... 17
Figure 7: Do you believe the following statements are correct or not? Share that believes the statements are correct. N=6019. ................. 18
Figure 8: Name the company that operates the power lines to your home. N=6019 ...................................................................................... 19
Figure 9: Who is the electricity supplier in your home? N=6014. .................................................................................................................... 20
Figure 10: Can you name two other electricity suppliers? N=6019. ................................................................................................................. 21
Figure 11: Total knowledge of electricity suppliers. N=6019. .......................................................................................................................... 21
Figure 12: Total knowledge of the electricity market. N=6019. ....................................................................................................................... 22
Figure 13: Have you ever signed a new contract with an electricity supplier? N=6019. .................................................................................. 23
Figure 14: When did you last sign a new contract with an electricity supplier? N=4697. ................................................................................ 24
Figure 15: Why did you sign a new electricity contract? Several answers possible. N=3099. .......................................................................... 25
Figure 16: Why did you sign a new electricity contract? Top 5 results by country........................................................................................... 26
Figure 17: Have you ever compared your current electricity contract to other contracts? N=4479. ............................................................... 27
Figure 18: When did you last compare your current electricity contract to other contracts? N=2482. ........................................................... 28
Figure 19: You have compared different offers but decided to stay in your current contract. Why? Several answers possible. N=2109. ...... 29
Figure 20: You have compared different offers but decided to stay in your current contract. Why? Top 5 results by country. ...................... 30
Figure 21: Why have you not switched or compared contracts more often? Several answers possible. N=373. ............................................ 31
Figure 22: Why have you not switched or compared contracts more often? Top 5 results by country. .......................................................... 32
Figure 23: Why have you never switched or compared contracts? Several answers possible. N=844. ............................................................ 33
Figure 24: Why have you never switched or compared contracts? Top 5 results by country. ......................................................................... 34
Figure 25: Who initiated the signing of your current contract? N=6019. ......................................................................................................... 35
Figure 26: How did you go about choosing electricity contract? Several answers possible. N=4392. .............................................................. 36
Figure 27: How did they contact you? N=915. ................................................................................................................................................. 37
Figure 28: Before you made your current choice of electricity contract, to what extent did you experience the following …? Standardized
mean: 0=No experience and 100=High extent. “Do not know” is excluded. N=2762-3013. ............................................................................ 38
Figure 29: If you in the future would like to choose an electricity contract, to what extent do you agree that… ? Standardized mean: 0=No
experience and 100=High extent. “Do not know” is excluded. N=2549-2686. ................................................................................................. 40
Figure 30: When you signed/compared your current electricity contract, did you visit an online comparison tool? N=3099. ........................ 41
Figure 31: What comparison tool(s) did you visit? Several answers possible. Results by country. N=1455. .................................................... 42
Figure 32: Do you know any of any online comparison tools for electricity contracts? N=2920. ..................................................................... 43
Figure 33: What comparison tool(s) have you visited online? Several answers possible. Results by country. N=1118. .................................. 44
Figure 34: When you think of your current electricity contract, are you aware of …? Share that has answered “Yes”. N=6019. .................... 45
Figure 35: To what extent do you agree with the following statements …? Standardized mean: 0=Fully disagree and 100=Fully agree. “Do
not know” is excluded. N=4066-5700. ............................................................................................................................................................. 46
Figure 36: To what extent do you agree with the following statements …? Standardized mean: 0=Fully disagree and 100=Fully agree. “Do
not know” is excluded. N=5700-5806. ............................................................................................................................................................. 47
Figure 37: How do you receive your electricity bill? N=6019. .......................................................................................................................... 48
Figure 38: Do you read the information presented on your electricity bill? N=6019. ...................................................................................... 48
Figure 39: What information do you read on your electricity bill? Share that has answered “Yes”. N=4818. ................................................. 49
Figure 40: How do you prefer to get information from your Electricity supplier? Several answers possible. N=6019. ................................... 51
Figure 41: Do you use electricity to heat your home? N=1508. ....................................................................................................................... 53
Figure 42: Approximately how many kilowatt-hours do you use each year? N=1508. .................................................................................... 53
Figure 43: How much money do you spend on electricity in total (supplier cost, grid cost and taxes) an average winter month? N=1508. .. 54
Figure 44: Do you believe the following statements are correct or not? Share that believes the statements are correct. N=1508. ............... 55
Figure 45: Name the company that operates the power lines to your home. N=1508. ................................................................................... 56
Figure 46: Who is the electricity supplier in your home? N=1507. .................................................................................................................. 56
Figure 47: Can you name two other electricity suppliers? N=1508. ................................................................................................................. 57
Figure 48: Total knowledge of electricity suppliers. N=1508. .......................................................................................................................... 57

3
Figure 49: Total knowledge of the electricity market. N=1508. ....................................................................................................................... 58
Figure 50: Have you ever signed a new contract with an electricity supplier? N=1508. .................................................................................. 59
Figure 51: When did you last sign a new contract with an electricity supplier? N=880. .................................................................................. 59
Figure 52: Why did you sign a new electricity contract? Several answers possible. N=570. ............................................................................ 60
Figure 53: Have you ever compared your current electricity contract to other contracts? N=1261. ............................................................... 61
Figure 54: When did you last compare your current electricity contract to other contracts? N=583. ............................................................. 62
Figure 55: You have compared different offers but decided to stay in your current contract. Why? Several answers possible. N=486. ........ 63
Figure 56: Why have you not switched or compared contracts more often? Several answers possible. N=97. .............................................. 64
Figure 57: Why have you never switched or compared contracts? Several answers possible. N=431. ............................................................ 65
Figure 58: Who initiated the signing of your current contract? N=1508. ......................................................................................................... 66
Figure 59: How did you go about choosing electricity contract? Several answers possible. N=912. ................................................................ 67
Figure 60: How did they contact you? N=227. ................................................................................................................................................. 68
Figure 61: Before you made your current choice of electricity contract, to what extent did you experience the following …? Standardized
mean: 0=No experience and 100=High extent. “Do not know” is excluded. N=481-544. ................................................................................ 69
Figure 62: If you in the future would like to choose an electricity contract, to what extent do you agree that…? Standardized mean: 0=No
experience and 100=High extent. “Do not know” is excluded. N=778-855. ..................................................................................................... 70
Figure 63: When you signed/compared your current electricity contract, did you visit an online comparison tool? N=570. .......................... 71
Figure 64: What comparison tool(s) did you visit? Several answers possible. N=217. ..................................................................................... 71
Figure 65: Do you know any of any online comparison tools for electricity contracts? N=938. ....................................................................... 72
Figure 66: What comparison tool(s) have you visited online? Several answers possible. N=306..................................................................... 72
Figure 67: When you think of your current electricity contract, are you aware of …? Share that has answered “Yes”. N=1508. .................... 73
Figure 68: To what extent do you agree with the following statements …? Standardized mean: 0=Fully disagree and 100=Fully agree. “Do
not know” is excluded. N=840-1391. ............................................................................................................................................................... 74
Figure 69: To what extent do you agree with the following statements …? Standardized mean: 0=Fully disagree and 100=Fully agree. “Do
not know” is excluded. N=1411-1420. ............................................................................................................................................................. 75
Figure 70: How do you receive your electricity bill? N=1508. .......................................................................................................................... 76
Figure 71: Do you read the information presented on your electricity bill? N=1508. ...................................................................................... 76
Figure 72: What information do you read on your electricity bill? Share that has answered “Yes”. N=1127. ................................................. 77
Figure 73: How do you prefer to get information from your Electricity supplier? Several answers possible. N=1508. ................................... 78
Figure 74: Do you use electricity to heat your home? N=1504. ....................................................................................................................... 80
Figure 75: Approximately how many kilowatt-hours do you use each year? N=1504. .................................................................................... 80
Figure 76: How much money do you spend on electricity in total (supplier cost, grid cost and taxes) an average winter month? N=1504. .. 81
Figure 77: Do you believe the following statements are correct or not? Share that believes the statements are correct. N=1504. ............... 82
Figure 78: Name the company that operates the power lines to your home. N=1504. ................................................................................... 83
Figure 79: Who is the electricity supplier in your home? N=1502. .................................................................................................................. 83
Figure 80: Can you name two other electricity suppliers? N=1504. ................................................................................................................. 84
Figure 81: Total knowledge of electricity suppliers. N=1504. .......................................................................................................................... 84
Figure 82: Total knowledge of the electricity market. N=1504. ....................................................................................................................... 85
Figure 83: Have you ever signed a new contract with an electricity supplier? N=1504. .................................................................................. 86
Figure 84: When did you last sign a new contract with an electricity supplier? N=1309. ................................................................................ 86
Figure 85: Why did you sign a new electricity contract? Several answers possible. N=967. ............................................................................ 87
Figure 86: Have you ever compared your current electricity contract to other contracts? N=994. ................................................................. 88
Figure 87: When did you last compare your current electricity contract to other contracts? N=610. ............................................................. 89
Figure 88: You have compared different offers but decided to stay in your current contract. Why? Several answers possible. N=550. ........ 90
Figure 89: Why have you not switched or compared contracts more often? Several answers possible. N=60. .............................................. 91
Figure 90: Why have you never switched or compared contracts? Several answers possible. N=89. .............................................................. 92
Figure 91: Who initiated the signing of your current contract? N=1504. ......................................................................................................... 93
Figure 92: How did you go about choosing electricity contract? Several answers possible. N=1199. .............................................................. 94
Figure 93: How did they contact you? N=240. ................................................................................................................................................. 95
Figure 94: Before you made your current choice of electricity contract, to what extent did you experience the following …? Standardized
mean: 0=No experience and 100=High extent. “Do not know” is excluded. N=925-951. ................................................................................ 96
Figure 95: If you in the future would like to choose an electricity contract, to what extent do you agree that… ? Standardized mean: 0=No
experience and 100=High extent. “Do not know” is excluded. N=505-519. ..................................................................................................... 97
Figure 96: When you signed/compared your current electricity contract, did you visit an online comparison tool? N=967. .......................... 98
Figure 97: What comparison tool(s) did you visit? Several answers possible. N=499. ..................................................................................... 99
Figure 98: Do you know any of any online comparison tools for electricity contracts? N=537. ....................................................................... 99
Figure 99: What comparison tool(s) have you visited online? Several answers possible. N=185................................................................... 100
Figure 100: When you think of your current electricity contract, are you aware of …? Share that has answered “Yes”. N=1504. ................ 101
Figure 101: To what extent do you agree with the following statements …? Standardized mean: 0=Fully disagree and 100=Fully agree. “Do
not know” is excluded. N=1126 1463. ........................................................................................................................................................... 102
Figure 102: To what extent do you agree with the following statements …? Standardized mean: 0=Fully disagree and 100=Fully agree. “Do
not know” is excluded. N=1465-1482. ........................................................................................................................................................... 103

4
Figure 103: How do you receive your electricity bill? N=1504. ...................................................................................................................... 103
Figure 104: Do you read the information presented on your electricity bill? N=1504. .................................................................................. 104
Figure 105: What information do you read on your electricity bill? Share that has answered “Yes”. N=1277. ............................................. 105
Figure 106: How do you prefer to get information from your Electricity supplier? Several answers possible. N=1504................................. 106
Figure 107: Do you use electricity to heat your home? N=1506. ................................................................................................................... 108
Figure 108: Approximately how many kilowatt-hours do you use each year? N=1506. ................................................................................ 108
Figure 109: How much money do you spend on electricity in total (supplier cost, grid cost and taxes) an average winter month? N=1506.109
Figure 110: Do you believe the following statements are correct or not? Share that believes the statements are correct. N=1506. ........... 110
Figure 111: Name the company that operates the power lines to your home. N=1506. ............................................................................... 111
Figure 112: Who is the electricity supplier in your home? N=1506. .............................................................................................................. 111
Figure 113: Can you name two other electricity suppliers? N=1506. ............................................................................................................. 112
Figure 114: Total knowledge of electricity suppliers. N=1506. ...................................................................................................................... 112
Figure 115: Total knowledge of the electricity market. N=1506. ................................................................................................................... 113
Figure 116: Have you ever signed a new contract with an electricity supplier? N=1506. .............................................................................. 114
Figure 117: When did you last sign a new contract with an electricity supplier? N=1289. ............................................................................ 115
Figure 118: Why did you sign a new electricity contract? Several answers possible. N=774. ........................................................................ 116
Figure 119: Have you ever compared your current electricity contract to other contracts? N=1115. ........................................................... 117
Figure 120: When did you last compare your current electricity contract to other contracts? N=643. ......................................................... 118
Figure 121: You have compared different offers but decided to stay in your current contract. Why? Several answers possible. N=553. .... 119
Figure 122: Why have you not switched or compared contracts more often? Several answers possible. N=90. .......................................... 120
Figure 123: Why have you never switched or compared contracts? Several answers possible. N=143. ........................................................ 121
Figure 124: Who initiated the signing of your current contract? N=1506. ..................................................................................................... 122
Figure 125: How did you go about choosing electricity contract? Several answers possible. N=1113. .......................................................... 123
Figure 126: How did they contact you? N=243. ............................................................................................................................................. 124
Figure 127: Before you made your current choice of electricity contract, to what extent did you experience the following …? Standardized
mean: 0=No experience and 100=High extent. “Do not know” is excluded. N=669-753. .............................................................................. 125
Figure 128: If you in the future would like to choose an electricity contract, to what extent do you agree that… ? Standardized mean: 0=No
experience and 100=High extent. “Do not know” is excluded. N=644-678. ................................................................................................... 126
Figure 129: When you signed/compared your current electricity contract, did you visit an online comparison tool? N=774. ...................... 127
Figure 130: What comparison tool(s) did you visit? Several answers possible. N=317. ................................................................................. 128
Figure 131: Do you know any of any online comparison tools for electricity contracts? N=732. ................................................................... 128
Figure 132: What comparison tool(s) have you visited online? Several answers possible. N=317. ................................................................ 129
Figure 133: When you think of your current electricity contract, are you aware of …? Share that has answered “Yes”. N=1506. ................ 130
Figure 134: To what extent do you agree with the following statements …? Standardized mean: 0=Fully disagree and 100=Fully agree. “Do
not know” is excluded. N=1043-1409. ........................................................................................................................................................... 131
Figure 135: To what extent do you agree with the following statements …? Standardized mean: 0=Fully disagree and 100=Fully agree. “Do
not know” is excluded. N=1437-1453. ........................................................................................................................................................... 132
Figure 136: If you should switch supplier, how important would it be to get all electricity costs on one bill instead of two separate bills from
the supplier and the network company? N=1506. ......................................................................................................................................... 133
Figure 137: How do you receive your electricity bill? N=1506. ...................................................................................................................... 133
Figure 138: Do you read the information presented on your electricity bill? N=1506. .................................................................................. 134
Figure 139: What information do you read on your electricity bill? Share that has answered “Yes”. N=1266. ............................................. 135
Figure 140: How do you prefer to get information from your Electricity supplier? Several answers possible. N=1506................................. 136
Figure 141: Do you use electricity to heat your home? N=1501. ................................................................................................................... 138
Figure 142: Approximately how many kilowatt-hours do you use each year? N=1501. ................................................................................ 138
Figure 143: How much money do you spend on electricity in total (supplier cost, grid cost and taxes) an average winter month? N=1501.139
Figure 144: Do you believe the following statements are correct or not? Share that believes the statements are correct. N=1501. ........... 140
Figure 145: Name the company that operates the power lines to your home. N=1501. ............................................................................... 141
Figure 146: Who is the electricity supplier in your home? N=1499. .............................................................................................................. 141
Figure 147: Can you name two other electricity suppliers? N=1501. ............................................................................................................. 142
Figure 148: Total knowledge of electricity suppliers. N=1501. ...................................................................................................................... 142
Figure 149: Total knowledge of the electricity market. N=1501. ................................................................................................................... 143
Figure 150: Have you ever signed a new contract with an electricity supplier? N=1501. .............................................................................. 144
Figure 151: When did you last sign a new contract with an electricity supplier? N=1219. ............................................................................ 144
Figure 152: Why did you sign a new electricity contract? Several answers possible. N=788. ........................................................................ 145
Figure 153: Have you ever compared your current electricity contract to other contracts? N=1109. ........................................................... 146
Figure 154: When did you last compare your current electricity contract to other contracts? N=646. ......................................................... 147
Figure 155: You have compared different offers but decided to stay in your current contract. Why? Several answers possible. N=520. .... 148
Figure 156: Why have you not switched or compared contracts more often? Several answers possible. N=126. ........................................ 149
Figure 157: Why have you never switched or compared contracts? Several answers possible. N=181. ........................................................ 150
Figure 158: Who initiated the signing of your current contract? N=1501. ..................................................................................................... 151
Figure 159: How did you go about choosing electricity contract? Several answers possible. N=1168. .......................................................... 152
5
Figure 160: How did they contact you? N=205. ............................................................................................................................................. 153
Figure 161: Before you made your current choice of electricity contract, to what extent did you experience the following …? Standardized
mean: 0=No experience and 100=High extent. “Do not know” is excluded. N=682-765. .............................................................................. 154
Figure 162: If you in the future would like to choose an electricity contract, to what extent do you agree that… ? Standardized mean: 0=No
experience and 100=High extent. “Do not know” is excluded. N=622-651. ................................................................................................... 155
Figure 163: When you signed/compared your current electricity contract, did you visit an online comparison tool? N=788. ...................... 156
Figure 164: What comparison tool(s) did you visit? Several answers possible. N=422. ................................................................................. 157
Figure 165: Do you know any of any online comparison tools for electricity contracts? N=713. ................................................................... 157
Figure 166: What comparison tool(s) have you visited online? Several answers possible. N=310. ................................................................ 158
Figure 167: When you think of your current electricity contract, are you aware of …? Share that has answered “Yes”. N=1501. ................ 159
Figure 168: To what extent do you agree with the following statements …? Standardized mean: 0=Fully disagree and 100=Fully agree. “Do
not know” is excluded. N=1057-1445. ........................................................................................................................................................... 160
Figure 169: To what extent do you agree with the following statements …? Standardized mean: 0=Fully disagree and 100=Fully agree. “Do
not know” is excluded. N=1437-1451. ........................................................................................................................................................... 161
Figure 170: How do you receive your electricity bill? N=1501. ...................................................................................................................... 162
Figure 171: Do you read the information presented on your electricity bill? N=1501. .................................................................................. 162
Figure 172: What information do you read on your electricity bill? Share that has answered “Yes”. N=1148. ............................................. 163
Figure 173: How do you prefer to get information from your Electricity supplier? Several answers possible. N=1501................................. 164

6
Introduction
Background In order to facilitate evidence-based policy making NordREG (organisation for the Nordic energy
regulators) believes that it will be valuable to increase the knowledge of how Nordic electricity
customers experience their situation. This is considered important when a harmonized Nordic retail
market is developed.
The purpose of the Customer Survey 2018 has been to explore customers’ views and experiences of
the four Nordic electricity markets in Denmark, Finland, Norway and Sweden. The study consists of a
survey for 1 500 participants in each of these countries, which means a total of 6 000 participants.
The study was conducted by Sentio Research on behalf of NordREG in 2018.
About the report The report is divided into five minor reports; one summarizing the results in total and focusing on
differences and similarities between the four Nordic countries; and one report for each of the four
countries focusing both on the main results for the specific country and differences between various
subgroups of the population.
In addition, both the Nordic report and the four country reports focus on differences and similarities
between the following three costumer profiles: Active customers, aware customers and inactive
customers (described in the presentation of the sample).
All five reports follow the same structure: The customers’ presence in the electricity market; the
customers’ knowledge of the electricity market; the customers’ participation in the electricity market;
and the customers’ attitude towards the electricity market.
Executive summary The results are based on a web survey among a representative sample of 6,000 Nordic electricity
customers; 1,500 respondents from each of the countries Denmark, Finland, Norway and Sweden. All
respondents participate in the decision-making regarding the electricity contract in one’s household.
78 per cent of the Nordic customers have signed a new contract with an electricity supplier, and 33
per cent of these did so during the last 12 months (so-called active customers). First and foremost,
the costumers signed a new contract to save money. Finnish customers are the most active ones,
whilst Danish are the least active.
Amongst those who have not made a switch in at least one year, 55 per cent have compared
contracts. 39 per cent of these customers did a comparison during the last 12 months (so-called
aware customers). The customers decided to stay in their current contract mainly because they were
satisfied or because there was little or no saving from switching. Finnish and Norwegian customers
are the most aware ones, whilst Danish and Swedish are the least aware.
Amongst those who have neither signed nor compared contracts the last year (so-called inactive
customers), the most common reasons given for not switching/comparing are satisfaction with one’s
current contract and only minor financial gains. The Danish customers are the most inactive ones.

7
All in all, the Danish customers differ from the other Nordic customers when it comes to using less
electricity; having a lower level of activity in the electricity market; having less knowledge both of
terms of contracts and of the electricity market as such; and having lower confidence in the
electricity market. Finnish and Swedish customers are quite similar when it comes to consumption,
activity level and reasons for (not) switching/comparing contracts. Norwegian customers stand out
with a much higher consumption of electricity, compared to others. In addition, the Norwegian
customers find the switching process somewhat easier than the others.
In addition to signing contracts most recently, the active customers are characterized by spending the
least on electricity; having the best knowledge of the electricity market; and finding it most easy to
switch contracts. In addition to regularly comparing contracts, the aware customers are
characterized by having the biggest consumption of electricity; having the best knowledge of their
terms of contract; reading the most information on their bill; and being most positive about making a
switch of contracts in the future. The inactive customers are characterized, not only by rarely
switching and comparing contracts, but also by knowing the least about their own electricity
consumption; having the poorest knowledge of the electricity market as such and their own terms of
contract; reading the least information on their bill; and finding it most difficult to switch contracts.
When it comes to gender and age differences, these can be summed up as follows: Men are
somewhat more aware electricity customers than women; they more often compare contracts, more
often initiate the contract themselves, know more about both the electricity market and their
contractual terms, read more of the information on the bill and find the switching process easier. The
younger electricity customers have the poorest knowledge of the electricity market and their own
contractual terms, find it more difficult to sign contracts and read the least information on their bill.
Method The study is a quantitative survey consisting of 6,000 respondents; 1,500 from each of the four
Nordic countries. All respondents were above the age of 25 and stated that they were part of the
decision-making regarding the electricity contract in their household. The results are representative
for Danish, Finnish, Norwegian and Swedish electricity customers above the age of 25 with access to
the internet.
Questionnaire The questionnaire was prepared by Sentio and NordREG in English. The final questionnaire consisted
of approximately 30 questions regarding both current suppliers and contracts; signing and comparing
of contracts; use of comparison tools; terms of contracts; billing and information; and general
knowledge about the electricity market.
The questionnaire was translated into Danish, Finnish, Norwegian and Swedish by NordREG. The
respondents had the opportunity to choose language themselves. Both the original English
questionnaire and the four translated questionnaires can be studied in the appendix.
Data collection The survey was conducted on web, among a pre-recruited web panel of respondents willing to
participate in different surveys. In the invitation to the survey it was specified that the survey was
about signing of electricity contracts and that only respondents participating in decision-making

8
regarding electricity in the household were to answer the survey. In addition, there were two control
questions in the beginning of the survey, which screened out those who did not participate in
decision-making regarding electricity contracts and those who either answered that electricity was
included in their rent or that they did not know how they received their bill.
A pilot survey consisting of 400 respondents, 100 from each country, was conducted august 24-25.
After the pilot survey some minor chances in the questionnaire were made, mainly screening
adjustments and some added categories.
The main survey was conducted in the period from September 5 to September 24.
The sample Since we do not know the exact population of Nordic electricity customers participating in decision-
making regarding electricity, the data cannot be weighed against population numbers. However,
since each of the four samples have been randomly drawn, we can state that they are
representative.
In all sample surveys one needs to consider the margins of error. These depend on the sample size as
well as the results. The more heterogenous sample, the bigger the margins of error. In this survey,
with a sample of 6,000 respondents, the margins of error will vary from +/- 0,8 percentage points to
+/- 1,3 percentage points, in a total distribution. When the results are broken down on subgroups,
such as country and other background variables, the margins of error will be greater. The figure
shows the margins of error given different sample sizes and different distributions.
Figure 1: Margins of error.

9
Main findings Costumer profiles
• 26 per cent of the electricity customers have signed a contract in the past year and are
considered active customers.
• 16 per cent have compared contracts in the past year without switching and are so-called
aware customers.
• 58 per cent have neither switched nor compared contracts in the past year and are inactive
customers.
• The share of active customers is highest in Finland. Norway and Finland have the highest
shares of aware customers. We find the highest share of inactive customers in Denmark.
The customers’ presence in the electricity market
• 52 per cent of the respondents use electric heating at home. In Norway, 91 per cent use
electric heating. In Sweden, the share is 52 per cent and in Finland 40 per cent. In Denmark,
only 24 per cent use electricity for heating purposes.
• 10 per cent of the Nordic electricity customers use 20,000 kWh electricity or more per year;
25 per cent use between 10,000 and 19,999 kWh; and 36 per cent use less than 10,000 kWh.
Norwegian customers have the by far highest electricity consumption, while Danes have the
lowest. Sweden and Finland have similar consumption patterns.
• 16 per cent spend more than EUR 200 on electricity in the course of a normal winter month.
28 per cent spend between EUR 100 and 200, while a total of 44 per cent spend less than
EUR 100. In Norway, electricity customers spend the most on electricity, compared to the
other countries.
The customers’ knowledge of the electricity market
• 91 per cent know that they themselves can choose electricity supplier; 49 per cent believe
that if one switches to another supplier, the new supplier will be in charge of meter reading;
25 per cent believe that the electricity supplier is determined by where one lives; nine per
cent believe that a switch of electricity supplier will affect the number of power cuts; seven
per cent believe it is necessary to replace the meter when switching electricity supplier.
There are small differences between the countries. The inactive customers are consistently
more uncertain than the active and aware customers.
• 29 per cent of the Nordic customers both know their grid company, their electricity supplier
and two other electricity suppliers as well. 40 per cent of the Swedish and Norwegian
customers have so-called “total knowledge” of the electricity market, and 34 per cent of the
Finnish customers do so. Only three per cent of the Danish customers know their grid
company, their electricity supplier and two additional suppliers. The active and aware
customers have better knowledge of the electricity market than the inactive customers.

10
The customers’ participation in the electricity market Signing and comparing of contracts
• 78 per cent of all Nordic customers have signed an electricity contract. In Finland and
Norway, this share is 87 and 86 per cent respectively, while it is 81 per cent in Sweden. In
Denmark, 58 per cent have signed an electricity contract.
• 33 per cent of those who have signed a new contract did so less than one year ago; an
equally large share changed 1-3 years ago; while 14 and 20 per cent respectively changed 3-5
years ago or more than five years ago. The share of active customers (signed during the last
12 months) is highest in Finland (39 per cent, compared to around 28-32 per cent in the
other countries). Norway has the most passive customers (25 per cent signed a new contract
more than five years ago).
• In all Nordic countries customers signed a new contract first and foremost to save money (46
per cent). After saving money, the most common reasons among Norwegian consumers are
“Change in life situation”; “I was approached by a seller”; and “To get better terms (other
than price)”. In Sweden significant shares respond that their previous contract expired; that
they switched to achieve better terms; or they had a change in life situation. In Denmark,
many mention that they were approached by a seller, experienced a change in life situation
or wanted a “green” contract or better terms in other ways. In Finland, significant shares
mention that the contract expired; they experienced a change in life situation; or they were
approached by a seller.
• 55 per cent have compared their current electricity contract to other contracts. The share is
highest in Finland (61 per cent) and lowest in Denmark (46 per cent). In Norway and Sweden
58 per cent have compared contracts.
• 39 per cent of those who have compared their contract to other contracts have done this
within the past year; 46 per cent did so 1-3 years ago; eleven per cent did so 3-5 years ago;
and four per cent did so more than five years ago. In Norway and Finland, 44 and 46 per cent
respectively are aware customers (compared during the last 12 months). In Sweden and
Denmark, the share is 32 and 33 per cent respectively.
• The most common reasons given for staying in one’s current contract are “I was satisfied
with my current contract” (51 per cent) and “There was little or no saving from switching”
(43 per cent). This applies to all four countries.
• The most common reasons given for not comparing/switching contracts more often are “I
am satisfied with my current contract” (54 per cent) and “There was little or no saving from
switching” (41 per cent). This applies to all four countries.
• The most common reasons given for never comparing/switching contracts are “I am satisfied
with my current contract” (39 per cent); “It is difficult to understand the differences between
the contracts” (25 per cent); and “There was little or no saving from switching” (24 per cent).
Being satisfied with one’s current contract is the most common reason in all four countries.
The switching process
• 63 per cent of the electricity customers themselves initiated the signing of their current
contract, while ten per cent say it was someone else in the household. In Norway, Sweden
and Finland two in three say that they themselves took the initiative to sign their current
electricity contract. In Denmark this applies to around half of the respondents.

11
• 36 per cent respond that they used a comparison tool when they/someone else in their
household initiated the signing of their current contract. 42 per cent in Finland and 40 per
cent in Sweden used comparison tools. In Denmark, this share is only 24 per cent, while in
Norway it is 36 per cent.
• Twelve per cent say that it was the electricity supplier who took the initiative for the
contract, while three per cent say that a broker initiated the contract. 45 per cent of these
customers were contacted by telephone.
• The customers who have made a switch in the past three years experienced to a great
degree that it was easy and straightforward to sign a new electricity contract. When
switching contracts, they experienced to a moderate degree that they trusted the seller; that
there were many different suppliers and many different contract that met their needs; that it
was easy to find trustworthy information; that one was well-informed; that one could easily
compare different contracts; and that it was easy to understand what was included in the
price. All in all, the Danish customers have experienced this to a somewhat smaller degree
than the others. In general, the active and the aware customers experienced the switch of
contracts as easier than the inactive.
• The customers who have not made a switch in at least three years believe it will be quite
easy and straightforward to sign a new electricity contract, and that it will be quite many
different suppliers and contracts that meet their needs. These customers are in somewhat
less agreement that they will be well-informed; that it will be easy to find trustworthy
information; and that it will be easy to compare different contracts. When it comes to
trusting the seller and understanding what is included in the price, they tend to disagree. All
in all, the Danish customers believe signing a contract will be somewhat harder than the
other customers do. For all statements we find that the aware customers are more in
agreement than the inactive.
Comparison tools
• 47 per cent of those who have signed contracts during the last three years visited an online
comparison tool. The share is highest in Sweden and Finland, where 54 and 52 per cent
respectively used such a tool. In Norway this share is 41 per cent, and in Denmark 38 per
cent. 64 per cent of the aware customers used such a tool, compared to 47 per cent of the
active and 38 per cent of the inactive.
• In Norway, 55 per cent used “Strømpris.no,” 27 per cent used “Elskling,” and nine per cent
used “Forbrukernet.” In Sweden 55 per cent used “Elskling,” 36 per cent used “Compricer”
and 23 per cent used “Elpriskollen.” In Denmark, “Elpris.dk” is dominant with 71 per cent. In
Finland, 64 per cent used “Energiaviraston ylläpitämä sähkön hintavertailusivusto”.
• Among the customers who have been passive in the electricity market for at least three
years, 38 per cent know of some online comparison tools for electricity contracts.
Differences between the countries are similar as for those who have signed a contract during
the last three years.
Terms of contract
72 per cent of the Nordic consumers are aware of the binding period in the electricity contract. 61-65
per cent also believe they know how the price is set, whether the price can change during the
contract period, and the period of notice in the electricity contract. Around half of all consumers
know if the contract is green and the consequences of terminating the contract before the binding

12
period expires. 58 per cent of Swedish and Danish consumers are aware of the effective unit rate.
Overall, the share being aware of the different terms of contract is somewhat higher in Sweden than
in the other countries, while the Danish customer generally have the poorest knowledge of their
contractual terms. More of the aware and active than the inactive customers are familiar with the
different terms of contract.
The customers’ attitudes towards the electricity market Nordic electricity customers mostly agree that it is easy to switch electricity supplier. They are only in
moderate agreement that one can save money by switching electricity supplier and that it is
important to have a green contract, while they are even less in agreement that they regularly
compare different electricity contracts. Danish customers are generally less in agreement with the
statements than others, except that having a green contract is most important to the Danish
customers. The active and aware customers are more in agreement with the statements above,
compared to the inactive.
Billing and information
• Consumers agree to quite a great extent that they want better information on the price they
pay for electricity; that they want to get updated information on their own consumption; and
that it is easy to understand the bill. Finnish and Swedish customers highly agree that they
would prefer to get all electricity costs on one bill. Consumers in Denmark are less in
agreement with the statement “My bill is simple and easy to understand” and “I want to get
updated information about my consumption”, while they are most in agreement with the
statement “I would like to be better informed about the price I pay for electricity”. The active
and aware customers have a significantly higher score for the statements than the inactive.
• 77 per cent of the Nordic electricity customers receive the bill electronically. 23 per cent
receive it as a paper invoice by mail. In Norway and Denmark, nine in ten customers receive
the bill electronically. In Sweden, the share is seven in ten, and in Finland six in ten.
• 80 per cent read the information presented on their electricity bill. The share is highest in
Finland and Norway (85 and 84 per cent respectively) and somewhat lower in Sweden and
Denmark (76 and 75 per cent respectively). 91 per cent of the aware customers and 87 per
cent of the active read this information, compared to 74 per cent of the inactive.
• 85-97 per cent of those reading the information look at the total amount they must pay, the
specification of the electricity consumption their bill is based on and the specification of the
different price elements the electricity cost is based on. 59-71 per cent look for the
estimated yearly consumption, historical consumption and notifications of changes that
affect the electricity price, while 28-34 per cent look for information on the contract expiry
date, how the electricity is produced and which bodies one can turn to for independent user
advice, dispute resolution or if one has complaints. There are only minor differences
between the countries. In general, there is a higher share of aware and active customers that
read the information on the bill, compared to the inactive.
• 58 per cent want information from their electricity supplier by E-mail, 40 per cent want it on
or attached to the electricity bill, and 28 per cent want it on “My pages” on the electricity
supplier’s website. Smaller shares want information in a separate letter, in an app, by SMS or
at a display in their house. E-mail is the most preferred information channel in all four
countries.

13
Presentation of the Sample This chapter describes how the respondents are distributed among different background variables.
Figure 2: Background.
The respondents consist of 50 per cent men and 50 per cent women. 17 per cent are below the age
of 35; 30 per cent are between the ages of 35 and 49; 29 per cent are aged 50-64; and 23 per cent
are 65 and above. Half of the respondents live in houses, and half live in apartments.
• The Danish respondents consist of 50 per cent men and 50 per cent women. 17 per cent are
below the age of 35; 28 per cent are between the ages of 35 and 49; 32 per cent are aged 50-
64; and 23 per cent are 65 and above. Six in ten respondents live in houses, while four in ten
live in apartments.
• The Finnish respondents consist of 51 per cent men and 49 per cent women. 17 per cent are
below the age of 35; 28 per cent are between the ages of 35 and 49; 32 per cent are aged 50-
64; and 23 per cent are 65 and above. 65 per cent of the respondents live in apartments,
while 35 per cent live in houses.
• The Norwegian respondents consist of 51 per cent men and 49 per cent women. 16 per cent
are below the age of 35; 35 per cent are between the ages of 35 and 49; 27 per cent are aged
50-64; and 21 per cent are 65 and above. Six in ten respondents live in houses, while four in
ten live in apartments.
• The Swedish respondents consist of 50 per cent men and 50 per cent women. 19 per cent are
below the age of 35; 30 per cent are between the ages of 35 and 49; 26 per cent are aged 50-
64; and 25 per cent are 65 and above. 55 per cent of the respondents live in apartments,
while 45 per cent live in houses.

14
Customer profiles In the report we operate with three different customer profiles. These are:
• Active customers: Consumers who have signed an electricity contract during the last 12
months.
• Aware customers: Consumers who have compared contracts but decided not to switch
electricity contract during the last 12 months.
• Inactive customers: Consumers that have neither switched nor compared contracts but have
remained passive in the electricity marked during the last 12 months.
Figure 3: Costumer profiles.
26 per cent of the electricity customers have signed a contract in the past year and are considered
active customers. 16 per cent have compared contracts in the past year without switching and are so-
called aware customers. 58 per cent have neither switched nor compared contracts in the past year
and are inactive customers. 28 per cent of the inactive customers have never signed a new contract,
and 53 per cent have never compared their current contract with other contracts.
The share of active customers is highest in Finland. Norway and Finland have the highest shares of
aware customers. We find the highest share of inactive customers in Denmark.
• In Denmark 16 per cent of the customers are active; 13 per cent aware; and 71 per cent
inactive.
• In Finland 34 per cent of the customers are active; 19 per cent aware; and 47 per cent
inactive.
• In Norway 26 per cent of the customers are active; 19 per cent aware; and 55 per cent
inactive.
• In Sweden 26 per cent of the customers are active; 14 per cent aware; and 60 per cent
inactive.

15
Differences and Similarities between the Nordic countries This chapter takes a closer look at the Nordic electricity customers and their presence and
participation in the electricity market, as well as their attitudes towards the electricity market.
Differences between the four countries will be commented. Also, interesting and any significant
differences between background variables, such as consumer profiles, sex, age and type of resident,
will be commented.
The Nordic Customers’ presence in the electricity market The consumers were asked different questions about their presence in the electricity market.
Figure 4: Do you use electricity to heat your home? N=6019.
Overall, around half of the respondents use electric heating at home. There are great differences
between the countries regarding the use of electric heating.
• Norway stands out in particular, where 91 per cent use electric heating. In Sweden the share
is 52 per cent, and in Finland 40 per cent. In Denmark only 24 per cent use electricity for
heating purposes.
• It is more common to use electric heating in houses than in apartments (62 compared to 42
per cent).
• Electricity customers below the age of 50 use more electric heating than those above 50 (57-
61 compared to 46 per cent)
• The aware customers use the most electricity (59 per cent), while the active use slightly less
(54 per cent) and the inactive the least (49 per cent).

16
Figure 5: Approximately how many kilowatt-hours do you use each year? N=6019.
10 per cent respond that they use 20,000 kWh electricity or more per year, 25 per cent use between
10,000 and 19,999 kWh, and 36 per cent use less than 10,000 kWh.
There are great differences between the countries, where Norway has the by far highest electricity
consumption, while Denmark has the lowest. Sweden and Finland have similar consumption
patterns.
30 per cent say that they do not know how much electricity they use, and this share is about the
same size in all countries.
• In Norway 22 per cent use 20,000 kWh electricity or more per year, 34 per cent use between
10,000 and 19,999 kWh, and 16 per cent use less than 10,000 kWh.
• In Sweden nine per cent use 20,000 kWh electricity or more per year, 25 per cent use
between 10,000 and 19,999 kWh, and 36 per cent use less than 10,000 kWh per year.
• In Finland five per cent use 20,000 kWh electricity or more per year, 24 per cent use between
10,000 and 19,999 kWh, and 40 per cent use less than 10,000 kWh per year.
• Denmark stands out with the lowest electricity consumption by far. Here 53 per cent use less
than 10,000 kWh electricity per year. 17 per cent use between 10,000 and 19,999 kWh, and
only two per cent use more than 20,000 kWh.
• Women have less knowledge of their electricity consumption than men, and 42 per cent of
the women respond “do not know” compared to only 18 per cent of the men.
• Those living in apartments use less electricity but also have less knowledge of their electricity
consumption than those living in houses.
• The aware customers use the most electricity, while the inactive electricity customers are
most uncertain as to how much electricity they use.

17
Figure 6: How much money do you spend on electricity in total (supplier cost, grid cost and taxes) an average winter month? N=6019.1
Overall, 16 per cent respond that they spend more than EUR 200 on electricity in the course of a
normal winter month. 28 per cent spend between EUR 100 and 200, while a total of 44 per cent
spend less than 100. 12 per cent responded “do not know.”
• Norway is also the country where inhabitants spend the most on electricity, and 46 per cent
spend EUR 150 or more in a normal winter month. In Sweden, this share is 30 per cent, in
Finland 24 per cent and in Denmark 15 per cent.
• In Denmark 21 per cent respond that they do not know how much they spend, in the other
countries this share is around ten per cent.
• Those living in houses use more electricity and thus also have higher electricity bills than
those living in apartments.
• The aware electricity customers spend the most money on electricity, 53 per cent in this
group spend EUR 100 or more per month, compared to 44 and 41 per cent among the active
and inactive customers respectively. The inactive electricity customers are most uncertain as
to how much money they spend.
1 The price categories were presented in national currency.

18
The Nordic Customers’ knowledge of the electricity market The Nordic customers were asked to consider different statements concerning electricity suppliers
and switching between these.
Figure 7: Do you believe the following statements are correct or not? Share that believes the statements are correct. N=6019.
In general, there are small differences between the countries with regard to whether the inhabitants
believe the statements are correct or incorrect.
The vast majority know that they themselves can choose electricity supplier (91 per cent).
• The share varies from 87 per cent in Sweden to 94 per cent in Finland. In Norway, the share
is at 93 per cent and in Denmark at 89 per cent.
Around half of the respondents believe that in the event of a change of supplier, the new supplier
will be responsible for reading the meter. Here the differences between the countries are somewhat
greater, and this statement is also the one with greatest uncertainty (26 per cent).
• The share that believes this is correct varies from 43 per cent in Norway to 57 per cent in
Finland.
• The share that has responded “do not know” varies from 23 per cent in Finland and Norway,
27 per cent in Denmark, to 31 per cent in Sweden.
• The share that responds that the assertion is incorrect, is 34 per cent in Norway, 29 per cent
in Denmark, 20 per cent in Finland and 18 per cent in Sweden.
Around one in four believe that the electricity supplier is determined by where one lives. Nine per
cent state that they do not know, while 67 per cent state that the supplier is not determined by
where one lives.
• In Norway, Sweden and Denmark there are 64 per cent who know that the electricity
supplier is not determined by where one lives. In Finland, this share is somewhat higher (75
per cent).

19
Eight in ten know that it is not necessary to replace the meter when switching electricity supplier,
while 13 per cent are uncertain.
• The share varies from 75 per cent in Sweden and 78 per cent in Denmark, to 86 per cent in
Finland and 87 per cent in Norway.
Few believe that a switch of electricity supplier will affect the number of power cuts (9 per cent),
while it is more common to be uncertain (18 per cent).
• In Sweden 22 per cent are uncertain whether the number of power cuts is affected by the
electricity supplier. In Denmark, this share is 19 per cent, while it is 15 and 14 per cent in
Norway and Finland respectively.
• The share that responds that this statement is incorrect, is 80 per cent in Norway, 76 per
cent in Finland, 72 per cent in Denmark and 66 per cent in Sweden.
• The inactive customers are consistently more uncertain than the active and aware customers
in relation to the different statements.
• Women are also more uncertain than men.
• Those under the age of 35 are generally less knowledgeable about different aspects of the
electricity market, and there are higher proportions that answer incorrectly or “do not know”
to the various statements.
Further, the respondents were asked to name the company that operates the power lines to their
home, their own electricity supplier and two other electricity suppliers.
Figure 8: Name the company that operates the power lines to your home. N=60192
2This variable is based on the respondents’ postal codes. It should be considered that the postal codes may be incorrect (e.g. if respondents have moved, etc.). Additionally, in Finland, some grid companies operate a distribution grid only in a small part of the municipality yet have been listed in the coverage data to operate in the whole municipality. This leads to that all the postal codes in the municipality is being represented as being serviced by that grid company. This may have resulted in some false correct answers as some postal code areas are represented in the grid companies coverage data as being serviced by multiple grid companies whereas in reality the postal code area is serviced by only one grid company.

20
53 per cent state the name of their actual grid company. 35 per cent have stated the wrong name –
another grid company, an electricity supplier or something else. Twelve per cent respond “Do not
know.”
• In Norway 71 per cent name the correct company operating the power lines. 68 and 60 per
cent respectively of the Swedish and Finnish customers state the name of their actual grid
company. In Denmark only 15 per cent name the correct grid company. 64 per cent of the
Danish customers state either another grid company than their own, an electricity supplier or
something else, while 21 per cent are unsure.
• The share naming the correct grid company is highest among the oldest customers (57 per
cent) and lowest among the youngest (43 per cent). 18 per cent of the customers below the
age of 35 say they do not know what company operates the power lines to their homes.
• 59 and 58 per cent respectively of the active and aware customers name the correct grid
company, while this only applies to 49 per cent of the inactive customers.
Figure 9: Who is the electricity supplier in your home? N=6014.
84 per cent state the name of an actual electricity supplier.3 Seven per cent have stated something
else than an actual electricity supplier (a grid company or something else). Ten per cent respond “Do
not know.”
• 90 per cent of the Norwegian customers name an electricity supplier, while 87 and 84 per
cent of the Finnish and Swedish customers do so. In Denmark 73 per cent state the name of
an actual electricity supplier, while a significant share (17 per cent) says they do not know
their supplier of electricity.
• The share naming a correct electricity supplier is highest among the oldest customers (87 per
cent) and lowest among the youngest (75 per cent). 16 per cent of the customers below the
age of 35 say they do not know their electricity supplier.
• 88 and 86 per cent respectively of the active and aware customers name a correct electricity
supplier, while this applies to 81 per cent of the inactive customers.
3 We cannot know whether this is their actual electricity supplier or just another supplier.

21
Figure 10: Can you name two other electricity suppliers? N=6019.
48 per cent state the names of two actual electricity suppliers, while 22 per cent state the name of
one supplier. 31 per cent cannot name any other electricity suppliers.
• In Sweden, Finland and Norway 55-57 per cent name two other suppliers, while only 23 per
cent in Denmark do so. 55 per cent of the Danish customers cannot name any other
electricity suppliers.
• Somewhat more men than women know two other electricity suppliers (50 and 45 per cent).
• 38 per cent of the customers aged 25-35 know no other suppliers, compared to 29 per cent
of those who are older.
• 63 and 55 per cent respectively of the active and aware customers name two other electricity
suppliers, while this only applies to 39 per cent of the inactive customers.
Figure 11: Total knowledge of electricity suppliers. N=6019.
21 per cent of the Nordic electricity customers only know their own supplier. 19 per cent also know
the name of one other supplier, while a total of 43 per cent both know their own supplier and two
more suppliers (total knowledge of electricity suppliers). 17 per cent have stated something else than
an actual electricity supplier (a grid company or something else) or that they do not know.
• Regarding total knowledge of electricity suppliers, 51 per cent of both Norwegian, Finnish
and Swedish customers state the name of three actual electricity suppliers. 19 per cent of
Danish customers know one’s own and two other suppliers. More of the Danish customers

22
only state the name of one’s own electricity supplier (36 per cent), compared to the rest (14-
19 per cent). Also, 27 per cent of the Danish customers name other things than electricity
suppliers.
• 58 and 52 per cent respectively of the active and aware customers name three electricity
suppliers, while this only applies to 35 per cent of the inactive customers.
Figure 12: Total knowledge of the electricity market. N=6019.
Nine per cent of the Nordic customers name the correct company operating power lines to their
home and one actual electricity supplier. Ten per cent know their grid company and two electricity
suppliers. A total of 29 per cent both know their grid company, their electricity supplier and two
other electricity suppliers as well (total knowledge of the electricity market). The category called
“Other” includes those not naming a correct electricity supplier as their own and/or not naming the
correct grid company (51 per cent).
• Regarding total knowledge of the electricity market, 40 per cent of the Swedish and
Norwegian customers name the correct grid company and three electricity suppliers, and 34
per cent of the Finnish customers do so. Only three per cent of the Danish customers know
their grid company, their electricity supplier and two additional suppliers. In Denmark, a
significant share (89 per cent) names either the wrong grid company and/or wrong electricity
supplier, while this applies to 33-44 per cent in the other countries.
• More men than women know their grid company, their electricity supplier and two other
suppliers (32 and 26 per cent respectively).
• The share knowing both grid company and three electricity suppliers is lowest among the
youngest customers (22 per cent).
• 39 and 35 per cent respectively of the active and aware customers both name their grid
company, their own electricity supplier and two more suppliers, while this only applies to 23
per cent of the inactive customers.
The open answers provided for these questions may be read in the appendix to the report.

23
The Nordic Customers’ participation in the electricity market Electricity customers were further given different questions related to their participation in the
electricity market; including switching and comparing electricity contracts, the use of comparison
tools, as well as knowledge of contractual terms.
Signing and comparing of contracts Figure 13: Have you ever signed a new contract with an electricity supplier? N=6019.
78 per cent claim that they have signed an electricity contract.
• In Finland and Norway, this share is 87 and 86 per cent respectively, while it is 81 per cent in
Sweden. The share is lowest in Denmark, where a mere 58 per cent have signed an electricity
contract.
• The share that has signed a new contract increases with age; from 72 per cent among those
under the age of 35, to 82 per cent among those aged 65 and above.
• A larger share of men than women has signed an electricity contract (81 compared to 75 per
cent).
• The share that has signed a new contract is significantly higher among the aware customers
(83 per cent) than the inactive (67 per cent).4
4 All active customers have signed a contract.

24
Those who responded that they had signed a new contract with an electricity supplier were asked
when they last did this.
Figure 14: When did you last sign a new contract with an electricity supplier? N=4697.
33 per cent of those who have signed a new contract did so less than one year ago and are
considered active customers. An equally large share changed 1-3 years ago, while 14 and 20 per cent
respectively changed 3-5 years ago or more than five years ago.
• The share who signed during the last 12 months is highest in Finland (39 per cent, compared
to around 28-32 per cent in the other countries).
• Norway has the most passive customers. Here 25 per cent state that it is more than five
years since they signed a new contract. In Sweden, this share is 20 per cent, and in Denmark
and Finland 16 per cent.
• The inactive customers are the least likely to sign new contracts; for 56 per cent there has
been more than three years since they signed a new contract. (compared to 36 per cent
among the aware).

25
The electricity customers who have signed new contracts in the past three years were asked why
they signed a new contract.
Figure 15: Why did you sign a new electricity contract? Several answers possible. N=3099.
In all of the Nordic countries it is most common to make the switch to save money; this applies to a
total of 46 per cent. Furthermore, 22 per cent mention that the previous contract expired; 17 per
cent mention “to get better terms (other than price)” and “change in life situation (moving, etc.)”
while 16 per cent say they were approached by a seller.
It is less common to switch due to desire for a green contract (9 per cent), bad experience with a
previous contract (6 per cent) or desire for a local supplier (5 per cent).
Four per cent state other reasons for the contract change (see appendix), and one per cent are
uncertain.

26
Figure 16: Why did you sign a new electricity contract? Top 5 results by country.
• In Norway and Denmark more than half respond that they signed a new contract to save
money (52 and 51 per cent respectively). In Finland, the share is 45 per cent, and in Sweden
39 per cent.
• After saving money, the most common reasons among Norwegian consumers are “Change in
life situation” (20 per cent); “I was approached by a seller” (20 per cent); and “To get better
terms (other than price)” (17 per cent).
• In Sweden 32 per cent respond that the previous contract expired, 25 per cent mention that
they switched to achieve better terms, and 15 per cent mention a change in life situation.
• In Denmark 22 per cent mention that they were approached by a seller and 21 per cent
wanted a “green” contract, while 15 and 14 per cent respectively wanted better terms or
experienced a change in life situation.
• In Finland 34 per cent mention that the contract expired, 17 per cent state a change in life
situation, and 14 per cent that they were approached by a seller.

27
Consumers who are not considered to be active (switched contract in past year), were asked if they
have compared their current contract to other contracts.
Figure 17: Have you ever compared your current electricity contract to other contracts? N=4479.
Overall, just above half of the respondents have compared their current electricity contract to other
electricity contracts (55 per cent).
• The share is highest in Finland, where 61 per cent have compared contracts. The share is
lowest in Denmark (46 per cent). In Norway and Sweden, 58 per cent have compared
contracts.
• The share that has compared electricity contracts increases with age; from 50 per cent
among the youngest to 59 per cent among the oldest.
• A higher share of men than women has compared electricity contracts.
• Slightly more of those who live in a house than those who live in an apartment have
compared their current contract with other contracts (58 compared to 52 per cent).
• All aware customers have compared contracts. Among the inactive customers, more than
half (53 per cent) report that they have never compared electricity contracts.5
5 The active customers have switched contract in the past year and were therefore not presented with this question.

28
Electricity customers who have compared their own contracts with others were asked when they
most recently did this.
Figure 18: When did you last compare your current electricity contract to other contracts? N=2482.
39 per cent of those who have compared their contracts to other contracts have done this within the
past year and are considered to be aware customers. Somewhat more (46 per cent) carried out such
a comparison 1-3 years ago, while eleven per cent did so 3-5 years ago. Only four per cent of those
who have compared their own contract to others did so more than five years ago.
• In Norway and Finland 44 and 46 per cent respectively have compared contracts in the past
12 months. In Sweden and Denmark, the share is 32 and 33 per cent respectively.
• A higher share of men than women has compared contracts in the past 12 months.
• Among the inactive customers most have carried out a comparison between one and three
years ago (75 per cent).

29
Those who have compared different contracts in the past three years but who have not switched,
were asked why they chose to keep their current contract.
Figure 19: You have compared different offers but decided to stay in your current contract. Why? Several answers possible. N=2109.
There are mainly two reasons that stand out. The most frequently mentioned reason in all countries
is “I was satisfied with my current contract,” which is mentioned by 51 per cent. Moreover, 43 per
cent say there was little to be saved.
14 per cent say that it was difficult to understand the differences between contracts, and 14 per cent
wanted to keep their local supplier.
Fewer say that they did not switch because the binding period on the contract had not expired (11
per cent); it was difficult to find relevant information (8 per cent); the switching process was too
complicated (6 per cent); or one was, for various reasons, unable to switch (4 per cent).
Five per cent state other reasons for deciding to remain in the current contract (see appendix), while
two per cent are unsure.

30
Figure 20: You have compared different offers but decided to stay in your current contract. Why? Top 5 results by country.
• In Denmark 21 per cent respond that it was difficult to understand the differences between
the contracts. In comparison, this share is 15 per cent in Norway, 12 per cent in Sweden and
ten per cent in Finland.
• In Denmark 14 per cent mention that it was difficult to find relevant information. In Norway
and Finland this share is seven per cent, and in Sweden four per cent.
• Danish electricity customers were also those who thought it was most complicated to switch
(9 per cent). There are fewest Norwegian customers who provide this reason (3 per cent).
• 58 and 50 per cent of the Norwegian electricity customers respectively state that they were
satisfied, and that there was little to save. In comparison, this applies to 46 and 33-41 per
cent respectively for the Swedish and Finnish customers.
• In Sweden and Finland 15 and 17 per cent respectively mention that the binding period had
not expired. In Norway and Denmark these shares are lower (4 and 7 per cent respectively).

31
Those who neither have switched nor compared contracts in the past three years were asked why
they had not done this more often.
Figure 21: Why have you not switched or compared contracts more often? Several answers possible. N=373.
Satisfaction with the current contract is mentioned by a total of 54 per cent and more than half of
the respondents in all countries. Moreover, 41 per cent say that there “is little to be saved” and 25
per cent respond “it is difficult to understand the difference between different contracts.”
17 per cent have not switched/compared more often because they want to keep their local supplier;
eleven per cent believe it is difficult to find relevant information.
Few have been inactive in the electricity market for at least three years because a switching process
is too complicated (10 per cent), or because they are indifferent to their contract (3 per cent).
Seven percent state other reasons (see appendix), and three per cent are unsure.

32
Figure 22: Why have you not switched or compared contracts more often? Top 5 results by country.
• In Norway “I am satisfied with my current contract” is the dominant reason and is mentioned
by 61 per cent of the respondents. In Finland, this share is 57 per cent, in Sweden 52 per cent
and in Denmark 51 per cent.
• Denmark is the only country where satisfaction with the current contract is not the most
frequently mentioned reason. In Denmark, “there is little or no saving from switching” is
most frequently mentioned (53 per cent). In the other countries this is the second most
mentioned reason.
• In Denmark, Norway and Finland, 27-29 per cent state that it is difficult to understand the
differences between contracts. In Sweden, this share is lower (19 per cent).
• In Finland, there is a significant share of 37 per cent who wish to keep their current supplier
because it is local. Nine, 15 and 17 per cent respectively of the Danish, Swedish and
Norwegian customers give the same reason for not switching/comparing more often.
• In Sweden and Finland ten and eight per cent respectively state that the binding period has
not expired, while only one per cent in Denmark and none in Norway state this as a reason.

33
Those who have neither switched nor compared contracts were asked for the reasons for never
doing this.
Figure 23: Why have you never switched or compared contracts? Several answers possible. N=844.
The pattern is much the same as for those who rarely (not in the past 3 years) have switched or
compared electricity contracts. 39 per cent state that they are satisfied with their current contract.
25 per cent state that it is difficult to understand the differences between the contracts, and 24 per
cent state that there is little or nothing to save by switching.
Fewer have been inactive in the electricity market because it is difficult to find relevant information
(13 per cent); the switching process is too complicated (12 per cent); one wants to keep the supplier
as this is local (12 per cent); one do not care about one’s electricity contract (7 per cent); one did not
know switching was possible (5 per cent); or the binding period of the contract has not expired (3 per
cent).
Four per cent provide other reasons for not switching or comparing contracts (see appendix), while
eleven per cent are unsure as to the reason they have remained passive.

34
Figure 24: Why have you never switched or compared contracts? Top 5 results by country.
• In Norway, satisfaction with the current contract is mainly emphasised (41 per cent). In
comparison, 33 per cent of the Finnish electricity customers say the same.
• In Finland 31 per cent say that they have never switched or compared contracts because
they want to keep their local supplier. This only applies to seven per cent of the Danish
customers.
• In Denmark 40 per cent claim to be satisfied with their current contract, and in addition 30
per cent state that there is little to be saved, while 28 per cent think it is difficult to
understand the differences between contracts. In Finland too, there is a significant share
thinking it is difficult to understand the differences between contracts (31 per cent). This
reason is least common among Norwegian electricity customers. (16 per cent).
• A significant number of Swedish electricity customers have neglected to switch/compare
contracts because the switching process is too complicated (18 per cent) and/or because the
binding period of the contract has not expired (9 per cent).

35
The switching process
The respondents were then given questions related to the switching process, including who initiated
the signing of their current contract; how one proceeded to choose contract; how one was
contacted, etc.
Figure 25: Who initiated the signing of your current contract? N=6019.
Most of the electricity customers (63 per cent) themselves initiated the signing of their current
contract, while ten per cent say it was someone else in the household.
Twelve per cent say that it was the electricity supplier who took the initiative. It is less common that
a broker, union or other parties initiated the contract (1-3 per cent). Nine per cent of the electricity
customers do not remember who took the initiative for their current contract.
• In Norway, Sweden and Finland two in three say that they themselves took the initiative to
sign their current electricity contract. In Denmark this applies to around half of the
respondents.
• The share that does not remember who took the initiative is somewhat larger in Denmark
than in the other countries (19 per cent in Denmark, 6 per cent in Norway and Sweden, and 3
per cent in Finland).
• A larger share of active and aware than inactive customers themselves took the initiative (71-
75 per cent compared to 56 per cent).
• A larger share of men than women says that they themselves took the initiative (69
compared to 57 per cent).
• The share who themselves took the initiative increases with age; from 55 per cent among
those below the age of 35, to 67 per cent among those aged 65 and above.

36
Those electricity customers who responded that either themselves or someone else in their
household initiated the signing of their current contract, were asked how they did this.
Figure 26: How did you go about choosing electricity contract? Several answers possible. N=4392.
36 per cent respond that they have used a comparison tool, 16 per cent searched online, while 14
per cent contacted one or more electricity suppliers.
27 per cent state other methods (see appendix), while 18 per cent do not remember how they
initiated the contract.
• 42 per cent in Finland and 40 per cent in Sweden used comparison tools. In Denmark, this
share is only 24 per cent, while in Norway, it is 36 per cent.
• In Denmark, the most common approach is to phone the electricity supplier (24 per cent).
Between nine and 13 per cent in the other countries have done this.
• Around half of the active and the aware customers used comparison tools. Among the
inactive the share is only 25 per cent.
• A larger share of men than women stated that they used comparison tools (41 compared to
31 per cent).
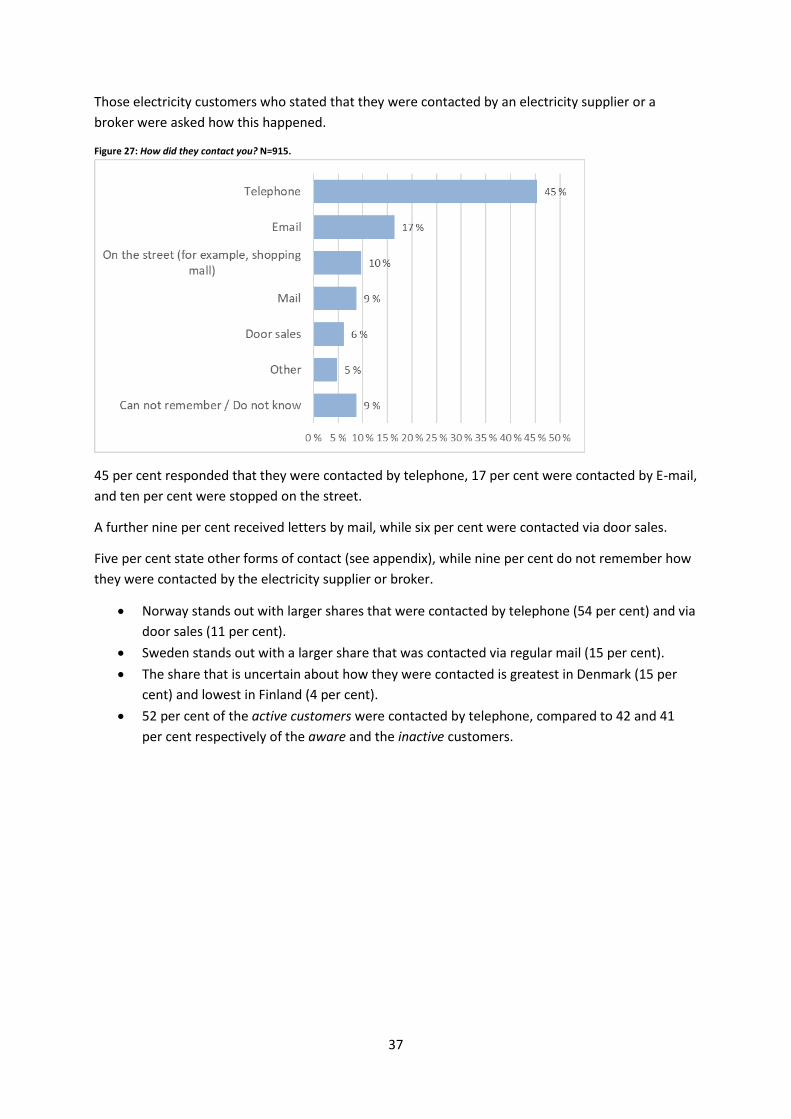
37
Those electricity customers who stated that they were contacted by an electricity supplier or a
broker were asked how this happened.
Figure 27: How did they contact you? N=915.
45 per cent responded that they were contacted by telephone, 17 per cent were contacted by E-mail,
and ten per cent were stopped on the street.
A further nine per cent received letters by mail, while six per cent were contacted via door sales.
Five per cent state other forms of contact (see appendix), while nine per cent do not remember how
they were contacted by the electricity supplier or broker.
• Norway stands out with larger shares that were contacted by telephone (54 per cent) and via
door sales (11 per cent).
• Sweden stands out with a larger share that was contacted via regular mail (15 per cent).
• The share that is uncertain about how they were contacted is greatest in Denmark (15 per
cent) and lowest in Finland (4 per cent).
• 52 per cent of the active customers were contacted by telephone, compared to 42 and 41
per cent respectively of the aware and the inactive customers.

38
Those who have made a switch in the past three years were asked to consider different statements
related to the switching process.
Figure 28: Before you made your current choice of electricity contract, to what extent did you experience the following …? Standardized
mean: 0=No experience and 100=High extent. “Do not know” is excluded. N=2762-3013.
Most experienced to a great degree that it was easy and straightforward to sign a new electricity
contract. The overall score is 79, on a scale from 0 to 100. This statement stands out with the highest
score by far. For the other statements the scores average between 61 and 64, with some major
differences between the countries.
• Norwegian and Finnish electricity customers found it easiest to sign an electricity contract
(scores of 82 and 81 respectively). Danish and Swedish customers also found this to be
unproblematic (76 and 75 respectively).
• For the statement “There were many different products/contracts to choose from that meet
my needs,” the scores are between 56 and 69. It is the consumers in Norway (69) that
experienced this to the greatest degree, followed by Denmark (66) and Sweden (63).
Consumers in Finland experienced this to a lesser degree than the others (56).
• The pattern is fairly similar with regard to choice of different suppliers. Here too the score is
highest in Norway (71), followed by Sweden (67), Denmark (61) and Finland (55).
• Regarding how easy it was to find reliable information; the score is highest in Norway (66).
Finland (65) and Sweden (62) follow close behind, while the score in Denmark is somewhat
lower than in the other countries (56).

39
• With regard to the statement “I was well-informed,” the scores for the four countries are
quite similar and range from 59 in Denmark to 65 in Sweden.
• For the statement “I could easily compare different electricity contracts with each other” the
scores are fairly similar for Sweden (61), Finland (63) and Norway (63), while Denmark is
lower with a score of 51.
• Trust in the seller was highest in Finland, where the score is 70. The other countries are quite
close to each other, with Norway at 63, Denmark at 60 and Sweden at 59.
• In terms of how easy it was to understand what was included in the price, consumers in
Denmark experienced this as difficult (49). Consumers in the other countries found it
somewhat easier; scores vary from 61 in Sweden and 62 in Norway to 68 in Finland.
• In general, the scores are highest among the active and the aware customers, and lowest
among the inactive.
• The scores among men are generally higher than among women, with the exception of the
statement “I trusted the information and advice from sellers,” where the score is higher
among women.
In summary, the electricity customers who made a switch had fairly high confidence in the electricity
market, with scores of 64 and 63 respectively for the statements concerning trust in sellers and how
easy it was to find reliable information.
• Finnish electricity customers have the greatest confidence in sellers (70), while Swedish
electricity customers have the lowest confidence (59).
• In Norway one had the greatest confidence in that the information one found was reliable
(66), while this was lowest in Denmark (56).

40
Those who have not made a switch in at least three years were also asked to consider different
statements concerning the switching process – given a hypothetical switch in the future.
Figure 29: If you in the future would like to choose an electricity contract, to what extent do you agree that… ? Standardized mean: 0=No
experience and 100=High extent. “Do not know” is excluded. N=2549-2686.
Overall, there is greatest consensus that there will be many different electricity suppliers and
contracts to choose from, and that it will be easy to sign a new electricity contract. The scores for
these statements are around 65-66 of 100, when all countries are taken as one.
• In Norway the scores for these statements are 71, in Finland 67-68, and in Sweden 65-67.
Denmark stands out from the other countries with somewhat lower scores, particularly with
regard to the statement “It will be easy and straightforward to sign an electricity contract”.
Here the score is only 57. The scores for the two remaining statements are 61 and 63.
“I will be well-informed” has a score of 59, while the statements that it will be easy to find
trustworthy information and that it will be easy to compare different contracts score 54 and 53
respectively.
• The scores for the statement “I will be well-informed” is quite similar in all countries.
However, Denmark differs with regard to the two other statements. Agreement is much
lower in Denmark for “It will be easy to find trustworthy information and necessary advice”
and “It will be easy to compare different electricity contracts with each other,” with scores as
low as 43. In Finland too, the scores are somewhat lower than in Norway and Sweden. In

41
Finland the scores for the two statements are 57 and 52 respectively, while in Norway and
Sweden the scores are around 60.
In terms of agreement to the statements that it will be easy to understand what is included in the
price and that one will trust information and advice from sellers, the scores are 48 and 44
respectively. In other words, electricity customers tend to disagree with this.
• Here too the scores in Denmark are lower than in the other countries and are as low as 39.
Scepticism towards sellers is also somewhat greater in Norway than in Sweden and Finland,
and the score for the statement “I will trust the information and advice from sellers” in
Norway is 42, compared to 46 in Sweden and 52 in Finland.
• For all statements we find that the aware customers are more in agreement than the
inactive.
• Men are generally more in agreement with the statements than women, with the exception
of trusting the seller in the event of a change of contract.
In summary, the electricity customers who have not made a switch have low confidence in the
electricity market, with scores of 44 and 54 respectively for the statements concerning trust in sellers
and how easy it will be to find reliable information.
• Danish electricity customers have the lowest confidence in both that the seller (39) and
information (43) will be reliable, if they were to switch.
• Norwegian and Swedish electricity customers have the greatest faith that they will find
trustworthy and reliable information (60), while Finnish electricity customers have somewhat
greater confidence in sellers than others (52).
Comparison tools
The respondents were also asked to consider different questions on comparison tools.
The electricity customers who has signed a contract in the past three years were asked if they had
visited an online comparison tool.
Figure 30: When you signed/compared your current electricity contract, did you visit an online comparison tool? N=3099.
47 per cent respond that they visited an online comparison tool when they compared or switched to
their current electricity contract.

42
• The share is highest in Sweden and Finland, where 54 and 52 per cent respectively used such
a tool. In Norway, this share is 41 per cent, and in Denmark 38 per cent.
• 64 per cent of the aware customers used such a tool, compared to 47 per cent of the active
and 38 per cent of the inactive.
• A higher share of men than women used comparison tools (51 compared to 43 per cent).
• The share that has used comparison tools is higher among those below the age of 50 (51-52
per cent) than those above (42-44 per cent).
Those who had used a comparison tool were asked to name the tool they had used.
Figure 31: What comparison tool(s) did you visit? Several answers possible. Results by country. N=1455.
Which comparison tools that were used, varies from country to country.
• In Norway 55 per cent say that they have used “Strømpris.no,” 27 per cent have used
“Elskling,” and nine per cent have used “Forbrukernet.”
• Sweden is the country with greatest variation. Here 55 per cent have used “Elskling,” 36 per
cent have used “Compricer” and 23 per cent have used “Elpriskollen.”
• In Denmark “Elpris.dk” is dominant with 71 per cent.
• In Finland 64 per cent responded that they had used “Energiaviraston ylläpitämä sähkön
hintavertailusivusto (sahkonhinta.fi).”

43
Seven per cent stated other comparison tools (see appendix), while a significant 21 per cent say they
do not remember which comparison tool they visited.
The electricity customers who have not signed a contract in at least three years were also asked
about comparison tools.
Figure 32: Do you know any of any online comparison tools for electricity contracts? N=2920.
• The share that knows about comparison tools is highest in Norway and Sweden, where 43
per cent are aware of them. In Finland and Denmark, the share is 34 and 33 per cent
respectively.
• 66 per cent of the aware customers know of such tools, compared to 33 per cent of the
inactive.
• A higher share of men than women is aware of comparison tools (42 compared to 35 per
cent).
• The share that is aware of comparison tools is slightly higher among those below the age of
65 (38-40 per cent) than those above (34 per cent).

44
Those aware of comparison tools for electricity contracts were asked which comparison tools they
had visited.
Figure 33: What comparison tool(s) have you visited online? Several answers possible. Results by country. N=1118.
The pattern is fairly similar as for those who have switched or compared electricity contracts in the
past three years.
• In Norway 63 per cent have visited “Strømpris.no,” 47 per cent “Elskling” and 16 per cent
“Forbrukernet”.
• In Sweden 65 per cent have visited “Elskling,” 46 per cent “Compricer” and 31 per cent
“Elpriskollen”.
• In Denmark 72 per cent respond “Elpris.dk”, while 30 per cent respond “Other”.
• In Finland 87 per cent respond “Energiaviraston ylläpitämä sähkön hintavertailusivusto
(sahkonhinta.fi)” and 16 per cent “Other”.
Eleven per cent stated other comparison tools (see appendix), while two per cent say they do not
remember. Also, two per cent say they have not visited any comparison tools online.

45
Terms of contract
Electricity customers were asked about their current contracts and how well they know the terms of
the contract.
Figure 34: When you think of your current electricity contract, are you aware of …? Share that has answered “Yes”. N=6019.
* Only Sweden and Denmark (N=3009).
72 per cent of consumers are aware of the binding period in the electricity contract; 65 per cent
believe they know how the price is set; and 64 per cent respond that they know whether the price
can change during the contract period.
Further, 61 per cent respond that they are aware of the period of notice in the electricity contract.
Half of consumers know whether they have a green contract, and 47 per cent know the
consequences of terminating the contract before the binding period expires.
In Sweden and Denmark consumers were also asked if they were aware of the effective unit rate
(where all fixed and variable fees are included). In Sweden 60 per cent are aware of this, and in
Denmark 56 per cent.
• Overall, the share being aware of the different terms of contract is somewhat higher in
Sweden than in the other countries. The exception is how the price is set, and the
consequence of terminating the contract in the binding period.
• In Finland there are certain aspects of the electricity contract that are widely known, for
example binding period (86 per cent) and price setting (83 per cent), while there are fewer

46
who know whether the price can be changed during the contract term (51 per cent) and
whether the contract is green (46 per cent).
• The Danish customers generally have the poorest knowledge of their contractual terms. The
exception is whether the contract is green; 52 per cent of the Danish customers are aware of
this. This share is lower in both Finland (46 per cent) and in Norway (44 per cent). The share
that is aware whether they have a green contract is highest in Sweden (59 per cent).
• The share that knows whether the price can be changed during the contract term is highest
in Norway (75 per cent). In Sweden, the share is 69 per cent, in Denmark 59 per cent and in
Finland 51 per cent.
• Norwegian and Finnish electricity customers have best knowledge of the consequences of
terminating the contract before the expiry of the binding period (53 per cent), compared to
47 and 37 per cent respectively of Swedish and Danish customers.
• Among the aware and active customers there are more who are familiar with the different
terms of contract, compared to the inactive.
• Men are generally more aware of the different terms in the contract than women.
• There is also a tendency that awareness concerning the different terms in the contract is
somewhat more usual among the older than the younger consumers.
The Nordic Customers’ attitudes towards the electricity market The respondents were asked to consider different statements concerning the electricity market.
Figure 35: To what extent do you agree with the following statements …? Standardized mean: 0=Fully disagree and 100=Fully agree. “Do
not know” is excluded. N=4066-5700.6
Most agree that it is easy to switch electricity supplier, and the score is 74 out of 100. Moreover, the
respondents are to quite a large extent in agreement that one can save money by switching
electricity supplier (66), and that it is important to have a green contract (61).
6 Customers who reported that they have never compared their current electricity contracts were not presented with the statement “I regularly compare contracts”.

47
The Nordic electricity customers are less in agreement that they regularly compare different
electricity contracts. The score here is 46, which indicates that this is something consumers rarely do.
• Denmark stands out from the other countries with a low score at the statement “I can save
money by switching electricity contract” (54). In Norway the score is 67, in Sweden 70 and in
Finland 71.
• With regard to “It is easy to switch supplier,” the score is highest in Norway (82). In Finland
the score is 76, while the scores in Denmark and Sweden are slightly lower (69 and 67
respectively).
• Having a green contract is most important to consumers in Denmark (65), and least
important in Sweden (59).
• In Denmark the score is 41 for the statement “I regularly compare electricity contracts,”
while Finland is somewhat higher, with a score of 51.
• The active and aware customers have a consistently higher score for the statements than the
inactive. The exception is “It is important to have a green electricity contract,” which is
somewhat important regardless of consumer profile.
Billing and Information
The respondents were asked to consider different statements concerning billing and information.
Figure 36: To what extent do you agree with the following statements …? Standardized mean: 0=Fully disagree and 100=Fully agree. “Do
not know” is excluded. N=5700-5806.
* Only Sweden and Finland (N=2899).
Consumers agree to quite a great extent that they want better information on the price they pay for
electricity; that they want to get updated information on their own consumption; and that it is easy
to understand the bill. The scores for these statements vary from 65 to 68.
Finnish and Swedish customers would prefer to get all electricity costs on one bill (average of 78 and
77 respectively).

48
• Consumers in Denmark stand out as significantly less in agreement with the statement “My
bill is simple and easy to understand,” with a score of 52. The score for this statement is also
somewhat lower in Sweden (64) than in Norway (72) and Finland (73).
• Finnish electricity customers are somewhat less in agreement with the statement “I would
like to be better informed about the price I pay for electricity” (64), while Danish customers
are most in agreement (70), closely followed by Norwegian and Swedish customers 69).
• With regard to the statement “I want to get updated information about my consumption”,
there is greatest agreement in Norway (73) and least in Denmark (64).
• The active and aware customers have a significantly higher score for the statements than the
inactive.
The electricity customers were also given different questions about the electricity bill; about how
they receive it; and what information they read on the bill.
Figure 37: How do you receive your electricity bill? N=6019.
77 per cent of the Nordic electricity customers receive the bill electronically. 23 per cent receive it as
a paper invoice by mail.
• In Norway and Denmark, nine in ten customers receive the bill electronically. In Sweden, the
share is seven in ten, and in Finland six in ten.
Figure 38: Do you read the information presented on your electricity bill? N=6019.
80 per cent respond that they read the information presented on their electricity bill.

49
• The share is highest in Finland and Norway, where 85 and 84 per cent respectively read this
information. In Sweden and Denmark, the share that reads the information on the electricity
bill is 76 and 75 per cent respectively.
• 91 per cent of the aware customers and 87 per cent of the active read this information,
compared to 74 per cent of the inactive.
The electricity customers who stated that they read the information presented on the electricity bill
were asked what information they read here.
Figure 39: What information do you read on your electricity bill? Share that has answered “Yes”. N=4818.
* Not Finland (N=3541)
Almost all (97 per cent) look at the total amount they must pay, and a large number read the
specification of the electricity consumption their bill is based on (90 per cent). Many also look at the
specification of the different price elements the electricity cost is based on (85 per cent).
It is slightly less common to look for the estimated annual consumption (71 per cent), historical
consumption (69 per cent), and notifications of changes that affect the electricity price (59 per cent).

50
It is more uncommon to look for information on the contract expiry date (34 per cent); how the
electricity is produced (31 per cent); and which bodies one can turn to for independent user advice,
dispute resolution or if one has complaints (28 per cent). With regard to information on how
electricity is produced, there is a fairly large share (21 per cent) that believes that they do not receive
this information on their bill.
Seven per cent look for other information on their bills (see appendix).
• In Norway, we find the highest share that reads the specification of consumption the bill is
based on (93 per cent). The share that looks for specification of the various price elements is
highest in Finland (89 per cent).
• In Norway, it is very common to look at consumption history; 83 per cent say they do this,
while in the other countries this is something 62-68 per cent do. In Denmark and Sweden 76
and 74 per cent respectively read about estimated annual consumption, compared to 65 per
cent in Norway.7
• There is a lower share in Norway than in the other countries that looks for information on
how the electricity has been produced. In Norway, 18 per cent do this, compared to 33 per
cent in Denmark, 35 per cent in Finland and 38 per cent in Sweden. 31 per cent of the
Norwegian customers say they do not believe this type of information is available on the
electricity bill.
• In Sweden and Finland, around 40 per cent look for the contract’s expiry date. In Norway and
Denmark, 23 and 33 per cent respectively do the same.
• 63 per cent of the Swedish customers look for notifications of changes that affect their
electricity price, compared to 55 per cent of the Norwegian customers.
• In Denmark 33 per cent read about where they may enquire for advice, etc., compared to 26-
27 per cent in other countries.
• In general, there is a higher share of aware and active customers that reads the information
on the bill, compared to the inactive.
• Men read somewhat more of the information than women, and the older read more of the
information than the younger.
7 Finnish electricity customers were not questioned about estimated annual consumption.
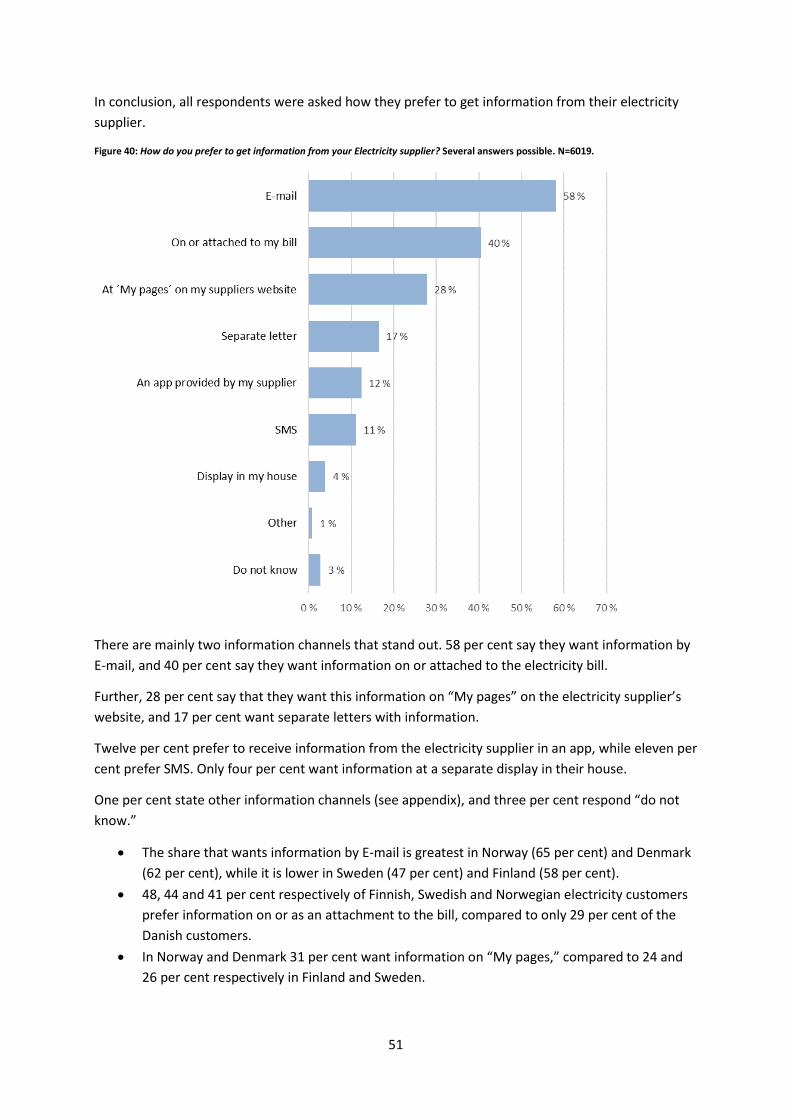
51
In conclusion, all respondents were asked how they prefer to get information from their electricity
supplier.
Figure 40: How do you prefer to get information from your Electricity supplier? Several answers possible. N=6019.
There are mainly two information channels that stand out. 58 per cent say they want information by
E-mail, and 40 per cent say they want information on or attached to the electricity bill.
Further, 28 per cent say that they want this information on “My pages” on the electricity supplier’s
website, and 17 per cent want separate letters with information.
Twelve per cent prefer to receive information from the electricity supplier in an app, while eleven per
cent prefer SMS. Only four per cent want information at a separate display in their house.
One per cent state other information channels (see appendix), and three per cent respond “do not
know.”
• The share that wants information by E-mail is greatest in Norway (65 per cent) and Denmark
(62 per cent), while it is lower in Sweden (47 per cent) and Finland (58 per cent).
• 48, 44 and 41 per cent respectively of Finnish, Swedish and Norwegian electricity customers
prefer information on or as an attachment to the bill, compared to only 29 per cent of the
Danish customers.
• In Norway and Denmark 31 per cent want information on “My pages,” compared to 24 and
26 per cent respectively in Finland and Sweden.

52
• 28 per cent of the Finns would like a separate letter with information from the electricity
supplier. This applies to 19 per cent of the Swedes, and only eleven and nine per cent
respectively of Danes and Norwegians.
• There are significant shares in Norway who prefer app and SMS (15 per cent), while this only
applies to 8-10 per cent in Sweden and Finland.

53
The Danish Customers This chapter takes a closer look at the Danish electricity customers and their presence and
participation in the electricity market, as well as their attitudes towards the Danish electricity
market. Interesting and any significant differences between background variables will be
commented.
The Danish Customers’ presence in the electricity market The consumers were asked different questions about their presence in the Danish electricity market.
Figure 41: Do you use electricity to heat your home? N=1508.
One in four Danes respond that they use electricity to heat their homes.
• A larger share of those under the age of 35 than the older ones uses electricity for heating
(47 and 14-29 per cent respectively).
• The share is somewhat higher among the aware customers (30 per cent), than the active and
inactive customers (23 per cent).
Figure 42: Approximately how many kilowatt-hours do you use each year? N=1508.
30 per cent respond that they use less than 5,000 kWh per year; 35 per cent use between 5,000 and
14,999 kWh; and only seven per cent use 15,000 kWh or more per year. 29 per cent respond that
they do not know how much electricity they use in a year.

54
• Men claim to use less electricity than women; 73 per cent of the men and 54 per cent of the
women use less than 15,000 kWh per year. Women are more uncertain than men as to how
much electricity they use (41 compared to 18 per cent).
• The older ones use less electricity than the younger ones; 37-39 per cent of the electricity
customers above the age of 50 use less than 5,000 kWh per year, compared to 16-22 percent
of the younger customers.
• Those living in apartments use less electricity than those living in houses. 35 and 26 per cent
respectively claim to use 5,000 kWh or less per year.
• 38 percent of the aware customers use less than 5,000 kWh, compared to 27-32 percent of
the active and inactive. The inactive customers are the most unsure; 32 per cent do not know
how much electricity they use, compared to 28 and 14 per cent respectively of the active and
the aware customers.
Figure 43: How much money do you spend on electricity in total (supplier cost, grid cost and taxes) an average winter month? N=1508.
Half of the Danish customers respond that they spend DKK 1,000 or less on electricity in an average
winter month. 14 per cent spend DKK 1,000-1,500, and 15 per cent spend more than DKK 1,500 per
month. One in five customers are uncertain.
• Those living in apartments spend less on electricity than those living in houses. 37 and 13 per
cent respectively spend less than DKK 500 on electricity in an average winter month.
• The difference between the different consumer profiles are small, but the aware customers
are less uncertain of their electricity consumption (11 per cent), than the inactive and active
(24 and 20 per cent respectively).
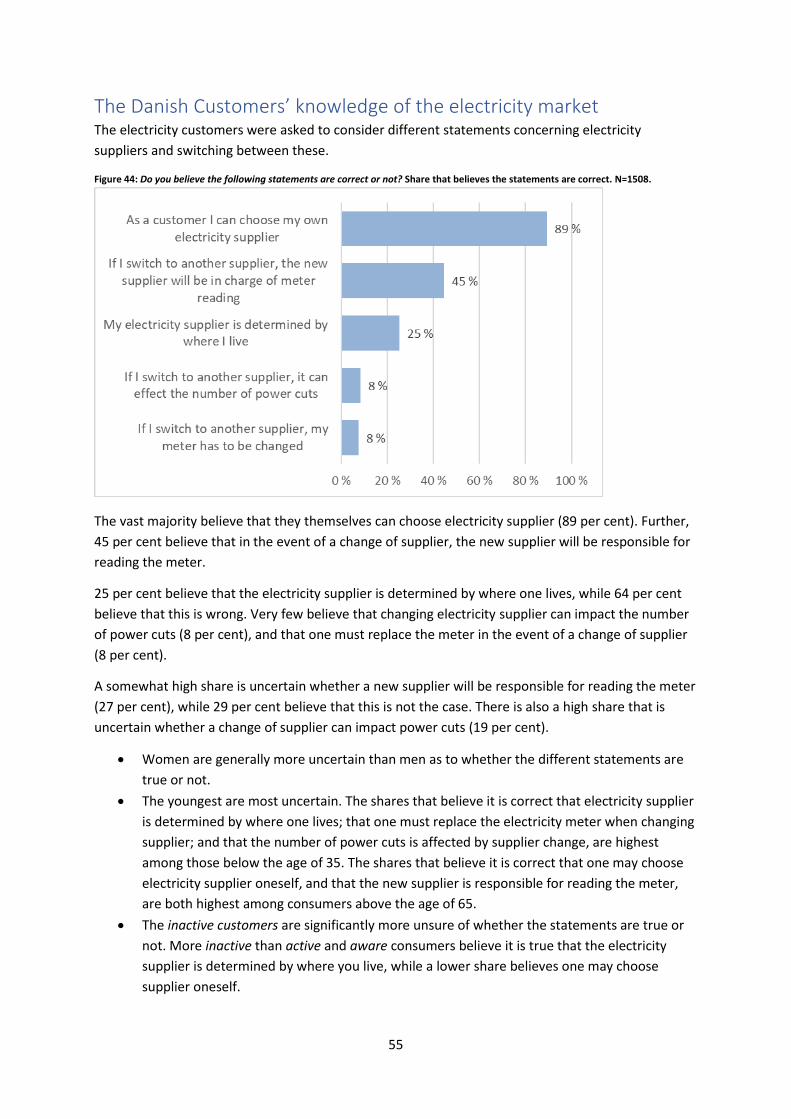
55
The Danish Customers’ knowledge of the electricity market The electricity customers were asked to consider different statements concerning electricity
suppliers and switching between these.
Figure 44: Do you believe the following statements are correct or not? Share that believes the statements are correct. N=1508.
The vast majority believe that they themselves can choose electricity supplier (89 per cent). Further,
45 per cent believe that in the event of a change of supplier, the new supplier will be responsible for
reading the meter.
25 per cent believe that the electricity supplier is determined by where one lives, while 64 per cent
believe that this is wrong. Very few believe that changing electricity supplier can impact the number
of power cuts (8 per cent), and that one must replace the meter in the event of a change of supplier
(8 per cent).
A somewhat high share is uncertain whether a new supplier will be responsible for reading the meter
(27 per cent), while 29 per cent believe that this is not the case. There is also a high share that is
uncertain whether a change of supplier can impact power cuts (19 per cent).
• Women are generally more uncertain than men as to whether the different statements are
true or not.
• The youngest are most uncertain. The shares that believe it is correct that electricity supplier
is determined by where one lives; that one must replace the electricity meter when changing
supplier; and that the number of power cuts is affected by supplier change, are highest
among those below the age of 35. The shares that believe it is correct that one may choose
electricity supplier oneself, and that the new supplier is responsible for reading the meter,
are both highest among consumers above the age of 65.
• The inactive customers are significantly more unsure of whether the statements are true or
not. More inactive than active and aware consumers believe it is true that the electricity
supplier is determined by where you live, while a lower share believes one may choose
supplier oneself.

56
Further, the respondents were asked to name the company that operates the power lines to their
home, their own electricity supplier and two other electricity suppliers.
Figure 45: Name the company that operates the power lines to your home. N=1508.8
15 per cent state the name of their actual grid company. 64 per cent have stated the wrong name –
another grid company, an electricity supplier or something else. 21 per cent respond “Do not know.”
• The share naming the correct grid company is highest among the oldest customers (19 per
cent) and lowest among the youngest (7 per cent).
• 17 per cent of the customers living in houses name the correct company, while only eleven
per cent of those living in apartments do so.
Figure 46: Who is the electricity supplier in your home? N=1507.
73 per cent state the name of an actual electricity supplier.9 Nine per cent have stated something
else than an actual electricity supplier (a grid company or something else). 17 per cent respond “Do
not know.”
8 This variable is based on the respondents’ postal codes. It should be taken into account that the postal codes may be incorrect (e.g. if respondents have moved, etc.). 9 We cannot know whether this is their actual electricity supplier or just another supplier.

57
• The share naming a correct electricity supplier is highest among the oldest customers (79 per
cent) and lowest among the youngest (67 per cent).
Figure 47: Can you name two other electricity suppliers? N=1508.
23 per cent state the names of two actual electricity suppliers, while 22 per cent state the name of
one supplier. The majority (55 per cent), however, cannot name any other electricity suppliers.
• 63 per cent of the customers aged 25-35 know no other suppliers, compared to 52-56 per
cent of those who are older.
• 35 and 34 per cent respectively of the active and aware customers name two other electricity
suppliers, while this only applies to 18 per cent of the inactive customers.
Figure 48: Total knowledge of electricity suppliers. N=1508.
36 per cent of the Danish electricity customers only know their own supplier. 18 per cent also know
the name of one other supplier, while a total of 19 per cent both know their own supplier and two
more suppliers (total knowledge of electricity suppliers). 27 per cent have stated something else than
an actual electricity supplier (a grid company or something else) or that they do not know.

58
• 34 per cent of the customers aged 25-35 have poor knowledge of electricity suppliers (stated
something else than an actual electricity supplier or that they do not know), compared to 21-
28 per cent of those who are older.
• 31 and 29 per cent respectively of the aware and active customers name three electricity
suppliers, while this only applies to 15 per cent of the inactive customers.
Figure 49: Total knowledge of the electricity market. N=1508.
Five per cent of the Danish customers name the correct company operating power lines to their
home and one actual electricity supplier. Three per cent know their grid company and two electricity
suppliers, and an equally high share both knows their grid company, their electricity supplier and two
other electricity suppliers as well (total knowledge of the electricity market).
The category called “Other” includes those not naming a correct electricity supplier as their own
and/or not naming the correct grid company. A significant 89 per cent have poor knowledge of the
electricity market.
• 95 per cent of the customers aged 25-35 have poor knowledge of the electricity market,
compared to 84 per cent of the customers above the age of 65.
The open answers provided for these questions may be read in the appendix to the report.

59
The Danish Customers’ participation in the electricity market Electricity customers were further given different questions related to their participation in the
electricity market; including switching and comparing electricity contracts, the use of comparison
tools, as well as knowledge on contractual terms.
Signing and comparing of contracts Figure 50: Have you ever signed a new contract with an electricity supplier? N=1508.
58 per cent of the Danish electricity customers have signed a contract with an electricity supplier. 38
per cent have not, and four per cent are unsure.
• More men (62 per cent) than women (55 per cent) have signed a new contract with an
electricity supplier.
• The proportion is somewhat higher among those above 50 years (61-62 per cent) and lowest
among the younger ones (54-55 per cent).
• The share that has signed a new contract is significantly higher among the aware customers
(71 per cent) than the inactive (46 per cent). 10
Those who responded that they had signed a new contract with an electricity supplier were asked
when they last did this.
Figure 51: When did you last sign a new contract with an electricity supplier? N=880.
10 All active customers have signed a contract.

60
28 per cent of those who have signed a new contract did so less than one year ago and are
considered active customers. The largest share (37 per cent) changed 1-3 years ago, while 19 and 16
per cent respectively changed 3-5 years ago or more than five years ago.
• Women are slightly more active than men; 32 and 25 per cent respectively have signed a
new contract during the last twelve months.
• The share of active customers (signed contract in past year) is somewhat higher among those
who live in apartments (32 per cent), than those who live in houses (25 per cent).
• The inactive customers are the least likely to sign new contracts; a total of 54 per cent have
not signed a new contract for the last three years (compared to 31 per cent among the
aware).
The electricity customers who have signed new contracts in the past three years were asked why
they signed a new contract.
Figure 52: Why did you sign a new electricity contract? Several answers possible. N=570.
The majority state that they switched to save money (51 per cent). Some also did so because they
were approached by a salesperson (22 per cent), or because they wanted a green contract (21 per
cent).

61
15 per cent signed a new contract because they wanted better contractual terms (other than price),
and 14 per cent did so due to a change in life situation.
It is less common to switch due to bad experience with a previous contract (11 per cent), expired
contract (7 per cent), or desire for a local supplier (6 per cent),
Five per cent state other reasons for the contract change (see appendix), and two per cent are
uncertain.
• Slightly more men than women claim they signed a new contract to save money (55 and 47
per cent respectively) or to get a green contract (24 and 17 per cent respectively).
• Those below the age of 35 switch to a somewhat lesser extent to save money (45 per cent,
compared to 51-56 per cent among others), and to a greater extent due to a change in life
situation (26 per cent, compared to 4-16 per cent among the older customers).
• Among those living in apartments, a “change in life situation” is a more important reason
than among owners of houses (18 compared to 10 per cent).
Consumers who are not considered to be active (switched contract in past year), were asked if they
have compared their current contract to other contracts.
Figure 53: Have you ever compared your current electricity contract to other contracts? N=1261.
46 per cent have compared their current electricity contracts to other contracts. Half of the Danish
consumers, on the other hand, have never compared their contracts with others. Three per cent
respond that they are unsure.
• More men than women have compared electricity contracts (54 compared to 38 per cent).
• The share that has compared their contract to others is highest among the oldest (52 per
cent) and lowest among the youngest (39 per cent).
• All aware customers have compared contracts. Among the inactive customers, the majority
(60 per cent) say they have never compared electricity contracts. 11
11 The active customers have switched contract in the past year and were therefore not presented with this question.

62
Electricity customers who have compared their own contracts with others were asked when they
most recently did this.
Figure 54: When did you last compare your current electricity contract to other contracts? N=583.
Among those who have compared their contracts to other contracts, one in three have done this
within the past year and are considered to be aware customers. Somewhat more (50 per cent)
carried out such a comparison 1-3 years ago, while 13 per cent did so 3-5 years ago. Only four per
cent of those who have compared their own contract to others did so more than five years ago.
• Men are more aware electricity customers than women; 37 and 28 per cent respectively
have compared their contract to other contracts in the past year.
• Among the inactive customers most have carried out a comparison between one and three
years ago (75 per cent).

63
Those who have compared different contracts in the past three years but who have not switched,
were asked why they chose to keep their current contract.
Figure 55: You have compared different offers but decided to stay in your current contract. Why? Several answers possible. N=486.
Almost six in ten respond that they kept their current contract because they were satisfied.
Approximately five in ten say there was little or nothing to save by switching, while two in ten find it
difficult to understand the differences between contracts.
It is somewhat less common to keep one’s contract because one wants to keep the supplier as it is a
local supplier (14 per cent), or because it was difficult to find relevant information (14 per cent).
Even fewer respond that the binding period on the contract had not expired (7 per cent); the
switching process was too complicated (9 per cent); or one was, for various reasons, unable to switch
(5 per cent).
Three per cent state other reasons for deciding to remain in the current contract (see appendix),
while one per cent are unsure.
• The customers under the age of 50 report to the greatest extent that they were unable to
switch, for example because the supplier made this difficult (10-14 per cent). Almost none of
the older customers reported this (0 per cent).
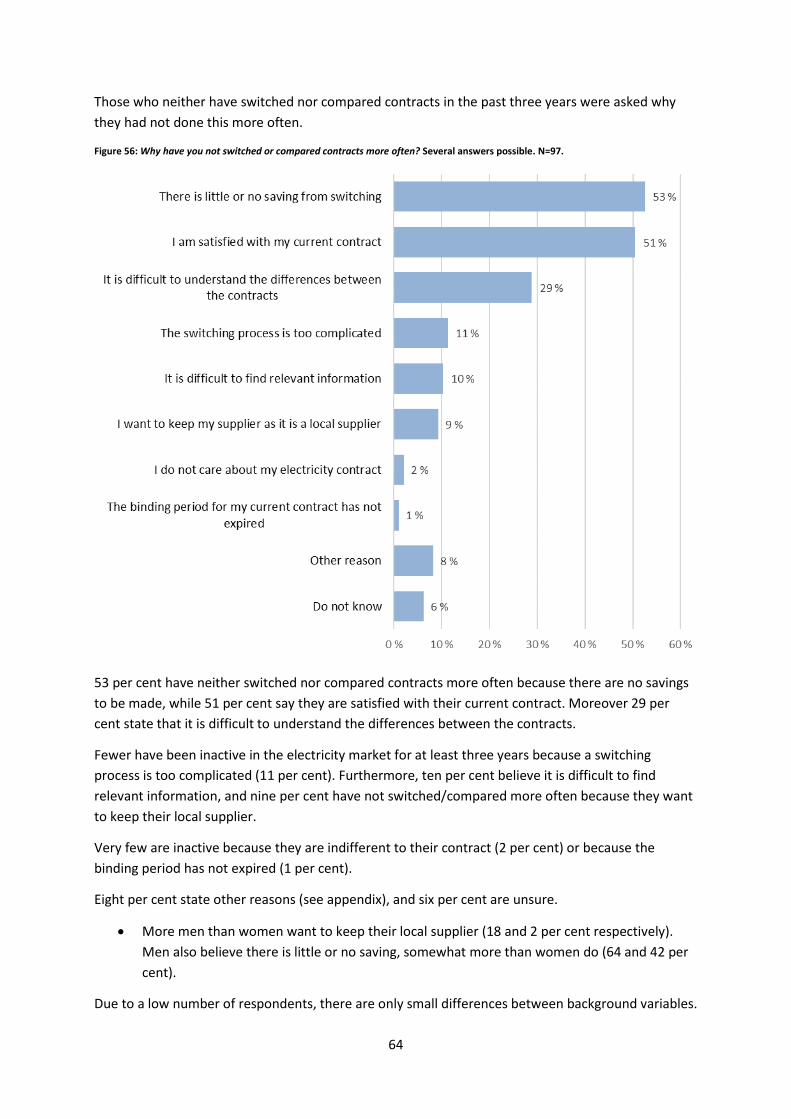
64
Those who neither have switched nor compared contracts in the past three years were asked why
they had not done this more often.
Figure 56: Why have you not switched or compared contracts more often? Several answers possible. N=97.
53 per cent have neither switched nor compared contracts more often because there are no savings
to be made, while 51 per cent say they are satisfied with their current contract. Moreover 29 per
cent state that it is difficult to understand the differences between the contracts.
Fewer have been inactive in the electricity market for at least three years because a switching
process is too complicated (11 per cent). Furthermore, ten per cent believe it is difficult to find
relevant information, and nine per cent have not switched/compared more often because they want
to keep their local supplier.
Very few are inactive because they are indifferent to their contract (2 per cent) or because the
binding period has not expired (1 per cent).
Eight per cent state other reasons (see appendix), and six per cent are unsure.
• More men than women want to keep their local supplier (18 and 2 per cent respectively).
Men also believe there is little or no saving, somewhat more than women do (64 and 42 per
cent).
Due to a low number of respondents, there are only small differences between background variables.

65
Those who have neither switched nor compared contracts were asked for the reasons for never
doing this.
Figure 57: Why have you never switched or compared contracts? Several answers possible. N=431.
The most common reason is that they are satisfied with their current contract (40 per cent). Many
also believe that savings are minimal (30 per cent), and that it is difficult to understand the
differences between contracts (28 per cent).
Fewer have been inactive in the electricity market because it is difficult to find relevant information
(14 per cent); the switching process is too complicated (9 per cent); one wants to keep the supplier
as this is local (7 per cent); one do not care about one’s electricity contract (6 per cent); one did not
know switching was possible (4 per cent); or the binding period of the contract had not expired (1 per
cent).
Three per cent provide other reasons for not switching or comparing contracts (see appendix), while
nine per cent are unsure as to the reason they have remained passive.
• 59 per cent of electricity customers above the age of 65 have been inactive because they are
satisfied with their current contract. In comparison, this applies to 26-46 per cent of the
younger customers.

66
The switching process The respondents were then given questions related to the switching process, including who initiated
the signing of their current contract; how one proceeded to choose contract; how one was
contacted, etc.
Figure 58: Who initiated the signing of your current contract? N=1508.
The majority of Danish electricity customers (53 per cent) initiated the signing of their current
contract themselves, while eight per cent say it was someone else in the household.
Eleven per cent say that it was the electricity supplier who took the initiative. It is less common that a
broker, union or other parties initiated the contract (2-4 per cent). A significant share (19 per cent) of
Danish electricity customers does not remember who took the initiative for their current contract.
• More men than women took this initiative themselves (60 and 45 per cent respectively),
while more women than men state that it was someone else in the household who arranged
their current electricity contract (11 and 5 per cent respectively). Also, more women than
men cannot remember who initiated the signing of the contract (23 and 15 per cent
respectively)
• The share that took the initiative to the contract themselves is lowest among those below
the age of 35 (41 per cent), while the share that states someone else in the household took
the initiative is highest in this age group (14 per cent).
• The share who themselves initiated their current contract is highest among the active and
aware customers (70 and 67 per cent respectively, compared to 46 per cent among the
inactive). The share that says that the electricity supplier took this initiative is highest among
the active customers (19 per cent, compared to 9-13 per cent among others). The inactive
customers answer to the greatest extent that someone else in the household took this
initiative (9 per cent). The inactive are also the most uncertain (25 per cent).

67
Those electricity customers who responded that either themselves or someone else in their
household initiated the signing of their current contract, were asked how they did this.
Figure 59: How did you go about choosing electricity contract? Several answers possible. N=912.
24 per cent used a comparison tool online when choosing an electricity contract. An equally large
share called one or several suppliers, while 17 per cent performed an internet search.
26 per cent state other methods (see appendix), while 21 per cent do not remember how they
initiated the contract.
• More men than women have used a comparison tool (30 compared to 16 per cent).
• The shares that called suppliers or performed internet searches become lower with age.
• The aware customers use comparison tools to a greater extent than the active and inactive
(41 per cent respectively, compared to 19-26 per cent). Relatively many inactive customers
do not remember how they chose an electricity contract (26 per cent, compared to 12-13 per
cent among others).

68
Those electricity customers who stated that they were contacted by an electricity supplier or a
broker were asked how this happened.
Figure 60: How did they contact you? N=227.
38 per cent stated that they were contacted by phone. Further, 19 per cent were contacted via
email; twelve per cent on the street; eight per cent received mails; and three per cent were
contacted via door sales.
Four per cent state other forms of contact (see appendix), while 15 per cent do not remember how
they were contacted by the electricity supplier or broker.
• More men than women were contacted via email (26 and 11 per cent respectively).
• 54 per cent of the customers between 50 and 65 years were contacted via Telephone,
compared to 30-34 per cent of the others. 12 per cent of those under the age of 35 were
contacted at the door, while this applies for 0 per cent of the older customers.
• The share that says they were contacted on the street is higher among the active customers
(29 per cent) than the aware and inactive (6-8 per cent).

69
Those who have made a switch in the past three years were asked to consider different statements
related to the switching process.
Figure 61: Before you made your current choice of electricity contract, to what extent did you experience the following …? Standardized
mean: 0=No experience and 100=High extent. “Do not know” is excluded. N=481-544.
Electricity customers who have made a switch experienced to a large extent that it was easy and
straightforward to sign a contract (average of 76 out of 100). Consumers also experienced to a fairly
great extent that there were many different electricity suppliers and many different
products/contracts that met their needs (67 and 66 respectively).
With regard to the remaining statements on the switching process, electricity customers have
experienced this to a moderate or a low degree. There is moderate agreement that one trusted the
information and advice from sellers (60) and that one was well-informed (59). However, there is low
agreement that it was easy to find trustworthy information and necessary advice (56); that one could
easily compare different contracts (51); and that it was easy to understand what was included in the
price (49).
• The older electricity customers experienced to the greatest extent that it was easy to sign a
contract, but to the least extent that it was easy to understand what is included in the price.
• Those living in apartments generally experienced the switching process as somewhat easier
than those living in houses, particularly with regard to trust in the sellers.
• The aware customers felt more well-informed than the active and inactive did.

70
Those who have not made a switch in at least three years were also asked to consider different
statements concerning the switching process – given a hypothetical switch in the future.
Figure 62: If you in the future would like to choose an electricity contract, to what extent do you agree that…? Standardized mean: 0=No
experience and 100=High extent. “Do not know” is excluded. N=778-855.
Those consumers who have not performed a switch believe that there will be quite many different
suppliers and quite many different contracts to choose from that meet their needs (average of 63
and 61 respectively out of 100). They also believe to a moderate extent that they will be well-
informed (60), while there is less agreement that it will be easy and straightforward to sign an
electricity contract – should they make a switch in the future (57).
There is very little agreement that it will be easy to compare different contracts (43); it will be easy to
find trustworthy information (43); it will be easy to understand what the price includes (39); and that
they will trust information and advice from sellers, should they make a switch (39).
• Women genereally agree somewhat less to the different statements than men do, especially
when it comes to how easy it will be to sign a contract and to find trustworthy information.
• Electricity customers below the age of 35 generally agree more to the statements than the
older customers do, especially when it comes to how easy it will be to compare contracts, to
find trustworthy information and to understand what the price includes, and trust in sellers.
• The aware customers generally believe that a switching process will be easier than what the
inactive customers believe, only with the exception of trust in sellers.

71
Comparison tools The respondents were also asked to consider different questions on comparison tools.
The electricity customers who have signed a contract in the past three years were asked if they had
visited an online comparison tool.
Figure 63: When you signed/compared your current electricity contract, did you visit an online comparison tool? N=570.
38 per cent of the electricity customers who had signed or compared a contract in the past three
years visited an online comparison tool. More than half (57 per cent) however claim that they did not
use such a tool when signing/comparing contracts, while five per cent are uncertain.
• More men than women used comparison tools (49 and 25 per cent respectively).
• The share that used comparison tools decreases with age and is highest among the youngest
(48 per cent).
• The aware customers used comparison tools to the greatest extent (68 per cent, compared
to 32 and 31 per cent respectively of the active and inactive).
Those who had used a comparison tool were asked to name the tool they had used.
Figure 64: What comparison tool(s) did you visit? Several answers possible. N=217.
71 per cent have used “Elpris.dk”. Six per cent stated other comparison tools (see appendix), while a
significant 24 per cent say they do not remember which comparison tool they visited.

72
• 76 per cent of the men and 57 per cent of the women have used “Elpris.dk”.
The electricity customers who have not signed a contract in at least three years were also asked
about comparison tools.
Figure 65: Do you know any of any online comparison tools for electricity contracts? N=938.
One in three consumers who have not signed a new contract in more than three years are aware of
comparison tools for electricity contracts. Two in three however, are not aware of such tools.
• The aware customers are more aware of comparison tools than the inactive (52 compared to
30 per cent).
Those aware of comparison tools for electricity contracts were asked which comparison tools they
had visited.
Figure 66: What comparison tool(s) have you visited online? Several answers possible. N=306.
The majority (72 per cent) have visited “Elpris.dk”. Further, 24 per cent stated other comparison
tools (see appendix), while four per cent say that they have not visited any comparison tools, and
four per cent respond “Do not know.”

73
• The share that has visited “Elpris.dk” is highest among the youngest (89 per cent, compared
to 60-76 per cent among the older).
• Among the aware customers the share that has visited “Elpris.dk” is greater than among the
inactive (90 and 68 per cent respectively).
Terms of contract Electricity customers were asked about their current contracts and how well they know the terms of
the contract.
Figure 67: When you think of your current electricity contract, are you aware of …? Share that has answered “Yes”. N=1508.
The majority know if the price can change during the contract term (59 per cent) and the effective
unit rate (56 per cent). A small majority also know the contract’s binding period (53 per cent), how
the electricity price is set (53 per cent), and whether they have a green contract (52 per cent).
Slightly less than half of the Danish customers know the contract’s notice period (46 per cent), while
37 per cent know what happens if they terminate the contract before the expiry of the binding
period.
• Men generally have significantly better knowledge of the terms of their electricity contracts
than women.

74
• Those living in houses have better knowledge of the effective unit rate and whether the price
can change, than those who live in apartments.
• The aware and active customers generally have the best knowledge of their terms of
contract. The inactive customers have the poorest knowledge of the terms in their electricity
contracts.
The Danish Customers’ attitudes towards the electricity market The respondents were asked to consider different statements concerning the electricity market.
Figure 68: To what extent do you agree with the following statements …? Standardized mean: 0=Fully disagree and 100=Fully agree. “Do
not know” is excluded. N=840-1391.12
There is quite great agreement that it is easy to switch electricity supplier (average of 69 in 100).
There is also moderate agreement that it is important to have a green electricity contract (65).
The Danish electricity customers neither agree nor disagree that one can save money by switching
contract (54), and there is very little agreement that they regularly compare contracts (41).
• Men most often compare contracts, while women to the greatest extent believe that it is
important to have a green contract.
• The older electricity customers find it easier to switch electricity supplier, however, they are
less in agreement that there is money to be saved by switching, that they regularly compare
contracts, and that it is important to have a green contract.
• The active customers are most in agreement that it is easy to switch supplier, that there is
money to save, and that it is important to have a green contract. The aware customers most
frequently compare contracts. The inactive customers generally agree less than the others.
12 Customers who reported that they have never compared their current electricity contracts were not presented with the statement “I regularly compare contracts”.

75
Billing and Information The respondents were asked to consider different statements concerning billing and information.
Figure 69: To what extent do you agree with the following statements …? Standardized mean: 0=Fully disagree and 100=Fully agree. “Do
not know” is excluded. N=1411-1420.
Danish electricity customers want better information on the price they pay for electricity (score of 70
out of 100). Some also want updated information about their consumption, for example online or in
an app (64). There is little agreement that the electricity bill is simple and easy to understand (52).
• The older one is, the less one agrees that the bill is simple and easy to understand.
• The active and aware consumers are most in agreement that the bill is easy to comprehend,
while the inactive are in least agreement.

76
The electricity customers were also given different questions about the electricity bill; about how
they receive it; and what information they read on the bill.
Figure 70: How do you receive your electricity bill? N=1508.
Nine in ten Danish electricity customers receive the bill electronically. One in ten receive it as a paper
invoice by mail.
• The older one is, the more common it is to receive the electricity bill electronically; 95 per
cent of those aged 65 and above, and 82 per cent of those below the age of 35 do so.
• The share that receives the bill electronically is highest among those living in houses (93 per
cent), and lower among those living in apartments (85 per cent).
Figure 71: Do you read the information presented on your electricity bill? N=1508.
Three in four Danish electricity customers read the information presented on their electricity bill.
• The share that reads information increases with age; 86 per cent of the oldest and 68 per
cent of the youngest do so.
• The share that reads the information on the electricity bill is highest among the aware
electricity customers (91 per cent), slightly lower among the active (82 per cent) and lowest
among the inactive (70 per cent).

77
The electricity customers who stated that they read the information presented on the electricity bill
were asked what information they read here.
Figure 72: What information do you read on your electricity bill? Share that has answered “Yes”. N=1127.
Almost all (96 per cent) look at the total amount they must pay, and a large number read the
specification of the electricity consumption the bill is based on (91 per cent). Many also look at the
specification of the different price elements the electricity cost is based on (84 per cent), as well as
estimated annual consumption (76 per cent).
It is slightly less common to read about one’s historical consumption (68 per cent), and notifications
of changes that affect the electricity price (61 per cent). Further, it is uncommon to look for
information on where to enquire for advice etc., the contract expiry date and how the electricity is
produced (all 33 per cent).
Nine per cent look for other information on their bills (see appendix).

78
• More men than women look for information about historical consumption (74 and 62 per
cent) and which bodies one can turn to for advice, complaints, etc (39 and 27 per cent).
• Electricity customers below the age of 35 read the least information concerning the
following: total payable amount; various price elements the bill is based on; specification of
electricity consumption; estimated annual consumption; and consumption history. However,
this age group is most concerned with information on the contract’s expiry date.
• Persons living in apartments read more about how the electricity is produced than those
living in houses (22 and 16 per cent respectively).
• The active and the aware customers generally read more of the information presented on
the electricity bill than the inactive customers.
• Those who receive the bill electronically read slightly more of the information than those
who receive paper invoices, except for information on expiry date and how the electricity is
produced. Somewhat higher shares of those who receive paper bills say that the information
is not available on the bill, compared to those who receive electronic bills.
In conclusion, all respondents were asked how they prefer to get information from their electricity
supplier.
Figure 73: How do you prefer to get information from your Electricity supplier? Several answers possible. N=1508.

79
The majority (62 per cent) want to receive information from their electricity supplier via E-mail. 31
per cent prefer to receive it at “My pages”, and 29 per cent want information on or attached to their
bill.
It is less common to want information in an app from the supplier (17 per cent), in a separate letter
(11 per cent), or by SMS (10 per cent). Only five per cent want information at a display in their house.
One per cent state other information channels (see appendix), and three per cent respond “do not
know.”
• The younger electricity customers are to a greater extent than the older customers
interested in information in an app or by SMS.
• The share that wants information at “My pages” is highest among the aware customers (39
per cent) and lowest among inactive (28 per cent).

80
The Finnish Customers This chapter takes a closer look at the Finnish electricity customers and their presence and
participation in the electricity market, as well as their attitudes toward the Finnish electricity market.
Interesting and any significant differences between background variables will be commented.
The Finnish Customers’ presence in the electricity market The consumers were asked different questions about their presence in the Finnish electricity market.
Figure 74: Do you use electricity to heat your home? N=1504.
Four in ten Finns responded that they use electricity to heat their homes.
• The share that reports that they do not use electricity is lower among those under the age of
35 (50 per cent), than other groups (53-63 per cent).
• The share that uses electricity for heating is higher among those living in houses (71 per
cent), than those living in apartments (24 per cent).
• Differences between active, aware and inactive customers are minor; 42, 44 and 38 per cent
respectively use electricity to heat their homes.
Figure 75: Approximately how many kilowatt-hours do you use each year? N=1504.

81
A total of 40 per cent respond that they use less than 10,000 kWh per year. 24 per cent use between
10,000 and 19,999 kWh, and only five per cent use more than 20,000 kWh per year. 32 per cent
respond that they do not know how much electricity they use in a year.
• Men claim to use less electricity than women; 48 per cent of men and 32 per cent of women
use less than 10,000 kWh per year. Women are more uncertain than men as to how much
electricity they use (42 compared to 21 per cent).
• Those living in houses use more electricity than those living in apartments. 54 and 15 per
cent respectively claim to use more than 10,000 kWh per year.
• The active customers claim to use somewhat less electricity than other customers. 27 per
cent use less than 5,000 kWh per year, compared to 23 and 19 per cent respectively of aware
customers and inactive customers. The inactive customers are the most unsure; 41 per cent
do not know how much electricity they use, compared to 24 and 22 per cent respectively of
the active and the aware customers.
Figure 76: How much money do you spend on electricity in total (supplier cost, grid cost and taxes) an average winter month? N=1504.
31 per cent respond that they spend less than EUR 50 on electricity an average winter month; 25 per
cent spend EUR 50-100; and a total of 22 per cent spend EUR 100-200. 14 per cent of Finns spends
more than EUR 200 on electricity an average winter month. Eight per cent are uncertain.
• Finns below the age of 35 report the least spending on electricity; 41 per cent claim that they
use less than EUR 50 in an average winter month, compared to 23 per cent of those above
the age of 65.
• Those living in houses spend more on electricity than those living in apartments; 71 and 18
per cent respectively spend more than EUR 100 in an average winter moth.
• The difference between the different consumer profiles are small, but the aware customers
are somewhat less uncertain of their electricity spending (4 per cent), than the inactive and
active (10 and 7 per cent respectively).

82
The Finnish Customers’ knowledge of the electricity market The electricity customers were asked to consider different statements concerning electricity
suppliers and switching between these.
Figure 77: Do you believe the following statements are correct or not? Share that believes the statements are correct. N=1504.
The vast majority believe that they themselves can choose electricity supplier (94 per cent). Further,
57 per cent believe that in the event of a change of supplier, the new supplier will be responsible for
reading the meter.
19 per cent believe that the electricity supplier is determined by where one lives, while 75 per cent
believe that this is wrong. Only ten per cent believe that changing electricity supplier can impact
power cuts, and very few believe that one must replace the meter in the event of a change of
supplier (3 per cent).
• Women are more uncertain than men as to whether the new supplier will be responsible for
reading the meter (28 per cent compared to 19 per cent).
• The share that believes it is correct that one’s electricity supplier is determined by where one
lives is highest among those below the age of 35 (29 per cent). Further, the youngest are
most uncertain as to whether one may choose electricity supplier oneself; that one must
replace the electricity meter when changing supplier; the number of power cuts is affected
by supplier change; and if the new supplier is responsible for reading the meter.
• The share that believes it is correct that the electricity supplier is determined by where one
lives, is higher among those who live in apartments than those living in houses (22 and 15 per
cent respectively).
• Somewhat fewer active than aware and inactive customers believe it is true that one’s
electricity supplier is determined by where one lives; that one must replace electricity meter
when changing supplier; and that switching to another supplier affects the number of power
cuts. The inactive customers are generally most unsure of whether the statements are true
or not.

83
Further, the respondents were asked to name the company that operates the power lines to their
home, their own electricity supplier and two other electricity suppliers.
Figure 78: Name the company that operates the power lines to your home. N=1504.13
60 per cent state the name of their actual grid company. 33 per cent have stated the wrong name –
another grid company, an electricity supplier or something else. Seven per cent respond “Do not
know.”
• The share responding “Do not know” is somewhat higher among those beneath the age of 35
(13 per cent) than the older customers (4-8 per cent).
• 63 per cent of the customers living in apartments name the correct company, while 55 per
cent of those living in houses do so.
Figure 79: Who is the electricity supplier in your home? N=1502.
13 This variable is based on the respondents’ postal codes. It should be considered that the postal codes may be incorrect (e.g. if respondents have moved, etc.). Additionally, some grid companies operate a distribution grid only in a small part of the municipality yet have been listed in the coverage data to operate in the whole municipality. This leads to that all the postal codes in the municipality is being represented as being serviced by that grid company. This may have resulted in some false correct answers as some postal code areas are represented in the grid companies coverage data as being serviced by multiple grid companies whereas in reality the postal code area is serviced by only one grid company.

84
87 per cent state the name of an actual electricity supplier.14 Six per cent have stated something else
than an actual electricity supplier (a grid company or something else). Eight per cent respond “Do not
know.”
• The share naming a correct electricity supplier is highest among those above the age of 35
(86-90 per cent) and lowest among those below the age of 35 (78 per cent).
• The inactive customers are more unsure (10 per cent) than the active and aware (5-6 per
cent).
Figure 80: Can you name two other electricity suppliers? N=1504.
55 per cent state the names of two actual electricity suppliers, while 24 per cent state the name of
one supplier. 21 per cent cannot name any other electricity suppliers.
• 27 per cent of the customers aged 25-35 know no other suppliers, compared to 18-23 per
cent of those who are older.
• 70 per cent of the active customers name two other electricity suppliers, while this only
applies to 51 and 46 per cent respectively of the aware and inactive customers.
Figure 81: Total knowledge of electricity suppliers. N=1504.
14 We cannot know whether this is their actual electricity supplier or just another supplier.

85
14 per cent of Finnish electricity customers only know their own supplier. 21 per cent also know the
name of one other supplier, while a total of 51 per cent both know their own supplier and two more
suppliers (total knowledge of electricity suppliers). 13 per cent have stated something else than an
actual electricity supplier (a grid company or something else) or that they do not know.
• 22 per cent of the customers aged 25-35 have poor knowledge of electricity suppliers (stated
something else than an actual electricity supplier or that they do not know), compared to 10-
14 per cent of those who are older.
• 65 per cent of the active customers name three electricity suppliers, while this only applies to
49 and 43 per cent respectively of the aware and inactive customers.
Figure 82: Total knowledge of the electricity market. N=1504.
Nine per cent of Finnish customers name the correct company operating power lines to their home
and one’s own electricity supplier. 13 per cent know their grid company and two electricity suppliers,
while 34 per cent both know their grid company, their electricity supplier and two other electricity
suppliers as well (total knowledge of the electricity market).
The category called “Other” includes those not naming a correct electricity supplier as their own
and/or not naming the correct grid company. 44 per cent have poor knowledge of the electricity
market.
• 42 per cent of the active customers name their grid supplier, their electricity supplier and
two other electricity suppliers. 30 per cent of the aware and inactive customers have the
same knowledge of the electricity market.
The open answers provided for these questions may be read in the appendix to the report.

86
The Finnish Customers’ participation in the electricity market Electricity customers were further given different questions related to their participation in the
electricity market; including switching and comparing electricity contracts, the use of comparison
tools, as well as knowledge on contractual terms.
Signing and comparing of contracts Figure 83: Have you ever signed a new contract with an electricity supplier? N=1504.
87 per cent of the Finnish electricity customers have signed a contract with an electricity supplier.
Ten per cent have not, and three per cent are unsure.
• The older one is, the more common it is to have signed a new electricity contract. The
proportion is highest among the oldest (91 per cent) and lowest among the youngest (82 per
cent).
• 82 and 80 per cent respectively of the aware and inactive customers have signed a new
contract with an electricity supplier.15
Those who responded that they had signed a new contract with an electricity supplier were asked
when they last did this.
Figure 84: When did you last sign a new contract with an electricity supplier? N=1309.
15 All active customers have signed a contract.

87
39 per cent of those who have signed a new contract did so less than one year ago and are
considered active customers. 35 per cent signed a new contract 1-3 years ago, while ten and 16 per
cent respectively changed 3-5 years ago and more than five years ago.
• Somewhat more of those living in houses than those living in apartments are active
customers (43 and 37 per cent respectively).
• The inactive customers are the least likely to sign new contracts; a total of 46 per cent have
not signed a contract for more than three years (compared to 35 per cent among the aware).
The electricity customers who have signed new contracts in the past three years were asked why
they signed a new contract.
Figure 85: Why did you sign a new electricity contract? Several answers possible. N=967.
45 per cent state that they switched to save money, while 34 per cent changed because the previous
contract expired. Some also made a switch due to a change in life situation (17 per cent), because
they were approached by a salesperson (14 per cent) or to get better contractual terms (12 per cent).
It is less common to switch due to a desire for a green contract (8 per cent); to get a local supplier (4
per cent); or because of poor experience with one’s previous contract (4 per cent). Two per cent
state other reasons for switching contract (see appendix).

88
• More women than men claim they switched due to a change in life situation (21 compared to
14 per cent).
• Those below the age of 35 switched more often due to a change in life situation and more
rarely because their previous contract expired (34 per cent), compared to older customers
(5-20 per cent). People aged 35-49 switch more often to save money (53 per cent), compared
to other age groups (40-44 per cent).
• More active customers changed because their previous contract expired (39 per cent),
compared to the aware and inactive customers (31 and 24 per cent respectively). The aware
customers are most concerned with price, and 50 per cent have signed a new contract in the
past three years to save money (compared to 47 and 39 percent among the active and
inactive customers).
Consumers who are not considered to be active (switched contract in the past year), were asked if
they have compared their current contract to other contracts.
Figure 86: Have you ever compared your current electricity contract to other contracts? N=994.
Six in ten have compared their current electricity contracts to other contracts. 37 per cent have never
compared their contracts with others. Two per cent respond that they are unsure.
• More men than women have compared their electricity contracts (66 compared to 57 per
cent).
• Those who live in a house are more likely to have compared their current contract with other
contracts, compared to those who live in an apartment (69 and 57 per cent respectively)
• All aware customers have compared contracts. Among the inactive customers, more than
half (51 per cent) say they have never compared electricity contracts. 16
16 The active customers have switched contract in the past year and were therefore not presented with this question.

89
Electricity customers who have compared their own contracts with others were asked when they
most recently did this.
Figure 87: When did you last compare your current electricity contract to other contracts? N=610.
46 per cent of those who have compared their contracts to other contracts have done this within the
past year and are considered to be aware customers. Somewhat fewer (44 per cent) carried out such
a comparison 1-3 years ago, while eight per cent did so 3-5 years ago. Only two per cent of those
who have compared their own contract to others did so more than five years ago.
• Men are somewhat more aware electricity customers than women; 50 and 41 per cent
respectively have compared their contract to other contracts in the past year.
• The proportion of aware electricity customers is highest among those below the age of 35,
where 59 per cent have compared contracts in the past year (compared to 42-46 per cent
among the other age groups).
• Among the inactive customers most have carried out a comparison between one and three
years ago (82 per cent).

90
Those who have compared different contracts in the past three years but who have not switched,
were asked why they chose to keep their current contract.
Figure 88: You have compared different offers but decided to stay in your current contract. Why? Several answers possible. N=550.
46 per cent respond that they kept their current contract because they were satisfied. 41 per cent
respond there was little or nothing to save by switching.
It is somewhat less common to keep the supplier because it is a local supplier, or not change because
the binding period for the current contract had not expired (both 17 per cent). Even fewer say that
they did not switch because it was difficult to understand the differences between the contracts (10
per cent); it was difficult to find relevant information (7 per cent); the switching process was too
complicated (6 per cent); or one was, for various reasons, unable to switch (5 per cent).
Five per cent state other reasons for deciding to remain in their current contract (see appendix),
while two per cent are unsure.
• The youngest electricity customers report to a greater extent than the older that it was
difficult to understand the differences between contracts and that the switching process was
too complicated (20 and 14 per cent respectively, compared to 6-10 and 4-5 per cent among
other age groups).

91
Those who neither have switched nor compared contracts in the past three years were asked why
they had not done this more often.
Figure 89: Why have you not switched or compared contracts more often? Several answers possible. N=60.
The majority (57 per cent) have neither switched nor compared contracts more often because they
are satisfied with their current contract. Moreover, 37 per cent claim that there are no savings to be
made and an equally large share says that they want to keep their local supplier.
27 per cent state that it is difficult to understand the differences between the contracts. 13 per cent
state that the switching process is too complicated.
Few have been inactive in the electricity marked for at least three years because the binding period
for their current contract has not expired (8 per cent); because they are indifferent to their contract
(7 per cent); or because they find it difficult to find relevant information (5 percent).
Five per cent state other reasons (see appendix), and three per cent are unsure.
Due to a low number of respondents, there are only small differences between background variables.

92
Those who have neither switched nor compared contracts were asked for reasons for never doing
this.
Figure 90: Why have you never switched or compared contracts? Several answers possible. N=89.
The most common reasons are that they are satisfied with their current contract; it is difficult to
understand the differences between the contracts; and one wants to keep the supplier as it is local
(31-33 per cent).
It is also quite common to never switch contract because one believes that savings are minimal (24
per cent), that it is difficult to find relevant information (17 per cent) and that the switching process
is too complicated (16 per cent).
Fewer have been inactive in the electricity market because they do not care about one’s electricity
contract (6 per cent); because one did not know switching was possible (4 per cent); or because the
binding period for one’s contract has not expired (3 per cent).
Two per cent provide other reasons for not switching or comparing contracts (see appendix), while
nine per cent are unsure as to the reasons they have remained passive.
Due to a low number of respondents, there are only small differences between background variables.

93
The switching process The respondents were then given questions related to the switching process, including who initiated
the signing of their current contract; how one proceeded to choose contract; how one was
contacted, etc.
Figure 91: Who initiated the signing of your current contract? N=1504.
The majority of Finnish electricity customers (68 per cent) themselves initiated the signing of their
current contract, while eleven per cent say it was someone else in the household.
14 per cent respond that it was the electricity supplier who took the initiative. It is not common that
a broker took the initiative (2 percent), and less than one percent say that a union or other parties
initiated the contract.
Three per cent of Finnish electricity customers do not remember who took the initiative for their
current contract.
• More men than women took this initiative themselves (72 and 65 per cent respectively),
while more women than men state that it was someone else in the household who arranged
the electricity contract they currently have (16 and 7 per cent respectively).
• The share responding that their supplier took the initiative is highest among those above the
age of 65 (19 per cent, compared to 11-13 percent among the other age groups).
• The share who initiated the contract themselves is highest among the aware customers (77
per cent, compared to 63-71 per cent among others). The inactive customers report to a
greater extent than others that someone else in the household arranged the electricity
contract (16 per cent, compared to 5-13 per cent among others). More active costumers say

94
that the supplier or sales representatives of the supplier took the initiative (22 per cent,
compared to 6-11 per cent among others).
Those electricity customers who responded that either themselves or someone else in their
household initiated the signing of their current contract, were asked how they did this.
Figure 92: How did you go about choosing electricity contract? Several answers possible. N=1199.
42 per cent used a comparison tool online when choosing an electricity contract. 14 per cent
performed an internet search, while nine per cent called one or several suppliers.
30 per cent state other methods (see appendix), while 15 per cent do not remember how they
initiated the contract.
• More men than women used a comparison tool online (47 compared to 38 per cent).
• The share that made an internet search becomes lower with age.
• People living in houses used comparison tools to a greater extent than those living in
apartments (53 per cent compared to 37 per cent).
• The active and aware customers used comparison tools to a greater extent than the inactive
(57 and 51 per cent respectively, compared to 28 per cent).

95
Those electricity customers who stated that they were contacted by an electricity supplier or a
broker were asked how this happened.
Figure 93: How did they contact you? N=240.
The majority (49 per cent) stated that this was by phone. Further, 17 per cent were contacted by E-
mail; 13 per cent were contacted on the street; 11 per cent received mail; and four percent were
contacted via door sales.
Three per cent state other forms of contact (see appendix), while four per cent do not remember
how they were contacted by the electricity supplier or broker.
• The share that says they were contacted on the street is higher among the youngest
customers (33 per cent, compared to 6-13 per cent of the older ones).
Due to a low number of respondents, there are only minor differences between other background
variables.

96
Those who have made a switch in the past three years were asked to consider different statements
related to the switching process.
Figure 94: Before you made your current choice of electricity contract, to what extent did you experience the following …? Standardized
mean: 0=No experience and 100=High extent. “Do not know” is excluded. N=925-951.
Electricity customers who have made a switch experienced to a great extent that it was easy and
straightforward to sign a contract (average of 81 out of 100). They also trusted the information and
advice from sellers (70).
With regards to the remaining statements on the switching process, electricity customers have
experienced this to a moderate degree. The customers experienced to a fairly great extent that it
was easy to understand what is included in the price (68); that it was easy to find trustworthy
information and necessary advice (65); that one could easily compare different electricity contracts
with each other (63); and that one was well informed (62).
The Finnish customers experienced to a somewhat lower extent that there were many different
products/contracts that met their needs (56); and that there were many different electricity suppliers
who met their needs (55).
• Men agree more than women that they could easily compare different electricity contracts;
that it was easy to understand what is included in the price/agreement; and that they were
well-informed.
• The oldest customers experienced to the highest extent that they could easily compare
different contracts with each other.

97
• Those living in houses generally experienced the switching process as easier, compared to
those living in apartments.
• The active customers experienced the process of signing a new contract as far less
complicated than the other customers, especially the inactive ones.
Those who have not made a switch in at least three years were also asked to consider different
statements concerning the switching process – given a hypothetical switch in the future.
Figure 95: If you in the future would like to choose an electricity contract, to what extent do you agree that… ? Standardized mean: 0=No
experience and 100=High extent. “Do not know” is excluded. N=505-519.
Those consumers who have not performed a switch believe to a fairly great extent that there will be
many different suppliers and quite many different contracts to choose from that meet their needs
(average of 68 and 67 out of 100). Many also believe that it will be easy and straightforward to sign
an electricity contract – should they make a switch in the future (68).
Consumers only believe to a moderate extent that they will be well-informed and that it will be easy
to find trustworthy information (both 57).
Finnish electricity customers neither agree nor disagree that it will be easy to compare different
contracts; that it will be easy to understand what the price includes; and that they will trust
information and advice from sellers, should they make a switch (all average of 52).
• In case of a switching process, men believe to a greater extent than women that they will be
well-informed.

98
• In general, the aware customers believe that a switching process will be much easier than
what the inactive customers believe.
Comparison tools The respondents were also asked to consider different questions on comparison tools.
The electricity customers who have signed a contract in the past three years were asked if they had
visited an online comparison tool.
Figure 96: When you signed/compared your current electricity contract, did you visit an online comparison tool? N=967.
52 per cent of the electricity customers who had signed or compared a contract in the past three
years visited an online comparison tool. 46 per cent claim that they did not use such a tool when
signing/comparing contracts, while two per cent are uncertain.
• Somewhat more men than women used comparison tools when they signed their current
contract (56 and 47 per cent respectively).
• The aware customers used comparison tools to the greatest extent (64 per cent, compared
to 53 and 43 per cent respectively of the active and inactive).

99
Those who had used a comparison tool were asked to name the tool they had used.
Figure 97: What comparison tool(s) did you visit? Several answers possible. N=499.
The majority (64 per cent) used “Energiaviraston ylläpitämä sähkön hintavertailusivusto
(sahkonhinta.fi)”. Some also used “kilpailuttaja.fi” (3 per cent) and “Vertaa.fi” (2 per cent).
Ten per cent stated other comparison tools (see appendix), while a significant 26 per cent say they
do not remember which comparison tool they visited.
• 72 per cent of the aware customer have visited ”sahkonhinta.fi ”, compared to 65 and 59 per
cent respectively of the active and inactive. Six per cent of the active have visited
“kilpailuttaja.fi”, while almost none of the aware and inactive have done so.
• The inactive customers are most unsure; 36 per cent do not remember which comparison
tool they visited, compared to 19 and 24 per cent respectively of the aware and active.
The electricity customers who have not signed a contract in at least three years were also asked
about comparison tools.
Figure 98: Do you know any of any online comparison tools for electricity contracts? N=537.
One in three customers who have not signed a new contract in more than three years are aware of
comparison tools for electricity contracts. Two in three, however, are not aware of such tools.

100
• Somewhat more men than women are aware of tools for price comparisons (40 compared to
30 per cent).
• The aware customers are more aware of comparison tools than the inactive (65 compared to
24 per cent).
Those aware of comparison tools for electricity contracts were asked which comparison tools they
had visited.
Figure 99: What comparison tool(s) have you visited online? Several answers possible. N=185.
Among those who know of comparison tools, almost nine in ten have visited “Energiaviraston
ylläpitämä sähkön hintavertailusivusto (sahkonhinta.fi)”. 16 per cent stated other comparison tools
(see appendix). Four per cent respond “Do not know.”
• Somewhat more men than women have visited “sahkonhinta.fi” (93 and 81 per cent
respectively).
Due to a low number of respondents, there are only minor differences between background
variables.

101
Terms of contract Electricity customers were asked about their current contracts and how well they know the terms of
the contract.
Figure 100: When you think of your current electricity contract, are you aware of …? Share that has answered “Yes”. N=1504.
The majority know the contract’s binding period (86 per cent) and how the electricity price is set (83
per cent). Many also know the contract’s notice period (72 per cent).
Around half of the Finnish electricity customers (53 per cent) know what happens if they terminate
the contract before the expiry of the binding period, and if the price can change during the contract
term (51 per cent). Slightly less than half (46 per cent) know whether they have a green contract.
• More men than women know the consequence of terminating the contract before the
binding period expires (57 and 49 per cent respectively), while more women than men know
if the price can change during the contract term (55 and 47 per cent respectively).
• Electricity customers under the age of 35 have the poorest knowledge of the binding period
and the notice period, while they have the best knowledge of whether the contract is green
and if the price can change.
• Those living in houses have better knowledge of how prices are set than those who live in
apartments (87 and 80 per cent respectively).
• In general, the aware and active customers have the best knowledge of their contractual
terms, while the inactive customers have the least knowledge. However, when it comes to
knowing whether the price can change, the inactive customers have the best knowledge.

102
The Finnish Customers’ attitudes towards the electricity market The respondents were asked to consider different statements concerning the electricity market.
Figure 101: To what extent do you agree with the following statements …? Standardized mean: 0=Fully disagree and 100=Fully agree.
“Do not know” is excluded. N=1126 1463.17
Finns agree that it is easy to switch electricity supplier and that one can save money by switching
contract (averages of 76 and 71 out of 100).
The Finish electricity customers are only in moderate agreement that it is important to have a green
electricity contract (60), while there is even less agreement that they regularly compare contracts
(51).
• Men agree more than women that it is easy to switch supplier, and that they often compare
contracts. Women agree more than men that it is important to have a green contract.
• The younger electricity customers find it most important to have a green contract, however,
they are least in agreement that it is easy to switch electricity supplier, compared to other
age groups.
• The active and the aware customers are most in agreement that it is easy to switch supplier.
The active also believe to the greatest extent that there is money to save, while the aware
most frequently compare contracts.
17 Customers who reported that they have never compared their current electricity contracts were not presented with the statement “I regularly compare contracts”.

103
Billing and Information The respondents were asked to consider different statements concerning billing and information.
Figure 102: To what extent do you agree with the following statements …? Standardized mean: 0=Fully disagree and 100=Fully agree.
“Do not know” is excluded. N=1465-1482.
Finnish electricity customers agree to the statement about preferring to get all electricity costs on
one bill instead of separate bills from the supplier and the network company (average of 78 in 100).
Finns also agree that the electricity bill is simple and easy to understand (73).
Additionally, quite many want updated information about their consumption (66) and better
information about the price they pay for electricity (64).
• The active customers are most in agreement that the bill is easy to comprehend, while the
inactive are in least agreement.
The electricity customers were also given different questions about the electricity bill; about how
they receive it; and what information they read on the bill.
Figure 103: How do you receive your electricity bill? N=1504.

104
Six in ten Finish electricity customers receive the bill electronically. Four in ten receive it as a paper
invoice by mail.
• The share that receives the bill electronically is highest among the customers aged 65 and
above (67 per cent), and lower among the younger ones (55-59 per cent).
• The share receiving the bill electronically is somewhat higher among the active customers
(63 per cent) than the aware (60 per cent) and the inactive (57 per cent).
Figure 104: Do you read the information presented on your electricity bill? N=1504.
85 per cent of the Finish electricity customers read the information presented on their electricity bill.
• The share that reads information increases with age; 91 per cent of the oldest and 79 per
cent of the youngest do so.
• The share that reads the information on the electricity bill is highest among the aware
customers (93 per cent), slightly lower among the active (88 per cent) and lowest among the
inactive (79 per cent).

105
The electricity customers who stated that they read the information presented on the electricity bill
were asked what information they read.
Figure 105: What information do you read on your electricity bill? Share that has answered “Yes”. N=1277.
Almost all (98 per cent) look at the total amount they must pay. A large number also read the
specification of the electricity consumption the bill is based on and the specification of the different
price elements the electricity cost is based on (both 89 per cent).
It is less common to read about historical consumption (62 per cent) and notifications of changes
that affect the electricity price (58 per cent). It is uncommon to look for information on the contract
expiry date (39 per cent); how the electricity is produced (35 per cent); and where to enquire for
advice, etc. (26 per cent).
Five per cent look for other information on their bills (see appendix).
• Electricity customers below the age of 35 read less information about specification of
electricity consumption, expiry date and consumption history.

106
• The active and the aware customers generally read more of the information presented on
the electricity bill than the inactive customers.
• There are only minor differences between those receiving the bill electronically and those
receiving a paper invoice. However, more of the customers getting an electronic bill look for
information on expiry date (42 per cent), compared to the customers getting paper invoice
(34 per cent).
In conclusion, all respondents were asked how they prefer to get information from their electricity
supplier.
Figure 106: How do you prefer to get information from your Electricity supplier? Several answers possible. N=1504.
The majority (58 per cent) prefers to receive information from their electricity supplier via E-mail. 48
per cent want information on or attached to their bill.
Some want information in a separate letter (28 per cent) or at “My pages” (24 per cent), while it is
less common to want information on SMS (10 per cent), in an app from the supplier (8 per cent) or at
a display in the house (3 per cent).
One per cent state other information channels (see appendix), and two per cent respond “do not
know.”

107
• More men than women prefer an app provided by the supplier (11 and 6 per cent
respectively).
• The younger electricity customers are to a greater extent than the older customers
interested in information by SMS, in an app or at a display in the house.
• The share that wants information at “My pages” is highest among the aware customers (32
per cent) and lowest among the inactive (21 per cent).

108
The Norwegian Customers This chapter takes a closer look at the Norwegian electricity customers and their presence and
participation in the electricity market, as well as their attitudes towards the Norwegian electricity
market. Interesting and any significant differences between background variables will be
commented.
The Norwegian Customers’ presence in the electricity market The consumers were asked different questions about their presence in the Norwegian electricity
market.
Figure 107: Do you use electricity to heat your home? N=1506.
Nine in ten Norwegians report that they use electricity to heat their homes.
• Slightly more men than women use electricity for heating (93 and 89 per cent respectively).
• The share is higher among those living in houses (95 per cent), than those living in
apartments (86 per cent).
• Differences between active, aware and inactive customers are minor; 93, 92 and 90 per cent
respectively use electricity to heat their homes.
Figure 108: Approximately how many kilowatt-hours do you use each year? N=1506.

109
21 per cent respond that they use 20,000 kWh or more per year; 34 per cent use between 10,000
and 19,999 kWh, and 16 per cent use less than 10,000 kWh per year. 29 per cent respond that they
do not know how much electricity they use in a year.
• Men claim to use more electricity than women; 48 per cent of the men and 26 per cent of
the women use 15,000 kWh or more per year. Women are more uncertain than men as to
how much electricity they use (44 compared to 15 per cent).
• Those living in houses use more electricity than those living in apartments. 57 and 12 per
cent respectively claim to use 15,000 kWh or more per year. 51 per cent of those living in
apartments, compared to 21 per cent of those living in houses, use less than this.
• The inactive customers are the most unsure; 34 per cent do not know how much electricity
they use, compared to 29 and 13 per cent respectively of the active and the aware
customers.
Figure 109: How much money do you spend on electricity in total (supplier cost, grid cost and taxes) an average winter month? N=1506.
One in four Norwegian respond that they spend NOK 2,000 or more on electricity in an average
winter month. 44 per cent spend NOK 1,000-2,000, while 22 per cent spend less than NOK 1,000 per
month. Ten per cent are uncertain.
• Those living in houses spend more on electricity than those living in apartments. 63 and 21
per cent respectively spend more than NOK 1,500 on electricity in an average winter month.
• The difference between the different consumer profiles are small, but the aware customers
are less uncertain of their electricity consumption (5 per cent), then the inactive and active
(11 and 10 per cent respectively).

110
The Norwegian Customers’ knowledge of the electricity market The electricity customers were asked to consider different statements concerning electricity
suppliers and switching between these.
Figure 110: Do you believe the following statements are correct or not? Share that believes the statements are correct. N=1506.
The vast majority believe that they themselves can choose electricity supplier (93 per cent). Further,
43 per cent believe that in the event of a change of supplier, the new supplier will be responsible for
reading the meter.
26 per cent believe that the electricity supplier is determined by where one lives, while 64 per cent
believe that this is wrong. Very few believe that one must replace the meter in the event of a change
of supplier (4 per cent), and that changing electricity supplier can impact the number of power cuts
(5 per cent).
A high share is uncertain whether a new supplier will be responsible for reading the meter (23 per
cent), while 34 per cent believe that this is not the case. There is also a high share that is uncertain
whether a change of supplier can impact power cuts (15 per cent).
• Women are generally more uncertain than men as to whether the different statements are
true or not.
• The youngest are most uncertain. The shares that believe it is correct that electricity supplier
is determined by where one lives; that one must replace the electricity meter when changing
supplier; and that the number of power cuts is affected by supplier change, are highest
among those below the age of 35. The shares that believe it is correct that one may choose
electricity supplier oneself, and that the new supplier is responsible for reading the meter,
are both highest among consumers above the age of 65.
• The inactive customers are generally most unsure of whether the statements are true or not.
More inactive than active and aware consumers believe it is true that the electricity supplier
is determined by where you live, while a lower share believes one may choose supplier
oneself.

111
Further, the respondents were asked to name the company that operates the power lines to their
home, their own electricity supplier and two other electricity suppliers.
Figure 111: Name the company that operates the power lines to your home. N=1506.18
71 per cent state the name of their actual grid company. 22 per cent have stated the wrong name –
another grid company, an electricity supplier or something else. Seven per cent respond “Do not
know.”
• Somewhat more men (74 per cent) than women (68 per cent) state the correct name.
• 78 per cent of those above the age of 65 name the correct grid company, compared to 58
per cent of those beneath the age of 35.
Figure 112: Who is the electricity supplier in your home? N=1506.
Nine in ten Norwegian customers state the name of an actual electricity supplier.19 Four per cent
have stated something else than an actual electricity supplier (a grid company or something else). Six
per cent respond “Do not know.”
18 This variable is based on the respondents’ postal codes. It should be taken into account that the postal codes may be incorrect (e.g. if respondents have moved, etc.). 19 We cannot know whether this is their actual electricity supplier or just another supplier.
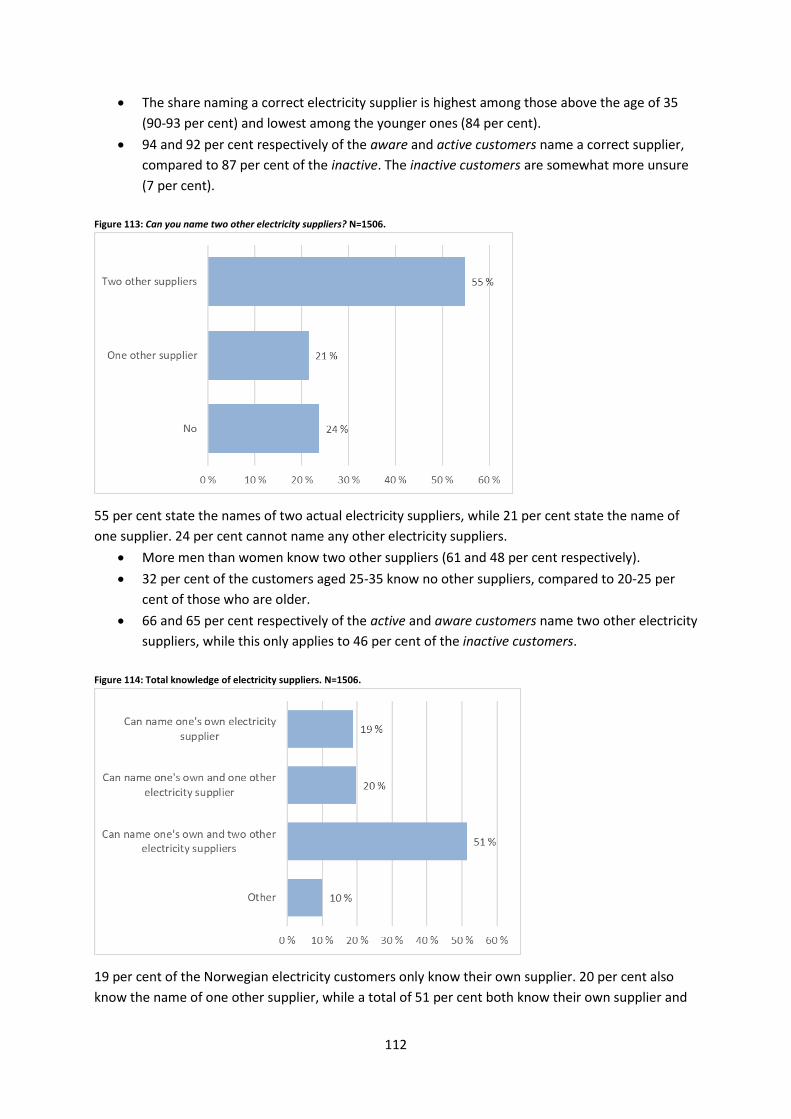
112
• The share naming a correct electricity supplier is highest among those above the age of 35
(90-93 per cent) and lowest among the younger ones (84 per cent).
• 94 and 92 per cent respectively of the aware and active customers name a correct supplier,
compared to 87 per cent of the inactive. The inactive customers are somewhat more unsure
(7 per cent).
Figure 113: Can you name two other electricity suppliers? N=1506.
55 per cent state the names of two actual electricity suppliers, while 21 per cent state the name of
one supplier. 24 per cent cannot name any other electricity suppliers.
• More men than women know two other suppliers (61 and 48 per cent respectively).
• 32 per cent of the customers aged 25-35 know no other suppliers, compared to 20-25 per
cent of those who are older.
• 66 and 65 per cent respectively of the active and aware customers name two other electricity
suppliers, while this only applies to 46 per cent of the inactive customers.
Figure 114: Total knowledge of electricity suppliers. N=1506.
19 per cent of the Norwegian electricity customers only know their own supplier. 20 per cent also
know the name of one other supplier, while a total of 51 per cent both know their own supplier and

113
two more suppliers (total knowledge of electricity suppliers). Ten per cent have stated something
else than an actual electricity supplier (a grid company or something else) or that they do not know.
• More men than women can name one’s own and two other suppliers (58 and 45 per cent
respectively).
• The older one is, the higher the share knowing both one’s own and two other suppliers.
• 63 and 62 per cent respectively of the aware and active customers name three electricity
suppliers, while this only applies to 42 per cent of the inactive customers.
Figure 115: Total knowledge of the electricity market. N=1506.
13 per cent of the Norwegian customers name the correct company operating power lines to their
home and one actual electricity supplier. 14 per cent know their grid company and two electricity
suppliers, while 40 per cent know their grid company, their electricity supplier and two other
electricity suppliers as well (total knowledge of the electricity market).
The category called “Other” includes those not naming a correct electricity supplier as their own
and/or not naming the correct grid company. 33 per cent have poor knowledge of the electricity
market.
• Men have somewhat better knowledge of the electricity market than women; 46 and 34 per
cent respectively know their grid supplier, their electricity supplier and two other suppliers.
• The older customers have better knowledge of the market than the younger ones; 48 and 30
per cent respectively of those above 65 and those beneath 35 know their grid supplier, their
electricity supplier and two other suppliers.
• 52 and 47 per cent respectively of the aware and active customers name their grid supplier,
their electricity supplier and two other electricity suppliers. 33 per cent of the inactive
customers have the same knowledge of the electricity market.
The open answers provided for these questions may be read in the appendix to the report.

114
The Norwegian Customers’ participation in the electricity market Electricity customers were further given different questions related to their participation in the
electricity market; including switching and comparing electricity contracts, the use of comparison
tools, as well as knowledge on contractual terms.
Signing and comparing of contracts Figure 116: Have you ever signed a new contract with an electricity supplier? N=1506.
86 per cent of the Norwegian electricity customers have signed a contract with an electricity supplier.
13 per cent have not, and two per cent are unsure.
• More men (89 per cent) than women (82 per cent) have signed a new contract with an
electricity supplier.
• The older one is, the more common it is to have signed a new electricity contract. The
proportion is highest among the oldest (90 per cent) and lowest among the youngest (78 per
cent).
• The share that has signed a new contract is significantly higher among the aware customers
(92 per cent) than the inactive (77 per cent). 20
20 All active customers have signed a contract.

115
Those who responded that they had signed a new contract with an electricity supplier were asked
when they last did this.
Figure 117: When did you last sign a new contract with an electricity supplier? N=1289.
30 per cent of those who have signed a new contract did so less than one year ago and are
considered active customers. An equally large share changed 1-3 years ago, while 15 and 25 per cent
respectively changed 3-5 years ago or more than five years ago.
• The youngest are more active than the older, and 39 per cent of those below the age of 35
have signed a contract in the last year (compared to 26-31 per cent of the older customers).
• The share of active customers (signed contract in the past year) is higher among those who
live in apartments (35 per cent), than those who live in houses (27 per cent).
• The inactive customers are the least likely to sign new contracts; a total of 64 per cent have
not signed a new contract in the last three years (compared to 42 per cent among the
aware).

116
The electricity customers who have signed new contracts in the past three years were asked why
they signed a new contract.
Figure 118: Why did you sign a new electricity contract? Several answers possible. N=774.
The majority state that they switched to save money (52 per cent). Some also did so due to a change
in life situation (20 per cent), because they were approached by a salesperson (20 per cent), or
because they wanted better contractual terms (17 per cent).
It is less common to switch due to poor experience with a previous contract (7 per cent), expired
contract (6 per cent), desire for a local supplier (6 per cent), or desire for a green contract (4 per
cent).
Six per cent state other reasons for the contract change (see appendix), and one per cent are
uncertain.
• More women than men claim they switched due to a change in life situation (25 compared to
15 per cent), while more men than women say they did so due to an expired contract (8
compared to 4 per cent).
• Those below the age of 35 switch to a lesser extent to save money (42 per cent, compared to
52-56 per cent among others), and to a greater extent due to a change in life situation (39
per cent, compared to 6-23 per cent among the older customers).

117
• Those living in houses have to a greater extent than those living in apartments switched to
save money (58 compared to 45 per cent). Among those living in apartments, a “change in
life situation” is a more important reason than among owners of houses (26 compared to 15
per cent).
• The aware customers are those who are most concerned with price, and 61 per cent have
signed a new contract in the past three years to save money (compared to 48-52 per cent
among active and inactive customers). This consumer group was to the least extent
contacted by salespersons (11 per cent, compared to 20-23 per cent among other groups).
Consumers who are not considered to be active (switched contract in past year), were asked if they
have compared their current contract to other contracts.
Figure 119: Have you ever compared your current electricity contract to other contracts? N=1115.
Almost six in ten have compared their current electricity contracts to other contracts. Four in ten, on
the other hand, have never compared their contracts with others. Two per cent respond that they
are unsure.
• More men than women have compared electricity contracts (62 compared to 53 per cent).
• The share that has compared their contract to others is highest among the oldest (60 per
cent) and lowest among the youngest (54 per cent).
• Slightly more of those who live in a house than those who live in an apartment have
compared their current contract with other contracts (60 compared to 54 per cent).
• All aware customers have compared contracts. Among the inactive customers, more than
half (53 per cent) say they have never compared electricity contracts. 21
21 The active customers have switched contract in the past year and were therefore not presented with this question.

118
Electricity customers who have compared their own contracts with others were asked when they
most recently did this.
Figure 120: When did you last compare your current electricity contract to other contracts? N=643.
44 per cent of those who have compared their contracts to other contracts have done this within the
past year and are considered to be aware customers. Somewhat fewer (42 per cent) carried out such
a comparison 1-3 years ago, while eleven per cent did so 3-5 years ago. Only three per cent of those
who have compared their own contract to others did so more than five years ago.
• Men are more aware electricity customers than women; 50 and 36 per cent respectively
have compared their contract to other contracts in the past year.
• The proportion of aware electricity customers is lowest among those below the age of 35,
where 37 per cent have compared contracts in the past year, compared to 43-47 per cent
among the older.
• Among the inactive customers most have carried out a comparison between one and three
years ago (75 per cent).
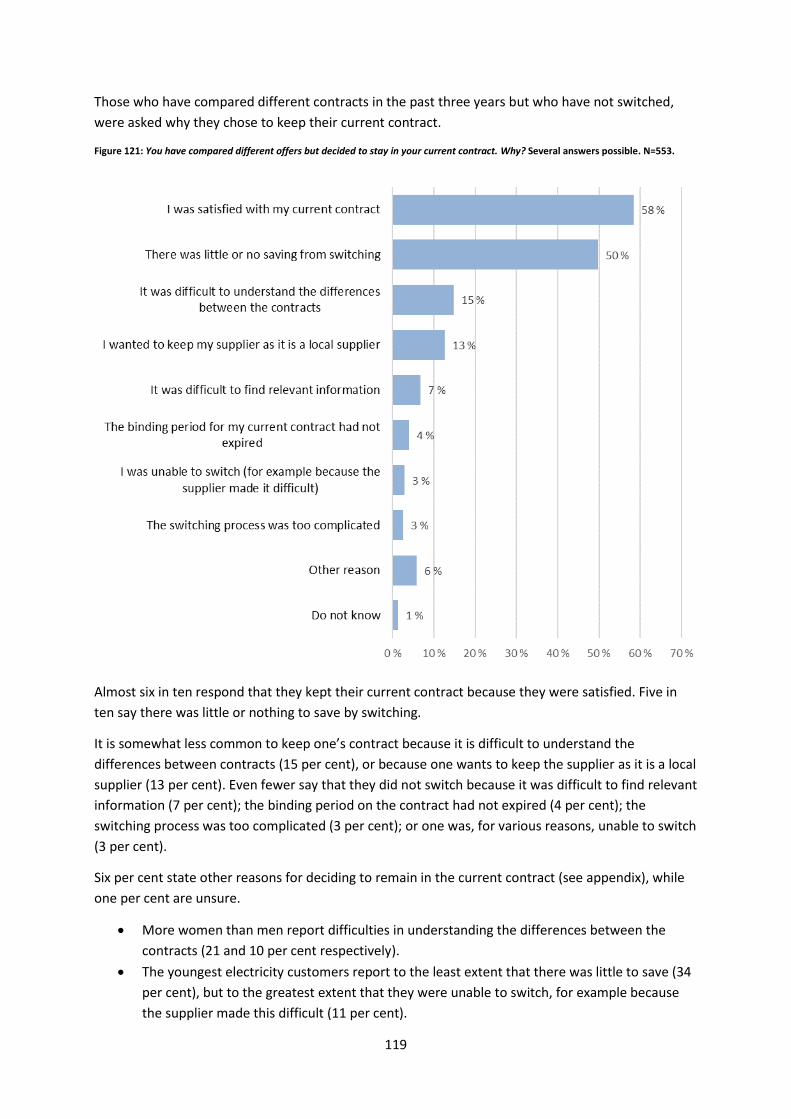
119
Those who have compared different contracts in the past three years but who have not switched,
were asked why they chose to keep their current contract.
Figure 121: You have compared different offers but decided to stay in your current contract. Why? Several answers possible. N=553.
Almost six in ten respond that they kept their current contract because they were satisfied. Five in
ten say there was little or nothing to save by switching.
It is somewhat less common to keep one’s contract because it is difficult to understand the
differences between contracts (15 per cent), or because one wants to keep the supplier as it is a local
supplier (13 per cent). Even fewer say that they did not switch because it was difficult to find relevant
information (7 per cent); the binding period on the contract had not expired (4 per cent); the
switching process was too complicated (3 per cent); or one was, for various reasons, unable to switch
(3 per cent).
Six per cent state other reasons for deciding to remain in the current contract (see appendix), while
one per cent are unsure.
• More women than men report difficulties in understanding the differences between the
contracts (21 and 10 per cent respectively).
• The youngest electricity customers report to the least extent that there was little to save (34
per cent), but to the greatest extent that they were unable to switch, for example because
the supplier made this difficult (11 per cent).

120
Those who neither have switched nor compared contracts in the past three years were asked why
they had not done this more often.
Figure 122: Why have you not switched or compared contracts more often? Several answers possible. N=90.
The majority (61 per cent) have neither switched nor compared contracts more often because they
are satisfied with their current contract. Moreover, 30 per cent claim that there are no savings to be
made, and 27 per cent state that it is difficult to understand the differences between the contracts.
17 per cent have not switched/compared more often because they want to keep their local supplier;
14 per cent believe it is difficult to find relevant information.
Few have been inactive in the electricity market for at least three years because a switching process
is too complicated (6 per cent), or because they are indifferent to their contract (4 per cent).
Eleven percent state other reasons (see appendix), and two per cent are unsure.
Due to a low number of respondents, there are only small differences between background variables.

121
Those who have neither switched nor compared contracts were asked for the reasons for never
doing this.
Figure 123: Why have you never switched or compared contracts? Several answers possible. N=143.
The most common reason is that they are satisfied with their current contract (41 per cent). Other
common reasons are that savings are minimal (17 per cent), that it is difficult to understand the
differences between contracts (16 per cent), and/or that one wants to keep the supplier as this is
local (16 per cent).
Fewer have been inactive in the electricity market because it is difficult to find relevant information
(11 per cent); the switching process is too complicated (10 per cent); one do not care about one’s
electricity contract (7 per cent); one did not know switching was possible (3 per cent); or the binding
period of the contract had not expired (1 per cent).
Eight per cent provide other reasons for not switching or comparing contracts (see appendix), while
14 per cent are unsure as to the reason they have remained passive.
• 76 per cent of electricity customers above the age of 65 have been inactive because they are
satisfied with their current contract. In comparison, this applies to 31-36 per cent of the
younger customers.
Due to a low number of respondents, there are only small differences between other background
variables.

122
The switching process The respondents were then given questions related to the switching process, including who initiated
the signing of their current contract; how one proceeded to choose contract; how one was
contacted, etc.
Figure 124: Who initiated the signing of your current contract? N=1506.
The majority of Norwegian electricity customers (64 per cent) themselves initiated the signing of
their current contract, while ten per cent say it was someone else in the household.
14 per cent say that it was the electricity supplier who took the initiative. It is less common that a
broker, union or other parties initiated the contract (2-3 per cent). Six per cent of Norwegian
electricity customers do not remember who took the initiative for their current contract.
• More men than women took this initiative themselves (70 and 58 per cent respectively),
while more women than men state that it was someone else in the household who arranged
the electricity contract they currently have (15 and 5 per cent respectively).
• The share who took the initiative to the contract themselves is lowest among those below
the age of 35 (51 per cent), while the share that identifies someone else in the household is
highest in this age group (19 per cent).
• The share responding “Other” is highest among those living in apartments (4 per cent,
compared to 2 per cent in houses), and here several mention cooperatives and building
societies.
• The share who themselves initiated their current contract is highest among the aware
customers (76 per cent, compared to 68 and 58 per cent respectively among active and
inactive). The share responding that the electricity supplier took this initiative is highest
among the active customers (24 per cent, compared to 10-11 per cent among others). The
inactive customers answer to the greatest extent that someone else in the household took
this initiative (13 per cent). The inactive are also the most uncertain (9 per cent).

123
Those electricity customers who responded that either themselves or someone else in their
household initiated the signing of their current contract, were asked how they did this.
Figure 125: How did you go about choosing electricity contract? Several answers possible. N=1113.
36 per cent used a comparison tool online when choosing an electricity contract. 17 per cent
performed an internet search, while 13 per cent called one or several suppliers.
26 per cent state other methods (see appendix), while 18 per cent do not remember how they
initiated the contract.
• More men than women have used a comparison tool (40 compared to 31 per cent).
• The shares that have used comparison tools, performed internet searches or called suppliers,
all become lower with age.
• The aware and active customers use comparison tools to a greater extent than the inactive
(56 and 46 per cent respectively, compared to 23 per cent). Relatively many inactive
customers do not remember how they chose an electricity contract (27 per cent, compared
to 6-11 per cent among others).

124
Those electricity customers who stated that they were contacted by an electricity supplier or a
broker were asked how this happened.
Figure 126: How did they contact you? N=243.
The majority (54 per cent) stated that this was by phone. Further, eleven per cent were contacted via
door sales; nine per cent via e-mail; nine per cent on the street; and two per cent received mails.
Seven per cent state other forms of contact (see appendix), while eight per cent do not remember
how they were contacted by the electricity supplier or broker.
• The share responding that they were contacted by telephone is higher among the active
customers (64 per cent) than the aware (44 per cent) and inactive (47 per cent).
Due to a low number of respondents, there are only small differences between background variables.

125
Those who have made a switch in the past three years were asked to consider different statements
related to the switching process.
Figure 127: Before you made your current choice of electricity contract, to what extent did you experience the following …? Standardized
mean: 0=No experience and 100=High extent. “Do not know” is excluded. N=669-753.
Electricity customers who have made a switch experienced to a very large extent that it was easy and
straightforward to sign a contract (average of 82 out of 100). Consumers also experienced to a great
extent that there were many different electricity suppliers who met their needs (71).
With regard to the remaining statements on the switching process, electricity customers have
experienced this to a moderate degree. There is relatively great agreement that there were many
different products/contracts that met their needs (69); and that it was easy to find trustworthy
information and necessary advice (66); that one was well-informed (64); that one could easily
compare different contracts (63); that one trusted the information and advice from sellers (63); and
that it was easy to understand what was included in the price (62).
• Women trusted information from sellers to a greater degree than men, while men to a
greater degree than women felt that they were well-informed.
• The oldest electricity customers experienced to the least extent that it was easy to find
trustworthy information, but to the greatest extent that there were many different suppliers
to choose from.
• Those living in apartments generally experienced the switching process as somewhat easier
than those living in houses, particularly with regard to how easy it was to compare contracts,
and how easy it was to understand what was included in the price.

126
• The aware customers felt most well-informed and felt to the greatest extent that it was easy
to compare different contracts, but trusted sellers to a lesser extent than the active and
inactive customers.
Those who have not made a switch in at least three years were also asked to consider different
statements concerning the switching process – given a hypothetical switch in the future.
Figure 128: If you in the future would like to choose an electricity contract, to what extent do you agree that… ? Standardized mean:
0=No experience and 100=High extent. “Do not know” is excluded. N=644-678.
Those consumers who have not performed a switch also largely believe that it will be simple and
straightforward to sign an electricity contract – should they make a switch in the future (average 71
out of 100). Many also believe that there will be many different suppliers and many different
contracts to choose from that meet their needs (both average 71).
Consumers only believe to a moderate extent that it will be easy to compare different contracts (61),
and that it will be easy to find trustworthy information (60).
There is relatively little agreement that one would be well-informed, and that it would be easy to
understand what the price includes (59 and 53 respectively). Electricity customers disagree
somewhat that they would trust information and advice from sellers, should they make a switch (42).
• Electricity customers below the age of 50 are least in agreement that it will be easy to sign a
new contract.

127
• The aware customers generally believe that a switching process will be easier than what the
inactive customers believe, only with the exception of trust in sellers.
Comparison tools The respondents were also asked to consider different questions on comparison tools.
The electricity customers who have signed a contract in the past three years were asked if they had
visited an online comparison tool.
Figure 129: When you signed/compared your current electricity contract, did you visit an online comparison tool? N=774.
41 per cent of the electricity customers who had signed or compared a contract in the past three
years visited an online comparison tool. More than half (55 per cent) however claim that they did not
use such a tool when signing/comparing contracts, while four per cent are uncertain.
• The share that used comparison tools sinks with age and is lowest among the oldest (31 per
cent).
• The aware customers used comparison tools to the greatest extent (61 per cent, compared
to 39 and 30 per cent respectively of the active and inactive).

128
Those who had used a comparison tool were asked to name the tool they had used.
Figure 130: What comparison tool(s) did you visit? Several answers possible. N=317.
More than half (55 per cent) have used “Strømpris.no”. 27 per cent have used “Elskling,” and nine
per cent “Forbrukernet.”
Two per cent stated other comparison tools (see appendix), while a significant 22 per cent say they
do not remember which comparison tool they visited.
• The share that used “Strømpris.no” is highest among men (63 per cent) and among the
oldest (71 per cent).
The electricity customers who have not signed a contract in at least three years were also asked
about comparison tools.
Figure 131: Do you know any of any online comparison tools for electricity contracts? N=732.
43 per cent of consumers who have not signed a new contract in more than three years are aware of
comparison tools for electricity contracts. More than half of them (57 per cent) however, are not
aware of such tools.
• More men than women are aware of tools for price comparisons (49 compared to 38 per
cent).

129
• The aware customers are more aware of comparison tools than the inactive (74 compared to
37 per cent).
Those aware of comparison tools for electricity contracts were asked which comparison tools they
had visited.
Figure 132: What comparison tool(s) have you visited online? Several answers possible. N=317.
The pattern is relatively similar as for those who have signed electricity contracts in the past three
years: The majority (63 per cent) have visited “Strømpris.no”. 47 per cent have used “Elskling,” and
16 per cent “Forbrukernet.” One per cent say that they have not visited any comparison tools.
• The share that has visited “Elskling” is highest among the youngest (70 per cent, compared to
26-54 per cent among the older). The share that has visited “Strømpris.no” is highest among
the oldest (77 per cent, compared to 48-67 per cent among the younger).
• The aware customers have visited the various price comparison tools to a slightly greater
extent than the inactive customers.

130
Terms of contract Electricity customers were asked about their current contracts and how well they know the terms of
the contract.
Figure 133: When you think of your current electricity contract, are you aware of …? Share that has answered “Yes”. N=1506.
The majority know if the price can change during the contract term (75 per cent). The majority also
know the contract’s binding period (69 per cent), how the electricity price is set (62 per cent), and
the contract’s notice period (60 per cent).
Around half of the Norwegian electricity customers (53 per cent) also know what happens if they
terminate the contract before the expiry of the binding period, while slightly less than half (44 per
cent) know whether they have a green contract.
• Men generally have significantly better knowledge of the terms of their electricity contracts
than women.
• Electricity customers above the age of 50 generally have better knowledge of their contract
terms than younger customers. Persons below the age of 35 have poorest knowledge of the
terms.
• Those living in houses have better knowledge of how prices are set, and whether the price
can change, than those who live in apartments.
• The aware customers generally have the best knowledge of their terms of contract. The
inactive customers have the poorest knowledge of the terms in their electricity contracts.

131
The Norwegian Customers’ attitudes towards the electricity market The respondents were asked to consider different statements concerning the electricity market.
Figure 134: To what extent do you agree with the following statements …? Standardized mean: 0=Fully disagree and 100=Fully agree.
“Do not know” is excluded. N=1043-1409.22
There is great agreement that it is easy to switch electricity supplier (average of 82 in 100). There is
also quite great agreement that one can save money by switching contract (67). The Norwegian
electricity customers are in moderate agreement that it is important to have a green electricity
contract (63), while there is little agreement that they regularly compare contracts (46).
• Men agree more than women that it is easy to switch supplier, and that they often compare
contracts. Women agree more than men that there is money to be saved by switching, and
that it is important to have a green contract.
• The older electricity customers find it easier to switch electricity supplier, however, they are
less in agreement that there is money to be saved by switching.
• The active and the aware customers are most in agreement that it is easy to switch supplier.
The active also believe to the greatest extent that there is money to save, while the aware
most frequently compare contracts. The inactive customers are most in agreement that it is
important to have a green contract.
22 Customers who reported that they have never compared their current electricity contracts were not presented with the statement “I regularly compare contracts”.

132
Billing and Information The respondents were asked to consider different statements concerning billing and information.
Figure 135: To what extent do you agree with the following statements …? Standardized mean: 0=Fully disagree and 100=Fully agree.
“Do not know” is excluded. N=1437-1453.
Norwegian electricity customers want updated information about their consumption, for example
online or in an app (score of 73 out of 100). There is also great agreement that the electricity bill is
simple and easy to understand (72). Additionally, many want better information on the price they
pay for electricity (69).
• The aware consumers are most in agreement that the bill is easy to comprehend, while the
inactive are in least agreement. The active customers want to greatest extent to be better
informed about the price they pay for electricity; the inactive want this to the least extent.
The aware and active are also more concerned with receiving up to date consumption
information than the inactive.

133
The Norwegian electricity customers were also asked a separate question on the importance of
having all electricity costs combined on one bill, rather than two separate bills from the electricity
supplier and grid provider.
Figure 136: If you should switch supplier, how important would it be to get all electricity costs on one bill instead of two separate bills
from the supplier and the network company? N=1506.
A total of seven in ten Norwegian electricity customers believe it is very or fairly important to have
everything on one bill. However, eleven per cent are of the opinion that this is not important at all.
• The aware customers are those who find it least important to have one combined bill. 19 per
cent feel that this is not important at all, compared to nine per cent of other electricity
customers.
Compared to a corresponding survey in Norway in 2012, today there are more who feel that it is
important to have all electricity costs on one bill. In 2012 a total of 44 per cent stated that this was
fairly or very important, compared to 69 per cent today. Furthermore, in 2012 52 per cent felt that
this was a bit important or not important at all, compared to the current 27 per cent.
The electricity customers were also given different questions about the electricity bill; about how
they receive it; and what information they read on the bill.
Figure 137: How do you receive your electricity bill? N=1506.

134
89 per cent of Norwegian electricity customers receive the bill electronically. Eleven per cent receive
it as a paper invoice by mail.
• Slightly more men than women receive an electronic bill (91 compared to 86 per cent).
• The older one is, the more common it is to receive the electricity bill electronically; 93 per
cent of those aged 65 and above, and 81 per cent of those below the age of 35 do so.
• The share receiving the bill electronically is highest among the aware customers (92 per
cent) and lowest among the inactive (86 per cent).
Figure 138: Do you read the information presented on your electricity bill? N=1506.
84 per cent of the Norwegian electricity customers read the information presented on their
electricity bill.
• Slightly more men than women read the information on the bill (87 compared to 82 per
cent).
• The share that reads information increases with age; 90 per cent of the oldest and 74 per
cent of the youngest do so.
• 86 per cent of those living in houses compared to 81 per cent of apartment owners read the
billing information.
• The share that reads the information on the electricity bill is highest among the aware
electricity customers (93 per cent), slightly lower among the active (88 per cent) and lowest
among the inactive (79 per cent).

135
The electricity customers who stated that they read the information presented on the electricity bill
were asked what information they read here.
Figure 139: What information do you read on your electricity bill? Share that has answered “Yes”. N=1266.
Almost all (97 per cent) look at the total amount they must pay, and a large number read the
specification of the electricity consumption the bill is based on (93 per cent). Many also look at the
specification of the different price elements the electricity cost is based on (85 per cent), as well as
historical consumption (83 per cent).
It is slightly less common to read about the estimated annual consumption (65 per cent), and
notifications of changes that affect the electricity price (55 per cent). It is uncommon to look for
information on where to enquire for advice, etc. (27 per cent); the contract expiry date (23 per cent);
and information on how the electricity is produced (18 per cent). With regard to information on how
electricity is produced, there is a fairly large share (31 per cent) that believes that they do not receive
this information on their bill.
Six per cent look for other information on their bills (see appendix).

136
• More men than women look for information on the contract’s expiry date (29 and 18 per
cent respectively), changes that impact the price of electricity (60 and 50 per cent) and
estimated yearly consumption (69 and 61 per cent).
• Electricity customers below the age of 35 read the least information concerning the
following: total payable amount; various price elements the bill is based on; specification of
electricity consumption; estimated annual consumption; consumption history; and changes
that impact the price. Those above the age of 50 are least concerned with information on
how the electricity is produced.
• Persons living in apartments read more about how the electricity is produced than those
living in houses (22 and 16 per cent respectively).
• The active and the aware customers generally read more of the information presented on
the electricity bill than the inactive customers.
• Those who receive the bill electronically generally read more of the information than those
who receive paper invoices. Higher shares of those who receive paper bills say that the
information is not available on the bill, compared to those who receive electronic bills.
In conclusion, all respondents were asked how they prefer to get information from their electricity
supplier.
Figure 140: How do you prefer to get information from your Electricity supplier? Several answers possible. N=1506.

137
The majority (65 per cent) want to receive information from their electricity supplier via e-mail. 41
per cent want information on or attached to their bill, and 31 per cent prefer to receive it at “My
pages.”
It is less common to want information in an app from the supplier (15 per cent) or by SMS (15 per
cent). Nine per cent want information in a separate letter, and only three per cent want it at a display
in their house.
Seven respondents state other information channels (see appendix), and two per cent respond “do
not know.”
• The younger electricity customers (below 50) are to a greater extent than the older
customers interested in information in an app, by SMS or at a display in the house.
• The share that wants information by e-mail is highest among the aware customers (76 per
cent) and lowest among inactive (62 per cent).

138
The Swedish Customers This chapter takes a closer look at the Swedish electricity customers and their presence and
participation in the electricity market, as well as their attitudes towards the Swedish electricity
market. Interesting and any significant differences between background variables will be
commented.
The Swedish Customers’ presence in the electricity market The consumers were asked different questions about their presence in the Swedish electricity
market.
Figure 141: Do you use electricity to heat your home? N=1501.
One in two Swedes respond that they use electricity to heat their homes.
• Electric heating is more common among the customers younger than 35 years, and the share
decreases by age; from 64 per cent among customers younger than 35 years to 44 per cent
among those 65 years or older.
• The share using electricity is higher among those living in houses (65 per cent) than those
living in apartments (42 per cent).
• 63 per cent among the aware customers use electricity to heat their homes, compared to 52
and 51 per cent respectively among the active and inactive.
Figure 142: Approximately how many kilowatt-hours do you use each year? N=1501.

139
Nine per cent respond that they use 20,000 kWh or more per year; 25 per cent use between 10,000
and 19,999 kWh, and 36 per cent use less than 10,000 kWh per year. 30 per cent respond that they
do not know how much electricity they use in a year.
• Women are more uncertain than men as to how much electricity they use (41 compared to
19 per cent).
• Those living in houses use more electricity than those living in apartments. 36 and four per
cent respectively claim to use 15,000 kWh or more per year. 33 per cent of those living in
apartments, compared to five per cent of those living in houses, use less than 5,000 kWh.
• The active customers claim to use the least electricity; 27 per cent use less than 5,000 kWh a
year, compared to 17-18 per cent among others. The inactive customers are the most
unsure; 38 per cent do not know how much electricity they use, compared to 19 and 16 per
cent respectively of the active and the aware customers.
Figure 143: How much money do you spend on electricity in total (supplier cost, grid cost and taxes) an average winter month? N=1501.
18 per cent of the Swedes respond that they spend SEK 2,000 or more on electricity an average
winter month. 23 per cent spend SEK 1,000-2,000, while a total of 49 per cent spend less than SEK
1,000 per month. Ten per cent are uncertain.
• Those living in houses spend more on electricity than those living in apartments. 73 and 15
per cent respectively spend more than SEK 1,500 on electricity an average winter month.
• The difference between the different consumer profiles are small. The aware customers
spend somewhat more money on electricity than the others, while the inactive are less sure
of how much they spend.
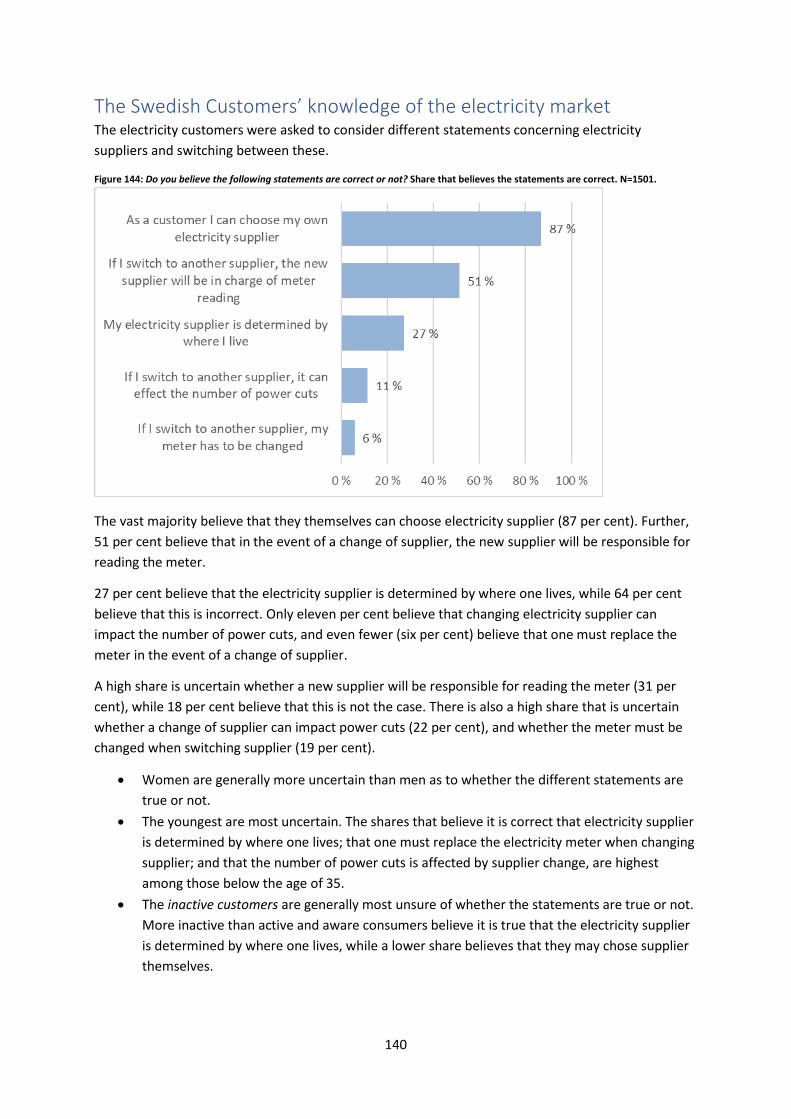
140
The Swedish Customers’ knowledge of the electricity market The electricity customers were asked to consider different statements concerning electricity
suppliers and switching between these.
Figure 144: Do you believe the following statements are correct or not? Share that believes the statements are correct. N=1501.
The vast majority believe that they themselves can choose electricity supplier (87 per cent). Further,
51 per cent believe that in the event of a change of supplier, the new supplier will be responsible for
reading the meter.
27 per cent believe that the electricity supplier is determined by where one lives, while 64 per cent
believe that this is incorrect. Only eleven per cent believe that changing electricity supplier can
impact the number of power cuts, and even fewer (six per cent) believe that one must replace the
meter in the event of a change of supplier.
A high share is uncertain whether a new supplier will be responsible for reading the meter (31 per
cent), while 18 per cent believe that this is not the case. There is also a high share that is uncertain
whether a change of supplier can impact power cuts (22 per cent), and whether the meter must be
changed when switching supplier (19 per cent).
• Women are generally more uncertain than men as to whether the different statements are
true or not.
• The youngest are most uncertain. The shares that believe it is correct that electricity supplier
is determined by where one lives; that one must replace the electricity meter when changing
supplier; and that the number of power cuts is affected by supplier change, are highest
among those below the age of 35.
• The inactive customers are generally most unsure of whether the statements are true or not.
More inactive than active and aware consumers believe it is true that the electricity supplier
is determined by where one lives, while a lower share believes that they may chose supplier
themselves.

141
Further, the respondents were asked to name the company that operates the power lines to their
home, their own electricity supplier and two other electricity suppliers.
Figure 145: Name the company that operates the power lines to your home. N=1501.23
68 per cent state the name of their actual grid company. 22 per cent have stated the wrong name –
another grid company, an electricity supplier or something else. Ten per cent respond “Do not
know.”
• 74 per cent of those above the age of 50 name the correct grid company, compared to 53
per cent of those beneath the age of 35.
• 71 per cent of the customers living in houses name the correct company, while 64 per cent of
those living in apartments do so.
• 77 and 72 per cent respectively of the active and aware customers name the correct grid
company, while 63 per cent of the inactive do so.
Figure 146: Who is the electricity supplier in your home? N=1499.
84 per cent state the name of an actual electricity supplier.24 Seven per cent have stated something
else than an actual electricity supplier (a grid company or something else). Eight per cent respond
“Do not know.”
23 This variable is based on the respondents’ postal codes. It should be taken into account that the postal codes may be incorrect (e.g. if respondents have moved, etc.). 24 We cannot know whether this is their actual electricity supplier or just another supplier.

142
• The share naming a correct electricity supplier is highest among those above the age of 35
(84-89 per cent) and lowest among those below the age of 35 (74 per cent).
• 91 per cent of the active customers name an actual electricity supplier, compared to 81-83
per cent of the aware and inactive.
Figure 147: Can you name two other electricity suppliers? N=1501.
57 per cent state the names of two actual electricity suppliers, while 20 per cent state the name of
one supplier. 23 per cent cannot name any other electricity suppliers.
• More men than women know the name of two other electricity suppliers (62 and 52 per cent
respectively).
• 31 per cent of the customers aged 25-35 know no other suppliers, compared to 18-23 per
cent of those who are older.
• 68 and 65 per cent respectively of the active and aware customers name two other electricity
suppliers, while this only applies to 51 per cent of the inactive customers.
Figure 148: Total knowledge of electricity suppliers. N=1501.
16 per cent of the Swedish electricity customers only know their own supplier. 17 per cent also know
the name of one other supplier, while a total of 51 per cent both know their own supplier and two
more suppliers (total knowledge of electricity suppliers). 16 per cent have stated something else than
an actual electricity supplier (a grid company or something else) or that they do not know.

143
• More men than women can name their own and two other suppliers (56 and 47 per cent
respectively).
• 26 per cent of the customers aged 25-35 have poor knowledge of electricity suppliers (stated
something else than an actual electricity supplier or that they do not know), compared to 11-
16 per cent of those who are older.
• 63 per cent of the active customers name three electricity suppliers, while this applies to 59
and 45 per cent respectively of the aware and inactive customers.
Figure 149: Total knowledge of the electricity market. N=1501.
Ten per cent of the Swedish customers name the correct company operating power lines to their
home and one’s actual electricity supplier. Twelve per cent know their grid company and two
electricity suppliers, while 40 per cent both know their grid company, their electricity supplier and
two other electricity suppliers as well (total knowledge of the electricity market).
The category called “Other” includes those not naming a correct electricity supplier as their own
and/or not naming the correct grid company. 39 per cent have poor knowledge of the electricity
market.
• More men than women have “total knowledge” of the electricity market (44 and 36 per cent
respectively).
• Customers above the age of 50 have the best knowledge; 44-46 per cent have “total
knowledge”, compared to 27 per cent of those under 35 years.
• 51 and 47 per cent of the active and aware customers respectively name their grid supplier,
their electricity supplier and two other electricity suppliers. 33 per cent of the inactive
customers have the same knowledge of the electricity market.
The open answers provided for these questions may be read in the appendix to the report.

144
The Swedish Customers’ participation in the electricity market Electricity customers were further given different questions related to their participation in the
electricity market; including switching and comparing electricity contracts, the use of comparison
tools, as well as knowledge on contractual terms.
Signing and comparing of contracts Figure 150: Have you ever signed a new contract with an electricity supplier? N=1501.
81 per cent of the Swedish electricity customers have signed a contract with an electricity supplier.
14 per cent have not, and five per cent are unsure.
• The youngest are less likely than the older to have signed a new electricity contract. The
proportion is highest among the oldest (86 per cent) and lowest among the youngest (73 per
cent).
• The share that has signed a new contract is significantly higher among the aware customers
(85 per cent) than the inactive (72 per cent). 25
Those who responded that they had signed a new contract with an electricity supplier were asked
when they last did this.
Figure 151: When did you last sign a new contract with an electricity supplier? N=1219.
25 All active customers have signed a contract.

145
32 per cent of those who have signed a new contract did so less than one year ago and are
considered active customers. An equally large share changed 1-3 years ago, while 15 and 20 per cent
respectively changed 3-5 years ago or more than five years ago.
• Among the youngest, a larger share has signed a new contract during the last three years. 75
per cent of those below the age of 35 have signed a contract in the last three years
(compared to 62 per cent of the older customers).
• The share of active customers (signed contract in past year) is higher among men (36 per
cent), than women (28 per cent).
• The inactive customers are the least likely to sign new contracts; a total of 57 per cent have
not signed a new contract within the last three years (compared to 32 per cent among the
aware).
The electricity customers who have signed new contracts in the past three years were asked why
they signed a new contract.
Figure 152: Why did you sign a new electricity contract? Several answers possible. N=788.
39 per cent state that they switched to save money, and 32 per cent signed a new contract because
their previous contract expired. Some also did so to get better terms (25 per cent); because of
change in life situation (15 per cent); or because they were approached by a sales person (10 per
cent).

146
It is less common to switch due to desire for a green contract (7 per cent), poor experience with a
previous contract (5 per cent), or a desire for a local supplier (4 per cent).
Four per cent state other reasons for the contract change (see appendix), and one per cent are
uncertain.
• More men than women claim they switched to save money (44 compared to 33 per cent).
• Fewer among those below the age of 35 switched because their previous contract expired,
and larger shares switched due to a change in life situation or due to bad experience with
previous contract.
• Those living in houses have to a greater extent than those living in apartments switched
because their previous contract expired (39 compared to 26 per cent). Among those living in
apartments, a “change in life situation” is a more important reason than among those living
in houses (21 compared to 9 per cent).
• A larger share of the active customers signed a new contract because their previous contract
expired (37 per cent compared to 27-28 per cent among the aware and inactive costumers).
Consumers who are not considered to be active (switched contract in past year), were asked if they
have compared their current contract to other contracts.
Figure 153: Have you ever compared your current electricity contract to other contracts? N=1109.
Almost six in ten have compared their current electricity contracts to other contracts. Four in ten, on
the other hand, have never compared their contracts with others. Three per cent respond that they
are unsure.
• More of those who live in a house than those who live in an apartment have compared their
current contract with other contracts (67 compared to 51 per cent).
• All aware customers have compared contracts. Among the inactive customers, 47 per cent
say they have never compared electricity contracts, while 4 percent do not know. 26
26 The active customers have switched contract in the past year and were therefore not presented with this question.

147
Electricity customers who have compared their own contracts with others were asked when they
most recently did this.
Figure 154: When did you last compare your current electricity contract to other contracts? N=646.
32 per cent of those who have compared their contracts to other contracts have done this within the
past year and are considered to be aware customers. 49 per cent carried out such a comparison 1-3
years ago, while eleven per cent did so 3-5 years ago. Eight per cent of those who have compared
their own contract to others did so more than five years ago.
• A larger share of those living in houses has compared contracts during the last year (37 per
cent, compared to 26 per cent among those living in apartment).
• Among the inactive customers most have carried out a comparison between one and three
ago (71 per cent).

148
Those who have compared different contracts in the past three years but who have not switched,
were asked why they chose to keep their current contract.
Figure 155: You have compared different offers but decided to stay in your current contract. Why? Several answers possible. N=520.
46 per cent respond that they kept their current contract because they were satisfied. 33 per cent
say there was little or nothing to save by switching.
It is somewhat less common to keep one’s contract because the current binding period had not
expired (15 per cent); because it is a local supplier (13 per cent); or because it is difficult to
understand the differences between contracts (12 per cent).
Even fewer say that they did not switch because the switching process was too complicated (6 per
cent), it was difficult to find relevant information (4 per cent); or one was, for various reasons, unable
to switch (3 per cent).
Five per cent state other reasons for deciding to remain in the current contract (see appendix), while
two per cent are unsure.
• 14 per cent of those beneath the age of 35 say that the switching process was too
complicated, compared to 2-6 per cent among other age groups.
• More of the inactive customers were satisfied with their current contract (52 per cent,
compared to 37 per cent among the aware customers). More of the aware than the inactive

149
say they did not switch because the binding period had not expired (20 and 11 per cent
respectively).
Those who neither have switched nor compared contracts in the past three years were asked why
they had not done this more often.
Figure 156: Why have you not switched or compared contracts more often? Several answers possible. N=126.
The majority (52 per cent) have neither switched nor compared contracts more often because they
are satisfied with their current contract. Moreover, 42 per cent claim that there are no savings to be
made.
19 per cent state that it is difficult to understand the differences between the contracts; 15 per cent
have not switched/compared more often because they want to keep their local supplier; 12 per cent
believe it is difficult to find relevant information.
Few have been inactive in the electricity market for at least three years because the binding period
has not expired (10 per cent), a switching process is too complicated (10 per cent), or because they
are indifferent to their contract (2 per cent).
Five per cent state other reasons (see appendix), and one per cent are unsure.

150
Due to a low number of respondents, there are only small differences between background variables.
Those who have neither switched nor compared contracts were asked for the reasons for never
doing this.
Figure 157: Why have you never switched or compared contracts? Several answers possible. N=181.
The most common reason is that they are satisfied with their current contract (35 per cent). Quite
many also say that it is difficult to understand the differences between contracts (21 per cent); that
the switching process is too complicated (18 per cent); and/or that savings are minimal (17 per cent).
Fewer have been inactive in the electricity market because they want to keep their supplier as this is
local (13 per cent); it is difficult to find relevant information (12 per cent); the binding period of the
contract had not expired (9 per cent); one do not care about one’s electricity contract (9 per cent); or
one did not know switching was possible (7 per cent);
Four per cent provide other reasons for not switching or comparing contracts (see appendix), while
14 per cent are unsure as to the reason they have remained passive.
• More men than women believe there is little or no savings from switching (27 and 9 per cent
respectively).
Due to a low number of respondents, there are only small differences between background variables.

151
The switching process The respondents were then given questions related to the switching process, including who initiated
the signing of their current contract; how one proceeded to choose contract; how one was
contacted, etc.
Figure 158: Who initiated the signing of your current contract? N=1501.
The majority of Swedish electricity customers (67 per cent) themselves initiated the signing of their
current contract, while eleven per cent say it was someone else in the household.
10 per cent say that it was the electricity supplier who took the initiative. It is less common that a
broker (4 per cent), union (1 per cent) or other parties (2 per cent) initiated the contract. Six per cent
of Swedish electricity customers do not remember who took the initiative for their current contract.
• More men than women took this initiative themselves (73 and 61 per cent respectively),
while more women than men state that it was someone else in the household who arranged
the electricity contract they currently have (15 and 6 per cent respectively).
• The share responding “someone else in the household” is higher among those living in
houses (15 per cent, compared to 7 per cent of those living in apartments).
• The share who themselves initiated their current contract is highest among the aware
customers (77 per cent, compared to 74 and 62 per cent respectively among active and
inactive). The inactive customers answer to the greatest extent that someone else in the
household took this initiative (13 per cent). The inactive are also the most uncertain (9 per
cent).

152
Those electricity customers who responded that either themselves or someone else in their
household initiated the signing of their current contract, were asked how they did this.
Figure 159: How did you go about choosing electricity contract? Several answers possible. N=1168.
40 per cent used a comparison tool online when choosing an electricity contract. 15 per cent
performed an internet search, while 12 per cent called one or several suppliers.
24 per cent state other methods (see appendix), while 18 per cent do not remember how they
initiated the contract.
• More men than women used a comparison tool (46 compared to 35 per cent), and made an
internet search (18 compared to 11 per cent).
• The aware and active customers use comparison tools to a greater extent than the inactive
(57 and 54 per cent respectively, compared to 29 per cent). A significant share of the inactive
customers does not remember how they chose an electricity contract (26 per cent, compared
to 7 per cent among others).

153
Those electricity customers who stated that they were contacted by an electricity supplier or a
broker were asked how this happened.
Figure 160: How did they contact you? N=205.
40 per cent stated that this was by phone. Further, 21 per cent via E-mail; 15 per cent received mail;
seven per cent were contacted via door sales; and four per cent on the street.
Five per cent state other forms of contact (see appendix), while eight per cent do not remember how
they were contacted by the electricity supplier or broker.
Due to a low number of respondents, there are only small differences between background variables.

154
Those who have made a switch in the past three years were asked to consider different statements
related to the switching process.
Figure 161: Before you made your current choice of electricity contract, to what extent did you experience the following …? Standardized
mean: 0=No experience and 100=High extent. “Do not know” is excluded. N=682-765.
Electricity customers who have made a switch experienced to a very large extent that it was easy and
straightforward to sign a contract (average of 75 out of 100).
Regarding the remaining statements on the switching process, electricity customers have
experienced this to a moderate degree. Consumers experienced to some extent that they were well
informed (65); that there were many different products/contracts that met their needs (63); that it
was easy to find trustworthy information and necessary advice (62); that one could easily compare
different contracts (61); that there were many different electricity suppliers to choose from that met
their needs (61); and that it was easy to understand what was included in the price (61).
The Swedish customers experienced to somewhat lower extent that they trusted the information
and advice from sellers (59).
• Women trusted information from sellers to a greater degree than men, while men to a
greater degree than women felt that it was easy to find trustworthy information and that
they could easily compare different contracts.
• The oldest electricity customers experienced to greater extent than the younger that it was
easy to find trustworthy information; that it was easy and straightforward to sign a new
contract; and that they were well-informed. They experienced to lesser extent that there

155
were many different suppliers to choose from and that there were many different
products/contracts to choose from that meet their needs.
• Those living in houses experienced to greater extent than those living in apartments that it
was easy and straightforward to sign a new contract and that they could easily compare
different electricity contracts with each other.
• The active customers felt to the greatest extent that it was easy to find trustworthy
information and to sign a new contract, and that they were well-informed. The inactive
customers generally agree less to the different claims.
Those who have not made a switch in at least three years were also asked to consider different
statements concerning the switching process – given a hypothetical switch in the future.
Figure 162: If you in the future would like to choose an electricity contract, to what extent do you agree that… ? Standardized mean:
0=No experience and 100=High extent. “Do not know” is excluded. N=622-651.
Those customers who have not performed a switch also believe to some extent that it will be simple
and straightforward to sign an electricity contract – should they make a switch in the future (average
67 out of 100). Many also believe that there will be many different suppliers and many different
contracts to choose from that meet their needs (66 and 65 respectively).
Customers who have not made a switch only believe to a moderate extent that it will be easy to find
trustworthy information (60), that they will be well informed (60) and that it will be easy to compare
different contracts (59).

156
There is little agreement that it will be easy to understand what the price includes (52) and that they
will trust information and advice from sellers (46).
• Electricity customers below the age of 35 are more in agreement than the older customers
that they will trust the information from sellers. They also believe to a larger extent that it
will be easy to compare contracts and to understand what the price includes.
• Those living in houses believe to a greater extent that it will be easy and straightforward to
sign an electricity contract compared to those living in apartments.
• The aware customers believe to a greater extent than the inactive customers that they will
be well informed.
Comparison tools The respondents were also asked to consider different questions on comparison tools.
The electricity customers who has signed a contract in the past three years were asked if they had
visited an online comparison tool.
Figure 163: When you signed/compared your current electricity contract, did you visit an online comparison tool? N=788.
54 per cent of the electricity customers who had signed or compared a contract in the past three
years visited an online comparison tool. 44 per cent claim that they did not use such a tool when
signing/comparing contracts, while three per cent are uncertain.
• The aware customers used comparison tools to the greatest extent (65 per cent, compared
to 57 and 44 per cent respectively of the active and inactive).

157
Those who had used a comparison tool were asked to name the tool they had used.
Figure 164: What comparison tool(s) did you visit? Several answers possible. N=422.
More than half (55 per cent) have used “Elskling”. 36 per cent have used “Compricer” and 23 per
cent “Elpriskollen”.
Two per cent stated other comparison tools (see appendix), while twelve per cent say they do not
remember which comparison tool they visited.
• The share that used “Elskling” is lowest among the oldest (42 per cent), while the share that
used “Elpriskollen” is highest in this group (34 per cent).
The electricity customers who have not signed a contract in at least three years were also asked
about comparison tools.
Figure 165: Do you know any of any online comparison tools for electricity contracts? N=713.
43 per cent of consumers who have not signed a new contract in more than three years are aware of
comparison tools for electricity contracts. More than half of them (57 per cent), however, are not
aware of such tools.
• More men than women are aware of tools for price comparisons (51 compared to 38 per
cent).
• The aware customers are more aware of comparison tools than the inactive (69 compared to
40 per cent).

158
Those aware of comparison tools for electricity contracts were asked which comparison tools they
had visited.
Figure 166: What comparison tool(s) have you visited online? Several answers possible. N=310.
The pattern is relatively similar as for those who have signed electricity contracts in the past three
years: The majority (65 per cent) have visited “Elskling”. 46 per cent have used “Compricer,” and 31
per cent “Elpriskollen”.
Four per cent stated other comparison tools (see appendix). One per cent say that they do not
remember. Two per cent have not visited any comparison tools.
• The aware customers have visited the various price comparison tools to a greater extent than
the inactive customers.

159
Terms of contract Electricity customers were asked about their current contracts and how well they know the terms of
the contract.
Figure 167: When you think of your current electricity contract, are you aware of …? Share that has answered “Yes”. N=1501.
The majority know the binding period (78 per cent); if the price can change during the contract term
(69 per cent); the notice period of the contract (66 per cent); how the electricity price is set (62 per
cent); the effective unit rate (60 per cent); and if the contract is a green contract (59 per cent).
47 per cent of the Swedish electricity customers also know what happens if they terminate the
contract before the expiry of the binding period.
• Generally, more men than women know the terms of their electricity contracts.
• The share that knows the terms of their contracts increases with age, especially regarding to
how the price is set, the binding period and the effective unit rate.
• Those living in houses have better knowledge of the binding period and the effective unit
rate, than those who live in apartments.
• The active and aware customers generally have the best knowledge of their terms of
contract. The inactive customers have the poorest knowledge of the terms in their electricity
contracts.

160
The Swedish Customers’ attitudes towards the electricity market The respondents were asked to consider different statements concerning the electricity market.
Figure 168: To what extent do you agree with the following statements …? Standardized mean: 0=Fully disagree and 100=Fully agree.
“Do not know” is excluded. N=1057-1445.27
The Swedish customers agree that one can save money by switching contract (70), and to some
extent that it is easy to switch electricity supplier (67).
The Swedish electricity customers are in moderate agreement that it is important to have a green
electricity contract (59), while there is little agreement that they regularly compare contracts (46).
• Men agree more than women that it is easy to switch supplier, and that they often compare
contracts. Women agree more than men that it is important to have a green contract.
• The older electricity customers find it easier to switch electricity supplier, however, they are
less in agreement that it is important to have a green contract compared to other age
groups.
• The active and the aware customers are more in agreement that it is easy to switch supplier;
that there is money to save; and that they regularly compare contracts, compared to the
inactive customers.
27 Customers who reported that they have never compared their current electricity contracts were not presented with the statement “I regularly compare contracts”.

161
Billing and Information The respondents were asked to consider different statements concerning billing and information.
Figure 169: To what extent do you agree with the following statements …? Standardized mean: 0=Fully disagree and 100=Fully agree.
“Do not know” is excluded. N=1437-1451.
There is great agreement among the Swedish customers that they prefer to get all electricity cost on
one bill (average of 78 in 100). They also want to be better informed about the price they pay for
electricity (69).
To some extent, they want updated information about their consumption, for example online or in
an app (66). There is moderate agreement that the electricity bill is simple and easy to understand
(64).
• The active consumers are most in agreement that the bill is easy to comprehend, while the
inactive are in least agreement. The aware customers want to a greater extent up to date
information about their consumption, the inactive want this to the least extent. The aware
and active agree more that they want to be better informed about the price they pay for
electricity, than the inactive.
• Those living in houses are more in agreement about wanting to be better informed about
the price they pay for electricity compared to those living in apartments. This is also true for
the statement about wanting to be get updated information about consumption.
• Those above 65 years agree the most to the statement that their bill is easy to understand,
compared to other age groups.

162
The electricity customers were also given different questions about the electricity bill; about how
they receive it; and what information they read on the bill.
Figure 170: How do you receive your electricity bill? N=1501.
69 per cent of Swedish electricity customers receive the bill electronically. 31 per cent receive it as a
paper invoice by mail.
• The share that receives the bill electronically is highest among the active customers (78 per
cent) and lowest among the inactive (64 per cent).
Figure 171: Do you read the information presented on your electricity bill? N=1501.
76 per cent of the Swedish electricity customers read the information presented on their electricity
bill.
• More men than women read the information on the bill (80 compared to 72 per cent).
• The share that reads information increases with age; 88 per cent of the oldest and 70 per
cent of the youngest do so.
• 82 per cent of those living in houses compared to 72 per cent of apartment owners read the
billing information.
• The share that reads the information on the electricity bill is highest among the active and
aware electricity customers (87-88 per cent), and lowest among the inactive (69 per cent).

163
The electricity customers who stated that they read the information presented on the electricity bill
were asked what information they read here.
Figure 172: What information do you read on your electricity bill? Share that has answered “Yes”. N=1148.
Almost all (97 per cent) look at the total amount they must pay, and a large number read the
specification of the electricity consumption the bill is based on (88 per cent). Many also look at the
specification of the different price elements the electricity cost is based on (83 per cent), as well as
the estimated yearly consumption (74 per cent).
It is slightly less common to read about the historical consumption (64 per cent), and notifications of
changes that affect the electricity price (63 per cent).
About four in ten looks at the date when the contract expires and the information on how the
electricity is produced (42 and 38 per cent respectively). It is less common to look for information on
where to enquire for advice, etc. (27 per cent).
Nine per cent look for other information on their bills (see appendix).

164
• More men than women look at the estimated yearly consumption (78 and 70 per cent
respectively), the historical consumption (69 and 57 per cent), and notification of changes
that affect the price (67 and 59 per cent).
• Electricity customers below the age of 35 read the least information concerning the
following: total payable amount; various price elements the bill is based on; specification of
electricity consumption; and estimated annual consumption. However, this age group is
most concerned with information on how the electricity is produced and information about
which bodies one can turn to for advice, etc.
• A larger share of persons living in houses than living in apartments, reads the specification of
the consumption (92 and 85 per cent respectively), the estimated yearly consumption (82
and 67 per cent) and the historical consumption (70 and 58 per cent).
• The active and the aware customers generally read more of the information presented on
the electricity bill than the inactive customers.
In conclusion, all respondents were asked how they prefer to get information from their electricity
supplier.
Figure 173: How do you prefer to get information from your Electricity supplier? Several answers possible. N=1501.
47 per cent want to receive information from their electricity supplier via E-mail, and 44 per cent
want information on or attached to their bill. 26 per cent prefer to receive it at “My pages”, while 19
per cent want information in a separate letter.

165
It is less common to want information in an app from the supplier (10 per cent) or by SMS (9 per
cent). Four per cent want information at a display in their house.
One per cent of the respondents state other information channels (see appendix), and four per cent
respond “do not know.”
• The younger electricity customers are to a greater extent than the older customers
interested in information in an app or by SMS. A larger share of the older customers wants
information on or attached to the bill.
• The share that wants information at “My pages” is highest among the aware customers (34
per cent) and lowest among inactive (22 per cent).