Embed Size (px)
Citation preview

Nord Stream 2 Natural Gas Pipelineconstruction and operation in the Finnish EEZEnvironmental and Technical MonitoringQuarterly Report Q2 2018
Date 24.9.2018Project PO 17-5149Client Nord Stream 2 AGDocument ID W-PE-EMO-PFI-RQU-892-RQU218EN-06

Quarterly Report Q2 2018PO 17-5149
1/20
W-PE-EMO-PFI-RQU-892-RQU218EN-06
Sitowise Oy Business ID 2335445-0 Tel +358 20 747 6000Tuulikuja 2, FI-02100 Espoo Domicile Espoo, Finland Email [email protected]

Quarterly Report Q2 2018PO 17-5149
2/20
W-PE-EMO-PFI-RQU-892-RQU218EN-06
Sitowise Oy Business ID 2335445-0 Tel +358 20 747 6000Tuulikuja 2, FI-02100 Espoo Domicile Espoo, Finland Email [email protected]
SummaryThe report presents results and preliminary findings of the environmental and technicalmonitoring for construction activities of Nord Stream 2 Gas Pipeline in the Finnish EEZ forthe second quarter 2018. Monitoring is based on the report Natural Gas Pipeline Routethrough the Baltic Sea – Environmental Monitoring Programme, Finland by Nord Stream 2(W-PE-EMS-PFI-REP-805-032300EN-11). The programme has been approved on 12.4.2018within the water permit decision (Nro 53/2018/2, Dnro ESAVI/9101/2017).
Sitowise Oy prepared this report based on data and reports provided by Nord Stream 2 AGand monitoring contractors. All findings are preliminary and final conclusions will bereported in annual report for 2018 to be published in May 2019.
The construction activities during the second quarter were munitions clearance, the firstcampaign of rock placement and pre-installation surveys for mattress installation.
The munitions clearance was successfully completed in the second quarter. The charge ofmunitions was either comparable to the charge presented in the permit application orsmaller.
The area where the permanent threshold shift (PTS) level (risk of permanent hearingdamage) of marine mammals was reached was significantly smaller than was assessed toin the permit application in all 3 vessel based munitions clearances. The PTS level was notreached within any of the adjacent Natura 2000 areas.
NSP2 has decided to conduct sampling of sediment contaminants and explosive residualsfor 2 munition clearances. The sediment toxicity analysis at munition clearance locationsshowed no residuals of explosives exceeding the laboratory detection limits.
The first water quality analysis will be carried out during Q3.
A wreck inspection survey for the monitoring object S-R05-7978 and an anti-submarine netverification survey for monitoring object S-R09-09806 were performed in early May 2018.

Quarterly Report Q2 2018PO 17-5149
3/20
W-PE-EMO-PFI-RQU-892-RQU218EN-06
Sitowise Oy Business ID 2335445-0 Tel +358 20 747 6000Tuulikuja 2, FI-02100 Espoo Domicile Espoo, Finland Email [email protected]
Content
1 Introduction ........................................................................................................................... 4
2 Construction activities during the second quarter .................................................................. 6
2.1 Schedule .................................................................................................................................. 62.2 Activities during the period ...................................................................................................... 6
3 Underwater noise ................................................................................................................ 10
3.1 Monitoring activities ...............................................................................................................103.2 Results ....................................................................................................................................10
4 Water quality and currents .................................................................................................. 13
4.1 Monitoring activities ...............................................................................................................134.2 Results ....................................................................................................................................14
5 Sediment toxicity analysis .................................................................................................... 15
6 Cultural heritage .................................................................................................................. 16
7 Notifications to ELY-Centres during the second quarter ....................................................... 18
8 Conclusions .......................................................................................................................... 19
9 List of sources ...................................................................................................................... 20
Annexes
Annex 1 Luode Consulting Oy 2018. Interim report of underwater noise monitoring duringmunition clearance in the Finnish EEZ. W-GE-EMO-PFI-REP-812-UWNIREEN-05
Annex 2 Nord Stream 2 construction activities during Q2/2018

Quarterly Report Q2 2018PO 17-5149
4/20
W-PE-EMO-PFI-RQU-892-RQU218EN-06
Sitowise Oy Business ID 2335445-0 Tel +358 20 747 6000Tuulikuja 2, FI-02100 Espoo Domicile Espoo, Finland Email [email protected]
1 IntroductionThe report presents results and preliminary findings of the environmental and technicalmonitoring for the construction activities of Nord Stream 2 Gas Pipeline in the Finnish EEZfor the second quarter (Q2) of 2018.
Nord Stream 2 AG has started construction activities for a new two-pipeline offshorenatural gas system from Russia to Germany through the Baltic Sea (Figure 1). The length ofthe corridor is approximately 1,200 km. Parallel pipelines pass through the territorialwaters and/or Exclusive Economic Zones (EEZ) of Russia, Finland, Sweden, Denmark andGermany. In the Finnish EEZ the route follows the existing Nord Stream pipeline route. Thelength of the route in the Finnish sector is approximately 374 km. Pipelay of Line A startedon the 5th of September 2018 and Pipelay of Line B is scheduled to start in 2019. Both linesare planned to be ready by the end of 2019, after which the pipelines are planned to betaken into operation.
Figure 1. Nord Stream 2 route passes through the Finnish EEZ.
Nord Stream 2 AG is responsible for environmental monitoring and reporting duringconstruction and operation of the pipelines. The content of monitoring is presented in thereport Natural Gas Pipeline Route through the Baltic Sea – Environmental MonitoringProgramme, Finland (W-PE-EMS-PFI-REP-805-032300EN-11, Ramboll 1.2.2018). Theprogramme has been approved within the water permit decision 12.4.2018 (N:o53/2018/2, Dnro ESAVI/9101/2017).
Monitoring is most intensive during the construction phase (Table 1).

Quarterly Report Q2 2018PO 17-5149
5/20
W-PE-EMO-PFI-RQU-892-RQU218EN-06
Sitowise Oy Business ID 2335445-0 Tel +358 20 747 6000Tuulikuja 2, FI-02100 Espoo Domicile Espoo, Finland Email [email protected]
Table 1. General schedule for monitoring activities 2018–2023 in the Finnish EEZ (based onRamboll 2018, modified).
Monitoring target Construction Operation
2018 2019 2020 2021 2022 2023
Underwater noise X
Water quality and currents X X
Commercial fishery X
Cultural heritage X X
The supervising authorities for monitoring of underwater noise, turbidity and water qualityare the regional ELY-Centres (The Centres for Economic Development, Transport and theEnvironment). For fishery monitoring, the supervising authority is Southwest Finland ELY-Centre. For cultural heritage, the supervising authority is National Board of Antiquities.
Quarterly reports will be provided three months after the end of the quarter during theconstruction period, and annual reports by the end of May the following year duringconstruction and during operation.
Quarterly reporting aims at presenting the main results from technical and environmentalmonitoring to authorities. For this reason, they are concise and focused on results. Annualreports will include further data analysis, comparisons to the impact assessmentspresented in the EIA Report and the permit application and more thorough discussion onthe observed impacts.

Quarterly Report Q2 2018PO 17-5149
6/20
W-PE-EMO-PFI-RQU-892-RQU218EN-06
Sitowise Oy Business ID 2335445-0 Tel +358 20 747 6000Tuulikuja 2, FI-02100 Espoo Domicile Espoo, Finland Email [email protected]
2 Construction activities during the second quarter
2.1 ScheduleThe construction activities during the second quarter were munitions clearance, the firstcampaign of rock placement and pre-survey for mattress installation (Table 2). Munitionsclearance started in the beginning of May and was completed in early June (3.5–6.6.2018).First rock placement campaign started in Finland 29.4 and ended 15.6.2018. The mattressinstallation at pipeline and cable crossings started 30.6.2018 with pre-installation surveys.The actual installation of mattresses started on the 1.7.2018 and will be reported in the Q3report.
The second rock placement campaign is planned to start in August 2018. The pipelay (LineA) started on 5.9.2018. Line B is planned to be laid in 2019. Both lines are planned to beready by the end of 2019, after which the pipelines are planned to be taken into operation.
Table 2. Construction activities during Q2 2018.
2018 Q2 April 2018 May 2018 June 2018
Week 14 15 16 17 18 19 20 21 22 23 24 25 26
Munitions clearance
Rock placement 1st campaign
Mattress installation
2.2 Activities during the periodMunition clearance
The scope of work included clearance and/or disposal of unexploded ordnance (UXO) atthe locations identified by Nord Stream 2 and for any further “chance finds” located duringthe work and which could endanger the safe construction and operation of the pipelines.The results of the clearance works are presented in the contractor reports (MMT SwedenAB 2018 - W-SU-UXO-PFI-REP-808-EODSUREN-01, and N-Sea/BODAC - W-SU-UXO-PFI-REP-831-GEOFRREN-01). The removal of the unexploded ordnance was scheduled to ensurethat areas are cleared prior to commencing rock placement and pipelay.
The work was divided between two companies MMT/Ramora and N-Sea/Bodac. Out of 87planned clearance targets 15 were found not to be munitions. Additionally, 2 chance findswere cleared making the total number of detonated unexploded ordnance 74 (Table 3).
Bubble curtains were used to reduce or attenuate the acoustic noise from the detonationto mitigate noise levels based on the following criteria:
· if the total net explosive quantity (NEQ)* of target was >22 kg,

Quarterly Report Q2 2018PO 17-5149
7/20
W-PE-EMO-PFI-RQU-892-RQU218EN-06
Sitowise Oy Business ID 2335445-0 Tel +358 20 747 6000Tuulikuja 2, FI-02100 Espoo Domicile Espoo, Finland Email [email protected]
· within a sensitive marine environment (i.e. east of GKP 174)
· or requested by a cable owner with a cable within 500 m security corridor
During munition clearance the contractors were responsible for the implementation ofmitigation measures in line with Great Britain’s Joint Nature Conservation Committee(JNCC) guidelines.
To minimise the risk of injury to marine mammals from the explosives, a mitigation zonewas established, where deployment of Acoustic Deterrent Devices (ADD), Passive AcousticMonitoring (PAM) and Marine Mammal Observer (MMO) observations were conducted.ADD’s were deployed around the UXO in a cardinal point configuration.
MMO was observing for minimum of one hour at 1 to 2 km radius from the detonation site.According to the guidelines, explosion would take place only if no marine mammals wasobserved during the last 20 minutes of the minimum of one-hour watch. No visual or otherrecord of marine mammals in the mitigation zone were made.
Detonation was taking place only if no bird flocks or fish schools were detected/seen at thedetonation site.
The charge of the munitions was either comparable to the charge presented in the permitapplication or smaller (Table 3). The duration of the munition clearance campaign wasshorter than planned because objects were reassessed as not munitions and therefore didnot require clearance. In addition, the weather conditions were favourable allowinguninterrupted operation, including clearance of more than one munition object a day onseveral occasions.
Table 3. Munition clearance campaign 3.5.-6.6.2018 including the work of MMT/Ramora and N-Sea/Bodac.
Planned Actual Difference between planned and actual
Munitionsclearances
87 No. 74 No. 15 objects were found not to be munitions*, 2 chancefinds added
Bubble curtainuse
80 No. 58 No. 26 munitions had total NEQ** smaller than 22 kg andof these, 16 were cleared without bubble curtain. Inaddition15 were not munitions and therefore did notrequire clearance.
Donor charge 15 kg 2,5 – 10 kg The donor charges were 10, 5 or 2,5 kg, out of which 5kg was most commonly used.
Charge 2 – 795 kg 0,5 – 300 kg The total NEQ of all munitions was either smaller orequal to the estimated values. Small increases inmunition sizes (max of 4 kg) were compensated by theuse of smaller donor charge.
* 1 object was not found, 1 was left in situ, 13 were recovered to the deck** the total net explosive quantity NEQ (munition charge plus donor charge)
Quarterly Report Q2 2018PO 17-5149
8/20
W-PE-EMO-PFI-RQU-892-RQU218EN-06
Sitowise Oy Business ID 2335445-0 Tel +358 20 747 6000Tuulikuja 2, FI-02100 Espoo Domicile Espoo, Finland Email [email protected]
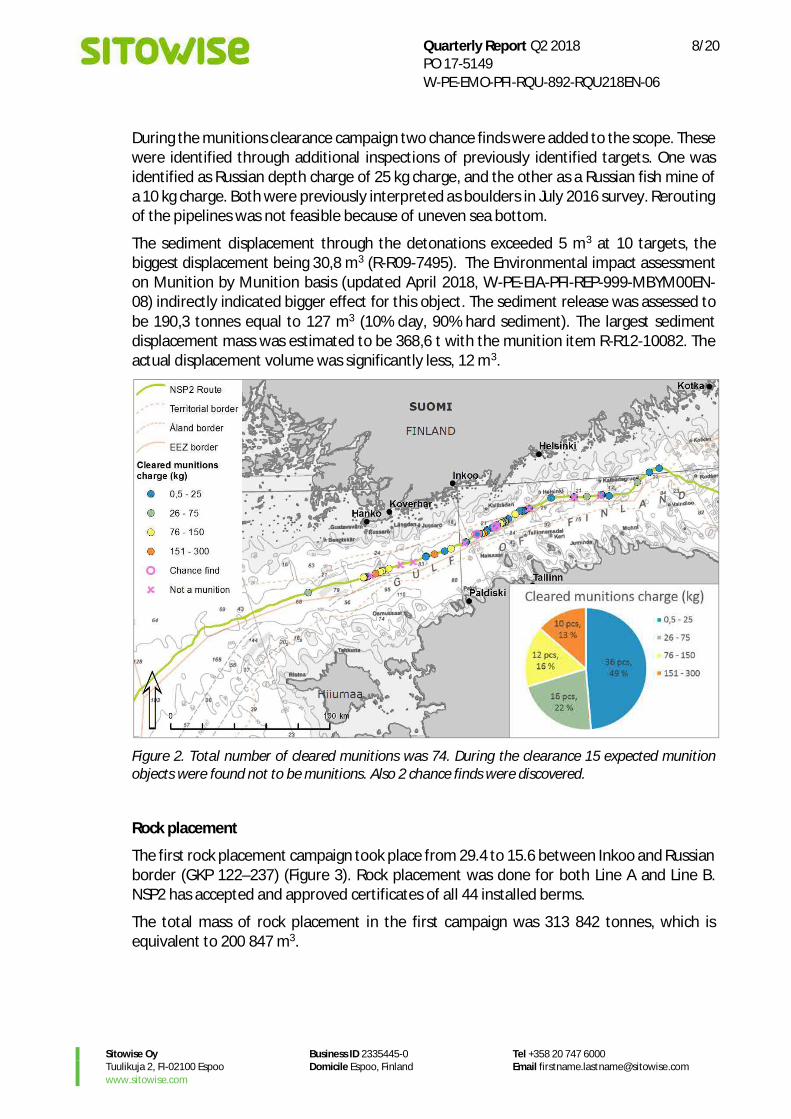
During the munitions clearance campaign two chance finds were added to the scope. Thesewere identified through additional inspections of previously identified targets. One wasidentified as Russian depth charge of 25 kg charge, and the other as a Russian fish mine ofa 10 kg charge. Both were previously interpreted as boulders in July 2016 survey. Reroutingof the pipelines was not feasible because of uneven sea bottom.
The sediment displacement through the detonations exceeded 5 m3 at 10 targets, thebiggest displacement being 30,8 m3 (R-R09-7495). The Environmental impact assessmenton Munition by Munition basis (updated April 2018, W-PE-EIA-PFI-REP-999-MBYM00EN-08) indirectly indicated bigger effect for this object. The sediment release was assessed tobe 190,3 tonnes equal to 127 m3 (10% clay, 90% hard sediment). The largest sedimentdisplacement mass was estimated to be 368,6 t with the munition item R-R12-10082. Theactual displacement volume was significantly less, 12 m3.
Figure 2. Total number of cleared munitions was 74. During the clearance 15 expected munitionobjects were found not to be munitions. Also 2 chance finds were discovered.
Rock placement
The first rock placement campaign took place from 29.4 to 15.6 between Inkoo and Russianborder (GKP 122–237) (Figure 3). Rock placement was done for both Line A and Line B.NSP2 has accepted and approved certificates of all 44 installed berms.
The total mass of rock placement in the first campaign was 313 842 tonnes, which isequivalent to 200 847 m3.

Quarterly Report Q2 2018PO 17-5149
9/20
W-PE-EMO-PFI-RQU-892-RQU218EN-06
Sitowise Oy Business ID 2335445-0 Tel +358 20 747 6000Tuulikuja 2, FI-02100 Espoo Domicile Espoo, Finland Email [email protected]
Figure 3. The first rock placement campaign. The lower map shows the area marked with the blueframe in more detail.
Mattress installation
Mattresses installation started in Finland on the 30.6 with the pre-installation surveys. Theactual installation of mattresses started on the 1.7 and will be reported in Q3 report 2018.

Quarterly Report Q2 2018PO 17-5149
10/20
W-PE-EMO-PFI-RQU-892-RQU218EN-06
Sitowise Oy Business ID 2335445-0 Tel +358 20 747 6000Tuulikuja 2, FI-02100 Espoo Domicile Espoo, Finland Email [email protected]
3 Underwater noise
3.1 Monitoring activitiesUnderwater noise measurements were carried out according to the EnvironmentalMonitoring Programme Finland, by Luode Consulting Oy. The monitoring consisted of 8fixed long-term monitoring stations covering practically the whole Gulf of Finland, andvessel based on-site monitoring of 3 selected munitions clearance operations (Table 4).
Table 4. Munitions monitored with vessel based campaigns.
ID Classification Nationality Predicted inpermit application
[TNT kg]
Clearancecontractor re-
evaluation[TNT kg]
R-R05-7058 Grenade Russian 40 7R-R06-20716 Depth Charge Unknown 180 40R-R09ALT1-20117 EMC-1 German 300 300
The long-term stations were installed between 17–24.4.2018 and serviced between 15.-26.5.2018 when the data was downloaded for further analysis. The available data coversapproximately the first month of the munitions clearance operation. The final report ofunderwater noise monitoring will be finished during Q3.
Two main indicators were calculated based on the records:
· Peak Sound Pressure Level (SPL) is the maximum sound pressure level that ismeasured during the noise event. It is in units of dB.
· Permanent Threshold Shift (PTS) describes the sound pressure level that causes anincreased risk of onset of permanent damage for hearing. For marine mammals thislevel is 179 dB. PTS is often presented as the area where the 179 dB level isexceeded. It can also be presented as the maximum distance from the sound sourcewhere the 179 dB level is still reached.
Calculation of PTS requires measurements also in the vicinity of the sound source. Thesemeasurements were available for the 3 vessel based monitored munitions clearance sites.In addition, the clearance operators carried out their own on-site measurements aroundother clearance sites. These measurements will be available for further assessment duringQ3.
3.2 ResultsIn the data collected at the long-term monitoring stations, 24 munitions clearance eventswere detected and analysed. Because the same clearance event was measured on severalstations, altogether 84 separate peak SPLs were detected. When compared to themodelled values in the permit application, 83 out of 84 measured peak SPLs were at or

Quarterly Report Q2 2018PO 17-5149
11/20
W-PE-EMO-PFI-RQU-892-RQU218EN-06
Sitowise Oy Business ID 2335445-0 Tel +358 20 747 6000Tuulikuja 2, FI-02100 Espoo Domicile Espoo, Finland Email [email protected]
below the modelled range (Figure 4). Only one measured peak (R-R09ALT1-20117 at 500meters) was 5 dB higher than the modelled value. This took place well within the estimatedinfluence area of the ADD’s. The probability for the occurrence of marine mammalsincreases with increasing distance from the munition. However, all the measured SPLs wereclearly below the modelled values within the 5–120 km range.
There is increasing variation in the measured peak SPLs with increasing distance which wasnot found in the model results. Bottom topography was estimated to be the main reasonfor this. Islands and shallow areas effectively break the SPLs. Thus the Finnish shallowarchipelago was sheltered more effectively than the deeper Estonian coastline whichtypically has no islands.
Figure 4. Peak sound pressure levels (SPL) from munitions clearance measured both by long termmeasurement stations and by vessel based stations. The SPL levels used in the permit applicationare based on modelling. They are presented as an area which covers the variation in the modelresults.
The area where the risk of onset of PTS level for marine mammals was reached wassignificantly smaller than it was assessed to be in the permit application in all 3 vessel basedmonitored munition clearances (Figure 5). The PTS level was not reached within any of theadjacent Natura 2000 areas.
In the case of the two smaller vessel based monitored munitions, the munition appearedto be of a smaller charge size than predicted (Table 4). The size of the largest munition (300TNT kg) was not changed in the clearance contractor re-evaluation. However, even in thecase of the largest munition, there was a significant decrease in the PTS area compared tothe permit application. It is possible that the use of a bubble curtain around the cleared
100
120
140
160
180
200
220
240
260
100 1000 10000 100000
Peak
SPL
[dB]
Distance [m] logarithmic scale
Measured peak SPLVariation in modelled peak SPL

Quarterly Report Q2 2018PO 17-5149
12/20
W-PE-EMO-PFI-RQU-892-RQU218EN-06
Sitowise Oy Business ID 2335445-0 Tel +358 20 747 6000Tuulikuja 2, FI-02100 Espoo Domicile Espoo, Finland Email [email protected]
munition was more effective than predicted in the modelling. In addition, munitions wereold and may have had a low order detonation rather the assessed high order detonation.
Figure 5. The map shows both the areas where the PTS levels for marine mammals was assessedto be reached in the permit application (predicted PTS area), and the actual measured areas(measured PTS area). The data for measurements was collected at 3 vessel based monitoredmunition clearance sites on 6– 8.5.2018.

Quarterly Report Q2 2018PO 17-5149
13/20
W-PE-EMO-PFI-RQU-892-RQU218EN-06
Sitowise Oy Business ID 2335445-0 Tel +358 20 747 6000Tuulikuja 2, FI-02100 Espoo Domicile Espoo, Finland Email [email protected]
4 Water quality and currents
4.1 Monitoring activitiesWater quality and current velocity was monitored according to the approvedEnvironmental Monitoring Programme Finland, at 6 sites by Luode Consulting (Table 5 andFigure 6). The sites were equipped with profiling current meters measuring flow speedsand directions in separate depth layers covering the whole depth range from the bottomto the surface. Water quality monitoring includes turbidity, dissolved oxygen, salinity andtemperature measurements at three depth layers near bottom.
During Q2, two of the sites were located at munition clearance sites, one on a pre-lay rockplacement site and one in the Sandkallan protected area relatively close to the munitionclearance and rock placement sites. In addition, two control stations were set up in theWestern and Eastern Gulf of Finland. The same control locations were used during the NordStream pipeline construction. First data analysis will be available during Q3. One additionalmonitoring site will be installed during Q3 to observe rock placement activities.
Table 5. Water quality and current velocity monitoring sites.
Installed Recovered
Munitions clearance 1 (R-R09ALT1-20467) 9.5.2018Munitions clearance 2 (R-R12-10513) 23.5.2018 21.6.2018Sandkallan protected area 18.4.2018Rock placement 1 (FI-A1001) 18.4.2018Control 1 17.4.2014Control 2 18.4.2014

Quarterly Report Q2 2018PO 17-5149
14/20
W-PE-EMO-PFI-RQU-892-RQU218EN-06
Sitowise Oy Business ID 2335445-0 Tel +358 20 747 6000Tuulikuja 2, FI-02100 Espoo Domicile Espoo, Finland Email [email protected]
Figure 6. Water quality and current monitoring sites during Q2.
4.2 Results
First water quality and current data analysis will be available during Q3.

Quarterly Report Q2 2018PO 17-5149
15/20
W-PE-EMO-PFI-RQU-892-RQU218EN-06
Sitowise Oy Business ID 2335445-0 Tel +358 20 747 6000Tuulikuja 2, FI-02100 Espoo Domicile Espoo, Finland Email [email protected]
5 Sediment toxicity analysisIn order to study potential toxic material release to seabed due to munitions clearance, 17sediment samples were collected to provide reference data of potential explosive residualand heavy metal spreading in clearance site surroundings of targets R-R08-5261 and R-R09-7495. Target R-R08-5261 was an old Russian depth charge BM-1 with NEQ 30 kg, and targetR-R09-7495 a German EMC-1 mine with NEQ 310 kg. No residues of explosives exceedingthe laboratory detection limits were found. Heavy metal concentrations were typical tothose seen in earlier studies in the Gulf of Finland (W-PE-EMS-PFI-REP-812-SEDTOXSEN-01).
The study methodology and results will be presented in more detail in the Q3 report andin the 2018 annual report.

Quarterly Report Q2 2018PO 17-5149
16/20
W-PE-EMO-PFI-RQU-892-RQU218EN-06
Sitowise Oy Business ID 2335445-0 Tel +358 20 747 6000Tuulikuja 2, FI-02100 Espoo Domicile Espoo, Finland Email [email protected]
6 Cultural heritageTo verify any changes in the two monitored marine archaeological objects, surveys wereperformed before the start of construction.
Wreck S-R05-7978
The wreck inspection using Remotely Operated Vehicle (ROV) survey for the monitoringobject S-R05-7978 was performed from the MV Stril Explorer on 6.5.2018. The cannonbarge wreck site is regarded as an important archaeological site.
Figure 7. Wreck midship, cannons, cannon balls and debris. Picture from 2016 inspectionW-SU-DET-POF-REP-808-CHO001EN-01.
The object is located approximately 59 meters from the nearest planned pipeline.
Distance to the nearest planned rock placement area is more than 500 meters, and to thenearest munition clearance 6,9 km.
Anti-submarine net S-R09-09806
The inspection of existence and condition of the historical anti-submarine net S-R09-09806was performed by the MV Geosund on 2.5.2018.
A Multibeam Echo Sounder (MBES) sweep was performed from north to south, across theinstallation corridor for both cable routes, A and B. The Remotely Operated Vehicle (ROV)then proceeded to visually trace the line of floats and cables of the anti-submarine warfarenet. Various, predefined targets defined by NSP2 were then each inspected, and theircondition recorded for future reference.

Quarterly Report Q2 2018PO 17-5149
17/20
W-PE-EMO-PFI-RQU-892-RQU218EN-06
Sitowise Oy Business ID 2335445-0 Tel +358 20 747 6000Tuulikuja 2, FI-02100 Espoo Domicile Espoo, Finland Email [email protected]
Figure 8. Buoy attached to submarine net/wires (SD-Alt1-3372-J) from 2016 inspection, W-SU-DET-POF-REP-808-WRK014EN-03.
The seabed in this area is dominated by exposed rock outcrops. The eastern margin of thisoutcrop forms a steep scarp face (33 % gradient). The anti-submarine net seems to havebeen laid along this rock outcrop.
Only the associated floats / buoys and the cable were seen during the survey. No munitionsor other debris items were visible.

Quarterly Report Q2 2018PO 17-5149
18/20
W-PE-EMO-PFI-RQU-892-RQU218EN-06
Sitowise Oy Business ID 2335445-0 Tel +358 20 747 6000Tuulikuja 2, FI-02100 Espoo Domicile Espoo, Finland Email [email protected]
7 Notifications to ELY-Centres during the second quarterNSP2 delivered the following notifications to Uusimaa, Southeast and Southwest ELY-Centres during the monitoring period:
· 18/04: Nord Stream 2 notification on commencement of works in Finland – WPcondition 44
· 23/04: Change in the monitoring programme (2 munitions for UW noise monitoring)– Water Permit (WP) provision 41
· 11/05: Change in the use of bubble curtains – WP provision 18
· 14/05: Preliminary results of UW noise (as per monitoring programme)
· 15/05: Summary table and map of munitions (interim version) –WP provision 18
· 24/05: Interim technical UW noise report (as per monitoring programme)
· 25/05: Munition chance finds –WP provision 24
· 31/05: Non-conformity notification regarding use of bubble curtains
· 29/06: Summary table and map of munitions (final version) –WP provision 18
The content of the notifications will be presented in the 2018 annual report.

Quarterly Report Q2 2018PO 17-5149
19/20
W-PE-EMO-PFI-RQU-892-RQU218EN-06
Sitowise Oy Business ID 2335445-0 Tel +358 20 747 6000Tuulikuja 2, FI-02100 Espoo Domicile Espoo, Finland Email [email protected]
8 ConclusionsThe preliminary construction works have been proceeding as planned and environmentaland technical monitoring has been carried out according to the monitoring programme.
The preliminary results indicate that environmental impacts of underwater noise havebeen as assessed or smaller.
The results in this report are preliminary. The final results will be presented in the annualreport.
Quarterly Report Q2 2018PO 17-5149
20/20
W-PE-EMO-PFI-RQU-892-RQU218EN-06
Sitowise Oy Business ID 2335445-0 Tel +358 20 747 6000Tuulikuja 2, FI-02100 Espoo Domicile Espoo, Finland Email [email protected]
9 List of sources
Literature
Great Britain’s Joint Nature Conservation Committee 2017. JNCC guidelines for minimising the risk of injuryto marine mammals from geophysical surveys
Luode Consulting Oy, 2018. Nord Stream 2. Interim report of underwater noise monitoring during munitionclearance in the Finnish EEZ. W-GE-EMO-PFI-REP-812-UWNIREEN-03.
Luode Consulting Oy, 2018. Results of sediment toxicity analysis for targets R-R08-5261 and R-R09-7495. W-PE-EMS-PFI-REP-812-SEDTOXSEN-01.
MMT Sweden AB, 2016. Nord Stream 2. Cultural heritage target inspection report S-R09-09806 and SD-ALT1-3372. Nord Stream 2. W-SU-DET-POF-REP-808-WRK014EN-03
MMT Sweden AB, 2018. Nord Stream 2. Route clearance and UXO removal, UXO clearance survey, Bay ofFinland May-June 2018. W-SU-UXO-PFI-REP-808-EODSUREN-01.
MMT Sweden AB, 2018. Nord Stream 2. Cultural heritage object inspection report S-R05-07978. W-SU-DET-POF-REP-808-CHO001EN-01
N-Sea/Bodac 2018. Nord Stream 2. Munition clearance in the Finnish EEZ. Anti-Submarine Net VerificationSurvey. W-SU-UXO-PFI-REP-831-FMASWNEN-01.
N-Sea/Bodac 2018. Nord Stream 2. Munitions Clearance Finnish EEZ. EOD Summary Report W-SU-UXO-PFI-REP-831-GEOFRREN-01
Ramboll, 2018. Nord Stream 2. Natural gas pipeline route through the Baltic Sea – Environmentalmonitoring programme, Finland. 1.2.2018. W-PE-EMS-PFI-REP-805-032300FI-08.
Maps and GIS data
Background admiralty charts, 2018. Charts are not to be used for navigation.© Crown Copyright and/or database rights. Unauthorized copying prohibited. Reproduced in Sitowise Oy by permission of the Controller of Her Majesty’s Stationery Office and the UK Hydrographic Office (www.GOV.uk/UKHO) and Bundesamt für Seeschifffahrt und Hydrographie (BSH). Other copyright holders include Finnish Transport Agency, Department of Navigation and Oceanography of the Ministry of Defence of the Russian Federation, and Estonian Maritime Administration.
European Environmental Agency (EEA) 2018. Natura 2000 sites. © Directorate-General for the Environment(DG ENV).
Finnish Environmental Institute (SYKE) 2018. Natura 2000 sites.
International Boundaries Research Unit (IBRU) 2010. Borders of Exclusive Economic Zones and TerritorialWaters

INTERIM REPORT OF UNDERWATER NOISE MONITORING DURING MUNITION CLEARANCE IN THE FINNISH EEZ
Toni Meriläinen, Antti Lindfors & Olli Huttunen
05 2018-09-14 Amended version TM KR AL
Rev. Date Description Prepared Checked Approved
Luode Consulting Oy
Document Title
INTERIM REPORT OF UNDERWATER NOISE
MONITORING DURING MUNITION CLEARANCE IN THE FINNISH EEZ
Company Representative : Enrica de Luca
Reference : PO17-5222 Document-No.
W-GE-EMO-PFI-REP-812-UWNIREEN-05
Rev.
05 PO. No. : PO17-5222
Contractor Representative : Antti Lindfors
Document Owner : Luode Consulting Oy

1
14.9.2018 Document: W-GE-EMO-PFI-REP-812-UWNIREEN-05
Introduction ..................................................................................................................................... 2
Metrics ............................................................................................................................................ 3
Measurement set-up ....................................................................................................................... 3
Comparison of the measured peak values with the modelled permit application values .................. 4
Permanent threshold shift (PTS) distances of marine mammals ..................................................... 6
Pressure waveform of explosion signal ........................................................................................... 7
Propagation loss variation with frequency ....................................................................................... 9
Measurement depth and thermocline .............................................................................................. 9
Time-series analysis of the long-term monitoring stations ............................................................. 10
Conclusions .................................................................................................................................. 15
Appendix 1. Analyzed munition clearances ................................................................................... 16
Appendix 2. Instruments ............................................................................................................... 17
Appendix 3. Calibration data ......................................................................................................... 18
Appendix 4. CTD profiles .............................................................................................................. 22
LIST OF ABBREVIATIONS: EEZ Exclusive Economic Zone SPL Sound Pressure Level SEL Sound Exposure Level L5 L5 Statistical Sound pressure level for peak values (exceeded 5% of time) CTD Oceanography instrument for conductivity, temperature, depth etc. PTS Permanent Threshold Shift
L U O D E C O N S U L T I N G O Y , S A N D F A L L I N T I E 8 5 ,
F I - 2 1 6 0 0 P A R A I N E N

2
14.9.2018 Document: W-GE-EMO-PFI-REP-812-UWNIREEN-05
Introduction This report includes the results of the long-term and vessel based underwater noise measurements of the Nord Stream 2 project in Finland in line with the approved “Monitoring Programme Finland “(W-PE-EMS-PFI-REP-805-032300EN-11). The report includes comparison of the measured peak values with the modelled permit application values. Comparison covers munitions cleared until the 14th of May. Report includes also the time-series from all eight long-term stations: Hanko A, Hanko B, Kallbådan A, Kallbådan B, Söderskär, Eastern Gulf of Finland, Malusi and Uhjtu (figure 1). Depending on the service visit date long-term time-series include approximately the first one month measurement period starting from 17th of April and ending between 14th - 26th of May 2018. Exact dates depend on the measuring station and these are introduced in table 1. Monitoring started two weeks prior the munitions clearance operations and will continue until the clearance operations are completed. The first clearance operations took place on 3rd of May 2018. Complete time-series including post clearance period from all stations will be analyzed after the systems will be recovered in July 2018.
Figure 1 long-term monitoring station locations
Table 1 The first measurement period
Station Deployment Service visit Estimated recovery
Hanko A 2018-04-17 2018-05-22 2018-07
Hanko B 2018-04-17 2018-05-22 2018-07
Kallbådan A 2018-04-17 2018-05-15 2018-07
Kallbådan B 2018-04-17 2018-05-15 2018-07
Söderskär 2018-04-18 2018-05-15 2018-07
Eastern GoF 2018-04-18 2018-05-15 2018-07
Malusi 2018-04-23 2018-05-26 2018-07
Uhtju 2018-04-23 2018-05-26 2018-07
In addition to long-term monitoring, three short-term vessel based monitoring campaigns were conducted. During these mobile noise measurements campaigns three different types and sizes munitions (table 2) were cleared. Results from the long-term stations are merged with the mobile monitoring results and the extent of PTS areas are modelled and compared to levels in updated

3
14.9.2018 Document: W-GE-EMO-PFI-REP-812-UWNIREEN-05
summary tables of Environmental Impact Assessment of Munition Clearance on Munition by Munition basis Finnish EEZ (W-PE-EIA-PFI-REP-999-MBYM02EN-01). PTS and other metrics are introduced in the next chapter. Measured peak levels from munitions clearance are compared to the modelled peak values from the permit application. Table 2 Mobile campaign munition clearance targets. *: These values were presented in the permit application
ID Classification Nationality Predicted values,
TNT (kg)*
R-R05-7058 Grenade Russian 40
R-R06-20716 Depth Charge Unknown 180
R-R09ALT1-20117 EMC-1 German 300
Metrics Underwater noise metrics are dependent on the characteristics of the noise source. For impulsive sounds appropriate metrics are Sound Exposure Level, Peak Sound Pressure level and Peak-to-Peak Sound Pressure Level. For continuous sound sources the Sound Pressure Level is commonly used. Peak level is the maximum sound pressure level that is measured during the noise event. It is the maximum value reached by the sound pressure. Sound Exposure Level, or SEL, is a useful metric to assess cumulative noise exposure as it allows for the comparison of sounds with varying durations. SEL gives an indication of the total acoustic energy of the noise event. Permanent threshold shift (PTS) in hearing is recommended as a criterion injury. PTS thresholds for single impulsive noise for marine mammals is 179 dB unweighted SEL (single event). Sound exposure and mean square levels are related by:
𝑆𝑃𝐿𝑟𝑚𝑠 + 10 𝑙𝑜𝑔10 (𝑇) = 𝑆𝐸𝐿 where 𝑆𝐸𝐿 is the sound exposure level (dB re 1 µPa2.s), 𝑆𝑃𝐿𝑟𝑚𝑠 is the mean square level (dB re 1 µPa2), and T is the signal duration in seconds. The 5-percent exceeded level, L5, is used in long-term monitoring time series. It is the sound pressure level exceeded for 5 percent of the time. Each statistical Ln level indicates the percentage (etc. 5%, 50%, and 95%) of measurements for which the SPL has a higher value than the Ln level. L5 quantifies peaks of noise. L5 has been calculated for 20 second intervals for the whole measurement period.
Measurement set-up A typical measurement installation is shown in figure 2. A set of monitoring devices were installed in a line. Moored hydrophone string is hanging from sub-surface buoys, which keep system suspended. More detailed information about used instruments can be found in Appendix 2. Before and after the measurements the hydrophones were tested and calibrated with a GRASS pistonphone. Pistonphone and Hydrophone calibration sheets are in Appendix 3. All measurement lines were identical having one monitoring device located 10 meters below the surface and second 35 meters below the surface. Water depth in all eight monitoring sites is more than 50 meters. CTD

4
14.9.2018 Document: W-GE-EMO-PFI-REP-812-UWNIREEN-05
(Conductivity Temperature Depth) and sound velocity profiles were collected during the installation and service visits in order to record background information concerning prevailing stratification.
Figure 2 Upper: Schematic illustration of long-term installation, not in scale and lower: Schematic illustration of vessel based monitoring arrays.
Comparison of the measured peak values with the modelled permit application values From the beginning of installation until the service visit of long-term noise monitoring stations 57 munitions were cleared. In four cases, two attempts were required to clear the munition. In this report 26 clearance operations were analyzed while other clearance operations from 15th to 26th of May were executed after the service visit to Eastern GOF, Söderskär and Kallbådan. Data especially from Kallbådan, which is the closest station, will be available after the systems are recovered in July. Analyses of the remaining munitions will be presented in the final report. Locations of the 26 analyzed munitions are shown in figure 3 and more details about the munitions and measurement distances are in the appendix 1.

5
14.9.2018 Document: W-GE-EMO-PFI-REP-812-UWNIREEN-05
Figure 3 Location of the munitions (yellow)
In all except one cases, measured peak pressure levels were lower than assessed in the permit application. At 1000 m from the detonations, measured peak levels (figure 4) of 26 clearance actions were on average 20 dB lower than modelled values. Noise reduction with distance was also higher. Only one measured peak level (R-R09ALT1-20117 at 500 meters) which was recorded with vessel-based monitoring was higher (5 dB) than modelled value.

6
14.9.2018 Document: W-GE-EMO-PFI-REP-812-UWNIREEN-05
Figure 4 Measured peak pressure data from munitions clearance from 3rd of May to 14th of May.
Permanent threshold shift (PTS) distances of marine mammals Permanent threshold shift (PTS) distances of marine mammals are introduced in Table 3 and the measured SEL results are compared against the modelled values with bubble curtain. Table 3 Distances to the PTS assessment level limit thresholds.
PTS (179 dB re 1μPa2s) R-R05-7058 TNT 40 kg
R-R06-20716 TNT 180 kg
R-R09ALT1-20117 TNT 300kg
Measured values 2300 meters 1900 meters 4900 meters
Modelled values 4000 meters 8400 meters 10600 meters
In these three cases enough data was available from different distances to model the PTS exposure areas which are introduced in figure 5. In all three cases the PTS-zone was smaller than it was assessed in the permit application. The difference between measured and modelled values is not due to munitions being smaller than originally assessed for R-R09ALT1-20117, because its re-evaluation confirmed the original size of 300 kg. The difference is in this case due to propagation loss being in general larger than modelled. For R-R06-20716 the difference was also due to the re-evaluation - the munition was probably smaller than assessed in the permit application.
120
140
160
180
200
220
240
100 1000 10000 100000
Pea
k SP
L[d
B r
e. 1
μP
a]
Distance [m]
Peak values
Measured values Permit Application
Log. (Measured values) Log. (Permit Application)

7
14.9.2018 Document: W-GE-EMO-PFI-REP-812-UWNIREEN-05
More PTS exposure areas will be attempted to analyze and modelled to the final report after the recovery of long term monitoring stations and when the short range measurement data has been received from the munition clearance vessels.
Figure 5 Distances to the PTS assessment level limit thresholds
Pressure waveform of explosion signal While main part of explosion´s energy is transmitted through water, part of the energy is propagating in the ground. Low-frequency ground wave propagates faster and it can be seen before the main pulse is recorded on hydrophones. For example during the munition clearance R-R08-20321 ground wave arrived to Kallbådan A (11800 meters) 6.3 seconds prior to main pulse (figure 6).

8
14.9.2018 Document: W-GE-EMO-PFI-REP-812-UWNIREEN-05
Figure 6 Munition clearance R-R08-20321 (24° 28.9076' 59° 47.1197'), German EMC 330 kg charge, measured from Kallbådan A, distance 11778 meters.
In figure 7 the same munition clearance was measured from a distance of 48000 meters. As seen on the figure main pulse reflected 5-6 times from surrounding islands and coastline after it was first recorded.
Figure 7 Munition clearance R-R08-20321 (24° 28.9076' 59° 47.1197'), German EMC 330 kg charge, measured from Malusi, distance 47984 meters.

9
14.9.2018 Document: W-GE-EMO-PFI-REP-812-UWNIREEN-05
Propagation loss variation with frequency In addition to wide-band results it is interesting to consider how the sound propagation varies with frequency. In figure 8 1/3 octave sound exposure level of munition event R-R09ALT1-20117 (German EMC-1, 300 kg charge) is measured from distances of 462 m, 2025 m, 4918 m and 13756 m. Propagation loss is more intensive at frequencies below 160 Hz. Low-frequency cut-off is defined by the seafloor and the depth varies in this case from 20 meters to 50 meters. Variation of sound transmission loss with frequency is dependent on water depth, sound speed profile, seabed and sea-surface loss. The frequency response will be different in the far field compared with measurements from the nearby area.
Figure 8 Munition clearance R-R09ALT1-20117 sound exposure level measured from four different distances.
Measurement depth and thermocline CTD and sound velocity profiles were measured from the long term monitoring locations during the installation and recovery. CTD and sound velocity profiles are introduced in appendix 4. CTD and sound velocity profiles are used to give background information about the stratification and presence of the seasonal thermocline. Strong vertical gradients can impact the noise penetration and attenuation. Thermocline was emerging during the first half of May and after the second recovery it is possible to detect the effect of the stratification on the sound attenuation and noise penetration. One of the biggest difference was measured during the munition clearance R-R09ALT1-20560 (figure 9). Form of the frequency response is similar but the amplitude difference is almost 10 dB at several 1/3 octave frequency bands meaning that less energy was seen on uppermost layer. Hydrophones were 10 m and 35 meters below the surface.
60
80
100
120
140
160
180
200
12
.5 16
20
25
31
.5 40
50
63
80
10
0
12
5
16
0
20
0
25
0
31
5
40
0
50
0
63
0
80
0
10
00
12
50
16
00
20
00
25
00
31
50
40
00
50
00
63
00
80
00
10
00
0
12
50
0
SEL
[dB
re
1μ
Pa2
s]
Frequency [Hz]
R-R09ALT1-20117
Distance 462 m Distance 2025 m Distance 4918 m Distance 13756 m

10
14.9.2018 Document: W-GE-EMO-PFI-REP-812-UWNIREEN-05
Figure 9 Munition clearance R-R09ALT1-20560 (24° 18.0863' 59° 44.5098'), shell with 17 kg TNT charge measured sound exposure level in Malusi, 10 m and 35 meters below the surface.
Time-series analysis of the long-term monitoring stations For the long-term monitoring stations analyses, munition clearance occurring during the first three weeks of the clearance campaign were used. Munition clearance operations started on 3rd of May to first service visits were done on 14th of May, Hanko A and B on 22nd of May and Malusi and Uhjtu which were serviced on 26th of May. Time-series analysis of the long-term monitoring stations are presented in figures 10 – 15. Reported value is L5 (20 seconds) which indicates the percentage (5%) of measurement windows for which the SPL has a higher value than the L5 level. L5 quantifies peaks of noise and it has been calculated for 20 second intervals for the whole measurement period. It’s not directly comparable with the peak SPL value which is the maximum value reached by the sound pressure. At Eastern Gulf of Finland (figure 10) the noise levels did not change much during the munition clearance. Shipping density was moderate and the monitoring station was aside from the shipping lane. Distance between the monitoring and munitions clearance was from 30 to 150 km and on the west side of the monitoring area between the station and munition clearance depth was only 15 meters. At Söderskär (figure 11) L5 (20 seconds data windows) values peaks from the munition clearance operations were standing out as 10 analyzed munitions clearance events were closer than 30 km from the monitoring station. Shallow area (under 10 meters) southwest from the station attenuated the noise levels of munition clearance operations which were cleared west side of Helsinki after 10th of May. In general the highest noise levels were recorded at Kallbådan A (figure 12). Highest peak levels were measured during the munitions clearance R-R09ALT1-20117 (8th of May), R-R09-7495 and R-R09ALT1-20111 (13th of May). Sensitivity of the hydrophones at Kallbådan A was too high and peak levels exceeded the maximum measurement threshold. Due to the fact that distance to
60
70
80
90
100
110
120
130
140
150
160
12
.5 16
20
25
31
.5 40
50
63
80
10
0
12
5
16
0
20
0
25
0
31
5
40
0
50
0
63
0
80
0
10
00
12
50
16
00
20
00
25
00
31
50
40
00
50
00
63
00
80
00
10
00
0
12
50
0
SEL
[dB
re
1μ
Pa]
Frequency [Hz]
R-R09ALT1-20560
Malusi lower Malusi upper

11
14.9.2018 Document: W-GE-EMO-PFI-REP-812-UWNIREEN-05
construction activities was the shortest at Kallbådan A stations, the highest noise impacts were recorded, but when compared with munitions clearance times, an intensive shipping in the area was found to be the main reason for elevated readings. At Kallbådan B peak levels were 10-20 dB lower as the surrounding area has strong depth gradient and several shallow areas. Distance between Kallbådan A and Kallbådan B is 6663 meters. At Hanko A & B munitions clearance between 3 of May and 14 of May had no effect to the time-series analysis. The shortest distance between the analyzed munition clearance and Hanko A/B monitoring station was over 50 km and on the east side of the measuring stations depth was under 10 meters. No significant difference was recorded between Hanko A & B stations. Peak levels are mostly caused by shipping in the area. High noise levels halfway through the measurement period are caused by stormy weather. Distance between Hanko A and Hanko B is 8143 meters. As expected single peaks from the munition clearance operations stand out at Malusi as it’s more silent in nature. A few peak before the operations are caused by shipping. Propagation loss is lower because of the constant depth all the way to the monitoring stations Malusi and Uhtju.Peaks at Uhtju (figure 15) are caused by shipping but also munition clearance operations which were cleared on the east side of Helsinki.
Figure 10 Time-series L5 (20 seconds) vs munition clearance events – Eastern Gulf of Finland

12
14.9.2018 Document: W-GE-EMO-PFI-REP-812-UWNIREEN-05
Figure 11 Time-series L5 (20 seconds) vs munition clearance events – Söderskär
Figure 12 Time-series L5 (20 seconds) vs munition clearance events – Kallbådan A & B

13
14.9.2018 Document: W-GE-EMO-PFI-REP-812-UWNIREEN-05
Figure 13 Time-series L5 (20 seconds) vs munition clearance events – Hanko A & B
Figure 14 Time-series L5 (20 seconds) vs munition clearance events – Malusi

14
14.9.2018 Document: W-GE-EMO-PFI-REP-812-UWNIREEN-05
Figure 15 Time-series L5 (20 seconds) vs munition clearance events – Uhtju

15
14.9.2018 Document: W-GE-EMO-PFI-REP-812-UWNIREEN-05
Conclusions These results are based on interim data analyzes.
83 out of 84 measured peak levels from 26 munition clearance operations were lower than modelled values.
Based on information collect from three vessel based monitoring cases the observed propagation loss was higher and thus noise readings smaller compared to the modelled results. Therefore the PTS-zone was smaller than it was assessed in the permit application.
As expected single peaks from the munition clearance operations stand out at Malusi and Söderskär stations as they are more silent in nature.
Due to the fact that distance to construction activities was the shortest at Kallbådan A
stations, the highest noise impacts were recorded, but when compared with munitions clearance times, an intensive shipping in the area was found to be the main reason for elevated readings.
Generally low background levels were recorded due to relatively calm weather period during the munitions clearance operations
Propagation loss was more intensive at frequencies below 160 Hz

16
14.9.2018 Document: W-GE-EMO-PFI-REP-812-UWNIREEN-05
Appendix 1. Analyzed munition clearances List of the 57 munitions cleared during the reference period. In four cases, 2 attempts were required to clear the munition.
Charge [kg] Charge [kg] Distace from Distace from Distace from Distace from Distace from Distace from Distace from Distace from
Permit Clearance plan Hanko A [m] Hanko B [m] Kallbådan A [m] Kallbådan B [m] Söderskär [m] Eastern GoF [m] Malusi [m] Uhtju [m]
R-R05-20018 9.5.2018 16:18 18 18 167308 163551 115240 112862 28969 30895 71393 37454
R-R05-20261 6.5.2018 11:41 75 40 160920 157210 108813 106477 22984 37259 65390 37514
R-R05-7058 6.5.2018 9:55 40 7 160918 157209 108808 106475 22991 37271 65371 37483
R-R05-20805 10.5.2018 13:47 50 50 151997 148502 99688 97607 16902 47101 55527 36869
R-R06-0386 5.5.2018 9:18 10 10 132872 129672 80382 78666 16221 66806 37465 46602
R-R06-20411 3.5.2018 15:01 150 40 128746 125465 76314 74472 16741 70212 35879 50895
R-R06-26165 4.5.2018 12:04 5 5 128422 125139 75991 74146 16897 70510 35709 51189
R-R06-26167 7.5.2018 14:33 20 24 128210 124927 75781 73935 17014 70709 35587 51373
R-R06-20716 7.5.2018 5:28 180 40 119181 115870 66794 64882 23149 79198 31513 59513
R-R07-8004 10.5.2018 8:10 5,5 3 111274 107893 58981 56925 29528 86597 30428 67123
R-R07-31008 10.5.2018 14:03 50 5 97087 93559 45085 42661 42456 100171 33501 80978
R-R09ALT1-20060 12.5.2018 6:08 17 17 57541 55564 6282 11054 83996 141560 53462 116222
R-R09ALT1-20208 11.5.2018 6:59 137 25 54311 52544 5220 11501 87451 145016 56312 119416
R-R09ALT1-20560 11.5.2018 12:43 17 17 54068 52420 5870 12254 87986 145519 56399 119658
R-R09ALT1-20560 14.5.2018 11:59 17 17 54068 52420 5870 12254 87986 145519 56399 119658
R-R09ALT1-20531 12.5.2018 12:29 40 17 52423 50946 6582 13215 89901 147420 57863 121325
R-R09ALT1-20531 12.5.2018 14:34 40 17 52423 50946 6582 13215 89901 147420 57863 121325
R-R09-7495 13.5.2018 6:56 300 300 52279 50820 6679 13321 90074 147591 57992 121472
R-R09ALT1-20117 8.5.2018 5:50 300 115 51168 49777 7096 13756 91228 148752 59049 122598
R-R09ALT1-20111 13.5.2018 12:40 300 150 50912 49531 7175 13827 91476 149003 59299 122856
R-R09ALT1-20111 14.5.2018 6:58 300 150 50912 49531 7175 13827 91476 149003 59299 122856
R-R09ALT1-20468 20.5.2018 9:27 50 1 49581 48236 7619 14171 92723 150273 60607 124190
R-R09ALT1-20472 20.5.2018 10:54 50 1 49561 48216 7624 14172 92740 150290 60627 124210
R-R09ALT1-20478 20.5.2018 12:20 50 1 49541 48196 7627 14174 92756 150307 60647 124230
R-R09ALT1-20486 20.5.2018 13:46 50 1 49500 48155 7635 14176 92790 150342 60689 124270
R-R09-7563 19.5.2018 5:33 115 115 49181 47840 7753 14255 93080 150638 61006 124590
R-R09-7578 19.5.2018 10:36 300 300 48517 47182 8009 14413 93670 151242 61668 125252
R-R09ALT1-20133 20.5.2018 7:08 10 10 48170 46849 8219 14570 94007 151584 62007 125601
R-R08-1585 13.5.2018 5:20 25 25 68037 65418 15450 15421 72636 130247 45350 106246
R-R08-20342 12.5.2018 5:54 40 40 66273 63796 13721 14378 74656 132237 46421 107826
R-R08-20613 13.5.2018 14:05 30 30 65982 63538 13449 14266 75016 132588 46574 108080
R-R08-7249 14.5.2018 5:10 30 30 65913 63456 13372 14148 75045 132623 46684 108163
R-R08-7183 14.5.2018 12:39 30 34 65766 63328 13236 14101 75231 132804 46757 108290
R-R08-7245 16.5.2018 4:59 30 30 64535 62149 12047 13294 76513 134088 47736 109468
R-R08-20713 16.5.2018 11:54 30 30 64378 62002 11899 13210 76684 134258 47853 109616
R-R08-20423 15.5.2018 7:01 30 30 64267 61877 11775 13048 76748 134330 48003 109741
R-R08-20321 15.5.2018 8:56 330 300 64264 61881 11778 13079 76769 134349 47984 109737
R-R08-20422 15.5.2018 5:12 30 30 64227 61839 11737 13023 76789 134372 48035 109779
R-R08-7234 17.5.2018 5:11 30 30 63873 61515 11413 12881 77197 134774 48275 110105
R-R08-7227 17.5.2018 12:00 150 150 62945 60627 10536 12348 78159 135738 49035 110999
R-R08-4659 18.5.2018 5:57 25 60784 58558 8546 11282 80386 137973 50855 113095
R-R08-7030 15.5.2018 8:40 40 20 82183 79014 29868 28012 57782 115449 37173 93546
R-R08-7003 17.5.2018 13:08 3 3 79222 76139 26841 25176 60843 118503 38618 96163
R-R08-7409 15.5.2018 13:44 50 50 78966 75885 26585 24924 61093 118756 38794 96407
R-R08-20545 17.5.2018 5:40 17 17 78670 75590 26293 24631 61377 119043 39012 96694
R-R08-20530 17.5.2018 7:19 17 17 78660 75580 26282 24620 61388 119054 39020 96704
R-R08-31017 17.5.2018 10:26 6 7 78544 75465 26168 24506 61499 119166 39105 96816
R-R08-7131 22.5.2018 1:12 40 17 78372 75282 26008 24318 61639 119315 39307 97013
R-R08-26413 18.5.2018 5:38 17 17 77902 74834 25520 23884 62143 119813 39510 97412
R-R08-7063 16.5.2018 11:00 30 17 77048 73978 24677 23031 62959 120642 40175 98251
R-R08-7063 16.5.2018 14:27 30 17 77048 73978 24677 23031 62959 120642 40175 98251
R-R08-20157 18.5.2018 11:46 17 17 75923 72832 23591 21878 63992 121697 41188 99407
R-R08-20196 18.5.2018 14:12 100 100 73000 70063 20539 19275 67149 124823 42588 101899
R-R10-0188 19.5.2018 5:59 50 25 29877 31992 30459 35252 117260 174825 82202 146987
R-R10-10732 19.5.2018 14:18 240 230 24892 28384 36836 41278 123905 181512 88788 153650
R-R10-8109 20.5.2018 10:17 17 6 21566 26339 41948 46163 129163 186801 94035 158943
R-R11-10639 21.5.2018 5:45 100 115 23581 31706 66455 70149 153890 211593 118282 183375
R-R11-5233 21.5.2018 6:09 115 115 26604 34613 70914 74556 158364 216073 122664 187777
R-R11-10656 21.5.2018 12:00 115 115 27580 35551 72142 75780 159591 217299 123832 188953
R-R11-10174 22.5.2018 5:55 250 240 29896 37752 75126 78738 162582 220292 126751 191885
R-R12-10010 22.5.2018 12:06 100 100 36389 43887 83083 86608 170563 228289 134653 199808
MunitionDetonation
date/time

17
14.9.2018 Document: W-GE-EMO-PFI-REP-812-UWNIREEN-05
Appendix 2. Instruments Long-term monitoring stations were equipped with SoundTrap and DSG-ST hydrophones. SoundTrap is an autonomous acoustic recording unit with frequency range of 20 Hz to 60 kHz and several different sample rate options from 24 to 28 kHz. During the monitoring campaigns the sample rate was set to 24 kHz. Maximum level before clipping is 190 – 210 dB re 1 μPa depending on the model and gain settings.
Figure 16 SoundTrap hydrophone
Loggerhead DSG Ocean Logger is a long-term autonomous acoustic recording unit. The frequency range of the selected hydrophone model, HTI-96-MIN, is 2 Hz to 30 kHz. Sample rate was set to 24 kHz.
Figure 17 DSG-ST hydrophone

18
14.9.2018 Document: W-GE-EMO-PFI-REP-812-UWNIREEN-05
Appendix 3. Calibration data

19
14.9.2018 Document: W-GE-EMO-PFI-REP-812-UWNIREEN-05

20
14.9.2018 Document: W-GE-EMO-PFI-REP-812-UWNIREEN-05
Hydrophone Sensitivity
1279 -179,8
1280 -180,4
1281 -180,5
1571 -201,2
1573 -200,8
1575 -200,9
1664 -200,8
1666 -201,2
1667 -200,7
SM2M HiSPL -239,9
SM2M Ultrasonic -164,1
Benthowave -172,7
SN-B002524 -184,6
SN-B002525 -185,1
SN-B002526 -184,8
335573045 182.4
335585333 174.5
335822915 176.1
335827011 182.9
336072751 183.0
336101423 181.6
1208021018 176.2
1208221722 176.7
1208246306 176.2
1208258609 176.0
1208500255 176.0
1208545311 176.1
1208750105 176.3
1208774690 176.3
1208778777 176.8

21
14.9.2018 Document: W-GE-EMO-PFI-REP-812-UWNIREEN-05

22
14.9.2018 Document: W-GE-EMO-PFI-REP-812-UWNIREEN-05
Appendix 4. CTD profiles Eastern Gulf of Finland 18.4.2018 (yellow) and 15.5.2018 (black) Söderskär 18.4.2018 (yellow) and 14.5.2018 (black)
Kallbådan A 17.4.2018 (yellow) and 15.5.2018 (black) Kallbådan B 17.4.2018 (yellow) and 15.5.2018 (black)

23
14.9.2018 Document: W-GE-EMO-PFI-REP-812-UWNIREEN-05
Hanko A 17.4.2018 (yellow) and 23.5.2018 (black) Hanko B 17.4.2018 (yellow) and 23.5.2018 (black)
Malusi 23.4.2018 (yellow) and 26.5.2018 (black) Uhtju 23.4.2018 (yellow) and 26.5.2018 (black)

!
!
!
!
!
!
!
!!!
!!!!!!!!
!!!!!!!!!!!!!!
!!!!!!!!!!!!!
!!!!!!!!!!
!
!!!!
!!
!!
!!!
!!!!!!!!!!!!!
!
XWXWXWXW
XWXW
XW
XW
XW
XW
XW
XWXWXW
XWXWXWXWXWXW
XWXW
XWXWXWXW
XWXW
XWXWXW
XWXWXWXWXWXW XW
XW
XW
XW
XW
XW
XW
SUOMI
EESTI
ÅLAND
Hiiumaa
FINLAND
ESTONIA
ÅLAND islands
Kotka
Helsinki
Tallinn
Hanko
Koverhar
Paldiski
Inkoo
0 10 20 30 40 50 kmcVersion: Q2 report EN ver6Code: W-PE-EMO-PFI-RQU-892-RQU218EN-06Date: 24.9.2018Prepared: Sonja OksmanControlled: Sanna Vaalgamaa
Construction activities during Q2/2018
Appendix 2
References:- Limits of Exclusive Economic Zones and Territorial Waters: IBRU May 2010- Background sea charts are "Not to be used for navigation"- Background sea chart; © Crown Copyright and/or database rights. Unauthorized copying prohibited. See further copyright descrpition in the report.
Nord Stream 2 Construction activities during Q2/2018! Cleared munitions
(74 munition objects)XW Installed berms
NSP2 RouteNatura 2000 site (coastaland offshore areas)
Territorial borderÅland borderEEZ border
XW
XWXWXW
XW
XW
XWXW
XWXWXWXW
XWXW
XW
XW
XW
!!!
!!!!!!!!!!!
!!
!!!!!!!!!
!!
!!!!!!!!!!
!
!! !
!
XW
XWXWXW
XW
XW
XWXW
XWXWXWXW
XWXW
XW
XW
XW
0 5 10 km