Embed Size (px)
Citation preview

COASTAL NONPOINT SOURCE CONTROL DMONSTRATION PROJECT
D R m NONPOINT SOURCE MANAGEMENT PLAN
FOR THE WATERSHED OF PHINNEYS HARBOR
BOURNE, MASSACHUSETTS
Prepared for the
Massachusetts Department of Environmental Protection
Division of Water Pollution Control
METCALF & EDDY, INC.
SEPTEMBER, 1989

TABLE OF CONTENTS Page
LETTER OF TRANSMITTAL TABLE OF CONTENTS LIST OF TABLES LIST OF FIGURES
CHAPTER 1 - INTRODUCTION Nonpoint Source Pollution Legislative Background Project Objectives and Approach Project Participants
CHAPTER 2 - STUDY AREA BACKGROUND AND EXISTING ENVIRONMENT Nonpoint Source Pollution Impacts Local Pollution Control Measures Applicable Standards and Criteria ./
Environmental Description References
CHAPTER 3 - IDENTIFICATION AND PRIORITIZATION OF POLLUTION SOURCES
Source Identification and Descriptions Source Prioritization References
CHAPTER 4 - ASSESSMENT OF BEST MANAGEMENT PRACTICES BMP Assessment Criteria Identification of Best Management Practices Agricultural Best Management Practices Urban Runoff Best Management Prabtices /' Land Disposal Best Management Practices Boats/Marinas Best Management Practices Nonstructural/Institutional Best Management Practices Summary of BMP Assessment References
CHAPTER 5 - NONPOINT SOURCE MANAGEMENT PLAN Recommended Plan Implementation Responsibilities Cost Estimates Schedule Regulatory Requirements References
APPENDICES
APPENDIX A - Project Advisory Group APPENDIX B - Water Quality Data APPENDIX C - Public And Agency Participation Summary

LIST OF TABLES
Table - 2- 1
Page
Massachusetts Minimum Water Quality Criteria for All Waters of the Commonwealth
Water Quality Criteria for Class SA Waters
Water Quality Criteria for Class B Waters
Satisfactory Compliance Criteria for Growing Areas Approved for Shellfishing Without Depuration
Shellfish Bed Classifications
Land Use Data in 1983 and 1988
Existing Water Quality Data Sources - Back River and Phinneys Harbor
Fecal Coliform Analyses at Stations in Phinneys Harbor and Back River Following Two 1985 Storms
MDEQE Sampling Program Data 8/27-28/85
Sediment Data from Red Brook Harbor
Phinneys Harbor Watershed Profile
Phinneys Harbor Watershed Nonpoint Pollution Source Descriptions
Phinneys Harbor Watershed Fecal Coliform Bacteria Source Loading Estimates
Phinneys Harbor Watershed Nutrient Source Loading Estimates
Potential Best Management Practices for Phinneys Harbor Demonstration Area
Water Pollution Control From New Development: Potential Local Regulatory Techniques
Summary of BMP Assessment
Implementation Tasks and Responsibilities
Cost Estimates for Program Components

LIST OF FIGURES
Figure
1-1
2- 1
2-2
2-3
2-4
2-5
2-6
2-7
2-8
3- 1
3-2
3-3
3-4
3-5
3-6
3-7
4- 1
4-2
4-3
5- 1
5-2
5-3
Nonpoint Source Demonstration Project Technical Approach
Bourne Project Area Location
Status of Shellfish Growing Areas in the Phinneys Harbor Watershed
Land Use in the Phinneys Harbor Watershed
Soils Map of Phinneys Harbor Watershed
Phinneys Harbor Field Sampling Stations
Fecal Coliform Values, Back River Railroad Bridge 1985- 1987
Phinneys Harbor, Wet Weather Fecal Coliform Concentrations
Phinneys Harbor Dissolved Oxygen Concentrations
Phinneys Harbor Watershed Nonpoint Source Locations
Beach Boulevard/Burtonwood Avenue Drainage System
Carlton Road Drainage System
Chester Park Drainage System
Identification and Prioritization Procedure
Prioritization of Nonpoint Sources of Bacteria in Phinneys Harbor Watershed
Prioritization of Nonpoint Sources of Nutrients in Phinneys Harbor Watershed
Conceptual Filter Barrier Design for Cranberry Bogs
Typical Stormwater Infiltration Catch Basin
Typical Leaching Galley Design
Alden Cranberry Bog Schematic, Recommended Plan
Baptiste Cranberry Bog Schematic, Recommended Plan
Beach Boulevard/Burtonwood Avenue Recommended Drainage Plan
Page
1-5
2-2
2-4
2-13
2-14
2-19
2-21
2-22
2-26
3-3
3-8
3-9
3-10
3-12
3-18
3-19
4-7
4-12
4-13
5-5
5-7
5-10
iii

LIST OF FIGURES (Continued) P..
Figure
5-4 Carlton Road Recommended Drainage Plan
5-5 Chester Park Recommended Drainage Plan
5-6 Detailed Dry Well Sizing Schedule
5-7 Chester Park Leaching Galley Plan
5-8 Chester Park Structural Details
5-9 Implementation Schedule
Page
5-1 1
5-13
5- 14
5- 15
5-16
5-25

CHAPTER 1
INTRODUCTION
Nonpoint Source Pollution
Nonpoint source pollution has become recognized as a primary obstacle to the
achievement of water quality standards and is now becoming a major focus of
pollution control efforts. Nonpoint source pollution is defined as pollution
derived from diffuse or widespread sources as opposed to point sources such as
discharges from municipal wastewater treatment plants which usually flow from
the end of a pipe. Typical nonpoint pollutants and sources include:
Bacteria from stormwater, on-site wastewater disposal systems, feedlot runoff, domestic and wild animals, and boat discharges
Nutrients from cultivated areas, on-site wastewater disposal systems, fertilizer application, and decaying grass clippings and vegetation
Sediment from stormwater runoff, land cultivation, construction sites, cleared land, and stream bank erosion
Oil and Grease from parking lot runoff, road surfaces, and illegal disposal of waste oil
Heavy Metals from parking lots, road runoff, and industrial areas
Legislative Background
From the 1970's to the present, water pollution control regulations have been
directed primarily at point source control. With most point discharges
addressed under the National Pollutant Discharge Elimination System (NPDES),
the U.S. Environmental Protection Agency (EPA) and state regulatory agencies
such as the Massachusetts Department of Environmental Protection (DEP),
Division of Water Pollution Control (DWPC) have begun to focus on controlling
nonpoint sources of pollution. Unlike point sources, however, there are no
well established institutional or regulatory frameworks to deal with nonpoint
sources.

As a first step in developing this framework, with Section 319 of the 1987 - amendments to the Clean Water Act, Congress provided local, state and federal
agencies with a new mandate to restore the beneficial uses of streams, lakes,
wetlands and estuaries impaired by nonpoint source pollution. The states are
currently in the process of developing nonpoint source control strategies
through the preparation of Nonpoint Source Assessment Reports and Nonpoint
Source Management Plans. Through these plans, the states are identifying
nonpoint source pollution impaired water bodies, developing nonpoint source
management plans to address the most impaired water bodies, and applying for
federal nonpoint source control funds.
Project Objectives and Approach
In order to develop approaches and effective me ans f or the assessment and
control of nonpoint source pollution problems for use by municipal officials
in Massachusetts coastal areas, especially in areas where nonpoint sources
have resulted in shellfish closures, the Division of Water Pollution Control
selected two test case or demonstration areas for study. These areas included ,-- the watershed of Phinneys Harbor and Back River in Bourne, and part of the
watershed of the East Branch of the Westport River (EBWR) in Westport. Both
of these areas are experiencing shellfish closures due to bacterial
contamination. There are, however, no significant point source discharges in
either area, indicating that the loss of resources is occurring as a result of
nonpoint source pollutian.
In order to demonstrate both technical and organizational means to control
nonpoint sources, nonpoint source management plans were developed for both
study areas. This report contains a nonpoint source management plan for the
watershed of Phinneys Harbor and Back River, Bourne, Massachusetts. The
objective of the development and implementation of the nonpoint source
management plan is to achieve a visible, measurable improvement in water
quality in an area where nonpoint sources were having detrimental effects. In
the case of the Bourne demonstration area, established goals include:
Achievement of Massachusetts water quality standards
Reduction of nonpoint pollutant loadings
Restoration of the recreational and economic value of shellfish beds in Phinneys Harbor and Back River.
The major tasks conducted and outlined in this report include:
1. Review of past studies and sanitary surveys, shellfish closure records, previous efforts at pollution control, and existing environmental quality data including data on land use, geology and soils, hydrography, water quality, sediment quality, and biological resources (Chapter 2 ) .
2. Identification and ranking of nonpoint pollution sources within the demonstration area (Chapter 3).
3. Identification, evaluation, and screening of best management practices (BMP-s) for each category or particular source of pollution identified. Screening criteria include technical feasibility, economics, public support, demonstration value and anticipated water quality improvements (Chapter 4).
4. Development of a nonpoint source management plan for the demonstration area including recommended BMPs, cost estimates, funding sources, implementation responsibilities, regulatory requirements, scheduling, a water quality monitoring plan, and a description of anticipated water quality benefits (Chapter 5).
As there is no existing institutional/regulatory framework for nonpoint source
control, much of the effort must come from state and local governments and
civic groups. There is a critical need for networking, coalition building,
and sharing of responsibilities among federal, state, regional, municipal and
local groups. Further, enthusiastic individuals from such groups must be
identified, educated and supported by the state's lead nonpoint source agency.
In order to assist state and local municipal officials in developing local
strategies to control nonpoint sources, procedures used in the development of
nonpoint source management plans for the demonstration areas in Westport and
Bourne are outlined in a concurrently prepared report entitled: Nonpoint
Source Control: A Guidance Document for Local Officials, 1989. This
document, available from the Division of Water Pollution Control, guides

users, step-by-step, through a basic approach to nonpoint source control as - outlined in Figure 1-1 and will be disseminated in an educational/technical
assistance format to municipal officials from communities experiencing
persistent water quality problems derived from nonpoint sources.
Project Participants
This technical report has been prepared by Metcalf & Eddy, Inc. under contract
to the Massachusetts Department of Environmental Protection. The conduct of
the study was facilitated by a large number of other participants. Continuous
guidance and technical review was provided by the Massachusetts Division of
Water Pollution Control. In order to obtain input from groups involved in
nonpoint source control, a project advisory group (PAG) was formed. This
group consisted of 27 primary members from federal, state and local
government; local environmental groups; local agricultural and fisheries
groups; and the academic community. The PAG met for two working sessions
during the development of the management plans and guidance document. The
role of the group was to: ,--.
Identify pertinent environmental assessment information and pollution sources
Provide input form various perspectives during project development
Review the draft nonpoint source management plans and guidance document
Provide a communication link to larger groups and auxiliary project advisory group members
Develop consensus and support within the represented organizations.
Each PAG member contributed by providing pertinent data and reports, assisting
with field investigations, and sharing site-specific knowledge and
organizational information. A list of PAG members is provided. in Appendix A.
Numerous individuals from local communities and agencies, as well as state and
federal agencies, provided input and assistance. This assistance is noted in

General Study Areas; Westport and Bourne
Review Existing Pubb and Agency Data lnvolvement I
I Delineate Study Area Boundaries
1 Identify Pollution Sources
Demonstration Areas (to be Selected) I Identify and Screen
BM Ps k---
Develop Nonpoint Source Management
Plan/Demonstration
Massachusetts Communities
Commonwealth of Massachusetts
I Develop Overall Guidance Document
I Massachusetts Nonpoint Source Control Program
FIGURE 1-1. NONPOINT SOURCE DEMONSTRATION PROJECT TECHNICAL APPROACH

the report where applicable. A public participation program consisting of two
public meetings in each demonstration area was also held to obtain further
local input to the project.

CHAPTER 2
STUDY AREA BACKGROUND AND
EXISTING ENVIRONMENT
This chapter provides a discussion of the project study area - Phinneys Harbor and Back River in Bourne, Massachusetts. Initially, the history of nonpoint
source pollution impacts and control efforts is provided and applicable water
quality and shellfishing standards and criteria are outlined. Finally, an
environmental baseline description including land use, geology and soils,
hydrography, water and sediment quality and biological resources is provided.
Phinneys Harbor (Figure 2-1) is a coastal embayment in Bourne, Massachusetts
situated just south of the Cape Cod Canal next to the Monument Beach area.
The harbor is connected to Back River and Eel Pond, an estuarine system with
extensive tidal flats. A total drainage area of 1,788 acres, all in the town
of Bourne, feeds this system.
Nonpoint Source Pollution Impacts
Nonpoint source pollution in Phinneys Harbor and Back River is symptomatic of
widespread pollution problems in the Buzzards Bay system of which it is a
part. According to the Massachusetts Nonpoint Source Assessment Report
(MDEQE, 1988a) nonpoint source pollution is pervasive in Buzzards Bay and
includes pollution from such sources as surface runoff, boat discharges, storm
sewers, septic systems, waterfowl, feedlot runoff and pasture runoff.
Bacteria, nutrients and solids contamination from these sources has resulted
in shellfishing bans, eutrophication and depressed dissolved oxygen levels in
various areas of the bay. In response, organizations ranging from the U.S.
Environmental Protection Agency to local environmental groups are
participating in the EPA-sponsored Buzzards Bay project. This project involves
a comprehensive multidisciplinary study of the bay, its watershed, and
potential solutions to widespread pollution problems caused by both point
sources and nonpoint sources. In turn, the DEP Division of Water Pollution
Control has identified Buzzards Bay as an area that has been significantly
degraded by nonpoint source pollution and has incorporated a management plan -
for Buzzards Bay into its Nonpoint Source Management Plan (MDEQE, 1988b).
2- 1

The impacts of nonpoint sources of bacteria Bay have been
significant. The bay contains approximately of shellfish beds
/, bay scallops, and oysters are where thousands of bushels of hardshell
harvested annually by commerciaJ -grid recreational fishermen, accounting for
more than $10 m i l l i ~ 4 n n u a l commercial landings. Yet, the number of
shellfish bed osed to harvesting as result of coliform contamination has /-='. during the past decade such that as of January of 1989,
beds were closed. According to the
Environmental Protection Agency (EPA, 1989a), the increase in acreage of
closed shellfish beds is closely correlated with the increase in the number of
building permits issued throughout the watershed.
The impact of nonpoint sources on Phinneys Harbor and Back River has resulted
in closures of shellfish beds. According to records obtained from the
Massachusetts Division of Marine Fisheries, closures of 111.5 acres of
shellfish beds in Back River began to occur in 1984. Over four years, the
area was closed intermittently until July 7, 1988, when in a letter to the Bourne Board of Selectmen, the Division of Marine Fisheries ( 1988) determined
P that shellfish growing areas in Eel Pond and Back River north of a line drawn
east from Rocky Point to the foot of Maryland Avenue did not meet the
criterion of an approved harvesting area. The area was thus reclassified as
prohibited to the direct harvest of shellfish for human consumption under the
provisions of MGL, Chapter 130, Section 74A. Figure 2-2 depicts the location
and status of shellfish growing areas in the study area.
Local Pollution Control Measures
In developing a nonpoint source management plan, it is critical to be aware of
past and current local efforts to control nonpoint sources. This section
describes recent nonpoint source control efforts in Bourne conducted by EPA as
part of Buzzards Bay program, as well as by the town and by the U.S.
~ e ~ a r tment of Agriculture .


The Town of Bourne has been aggressive in dealing with nonpoint source /-_ pollution through use of zoning bylaws and regulations related to controlling
septic tank pollution. In addition, the town established a water quality
sampling program. In March 1986, the Water Quality Subcommittee of the Bourne
Selectmen's Task Force on Local Pollution developed a work plan to survey and
, identify sources of contamination to the surface and groundwaters in the Town
of Bourne. The scope of the monitoring program was to 1) verify DEQE
shellfish monitoring program bacteria sampling results, 2) work in cooperation
with the EPA Buzzards Bay project, 3 ) locate sources of fecal coliform contamination, 4 ) map existing stormdrain discharges, 5) establish a water
quality database, and 6) correlate rainfall data and bacteria sampling results. Eighty-one sites were selected as sampling stations based on mapping
of suspected bacteria sources. A database was established for 1985, 1986, and
1987 and plots were generated to illustrate the percentage of samples that violated swimming and shellfishing standards, as well as plots of total and
. fecal coliform counts over time for each station. Several conclusions
formulated by the town included that surface water bodies with low flushing
such as Back River tend to have higher bacteria levels, and that levels of /- contamination are directly correlated to and increase with rainfall.
Recommendations of the Subcommittee included continued sampling, drainage
improvements, and establishment of conditional closures of shellfish beds
based on recent rainfall. Through the Board of Health, extensive sampling of
shellfish resource areas as well as suspected nonpoint sources has been
accomplished. The data from this sampling program are analyzed later in this
chapter.
As part of the Buzzards Bay program, a project to control nonpoint source
bacteria pollution from stormwater runoff was recently constructed at Electric
Avenue Beach in another area of town. This project was funded by the
Environmental Protection Agency, Region I, and the design was performed by
their contractor (Metcalf & Eddy, 1989). The project involved construction of
a system of leaching chambers and leaching galleys, along with revised
stormwater drainage piping, to allow infiltration of stormwater into the
groundwater. This eliminated a major direct discharge of bacteria which had
been identified during the aforementioned town sampling program. .-.

An interesting aspect of the Electric Avenue Beach project is that it was
- constructed by the town itself using Department of Public Works personnel.
This resulted in a substantial savings over use of a private contractor. It
also provided the town with expertise in constructing stormwater control
facilities. This expertise can be utilized in other areas of town, such as
Phinneys Harbor, where stormwater runoff maybe a contamination problem. The
Electric Avenue Beach project is being monitored by the Barnstable County
Health Department to assess its effectiveness. Preliminary unpublished
results have indicated that the facilities are effective in removing bacteria
( Heufelder , 1989 .
The Town of Bourne has been addressing implementation of stormwater controls
in other areas of town. A recent project funded by the town (Gale Associates,
Inc., 1989) developed recommended stormwater control BMPs for the Hen Cove,
Barlow's Landing and Pocasset River watersheds. Recommendations made
consisted mainly of replacing existing catch basins with leaching type catch
basins, and replacing concrete-lined drainage ditches with grassed swale
The town has applied for grant assistance through the EPA Buzzard's Bay
,--- Project Minigrants program to fund stormwater rehabilitation projects.
application was accepted and the minigrant will be used to assist in
7 The#
constructing the stormwater facilities recommended for the Hen's Cove, ( Barlow's Landing and Pocasset River watersheds.
1 /----A 1
\
Additional methods of nonpoint source pollution control which have been
implemented by the town include enactment of bylaws and performance of
maintenance activities. For example, the town enacted regulations aimed at
septic tank control and dog waste reduction. The town also has a program of
regular street sweeping, catch basin cleaning and beach wrack line removal.
These programs have not eliminated bacterial contamination of shellfishing
areas, but in combination with control of direct stormwater discharges, they
are expected to reduce the problem substantially.
The USDA Soil Conservation Service has also played a role in controlling
nonpoint source pollution in Bourne and in the watershed of Phinneys Harbor.
As a result of various educational efforts by the Soil Conservation Service, a
2-6

number of cranberry bog owners, including Mr. John Alden who operates a bog
- adjacent to Back River, have requested assistance from the Soil Conservation
Service to develop and implement conservation measures. The Soil Conservation
Service provides technical assistance including design of detention ponds,
dikes and other conservation measures, as well as cost sharing. More details
of the plan being developed for the Alden cranberry bog are provided later in
this report.
Applicable Standards and Criteria
Objectives of this demonstration project include improvement of water quality
in the study area through the control of nonpoint sources, and achieving an
improvement in water quality in shellfish beds which are permanently or
intermittently closed due to bacteria violations. This section outlines the
water quality standards, criteria and regulations that apply to the Back River
and Phinneys Harbor area. These standards and criteria are used later in the
report in an assessment of existing water quality and to define water quality
objectives for this project. r .
As required by the Federal Clean Water Act, the Commonwealth of Massachusetts
has set water quality standards for Phinneys Harbor and its tributaries.
Table 2-1 lists the minimum water quality criteria that must be met by all
waters of the Commonwealth, except when the criteria specified for individual
classes are more stringent. According to the Massachusetts Surface Water
Quality Standards (314 CMR 4.03), Phinneys Harbor, Back River and Eel Pond are
classified SA. The water quality criteria for class A waters are presented in
Table 2-2. Waters assigned to this class are designated for the uses of
protection and propagation of fish, other aquatic life and wildlife; for
primary and secondary contact recreation; and for shellfish harvesting without
depuration in approved areas. According to the Massachusetts Water Quality
Standards, any fresh water tributaries would be classified B. The water
quality criteria for Class B waters are presented in Table 2-3. Waters
assigned to this class are designated for the uses of protection and
propagation of fish, other aquatic life and wildlife; and for primary and
secondary contact recreation. In addition, in order to further protect the

TABLE 2-1. HASSACHUSETTS HINIXUH WATER QUALITY CRITERIA FOR ALL WATERS OF THE COMONUEALTH
Parameter Criteria
1. Aesthetics All waters shall be free from pollutants in concentrations or combinations that:
Settle to form objectionable deposits; Float as debris, scum or other matter to form nuisances; Produce objectionable odor, color, taste or turbidity; or Result in the dominance of nuisance species.
2. Radioactive Substances Shall not exceed the recommended limits of the United States Environmental Protection Agency's National Drinking Water Regulations. .
3. Tainting Substances Shall not be in concentrations or combinations that produce undesirable flavors in the edible portions of aquatic organisms.
4. Color, Turbidity, Total Shall not be in concentrations or combinations Suspended Solids that would exceed the recommended limits on the
most sensitive receiving water use.
5. Oil and Grease The water surface shall be free from floating oils, grease and petrochemicals and any concentrations or combinations in the water column or sediments that are aesthetically objectionable or deleterious to the biota are prohibited. For oil and grease of petroleum origin the maximum allowable discharge concentration is 15 mg/l.
6. Nutrients Shall not exceed the site-specific limits necessary to control accelerated or cultural eutrophication.
7. Other Constituents Waters shall be free from pollutants in concentrations or combinations that:
a) Exceed the recommended limits on the most sensitive receiving water use;
b) Injure, are toxic to, or produce adverse physiological or behavioral responses in humans or aquatic life; or
c) Exceed site-specific safe exposure levels determined by bioassay using sensitive
,- resident species

TABLE 2-2. WATER QUALITY CRITERIA FOR CLASS S A WATERS
Parameter Criteria
1. Dissolved Oxygen Shall be a minimum of 85 percent of SATURATION.
2. Temperature None except where the increase will not exceed the recommended limits on the most sensitive water use.
Shall be in the range of 6.5-8.5 standard units and not more than 0.2 units outside of the naturally occurring range.
4. Total Coliform Bacteria Shall not exceed a median value of 70 MPN per 100 ml and not more than 10 percent of the samples shall exceed 230 MPN per 100 ml in any monthly sampling period.
TABLE 2-3. WATER QUALITY CRITERIA FOR CLASS B WATERS
- Parameter Criteria
1. Dissolved Oxygen
2. Temperature
Shall be a minimum of 5.0 mg/l in warm water fisheries and a minirmun of 6.0 mg/l in cold water fisheries.
Shall not exceed 83OF (28.3OC) in warm water fisheries or 68OF (20°C) in cold water fisheries, nor shall the rise resulting from artificial origin exceed 4.0°F (2.2OC).
Shall be in the range of 6.5-8.0 standard units and not more than 0.2 units outside of the naturally occurring range.
4. Fecal Coliform Bacteria Shall not exceed a log mean for a set of samples of 200 per 100 ml, nor shall more than 10 percent of the total samples exceed 400 per 100 ml during any monthly sampling period, except as provided in 310 CMR 4.02(1).

public from health risks related to the. ingestion of contaminated seafood,
,- Massachusetts has adopted the guidelines established by the U.S. Department of
Public Health, Shellfish Sanitation Branch, as set forth in the National
Shellfish Sanitation Program Manual (U.S. Department of Health and Human
Services, I986 ) . Compliance requirements from the National Shellfish
Sanitation Program Manual are listed in Table 2-4, and Table 2-5 describes the
state-mandated criteria on which shellfish beds are classified.
Environmental Description
In order to understand the extent and nature of water quality violations in
Phinneys Harbor, it is important to understand the characteristics of the
contributing watershed. Accordingly, this section contains an environmental
description of the Phinneys Harbor area. This description includes a review
of existing environmental assessment information on land use, geology and
soils, hydrography, water and sediment quality, and biological resources.
This baseline is used in this report to identify water quality problems and
pollution sources and to evaluate potential best management practices.
,--
Land Use
The watershed of the Back River estuary covers an area of 1,788 acres and is
predominantly residential, with some commercial and agricultural
development. Recent land use data for the watershed of Phinneys Harbor were
developed by EPA ( 1989b) and are shown in Figure 2-3. There is dense
residential development in the Monument Beach area and north and west of Back
River. There are approximately 60 acres of inland wetlands consisting of
cranberry bogs, wooded swamp, Mill Pond and Mill Brook which discharge into
the Back River estuary. Back River is characterized by 73 acres of saltmarsh. Approximately 1,020 acres of the watershed east of Back River is
forested.

TABLE 2-4. SATISFACTORY COMPLIANCE CRITERIA FOR GROWING AREAS APPROVED FOR SHEUFISHING WITHOUT DEPURATION
(U.S. DEPARTMENT OF HEALTH ANJI HUHAN SERVICES, 1986)
A. The area is not contaminated with fecal material, pathogenic organisms, poisonous or deleterious substances, or marine biotoxins.
B. The bacteriological quality of every sampling station in those portions of the area exposed to fecal contamination shall met one of the following standards:
i. The total coliform median or geometric mean MPN of the water does not exceed 70 per 100 ml and not more than 10 percent of the samples exceed an MPN of 230 per 100 ml for a 5-tube decimal dilution test (or an MPN of 330 per 100 ml for a 3-tube decimal dilution test).
The total coliform standard need not be applied if it can be shown by detailed study verified by laboratory findings that the coliforms are not of direct fecal origin and do not indicate a public health hazard. In addition, the standard may not be applicable in a situation where an abnormally large number of pathogens might be present. Consideration must be given to the possible presence of industrial or agricultural wastes containing a typical coliform to pathogen ratio. The standard in (b)(i) is based upon typical coliform to pathogen ratios associated with discharge of domestic sewage after some dilution and die-off in coastal waters.
ii. The fecal coliform median or geometric mean MPN of the water does not exceed 14 per 100 ml and not more than 10 percent of the samples exceed an MPN of 43 for a 5-tube dilution test (or an MPN of 49 per 100 ml for a 3-tube decimal dilution test).
C. The determination that the approved area classification standards are met shall be based upon a minimum of fifteen (15) samples collected from each station in the approved area. These stations shall be located adjacent to actual or potential sources of pollution. Sample collection shall be timed to represent the worst pollution conditions.

TABLE 2-5. SHELLFISH BED CLASSIFICATIONS
APPROVED AREA: any shellfish growing area that does not contain pathogenic bacteria, fecal material or poisonous substances in dangerous concentrations and was approved by state authorities for growing or harvesting shellfish for direct marketing.
CONDITIONALLY APPROVED AREA: any shellfish growing area that is subject to intermittent microbiological pollution and was determined by state authorities to meet approved area criteria for a predictable period. The period is conditional upon established performance standards specified in a management plan.
RESTRICTED AREA: any shellfish growing area that is subject to a limited degree of pollution and was classified by state authorities as an area from which shellfish may be harvested only by licensed diggers and subjected to a suitable and effective purification process.
CLOSED AREA: any shellfish growing area where the harvesting of shellfish is temporarily or permanently not permitted.
PROHIBITED AREA: any shellfish growing area that is closed to the harvesting of shellfish at all times.
Geology and Soils
The watershed is composed mostly of outwash plain deposits which are primarily
sandy and gravelly deposits on the order of 80 feet thickness. The location
of soil types within the watershed are illustrated in Figure 2-4 and are
listed in Table 2-6. Major soils in the area include the Barnstable-Plymouth
soil complex. These soils can be stony or bouldery in a matrix of sand. They
are well to excessively drained and the water table in these areas is
typically greater than 6 feet from the surface. Permeability in both the
soils and substrata is rapid to very rapid. Carver and Merrimac soils, also
found in the area, have similar characteristics, but tend to be less stony.
These highly permeable soils and abundant vegetation insure that most of the
precipitation that falls will recharge to the groundwater rather than form
surface runoff. There is generally a low flood frequency associated with

TABLE 2-6. PHINNEYS HARBOR WATERSHED SOIL TYPES
Symbol Description Slope Septic Tank Suitabi l i ty
BbB BbC BbD BmA CcB ccc CcD De A Ea A EaB EnB Fm Fs F t HeB ImA Me A MeB MeC Pe A pg PmA PmB PmC PmD P s P s B PsC PsD Ud W
Barnstable Sandy loam, very stony Barnstable Sandy loam, very stony Barnstable Sandy loam, very stony Berryland Mucky loamy coarse sand Carver loamy coarse sand Carver loamy coarse sand Carver loamy coarse sand Deerfield loamy f ine sand Eastchop loamy fine sand Eastchop loamy fine sand Enfield s i l t loam Freetown mucky peat, ponded Freetown and Swansea Freetown coarse sand Hinkley sand loam Ipswich, Pawtucket and Matunuck peats Merrimac sand loam Merrimac sand loam Merrimac sand loam Pipes tone loamy coarse sane P i t s , sand and gravel Plymouth loamy coarse sand Plymouth loamy coarse sand Plymouth loamy coarse sand Plymouth loamy coarse sand Plymouth loamy coarse sand Plumouth loamy coarse sand Plymouth loamy coarse sand Plymouth loamy coarse sand Udipsamments, smoothed Water
Severe : Severe : Severe : Severe : Severe : Severe : Severe : Severe : Severe : Severe : Severe : Severe : Severe: Severe: Severe : Severe : Severe : Severe: Severe : Severe:
Severe : Severe : Severe: Severe: Severe : Severe: Severe: Severe :
poor f i l t e r poor f i l t e r poor f i l t e r , slope wetness, flooding poor f i l t e r poor f i l t e r poor f i l t e r , slope wetness, poor f i l t e r poor f i l t e r poor f i l t e r poor f i l t e r pond ing wetness wetness, poor f i l t e r poor f i l t e r flooding, ponding poor f i l t e r poor f i l t e r poor f i l t e r wetness, poor f i l t e r
poor f i l t e r poor f i l t e r poor f i l t e r poor f i l t e r , slope poor f i l t e r poor f i l t e r poor f i l t e r poor f i l t e r , slope

FIGURE 2-3. LAND USE IN THE PiIINNEYS HARBOR WATEHSllED
[Pas pasturc L------l PI] Forcsl
Wolland
wrung
Cpen Land

FIGURE 2-4. SOILS MAP OF PtlINNEYS tIARIIOR WATERSllED

these soils. In some areas, they may provide severe conditions for septic
tanks in that they are a poor filter.
Soils in low-lying, nearly level areas frequently consist of Freetown and
Swansea mucks. These areas form wetlands with water tables near the
surface. They are composed of organic material, and are poorly drained.
Permeability is moderate, and severe conditions may exist for septic systems
due to ponding and wetness. Saltmarsh areas are classified as Ipswich peats,
which are poorly drained and frequently flooded (SCS, 1987).
Phinneyls Harbor is a 300 acre coastal embayment in northeast Buzzards Bay
bordered by Mashnee Island, the Gray Gables and Monument Beach sections of
Bourne, and Tobys Island. Water depths range from six to twelve feet over
most of the harbor to twenty-four feet in the outer harbor. Water quality may
be enhanced in this area by a rapid flushing rate caused by flow around the
Tobys Island causeway.
The Back River estuary is a 95-acre, shallow waterbody that is the primary
tidal channel flowing into Phinneys Harbor. Two bridges located at Shore Road
divide the system into an inner and outer portion. The inner portion branches
into several different arms, including Eel Pond. Extensive tidal flats, salt
marshes, and bordering vegetated wetlands characterize this area with water
depths generally less than five feet. The outer portion of the estuary
consists of a narrow channel which widens as it approaches Phinneys Harbor.
The bordering tidal flats and salt marshes in the outer portion are less
extensive, and the channel is deeper (4 to 12 ft). The mean tidal range is
four feet, and flushing is estimated at two to six days (Brookside, 1989).
Surface water enters the Back River/Phinneys Harbor system through two
tributaries. 'The northern tributary passes through a number of swamps,
marshes, cranberry bogs, and salt marshes. The eastern tributary passes
through several cranberry bogs, a small pond (Mill Pond), and a salt marsh.
Several intermittent streams also discharge freshwater from two wooded swamps
located to the southeast of the estuary.

Water Quality
A number of organizations have collected water quality and other environmental
quality data in Phinneys Harbor including the Massachusetts Division of Water
Pollution Control, the Massachusetts Division of Marine Fisheries and the
Bourne Board of Health. A summary of these sampling programs is presented in
this section and in Table 2-7. The locations of sampling stations from these
programs are shown in Figure 2-5. The discussion includes both the waters of
Phinneys Harbor, and sources of flow to Phinneys Harbor which include Back
River and a number of storm drains. This evaluation is further segregated
into discussions of dry weather or routinely collected data and wet weather
data.
In order to assist in assessing water quality, a database was established by
extracting, from existing studies, data collected at several stations in
Phinneys Harbor and Back River. Selected stations included: the Railroad
Bridge at the mouth of Back River, a storm drain at Monument Beach, St. John
Chester Park, and Chester Park, Worcester Avenue. The data were coded and
p entered in a Lotus spreadsheet, thus allowing sorting and plotting of the data
from individual data collection programs or of aggregate data. The database
established is included in Appendix B. The data were sorted by station and
parameter and were then sorted chronologically to enable preparation of plots
of concentration over time.
In the database, the sample number and station number assigned by the
collector was recorded. In order to provide a chronological reference and
evaluate the time elapsed between rainfall events and sample collection, the
sampling date was recorded with the time (if available) as well as rainfall
amounts on the day of sampling and the previous day. Parameter analyzed,
measured concentration, measured flow, sponsoring agency, year published, and
reference number were assigned individual fields in the data file. Units of
concentration are colonies (millipore filter) per 100 milliliters.
Definitions of the file contents and associated codes and abbreviations are
presented in Appendix B. The data file assembled contains over 100 fecal
coliform data points from the selected stations.

TABLE 2-7. EXISTING HATER QUALITY DATA SOURCES BACK RIVER AND PHINNEYS HARBOR
No. of Dates and Report Stat ions i n Frequency
Agency Tit le Study Area of Sampling Parameters Scope
Mass. DEQE Division of Water Pollution Control (DWPC, 1987)
Mass. Division of Marine Fisheries
Town of Bourne
Brooks ide Development
Buzzards Bay 1986 Water Quality Survey Data
Shellfish compliance monitoring, ongoing
Town of Bourne Water Quality Monitoring Program (1988)
'/-Back River and Phinneys Harbor
11 -Back River and Phinneys Harbor
12-Back River and Phinneys Harbor
8/27-28/85 two per day
several times per year
several times per year 1985- 1987
Nutrients, solids, General water quality bacteria, metals survey of Buzzards Bay
Bacteria
Bacteria
Shellfish compl lance monitoring
Shellfish compliance and nonpoint source impact data
~acker ia , Environmental impact nutrients study of development

FIGURE 2-5.FIELD SAMPLING STATIONS, PlIINNEYS HARBOR WATERSHED
Bacteria. Using the database, plots of fecal coliform bacteria levels were
- generated covering the period 1983 to 1987 Figure 2-6 shows log fecal --7 coliform values %-weather combined) ,at the railroad bridge in Back
River between 1 1
-provides a good representation of
water quality in shellfish grolaing areas in Back River and northeast portions
#aEh~r. As ---. shodin Figure 2-6, fecal coliform "--------- exceeded class SA standards ( 14/100 ml) 7
/-k' -------
During a water quality survey of the Phinneys Harbor area in 1985, the _/- -
--- 7 Massachusetts Division of Water Pollution Control (DWPC, 1985) w t e d wa-o
quality data under- conditions at stations in Back River and
Phinneys Harbor. These data were collected on August 27-28, 1985 following a
large rainfall of 4.19 inches on August 26, 1985 and during 0.38 inches of
rainfall on August 27, 1985. This rainfall was preceded by an extended dry
period of 18 days in which only 0.37 inches of rain fell. Total and fecal
coliform data were collected at Mill Pond (Station 2), Back River (station 3), and from four stations in the open waters of Phinneys Harbor. These data
clearly show the impact of wet weather surface runoff on the bacteriological
water quality in the river and the inner harbor. Figure 2-7 shows the
concentrations of total and fecal coliform at Stations 2, 3, and 7. Although
most of the precipitation associated with this storm occurred on August 26,
and these data do not show the effect of the first flush of this storm, the
data show elevated fecal coliform bacteria levels (900-2600 colonies/100 ml)
following the storm, with levels declining to near baseline conditions
approximately two days after the rainfall. Fecal coliform concentrations in
the inner harbor at Stations 4, 5 and 6 ranged from 300 to 350 colonies/100 within 24 hours of the heavy precipitation on August 26. Fecal coliforms at
Station 7 averaged 3 colonies/100 ml, showing that even large inputs of bacteria do not influence the outer areas of Phinneys Harbor. Although this
data collection program was not oriented about this precipitation event, the
sampling results clearly show an increase in coliform bacteria in response to
surface runoff and a subsequent decrease following flushing by tidal action
and bacterial die-off.

Bourne-Back River Railroad Bridge Log Values 1985-1 987
m m m
FIGURE 2-6. FECAL COLIFORM VALUES, RACK RIVER RAILROAD BRIDGE 1985-1987
0.2 m 1983 I 1984 I 1985 I 1986 I 1987
Year

DWPC SAMPLING DATA - 8127-28185 RAINFALL OCCURED -8126-4.19 INCHES
8127-0.38 INCHES
- - STA. 7TI < < <
FIGURE 2-7. PHINNEYS HARBOR, WET WEATHER FECAL COLIFORM CONCENTRATIONS

Water samples from the Back River and Phinneys Harbor have been collected and
analyzed on a regular basis by both the DWPC and the Bourne Board of Health
for the years 1985, 1986 and 1987. The Water Quality Subcommittee of the
Bourne Selectmen's Task Force on Local Pollution established a monitoring
program to address the "alarming rate of shellfish closures within the town,"
to verify DEQE test results of surface waters, and to correlate rain data and
specific weather conditions with water sample results. The Subcommittee also
identified potential pollution sources and made specific recommendations for
their abatement. These efforts were described earlier in this chapter. The
stations sampled were shown in Figure 2-5 and include stations in Phinneys
Harbor, Back River, Eel Pond and Mill Pond including stations in tidal flats
where shellfish are abundant. The results of these analyses have been
tabulated by the Bourne Board of Health and indicate that bacterial standards
e rarely exceeded the outer part of Phinneys for shellfishing (14/100 ml) p--2 Harbor but are more frequently exceeded in the remainder of the harbor and the
estuary. Statistical analyses were performed in order to determine the
frequency of exceedance of the water guality standards for shellfishing. This #.-iaiarps!-- --"-- --- * I I
analysis showed t 50 percent of the s a m n r o m Phinneys Harbor and - " " -___ -__-_. .-"- - - greater than 50 the samples from Back River exceeded the standard.
The data collected by both DWPC and the Bourne Board of Health show that fecal
coliform counts are directly affected by surface runoff and that the effect of
runoff is amplified in Back River as compared to Phinneys Harbor. In
addition, the data show that fecal coliform levels decline rapidly following
rainfall. These phenomena are exemplified by comparing fecal coliform data
collected several days after precipitation with data collected during rainfall
at various stations in Back River and Phinneys Harbor. DWPC collected fecal
coliform data at 12 stations on May 15, 1985 following rainfall events of 0.33 and 0.45 inches on May 12 and May 13, respectively. As shown in Table 2-8,
despite the rainfall just two days prior, fecal coliform levels at most
stations had declined to less than 14/100 ml. In comparison, the same
stations were sampled on June 25, 1985, a day on which it rained
0.53 inches. The effects of this event can be observed in the elevated fecal
coliform counts at stations in the inner harbor, Back River, and at drain
pipes in Phinneys Harbor. These data show that while the immediate effects of
2-23

TABLE 2-8. FECAL COLIFORH ANALYSES AT STATIONS IN PHINNEYS HARBOR AWD BACK RIVER FOLLOWING TWO 1985 STORMS
- Station May 15, 1985 June 25, 1985
Conservation Land off County Road
Railroad Bridge at Back River
N. Beach (Stanley Bolles Park 1
119 Old Dam Road
Plow Penny Road
28 Old Dam Road
East End of Dike Road
Maryland Ave.
Drain at Monument Beach
S.W. End of Mashnee P
N.W. End at Mashnee
Pipe at St. Johns
rainfall are pronounced, the flushing rate of Back River and tidal action
throughout the area, as well as the rapid die-off of bacteria in saline water,
results in rapid declines in fecal coliform bacteria levels.
Based on analysis of the data obtained by the DWPC and the Bourne Board of
Health, the Water Quality Subcommittee concluded that areas with large volumes '
of fresh water input, such as Back River, tended to have higher fecal coliform
levels, and that fecal coliform levels increase in direct response to rain
events, particularly of 0.5 inches or more.
Nutrients. As was shown in Table 2-7, two sampling studies provided nutrient
data in the Phinneys Harbor system. Nutrient and other water quality data
collected in Back River and Phinneys Harbor by the DWPC are listed in
. Table 2-9. The only numerical nutrient criterion involves ammonia, and is

TABLE 2-9. DUPC SAMPLING PROGRAM DATA 8/27-28/85
Saline Stations (3 BR, 4 BR Fresh Station
Parameter Unit 5 PH. 6 PH. TTI) (2 BR)
BOD5 TKN
z; TP OP pH Alk. Cond . TS SS Turb Metals
mg /l mg/l mg/l mg /l mg/l mg/l std unit mg/l CaC03 w/l mg/l mg/l NTU PPb
det. limit = 0.02 det. limit = 0.02 det. limit = 0.02 det. limit = 0.06 det. limit = 0.0002 det. limit = 0.03
1.8-3.3 1.1-1.7
0.03-0.11 no data 0.08-0.14 0.02-0.06 7.2-8.0 62-90
24,000-36,000 17,000-30,000
5- 18 1.7-3.1
All values less than detection limits
related to ammonia toxicity. The draft Commonwealth of Massachusetts "toxic
policyN limits ammonia nitrogen in both fresh and marine waters to a maximum
of 0.5 mg/l. The ammonia data available on both Phinneys Harbor and Back
River are typically on the order of less than 0.1 to 0.4 mg/l, thus there
appear to be no ammonia toxicity concerns for these waterways.
Regarding eutrophication, dissolved oxygen data indicate that eutrophication
may be a problem in Phinneys Harbor. The dissolved oxygen data collected by
the DWPC were shown in Figure 2-8. These data indicate a diurnal oxygen swing
of over 4 mg/l, as well as a range in saturation from 75 or 80 percent to over 120 percent. This is evidence of significant photoplankton activity, although
nuisance algal blooms or fish kills are not known to have been reported for
this system. The growth of phytoplankton in marine systems is usually limited
by the availability of the plant nutrient nitrogen. This is in contrast to
freshwater systems, where phosphorus is normally the growth-limiting nutrient. ,- .

FIGURE 2-8. PIIINNEYS HARBOR DISSOLVED OXYGEN CONCENTRATIONS

The dichotomy in nutrient limitation between freshwater and marine systems can
r x be explained based on theoretical considerations of the elemental nitrogen and
phosphorus content, and thus nutritional requirements, of plant cells. The
well known Redfield ratio (Redfield, 1934) states that the ratio by weight of elemental carbon, nitrogen and phosphorus in both marine phytoplankton and
seawater are approximately 53:8:1 (N:P ratio equals 6.6). Other researchers,
such as Cooper (1938) and Fleming (1940) have developed a similar ratio for
marine systems, suggesting that when the nitrogen to phosphorus weight ratio
in seawater is much less than 7, as is usually the case, phytoplankton growth
is primarily nitrogen limited. Similarly, at ratios close to 7, both nitrogen
and phosphorus may limit phytoplankton growth by similar degrees.
Based on the available data, the typical ratio is at least 16, assuming total
N equals 1.6 and total P equals 0.1. This would indicate nitrogen limitation,
although the ratio is low enough that phosphorus may also play some role.
This is supported by the fairly low concentration of ammonia and total
phosphorus which occur in Phinneys Harbor and Back River. The fact that
ammonia levels are low (near the typical value of half-saturation constants r for this parameter), indicates that it is currently likely to be limiting
growth.
Typical nutrient levels in the estuarine portion of Back River and Phinneys
Harbor, as well as at the fresh water station, are shown in Table 2-9.
Typical nutrient levels are higher in the fresh water station, which indicates
that nonpoint sources are contributing nutrients, and some level of control
may thus be desireable. However, since there is no existing use impairment
with respect to eutrophication, nutrient control would not take as high a
priority as bacteria control, which has been shown clearly to be impacting an
existing resource.
Solids. There are no numerical solids criteria in the state or federal water
quality standards. As was shown in Table 2-1, however, there are aesthetic
criteria. Based on the data in Table 2-9, solids do not appear to be a
problem in the harbor. Despite this, it is good practice to eliminate areas
of excessive erosion which can be created by such activities as construction

and agriculture. Other than sensible best management practices to control
, - excessive erosion, there does not seem to be need for solids reduction.
Metals. Data on metals in the water column in Phinneys Harbor and its
tributaries were shown in Table 2-9. Although limited, the data indicate no
violations of any EPA marine criteria for cadmium, copper, chromium, lead,
mercury, and nickel. However, data are insufficient to draw conclusions.
Sediment metals data are discussed later in this chapter.
Sumnary of Existing Water Quality. Waters of Back River, Eel Pond and the
inner portion of Phinneys Harbor are periodically closed to shellfishing. The
data collected clearly show the effect of rainfall increasing bacteria levels
in these waterbodies by an order of magnitude or more. Levels drop after
rainfall events, but some dry weather bacteria contamination exists,
particularly in Back River and Eel Pond. Bacteria contamination results
largely from rainfall-induced nonpoint source runoff from developed areas.
The outer part of Phinneys Harbor does not seem to be influenced by this
nonpoint source bacterial loading. There is also some evidence of nutrient
- induced eutrophication in both the inner and outer portions of the Harbor.
The main goal of the nonpoint source management plan will be to achieve the
Class SA standards in Back River, Eel Pond and Phinneys Harbor receiving
waters as frequently as possible. This will require bacteria reduction during
wet weather of about one order of magnitude. Bacteria reduction during dry
weather will also be sought where possible. Finally, a secondary goal will be
to reduce nutrient input from the drainage basin.
Sediment Quality
Sediment chemistry data are not available for Phinneys Harbor. However, two
samples were collected in Red Brook Harbor by DWPC (1987). In order to assess
the quality of these sediments, heavy metals, PCB, PAH and solids data were
compared with sediment classification criteria from three sources including:

Massachusetts dredge material disposal classification (314 CMR 9.00 1986).
Massachusetts regulations for land application of sludge ( 3 10 CMR 29.00, 1983)
Great Lakes sediment rating criteria (MDEQE, 1982).
Table 2-10 compares sediment data with the cleanest criteria in the
regulations and guidelines outlined above. This comparison shows that
sediments from Red Brook Harbor meet the cleanest criteria. While PAH's were
found, it is not known if these exist within Phinneys Harbor. These data,
combined with the water column metals results discussed earlier, indicate that
there is no apparent need for metals control.
Biological Resources
The Back River estuary, headwater wetlands and part of Phinneys Harbor were
recently designated by the Secretary of Environmental Affairs as an Area of
Critical Environmental Concern. The area was designated as such, in part, due
to its abundant biological resources.
As shown earlier in this chapter, the watershed contains over 73 acres of salt
marsh. In addition, there are about 70 acres of inland wetlands which have
been designated as restricted wetlands under the Massachusetts Wetlands
Restriction Act. These wetlands are valuable habitat resources and provide
food and habitat for marine wildlife as well as birds, reptiles, amphibians
and small animals. Presently, the estuary is the resting site for the osprey
andi ion haliaetus), provides breeding habitat for spotted turtle (clemm~s guttata) and is the probable breeding/feeding site for the diamondback
terrapin (~alaclemys terrapin) (Town of Bourne, 1988). The estuary provides
habitat for shellfish and finfish. Mill Brook and Little Mill Pond function
as a catadromous fish run for the American Eel (~nguilla ro'strata) (Town of
Bourne, 1 988 ) .

TABLE 2-10. SEDIMENT DATA FROM RED BROOK HARBOR
- (DUPC, 1987) (=/KG)
15 RBH 30 Dredge and Sludge Red Brook Harbor Fil t a 1
C l a ~ s i f f ~ ) Parameter Sample A Sample B Class catlon Great Rating Lf :es
PAH (el - % fines 93 7 1 Type B: 60-90
(silt & clay) Type C: 90-100
a. 1 = cleanest b. I = cleanest c. * = nonpolluted d. ND= not detected e. Flouranthane = 0.32 ug/g; Pyrene = 0.21 ug/g/

REFERENCES
Brookside, 1989. Brookside Mixed Use Development. Final Environmental Impact Report EOEA No. 6774.
Cooper, L.H.N. 1938. Redefinition of the anomaly of the nitrate-phosphate ratio. Journal Marine Biol. Assn. U.K., Vol. 23, Plymouth.
Division of Marine Fisheries, 1988. Letter from P. Coates (Division of Marine Fisheries) to Bourne Board of Selectmem.
Division of Water Pollution Control, 1987. Buzzards Bay Research Sediment Data Report: 1985 - 1986.
Division of Water Pollution Control, 1987. Buzzards Bay 1985 Water Quality Survey Data.
Environmental Protection Agency, 1989a. Buzzards Bay Project, Bacterial Contamination of Shellfish, Fact Sheet #l.
Environmental Protection Agency, 1989b. Buzzards Bay Land Use Data. UMass Resource Mapping Group.
Fleming, R.H. 1940. The composition of plankton and units for reporting populations and production. Proc. Sixth Pacific Sci. Congr., Vol. 3.
,- Gale Associates, Inc., 1989. Stormwater Management Plan for the. Hen Cove, Barlow's Landing, and Pocasset River Watersheds in Bourne, Massachusetts.
Heufelder, G. 1989. Barnstable County Department of Health. Personal Communication.
Massachusetts Department of Environmental Quality Engineering , 1988a. Commonwealth of Massachusetts Summary of Water Quality 1988 - Appendix IV - Nonpoint Source Assessment Report.
Massachusetts Department of Environmental Quality Engineering, 1988b. Nonpoint Source Management Plan (Final Draft).
Metcalf & Eddy, Inc. 1989. Buttermilk Bay Stormwater Control Demonstration Project, Electric Avenue Beach, Bourne, Massachusetts. Final Design Drawings and Specifications.
Redfield, A.C. 1934. On the proportions of organic derivations in sea water and their relation to the composition of plankton in James Johnstone Memorial Volume, Liverpool, Univ. Press.
Town of Bourne, 1988. Letter from C.J. Smith and R.M Gray (Bourn Conservation Commission) to J. Hoyte (Executive Office of Environmental Affairs).
U.S. ~e~artment of Health and Human Services, 1986. Manual of Operations Part 1 , Sanitation of Shellfish Growing Areas. .I986 Revision, National Shellfish Sanitation Program.

CHAPTER 3 IDENTIFICATION AND PRIORITIZATION OF POLLUTION SOURCES
This chapter describes the identification of nonpoint sources within the
watershed of Phinneys Harbor, and the process used to prioritize sources
recommended for control.
Source Identification and Description
Morehouse (1988) developed a list of nonpoint sources of pollution commonly found throughout New England. This list was used as the basis for the
development of a list of pollution sources or watershed profile for the
Phinneys Harbor watershed. This Phinneys Harbor watershed profile shown in
Table 3-1 was developed through:
Interviews with local and state officials, members of the project advisory group, local environmental groups, representatives of USDA, and private citizens;
Review of previous studies;
Review of recently developed land use maps and aerial photographs; and
Field visits during February of 1989 with local representatives.
The underlined categories were those thought to be present in the watershed.
In order to identify specific sources, detailed field reconnaissance was
conducted during the summer of 1989. Field activities included visual
observations, drainage system inspections, and photodocumentation. The
specific sources identified through field inspection are listed and described
with respect to location and pollutant type in Table 3-2. The locations of
these sources are shown in Figure 3-1. Detailed descriptions of the sources
are provided below by category.
Agriculture. According to the Association of State and Interstate Water
Pollution Control Administration and EPA (1985), every region of the United States listed.agricultura1 sources of pollution as the most pervasive nonpoint
.-

TABLE 3-1: PHINNEYS HARBOR WATERSHED PROFILE
NPS POLLUTION CATEGORIES AND SUBCATERGORIES SCREENING FOR BOURNE
10 Agriculture 11 : Non-lrrlgated Crop Production 12: lrriaated C r o ~ Production
. 13: Specialty Crop Production 14: Pasture Land 15: Hayland 16: Animal Holding Areas 17: Wash and Process Water 18: Waste Application Areas
20 Silviculture 21 : Harvesting 22: Reforestation 23: Residue Management
30 Construction 31 : HighwaylRoadlBridge 32: Land Development
40 Urban Runoff 41 : Storm Sewers 42: Combined Sewers 43: Surface Runoff 44: Infiltration Wells and Basins
50 Resource ExtractionlExplorationlDevelopment 51 : Surface Extraction Areas 52: Processing Facilities
60 Land Disposal (RunofflLeachate from Permitted Areas) I 61 : SludgelSeptage 62: Landfills 63: On-Site Wastewater Systems 64: Hazardous Waste
70 HydrologiclHabitat Modification 71 : Channelization 72: Dredging 73: Dam Construction 74: Earth Fill
80 Other
82: Waste StoragelStorage Tank Leaks 83: Highway and Bridge Maintenance 84: Spillsllllegal Disposal 85: In-Place Contaminants 86: Natural Vegetation --
87: Auto Salvage Facilities 88: Washina and Processing Areas 89: Snow Dumping Areas 90: Utility Rights-of-way 91 : Domestic and Wild Animals 92: Sewer System Leaks 93: Boats and Marinas


TABLE 3-2. PHINNEYS HARBOR NONPOINT POLLUTION SWRCE DESCRIPTIONS
,--- Conventional Pollution Sources Descriptions Pollutant Types
Alden Cranberry Bog
Baptiste Cranberry Bog
Waterhouse Road Development
County Road Development
Chester Park
16 acre cranberry bog east of County Road
Nutrients
13 acre cranberry bog Nutrients north of Old Dam Road
Proposed development on Nutrients, solids Waterhouse Road draining to wetlands east of Alden bogs
Cleared land on County Rd. Nutrients, solids south of Alden Cranberry Bog for construction of new homes
Piped outlet to Phinneys Bacteria, nutrients, solids Harbor at Chester Park drain- ing 6 acres of residential and commercial land
Beach Boulevard and Piped outlet to Eel Pond at Bacteria, nutrients, solids Burtonwood Avenue Burtonwood Road draining
2,5 acres of residential land
Carlton Road
Shore Road
9. County Road
10. Old Dam Road
11 . Septic Systems
Piped outlet to Eel Pond near Bacteria, nutrients, solids Carlton Road draining 17 acres of residential land
Drainage enters Phinneys Bacteria, nutrients, solids Harbor at one location by overland flow
Drainage enters Back River along most of its length by overland flow
Drainage enters Back River along its length by overland flow
Bacteria, nutrients, solids
Bacteria, nutrients, solids
Watershed-wide and suspected Bacteria, nutrients specific problem areas at Rocky Point, North Beach Road, Plow Penny Road, Monument Beach, and Mashnee Island

TABLE 3-2 (Continued). PHINNEYS HARBOR NONPOINT POLLUTION SOURCE DESCRIPTIONS
- Conventional Pollution Sources Descriptions Pollutant Types
12. Domestic and Wild Watershed-wide domestic Bacteria, nutrients Animals animals and concentrated
waterfowl in Back River and Phinneys Harbor
13. Monument Beach 50-100 boat marina at Monument Bacteria, nutrients, Marina Beach with no pump-out station hydrocarbons
pollution source. Within the watershed of Phinneys Harbor, agricultural
sources include two cranberry bogs at the periphery of Back River. The
Baptiste cranberry bog is located north of Old Dam Road and outlets into Back
River through a 36" culvert under Old Dam Road. This bog is operated using
commercial fertilizers and pesticides. The Alden cranberry bog is located
east of County Road and outlets to Mill Pond which eventually enters Back
River. The owner of this bog once tried operating without fertilizers and
pesticides. The crop was unsuccessful, however, and the program was - dropped. These bogs may contribute nutrients to Back River and Phinneys
Harbor.
The potential for export of nutrients from cranberry bogs is partially a
function of the operation of the particular bog. The cranberry growing season
extends from April to October. Cranberry bogs consist of a layer of peat over
hard pan with a thin layer of sand on top. Optimum growing conditions require
that the bog be kept wet but not flooded. Accordingly, the bogs are sprayed
with about one inch of water per week but never flooded during the growing
season. Fertilizer is applied approximately five times per year at a rate of
150 to 400 pounds per acre depending on soil requirements, but primarily
during the growing season in late June to early August. July and August is a
period of high water need so there is little opportunity for runoff of
fertilizers (Dapsis, 1986). Research by Duebert (1974) indicates that the net
movement of water in the bog during the growing season is into the bog due to
evapotranspiration by the plants, allowing little opportunity for nutrient

export during this period. Most bogs are flooded during harvest in late
- September and October and during winter (mid December to late March) to
protect against freezing. Irrigation systems are used for frost protection
during spring and fall. Thus, the highest potential for export of nutrients
from the bogs is during spring when winter flood water is released. Granular
herbicide is applied in early April and pesticide is applied periodically from
May to early August. The Environmental Protection Agency and the Division of
Water Pollution Control have recently conducted research projects to quantify
nutrient balances in cranberry bogs. Although these data are not yet
published, data collected by the Division of Water Pollution Control indicate
elevated levels of ammonia, nitrates and phosphorus in tailwaters released
from the bogs in the spring. In comparison, fall water samples showed
considerably lower nitrogen levels and continued elevated phosphorus levels.
Overall, nutrient concentrations seem to indicate that cranberry bogs may not
be a major source of nutrients to Buzzards Bay and that nutrient loading is
partially a function of the operational details of the individual bog. It is
generally recommended that operators of cranberry bogs use techniques to F minimize nutrient export including retention of nutrient-rich waters in the
bog, proper application of fertilizer, use of time release fertilizer, and
modification of water retention facilities. Nutrient loading from properly
operated cranberry bogs may be substantially less than other sources such as
septic tanks, street runoff and lawn fertilizers.
Construction. Construction activities result in erosion and deposition of
sediment in nearby waterways. Within the watershed of Phinneys Harbor, there
are areas along County Road and Waterhouse Road where developments are in
various stages of construction. Along the eastern side of County Road south
of the Alden Cranberry Bog, land is being cleared for construction of
approximately 15 to 20 residential homes. Runoff from this area can cross
County Road and enter the upper reaches of Back River. In addition, a few new
homes are being constructed near an existing condominium development, and
construction of a housing development and golf course are proposed along
Waterhouse Road. Runoff from this large development will enter the wetlands
east of the Alden Cranberry Bog. These areas are identified on Figure 3-1. -

Urban Runoff. On a national level, stormwater runoff is seen as the most
pervasive nonpoint pollution problem after agriculture. In highly developed
areas and major roadways, drainage systems cause urban runoff to bypass
natural vegetation which promotes infiltration and filtering of solids.
Therefore, the pollutants which buildup along the road sides during dry
weather are washed off directly into adjacent waterways during wet weather.
These pollutants include bacteria, nutrients, sediments, and heavy metals.
Sources of urban runoff in the watershed of Phinneys Harbor include two piped
drainage systems discharging to Eel Pond and a third piped drainage system
discharging to Phinneys Harbor at Chester Park. Figures 3-2 and 3-3 depict
the two systems at Eel Pond which include two catch basins that discharge
runoff from 2.5 acres west of Eel Pond at Beach Boulevard and Burtonwood
Avenue and a second system at Carlton Road draining 17 acres of recently developed residential land. The third piped drainage system discharges
directly to Phinneys Harbor at Chester Park from six acres of residential and
commercial development as depicted in Figure 3-4.
- Other sources of urban runoff near Back River and Phinneys Harbor are
identified on Figure 3-1 and include surface runoff from Shore Road, County Road and Old Dam Road which all cross Back River at various locations. These
areas, however, are not drained by piped drainage systems, and pollutant
runoff from these areas may be attenuated through infiltration and by
filtration by roadside vegetation. Shore Road crosses near the mouth of Back
River in a well developed residential and commercial area consisting of a
restaurant and boat repair shop. Runoff from this area directly enters Back
River by overland flow. Old Dam Road is at the northern boundary of Back
River and crosses it at the outlet of the Baptiste Cranberry Bog. County Road
is at the eastern boundary of Back River and crosses it at the outlet of Mill
Pond. Runoff from both of these roadways enters Back River by overland flow
through dense vegetation.

EEL POND
I OUTLET
CATCH BASINS BEACH BOULEVARD
FIGURE 3-2. BEACH DOULEVARDIRURTONWOOD AVENUE DRAINAGE SYSTEM

EEL POND
FIGURE 3-3. CARLTON ROAD DRAINAGE SYSTEM

I I
RAILROAD
MONUMENT AVE
RETAINING WALL \ , \ \
24' RCP DRAIN OUTLET
PHlNNEYS HARBOR
FIGURE 3-4. CHESTER PARK DRAINAGE SYSTEM
M r T C A L r A F O O Y
L -

Land Disposal. Land disposal sources include on-site wastewater disposal
systems. Since the watershed of Phinneys Harbor is not sewered, each home has
a septic tank. Septic tanks may contribute nutrients and bacteria to
groundwater which flows to Phinneys Harbor and Back River. If systems are
properly operated, solids are removed periodically during maintenance.
Bacteria and nutrient loading from septic systems, however, is substantially
reduced by filtration and contact with soils. In recent studies of the impact
of septic tank effluent on groundwater quality at Buttermilk Bay (Weiskel,
et. al, 1989), horizontal transport of fecal coliform with flowing groundwater
was observed to be extremely limited. Previously, DWPC ( 1987), .in a study
conducted in Westport, was not able to isolate sources of fecal contamination
through differentiation of coliform bacteria in samples collected in areas
thought to have widespread Title V violations and areas thought to be in
compliance. Septic tanks are among the most difficult nonpoint sources to
identify due to their location (largely on private property) and their
extremely diffuse nature since septic tanks discharge underground.
During field reconnaissance with members of the Bourne Department of Natural
,-- Resources, a number of areas were pointed out where septic systems are
suspected to be out of compliance with Title V. These include homes at Rocky
Point, on North Beach Road and Plow Penny Road, in Monument Beach and on
Mashnee Island. Many homes in these areas of the Phinneys Harbor watershed
are constructed very close to the surface water and approximately 100 are
within 100 feet of Eel Pond, Back River, and Phinneys Harbor.
Other nonpoint sources identified include domestic animals and areas where
wild animals congregate such as Monument Beach and the wetlands feeding Back
River, and possible illegal boat discharges at the 50-100 boat Monument Beach
marina .
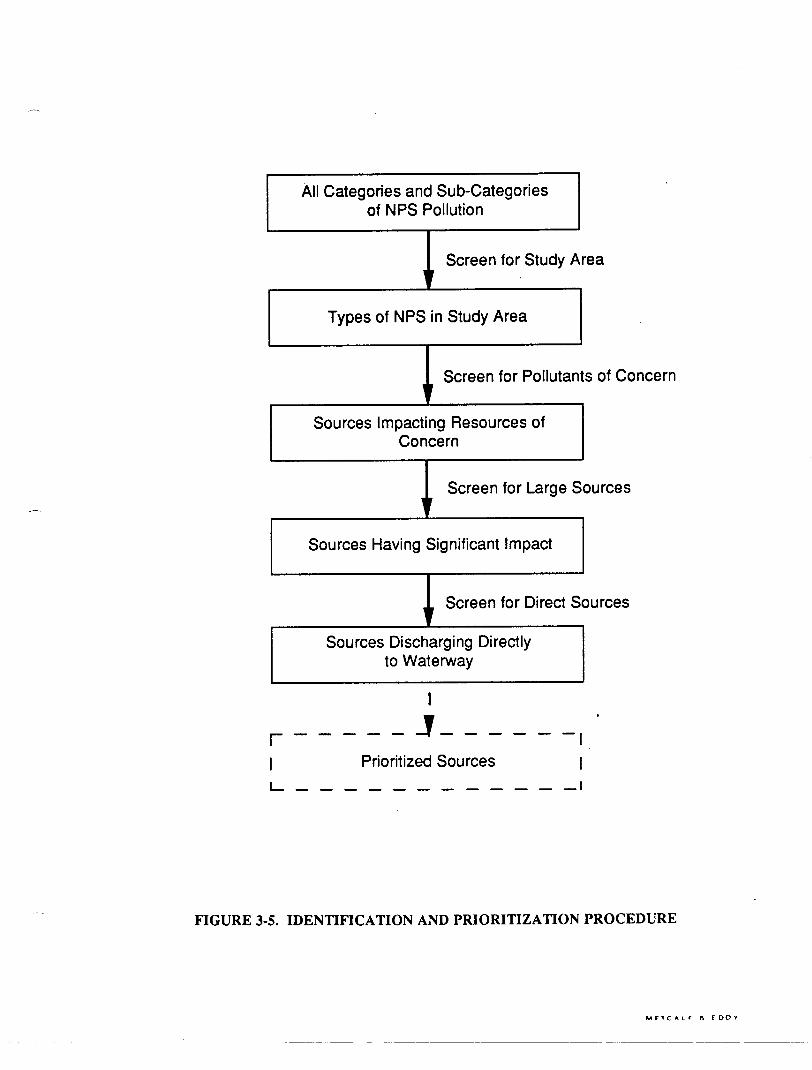
Source Prioritization
The U.S. Environmental Protection Agency has published several nonpoint source
guidance documents setting forth a pollution source identification and
prioritization process. This process is outlined in Figure 3-5 and is --
3-1 1
All Categories and Sub-categories of NPS Pollution
A Screen for Study Area
Types of NPS in Study Area
Screen for Pollutants of Concern
Sources Impacting Resources of Concern
Screen for Large Sources
--
Sources Having Significant Impact
Screen for Direct Sources I
-
Sources Discharging Directly to Waterway
I Prioritized Sources I L - - - - - - - - - - - - 1
FIGURE 3-5. IDENTIFICATION AND PRIORITIZATION PROCEDURE
M F T C A L F 6 F D O V
--

designed to isolate the sources of pollution in a target area and determine
which of these sources should be prioritized for control. EPA ( 1987)
recommends, in the nonpoint source guidance document Setting Priorities, that
pollution control efforts be concentrated on limited areas causing substantial
degradation or loss of resources. Through this targeting approach, water
quality improvements can be optimized given limited financial resources.
The process begins with review of a list of all possible categories and
subcategories of nonpoint pollution sources. The list is then screened to
establish a watershed profile or a list of all the sources occurring in the
study area. This list is then ranked to develop a priority list of those
sources which should be addressed to optimize water quality improvements. The
ranking process separates significant sources from those that do not
contribute pollutants of concern, sources df relatively small magnitude and
sources that do not discharge directly and whose pollutant load may be
attenuated by vegetation or infiltration. In order to optimize water quality
improvements in Phinneys Harbor, a priority list of pollution sources was
developed, starting with the complete list in Table 3-2. Ranking criteria ,-- included pollutant type, source magnitude, and transport considerations. The
paragraphs below describe the application of this process to the watershed of
Phinneys Harbor.
Pollutant Type. As discussed in Chapter 2, historical water quality data
indicate that violation of the fecal coliform bacteria standard for
shellfishing and possible eutrophication due to excess nutrient loads are
significant water quality problems in Phinneys Harbor and Back River.
Frequent violations of the Class SA fecal coliform standard occur in Back
River and Eel River during both wet and dry weather. Violations also occur in
the near shore areas of Phinneys Harbor. In addition, nutrient loading to
Back River results in excess phytoplankton activity as evidenced by the
observed dissolved oxygen variations. Therefore, the sources presented in
Table 3-2 which would not contribute to current fecal coliform shellfishing
standard violations or excess nutrient loading, are of lowest priority. These
sources include the developments on Waterhouse Road and County Road which do
not contribute to current bacteria standard violations. However, these -

development could contribute to future bacteria violations and nutrient
- loading but are considered small compared to other existing and potential
sources.
Source Magnitude. In the second ranking phase, pollution sources were
prioritized based on their relative magnitude. The ranking is based on field
observations, existing water quality data, and estimates. As discussed in
Chapter 2, water samples from the Back River and Phinneys Harbor have been
collected and analyzed on a regular basis by both the DWPC and the Bourne
Board of Health for the years 1985, 1986, and 1987. Some of these samples
were collected at suspected sources of coliform bacteria throughout the
watershed during both dry and wet weather. Using these data and literature
values, an effort was made to estimate the fecal coliform bacteria and
nutrient loadings from the identified sources. A summary of these loadings
are given in Tables 3-3 and 3-4.
There are many inherent problems with attempting to estimate accurately, loads
from these sources. Some of these problems include the lack of site specific
,- data on each source, the extremely high variability of bacteria
concentrations, and the extensive data required to derive a statistically
valid estimate. The source loadings for Phinneys Harbor can be checked to
some extent using the water quality database established. Where a large
number of samples exist for a station, the log mean bacteria counts upstream
and downstream of a source provides some indication of the long-term average
strength of that source. Such checking could be accomplished using available
data for certain sources including the storm drains sampled by the Town of
Bourne. In general, however, the estimates are order of magnitude at best.
They are more suited as relative comparisons between source loading, and as a
rough check on the ranking system.
The loads in Table 3-3 indicate the dominance of directly discharged
stormwater runoff as bacteria sources. These sources must be given the
highest clean-up priority for the Phinneys Harbor demonstration project. The
loads calculated in Table 3-4 indicate the dominance of the cranberry bogs, the Carlton Road drain, and septic tanks.

TABLE 3-3. PHINNEYS HARBOR WATERSHED FECAL COLIFORH BACTERIA SOURCE LOADING ESTIMATES
Estimated Source Estimated
Source Concentration Loading J Total Pollution Sources Area (MPN/ 100 ml ) (MPN/day ) Loading
1. Alden Boga 13 Ac. 1 00 2.5~10 8 5
2. Baptiste Boga 16 Ac. 100 3.2~10~ 6
5. Chester Park rain^ 7 Ac. 2,500 1.5~109 2 7
6. Beach Boulevard/ 2.5 Ac. 1 ,000 1 .8x108 3 Burtonwood Avenue b rain^
7. Carlton Road rain^ 17 Ac. 1 ,000 1.2~10~ 22
8. Shore Roadb 3700 LF 100 2.8x10⁷ < 1
9. County Roadb 3300 LF 100 2.4~10~ < 1
10. Old Dam Roadb 3300 LF 100 2.4x10⁷ < 1
1 1 . Septic systemsC 100 homes 100 7.3x10⁷ 1 - 12. Wetlands 10 Ac. 50 9.6~10~ 2
13. Monument Beachd 1 discharge - 1.3x10⁹ 24 Marina
Direct Drainage 141 Ac.
a. Estimated from available in-water data.
b. Estimated from EPA (1983) with refinements for overland flow.
c. Assumed conservative concentration at point where plume enters river.
d. Based on one illegal discharge per day during peak season from a boat cont inhg one day of waste from two people. One person contributes t 2x10 f cal coliform per day (Metcalf & Eddy, 1979). Estimated loading 8 of 4x10 is divided by 3 for annual average conditions. 12 months/ peak season ( 4 months) = 3

TABLE 3-4. PHINNEYS HARBOR WATERSHED NUTRIENT SOURCE U)ADING ESTIUATES
Phosphorus Nitrogen Estimated Source Estimated Estimated Source Estimated
Source Concentration Loading % Total Concentration Loading % Total Pollution Sources Area (mg/l) (mg/day ) Loading (mg/l) (mg/day Loading
1. Alden Boga 13 acres 0.3 7.4~10~ 15 1 .O 2.5x10⁵ 10
2. Baptiste Boga 16 acres 0.3 9.7~10~ 20 1 .O 3.2x10⁵ 13
5. Chester Park b
7 acres 0.3 1 .9x104 4 Drain
6. Beach Boulevard/ 2.5 acres 0.3 5.7~10~ 1 Burto wood Avenue Drain 6
7. Carlton Road b
17 acres 0.3 3.9~10~ 8 Drain
8. Shore RoadC 3700 LF 0.2 5 .4x103 1 1 .O 2.7~10~ 1
9. County Roadc 3300 LF 0.2 5.0x10³ 1 1 .O 2.5~10~ 1
10. Old Dam ~oad' 3300 LF 0.2 5.0x10³ 1 1 .O 2.5~10~ 1
11 . Septic 100 homes 0.1 7 . 3 ~ 1 0 ~ 15 sys t emsd
13. Monument Beachf 4 boat 10 0.6~10~ < 1 Marina washes .
Direct ~ a i n f a l l g 224 acres
a . Estimated from G i l (1988) b. Estimated from EPA (1983) c. Estimated from EPA (1983) w i t h refinements for overland flow d. Assumed concentration a t point where plume enters river e. Estimated from Krenkel & Novotny (1980) f. Based on 2 boat washes per day, and 5 gallons of concentrated washwater per wash. Concentrations
based on Metcalf & Eddy (1979) g. Estimated from Brezenik (1972)
Transport Considerations. The priority of the remaining sources was based
upon transport considerations, such as whether the pollution load is
attenuated by vegetation or infiltration. In this comparison, sources in
close proximity to Back River, Eel Pond, or Phinneys Harbor were ranked above
those which discharge distally. Sources with clear paths to the waterway,
such as ditches or gulleys, were given higher priority than those which must
travel through natural filters such as forested or grassy areas. Applying
this criterion, the Baptiste and Alden Cranberry Bogs, discharging directly to
Back River, and the three piped drainage system discharging into Eel Pond and
Phinneys Harbor are of highest priority. Runoff from Shore Road, County
Road, and Old Dam Road is screened since this runoff is not discharged through
a piped drainage system but passes overland and vegetation before reaching
Back River. Septic systems and sheet surface runoff, which both pass through
natural filters before reaching the water, have a lower priority for bacteria
control based on transport considerations.
Figures 3-6 and 3-7 illustrate the ranking of sources within the Phinneys
Harbor watershed. The process proceeded from a watershed profile to a - detailed list of the sources within the watershed. Criteria were then applied
to rank those sources which can be most effectively controlled to optimize
water quality improvements. Highest on the priority list are the two
cranberry bogs and the three piped drainage system discharges. By focusing
implementation efforts, tangible water quality improvements can be realized
more quickly and cost-effectively.

Phinneys Harbor Pollution Pollutant Source Transport Priority Source Profile TY ~e Magnitude Considerations Sources
Alden Cranberry Bog X Baptiste Cranberry Bog X Waterhouse Rd. Development County Rd. Development -X Chester Park Drain 0 Drain at Beach & Burtonwood Drain at Carlton Road Shore Rd. Runoff X County Rd. Runoff X Old Dam Rd. Runoff X Septic Systems X Wetlands East of County Rd. X Monument Beach Marina
FIGURE 3-6. PRIORITIZATION OF NONPOINT SOURCES OF BACTERIA IN PHINNEYS HARBOR WATERSHED

Phinneys Harbor Pollution Pollutant Source Transport Priority Source Profile TY ~e Magnitude Considerations Sources
1. Alden Cranberry Bog 2. Baptiste Cranberry Bog 3. Waterhouse Rd. Development 4. County Rd. Development q-x
5. Chester Park Drain 6. Drain at Beach & Burtonwood X 7. Drain at Carlton Road 8. Shore Rd. Runoff X 9. County Rd. Runoff X 10. Old Dam Rd. Runoff X 1 1. Septic Systems 12. Wetlands East of County Rd. X 13. Monument Beach Marina X
FIGURE 3-7. PRIORITIZATION OF NONPOINT SOURCES OF NUTRIENTS IN PHINNEYS HARBOR WATERSHED
REFERENCE
-7
Association of State and Interstate Water Pollution Control Administrators, 1984. America's Clean Water: The States' Evaluation of Progress 1972-1982.
Deubert, K.H. 1974. Impact of the Cranberry Industry on the Quality of Groundwater in the Cape Cod area.
Environmental Protection Agency, 1983. Results of the Nationwide Urban Runoff Program, Volume 1. Final Report NTIS PB84- 185552.
Environmental Protection Agency, 1987. Setting Priorities: The Key to Nonpoint Source Control.
Kress, M., and G. F. if ford, 1984. Fecal coliform release from cattle fecal deposits: Water Resource Bulletin: V. 20, No. 1, American Water Resources Association.
Massachusetts Department of Environmental Quality Engineering, 1987. Buzzards Bay Research Bacteriological Data Report, 1986.
Morehouse, 1988. Ready Reference Guide to Nonpoint Source Pollution. Sources, Pollutants, Impairments, Best Management Practices for the New England States.
- Weiskel, P.K., G.R. Heufelder and B.L. Howes, 1989. The Impact of Septic Effluent on Groundwater Quality, Buttermilk Bay Drainage Basin, SE Massachusetts Part 1: Indicator Bacteria.
Dapsis , L . , 1986. Personal communication between L . Dapsis (Ocean Spray) and P. Boucher (Metcalf & Eddy, Inc.).
Division of Water Pollution Control, 1987. Buzzards Bay Research Bacteriological Data Report.
Gil, L., 1988. Buzzards Bay Cranberry Bog Input Study, Special Water Quality Study. Unpublished Report.
Brezonik, P.L., 1972. "Nitrogen: Sources and Transformations in Natural Waters", in Nutrients in Natural Waters, H.E. Allen and J.R. Kramer, Editors, Wiley and Sons, 1972.
Krenkel, P.A. and Norotny, V., 1980. Water Quality.Management. Academic Press.
Metcalf & Eddy, Inc., 1979. Wastewater Engineering, Treatment, Disposal, Reuse. McGraw Hill Book Company.

CHAPTER FOUR
ASSESSMENT OF BEST MANAGEMENT PRACTICES
In this chapter, a range of pollution control measures or best management
practices which address the water quality problems identified in Phinneys
Harbor are identified, evaluated and screened. Based on the water quality
evaluations conducted in earlier chapters, the practices presented focus
primarily on bacteria and nutrient control, although control of solids and
other potential contaminants is also addressed. Each control practice is
described and assessed with respect to various technical, environmental and
socio-economic criteria. Based on this process, appropriate control measures
are selected to be part of the recommended plan. This plan is described in
detail in Chapter 5.
BW Assessment Criteria
Based on the discussions and evaluations presented in this chapter, BMP1s are
selected for implementation in the recommended nonpoint source control plan.
This selection is based on a variety of qualitative and quantitative
factors. In this section, the BMP screening and assessment criteria
considered important for development of a nonpoint source control plan are
presented.
Technical Feasibility. To be technically feasible, a BMP must be buildable in
, the area being considered for its use. Such factors as land area
requirements, site constraints (size, elevation, slope), land ownership, and
potential permitting problems are considered.
Monetary Factors. This category includes both cost and funding
availability. Costs include both capital and operations and maintenance costs
for a given BMP. Given the limited funding currently available for nonpoint
source control, availability of funding is a critical concern. In general,
BMP1s costing more than several hundred thousand dollars would be extremely
difficult to justify, given current funding availability. This factor ties
together with BMP cost, since a technically feasible or desirable BMP may not
be economically feasible.
4- 1

Water Quality Improvements and Benefits. The main purpose of nonpoint source
-. control is to effect a desired level of water quality improvement in Phinneys
Harbor and the Back River. In particular, as set forth in earlier chapters,
at least a one order of magnitude (90 percent) reduction in bacteria loading
from storm drains is sought. In addition, where possible, reduction in
nutrients and solids loadings will be sought, although solids are considered
far less important than bacteria and nutrients.
Public and Agency Support. Support of pollution control measures is gaged in
part through a series of public and Project Advisory Group meetings, as well
as through extensive discussions with various individuals representing these
groups. This support is further gaged by the technical comments received on
various project outputs and reports. In addition, agency support will be
sought in selected cases through funding applications for implementation.
Experience of Other Nonpoint Source Control Efforts. NPS control programs
already implemented elsewhere can be used to gain knowledge on what is
expected to work, and what problems may arise. Such programs include the ,--- Massachusetts Clean Lakes Program, the USDA Rural Clean Water Program
(implemented in Westport), various activities ongoing as part of the Buzzards
Bay program (such as the construction and testing of stormwater infiltration
BMP's at Electric Avenue Beach), and other test cases cited in various
literature and programs.
Demonstration Value. For this project, it is of special interest to
demonstrate methods for NPS control which can be effectively implemented in
other coastal areas where similar problems exist. It is also important to
select BMP's which can be implemented in other areas of the EBWR outside of
the Phinneys Harbor watershed.
The above criteria are all utilized during screening, development and
assessment of BMP's described in the following section.

Identification of Best Management Practices
-.
Best management practices (BMP1s) as used in this report is a general term
which could include any pollution control practice. This term is also often
interpreted to mean low-cost, nonstructural types of control measures. It is
important to stress low-cost, nonstructural control methods where feasible due
to the limited funding resources within which nonpoint source control programs
must currently be implemented.
Extensive efforts at development and implementation of nonpoint source control
methods have resulted in identification of numerous potential BMP's which
could be utilized at Phinneys Harbor. The list of possible BMP's may be
narrowed to reflect those applicable to the pollution sources which exist in
the Phinneys Harbor study area. Based on these sources, which were described
in detail in Chapter 3, a list of potential BMP1s is given in Table 4-1.
The list of BMP's in Table 4-1 is compiled from several sources. Morehouse
(1988) compiled a list of BMP's applicable to pollution sources in New England. The Soil Conservation Service (1989) has developed extensive BMP
descriptions with planning considerations and design criteria for agricultural
BMP' s . Other sources include Division of Water Pollution Control ( 1987) , EPA (19871, and others.
The following paragraphs describe and assess BMP's for each major type of
pollution source (agricultural, urban runoff and land disposal) which occurs
in the Phinneys Harbor drainage area. In addition, a number of
non-structural, institutional BMPs are assessed. Following this, a summary
assessment of BMP's is provided as a final basis of selection for inclusion in
the recommended plan.
Agricultural Best Management Practices
This section presents a variety of agricultural best management practices to
control nutrient loading on Back River from area cranberry bogs including
fertilizer management, water management and water treatment.
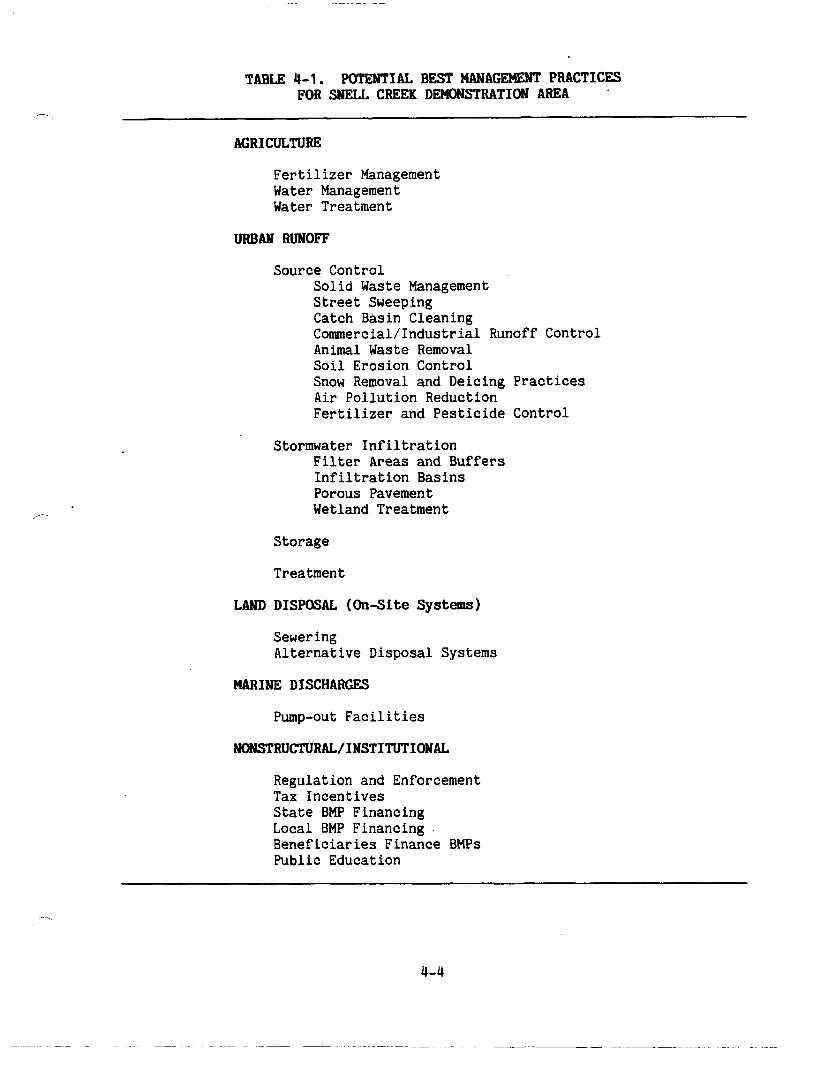
TABLE 4-1. POTENTIAL BEST MANAGEMENT PRACTICES FOR SNELL CREEK DEMONSTRATION AREA
AGRICULTURE
Fertilizer Management Water Management Water Treatment
URBAN RUNOFF
Source Control Solid Waste Management Street Sweeping Catch Basin Cleaning Commercial/Industria1 Runoff Control Animal Waste Removal Soil Erosion Control Snow Removal and Deicing Practices Air Pollution Reduction Fertilizer and Pesticide Control
Stormwater Infiltration Filter Areas and Buffers Lnfiltration Basins Porous Pavement Wetland Treatment
Storage
Treatment
LAND DISPOSAL (%-Site Systems)
Sewer ing Alternative Disposal Systems
MARINE DISCHARGES
Pump-out Facilities
Regulation and Enforcement Tax Incentives State BMP Financing Local BMP Financing . Beneficiaries Finance BMPs Public Education

Fertilizer Management. Fertilizers are used to increase the productivity of
the land and are necessary for crop production. However, use of fertilizer
can increase the amount of pollutants, especially nitrogen and phosphorus,
available for transport (EPA, 1987). Therefore, proper fertilizer application
is important for increasing cranberry production and decreasing impacts on
water quality.
Fertilizer management approaches the problems of nitrogen and phosphorus
loading from a source control perspective. The North Carolina Agricultural
Extension Service (EPA, 1982) suggests that avoiding excess fertilizer use is
the first step in nutrient control. Various methods include soil testing,
liming, proper application, and timing. Soil testing isolates the fertilizers
needed, liming can increase the fertilizer effectiveness, proper application
assures efficient use of the nutrients, and application near the time of
maximum growth can maximize plant utilization of nutrients (EPA, 1982).
Fertilizer management can reduce costs by decreasing the amount of fertilizer
purchased and reducing the labor hours required to apply the fertilizer (EPA
1987). Fertilizer management is recommended for both cranberry bogs in the i watershed and a plan to coordinate this effort through the Soil Conservation
Service is presented in Chapter 5.
Water Management. During periods of fertilization and application of
herbicides and pesticides, release of nutrients and chemicals can be minimized
by retaining water in the bog for a period of several days after chemicals are
applied. This technique allows for plant uptake of applied fertilizers and
attenuation of chemical concentrations. This is accomplished by water control
structures such as dikes, dams, flumes and spillways. Additional control of
these tailwaters can be achieved by the used of tailwater recovery systems
consisting of ditches and pipes which collect water and convey it to storage
lagoons. Water stored in such lagoons can be reused or released after
neutralization. A plan for water management to control nutrient release is
currently being developed for the Alden bog by the Soil Conservation
Service. It is recommended that a similar plan be developed and implemented
at the Baptiste bog. Conceptual plans for both bogs were developed in close
consultation with the Soil Conservation Service and are presented in
Chapter 5.
4-5

Water Treatment. The best management practices previously discussed in this
,- section are, for the most part, nonstructural, high management techniques to
control nutrients from cranberry bogs. In the absence of fertilizer and water
management, a structural technique involves construction of a filter
barrier. A plan and cross section of a typical filtration barrier is
illustrated in Figure 4-1 and consists of an earthen berm and a leaching chamber. Water exiting the bog would pass through the leaching chamber which
is filled with a sand/alum mixture. These systems can be effective in
removing phosphorus and also remove solids and bacteria. Potential
constraints on use of filter barriers include hydraulic capacity, maintenance
requirements and potential wetlands and waterways impacts and permitting
difficulties. Due to the availability of nonstructural techniques and the
fact that reduction of nutrients is a secondary objective, filter barriers are
not recommended.
Urban Runoff Best Management Practices
As discussed in Chapter 3, piped drainage systems near Eel Pond and Chester Park at Phinneys Harbor are significant sources of stormwater runoff in the
Phinneys Harbor watershed. Pollutants washed off the roadway during wet
weather travel through these piped drainage systems and discharge directly to
Eel Pond and Phinneys Harbor. Potential methods of controlling bacteria
loading from such a piped drainage system include source controls, promotion
of infiltration, storage, and end-of-pipe treatment. This section presents a
variety of stormwater best management practices to control bacteria and
nutrient loading from these drainage systems.
Source Controls. Source control measures include actions within a drainage
basin which effectively reduce the stormwater pollution before it is washed
off by rainfall and enters the receiving waters. Source controls do not
usually require large capital expenditures. However, they are generally
labor-intensive; therefore, the associated maintenance costs can be high.
Solid Waste Management - Although intentional disposal of waste material on streets and sidewalks is prohibited, it may occur to a small degree in the
,--
watershed of Phinneys Harbor, especially during summer. This street litter
4-6

EXISTING CULVERT
f
PLAN (NOT TO SCALE)
ACCESS COVER FOR REPLACEMENT OF SANDIALUM
FLOW
2%- GRAVEL BED
FIGURE 4-1. TYPICAL FILTRATION BARRIER
SECTION A - A (NOT TO SCALE)

commonly includes metallic, glass, and paper containers; cigarettes;
*- newspapers; food wrappers; and a variety of other such items. If not removed
from the street surfaces by cleaning equipment, these items often end up in
stormwater discharges. This can result in visible pollution due to the
floatable nature of many of these items.
Enforcement of anti-litter ordinances is generally given a relatively low
priority by law enforcement agencies due to the limited personnel and funds,
and the difficulty of identification and conviction of violators. Public
education programs and conveniently placed waste disposal containers may both
be effective, low cost alternatives. Since leaves, grass clippings, crankcase
oil, paints, chemicals and other such wastes are sometimes disposed of in
catchbasins or street inlets, proper disposal of these materials can be
addressed in a public education program. However, since the results of such a
program are dependent on voluntary cooperation, no level of effectiveness can
be predicted. While such an education program is desirable, it can not be
considered a reliable bacteria and nutrient control alternative. Further,
solid waste pollution is not considered a serious pollution problem in this - area.
Street Sweeping - Street sweeping is often considered a practical best management practice (BMP) for stormwater pollution control. Frequent street
sweeping can prevent accumulations of dirt, debris and their associated
pollutants. The first-flush of pollutants from streets and other tributary
areas to a drainage system would be reduced if accumulations were prevented.
However, street sweeping requires high maintenance costs and has been shown
not to remove significant amounts of bacteria or nutrients, especially in a
residential setting. Thus, it is unlikely that substantial reductions in
bacterial or nutrient pollution will result from more frequent cleaning.
Catchbasin Cleaning - Regular cleaning of catchbasins can remove accumulated sediment and debris that could ultimately be discharged from storm drains.
The frequency of catchbasin cleaning varies, but is typically one to two times
annually and is targeted towards maintaining proper drainage system
performance rather than pollution control. Research by EPA has determined ,. -

that a frequency-af-catchbasin - - cleaning of two times a year maintains - YC'- -- @ e z y = e a n t removaa~he option of increased catch basin cleaning
would not increase bacteria removals by any substantial amount, and like
street sweeping, it is also maintenance intensive.
Commercial/Industrial Runoff Control - Commercial and industrial lands can contribute quantities of grit, oils and grease to drainage systems. In the
study area, such contaminants may runoff into sewers from gasoline stations,
and parking lots. Pretreatment of runoff from these areas may be achieved by
installing and maintaining oil and grease separators in catch basins and area
drains. However, commercial development in the Phinneys Harbor watershed is
light and there are no directly discharging drains from these areas.
Soil Erosion Control - Properly vegetated soils will not erode and thus will not be transported through the storm drains during wet weather. Controlling
soil erosion is important in two respects: (1) soil particles create turbidity
in receiving waters, block sunlight and in general create a nuisance; (2) soil
particles carry nutrients and metals. Nutrients and metals fixed onto soil
particles may be released and become available for aquatic plant uptake or
intake by organisms. In the study area, however, there do not appear to be
any major sources of continuous soil erosion.
Snow Removal and Deicing Practices - This abatement measure involves limiting the use of chemicals for snow and ice control to the minimum necessary for
public safety. This in turn would limit the amount of chemicals, primarily
salt, and sand washed into the collection system and ultimately discharged.
Since little or no bacteria or nutrient reduction would occur, this option is
not considered viable.
Air Pollution Reduction - One method of controlling pollutant loadings from urban runoff is to limit the amount of pollutants that are contributed to
local air. Particulate and gaseous pollutants in air are carried to the
ground by rainfall. Air born particulates also settle to the ground during
dry weather.

Certain metals, such as lead and zinc, are by-products of automobile use.
- Reducing automobile emissions of lead and zinc would likely decrease their
concentrations. However, it is extremely difficult to quantify the potential
reduction in stormwater pollution associated with air quality improvement. It
is doubtful that there would be any reduction in bacterial or nutrient
pollution, hence this option is not considered realistic.
Animal Waste Removal - Essentially, this refers to removing animal excrement from areas tributary to storm drains. The town of Bourne recently enacted
local regulations related to control of pet litter. It is anticipated that
some (although unpredictable and probably minor) reduction in bacteria load
may be achieved. This best management practice could also be emphasized
during public information programs.
Fertilizer and Pesticide Control - Fertilizers and pesticides washed off the ground during storms contribute to the runoff pollutant levels. Controlling
the use of these chemicals on public lands can help reduce nutrient loads.
Care should also be taken to properly store and protect chemicals from - exposure. Since most of the problems associated with these chemicals are a
result of improper or excessive usage, a public education program may be
worthwhile. Control of these chemicals, however, is not expected to achieve
bacteria reduction in the drainage area but could help to control nutrients.
In summary, source controls can improve stormwater runoff quality and may
achieve some nutrient control. They cannot, however, be relied upon to
provide a consistent reduction in bacteria loading. A public education
program to inform residents of what can be done to reduce urban runoff
pollution can be effective. Such a program could encourage a number of
activities including proper disposal of household chemicals and motor oil,
animal waste control, regular cleanup of litter, and control of
pesticidedfertilizer application.
Stormwater Infiltration. Methods to infiltrate stormwater into the ground
prior to direct discharge into receiving waters can be highly effective in
removing bacteria, solids, and certain nutrients and metals. It is a

desirable BMP approach because high bacteria removals (over 99 percent) can be
_- obtained, even in permeable soils, and because costs are lower than more structurally intensive methods such as end-of-pipe treatment. While generally
no pumping or power costs are involved, some maintenance is usually
required. Infiltration methods are being studied, utilized and tested as part
of the Buzzards Bay project, particularly at Buttermilk Bay. Leaching
facilities have been constructed at Electric Avenue Beach in Bourne
(Metcalf & Eddy, 1989) .
Filter Areas and Buffers - In this BMP, the drainage system is altered
through diversion or detention to promote overland flow through natural
vegetation which acts as a filter to decrease the runoff velocity, allows
solids to settle, and promotes infiltration. Design considerations include
type of pollutant and expected flow and load, type of vegetation present and
slope. In general, bacteria in road runoff does not attach to sediments and
infiltration is required to remove bacteria. Therefore, unless large areas
are used, these systems are not effective in removing bacteria from urban
runoff. If the filter area is large enough, some removal of nutrients and
- solids may also be achieved. Filter areas may be less effective in winter due
to frozen ground. Filter areas are inexpensive and do not require extensive
maintenance. Due to lack of available land, lack of effectiveness in winter,
and availability of other techniques, filter areas are not recommended.
Infiltration Basins - In order to promote infiltration within piped drainage systems, infiltration basins may be constructed within the drainage system.
According to the Soil Conservation Service (1987), the soils in the watershed consist of well drained sandy and gravelly deposits which are conducive to the
use of infiltration. A typical stormwater infiltration catch basin is shown
in Figure 4-2 and a stormwater drainfield or leaching galley, a similar system
with larger hydraulic capacity, is shown in Figure 4-3. Another common
infiltration system consists of dry wells retrofitted to existing catch
basins. The dry wells, when used with a hooded catch basin, are less likely
to clog than infiltration catch basins because oil, grease, and other
floatables are captured before infiltration.

BACKFILL WITH 6" MANHOLL RISER TO BE OF TOPSOIL I / rEX7ENDED TO GRADE
, . . . .- ...
INLET PIPE
SPLASH M D LW CLCW
WASHED STONE, SIZE TO . BE GRADED FROM 3A.-lb2 SlONE NEXT TO DRY WELL TO PEA STOW NEXT TO SIDEWALLS. WASHED PEA STONE SMOUU) EXTEND A MlNUUM OF 2FT. FROM SIDEWALLS OI: EXCAVATION
* INLET PIPE SIZE AND INVERT ELEVATION
S E C T I O N V I E W
FIGURE 4-2. TYPICAL STORM WATER INFILTRATION CATCH RASIN

FIGURE 4-3. TYPICAL LEACHING GALLEY DESIGN

EPA (1974) showed in "Water Quality Management Planning for Urban Runoff" that - during the first 4-inch of rainfall, an intensity of 1.0 inch/hour for thirty
minutes is considered heavy enough to remove 90 percent of the pollutants from
pavement. This phenomenon, in which the majority of pollutants.are
"washed-off" paved surfaces at the beginning of a rainfall event, is known as
the "first flush1'. Using this rule of thumb, infiltration basins or leaching
gallies installed for pollution control are typically designed to infiltrate
runoff from a 1 or 2-year storm in order to maximize water quality benefits.
Given the effectiveness of infiltration coupled with sandy soils in the
watershed, stormwater infiltration is recommended to control direct discharges
of stormwater to Eel Pond and to Phinneys Harbor at Chester Park. Conceptual
plans for dry wells and leaching galleys are presented in Chapter 5.
Porous Pavement - Porous pavement consists of a porous top course of varying thickness covering a layer of gravel over a crushed stone recharge bed.
Porous pavement provides temporary storage and promotes infiltration in
otherwise impervious areas, and is typically designed to enhance groundwater
recharge rather than pollution control. Porous pavements can be installed - over existing impervious pavements, keeping the replacement costs about equal
to the original installation costs. However, these systems are not as
effective as porous pavement installed over pervious soil (EPA, 1987). This
technique is most frequently used in small but highly erodible areas subject
to considerable traffic, such as parking lots. Porous pavement is not
recommended, however, for areas subject to heavy high-speed traffic and would
not likely be technically feasible for use on streets in the watershed.
Wetland Treatment - Wetlands provide natural detention and filtering areas through vegetation and infiltration. Use of wetlands to treat stormwater may
not be permittable, however, under the Massachusetts Wetlands Protection Act
Regulations which do not permit alteration of wetlands. Discharge of large
volumes of polluted stormwater to existing wetlands may constitute a
significant negative impact and would not likely be permitted by the local
conservation commission. Further, there are no suitable existing wetlands to
serve as treatment areas for runoff from streets in the watershed.

Storage. The use of storage for urban runoff control can involve in-system or
-. off-line facilities. In-system facilities rely on excess capacity in the
drainage system to control peak discharges. Off-line storage includes such
facilities as retention/detention ponds. Storage facilities are generally
used for hydraulic control of peak flows. For example, conservation
commissions routinely require that pre- and post-development flows cannot be
altered. Storage facilities are not generally used for urban runoff pollution
control unless in combination with treatment methods. Given that their
feasibility for bacteria removal is limited, unless in combination with high
cost treatment methods, further consideration of these methods is not
warranted.
Treatment. Numerous end-of-pipe treatment methods for bacterial and nutrient
control exist. These include physical, chemical and biological methods in
various combinations, often with disinfection for bacteria removal. These
methods are normally used to treat wastewater and sometimes combined sewage,
but are rarely used to treat stormwater because of the high cost. Since these
methods involve land acquisition, significant environmental impact and high - cost, and are beyond the limits of available funding for nonpoint source
control, they will not be considered further.
Land Disposal Best Management Practices I
As discussed in Chapter 2, there are no water quality data collected in \ studies of Phinneys Harbor and Back River that indicate a bacteria pollution
problem caused by septic tanks. In many areas of the watershed of Phinneys 1 Harbor, however, due to improperly installed or undersized systems, septic
tanks may be a source of fecal coliform bacteria and nutrients in certain I I
I
areas or intermittently depending on weather conditions, tides, and occupancy I
*i /
Due to widespread concern over the impact of septic tanks on water quality,
several potential BMPs to control discharge of bacteria from septic tanks are
evaluated below including sewering, and alternative disposal systems.
Nonstructural/Institutional methods of controlling bacteria from septic tanks
are discussed later in this chapter.

Sewering. Sewering involves the construction of underground conduits to
,- convey wastewater from an entire community to a municipal wastewater treatment
facility. Although sewering would effectively eliminate on-site system
failures, no significant amount of failures or surface breakouts has been
observed either directly or through water quality analyses and sewering may
not improve bacterial water quality significantly. Further, such a
recommendation would not likely receive public support, may be prohibitively
expensive, and may not be eligible for funding through the state construction
grants program in the near future. Thus, sewering is not recommended to
control bacteria from septic tanks near Phinneys Harbor.
Alternative Disposal Systems. Alternative wastewater disposal systems include
pressure sewerage systems, vacuum sewerage systems, package wastewater
treatment plants and large on-site systems to treat sewage from a group of
homes. Like sewering, these systems may be effective in preventing septic
system breakout. There is, however, no evidence of widespread breakout
problems in Bourne and construction of these systems may not result in a
significant water quality improvement. In addition, these systems may not be
r eligible for state funding and would not likely receive public support or \ I
local or private funding. There are, however, no dry weather water quality 1 J b2 data that indicate that beat discharges contribute to bacteria concentration+ MA '
in Phinneys Harbor. Any water quality impacts from this marina may be -41 \ 1-
dissipated by the rapid tidal flushing rate around Toby's Island.
--i
Boats/Marinas Best Management Practices
---.. '. The Monument Beach Marina is located at the southern end of Phinneys Harbor ', near Toby's Island. Approximately 50 to 100 boats dock at this marina.
Because of the large concentration of boats in the area, this may be a source
of pollution including bacteria, surfactants, and petroleum products. This
marina does not have pump-out facilities to accommodate boats with holding
tanks returning after a full day trip. Therefore, many people reportedly
discharge accumulated wastes directly into the surface water on their way to 1 the marina. This could be a direct source of bacteria to Phinneys Harbor and
could contribute to shellfish closures in the area. There are, however, no

dry weather water quality data that indicate boat discharges as a significant F source of fecal coliform bacteria to Phinneys Harbor. Any water quality
impacts from this marina may be dissipated by the rapid tidal flushing rate
around Tobys Island. Since boat discharges may occur occasionally and could
be a threat to public health, this section evaluates construction of pump out
facilities as a method of reducing discharges from marine sanitation devices
into Phinneys Harbor. Institutional means to control these discharges
including regulation and enforcement and education are discussed in a latet-,
section of this chapter.
Pump-out Facility Construction. Throughout the Cape Cod area there are \ ver
few boat pump-out facilities. For example, the nearest facility to the "I Monument Beach marina is the facility at the Massachusetts Maritime Academy by I the Cape Cod Canal, a significant trip for boats in Phinneys Harbor. The I Commonwealth of Massachusetts has developed a task force designed to study 1 this problem and develop solutions. One task is to find suitable locations
for new pump-out facilities and funding sources for their construction. / ! I -
Construction and operation of these facilities is expensive and may not be I
feasible at the Monument Beach marina. However, the state task force may be \ I able to identify a centrally located site suitable for a facility. Given the '
/ lack of a documented water quality problem and the above factors, constructiw'
of a pump-out facility is not recommended at this time. 1''
Nonstructural/Institutional Best Management Practices
In addition to the various structural means to control nonpoint sources, a
number of nonstructural or institutional means of nonpoint sources control
have been evaluated. This section presents a number of nonstructural and
institutional means to control agricultural runoff, urban runoff, and
contamination from on-site wastewater systems and boats including regulation
and enforcement; tax incentives; state, local and beneficiary financing of
BMPs; and public education. It must be noted that enactment of local bylaws
or regulations must occur through the town meeting process. Further, there is
-. currently no local or state institutional framework to grant tax incentives

for BMP installation, and there is no basis to charge polluters or
- beneficiaries a fee to generate revenue for pollution control. Thus, the
implementability of several of the BMPs described below is questionable in the
absence of widespread public and political support.
Regulation and Enforcement. Opportunities for regulatory control of pollution
include bylaws, regulations, enforcement, and incorporation of measures to
address water quality concerns in local permits issued by the health
department, planning board, and conservation commission. Local environmental
bylaws and regulations may be enacted to conserve health; to provide for
water, water supply, drainage, sewerage, open space and conservation of
natural resources; and to prevent blight and pollution of the environment. A
zoning bylaw may be adopted to protect designated land uses with critical
environmental concerns from inappropriate uses of land (SRPEDD, 1989) . Sample
bylaws and regulation have been developed by the Southeast Regional Planning
and Economic Development District (1989) under contract to EPA Buzzards Bay Project. This section describes potential regulatory means to control
nonpoint source pollution from agriculture, stormwater runoff, proposed p developments and subsurface disposal systems.
Agriculture - There are a myriad of federal, state and regional agencies dealing with agriculture including the U.S. Department of Agriculture, the
Environmental Protection Agency, the Massachusetts Department of Environmental
Management, the Massachusetts Department of Food and Agriculture, and the
Massachusetts Soil and Water Conservation Districts. Most of the programs
implemented by these agencies, however, provide technical and financial
assistance and do not serve in a regulatory or enforcement capacity. The
strategy for control of agricultural nonpoint sources, as presented in the
Massachusetts Nonpoint Source Management Plan (DEP, 19881, suggests source
identification, prioritization and control through BMPs, education and
technical assistance rather than a regulatory approach. One method to control
agricultural pollution is through establishing agricultural districts through
zoning bylaws.

Stormwater Runoff (Existing and Future) - Water quality in Phinneys Harbor and ,- Back River is directly influenced by the cumulative effect of existing
development and activities in the watershed and the resultant stormwater
runoff in the drainage basin. Future development represents a threat of
further deterioration in water quality. Within the Phinneys Harbor watershed,
over half of the acreage, or about 1000 acres, could be developed with home
sites under current zoning. Development of any significant fraction of that
property could generate impacts in terms of surface runoff quality and
quantity, erosion, sedimentation, disruption of natural drainage patterns,
coliform bacteria and leachates from septic tanks, and other potentially
damaging effects. There is at least one large development proposed within the
Phinneys Harbor watershed.
The existing institutional and statutory framework for regulating urban runoff
is not cohesive. On the federal level, amendments to the Clean Water Act of
1987 established a municipal and industrial stormwater discharge permit program. This program will not apply to Bourne, however, due to the low
population of the town and lack of a large municipal storm sewer system. --. Within well-established municipal authority, however, there are numerous tools
available that can be of major assistance in controlling water pollution from
new development. A set of enhanced municipal tools constitutes an ideal
future complement to a program of direct structural improvements designed to
mitigate existing conditions. Bourne has moved aggressively since the early
1970's to adopt a number of these local methods. This has been particularly
so in the areas of on-site sewage disposal within Board' of Health authority,
and Environmental Overlay Water Resource Protection Districts within the
zoning bylaws. The community could, however, benefit further both from
tightening of certain local regulations already adopted, and by consideration
of additional available methods. Table 4-2 provides a more complete list of
the tools that might be considered.
In order to illustrate the need for additional strengthening of local
regulations, selected comments follow. These observations do not constitute a
comprehensive analysis or plan, but they do serve to highlight areas for
future discussion. , -

Techniques to consider
A . Zoning Strategies
1. Environmental Overlay District
MA Cenl. Laws, Chap. 4OA
2. Special Performance Zoning
MA Cenl. Laws, Chap. 40A
3. Special Permit Authority
C. 4OA, Sec. 4
4. Site Plan Review (As i n No. 1 above.)
5. Performance Standards (Not the same as No. 2 preceding. ) ( A s in No. 1 above.)
Description
By imposing a protection overlay over any base d i s t r ic t ( s ) desired, special requirements addressing surface runoff, as well as subsurface intrusion, can be established for a l l development within that zone.
Ties the impact of any development directly to the physical carrying capacity of the land on which it l i es . Explicit performance c r i te r ia are needed. Carrying capacity for each d is t r ic t must be determined.
By making certain uses conditional and requiring special review and permitting, the community gains great power to: require appropriate s i t e design; mitigate on- and off-site impacts; and even t o share mitigation costs.
Allows designated types of developments to receive a detailed administrative review, in regard to basic s i t e features such as driveways, building s i t ing, drainage patterns.
Quantifiable limits are se t on objectionable or nuisance conditions, such as noise, glare, d u s t , heat, odors, e tc . , and can be expanded to cover various environmental protection areas.
Is only as strong as the special standards created for i t , and is best supplemented by other zoning tools.
Requires extensive technical analysis and review process, which m u s t engender developer opposition and require a professional s taff or consultant capability.
Provides community with opportunity to s e t protective standards and subsequent mitigations and, unlike most other methods, offers a means to levy fair-share costs as a legally supportable quasi-impact fee. Potentially, a powerful tool. Well-established technique, but could be subject to legal challenge i f a l l uses i n a d i s t r i c t are conditional.
More limited i n scope than most other tools, and they are more constrained as an environmental protection tool.
Focuses on impacts rather than development, so it t reats a l l parties equitably, clearly and objectively. Standards can differ , however, from existing federal or s ta te regulations for the same impact.

TABLE 4-2 (Continued). WATER POLLUTION COWTROL FROM UEU DEVELOPMEW: POTENTIAL LOCAL RECULATORY TECHNIQUES
Techniques t o c o n s i d e r Desc r ip t ion Comnents
A . Zoning S t r a t e g i e s (Cont.)
6. Open Space . R e s i d e n t i a l D i s t r i c t s
C. 40A, S e c t i o n s 2 and 9
7. Stormwater Hanagemen t By-Law ( I n f i l t r a t i o n Requirements)
8. Trans fe r o f Development R igh t s
C. 40A. Sec . 9
9. . Ear th Removal By-Law
. Sedimenta t ion/ Eros ion Control By-Law
. N u t r i e n t Loading By-Law
10. Floodpla in Districts
Uses c l u s t e r i n g o p t i o n s and v a r i a b l e l o t s i z e p r o v i s i o n s (even i f o n l y s i n g l e f ami ly detached homes a r e invo lved) a s a means o f p r e s e r v i n g open space .
Provides a method f o r d i v e r t i n g s u r f a c e r u n o f f e n t i r e l y away from wet lands , and, i n r u r a l a r e a s , f o r maximizing r e c h a r g e / i n f i l t r a t i o n i n t o s u b s u r f a c e o f s o i l .
T r a n s f e r development r i g h t s from t h e l lsendingll o r p r o t e c t i o n zone t o t h e "receivingo1 o r development zone, u s u a l l y by s a l e o f such r i g h t s . T h e o r e t i c a l l y , a major p l ann ing t o o l t o keep development away from where it 's n o t d e s i r e d , and i n t o where it is sough t .
P rov ides s t a n d a r d s f o r managing p o l l u t i o n from a l l c o n s t r u c t i o n sites, permanent sites and a g r i c u l t u r e , by s e t t i n g q u a n t i t a t i v e l i m i t s and r e q u i r i n g s t r u c t u r a l improvements o f v a r i o u s types .
Tends t o be ignored by deve lope r s , u n l e s s s e v e r a l f a c t o r s a r e p r e s e n t , such a s : bonus u n i t i n c e n t i v e s ; c l e a r and comprehensive open space system g o a l s and d e f i n i t i o n s ; and s t r e a m l i n i n g o f a d m i n i s t r a t i v e procedures .
Can a l s o be handled under: environmental o v e r l a y d i s t r i c t , s i t e p l a n review, o r performance s t a n d a r d s . I f adop ted , t h e r e should b e a r e c i p r o c a l c l a u s e wi th in s u b d i v i s i o n c o n t r o l .
I s d i f f i c u l t and c o n t r o v e r s i a l t o p lan f o r , p a r t i c u l a r l y d e s i g n a t i n g r e c e i v i n g s i t e s . I t is a l s o hard t o a s s e s s monetary va lue o f t h e development r i g h t s i n an e q u i t a b l e manner.
Can be implemented as s e p a r a t e by-laws o u t s i d e o f zoning, and s i m i l a r p r o v i s i o n can (and shou ld ) b e placed i n t o s u b d i v i s i o n r e g u l a t i o n s .
P rov ides a degree o f s h o r e l i n e p r o t e c t i o n by l i m i t i n g Most comnuni t ies , i n c l u d i n g Ues tpor t , have a l r e a d y b u i l d i n g below 100-year s to rm e l e v a t i o n . adopted, i n o r d e r conform t o r equ i remen t s o f
f e d e r a l f lood insu rance .

TABLE 4-2 (Continued). UATER FOLLVFION COWROL FROn NEU DEVELOPI(EW: POTENTIAL LOCAL REGULATORY TECHNIQUES
Techniques t o c o n s i d e r Desc r ip t ion
8 . Regulatory S t r a t e g i e s : Non-Zoning
1. Subd iv i s ion Con t ro l Subd iv i s ion c o n t r o l r e g u l a t i o n s can be amended t o Amendments c o n t a i n numerous requirements f o r s tormwater
HA Genl. Laws, management, environmental ly s e n s i t i v e l and develop- Chapter 41, ment p r a c t i c e s , and d e s i g n s t a n d a r d s . S e c t i o n s 8lK-81GG
2. Board o f Hea l th The t r a d i t i o n a l l a n d - r e l a t e d f u n c t i o n s o f l o c a l Powers ( P u b l i c . Heal th Boards, s e p t i c pe rmi t s , n o n - r e s i d e n t i a l Heal th ) e s t a b l i s h m e n t i n s p e c t i o n s , s u b d i v i s i o n review,
MA Genl. Laws, sewer/water connec t ions , e t c . , can be expanded t o Chap. 111 and i n c l u d e broader powers ove r a lmos t any environmental Chap. 41, Sec. 8 1 4 ; r i s k , provided t h e r i s k is apparen t and demonstrable . T i t l e V s p e c i f i c a l l y governs o n - s i t e sewage d i s p o s a l
3. Wetlands P r o t e c t i o n Can be a p p l i e d more a g g r e s s i v e l y i n a p u b l i c h e a l t h Act hazard s i t u a t i o n , such a s r e q u i r i n g a d d i t i o n a l
MA Genl. Laws, b u f f e r s a long s t a t u t o r y we t l ands , when a r e l a t i v e l y Chap. 131, Sec . 40 l a r g e development is cons t ruc ted .
4. Groundwater and By c r e a t i n g a s p e c i a l ove r l ay d i s t r i c t , o b j e c t i o n a b l e Aquifer P r o t e c t i o n u s e s can be p r o h i b i t e d , r echa rge a r e a s p rese rved , By -Laws b u f f e r s c r e a t e d , and c o n d i t i o n a l permit r equ i remen t s
and c o n d i t i o n s i n s t i t u t e d .
Comnents
There a r e two d i s t i n c t l i m i t a t i o n s : ( 1 ) s u b d i v i s i o n c o n t r o l a p p l i e s only when land is being d iv ided , b u t n o t i n c a s e s o f new c o n s t r u c t i o n on a l r eady-d iv ided p rope r ty ; and ( 2 ) t h e improvements exac ted a s a r e s u l t o f t h e s u b d i v i s i o n c o n t r o l p r o c e s s have t r a d i t i o n a l l y a p p l i e d l a r g e l y t o o n - s i t e improvements.
There must be a c l e a r and p r e s e n t danger t o p u b l i c h e a l t h , which can be d i f f i c u l t t o document, p a r t i c u l a r l y from non-point sou rces .
Exceeding t h e narrow i n t e r p r e t a t i o n o f t h e s t a t u t e i n terms o f w h a t is r e q u i r e d , would impel a v e r i f i c a t i o n o f c l e a r and p r e s e n t danger by t h e Conservat ion Commission and probably by HA DEP.
Often f u n c t i o n s a s a s p e c i a l pe rmi t g r a n t e d by Board o f Appeals o r o t h e r des igna ted a u t h o r i t y .

TABLE 4-2 (Continued). WATER POLLVFION COWROL FROU NEY DEVELOPMENT: POTENTIAL LOCAL RffiULATORY TECHNIQUES
Techniques t o cons ide r Desc r ip t ion Comnent s
8. Regulatory S t r a t e g i e s : Non-Zoning (Cont . )
5. Underground Fuel O f f e r s a means o f moni tor ing and upgrading petroleum Becomes p a r t o f e i t h e r b u i l d i n g - r e l a t e d codes S to rage Regu la t ions t anks . ( b u i l d i n g , housing, l i f e s a f e t y , plumbing and
wi r ing c o d e s ) , o r part o f p u b l i c h e a l t h r e g u l a t i o n s .
C. Other: Negot ia ted Techniques
1. Conservat ion (Vo lun ta ry ) Agreement between a l a n d owner t o keep Low c o s t means o f p rese rv ing open space , b u t is a R e s t r i c t i o n s a l l o r p a r t o f h i s p rope r ty i n a most ly u n a l t e r e d vo lun ta ry method and t h e r e f o r e l i m i t e d i n a p p l i c a t i o n .
H.C.L. Chap. 181, s t a t e and t h e Conservat ion Commission. Owner still Secs . 31-33 pays some p r o p e r t y t a x e s and m a i n t a i n s t h e p rope r ty
i n f u l l , bu t r e c e i v e s i n r e t u r n l i f e occupancy r i g h t s .
2. Conservat ion Within any r e g u l a t o r y review, b u t p a r t i c u l a r l y i n Probably n o t a method f o r s av ing l a r g e open s p a c e Easements s u b d i v i s i o n c o n t r o l , conse rva t ion easements and t r a c t s i n t h e i r e n t i r e t y , b u t can be h e l p f u l on
HA Cenl. Laws, b u f f e r s can be n e g o t i a t e d by Planning Board and bound environmental ly important segments. . Chap. 184 and a s a recorded deed a t t achmen t . Chap. 232, Secs . 1 and 2

\
TABLE 4-3. SUHHAHY OF IMP ASSESSMNT
Technical Monetary Factors Water Quality Public and Other NPS Demonstration BMP Feasibility Capital OLM Funding Improvements Agency Support Control Efforts Value Conunen ts
Agricultural
Low Requires a s o i l t e s t and operational planning
Fert i l izer Management
Assistance available .to operators from USDA
Water Management + Moderate Low Capital costs for installation of water structures
Requires management by bog operator
Very effective for retaining and reusing contaminated tailwater
Water Treatment + High Moderate - High capital cost
Potential wetland impacts
Does not address nutrient source
Urban Runoff
Source Controls + Low Moderate - Implement through public education
Inf i l t ra t ion Moderate Low + Feasibility depends on s o i l type and groundwater elevation

TABLE 4-3 (Continued). SUWARY OF BnP fU%XSSMEW
Technical Monetary Fac tors Water Q u a l i t y Public and Other NPS Demonstration BMP F e a s i b i l i t y C a p i t a l OhM Funding Improvements Agency Support Control E f f o r t s Value Comments
E f f e c t i v e f o r b a c t e r i a , n u t r i e n t , s o l i d s and metals removal
Low maintenance
Storage
Treatment
High
High
High - High -
No b a c t e r i a removal
High c a p i t a l c o s t
Environmental Impacts
Land Disposal
High High -
High Moderate -
High c a p i t a l c o s t Sewering +
A 1 t e r n a t i v e Disposal Systems + High c a p i t a l c o s t
Likely p u b l i c oppos i t ion
Nons t ruc tura l / I n s t i t u t i o n a l
Regulat ion and Enforcement + Requires ex tens ive c o a l i t i o r
bui lding- and p u b l i c suppor t
No programs i n p lace
Depends on a v a i l a b i l i t y
Tax I n c e n t i v e s - Local Financing +

In the zoning by-laws, the five water resource protection overlays in IV-4700
- are of value, but do not address management of surface runoff in an explicit
way. The designation of numerous land uses as being conditionally allowed by
special permit is a sound control strategy, but in many cases is not enhanced
by specific standards. For example, underground fuel tanks might best be
regulated by a separate and far more detailed bylaw which applies to the
entire town, not only within the water resource districts.
Another example for possible improvement in the zoning pertains to the earth
removal provisions in IV-4400. These regulations are brief and lack certain
detail, such as depth-to-water table requirements.
Another example involves the apparent exclusion in the site plan review
process in 1-1100 of single family housing. A small number of dwellings can
be excluded, but larger developments should be evaluated in terms of drainage
practices, and on-site open space design. Some of these considerations would
be addressed in subdivision control, but if a relatively large number of lots
have already been recorded, construction could occur without detailed
-- assessment of site plans.
A local wetlands protection bylaw also might be worth considering. At present
in Bourne, wetlands are governed by municipal conservation commission powers
under the Chapter 131, Section 40 statutes, under Department of Environmental Protection aegis. Local regulations would, however, allow more detailed
definitions and protective criteria to be promulgated, and would strengthen
all local review procedures in terms of compelling more careful land planning
and site design. (This is not to be confused with the town lowlands
regulations, which cover flood hazard requirements).
In Board of Health regulations under Chapter 1 1 and Title V, the board has ' ,
added various provisions over the years to strengthen control of on-site '1) I
sewage disposal and its effect on wells, watercourses, and wetlands. One area
in which more clarity would be desirable is in the setback requirements for
septic tanks from water and wetlands. The 100' and 150' setback provisions I I
from Title V perhaps should be refined to specify different types of wells,

watercourses, and water bodies, and should be tightened to allow for tidal
variations in shoreline, seasonal fluctuations, wetlands buffers (particularly
with bordering vegetated wetlands) and other variables. Applicability of
separation requirements in both on-site and off-site circumstances could be
clarified as well.
The preceding examples convey an idea of the local regulatory improvements
that might merit examination. There are other examples that also could be
discussed. Table 4-2 provides a more complete list. Bourne has implemented a
number of water pollution protection measures including the water resources
distric.t and stronger Board of Health provisions, but might benefit from other
methods. Potential local tools described in Table 4-2 include conservation
bylaws and local subdivision and site plan review regulations for nutrient
loading control and stormwater management through the planning board.
Existing means of control, as described in Table 4-2 include the Wetlands
Protection Act and the Subdivision Control Act implemented by the conservation
commission and the planning board. In either case, the purpose of such
controls would be mainly to limit any increase in bacteria loading, and
secondarily to limit nutrient and solids loading to the receiving waters. The
paragraphs below complement Table 4-2 and describe, in more detail, potential
new regulations and means of using existing regulations for water quality
protection.
New Regulations - Stormwater runoff pollution control bylaws have been implemented by some communities. Although they are currently not common, they
are becoming more frequent as the recognition of stormwater as a nonpoint
pollution source increases. One example bylaw enacted by the town of
Wellfleet (Article 7, Section 30 of the General Bylaws) is as follows
(Southeastern Regional Planning and Economic Development District, 1989) :
''In order to protect the quality of the waters of the harbor and other wetlands within the town limits, no road or other surface shall be regraded, constructed, or maintained in such a manner as to divert or direct the flow of runoff, defined as including stormwater or any other surface waters, excepting natural pre-existing water courses, into any wetland, as defined in Massachusetts General Laws Chapter 131, Section 40. Uncontaminated runoff shall be directed in such a way as to

recharge the groundwater within the lot where it originates and in such a manner as not to alter natural runoff into any wetland, nor to cause erosion, pollution or siltation into or towards any wetland."
While this bylaw does not specifically mention bacteria, it would allow for
bacteria control by requiring on-lot groundwater infiltration. However, this
type of bylaw may not be workable in areas of poor soil infiltration capacity.
In Falmouth, Massachusetts, where there are extensive water resources combined
with rapid development in areas without public sewer facilities, a nutrient
loading by-law has been established for controlling development. Under this
by-law, developers are required to determine the nutrient loading of the
proposed development and evaluate the impact of this increased loading on the
water body. Pre-established criteria are used to define the loading from the
development. If the proposed development will push the receiving waters to or
above the pre-established critical level in terms of eutrophication, the
regulations call for the developer to present mitigating measures to reduce
the nutrient loading. One disadvantage of establfshing a town by-law of t h i p
nature is the fact that it may be cumbersome for the town to administer. Due
to the uncertainty involved in precisely predicting critical nutrient loading
levels and associated impacts, it is also possible that the by-law would be
disputed frequently. As a long-term objective, however, it would be advisable 1 for the town to explore adopting of some type of by-law aimed at control of
stormwater pollution. -- /
Existing Development Review - A simpler method of controlling impacts due to
development would be through use of existing regulatory reviews which are
already required. One example of this is when a project requires wetlands
review through the conservation commission. The Wetlands Protection Act
Regulations (310 CMR 10) require that anyone planning work in or within 100 feet of a wetland must submit a Notice of Intent to the local conservation
commission. The conservation commission enforces the regulations by issuing
an order of conditions which either denies the project or requires that
certain conditions and mitigating measures by incorporated into the project
design to protect the functions of nearby wetlands and waterways which

include, among others, protection of public and private water supply,
-- prevention of pollution, protection of land containing shellfish, protection 7 \
of fisheries, and protection of wildlife habitat. Such conditions may include
measures to mitigate the short-term impact of construction and other measures 1 . to mitigate long-term changes in runoff quantity and quality. A common order
of condition prevents new developments from increasing the peak runoff rate of
a parcel of property. With this restriction, new developments are required to
construct stormwater retention/infiltration basins and/or leaching fields.
These facilities could be designed to infiltrate runoff into the ground, and
prevent direct discharge to the receiving waters. The facilities are designed
for a particular runoff event (e.g. 50 yr. storm), and allow no more than the
existing peak runoff to be discharged. This type of regulation would be
easier to enforce since the hydrologic calculations are more directly computed
and less debatable than pollutant loading calculation. Infiltration
facilities must be used with caution, however, in areas of critical
groundwater supply resources. In general, with the requirement that retention !
facilities be designed to infiltrate runoff, the effectiveness in reducing I
bacteria and nutrient loading would be enhanced. Although projects not -. regulated under the Wetlands Protection Act could not be reviewed, this could
still be an effective strategy in Bourne due to the ACEC designation and the
fact that the projects of greatest concern are likely to be within the
100 foot buffer zone of the receiving waters. Planning board review of other - -
proposed developments, as well as MEPA review, may allow further opportunities , -
for town input on pollution control requirements.
It seems appropriate to initiate development of a "standard order of 'l k , l ' * \ (At ' r /
conditions" for use by town agencies which could be quickly implemente and
used when appropriate. Such a condition could be patterned after the common
hydrologic condition aimed at preventing increased runoff, however it could be
modified to be more specific to pollution control. Potential conditions may
include requirements for sumps and oil/gasoline traps, and inspection and
maintenance. A longer term objective would be to develop specific new by-laws
to control such activity.
Subsurface Disposal Systems - On-site wastewater disposal is currently regulated by Title V: minimum requirements for the disposal of sanitary sewage
(310 CMR 15.00). Title V governs the siting, design and construction of
septic systems and is administered by local boards of health. Although local-
boards of health may adopt stricter regulations than those of Title V such as 1 I
a local bylaw requiring inspection of on-site systems, it is often a difficult ' process due to local politics and the tough situation of enforcing regulations 1
against one's neighbors. In general, enforcement, proper care and i 7
maintenance, rather than stringent regulation, are the best means to assure
that such systems will serve the purpose intended and prevent danger to public --_
health and the environment (DEP, 1988). The DEP is currently initiating an
effort to review certain aspects of Title V including system maintenance, setback requirements, and determinatipn of maximum groundwater elevation, and
may ultimately develop revisions to Title V to recommend for promulgation to the commissioner of DEP.
It is generally agreed that local boards, especially boards of health, are
underutilized in enforcing health and conservation regulations. Accordingly, ,- the Division of Water Pollution Control is initiating a program of technical
and legal assistance to local communities on Title V administration and
enforcement.
J,/:9 ac
Marine sanitation devices are regulated by the U.S. Coast Guard shipboard ~4
sewage regulations as well as Massachusetts DEP regulation which requires that
marinas be licensed by the Division of Water Pollution Control and that marine
sanitation pumpout facilities be provided. The Massachusetts regulations,
however, have not been enforced. As a result, there are few pumpout
facilities available to mariners in Massachusetts. Several towns such as
Plymouth have enacted harbor bylaws containing provisions related to shipboard
sewage. Another potential local measure involves development of local
regulations which require the installation of sanitary waste pumpout
facilities at all marinas.

Tax Incentives. Tax incentives involve abatements on taxes to farmers for
establishment of greenways or buffers strips along waterways, or to farmers
and developers for construction of pollution control facilities. Such
incentives are not currently in place through federal or state programs and
are not anticipated. Federal financial assistance for farmers comes in the
form of cost sharing through a number of USDA programs.
State BMP Financing. One potential source of funding for BMPs is through the
Massachusetts Nonpoint Source Program. Although the program was initiated
several years ago, none of the intended $4OO,OOO,OOO have been appropriated
for nonpoint source control projects. On April 14, 1988, Senator Robert A.
Durand proposed legislation for a Massachusetts Nonpoint Source Pollution
Control Program. The legislation provided seventy-five percent funding for
feasibility studies, design, and implementation of best management practices,
and up to ninety-five percent funding for innovative projects. Although this
program represents an excellent potential source of future funds for
prioritized nonpoint source control projects, there is currently no funding
available.
Local BEiP Financing. Revenues for BMP construction and maintenance may be
creatively generated locally through attachment of stormwater control fees to
a utility bill and by requiring developers to pay in advance for stormwater
facility maintenance. These methods may require local or state regulations
not currently in place. Local financing of BMPs may require a property tax
increase. Stormwater BMPs may gain voter appeal if combined with other public
works projects such as road improvements and maintenance.
Beneficiaries Finance BWs. Construction and maintenance of BMPs may be
financed by those who benefit directly from their positive impact on water
quality. Ideally, this technique would involve an organization to which all
the beneficiaries of water quality improvements must belong. This
organization could collect and administer funds for bacteria control through
stormwater control, lobbying and public education. In the case of Bourne,
this BMP would require the formation of an organization to administer this
effort. Prerequisites would involve extensive coalition building in the town
and considerable education of shellfishermen and town officials.
4-29

Public Education. Public education is an effective means of keeping local
citizens informed of implementation activities and to educate individual
property owners of what contributions they can make to improving local water
quality. Public education could serve to increase residents awareness of
proper system inspection and maintenance. Septic system efficiency can be
improved by reducing the amount of solid waste entering the system. Use of
garbage disposals contributes substantial quantities of organic material and
suspended solids to septic systems, thereby increasing the rate of sludge and
scum accumulation in the systems. Reducing these and other solid wastes from
septic systems will reduce the amount of organic materials and suspended
solids discharged from the systems, and will also provide for a reduction in
nutrient loads from the septic tanks. Additional septic system efficiency is
possible through reduced hydraulic loading. Water saving devices such as
waterless toilets, water-saving showerheads and flush dams for toilet tanks
will help to reduce hydraulic loading thereby reducing discharge of effluent
to groundwater and increasing phosphorus removal. Hydraulic loading can also
be reduced by expanding the septic systems of summer cottages which have been
converted to permanent residences. There are a variety of other household - practices that can be altered to reduce export of bacteria and nutrients from
residential properties including use of low phosphorus-containing detergent,
organic slow-release fertilizer use, and proper grass clipping and leaf
disposal. In addition, education of boat owners could raise awareness of th
water quality impacts of improper discharges of sanitary wastes from holdin
tanks. /A .* ;LJ. ,hPt - ' 1 .- LI LC
Public education could be achieved through public meetings, distribution of
educational materials, seminars, newspaper and TV coverage, and coalition
building. A meeting could be held in the form of a symposium in which a
variety of pollution control related subjects could be discussed. Meetings
could be conducted by the DEP or their consultant with the town and the
watershed association in order to answer questions and present educational
material. Educational materials could be distributed which describe the
nature of water quality problems and behavioral modifications which may help
to alleviate those problems.

Sumsnary of BMP Assessment
A summary matrix of the various BMPts considered for use in the Snell Creek
watershed is presented in Table 4-3. In this table, the BMP1s are compared
against the criteria defined at the outset of the chapter.
Based on the results of this assessment, the following BMP1s are selected for
incorporation into the recommended plan:
Agricultural
- Fertilizer and water management
Urban Runoff
- Infiltration practices at Eel Pond and Phinneys Harbor at Chester Park - Selected source controls through public education
- Regulation and Enforcement - Public Education

TABLE 4-3 (Continued). S W R Y OF IMP ASSESSkEWF
BMP Technical Monetary Factors Water Quality Public and Other NPS Demonstration
Feasibil itv C a ~ i t a l OhM Fund inn Im~rovements Anencv S u ~ ~ o r t Control Efforts Value Comrnen ts
Beneficiaries Financing -
Public Education + Moderate Low + +
+ Complex organizational requirements
+ Builds public awareness and support
+ = Favorable, Present - = Unfavorable, Not Present

REFERENCES
Department of Environmental Protection, 1988. Massachusetts Management Plan.
Division of Water Pollution Control, 1987. Nonpoint Source Outline of Basic Information.
Nonpoint Source
Pollution: An
Environmental Protection Agency, 1974. Water Quality Management Planning for Urban Runoff .
Environmental Protection Agency, 1987. Setting Priorities: The Key to Nonpoint Source Control. Office of Water Regulations and Standards.
Environmental Protection Agency, 1987. Guide to Nonpoint Source Pollution Control.
Metcalf & Eddy, Inc. 1989. Buttermilk Bay Stormwater Control Demonstration Project, final Design Drawings and Specifications. Electric Avenue Beach Leaching Facilities Design.
Morehouse R., 1988. Ready Reference Guide to Nonpoint Source Pollution - Sources, Pollutants, Impairments - Best Management Practices for the New England States.
Roesner L.A., B. Urbonas and M.B. Sonnen, 1989. Design of Urban Runoff Quality Controls. Proceedings of an Engineering Foundation Conference on Current Practices and Design Criteria for Urban Quality Control.
Soil Conservation Service, 1989. Field Office Technical Guide.
Soil Conservation Service, 1984. Massachusetts Agricultural Water Quality Study .
Soil Conservation Service, 1987. Interim Soil Survey Report, Barnstable County, Massachusetts: Cape Cod Conservation District.
Southeast Regional Planning and Economic Development District , 1989. Sample Bylaws and Regulations.
Metropolitan Washington Council of Governments, Department of Environmental Programs. 1987. Controlling Urban Runoff: A Practical Manual For Planning and Designing Urban BMP's.
U.S. EPA. 1982. State-of-the-Art Review of BMPs for Agricultural NPS Control. 11. Commercial Fertilizer.
State of Maryland, Department of the Environment, 1984. Standards and Specifications for Infiltration Practices. Stormwater Management Administration.
Soil Conservation Service, 1987. Interim Soil Survey Report, Barnstable County, Massachusetts. Cape Cod Conservation District.

CHAPTER 5
NONPOINT SOURCE MANAGEMENT PLAN
This chapter integrates the steps required to implement the best management
practices recommended in Chapter 4. Each BMP is described and information is
also provided on critical elements of BMP implementation including:
Responsibilities of the municipality, DEP, consultants, and other involved parties
Implementation schedule including planning, design, construction, and monitoring
Cost estimates for design, construction and monitoring
In addition, institutional and regulatory aspects of the implementation are
discussed including consistency with local, state, and federal regulations;
funding sources; and permitting requirements.
Reconmended Plan ,-
The recommended plan for the watershed of Phinneys Harbor consists of several
major elements including:
Enhance existing water quality sampling programs
Implement agricultural best management practices at the Alden and Baptiste cranberry bogs
Implement stormwater best management practices at Beach Boulevard and Burtonwood Avenue, Carlton Road and Chester Park
Utilize existing environmental regulations and enact additional local zoning or conservation bylaws oriented toward nonpoint source control
Conduct a public education program
Conduct pre- and post-implementation BMP monitoring and wet and dry weather sampling
Water quality analysis

These recommendations are described in detail in the following sections.
Enhance Existing Water Quality Sampling Programs. As discussed in Chapter 2,
water quality sampling efforts have been conducted by the state and the town
of Bourne. These data allow a general assessment of water quality, but
optimization of sampling program locations, frequencies and par&eters would
allow more quantitative assessments to be made. In order to optimize existing
sampling programs, it is recommended that a sampling protocol be developed for
use by organizations collecting water quality data in Phinneys Harbor and Back
River and that the DEP and the Town of Bourne coordinate to maximize sampling
efforts.
Sampling Protocol - The Bourne Board of Health should adopt a sampling protocol in order to establish a more quantitative water quality database to
supplement that established in previous years. It is recommended that the
town's sampling efforts be expanded to include nutrients and that flow data be
collected where possible. This data collection protocol should be implemented -- immediately and followed for all subsequent sampling including during and
after implementation of BMP's. Sampling information should be recorded in a
format compatible with the database established for this project as described
in Chapter 2, which could easily be adapted to other data management systems
such as STORET, DATATRIEVE, RBASE or DBASE. Field and laboratory data should
be recorded on data sheets similar to that presented in Appendix B with data
fields including:
Collection Program
Sample Number
Laboratory Number
Station Number
Date Collected
- eg. Massachusetts Shellfish Monitoring Program
- Program Specific
- Program Specific
- Station number should be consistent with . past programs and a graphic and verbal
description of the station should be recorded

Time Collected
Date Analyzed
Sampling Technique
Tide Stage
Parameter
Concentration
Units
Flow
Rainfall
Laboratory
Analytical Technique
Comments
- Grab or Composite
- Low, High, Flood, Ebb
- Refer to parameter code list in Appendix B
- Of Constituent
- Milligrams per liter for conventional parameters and #/I00 milliliters for bacteria analysis
- As recorded at the time of sampling in cubic feet per second or in liters per second as appropriate for extreme low flow conditions
- Record rainfall on the day the sample is collected and on the previous day
- Indicate the name of the laboratory that conducted the analysis
- EPA or Standard Methods identification number and detection limits
- Any special comments related to field conditions or observations
New sampling procedures should be adopted to ensure the representativeness and
comparability of the data sets being assembled. Representativeness is defined
as the extent to which data define an environmental condition. In order to
achieve this goal, samples must be collected at consistent locations, and
accurate flow and weather conditions must be recorded. Data sets being
collected at different times and places by different groups using the same
procedures can be made comparable by coordinating efforts. The ability to
compare data sets is particularly critical when a set of data for a specific
parameter is applied to an action level, permit limits, criteria or standards
( Fairless and Bates, 1989). For example, appropriate detection limits should

be selected to insure that field program objectives are met. Field samplers
must be familiar with the objectives of the sampling program so that
appropriate logical choices can be made in response to changing field
conditions. Exact station locations must be selected to facilitate flow
measurements and sampling station locations should be marked on a map.
Interagency Sampling Effort Coordination - It is recommended that the DEP and the Town of Bourne attend a meeting to maximize sampling efforts. Through a
meeting and a tour of the area, the group could agree on exact sampling
locations, coordinate sampling schedules to distribute sampling temporally to
avoid duplication of effort, and coordinate maintenance of the database
established by the Bourne Board of Health.
Agricultural Best Management Practices. As discussed in Chapter 3, recent studies on the impact of cranberry bogs on water quality are not conclusive
and impacts may depend on practices at individual bogs. Due to potential
impacts on Back River and Phinneys Harbor from cranberry bogs, it is
recommended that agricultural best management practices be implemented at the - Alden and Baptiste cranberry bogs. In this section, conceptual plans,
developed in close consultation with the Soil Conservation Service, are
outlined for each operation.
Alden Cranberry Bog - Mr. John Alden and the Soil Conservation Service have developed an agreement to implement conservation measures on this 14-acre
cranberry bog. The plan, depicted in Figure 5-1, involves measures to retain
water and consists of a five acre-foot water impoundment reservoir to be used
to store floodwaters for pest management and as a tailwater recovery system to
store and retain pesticide and nutrient contaminated water. The pond will
also serve as a reservoir for irrigation management and frost protection. The
components of the tailwater recovery system include conveyance pipe, water
control strictures, transfer pipe and a bypass canal. The Soil Conservation
Service is currently conducting detailed design of the reservoir and the
tailwater recovery system. Construction of the impoundment reservoir is
planned in spring of 1990 with the water control structures, transfer pipe

300
-O SCALE IN FEET
FIGURE 5-1. ALDEN CRANBERRY BOG SCHEMATIC RECOMMENDED PLAN

and appurtenances in the summer and fall of 1990. The Soil Conservation
Service estimates the cost of this construction at $32,000 (Liptack, 1989).
Baptiste Cranberry Bog - During development of this conceptual plan, Mr. Peter Baptiste was contacted by the Soil Conservation Service to investigate his
interest in implementing conservation measures on his cranberry bog. Although
he was not available for a meeting due to his work schedule, he expressed
interest and stated that he would be able to meet in the future. On
August 23, 1989 Metcalf & Eddy and the Soil Conservation Service conducted a
site visit to investigate opportunities for water management. As with the
Alden bog, there appear to be a number of opportunities to improve water
retention including construction of an impoundment reservoir and upgrades and
modifications to water control structures and the irrigation system. The
water retention pond could be used to collect and reuse pesticide and nutrient
contaminated water. Water control structures and the irrigation system could
be modified to provide more efficient control and retention of water in the
upper bogs for nutrient control.
During the site visit, it was apparent that several of the cranberry bogs were
contiguous with emergent freshwater wetlands. This does not allow separation
of irrigation water for fertilization and pest control from other surface .
waters entering Back River. One method of achieving this separation is
through construction of low flow dikes between the cranberry bogs and adjacent
wetlands. This method, however, would be expensive and could result in
significant adverse wetland impacts. Figure 5-2 depicts a conceptual design
for this bog, developed in close consultation with the Soil Conservation
Service, including three water control structures, a water impoundment
reservoir and two low flow dikes.
It is recommended that the Soil Conservation reestablish contact with
Mr. Baptiste, conduct a site visit with him to obtain information on the
details of his operation, and discuss methods of controlling nutrient export
from the bog. It is recommended that an agreement be developed between him
and the Soil Conservation Service to implement best management practices. In
order to keep this bog on a schedule consistent with the Alden bog,

WATER CONTROL STRUCTURE
BAPTISTE CRANBERRY BOGS
SCALE IN FEET BACK Rl VER
FIGURE 5-2. BAPTISTE CRANBERRY BOGS SCHEMATIC RECOMMENDED PLAN
M t T C A L F A c o o v

Mr. Baptiste should be contacted immediately and water control structures and
- irrigation improvements should be implemented during 1990, if possible. Due to the wetland impacts associated with construction of the low flow dikes,
careful fertilizer management should be used to control release of nutrients
to the adjacent wetlands. Costs were not developed by the Soil Conservation
Service due to lack of design information. However, absent the low flow
dikes, these improvements are very similar to the measures being developed for
the Alden Bog and will likely cost at least $30,000.
Stormwater Best Management Practices. There are three drainage systems
directing runoff into the surface waters of Phinneys Harbor and Back River.
The recommended plan to reduce bacteria and nutrient loading from these
sources includes using dry wells and leaching galleys to promote infiltration
of rainfall and reduce direct discharges to surface waters. The recommended
plans for areas adjacent to Eel Pond and Phinneys Harbor require the design of
structural modifications to the existing drainage systems. These designs are
based upon a one inch/hour intensity, 1/2 hour duration rainfall event. In an
EPA-sponsored study, Water Quality Management Planning for Urban Runoff (EPA,
, -. 1974), it was found that during the first 1/2 inch of rainfall an intensity of
one inch/hour for 30 minutes is considered sufficient to remove 90 percent of
pollutants from pavement. Also, over 90 percent of the rainfall events
occurring produce less than one inch of precipitation and even fewer have
intensities greater than one inch/hour. Therefore, designing the infiltration
systems for this one inch/hour intensity and providing overflows for greater
intensity storms results in treatment of more than 90 percent of the rainfall
runoff. In addition, an urban runoff BMP manual from the Metropolitan
Washington Council of Governments (1987) states that designing infiltration
structures for a one inch/hour storm results in 90 percent removal of bacteria
from runoff. Thus, these structures are sufficient for effective pollutant
removal and are significantly smaller than structures designed for 10-year or
25-year design storms. Conceptual design information for storm drain
. improvements in three areas of the watershed of Phinneys Harbor is provided in
the paragraphs below.

Beach Boulevard/Burtonwood Avenue - The drainage system outleting to Eel Pond -- between 50 and 52 Beach Boulevard consist of two catchbasins located on Beach
Boulevard at its intersection with Burtonwood Avenue. These two catchbasins
collect runoff from approximately 2.5 acres of residential land directly west
of Eel Pond and discharge it directly to the surface water. The recommended
plan for this drainage system involves adding a dry well sized to detain the
runoff resulting from the first 1/2 hour of a one inch/hour storm. As shown
in Figure 5-3, this dry well will be placed in the road right-of-way, and the outlet to Eel Pond will be maintained as an overflow during large storms. In
addition, the existing catchbasin outlets should be retrofitted with hoods to
prevent floatables such as oil and grease from entering the dry wells and
clogging the system. These system modifications will provide infiltration of
rainfall thereby reducing the level of pollutants entering Eel Pond.
Carlton Road - The drainage system outleting into the southern end of Eel Pond consists of 14 catchbasins draining the land around Eel Pond Road and Carlton Road. These catchbasins collect runoff from 17 acres of residential land
directly south of Eel Pond. The recommended plan for this drainage system - involves installing dry wells sized using the same criterion as above. As
shown in Figure 5-4, seven dry wells are located throughout the system and
each collects runoff from 500 to 1000 feet of roadway.. The existing drainage
system should be maintained as an overflow system to direct large flows to Eel
Pond. As for Beach and Burtonwood, the existing catchbasin outlets should be
retrofitted with hoods.
Chester Park - Unlike the other two direct discharge drainage systems which discharge to Eel Pond, the Chester Park system outlets directly to Phinneys
Harbor. This drainage system collects runoff from six acres of land
consisting of approximately two acres of commercial land with the balance
being residential. Data from the Bourne Board of Health (1988) indicate that
this drainage system is the largest fecal coliform source in the Phinneys
Harbor watershed.
The recommended plan for this drainage system involves installation of
leaching galleys, dry wells and a gross particle separator. It is recommended
that leaching galleys be installed under the playground area of Chester
5-9

EEL POND
I OUTLET
I I I I I I
WELL CATCH BASINS DW8-HD BEACH BOULEVARD
0 0 i
FIGURE 5-3. REACH ROULEVARDIRURTONWOOD AVENUE RECOMMENDED DRAINAGE MODIFICATIONS

\ EEL POND
/ / FIGURE 5-4. CARLTON ROAD RECOMMENDED DRAINAGE MODIFICATIONS
Park. Since the drainage area has a high runoff rate, it is also recommended
f that dry wells be installed in the two existing catchbasins near the
intersection of Beach Street and Shore Road to treat a portion of the first
flush from the commercial areas of the drainage basin. These dry wells will
be similar in design and function to those used near Eel Pond.
The recommended system configuration is illustrated in Figure 5-5. In
addition to the leaching galleys, this system includes a gross particle
separator for pretreating the runoff and reducing clogging of the system.
This separator removes floatables and promotes settling of suspended
sediments. Therefore, it must be periodically cleaned, usually twice per
year. Figure 5-6 illustrates a typical dry well configuration. Figures 5-7 and 5-8 show a more detailed conceptual plan and cross sections of the gross
particle separator, distribution box and leaching galleys for Chester Park.
As discussed in Chapter 2, the town of Bourne Department of Public Works has
installed various infiltration structures at Electric Avenue Beach as part of
the Buzzards Bay program. This program involved installing dry wells similar - to those recommended for the Phinneys Harbor watershed as well as a gross
particle separator and leaching galleys like those recommended for Chester
Park. By purchasing the necessary materials and utilizing Department of
Public Works personnel to install the Phinneys Harbor watershed infiltration
structures, the town of Bourne can realize a substantial savings over using a
private contractor. Therefore, it is recommended that the installation
procedures used at Electric Avenue Beach also be used within the Phinneys
Harbor watershed. Funding for this recommendation could be sought through the
EPA Buzzards Bay Project Minigrants program should additional funds become
available. Maintenance of the facilities should be conducted by the town.
Regulatory Controls. In order to develop a BMP aimed at preventing increased
pollution loading from proposed development, a two-phased approach is - ? I
recommended. Initially, a standard order of conditions should be developed \,,' -'
which would prevent substantial increases in bacteria load (as well as w
/
nutrient and solids load). Secondly, a bylaw should be developed and
ultimately adopted which would be specific to runoff pollution control. The

I
RAILROAD
PARTICLE MONUMENT AVE SEPARATOR \
DISTRIBUTION BOX
MANHOLE
\ i- - -
LEACHING GALLEYS \
\
RETAINING WALL . , \ \ ' 24' RCP DRAIN OUTLET
FIGURE 5-5. CHESTER PARK RECOMMENDED DRAINAGE MODIFICATIONS

Wash Stone
Precast Concrete Dry Well
PLAN
C.I. / M.H. Frame
and Cover
r
Washed
SECTION A-A
FIGURE 5-6. TYPICAL DRY WELL
lnflue Pipe
Excavation

\ \
Diversion
Gross Particle Separator (See Detail)
F'
Leaching Galley (TYP) 7 r----- -1
I
(See Detail)
C
I Box (See Detail) I I
FIGURE 5-7. CHESTER PARK LEACHING GALLEY PLAN

SECTION A-A t
Dia. Outlets 7 1 314" Walls
.. .;., -'.'.?..:.i-"' : , "- 7,.
SECTION B-B
' a ? ,
SECTION C-C
FIGURE 5-8. CHESTER PARK STRUCTURAL DETAILS

standard order of conditions should be developed by the Bourne Conservation
-- Commission with assistance from the DEP or their consultant. Once developed,
coordination with the conservation commission, board of health, and planning
board would be required to obtain concensus on the intent, wording, and
appropriate instances for its use.
Second, it is recommended that the town consider development of additional
pollution control bylaws. Currently, a pollution control bylaw is under ./& - development as part of the Buzzards Bay project which can be used as a
model. For development of a town bylaw, it is proposed that the Massachusetts
CZM, in conjunction with the Buzzards Bay program as well as other shellfis
regulations could provide a model for most coastal areas in the
3 protection efforts, be responsible for drafting language. These proposed
Commonwealth. Taking this approach, involved communities such as Bourne would
then be given an opportunity for review and input. Finally, the town itself
would be responsible for its adoption, with any appropriate changes. In
addition, it is recommended that the town of Bourne review and scrutinize the
potential means of water pollution control outlined in Table 4-2 as well as - the specific suggestions outlined in Chapter 4 to assist in developing an
appropriate set of local pollution control bylaws.
Public Education Program. Although no septic system outbreaks were discovered
during field reconnaissance efforts, many septic systems in the area are not - -
in compliance with Title Y, Occasional outbreaks and gi;oundwater iipa- \__ .__
could be reduced by proper maintenance of septic systems and by improved &
practices in the home. Short of a mandatory program of septic tank
maintenance, improved maintenance could be accomplished through a public
education/outreach program. Since it would be impractical to approach only
residents in the watershed of Phinneys Harbor, it is recommended that a
town-wide education program be conducted. The recommended public education
program would consist of:
A public meeting
Distribution of education materials

Media coverage through newspaper articles and cable TV, and
Coalition building through the Bourne Board of Health and local environmental groups like the Monument Beach Civic Association and the Coalition for ~uzzards Bay
Through surveys conducted under the Massachusetts Clean Lakes Program, septic
tank owners frequently are not aware that their system is undersized or that
it should be cleaned and inspected on a regular basis. Proper septic system
use and maintenance is of particular concern. Poor household practices often
contribute to system failure or overload; a few examples are indicated as
follows. Cooking grease can be containerized in regular household refuse;
paper products, tissues, plastic wrap and aluminum foil also can be disposed
of in the home garbage. White toilet paper should be used instead of colored
tissue, because the latter inhibits bacterial processes. Hazardous and toxic
household substances (e.g., paints, solvents, disinfectants, lubricating oil,
medicines, etc.) should never be placed into the on-site system, and should be
disposed of at an acceptable off-site location. Large quantities of vegetable
and fruit waste and coffee grounds should go into the home garbage or be 4 f,,
composted. C.I L ~ L 1 " re/ F
\ I 1 , ,, 2 '4
f 8
A public meeting could be held in Bourne in the form of a symposium on water
quality to educate septic tank owners on harmful activities, such as improper
garbage disposal use, and on means of reducing hydraulic loading such as
water-saving showerheads, and proper maintenance procedures, including regular
pumping and inspection. Additional subjects that could be addressed as part
of the symposium include:
A demonstration project update to.report on the status of implementation of other recommendations by the Division of Water Pollution Control.
An update on other pollution control efforts ongoing in the town by the Bourne Board of Health
An update on the Comprehensive Conservation and Management Plan being prepared for Buzzards Bay by Coastal Zone Management
An update on the development of the Massachusetts Nonpoint Source Program by the Division of Water Pollution Control

- The meeting/symposium could be organized by the Division of Water Pollution
Control or their consultant with assistance from the Bourne Board of Health
and Selectmen's Office, and the Monument Beach Civic Association. The meeting
or symposium should be advertised by local and regional newspaper articles;
newsletters such as EPA's Buzzards Bay Project newsletter and CZM's
Coastlines; notification of project advisory group members and town officials;
posting in public buildings; and through cable TV advertising and coverage.
Additional public outreach can be achieved through distribution of educational
materials. Previously prepared materials which could be used directly or
adapted for use in Bourne include documents prepared by the New Jersey
Department of Environmental Protection (1987) as recently adapted by the
Westport River Watershed Alliance for use in Westport, Heufelder ( 1989), and
the Lake Cochituate Watershed Association (1985). These materials could be
prepared by the DWPC or its consultant with assistance from the Bourne Board
of Healthi and should describe the natuce of local water quality problems and
behavioral modifications that could help to alleviate these problems such as - septic tank maintenance, reduced water consumption and solids loading. These
educational materials could be distributed town-wide using a number of town
and private mailing lists and could be distributed widely as an insert to the
EPA and CZM newsletters described above. Public education can be enhanced by
newspaper articles, cable TV advertising, and coalition building through
cooperation between town departments such as the conservation commission and
health department and local environmental groups such as the Monument Beach
Civic Association.
BMP Effectiveness Sampling. Phinneys Harbor and Back River fecal coliform
bacteria levels increase dramatically during wet weather, resulting in
shellfish standard violations. While ongoing sampling programs will provide
baseline data over some conditions, it is recommended that wet and dry weather
sampling be conducted by the Division of Water Pollution Control, or its
consultant. A detailed protocol should be developed for this sampling effort,
modelled after the protocol developed earlier in this section for routine
sampling programs, with the following amendments: -
5-19

Sample multiple stations within Phinneys Harbor and Back River
Sample suspected sources (such as stormdrains at Eel Pond and Chester Park) and in receiving waters in these areas
Conduct sampling of sources at regular intervals including the first flush and for a period before, during, and after a storm event
Analyze samples for bacteria and nutrients
The wet weather data will be used for source quantification and BMP
effectiveness evaluation, and will allow calculation of wet weather loading to
Phinneys Harbor and Back River. Dry weather sampling will provide baseline
data on nutrient concentrations not available in the existing database. In
order to provide data before and after BMP implementation in the vicinity of
suspected sources, it is recommended that water quality samples be collected
at the three stormdrains recommended for modification, near the outlets of the
two cranberry bogs, in the vicinity of suspected septic tank problems and near
the marina in Phinneys Harbor. During wet weather, samples should be
collected at regular intervals at each station for a minimum of 4 to 8 hours - depending on the size of the storm. Samples should be properly preserved and
handled and should be analyzed for bacteria, nutrients, and solids. Flow data
should also be collected at the stormdrains at each sampling interval.
Samples should be collected on two wet weather and two dry weather occasions
prior to implementation and during similar meteorological conditions on two
occasions after implementation.
The sampling recommendations outlined above should be implemented as soon as
is practical. A suggested schedule is outlined later in this chapter. These
efforts could be conducted by the DEP, through a cooperative interagency
effort, or through a contract with a consultant. The sampling effort could be
supplemented by other agencies already conducting regular sampling by
adjusting sampling schedules to collect pre- and post-storm routine samples,
and by providing a local meeting place from which to deploy workers and to
drop-off, composite and preserve samples.

Water Quality Analysis. Following collection of routine water quality samples
before and after construction, as well as pre- and post-implementation wet and
dry weather sampling, it is recommended that these data be analyzed. Flow
measurements and grab samples collected during this period will allow
refinement of loading estimates and will allow an assessment of the success of . the recommended pollution control measures. It is recommended that this
analysis be conducted by the Division of Water Pollution Control or its
consultant.
Implementation Responsibilities
In order to implement the recommendations described in this chapter, extensive
cooperation and coordination will be required. Proposed
responsibilities for each major component of the program
Table 5-1.
implementation
are summarized
In order to initiate the implementation phase of this project, several
administrative actions must be conducted by the DEP. One administrative task
- that may be vital to the implementation of all the recommendations described
herein is the development of a memorandum of understanding establishing an
interagency agreement on specific implementation and funding
responsibilities. This agreement would include water quality sampling,
analysis and management; design and coordination of agricultural BMPs; design,
permitting, construction supervision, and maintenance of stormwater BMPs;
public education; and reporting.
Cost Estimates
Preliminary cost estimates have been prepared for each of the major program
components described in this chapter and are presented in Table 5-2. Tasks to
be conducted by existing programs have not been assigned costs.

TABLE 5-1. IMPLEMENTATION TASKS AND RESPONSIBILITIES
Task Responsibility
Administrative
Overall Program Coordination
Develop Interagency Memorandum of Understanding
Water Quality Sampling and Analysis
Continue Sampling in Phinneys Harbor and Back River
Conduct Interagency Sampling Coordination Working Session
Maintain Database for Phinneys Harbor and Back River
Conduct BMP Effectiveness Sampling
Water Quality Analysis
/- Agricultural Controls
Develop Water Quality Management Plan for Alden and Baptiste Cranberry Bogs
Install Cranberry Bog BMPs
On-Site Coordination and Follow-up at Bogs
Stormwater Controls
Designs, Specifications, and Permitting for Storm drain Modifications
Division of Water Pollution Control
Division of Water Pollution Control
Division of Water Pollution Control Bourne Board of Health Division of Marine Fisheries
Division of Water Pollution Control
Division of Water Pollution Control Bourne Board of Health
Division of Water Pollution Control
Division of Water Pollution Control
Soil Conservation Service
Mr. John Alden Mr. Peter Baptiste
Soil Conservation Service Agricultural Stabilization and Conservation Service
Division of Water Pollution Control Town of Bourne

TABLE 5-1 (Continued). IMPLEMENTATION TASKS AND RESPONSIBILITIES
,- Task Responsibility -- -- - -
Construct Storm drain Modifications Bourne Department of Public Works
Maintenance of Catch Basins, Leaching Galleys and Dry Wells
Institutional/Nonstructural Controls
Develop Pollution Control Bylaws and Standard Order of Conditions
Prepare and Distribute Educational Materials
Public Meeting/Symposium
Prepare Press Releases -
Bourne Department of Public Works
Coastal Zone Management Bourne Conservation Commission and Planning Board
Division of Water Pollution Control ~nvironmental Protection Agency Monument Beach Civic Association
Division of Water Pollution Control Monument Beach Civic Association Town of Bourne - all Boards Coalition for Buzzards Bay Environmental Protection Agency Coastal Zone Management
Division of Water Pollution Control
Schedule
The overall schedule of activities for the implementation phase is outlined in
Figure 5-9. The schedule includes water quality sampling and analysis, design
and construction, maintenance, monitoring, public education, and regulatory
activities.
Regulatory Requirements
This section outlines regulatory requirements associated with the recommended
plan. Since no fill is being placed in wetlands or waterways and since no
federal permits are required, the only permit that will be required for this
project will be an order of conditions for work in the buffer zone and banks
of the cranberry bogs as well as coastal beach and bank for work at Eel Pond
and Chester Park. Neither MEPA nor NEPA compliance is anticipated to be
necessary.

TABLE 5-2. COST ESTIMATES FOR PROGRAM COMPONENTS
Estimated Cost I tem ($1
Water Quality Sampling and Analysis
Continue Sampling in Phinneys Harbor and Back River
Conduct Interagency Sampling Coordination Working Session * Maintain Database for Phinneys Harbor and Back River
Conduct BMP Effectiveness Sampling
Water Quality Analysis 16,000
Agricultural Controls
Develop Water Quality Management Plan for Alden and Baptiste Bogs 2,000
Conduct Educational Activities 2,000
Install Agricultural BMPs
Alden Bog Baptiste Bog
On-Site Coordination and Follow-up
Stormwater Controls
Design -- Engineering Design, Plans, Specifications Obtain Permits
Construction Materials Labor
Construction Supervision
Maintenance
Institutional/Nonstructural Controls
Develop Pollution Control Bylaw and Standard Order of Conditions * Prepare and Distribute Educational Materials
Public Meeting/Symposium
Prepare Press Releases
(1) Rough estimates based on discussions with Soil Conservation Service.
(2) Annual Cost

TASK
WATER QUALITY SAMPLING AND ANALYSIS
CONTINUE SAMPLING PROGRAMS INTERAGENCY WORKING SESSION MAINTAIN DATA BASE BMP EFFECTIVENESS SAMPLING WATER QUALITY ANALYSIS
AGRICULTURAL CONTROLS
DEVELOP MANAGEMENT PLANS EDUCATIONAL ACTIVITIES INSTALL AGRICULTURAL BMPs FOLLOW-UP *
STORMWATER CONTROLS
DESIGN AND SPECIFICATIONS OBTAIN PERMITS CONSTRUCT DRAINAGE MODIFICATIONS MAINTENANCE
INSTITUTIONAL I NONSTRUCTURAL CONTROLS
DEVELOP BYLAWS PREPARE EDUCATIONAL MATERIALS PUBLIC MEETING I SYMPOSIUM PRESS RELEASES
FIGURE 5-9. IMPLEMENTATION SCHEDULE

REFERENCES
Heufelder G., 1989. Pollution Sources in Buttermilk Bay, Keeping it All in Perspective. EPA Buzzards Bay Project.
Lake Cochituate Watershed Association, 1985. Septic Systems and Your Lake.
Soil Conservation Service, 1989. Personal communication with Bernadette Taber .
New Jersey Department of Environmental Protection. 1987. The Clean Water Book: A Guide to Reducing Water Pollution in Your Home and Neighborhood.
Fairless B.J. and D.I. Bates, 1989. Estimated the Quality of Environmental Date. Pollution Engineering.
Metropolitan Washington Council of Governments, 1987. Controlling Urban Runoff: A Practical Manual for Planning and Designing Urban BMPs.
Environmental Protection Agency, 1974 Water Quality Management Planning for Urban Runoff .
Liptick, D., 1989. Correspondence between D. Liptack (Soil Conservation Service) and P. Boucher (Metcalf & Eddy, Inc.).