Embed Size (px)
Citation preview

XI International Conference on Computational Plasticity. Fundamentals and Applications
COMPLAS XI
E. Oñate and D.R.J. Owen (Eds)
NON-LINEAR FINITE ELEMENT ASSESSMENT ANALYSIS
OF A MODERN HERITAGE STRUCTURE
STEFANO SORACE* AND GLORIA TERENZI
†
* Department of Civil Engineering and Architecture
University of Udine
Via delle Scienze 208, 33100 Udine, Italy
e-mail: [email protected]
† Department of Civil and Environmental Engineering
University of Florence
Via di S. Marta 3, 50139 Florence, Italy
e-mail: [email protected]
Key words: Non-linear Finite Elements, Structural Assessment, Steel, Reinforced Concrete,
Buckling, Smeared Cracking.
Abstract. A synthesis of a non-linear finite element structural assessment enquiry carried out
on a monumental modern heritage building is reported in this paper. The study includes a
buckling analysis of the slender steel beams constituting a mushroom-type roof, and an
―integral‖ seismic pushover analysis of the supporting R/C columns. The computational
solutions obtained for the steel roof beams are compared to the results derived from a
calculation of the critical stress of beam panels, and the global lateral-torsional buckling
resistance of members developed according to the Technical Standards adopted for structural
verifications. The unconventional ―full-cracking‖ pushover application to the R/C columns
offers detailed simulation of the evolution of their non-linear response, which is discussed in
the paper, along with the most significant parameter and procedure choices made in the
analysis.
1 INTRODUCTION
Non-linear finite element approaches are suggested in the latest generation of international
Technical Standards as preferential analysis methods for the static and seismic assessment of
existing structures. This prompts an extension of the use of non-linear models and calculus
programs, which are typically conceived, developed and implemented in the academic
community for research aims, to the professional community of structural engineers. An
important role can be played by academicians also at this challenging phase, where a critical
review of the theoretical options and of the limits of available models, as well as an expert
guidance to their practical application, are urged by professional users.
A study in this field is currently being carried out by the authors within a National
Research Project, financed by the Italian Ministry of Education and University and dedicated
to the historical and structural analysis of Italian modern heritage architecture built in the
brought to you by COREView metadata, citation and similar papers at core.ac.uk
provided by Florence Research

Stefano Sorace and Gloria Terenzi.
2
1950s and in the 1960s. Special care is devoted in this paper to a representative masterpiece
building, the ―Palazzo del Lavoro‖ in Turin, designed in 1959 by the world-famous Italian
engineer Pier Luigi Nervi, and completed in 1961. The main structural elements of the
building consist of sixteen monumental reinforced concrete (R/C) columns, 20 m high, and
sixteen supported steel mushroom roof panels, each covering an area of 40×40 m×m. The
building includes other monumental structural members, and namely the R/C ribbed slabs
typical of Nervi’s style, which constitute the two perimeter gallery floors, and the continuous
gallery-to-roof glass façades. External views of the building at the time of its opening and in
its current conditions; the plans of the roof and upper gallery floors; the elevation design
drawing and a view of a mushroom steel roof panel and relevant R/C column, are shown in
Figures 1, 2 and 3, respectively.
Figure 1: External views of the building at the time of its opening and in its current conditions
Figure 2: Plans of the roof and the upper gallery
Figure 3: Elevation design drawing and view of a mushroom steel roof panel and the supporting R/C column

Stefano Sorace and Gloria Terenzi.
3
Linear elastic finite element analyses of these structural elements taken separately, as well
as of the entire building, were initially carried out to evaluate their static and dynamic
characteristics, and to check their current nominal safety conditions [1]. Based on the results
of this first-level assessment analyses, a second-level step was then undertaken, aimed at
carefully evaluating the structural performance of the two most important types of members,
i.e., the steel roof beams and the R/C monumental columns. This new section of the numerical
study posed two representative problems of non-linear geometrical—steel beams—and
material—R/C columns—type, respectively.
A local and global buckling analysis was developed for the roof beams, in order to
investigate the instability effects arising from their very slender sections. Similarly to many
other finite element commercial codes, the SAP2000NL [2] program used for this analysis
produces a not plainly understandable buckling mode calculation, which leaves uncertainties
both on the non-linear geometrical formulation of the problem and the final results. These
aspects were investigated by comparing the computational solutions with the results derived
from the expressions of the critical stress of panels and the global lateral-torsional buckling
resistance of beams provided by the reference Technical Standards on steel structures adopted
for the structural verifications [3-6].
The R/C columns were evaluated with an ―integral‖ seismic pushover analysis of the
numerical model constituted by a full mesh of solid octahedral smeared cracking ―concrete‖
elements with embedded steel reinforcements, generated by the ANSYS non-linear calculus
program [7]. No reductions to simplified models were considered in this enquiry, as the
―uniform resistance‖ columns designed by Nervi should ideally reach the first significant
cracked configurations, and then the plasticization of vertical reinforcements, simultaneously
in several sections along the height. This ―full-cracking‖ application offers a more direct and
realistic simulation of the evolution of the non-linear response of columns as compared to
models including lumped plastic hinges or fiber-composed plastic zones, but it requires a
much greater computational effort, more careful choices of the mechanical and algorithmic
parameters, and proper checks on the stability and accuracy of the solution.
A synthesis of the analyses carried out on the roof steel beams and the R/C columns is
presented in the following two sections.
2 ANALYSIS OF STEEL ROOF BEAMS
The 20 cantilever steel radial beams forming the corolla of each one of the 16 mushroom
panels of the roof have fixed-end bolted connections to a circular drum, constituted by 20
rectangular steel frames, whose height is 2800 mm and whose base is 1900 mm. Each frame
is supported by a triangular steel plate—with a 1500 mm-long vertical side and a 1900 mm-
long horizontal side—placed over a 200 mm-deep groove on the upper section of the R/C
column (Figure 4). The I-section welded beams, which are joined on their free end to a
continuous C-shaped steel edge beam outlining the square perimeter of the mushroom panel,
are 2800 mm to 700 mm high, and their top and bottom flanges are 690 mm to 200 mm wide.
The beams have three different spans, ranging from 15,750 mm (type 1 beams, orthogonal to
the C edge profile) to 20,250 mm (type 3 beams, close to the diagonal of the square). The
constituting steel is equivalent to the current S235JR type, with yielding and ultimate nominal
stress values fy=235 MPa and fu=355 MPa, respectively. The web of the beams is very thin (5

Stefano Sorace and Gloria Terenzi.
4
mm—type 1 through 7 mm—type 3); this determines a high slenderness of cross sections,
especially in the areas close to the fixed end. The web is subdivided in 13 (type 1 beam)
through 17 (type 3) panels by a set of vertical stiffening plates welded to the web and to the
top and bottom flanges. The different web thickness and stiffener spacing values determine a
very similar resistance of the three types of beams to bending and shear stresses, as well as to
local and global buckling, as planned in the original design of the metallic roof (carried out by
engineer Gino Covre, who worked with Pier Luigi Nervi for this part of the building
structure). In view of this, the finite element and verification analyses are synthesized below
for type 1 beams, whose dimensions are reported in Figure 4, as they are also representative
of the remaining two beam types.
Figure 4: Upper section of a R/C column and relevant steel drum, and view of a triangular bearing plate
and a type 1 cantilever beam (dimensions in millimeters)
2.1 Bending and shear resistance and lateral-torsional buckling verifications
The resistance verification to the in-plane bending moment at the ultimate limit states—
carried out by referring to the effective properties of Class 4 cross-sections, to which the
considered members belong according to Eurocode 3 Part 1-1 rules [3]—is not met. Indeed,
the ratio of the design value of bending moment to the corresponding design resistance is
significantly greater than 1 (and it reaches 1.57 for the fixed-end section) along over 3/4 of
beam span. The resistance verification to shear stress is met for all sections. The verification
at the serviceability limit states concerning vertical deflection, developed according to the
current Italian Technical Standards [5] (as Eurocode 3 devolves this specification to the
National Annexes), is widely met too.
The verification of the beams to lateral-torsional buckling was carried out by considering
the only effect of the major axis bending, since the compression axial force induced by the
slope of the center-line of the beams is very low (with a maximum of 22 kN at the fixed-end
section). The relevant verification formula is:
1
M
M
Rdb,
Ed
(1)
where MEd, Mb,Rd are the design value of the moment and the design buckling resistance
moment, respectively, with Mb,Rd expressed as:
1610
23
00
27
5
25
5
+20,0
2500
2200 1390 250 500
28
20
28
21
1887
15750 518 887 938 1046 1149 1158 1289 1325 1492 1556 1629 1641 1015
6 5 4 10 9 11 12 13
3 2 1 7 8

Stefano Sorace and Gloria Terenzi.
5
M1
y
yLTRdb,γ
fWχM
(2)
being Wy=Weff,y for Class 4 sections (Weff,y is computed by determining the effective section
as a function of the reduction factor ρ for the compressed portion of the web and the
compressed flange), fy=235 MPa, as noted above, and γM1=1.05; χLT is given by the following
relation:
2
LT
2
LTLT
LT
λ
1χ
(3)
where 2
LTLTLTLT λ2.0λα15.0 , αLT is an imperfection factor, equal to 0.76 for welded
I-sections with height-to-base ratio greater than 2, cr
y
LTM
fWλ
y , and Mcr is the elastic critical
moment for lateral-torsional buckling evaluated according to the expression in Annex F of
[3]. By applying the relations above, the ratio of MEd (equal to 2414 kNm) to Mb,Rd (1415
kNm) results to be equal to 1.706, and thus the verification inequality (1) is definitely not met.
The unsafety factor is obtained by inverting the ratio between the two moments (Mb,Rd/
MEd=1/1.706), i.e. 0.586.
2.2 Web panel buckling verifications
The web panels are much more sensitive to buckling than the flange plates are, as a
consequence of the high slenderness of the web determined by the geometrical characteristics
of the beams. The verification analysis is carried out in this case by referring to the criterion
proposed in a previous edition of the Italian Standards for steel structures [6], where the
effects of normal and shear stresses are jointly considered, assuming an ideal critical stress
cr,id to be compared to the design ideal stress computed according to the von Mises rule. The
expression of cr,id is derived from the Massonnet normal critical stress–shear critical stress
domain [8] as follows:
2
cr
2
cr
1
cr
1
22
1
idcr,
τ
τ
σ
σ
4
ψ3
σ
σ
4
ψ1
3τσσ
(4)
where 1=130.9 MPa, =20.1 MPa are the design normal and shear stress values;
cr,0σcr σkσ , cr,0τcr σkτ , being
σk , τk the normal and shear stress buckling factors, and
cr,0σ the elastic critical plate buckling stress of the equivalent orthotropic plate, expressed as
22
cr,0h
t
ν)-12(1
Eπσ
, with t=plate thickness and h=plate width (or mean width in case of
variable section); and ψ is a coefficient that defines the linear variation of normal stress over
the section, which can be set as equal to -1 in this case, by neglecting the very little
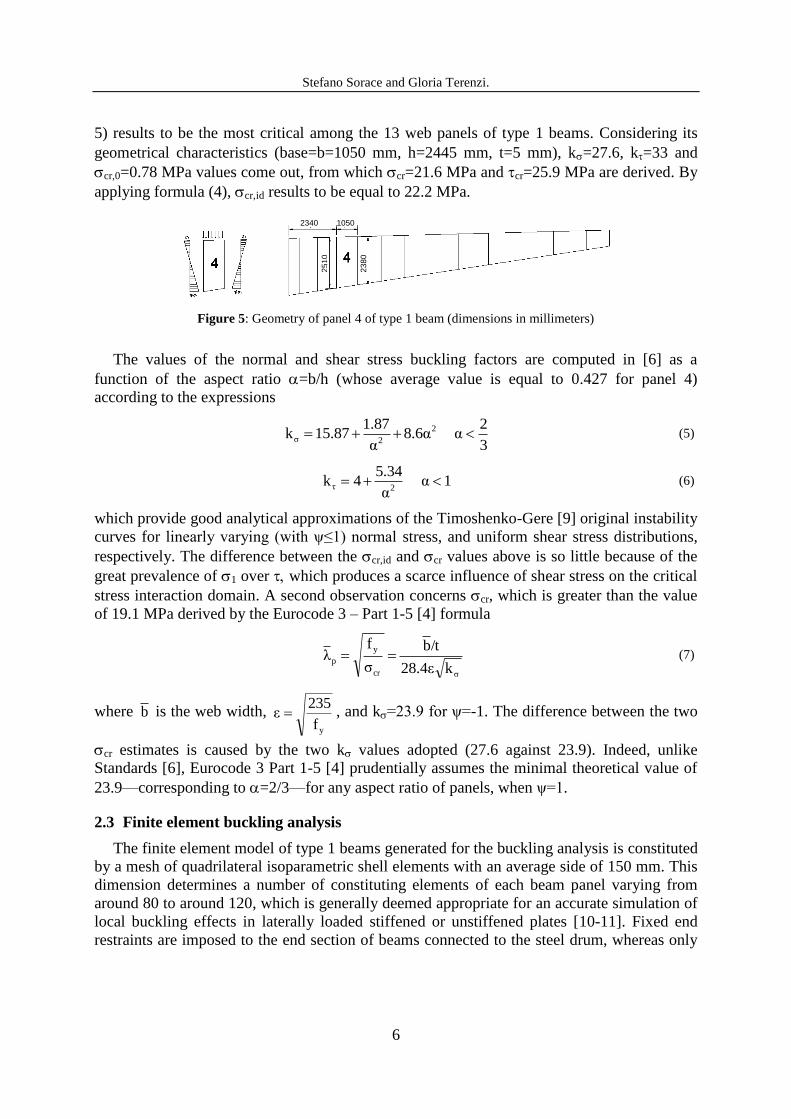
contribution of the axial force to 1, quantified by a normal stress of 1.6 MPa. Panel 4 (Figure
Stefano Sorace and Gloria Terenzi.
6
1050
23
80
25
10
234050
5) results to be the most critical among the 13 web panels of type 1 beams. Considering its
geometrical characteristics (base=b=1050 mm, h=2445 mm, t=5 mm), k=27.6, k=33 and
cr,0=0.78 MPa values come out, from which cr=21.6 MPa and cr=25.9 MPa are derived. By
applying formula (4), cr,id results to be equal to 22.2 MPa.
Figure 5: Geometry of panel 4 of type 1 beam (dimensions in millimeters)
The values of the normal and shear stress buckling factors are computed in [6] as a
function of the aspect ratio =b/h (whose average value is equal to 0.427 for panel 4)
according to the expressions
3
2αα6.8
α
87.187.15k 2
2σ
(5)
1α
α
34.54k
2τ
(6)
which provide good analytical approximations of the Timoshenko-Gere [9] original instability
curves for linearly varying (with ψ≤1) normal stress, and uniform shear stress distributions,
respectively. The difference between the cr,id and cr values above is so little because of the
great prevalence of 1 over which produces a scarce influence of shear stress on the critical
stress interaction domain. A second observation concerns cr, which is greater than the value
of 19.1 MPa derived by the Eurocode 3 – Part 1-5 [4] formula
σcr
y
pk4ε.28
/tb
σ
fλ
(7)
where b is the web width, yf
235ε , and k=23.9 for ψ=-1. The difference between the two
cr estimates is caused by the two k values adopted (27.6 against 23.9). Indeed, unlike
Standards [6], Eurocode 3 Part 1-5 [4] prudentially assumes the minimal theoretical value of
23.9—corresponding to =2/3—for any aspect ratio of panels, when ψ=1.
2.3 Finite element buckling analysis
The finite element model of type 1 beams generated for the buckling analysis is constituted
by a mesh of quadrilateral isoparametric shell elements with an average side of 150 mm. This
dimension determines a number of constituting elements of each beam panel varying from
around 80 to around 120, which is generally deemed appropriate for an accurate simulation of
local buckling effects in laterally loaded stiffened or unstiffened plates [10-11]. Fixed end
restraints are imposed to the end section of beams connected to the steel drum, whereas only

Stefano Sorace and Gloria Terenzi.
7
the lateral displacements are blocked on the tip end section, so as to reproduce exactly the
restraint offered by the perimeter C-shaped edge beam of each mushroom roof panel.
The buckling analysis is developed in SAP2000NL by a classical eigenvalue formulation:
0vKλK GE
(8)
where [KE] and [KG] are the elastic and geometric stiffness matrixes of the structural element
or system, λ is the generic eigenvalue, and {v} is the corresponding eigenvector. The solution
of equation (8) provides the instability factors i and the instability modal vectors {vi}. The
minimum among the i multipliers computed by the program represents the first (or critical)
eigenvalue 1. If 1 is greater than 1, no buckling occurs under the imposed loads.
The first mode buckling configuration of type 1 beams resulting from the analysis,
displayed in Figure 6, highlights that the maximum lateral deformation is achieved in panel 4,
consistently with the analytical assessment predictions.
Figure 6: Deformed shape of type 1 beams obtained for the first buckling mode
The 1 factor is equal to 0.259. By multiplying this value by the maximum von Mises ideal
stress obtained in the central zone of the panel for the first buckling mode deformed
configuration, equal to 90 MPa, the following finite element critical ideal stress estimate
cr,id,FE is deducted: cr,id,FE=23.3 MPa. This value is very close to the cr,id normative estimate
of 22.2 MPa given by formula (4), with a percent difference limited within 5%. Similar
correlations are obtained for the subsequent local buckling modes too (the second mode
achieves the maximum lateral displacements in panel 5, the third mode in panel 3, etc) as the
differences between cr,id and cr,id,FE never exceed 5%.
The seventh and eighth buckling modes are the first two involving a global (lateral-
torsional) instability deformed shape. The maximum lateral displacements and stresses are
reached in the eighth mode, visualized in Figure 7 with an amplification factor of 5000. The
horizontal projection is also plotted in this drawing, showing that the deformed shape
corresponds, as for the seventh mode, to the first theoretical global buckling mode of the
beams. The 8 eigenvalue is equal to 0.524, which must be compared to the unsafety factor
Mb,Rd/MEd=0.586 resulting from the lateral/torsional buckling verification discussed in section
2.1. The difference between the two values is around 12%, and the numerical result in this
case is more conservative than the normative factor estimate.
The data obtained from a computational analysis are always a function of the geometrical
dimensions of the mesh. Mesh-sensitivity was investigated by varying the sides of the shell

Stefano Sorace and Gloria Terenzi.
8
elements by factors 2, 1.5, 0.75 and 0.5 with respect to the reference average dimensions of
150 mm.
Figure 7: 5000-times magnified deformed shape of type 1 beams obtained for the eighth buckling mode
As a general result of this enquiry, no appreciable influence on eigenvalues and
eigenvectors was observed when passing to the most refined meshes. A trend to a progressive
increase of the eigenvalues emerges when increasing the sides (e.g., cr,id,FE in panel 4
becomes equal to 24.1 and 25.3 MPa for mesh factors 1.5 and 2, respectively), even if the
shapes and the hierarchy of buckling modes are kept unchanged. Based on these observations,
the average dimensions assumed for this analysis appear to be the maximum compatible with
the accuracy of the solution, and thus they can represent a credible balance point between the
need to reach accurate results and to constrain the computational effort. Limitedly to this case
study, it can be concluded that the buckling analysis performed by SAP2000NL allows
acceptably estimating the local and global critical buckling conditions of steel beams.
3 ANALYSIS OF R/C COLUMNS
A view of a monumental column during the construction phases of the building, and the
sequence of geometrical sections along its height, are reproduced in Figure 8. As illustrated in
these images, the shape of columns constantly varies from the base (cross-type section with 6
m-long and 1 m-wide sides) to the top (circular-type section, 2.5 m wide). The top section,
reduced to a diameter of 2 m, is prolonged for further 1.6 m to form the groove where the
triangular steel plates supporting the circular drum of the mushroom roof are positioned, as
described in section 2.
Figure 8: View of a column during the construction phases, and sequence of its geometrical sections
DEFORMED BEAM AXIS
UNDEFORMED BEAM AXIS

Stefano Sorace and Gloria Terenzi.
9
The drawings of the R/C sections at the base, at an intermediate height and on top,
displayed in Figure 9, show an inner hole, where a spiral steel staircase to access the roof, and
a conductor pipe are housed.
Figure 9: R/C sections at the base, an intermediate height and the top
As observed in the introductory section, an ―integral‖ seismic pushover assessment
analysis of the columns was carried out in view of their ―uniform resistance‖ design
conception. The model was generated with ANSYS [7] and is made of a full mesh of solid
octahedral ―concrete‖ elements, with embedded steel reinforcing bars that can be freely
oriented with respect to the global coordinate system. A sketch of the geometry of a
―concrete‖ element is shown in Figure 10.
Figure 10: Geometrical representation of an octahedral ―concrete‖ element with embedded reinforcing bars
The Willam-Warnke triaxial failure domain [12]—a three-dimensional view of which in
the space of the principal stresses (xp, yp, zp) normalized to the compressive strength fc,
and a projection of which on the xp–yp plane are displayed in Figure 11—is adopted to
model the ultimate compressive, tensile and mixed compressive-tensile triaxial ultimate
response of the concrete material. The classical Drucker-Prager yield criterion [13] is
assumed by the program for plastic deformations. A bilinear strain-hardening elasto-plastic
behaviour is assigned to reinforcing steel.
Figure 11: Representations of the Willam-Warnke failure domain
Stefano Sorace and Gloria Terenzi.
10
The main mechanical parameters of the ―concrete‖ model are as follows: o=shear transfer
coefficient for an open crack, c=shear transfer coefficient for a closed crack, ft=uniaxial
tensile cracking stress, fc=uniaxial crushing stress, fcb=biaxial crushing stress, Ec=Young
modulus, and c=Poisson ratio. The parameters of reinforcing steel are: fy=yielding stress,
sh=kinematic strain hardening ratio, Es=Young modulus, ands=Poisson ratio. The
parameters that define the surface of the Drucker-Prager domain are: c=cohesion, =friction
angle, and = dilatancy angle. The following values of these quantities were adopted in the
analysis: o=0.3, c=0.85, ft=1.7 MPa, fc=23.8 MPa, fcb=1.2 fc, Ec=35600 MPa, c=0.2;
fy=321.6 MPa, sh=0.015, Es=206000 MPa, s=0.3, according to the characteristics of the
materials; and c=2.12 MPa, =30º, =0º (associated flow rule), from literature suggestions
concerning the plasticity domain for concrete elements [7], [14-15].
The horizontal load for the development of the pushover process was applied to the top of
the column. P-delta effects were taken into account, in view of the expected high maximum
displacements. As for all types of incremental analysis, the critical parameter for the
convergence and the accuracy of the numerical solution was represented by the number of
sub-steps to be developed in the ramped loading process within any single load step, with the
latter fixed at 10 mm. A displacement-based criterion for convergence control was adopted,
with a tolerance of 5%. The following numbers of sub-steps were finally selected, after
several tentative choices: 50 (corresponding to 0.2 mm) for steps 1 through 13, characterized
by moderate cracking effects in the concrete elements; 200 (0.05 mm) for steps 14-27—
extensive cracking in the tension zones; 300 (0.033 mm) for steps 28-70—softening response
phase. These data confirm general suggestions [14] about the preferable values (ranging from
0.1 mm to 0.01 mm) of the displacement increments in full-cracking/crushing problems when
the non-linear behaviour of a significant portion of the model is activated. Further increases of
the number of sub-steps in the more accentuated non-linear response phases did not show any
practical influence on the accuracy of the solution. Indeed, by amplifying the number of sub-
steps by a factor up to 10, that is, by assuming up to 2000 sub-steps for steps 14-27, and up to
3000 sub-steps for steps 28-70, differences no greater than 0.1% on base shear were found.
For the assumed set of mechanical parameters, derived from the original design
documentation of the building, the pushover analysis was concluded at the end of step 70,
corresponding to a top displacement of 700 mm (drift ratio of 3.5%). At the current level of
refinement of the model, this was assumed as the numerically determined structural collapse
condition. The only two parameters not related to the specific characteristics of the
constituting materials—o and c—were varied in their technical ranges of interest (o from
0.2 to 0.4, c from 0.65 to 0.9) to check their influence on response, which resulted to be
negligible.
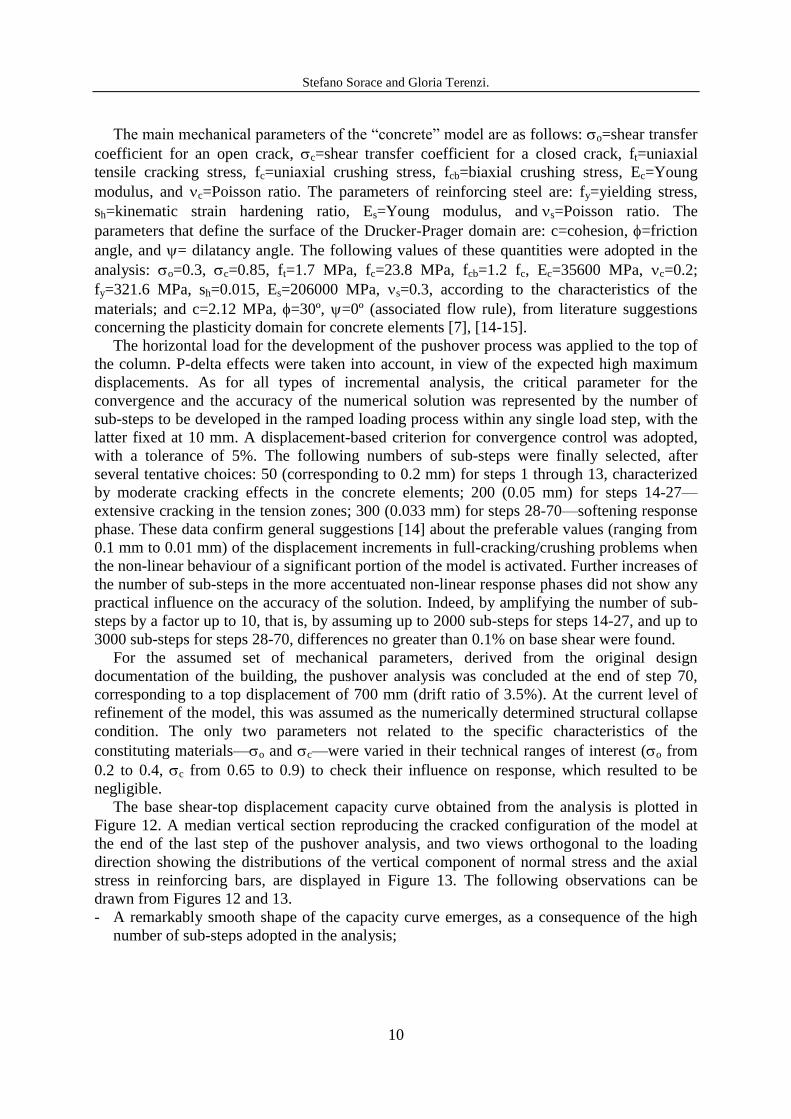
The base shear-top displacement capacity curve obtained from the analysis is plotted in
Figure 12. A median vertical section reproducing the cracked configuration of the model at
the end of the last step of the pushover analysis, and two views orthogonal to the loading
direction showing the distributions of the vertical component of normal stress and the axial
stress in reinforcing bars, are displayed in Figure 13. The following observations can be
drawn from Figures 12 and 13.
- A remarkably smooth shape of the capacity curve emerges, as a consequence of the high
number of sub-steps adopted in the analysis;
Stefano Sorace and Gloria Terenzi.
11
Figure 12: Response curve obtained from the pushover analysis
Figure 13: Cracked configuration of the model, vertical normal stress distribution, and stress distribution in
reinforcing bars at the end of the last step of the pushover analysis
- The curve is rather linear up to around 1500 kN (with top displacement of 20 mm and drift
ratio of 0.1%), that is up to around 60% the maximum base shear, equal to 2390 kN; then,
cracking begins to develop significantly in the elements situated on the tension side, and
the curve visibly gets non-linear elastic;
- This second response phase goes on up to a force of 2200 kN, with corresponding top
displacement of 110 mm (drift ratio of 0.55%), when the first plasticization of reinforcing
bars occurs;
- The plasticization then increases, determining nearly a plateau zone extended from around
250 mm to around 450 mm; the maximum shear force is reached for a displacement of 300
mm (drift ratio of 1.5%);
- A softening branch follows, featuring a strength degradation of around 0.2 kN/mm up to
the last two steps, where the degradation reaches accentuated values of 0.5 kN/mm (step
69) and 2kN/mm (step 70), while it does not mean a sudden drop of strength in proximity
to the numerical solution divergence point;
- Cracking extends rather uniformly over the tension side, whereas crushing is attained only
in very few local elements situated around the inner hole (dark-coloured elements in the
vertical section in Figure 13). This indicates that concrete is far from ultimate strength
conditions on the compression side of the column at the last step of the analysis;
0 100 200 300 400 500 600 700 800 0
500
1000
1500
2000
2500
3000
Top Displacement [mm] B
ase S
hear
[kN
]

Stefano Sorace and Gloria Terenzi.
12
- This is confirmed by the distribution of the vertical components of normal stress, which
shows maximum values no greater than 0.5 fc, in the external fiber of base section;
- Plasticization of reinforcing bars is spread over 2/3 of the height of the column.
These observations highlight that numerical collapse is not determined by the failure of the
constituting materials, but by the excessive deformation of the octahedral elements in various
portions of the mesh. Deformation is not sensitive to the number of sub-steps, which was
increased further to a value of 10000 in the 70th
step to check its possible influence, without
any practical consequences.
The response curve highlights acceptable behavioural capacities of columns, with no
damage for rather high base shear values, and reasonably good ductility resources. A
complete interpretation of the results of the pushover enquiry, based on a formal seismic
assessment analysis, will be presented in forthcoming communications about this research.
ACKNOWLEDGMENTS
The study reported in this paper was financed by the Italian Ministry of Education,
University and Research within the PRIN 2008 Project (Research Programme ―Conceiving
structures: engineering and architecture in Italy in the 1950s and 1960s. A multi-disciplinary
research‖). The authors gratefully acknowledge this financial support.
REFERENCES
[1] Sorace, S. and Terenzi, G. Structural and historical assessment of a modern heritage masterpiece: the
―Palazzo del Lavoro‖ in Turin. Proc. STREMAH 2011, C. Brebbia and L. Binda, Eds., Chianciano Terme,
Italy, WIT Press, Southampton (2011).
[2] Computers & Structures, Inc. SAP2000NL, Structural Analysis Programs – Theoretical and users’ manual,
Version No. 14.03, Berkeley, CA (2010).
[3] Eurocode 3. Design of steel structures. Part 1-1: General rules and rules for buildings. EN 1993-1-1,
Bruxelles (2005).
[4] Eurocode 3. Design of steel structures. Part 1-5: Design of plated structures. EN 1993-1-5, Bruxelles
(2006).
[5] NTC 2008. New Technical Standards for constructions [in Italian]. G.U., Rome, Italy (2008).
[6] CNR 10011. Steel structures – Instructions for design, construction, testing and maintenance [in Italian].
UNI, Milan, Italy (1997).
[7] Swanson Analysis System, Inc. ANSYS, Engineering Analysis System – Theory/users’ manual. Release
10.0, Canonsburg, PA (2010).
[8] Massonnet, C. Rapport sur le theme II C: Poutres de grandes dimensions à âme mince. Proc. 8th
AIPC
Congress, New York, pp. 157-208 (1968).
[9] Timoshenko, S.P. and Gere, J.M. Theory of elastic stability. 2nd
edition. Mc-Graw Hill, New York (1961). [10] Mukhopadhay, M. and Mukherjee, A. Finite element buckling analysis of stiffened plates. Computer &
Structures (1990) 34:795-803.
[11] Chin, C.-K., Al-Bermani, F.G. and Kitipornchai S. Finite element for buckling analysis of plate
structures, Journal of Structural Engineering (ASCE) (1993) 119: 1048-1068.
[12] Willam, K.J. and Warnke, E.P. Constitutive model for the triaxial behaviour of concrete. Proc. IABSE
Seminar on Concrete structures subjected to triaxial stresses, Bergamo, Italy, Vol. 19, pp. 1- 30 (1974).
[13] Drucker, D.C. and Prager, W. Soil mechanics and plastic analysis for limit design. Quarterly of Applied
Mathematics (1952) 10:157–165.
[14] Chen, W.F. Plasticity in reinforced concrete. Mc-Graw Hill, New York (1982).
[15] Borri, A., and Sorace, S. FE analysis strategies for structural materials with small tensile strength. Journal
of Pressure Vessel Technology (ASME) (1993) 115:156-163.


![Mesh Sampling for Finite Element Methodcs229.stanford.edu/proj2019spr/report/89.pdfReferences [1]T.J.R.Hughes, The Finite Element Method: Linear Static and Dynamic Finite Element Analysis](https://img.dokumen.tips/doc/110x75/5f78faed1406ab6bec26f363/mesh-sampling-for-finite-element-references-1tjrhughes-the-finite-element.jpg)