Embed Size (px)
Citation preview
LV-2019-049
Noise monitoring at Geothermal power plantsSummary of noise level measurements 2014-2018


LV-2019-049
Noise monitoring at Geothermal
power plants.
Summary of noise level measurements
2014-2018
Ágúst 2019

MANNVIT | +354 422 3000 | www.mannvit.is | [email protected]
NOISE MONITORING AT GEOTHERMAL
POWER PLANTS
SUMMARY OF NOISE LEVEL
MEASUREMENTS 2014 - 2018
DOCUMENT NUMBER: 5690211-000-HRP-0006
CURRENT REVISION: 1.0
1.0 2019.07.02 IFR GBJ AA GBJ LV
REVISION DATE ISSUE PREPARED
BY
REVIEWED BY APPROVED BY CLIENT

SUMMARY OF NOISE LEVEL MEASUREMENTS 2014 - 2018 DOCUMENT NUMBER: 5690211-000-HRP-00065690211-000-HRP-0006 REVISION NUMBER: 1.0
Copyright © 2019 Mannvit. All rights reserved. │Page i of i
Table of Contents:
1. Introduction ............................................................................................. 1
2. Requirements or prerequisites ................................................................. 1
3. Implementation ....................................................................................... 2
4. Results ..................................................................................................... 4
4.1 Measurements with a handheld sound level meter ............................................................. 4
4.2 Measurements with a fixed logging sound level meter ........................................................ 6
5. Summary ............................................................................................... 10

SUMMARY OF NOISE LEVEL MEASUREMENTS 2014 - 2018 DOCUMENT NUMBER: 5690211-000-HRP-00065690211-000-HRP-0006 REVISION NUMBER: 1.0
Copyright © 2019 Mannvit. All rights reserved. │ 1
1. Introduction This report discusses results from noise level measurements conducted around the geothermal power stations at Krafla, Þeistareykir and Bjarnarflag between 2014 and 2018.
In 2014 the procedures for noise monitoring at Landsvirkjun‘s geothermal power plants in Northeast Iceland, i.e. Krafla, Þeistareykir and Bjarnarflag, was reviewed and subsequently changed. Noise measurements had previously been made manually once a year with a handheld sound level meter at a few predetermined locations. In 2014 a new five-year plan for noise monitoring was devised that involved expanding the scope of the measurements and more detailed reporting of their results.
An automatic fixed logging sound level meter was installed at each of the three geothermal sites, which had not been done previously. Manual measurements made with a handheld sound level meter were continued but measurement locations were reviewed, and the frequency of measurements was increased.
The results of these noise measurements have been reported annually (in Icelandic) since the new arrangement has been in place. What follows is a brief summary of their findings.
Figure 1: At the northern edge of the crater Víti in Krafla, facing south.
2. Requirements or prerequisites The environmental operating licenses for Landsvirkjun‘s geothermal plants stipulate requirements for noise levels that need to be fulfilled.
They state that noise levels should be limited as possible and that care should be taken to prevent noise disturbance in surrounding areas. Noise levels at site boundaries should be within limits as stated in regulation for noise nr. 724/2008 and should not exceed 70 dB(A). Exceptions can be acceptable during temporary operations such as drilling and well production testing.

SUMMARY OF NOISE LEVEL MEASUREMENTS 2014 - 2018 DOCUMENT NUMBER: 5690211-000-HRP-00065690211-000-HRP-0006 REVISION NUMBER: 1.0
Copyright © 2019 Mannvit. All rights reserved. │ 2
Table 1: Limits for noise from commercial activities as stipulated by regulation 724/2008.
LAeq (07-19) LAeq (19-23) LAeq (23-07) LAFmax night
At facade Indoors At facade Indoors At facade Indoors Indoors
Homes in residential areas
50 30 45 30 40 25 40
Industrial and commercial areas
70 70 70
Recreational dwellings
35 35 35 35
Noise limits in residential areas and recreational dwellings are relevant for areas neighbouring the Bjarnarflag power plant. No such areas are close to either Krafla or Þeistareykir.
3. Implementation Noise level measurements have been carried out both manually with a handheld sound level meter as well as automatically with fixed logging sound level meters in each of the years in question. The measurements have been performed in accordance with Landsvirkjun‘s protocol for noise level measurements (Landsvirkjun, 2014). That protocol is based on, and in accordance with, the directions given by The Environmental Agency of Iceland for noise monitoring measurements.
Sound level meters of type Nor140 from Norsonic were used for all measurements.
Figure 2: Nor140 sound level meter.

SUMMARY OF NOISE LEVEL MEASUREMENTS 2014 - 2018 DOCUMENT NUMBER: 5690211-000-HRP-00065690211-000-HRP-0006 REVISION NUMBER: 1.0
Copyright © 2019 Mannvit. All rights reserved. │ 3
Early in 2014 the locations for manual measurements with a handheld sound level meter were revised and for each of the three geothermal sites 7-10 locations were selected. The locations were chosen so that their distribution would be fairly even at the sites, that there were measurements made in the vicinity of operational wells but also further away, near buildings and popular tourist destinations as well as in more remote areas.
Over the five-year period there were no significant problems involved with carrying out the manual measurements. In very few cases a measurement may not have been possible at a certain location, usually because it was inaccessible at the time, but these are rare exceptions.
As previously mentioned, fixed logging sound level meters were installed in each geothermal site. They were initially put in place in the first half of 2014, but it took some time and effort to get them to run properly and return data consistently. As a result, it was not until end of year 2014 that the first noise levels are logged. Measurements continued in the year 2015 but problems with keeping the instruments running and maintaining a stable connection to them persisted. As a result, the logged data has considerable gaps in it, the data from Krafla for example only covering about 2/3 of the year. The reliability of the logging data slowly improved as time went by, but the noise data logged in 2016 was still disappointingly sporadic.
At this point some experience had been gained with regards to operating and downloading data from the instruments. In 2017 certain changes were made to how measured data was stored and accessed as well as how the instruments were monitored. These changes appear to have solved more or less all remaining problems with the setup. Since then the logged data has been almost completely continuous, with measurements recorded for 97% of that period. There have been no appreciable problems with running these instruments in well over two years.
Figure 3: Drilling at Þeistareykir.

SUMMARY OF NOISE LEVEL MEASUREMENTS 2014 - 2018 DOCUMENT NUMBER: 5690211-000-HRP-00065690211-000-HRP-0006 REVISION NUMBER: 1.0
Copyright © 2019 Mannvit. All rights reserved. │ 4
4. Results
4.1 Measurements with a handheld sound level meter
All in all, there have been 570 measurements made manually with a handheld sound level meter in 26 locations in and around the geothermal areas during the five-year period 2014 – 2018.
In four instances the measured sound pressure level exceeded 70 dB(A), once due to excavation work and twice due to blowing geothermal wells being tested in the vicinity. Only once can it not be fully explained why the noise levels measured so high, but even then it is likely due to tourist traffic or similar since the measurement was made at the edge of Víti, a popular tourist attraction.
In all other cases the measured noise levels were below the 70 dB(A) limit, stipulated in the operating licenses and Icelandic regulations.
Results of all manual measurements with a handheld sound level meter can be seen in tables 2 -4.
Table 2: All manual measurements at Krafla, results are in dB(A).
Krafla
Date 1 2 3 4 5 6 7 8 9 Time TempWind
direction
Wind
speed
28.5.2014 35 47 38 45 61 43 53 9°C S 5-6m/s
25.6.2014 48 44 30 41 46 61 43 53 10:15-14:30 16°C S 3-4m/s
28.8.2014 54 43 50 33 48 54 43 56 10:50-14:10 16°C SE 2-6m/s
11.11.2014 41 43 35 47 44 45 42 56 10:10-13:30 3°C E 5-6m/s
18.5.2015 46 40 35 45 44 41 42 55 13:05-16:30 5°C NW 3-5m/s
10.7.2015 53 47 22 37 46 31 43 47 49 16:35-18:45 7°C NW 4-6m/s
17.9.2015 49 45 19 40 59 27 35 51 44 10:10-14:00 6°C NW 1-4m/s
4.12.2015 45 36 25 33 45 36 39 54 38 08:10-13:00 -8°C ESE 3-5m/s
21-22.03.2016 41 37 37 42 43 42 43 55 40 14:29-09:10 3°C NW 1-3m/s
17.5.2016 46 37 28 33 43 33 29 47 28 14:30-18:10 2°C E 2-4m/s
4.7.2016 56 55 52 44 48 34 37 47 51 15:00 10°C NNW 2-7m/s
10.8.2016 51 46 34 44 53 32 43 52 47 10:40-15:00 10°C E 2-4m/s
27.9.2016 53 49 30 45 46 35 31 53 40 14:15-17:30 7,5°C NE 3-6m/s
10.11.2016 33 49 26 42 58 42 42 55 51 08:25-13:10 0°C SSE 1-5m/s
28.2.2017 43 34 26 41 42 25 31 49 26 13:00-16:04 0°C - 0-1m/s
9.5.2017 41 47 25 34 45 27 24 73 35 09:45-13:10 4,5°C SE 2-5 m/s
27.7.2017 48 49 30 46 50 45 48 08:05-11:00 8,5°C NNE 3-8m/s
3.10.2017 46 47 25 45 48 34 32 54 36 08:30 4°C NW 1-2 m/s
11.12.2017 44 43 38 42 40 37 52 35 11:15-15:00 -8°C E 1-2 m/s
28.2.2018 41 35 22 41 42 32 32 50 37 08:05-11:15 2°C - 0 m/s
25.7.2018 56 52 41 45 53 30 27 61 43 08:40-11:45 10,5°C S 1-3 m/s
8.10.2018 40 43 37 43 42 31 46 28 08:00-12:00 0°C SW 1-4 m/s
19.11.2018 45 49 27 39 42 33 28 52 35 10:00-12:10 -1°C SE 1-2 m/s
Location

SUMMARY OF NOISE LEVEL MEASUREMENTS 2014 - 2018 DOCUMENT NUMBER: 5690211-000-HRP-00065690211-000-HRP-0006 REVISION NUMBER: 1.0
Copyright © 2019 Mannvit. All rights reserved. │ 5
Table 3: All manual measurements at Þeistareykir, results are in dB(A).
Table 4: All manual measurements at Bjarnarflag, results are in dB(A).
Þeistareykir
Date 1 2 3 4 5 6 7 Time TempWind
direction
Wind
speed
22.5.2014 28 31 30 50 43 42 - 0 m/s
26.6.2014 28 38 29 55 34 29 13:30-16:00 16°C ENE 3-5m/s
9.10.2014 37 40 38 43 53 57 13:00 6°C NE 5-6m/s
24.11.2014 48 60 34 65 42 51 16:26-18:27 5°C WSW 3-5m/s
26.2.2015 33 53 47 65 41 33 13:45-16:00 -3°C ENE 0-8m/s
13.5.2015 40 41 39 57 50 40 10:26-12:10 1°C S 4-6m/s
14.7.2015 39 48 33 49 52 39 49 9:00-12:10 5°C NE 5-7m/s
2.9.2015 27 29 25 29 53 25 30 8:47-11:55 8°C W 1-3m/s
12.1.2016 42 33 40 35 29 47 49 07:30-11:00 -6°C N 6-8m/s
17.3.2016 39 48 45 55 44 48 51,6 07:55-11:10 0°C S 9-10m/s
18.5.2016 24 29 19 32 50 30 25,2 08:50-11:50 3°C - 0-1m/s
29.6.2016 48 50 43 51 43 48 36,9 09:00-13:20 14°C SSW 0-6m/s
9.8.2016 24 34 26 37 41 38 29 09:05-12:00 6°C S 3-5m/s
27.9.2016 36 44 35 34 46 54 33 09:10-13:30 3°C N 2-4m/s
9.11.2016 26 41 50 52 52 47 52 08:30-12:50 -1°C SSE 1-5m/s
13.2.2017 37 59 56 78 64 53 75 11:30-15:00 3°C - 0-4,5m/s
13.3.2017 65 44 51 63 55 47 63,4 11:35-14:20 1°C SSW 2-9m/s
23.5.2017 40 54 41 44 35 26 38 13:40-16:20 14°C SE 3-5 m/s
26.7.2017 39 45 36 50 40 45 52,9 09:10-12:10 18°C S and SE 3-4 m/s
10.10.2017 46 52 43 46 46 51 08:30-15:30 4°C SE 3-9 m/s
5.12.2017 35 41 36 44 47 08:30-12:50 -1°C SSE 1-5m/s
13.3.2018 30 35 40 46 46 40 42 10:10-13:10 -5°C E 0-2,5 m/s
26.7.2018 39 36 39 49 63 47 42 08:50-11:30 14°C S-SE 2-6 m/s
7.11.2018 33 30 34 56 38 41 - 3°C - 0 m/s
20.11.2018 23 29 27 46 36 34 44 09:00 -2°C SE 1-8,5 m/s
Location
Bjarnarflag
Date 1 2 3 4 5 6 7 8 9 10 Time TempWind
direction
Wind
speed
24.6.2014 50 44 48 46 50 40 29 40 35 47 17°C S 3-4m/s
11.11.2014 42 43 46 40 36 35 25 39 49 49 13:40-16:35 4°C E 3-5m/s
27.5.2015 41 53 46 53 39 38 45 52 50 45 10:15-14:13 4°C NE 3-5m/s
10.7.2015 56 50 53 51 30 51 35 34 30 46 13:40-16:30 6°C NW 3-4m/s
2.9.2015 46 52 46 47 37 42 33 36 29 46 13:23-17:05 12°C NE 2-4m/s
11.1.2016 37 47 41 40 36 42 37 40 35 50 12:50-16:30 -9°C ESE 0-3m/s
21.3.2016 44 41 41 38 37 41 27 33 33 42 08:55-14:21 0°C SE 3-5m/s
17.5.2016 46 43 42 41 32 45 30 41 34 42 10:28-14:25 0°C SE 4-6m/s
4.7.2016 50 52 52 50 40 44 76 38 37 41 10:50 10°C NNW 2-5m/s
8.8.2016 51 51 49 49 40 47 45 45 42 44 10:55-15:30 8°C NW 2-6m/s
28.9.2016 61 48 45 42 39 36 32 37 37 48 10:55-14:55 5°C ESE 2-4m/s
9.11.2016 50 49 50 51 47 38 36 41 50 52 13:20-17:20 -2°C NE 1-4m/s
28.2.2017 44 30 35 32 31 30 29 27 43 09:00-12:00 -2°C N 0-3m/s
16.5.2017 46 54 44 41 41 42 29 35 32 44 12:00-16:55 11°C WSW 3-4 m/s
27.5.2017 41 53 46 53 39 38 45 52 50 45 10:15-14:13 4,2°C NE 3-10m/s
3.10.2017 52 47 47 45 27 41 35 41 30 54 13:28-16:30 5°C NW 2-5 m/s
14.12.2017 48 49 43 38 25 31 28 37 28 40 10:00-15:00 -2°C N 1-6 m/s
28.2.2018 45 43 46 43 26 38 30 39 31 44 12:45-16:00 3°C - 0 m/s
25.7.2018 44 47 50 44 27 43 35 46 34 45 12:25-15:25 14°C S 1-3 m/s
8.10.2018 45 44 50 40 24 48 38 45 13:14-16:25 - SW 0-6 m/s
19.11.2018 47 46 44 38 31 42 29 43 36 48 13:40-16:30 -1°C SW - SE 0-2 m/s
Location

SUMMARY OF NOISE LEVEL MEASUREMENTS 2014 - 2018 DOCUMENT NUMBER: 5690211-000-HRP-00065690211-000-HRP-0006 REVISION NUMBER: 1.0
Copyright © 2019 Mannvit. All rights reserved. │ 6
4.2 Measurements with a fixed logging sound level meter
Almost 32.000 hours of sound level measurements have been made automatically in each of the geothermal areas at Krafla, Bjarnarflag and Þeistareykir since the fixed logging sound level meters were first installed in 2014.
The equivalent sound pressure level for each year, as well as the whole five-year period, as measured by these sound level meters is below the 70 dB(A) limit, stipulated in the operating licenses and Icelandic regulations.
When taking only into account measurements made where windspeed is below 5 m/s, as required by measurement protocols for accurate outdoor sound pressure level measurements, the resulting equivalent sound pressure level is even lower. Using this as criteria the highest equivalent sound pressure level for any one year is 60,4 dB(A) for 2017 at Þeistareykir, at Krafla it is 56,7 dB(A) and at Bjarnarflag 46,8 dB(A), both for the year 2016.
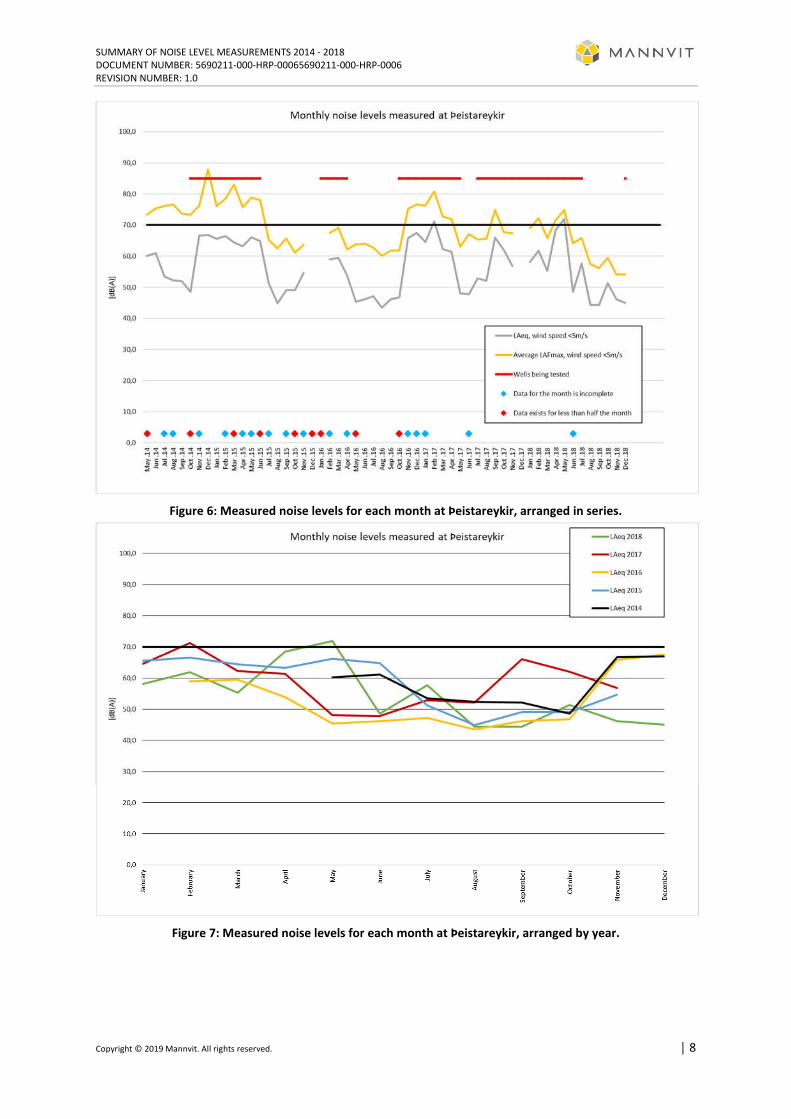
The following graphs in figures 4 to 9 show the equivalent sound pressure levels and average maximum sound levels for each month at each location, since the sound level meters have been in operation. Only measurement data acquired in appropriate weather conditions is used, months where measurement data is incomplete are marked.
Periods where geothermal wells are blowing in the power plant area are also indicated, being by far the noisiest events encountered. This is particularly revealing for the Þeistareykir area since, it being in development, quite a few wells were put into operation during the period in question.
During most of the five-year period the Þeistareykir area was under development. This includes construction of power station, pipelines and service installations, road construction, various earthworks, drilling of wells and putting them into operation, etc. Any and all of these activities can be noisy, but usually higher levels of noise are confined to short periods at a time, associated with some specific operation. On average the noise from these activities is relatively moderate.
The noise generated by blowing geothermal wells being production tested is different. They are consistently very loud over a long period. Just how much noise they generate varies from one well to another but they all generate sound pressure levels far exceeding anything else on site. The sound generated, generally has a stable frequency spectrum and amplitude resulting in a very steady source of background noise over a relatively large area. It has invariably been the case that measured noise levels are higher when there is a well blowing in the geothermal area and can easily account for a 10 – 15 dB(A) increase from what would otherwise be expected, depending on distance to the well and other factors.

SUMMARY OF NOISE LEVEL MEASUREMENTS 2014 - 2018 DOCUMENT NUMBER: 5690211-000-HRP-00065690211-000-HRP-0006 REVISION NUMBER: 1.0
Copyright © 2019 Mannvit. All rights reserved. │ 7
Figure 4: Measured noise levels for each month at Krafla, arranged in series.
Figure 5: Measured noise levels for each month at Krafla, arranged by year.
SUMMARY OF NOISE LEVEL MEASUREMENTS 2014 - 2018 DOCUMENT NUMBER: 5690211-000-HRP-00065690211-000-HRP-0006 REVISION NUMBER: 1.0
Copyright © 2019 Mannvit. All rights reserved. │ 8
Figure 6: Measured noise levels for each month at Þeistareykir, arranged in series.
Figure 7: Measured noise levels for each month at Þeistareykir, arranged by year.

SUMMARY OF NOISE LEVEL MEASUREMENTS 2014 - 2018 DOCUMENT NUMBER: 5690211-000-HRP-00065690211-000-HRP-0006 REVISION NUMBER: 1.0
Copyright © 2019 Mannvit. All rights reserved. │ 9
Figure 8: Measured noise levels for each month at Bjarnarflag, arranged in series
Figure 9: Measured noise levels for each month at Bjarnarflag, arranged by year.

SUMMARY OF NOISE LEVEL MEASUREMENTS 2014 - 2018 DOCUMENT NUMBER: 5690211-000-HRP-00065690211-000-HRP-0006 REVISION NUMBER: 1.0
Copyright © 2019 Mannvit. All rights reserved. │ 10
5. Summary In 2014 a new five-year plan for noise monitoring around the geothermal plants at Krafla, Þeistareykir and Bjarnarflag was initiated. Automatic fixed logging sound level meters were installed in each area and the frequency of manual spot measurements with a handheld sound level meter was increased.
Some issues were encountered regarding running the automatic sound level meters consistently, but these were eventually resolved and there have been no considerable problems for well over two years. There have been no significant problems involved with carrying out the manual measurements.
During the five-year monitoring period 570 manual measurements have been made at 26 locations. At the same time fixed sound level meters have logged about 95.000 hours of measurements, or about 32.000 hours at each location.
Four times the manual measurements recorded noise levels exceeding 70 dB(A). In all other cases the measured noise levels were below the 70 dB(A) limit, stipulated in the operating licenses and Icelandic regulations. Usually the measured noise was well below the limit.
The equivalent sound pressure level for each year, as well as the whole five-year period, as measured by the fixed logging sound level meters is also below the 70 dB(A) limit, stipulated in the operating licenses and Icelandic regulations.
Figure 10: A geothermal well with silencer, during testing.