Embed Size (px)
Citation preview

NOAA-USGS Debris-FlowWarning System—Final ReportN
OAA-USGS Debris Flow Task Force—
NO
AA
-USG
S Debris-Flow
Warning System
—Final Report—
U.S. Geological Survey Circular 1283
U.S. Department of the InteriorU.S. Geological Survey
Circular 1283
This report was prepared in response to the Debris Flow Team charterand NOAA/USGS Memorandum of Understanding 052-49Printed on recycled paper
BL
EE
D
BLEED
BL
EE
D
BLEED
BL
EE
D
BLEED
BL
EE
D
BLEED
FOL
DFO
LD

NOAA-USGS Debris-Flow Warning System—Final Report
By NOAA-USGS Debris Flow Task Force
This report was prepared in response to the Debris Flow Team charter and NOAA/USGS Memorandum of Understanding 052-49
Circular 1283
U.S. Department of the InteriorU.S. Geological Survey
U.S. Department of the InteriorGale A. Norton, Secretary
U.S. Geological SurveyP. Patrick Leahy, Acting Director
U.S. Geological Survey, Reston, Virginia: 2005
Any use of trade, product, or firm names in this publication is for descriptive purposes only and does not imply endorsement by the U.S. Government.
Although this report is in the public domain, permission must be secured from the individual copyright owners to reproduce any copyrighted materials contained within this report.
For more information on the USGS—the Federal source for science about the Earth, its natural and living resources, natural hazards, and the environment: World Wide Web: http://www.usgs.gov/ Telephone: 1-888-ASK-USGS
Suggested citation:NOAA-USGS Debris Flow Task Force, 2005, NOAA-USGS debris-flow warning system— Final report: U.S. Geological Survey Circular 1283, 47 p.
This publication is available online at URL: http://pubs.usgs.gov/circ/2005/1283/ and as Circular 1283 in printed form
For information on other USGS products and ordering information: World Wide Web: http://www.usgs.gov/pubprod/ Telephone: 1-888-ASK-USGS

Foreword
Landslides threaten lives and property in every State in the United States. The autumn and winter of 2004 and 2005 were particularly active landslide seasons, with numerous landslides caused by hurricanes on the East Coast and heavy rainfall on the West Coast. Debris flows are an especially destructive form of landslides and cause loss of life and millions of dollars in damages annually in the United States. Debris flows following wildfires also pose significant hazards.
This document presents the findings and recommendations of a joint NOAA-USGS Task Force that assessed the current state-of-the-art in precipitation forecasting and debris-flow hazard-assessment techniques. This report includes an assessment of the science and resources needed to establish a demonstration debris-flow warning project in recently burned areas of southern California and the necessary scientific advancements and resources associated with expanding such a warning system to unburned areas and, possibly, to a national scope.
The development of this document has been a truly collaborative process between NOAA and USGS and highlights the potential for strong continuing scientific and operational partnerships between the agencies. Implementation of the prototype warning system will support the NOAA-USGS goal of issuing timely debris-flow Warnings to public officials and affected communities.
P. Patrick Leahy D.L. Johnson
Acting Director, USGS Director, NOAA’s National Weather Service
iii
Executive Summary
Landslides and debris flows cause loss of life and millions of dollars in property damage annu-ally in the United States (National Research Council, 2004). In an effort to reduce loss of life by debris flows, the National Oceanic and Atmospheric Administration’s (NOAA) National Weather Service (NWS) and the U.S. Geological Survey (USGS) operated an experimental debris-flow prediction and warning system in the San Francisco Bay area from 1986 to 1995 that relied on forecasts and measurements of precipitation linked to empirical precipitation thresholds to predict the onset of rainfall-triggered debris flows. Since 1995, there have been substantial improvements in quantifying precipitation estimates and forecasts, development of better models for delineating landslide hazards, and advancements in geographic information technol-ogy that allow stronger spatial and temporal linkage between precipitation forecasts and hazard models. Unfortunately, there have also been several debris flows that have caused loss of life and property across the United States. Establishment of debris-flow warning systems in areas where linkages between rainfall amounts and debris-flow occurrence have been identified can help mitigate the hazards posed by these types of landslides. Development of a national warn-ing system can help support the NOAA-USGS goal of issuing timely Warnings of potential debris flows to the affected populace and civil authorities on a broader scale.
This document presents the findings and recommendations of a joint NOAA-USGS Task Force that assessed the current state-of-the-art in precipitation forecasting and debris-flow hazard-assessment techniques. This report includes an assessment of the science and resources needed to establish a demonstration debris-flow warning project in recently burned areas of southern California and the necessary scientific advancements and resources associated with expanding such a warning system to unburned areas and, possibly, to a national scope.
The principal findings of the NOAA-USGS Task Force are:
Interviews with potential users of the demonstration warning system revealed that (1) some users saw the benefit from warning system for burned areas, whereas others thought that they already have sufficient knowledge to deal with such a situation. However, users clearly stated the need for an enhanced effort. Further, users clearly expressed the importance of executing the research plan outlined in this document and incorporating its results into better operational models, as appropriate, and as added resources warrant. (2) In addition to advisory Outlooks, Watches, and Warnings, map products that provide information about areas that could be impacted by debris flows are considered useful. (3) Lead times of 24 to 48 hours for Outlooks and Watches and 24 hours for Warnings are desired. (4) Extension of a system to cover unburned areas would be a valuable contribution.
It is possible to institute a demonstration debris-flow forecasting and warning project for recently burned areas in southern California. Debris flows are common following wildfires, and rainfall intensity duration thresholds for debris-flow occurrence have been developed for parts of southern California using analyses of rainfall and response data from recently burned areas. These quantitative thresholds provide an improvement over the present method of identification of dangerous rainfall conditions based on professional opinion and experience. The demonstra-tion project will cover the service area of the National Weather Service Weather Forecasting Offices (WFO) at Oxnard and San Diego, Calif., which includes the counties of San Luis Obispo,
iv

Santa Barbara, Ventura, Los Angeles, San Bernardino, Orange, Riverside and San Diego. Areas within those counties are prone to wildfires in close proximity to developed areas, and heavy rainfall over those areas has resulted in debris flows that caused considerable loss of life and property damage.
Given presently available resources, the Task Force determined that the only practical way to start a demonstration system is to use the National Weather Service Flash Flood Monitoring and Prediction (FFMP) system, which is currently operationally available at the WFOs. FFMP is used to identify when flash floods are likely to occur based on comparisons between radar precipitation estimates and rainfall intensity-duration threshold values. Advisory Outlooks, Watches, and Warnings are disseminated to emergency-management personnel through the Advanced Weather Information Processing System (AWIPS). Given that basic levels of debris-flow forecasting can also utilize precipitation thresholds, the Task Force concluded that the FFMP provides the most cost-effective and expedient approach to implement a warning system on a 24 hour x 7 day (24x7) basis. The approach relies on USGS providing NWS with precipita-tion thresholds developed for post-wildfire flash floods and debris flows, and NWS determining actual gridded precipitation accumulations and forecasts and then issuing the appropriate advi-sory Outlook, Watch, or Warning. The USGS also provides necessary training to WFO staffers for interpreting debris-flow thresholds.
The Task Force recommends that, as a first step in the advancement of the science, and with appropriate funding, a smaller area within the larger demonstration area be dedicated to intense instrumentation and research to enhance and develop new geological, hydrological, and hydro-meteorological methods to improve precipitation forecasts and measurement techniques and debris-flow-forecasting models. Funding for hydrometeorological and geological instrumentation and research should be about $1.0 million for a 5-month deployment and 1 year of analysis.
Given appropriate resources and scientific focus, considerable potential exists for enhancing and expanding the warning system to provide spatially and temporally explicit information specific to debris flows. Expansions include incorporating improved forecasts and measure-ments of precipitation as well as methods for delineating where debris-flows might occur, how big the events might be, and what areas might be impacted. The team defined the scientific and operational requirements necessary to enhance the system in the near and long terms. Issues, research needs, and potential warning-system products that can be developed over different time scales and in different areas are identified in tables 3, 4, 5, 6, 7, 8, and 9. Personnel and expertise needs for the implementation, operation, and maintenance of any expanded system are included in tables 10, 11, 12, 13, 14, and 15.
In the near term (2–5 years), the demonstration warning project can be refined and expanded to other burned areas within southern California. Expansion of the warning system beyond the demonstration project but within the FFMP framework would consist of refinement of existing rainfall thresholds and development of new regionally specific thresholds. Implementation of models to provide near-real-time mapping of basin-scale debris-flow probability, magnitude, and areas of inundation is possible but requires the development of an operational framework beyond that of the FFMP to address issues specific to debris flows.
Near-term (2–5 years) expansion of the demonstration warning system to burned areas beyond southern California is possible within the FFMP framework but will require the refinement of existing rainfall thresholds and development of new thresholds for additional areas. Develop-
v
ment of models that provide near-real-time mapping of basin-scale debris-flow probability, magnitude, and areas of inundation is possible but requires the development of an operational framework beyond that of the FFMP. Physically based models that characterize the hydrological response of burned areas could be incorporated into a warning system.
Near-term (2–5 years) development and expansion to a nation-wide debris-flow warning system in areas other than those burned by wildfire requires development of an operational framework separate from the FFMP and requires, at a minimum, development of regionally specific rainfall intensity-duration thresholds. An expanded warning system could potentially provide map prod-ucts that identify areas of instability in the event of heavy rainfall and areas of inundation for a range of possible debris-flow volumes.
More substantive development and expansion of a debris-flow warning system over the longer term (5–10 years) within burned areas in the United States includes the development and cali-bration of physically based models for post-fire runoff and erosion and improvement of inunda-tion-area mapping.
Longer term (5–10 years) development and expansion to a national debris-flow warning system in areas other than those burned by wildfire requires development and implementation of physi-cally based models for slope failure that, when linked with spatially distributed precipitation forecasts and measurements, can provide near-real-time information on where and when within a storm debris flows are likely to occur. Methods for predicting possible debris-flow volumes can potentially be linked with inundation-area mapping to provide map products showing probable impacts. We expect this effort to be considerably leveraged by current research at the NWS’ Office of Hydrologic Development on high-resolution distributed models. The implementation of those models will allow the computation of soil-moisture forecasts that could be coupled with high-resolution slope-stability models.
Although this report describes a likely fruitful collaboration between the NWS and the USGS and potential capabilities of a debris-flow early warning system, the Task Force wishes to emphasize that both the human capital and financial resources required to successfully imple-ment, operate, and advance such a system are beyond those available to either agency at this time. A long-term commitment of such resources from both agencies is needed prior to the implementation of any such warning system.
vi

Contents
Foreword ........................................................................................................................................................iiiExecutive Summary ......................................................................................................................................ivIntroduction.....................................................................................................................................................1
Motivations, History, and a New Opportunity ..................................................................................1Hazards Posed by Debris Flows .........................................................................................................2Terminology ............................................................................................................................................3Objectives of the Task Force ...............................................................................................................3
Acknowledgments .........................................................................................................................................3Leadership Team ...................................................................................................................................3Management Team ...............................................................................................................................4Task Force ..............................................................................................................................................4External Cooperators............................................................................................................................5
Debris Flows ...................................................................................................................................................5Triggers ...................................................................................................................................................5
Transformation from Landslides ................................................................................................5Mobilization of Channel Deposits .............................................................................................5
Hazard Assessments ............................................................................................................................6When? (Rainfall Intensity-Duration Thresholds) ....................................................................6Where? (Hazard Mapping) .........................................................................................................6How Big? (Volume or Peak Discharge) ....................................................................................7How Far? (Runout and Inundation-Area Mapping) ................................................................8
Precipitation....................................................................................................................................................9Measuring Precipitation ......................................................................................................................9
Rain Gages ....................................................................................................................................9Radar ...........................................................................................................................................9Multisensor Techniques ...........................................................................................................10
Forecasting ..........................................................................................................................................10Debris-Flow Warning Systems ..................................................................................................................11
Review of Existing Systems ..............................................................................................................11Current NOAA-USGS Capabilities and Limitations .......................................................................12Elements of a Debris-Flow Warning System ..................................................................................12
Products ......................................................................................................................................12Data Forms and Formats ..................................................................................................12
Procedures and Protocols .......................................................................................................13Training ........................................................................................................................................13Outreach and Information ........................................................................................................13Validation Methodology ............................................................................................................13
A Prototype Debris-Flow Warning System .....................................................................................14Southern California Setting ......................................................................................................14
History of Debris-Flow Activity .......................................................................................14Geology ...............................................................................................................................15Vegetation ..........................................................................................................................15
vii

Climatology and Meteorology .........................................................................................15Existing Meteorological Operational Systems .............................................................16
Identification of Customers/Collaborators and Their Requirements ................................19Elements of the Prototype Warning System ..........................................................................20
Products .............................................................................................................................20Implementation .................................................................................................................21Procedures and Protocols ..............................................................................................21Training ...............................................................................................................................21Outreach and Information ...............................................................................................21Validation Methodology ...................................................................................................22Research ............................................................................................................................22
Implementation Plan of the Prototype Warning System .....................................................22Implementation and Operational Costs of the Prototype Warning System .....................22Operational Considerations .....................................................................................................23
Entrance/Exit Strategies ..................................................................................................23Public Affairs Factors .......................................................................................................23
Intensive Research Area ..........................................................................................................23Validation Methodology ...................................................................................................23
Implementation and Operation Costs .....................................................................................24Future Development ....................................................................................................................................24
Precipitation Measurement ..............................................................................................................24Refined Precipitation Forecasts and Measurements ..........................................................24Operational Costs and Impacts ...............................................................................................26
Distributed Hydrologic Modeling Issues ........................................................................................26Hydrology and Geology Modeling Issues for Burned Areas .......................................................27
Developments Possible Within 2 to 5 Years Time Frame to Expand Capability of the Existing Prototype System for Burned Areas in Southern California ..................27
Refining Existing Rainfall Thresholds ............................................................................27Generation of Basin-Scale Debris-Flow Probability and Volume Maps ..................27Generation of Debris-Flow-Inundation-Area Maps ....................................................27
Developments Possible Within 5 to 10 Years Time Frame to Expand Capability of the Existing Prototype System for Burned Areas in Southern California ..................28
Develop Magnitude/Frequency Relations for Debris Flows ......................................28Develop Automated Warning System ...........................................................................28
Developments Possible Within 2 to 5 Years Time Frame to Expand Prototype System to Burned Areas beyond Southern California ...........................................28
Definition of Rainfall Thresholds ....................................................................................28Generation of Basin-Scale Debris-Flow Probability and Volume Maps ..................28
Developments Possible Within 5 to 10 Years to Expand Prototype System to Burned Areas beyond Southern California .........................................................28
Generation of Debris-Flow-Inundation-Area Maps ....................................................28Development and Calibration of Physically Based Models .......................................28
Hydrology and Geology Issues for Unburned Areas ....................................................................28Developments Possible Within 2 to 5 Years for Unburned Areas ......................................29
Development of Rainfall Thresholds ..............................................................................29Statistical and Physically Based Methods ...................................................................29
viii
Debris-Flow-Inundation Modeling .................................................................................29Developments Possible Within 5 to 10 Years for Unburned Areas ....................................29
Physically Based Models for Spatially and Temporally Specific Projections ........29Methods for Predicting Debris-Flow Volumes .............................................................29Refine Inundation-Area Mapping Using Ground-Based or
Airborne-Based LiDAR .......................................................................................29Magnitude/Frequency Relations for Debris Flows ......................................................29Develop Automated Warning System ...........................................................................30Snowmelt-Triggered Debris Flows .................................................................................30
Developments in 10+-Year Time Frame for Unburned Areas..............................................30Issues and Products Tables .....................................................................................................30
Resources, Expertise, and Impacts .................................................................................................32Conclusions and Recommendations ........................................................................................................35
Conclusions..........................................................................................................................................35Recommendations ..............................................................................................................................36
References ....................................................................................................................................................36Appendix A—Functions of NWS Organizations Involved in the Preparation of
Precipitation Forecasts .................................................................................................................42Meteorological Development Laboratory .......................................................................................42Hydrometeorological Prediction Center .........................................................................................42Weather Forecast Offices and River Forecast Centers ................................................................43
Appendix B—Snowmelt and Rain-on-Snow Triggering of Debris Flows ...........................................43Appendix C—List of Potential Customers and Collaborators ..............................................................45Appendix D—Customer Requirements ....................................................................................................46
Customers in the WFO Oxnard area ................................................................................................46San Luis Obispo ..........................................................................................................................46Santa Barbara ............................................................................................................................46Ventura ........................................................................................................................................46Los Angeles.................................................................................................................................46
Customers in the WFO San Diego area ...........................................................................................46Riverside ......................................................................................................................................46San Diego ....................................................................................................................................46San Bernardino ..........................................................................................................................46
Figures
1. Proposed prototype region for issuing debris-flow Forecasts and Warnings .................2
2. Rainfall thresholds for La Honda study site in northern California .....................................7
3. Probability of debris-flow occurrence after the 2002 Missionary Ridge fire in Colorado in response to 25-year recurrence, 1-hour duration rainstorm .....................8
4. Topography of southern California .........................................................................................16
5. Map of mean annual precipitation for southern California................................................17
6. Topography map of southern California and the location of ALERT rain gages, NWS operational radars, upper-air radiosonde sites ........................................................17
ix
7. Southern California ALERT rain gage locations and WSR-88D radar low-level coverage ..................................................................................................................18
8. Example of storm-total maps of precipitation accumulation available in real time on the Internet from every NEXRAD radar site ...............................................19
9. Vertical section of radar coverage across the Los Angeles Basin area .........................20 10. Base map of an enhanced precipitation measurement network
that could be deployed in and near a recently burned mountainous area susceptible to debris flows ............................................................................................25
Tables
1. Prototype implementation plan ...............................................................................................22 2. Summary of estimated meteorologic and geologic implementation
costs for a 5-month deployment of the Intensive Research Area ....................................24 3. Issues and products by expanding capability of existing prototype—2–5 years ..........30 4. Issues and products by expanding capability of existing prototype—5–10 years ........30 5. Issues and products by expanding prototype to burned areas beyond
southern California—2–5 years ..............................................................................................31 6. Issues and products by expanding prototype to burned areas beyond
southern California—5–10 years ............................................................................................31 7. Issues and products to establish warning system in areas other than
recent fires—2–5 years ...........................................................................................................31 8. Issues and products to establish warning system to areas other than
recent fires—5–10 years .........................................................................................................31 9. Issues and products to establish warning system in areas other than
recent fires—10+ years ...........................................................................................................31 10. Personnel and expertise necessary to expand capability of a prototype
system for burned areas in southern California (and to move beyond reliance on FFMP system) .......................................................................................................32
11. Operation and maintenance items to expand capability of a prototype system for burned areas in southern California (and to move beyond reliance on FFMP system) .......................................................................................................33
12. Personnel and expertise necessary to expand prototype system to a region with burned areas beyond southern California ...................................................................33
13. Operation and maintenance items to expand prototype system to a region with burned areas beyond southern California ...................................................................33
14. Near- and long-term implementation items to establish warning system in areas other than recent burns per year per region ........................................................34
15. Operation and maintenance items to establish warning system in areas other than recent burns per year per region ........................................................35
C-1. List of potential customers and collaborators .....................................................................45
x

List of Selected Acronyms Used in this Report
Acronym Meaning
AL NOAA’s Aeronomy Laboratory ALERT Automated Local Evaluation in Real Time ASCII American Standard Code for Information Interchange AWIPS Advanced Weather Interactive Processing System CNRFC California-Nevada River Forecasting Center CWA County Warning Areas DFWS Debris Flow Warning System DMIP Distributed Model Intercomparison Project DSD Drop size distribution EAS Emergency Alert System EM Emergency Management ETL Environmental Technology Laboratory FAA Federal Aviation Administration FAR False Alarm Ratio FFMP Flash Flood Monitoring and Prediction FTP File Transfer Protocol GeoMAC Geospatial Multi-Agency Coordination GOES Geostationary Operational Environmental Satellite GRIB2 Gridded Binary Data Edition 2 HPC NOAA’s Hydrometeorological Prediction Center IPMA Intensive Precipitation Measurement Array IT Information Technology LAMP Localized Aviation MOS Program MIC Meteorologist In Charge MND Mass News Disseminator MOS Model Output Statistics NCEP NOAA’s National Centers for Environmental Prediction NDFD National Digital Forecast Database NEXRAD Next Generation Radar NMQ National Mosaic and Multisensor QPE NOAA National Oceanic and Atmospheric Administration NOHRSC National Operational Hydrologic Remote Sensing Center NRC National Research Council NSSL NOAA’s National Severe Storms Laboratory NWP Numerical Weather Prediction NWS NOAA’s National Weather Service NWSH National Weather Services Headquarter NWSTG NWS Telecommunications Gateway OAR NOAA’s Oceanic and Atmospheric Research OHD NOAA’s Office of Hydrologic Development PACJET Pacific Jets Experiment PNS Public Information Statement Product
xi
Acronym Meaning
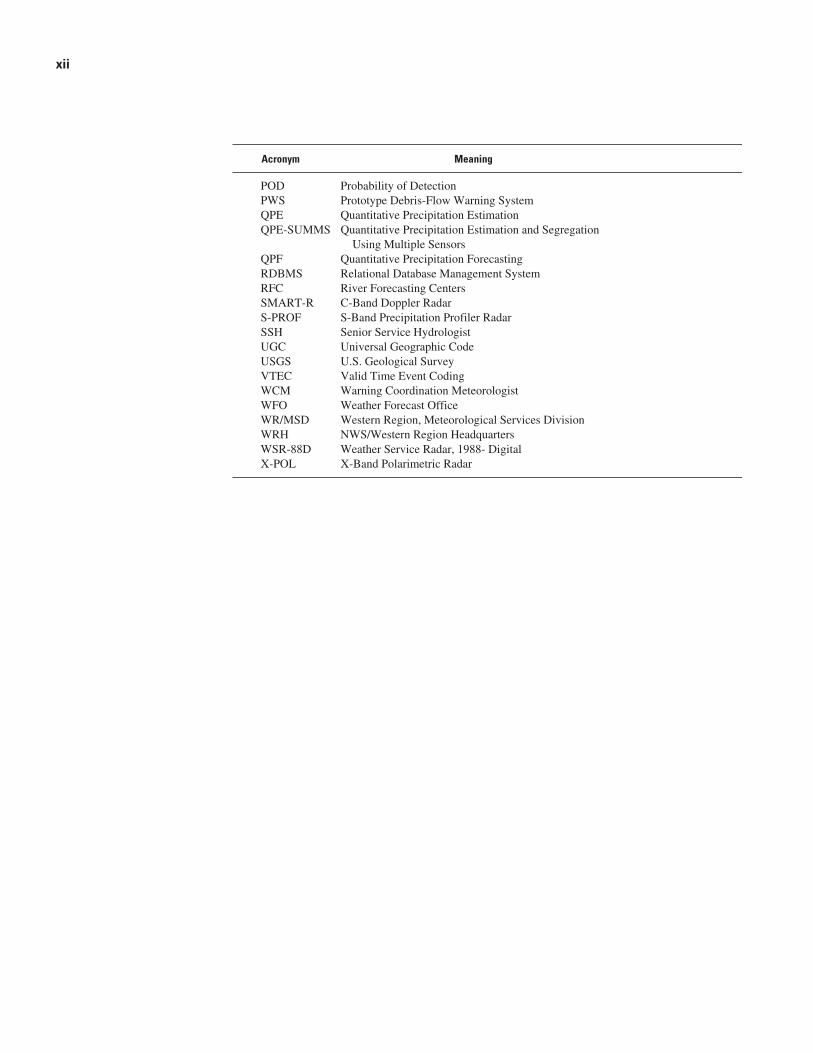
POD Probability of Detection PWS Prototype Debris-Flow Warning System QPE Quantitative Precipitation Estimation QPE-SUMMS Quantitative Precipitation Estimation and Segregation
Using Multiple Sensors QPF Quantitative Precipitation Forecasting RDBMS Relational Database Management System RFC River Forecasting Centers SMART-R C-Band Doppler Radar S-PROF S-Band Precipitation Profiler Radar SSH Senior Service Hydrologist UGC Universal Geographic Code USGS U.S. Geological Survey VTEC Valid Time Event Coding WCM Warning Coordination Meteorologist WFO Weather Forecast Office WR/MSD Western Region, Meteorological Services Division WRH NWS/Western Region Headquarters WSR-88D Weather Service Radar, 1988- Digital X-POL X-Band Polarimetric Radar
xii
Introduction
Motivations, History, and a New Opportunity
Landslides result in an estimated 25 to 50 deaths and damages exceeding $2 billion annually (National Research Council (NRC), 2004). Debris flow is a type of landslide most commonly initiated when heavy rainfall or rapid snowmelt mobilizes soil on steep slopes, sending a slurry of rocks, soil, and mud downhill with tremendous force. These are often called mudslides by the public. Because of their close link with precipitation, debris flows are somewhat more predict-able than most other types of landslides. The weather condi-tions that provoke them are the same as those monitored by meteorologists for flood predictions, although the critical precipitation-warning thresholds and areas vulnerable to flood and debris-flow damage may differ significantly. Geological research has established rainfall intensity and accumulation thresholds above which debris flows are likely to occur in some mountainous or hilly locations. Meanwhile, the ability to monitor and forecast precipitation and issue timely weather-hazard Warnings is a well-established and ever-improving operational meteorological capability.
Thus, prospects are good for devising an effective opera-tional system to predict debris flows and issue Warnings of their imminent threat. A joint cooperative program involving the U.S. Geological Survey (USGS) and the National Oceanic and Atmospheric Administration (NOAA) is proposed here to develop and implement such a system, beginning with a limited-scale prototype demonstration. The complementary expertise and capabilities of the two agencies provides an ideal partnership for addressing this problem. This problem is directly related to the missions of both agencies—to provide services to protect life and property from natural disasters.
An exploratory program for predicting debris flows and issuing Warnings was operated in the San Francisco Bay area from 1986–95 through an informal cooperation between the USGS and NOAA’s National Weather Service (NWS). This program demonstrated a notable degree of success and estab-lished rudiments for future efforts.
In the ensuing decade, significant advances have occurred in precipitation forecasting and monitoring. These improve-ments, now operational at the NWS, include higher resolution numerical weather-prediction models that use more realistic
precipitation-formation physics, the deployment of a national network of WSR-88D (NEXRAD) storm-surveillance Dop-pler radars, and an explosion of real-time information sharing through the Internet. Recent NOAA studies of West Coast winter storms offer new understanding of these storms and have employed technologically advanced instruments that may become operational forecast-aid tools in the future. Simultane-ously, the geology and physics of debris flow has been refined though continued USGS research involving case studies and model development.
As of 2005, a very few NWS Weather Forecasts Offices (WFO) are issuing weather Warnings that experimentally include comments about debris-flow threats in recently burned areas, based on very simplistic and untested rainfall thresholds provided by a panel of geologists. In January 2005, the USGS conducted an ad hoc warning exercise as a record-breaking storm deluge approached and crossed southern California, producing numerous debris flows and the deadly landslide at La Conchita, Calif. (cover photo). These tem-porary activities have further clarified the opportunity and the need for a more formal, operational debris-flow forecast/warning system.
Important recent science and technology advances sug-gest that the time is right to develop an operational warning system. It could build on and extend the earlier San Francisco area exploratory program using the new tools and knowledge now available. Mountainous areas recently burned by wild-fires are the best candidates for testing the prototype of such a system because the likelihood of debris flows occurring is high and, unlike unburned areas, largely independent of antecedent precipitation and soil-moisture conditions. As such, burned areas also offer a comparatively simple study “laboratory.” The mountainous areas of southern California have been identified as an excellent location for the warning program’s prototype demonstration. Recently burned slopes in these areas are prevalent, debris flows are likely to occur frequently, a large nearby population is at risk, and data from earlier events in some of these mountain ranges are available to establish site-specific rainfall/flow thresholds. The area (fig. 1) is served by two NWS WFOs and has relatively good upper-level coverage from nearby NEXRAD radars and surface monitoring by real-time rain-gage networks. In figure 1, the two NWS Weather Forecast Office regions are shown with different shading. Also, a smaller (movable) region for intensive research is shown in red.
NOAA-USGS Debris-Flow Warning System—Final Report
By NOAA-USGS Debris Flow Task Force

Initially, the prototype system will rely primarily on operational tools (such as existing rain gages and NEXRAD) to monitor storm conditions. However, although the current operational weather tools and the present geological knowl-edge of debris flows far exceed what was available a decade earlier, they are known to have shortcomings that render them less than ideal for developing Forecasts and Warnings. Thus, the warning development program and its prototype demon-stration must also include a strong research component (both geologic and meteorological) that addresses weaknesses if the system is to be more broadly relevant. The research to be focused in a smaller subregion (fig. 1) would include, for example, testing supplemental instrumentation for improved measurements of rainfall and the development of geologic and hydrologic models that more accurately predict areas at risk from debris flows.
A successful prototype demonstration in southern Cali-fornia will serve as a model for implementing similar systems in other areas of the Nation vulnerable to debris-flow hazards. However, the geology and meteorology associated with debris flow in other areas may differ greatly from those in southern California. Widespread winter storms are the primary catalyst for triggering debris flows in southern California. However,
in other parts of the country, the main threat arises from other sources, such as localized convective thunderstorms in the Rocky Mountains, summer monsoon rains in Arizona, and hurricane rainfall in the Appalachian Mountains. The regional and local geology affecting debris flow varies greatly. Hence, another important topic for the program’s research is to assess transferability of results from one area to another and the specific data and observational requirements for implementing Forecasts in new areas.
Hazards Posed by Debris Flows
Landslides are among the most widespread geological hazards on Earth and threaten lives and property in every State in the Nation. Landslides result in an estimated 25 to 50 deaths and damages exceeding an average of $2 billion annually (National Research Council, 2004). Despite advances in sci-ence and technology, these events continue to result in human suffering, property losses, and environmental degradation. As our population increases and our society becomes ever more complex, the economic and societal costs of landslides will continue to rise unless there is significant intervention.
Figure 1. Proposed prototype region for issuing debris flow Forecasts and Warnings.
� NOAA-USGS Debris-Flow Warning System—Final Report
Debris flows are among the most hazardous types of landslides. They pose a hazard distinct from other landslide processes because of their unique destructive power. They can occur with little warning and can exert great impulsive loads on objects in their paths. Even small debris flows can strip vegetation, block drainage ways, damage structures, and endanger human life (Iverson, 1997). The deaths of 19 people during the winter storms of 2004–05 that impacted much of southern California highlight the most drastic consequences of debris flows. In addition to the lives lost, damage to public property by debris flows and floods from this event has been estimated to approach $0.5 billion (Los Angeles Times, 2005). Hillslopes burned by wildfire are particularly susceptible to debris-flow activity. Sixteen people were killed during the Christmas Day 2003 storm that impacted recently burned hillslopes in southern California (Los Angeles Times, 2004). In response to this one event, $26.5 million was spent to repair roads and to remove the 4.1 million m3 of material deposited in debris retention basins (Pat Mead, San Bernardino Flood Control District, oral commun.).
Terminology
Debris flows are gravity-driven mixtures of sediment and water that are intermediate between landslides and water floods. They have mechanical characteristics that are distinct from either of these processes (Johnson, 1970; Iverson, 1997; Iverson and Vallance, 2001) and are commonly described as resembling flowing, wet concrete. A debris flow is commonly defined as a flowing mixture of approximately equal parts sed-iment and water in which a broad distribution of grain sizes, commonly including gravel, is vertically well mixed. Debris flows exhibit behavior that is strongly affected by interactions between the solid and fluid components. Debris flows can travel through steep channels, over open hillslopes, and across gently sloping surfaces, where they are known to build their own channels (Costa, 1984). Flow properties vary with water and clay content, and sediment size and sorting (Costa, 1984). They commonly travel along channels in a series of waves or surges (Costa, 1984). Debris flows can have apparent viscosi-ties that are five to six orders of magnitude greater than water, and fluid densities almost twice as great. As a consequence of the high fluid densities of debris flows, large rocks can be carried along and cause significant damage by impact (Wiec-zorek and others, 2002). In this report, debris flows broadly encompass mudflows (slurries containing mostly fine grained material) and debris avalanches (a variety of very rapid debris flow (Varnes, 1978)). Debris flows and mudflows are com-monly referred to in the vernacular as mudslides.
Hyperconcentrated flow is another form of sediment-water mixture found in mountainous terrain (e.g., Pierson, 2005a). Hyperconcentrated flow is defined as a phase of flow that is transitional between debris flow and sediment-laden streamflow in which stresses exerted by the fluid are respon-sible for the transport of sediment. A hyperconcentrated
flow contains volumetrically more water than sediment, but it is very sediment rich compared to normal streamflow. As a result, the coarsest particles settle rapidly and the flowing sediment-water mixture usually contains a narrower distribu-tion of grain sizes than is found in a debris flow. The sedi-ment in many hyperconcentrated flows is predominantly sand. Hyperconcentrated flow can form when a debris flow moves downslope and mixes with streamflow. It can also form when water flow erodes and ingests large amounts of sediment.
The debris-flow warning system will use the same termi-nology used by the NWS in the delivery of hazardous weather messages (Outlook, Watch, and Warning). It is, therefore, important to describe these terms and their application. An Outlook is used by the NWS to indicate that a hazardous weather or hydrologic event may develop. It is intended to provide information to those who need considerable lead time to prepare for the event. A Watch is issued when the risk of a hazardous weather or hydrologic event has increased signifi-cantly, but its occurrence, location, and (or) timing is still uncertain. It is intended to provide enough lead time so that those who need to set their plans in motion can do so. Lead times are, at most, less than 3 days and can be as short as a few hours. A Warning is issued when a hazardous weather or hydrologic event is occurring, is imminent, or has a very high probability of occurring. A Warning is used for conditions that pose a threat to life or property. Desired lead times for Warnings would be within 1 day, but developing conditions might cause them to be issued with lead times as short as 30 minutes.
Objectives of the Task Force
The objective of the NOAA-USGS Task Force is to develop a plan for the implementation and operation of a NOAA-USGS system to issue joint Outlooks, Watches, and Warnings for areas deemed to be at risk from debris flows as a result of current or forecast precipitation. As part of this effort, a prototype system will be developed, implemented, and tested in recently burned areas in southern California using technolo-gies currently available to NOAA and the USGS. The potential and resources required for expansion of a warning system to additional geographic settings and other debris-flow-triggering conditions using more advanced techniques in precipitation forecasting and measurement and debris-flow hazard delinea-tion are identified.
Acknowledgments
Leadership Team
The leadership team is formed by the Directors of NOAA line offices and the Associate Directors of the U.S. Geological Survey for Water and Geology.
Acknowledgments �
Management Team
The management team has as its responsibility the overall direction of the project and is formed by senior personnel of the four offices involved in the project.
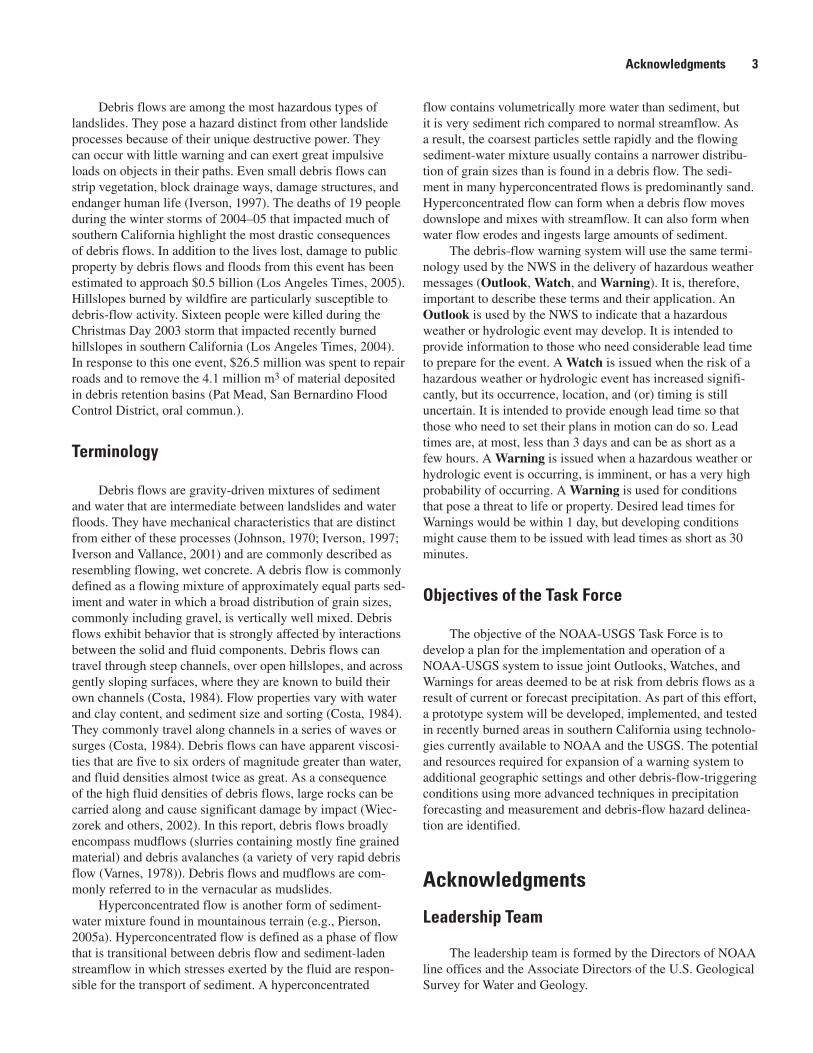
Leadership Team composition.
[AD, Associate Director]
Name Title Affiliation
Robert Hirsch AD for Water U.S. Geological Survey D.L. Johnson Director NOAA’s National Weather Service Linda Gundersen AD for Geology, Acting U.S. Geological Survey Rick Rosen Director OAA Oceanic and Atmospheric Research N
Management Team composition.
Name Affiliation
Steve Blanchard USGS, Water Resources Discipline Gary Carter NOAA’s Office of Hydrologic Development Peter Lyttle USGS, Geologic Resources Discipline Marty Ralph NOAA, Environmental Technology Laboratory
Task Force
The Task Force was formed to carry out the research and draft the overall implementation plan. The product of this assignment is this report.
Task Force composition.
Name Affiliation
Jim Bowers USGS, Water Resources Discipline, Calif. Sue Cannon USGS, Geologic Resources Discipline Tom Carroll NOAA, National Operational Hydrologic Remote Sensing Center John Costa USGS, Water Resources Discipline Jonathan Godt USGS, Geologic Resources Discipline J.J. Gourley NOAA’s National Severe Storms Laboratory David Jorgensen NOAA’s National Severe Storms Laboratory David Kingsmill NOAA, Environmental Technology Laboratory Jon Major USGS, Water Resources Discipline Brooks Martner NOAA, Environmental Technology Laboratory Pedro Restrepo NOAA’s Office of Hydrologic Development David Savage NOAA, National Operational Hydrologic Remote Sensing Center Michelle Schmidt NOAA’s National Weather Service, Western Region Headquarters Robert Tibi NOAA’s National Weather Service, Western Region Headquarters Kevin Werner NOAA’s National Weather Service, Western Region Headquarters Gerry Wieczorek USGS, Geologic Resources Discipline
� NOAA-USGS Debris-Flow Warning System—Final Report

External Cooperators
The project benefited immensely from a number of individuals and organizations that were not part of the Task Force. They contributed either by commenting on sections of the report or by being interviewed and expressing their opinion with regard to the value of this debris-flow-warning system.
Transformation from Landslides
Many debris flows in undisturbed landscapes begin as discrete landslides on steep (greater than about 15°) hillslopes as a result of a relatively rapid influx of large amounts of water (e.g., Iverson and others, 1997). Slope failures usually origi-nate at the head of swales (small zero-order drainages), but they can also occur on flat or convex side slopes. Landslide failures typically occur when rainfall infiltrates through a rela-tively competent block of soil. As the block of soil gradually saturates, pore-water pressures increase, and shear strengths decrease. It is not necessary for the entire thickness of soil to be saturated for failure to occur. The initial landslide failure then mobilizes into the muddy slurry that is the debris flow. Landslide-generated debris flows can move rapidly downslope and frequently incorporate significant volumes of channel sediment, thus increasing in size with distance.
In landscapes disturbed by wildfire, forest practices, volcanic eruptions, etc., infiltration-triggered landslide activity is frequently attributed to increased soil moisture caused by reduced transpiration rates as a result of loss of vegetation and to root decay associated with decreases in soil cohesion (e.g., Schmidt and others, 2001; Swanson and Major, 2005). In areas burned by wildfire, Cannon and Gartner (2005) found that debris flows caused by landslide mobilization could occur during the first rainy season immediately after the fire, and as much as about 10 years after the fire. Such landslides generally occurred in response to prolonged, infrequent rainfall events. The most extensive landslide events occurred in response to week-long, or multiweek storms, or prolonged rainfall in combination with rapid snowmelt.
Mobilization of Channel Deposits
Large-scale sediment entrainment has proven to be a process capable of generating debris flows. Material stored in channels can be mobilized by rainfall runoff or flash-flood surges and act as the source sediment for debris flows. In several areas, volume increases in flow caused by sediment entrainment have been recognized as an important or even predominant factor in creating large debris flows. Such an initiation process, known as bulking in the sedimentologic lit-erature, in reference to the associated increase of flow volume that accompanies sediment entrainment, has been recognized to be an important process around volcanoes (Gallino and Pierson, 1985; Scott, 1988; Scott and others, 2005) as well as in nonvolcanic terrain. Scott (1971) noted that channel deposits are a major source of debris-flow sediment in the San Gabriel Mountains of southern California.
Mobilization and entrainment of channel sediment is particularly important in areas recently burned by wildfires. Meyer and Wells (1997) and Cannon and others (2001, 2003) describe a process whereby storm runoff progressively entrains sediment eroded from hillslopes and channels and transforms into a debris flow. Convergence and concentration
External cooperators.
[See “List of selected acronyms used in this report” at end of table of contents for acronym definitions]
Eric Boldt, WCM, NOAA/NWS/WFO, Los Angeles/Oxnard Ed Clark, WCM, NOAA/NWS/WFO, San Diego Dan Keeton, MIC, NOAA/NWS/WFO, Oxnard Jayme Laber, SSH, NOAA/NWS/WFO, Oxnard Jim Purpura, MIC, NOAA/NWS/WFO, San Diego Greg Romano, NOAA/NWS Public Affairs Craig Schmidt, WR/MSD Mike Smith, Research Hydrologist, NOAA/NWS/OHD San Bernardino County Office of Emergency Services San Diego County Office of Emergency Services San Luis Obispo, Office of Emergency Services Riverside County Office of Emergency Services
Debris Flows
Triggers
Debris flows originate when poorly sorted rock and soil debris are mobilized from hillslopes and channels by the addition of moisture (Costa, 1984). Prerequisite conditions for most debris flows include an abundant source of uncon-solidated regolith, steep slopes, and a source of moisture. The most common moisture sources are intense or prolonged rain-fall and rapid snowmelt (or some combination of the two).
Debris flows can be triggered by a variety of mecha-nisms. Commonly, debris flows occur when landslides trans-form into rapidly flowing masses. However, they may also occur when rapid hillslope runoff or flood surges erode and entrain channel sediment. At volcanoes, they can be triggered by rapid melting and mixing of snowpack with volcanic debris during eruptions (Waitt and others, 1983; Major and others, 2005) and by heavy rainfalls (Gallino and Pierson, 1985; and Scott and others, 2005). Earthquakes and dam failures can also result in debris flows (Scott, 1988; O’Connor and others, 2001; Evans and Bent, 2004). Initiation mechanisms can greatly influence debris-flow volumes, compositions, and hydrographs. Any conditions that foster slope instability, enhanced and rapid runoff, or flash flooding can favor forma-tion of debris flows. This report is focused on rainfall-induced debris flows.
Debris Flows �

of surface runoff within small, first-order drainages initiates erosion, often to bedrock, and the transport of material down-channel. Field observations indicate that at some distance down the channel network, a sufficient amount of eroded material is incorporated, relative to the volume of surface run-off, to impart debris-flow characteristics to the flow. In a study of the response of 410 burned basins throughout the Western United States, Cannon and Gartner (2005) found that about 75 percent of debris flows were produced through this process. This mechanism of debris-flow generation usually occurred in response to short-recurrence (<2- to 10-year) rainfall events.
In addition to enhanced and rapid runoff, landslides can influence mobilization of channel sediment in several ways. First, a landslide may override and mobilize saturated chan-nel sediment (e.g., Hungr and Evans, 2004). If a sufficient amount of channel sediment is mobilized, it can augment the travel distance of a debris flow. Second, rapid release of ground water from a landslide rich in coarse debris can trigger a flood that subsequently entrains sediment and transforms into a debris flow (e.g., Scott and others, 2005). Third, a landslide can dam a stream channel and temporarily impound a lake. Breaching of the impoundment can trigger a flash flood capable of entraining enough channel sediment to transform into a debris flow (e.g., Scott, 1988).
Hazard Assessments
Reliable and accurate debris-flow Watches and Warnings must be based on sound identification of areas susceptible to debris flows and recognition of the conditions that will result in their occurrence. Hence, a comprehensive debris-flow-hazard assessment must address the following questions:
When? (Rainfall Intensity-Duration Thresholds)
To address when debris flows are likely to occur, both within a storm or within a storm season, two complementary triggering thresholds that relate to different time scales must be considered: (1) an antecedent rainfall threshold, requiring an accumulation of a certain amount of rainfall during the season, and (2) a storm intensity-duration threshold, requiring that a critical combination of rainfall intensity and duration be exceeded during the course of the storm (Wilson, 1993). The antecedent rainfall threshold exists because hillside soils become dehydrated during the dry season, and a certain amount of rainfall is necessary to replenish soil moisture. Until soil moisture is restored, the pore pressures necessary for slope failure cannot form and debris flows are unlikely, even in heavy rainfall (Wilson, 1993). Note that in recently burned areas, where debris flows are most likely to be initiated through runoff-dominated processes rather than from infiltra-tion-triggered landslides, the largest and most extensive debris flows generally occur in response to the first significant storm to impact an area (Cannon and Gartner, 2005). Thus, defini-
tion of antecedent rainfall conditions is not as important for debris-flow initiation in burned landscapes as it is in undis-turbed landscapes. In burned areas, rainfall intensity-duration thresholds can provide sufficient information for the initial prediction of debris flows.
For landslide-triggered debris flows, once an ante-cedent rainfall threshold has been exceeded, approaching storms are evaluated to see if the intensity and duration of the expected rainfall are sufficient to initiate movement. Storm thresholds are usually defined by identifying those rainfall intensities and durations that are unique to debris-flow-producing storms. A threshold line delineates a range of rainfall combinations—from short-duration, high-intensity to long-duration, low-intensity—any of which can result in debris-flow activity within a storm. Thresholds commonly take the form of a power-law function, and because of variations in the rainfall conditions that trigger debris flows in different regions, such thresholds typically are region specific. For example, distinct landslide-triggering rainfall thresholds have been reported for Puerto Rico (Larsen and Simon, 1993), Hong Kong (Au, 1993; Finlay and others, 1997), Taiwan (Taiwanese Soil and Water Conservation Bureau), central and southern California (Campbell, 1975; Cannon and Ellen, 1985, Wieczorek 1987; Cannon, 1988; Wilson and Wieczorek, 1995), Seattle, Wash. (Baum and oth-ers, 2005), the Blue Ridge in Virginia (Wieczorek and others, 2000), New Zealand (Crozier, 1986, 1999; Glade and others, 2000), and the Piedmont Region in Italy (Aleotti, 2004). To account for local variability in precipitation amounts due to local orographic effects and the concurrent variability in local debris-flow-triggering rainfall conditions, some work-ers have proposed normalizing rainfall thresholds by mean annual precipitation (Cannon, 1988), or by rainy-day normals (Wilson, 1993).
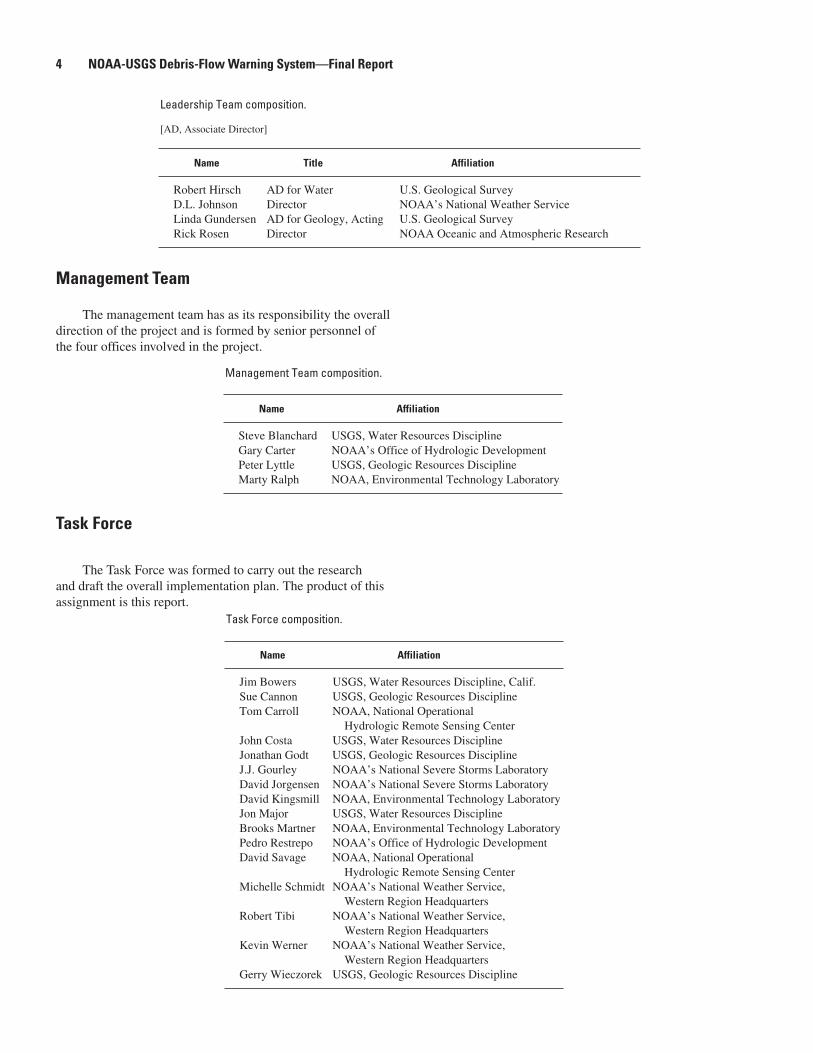
Rainfall intensity-duration thresholds can also be used to indicate different levels of potential hazards, as shown in figure 2. For example, in the operation of a debris-flow warn-ing system in the San Francisco Bay region of California, a lower “safety” threshold identified a rainfall level below which significant debris-flow hazards are considered unlikely, and above which debris flows are likely. An upper “danger” threshold represented a rainfall level above which abundant debris flows large enough to destroy structures are likely to occur across broad areas (Wilson, 1993).
Where? (Hazard Mapping)
During the past 3 decades, geoscientists have developed several approaches to debris-flow-hazard analyses, which can be broadly classified as inferential, statistical, and process-based (Hanson, 1984; Varnes, 1984). All three approaches are currently applied to produce a variety of map products described below; there is no standard approach used in the United States. These approaches vary considerably in their spatial and temporal resolution and physical basis.
� NOAA-USGS Debris-Flow Warning System—Final Report
An inferential approach is very common and relies on information from a variety of sources to create interpretive maps that show the potential extent of landslide activity. An example of an inferential product would be a landslide susceptibility map. Such a map ranks slope stability of an area into categories that range from stable to unstable to indicate a sense of relative stability. The controls on landslide occurrence and the relative effects of each of the controls are generally inferred based on expert opinion, field observations, and data from landslide inventories. For example, in a series of maps for the southern California area, Morton and others (2003) present the susceptibility to shallow landsliding as a function of the product of geologic unit, slope, and aspect. Such a prod-uct provides a static representation of landslide susceptibility in the event of some unspecified rainfall accumulation.
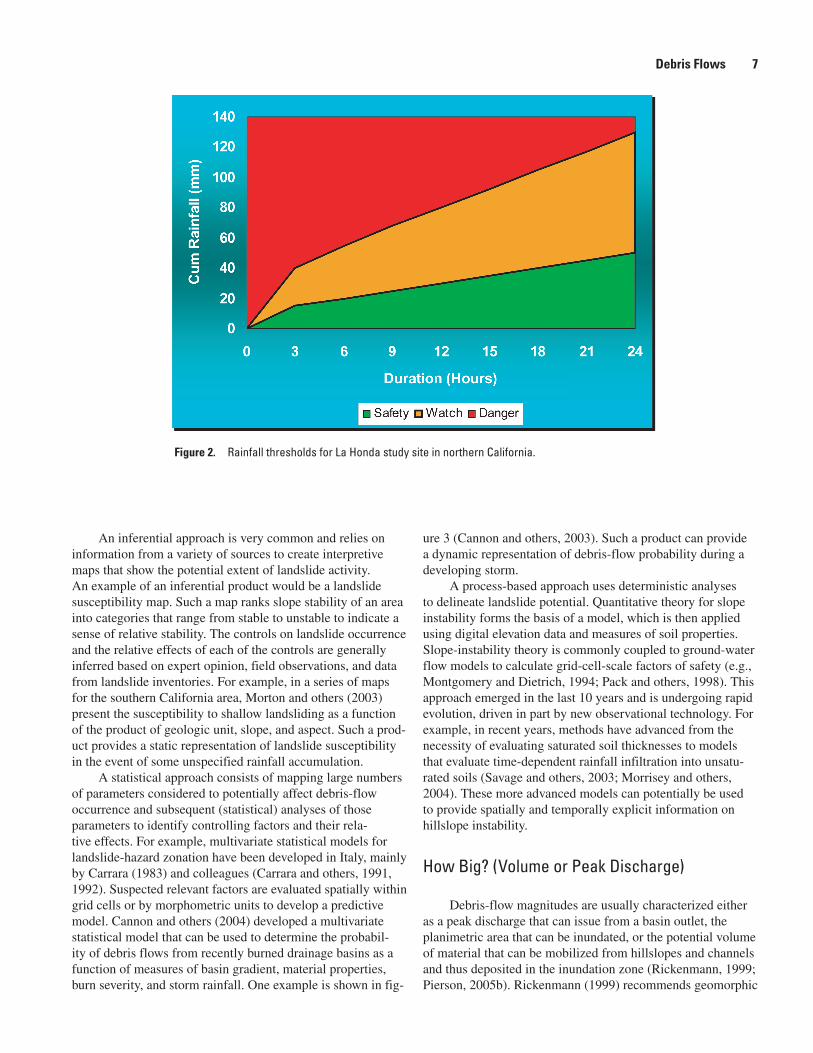
A statistical approach consists of mapping large numbers of parameters considered to potentially affect debris-flow occurrence and subsequent (statistical) analyses of those parameters to identify controlling factors and their rela-tive effects. For example, multivariate statistical models for landslide-hazard zonation have been developed in Italy, mainly by Carrara (1983) and colleagues (Carrara and others, 1991, 1992). Suspected relevant factors are evaluated spatially within grid cells or by morphometric units to develop a predictive model. Cannon and others (2004) developed a multivariate statistical model that can be used to determine the probabil-ity of debris flows from recently burned drainage basins as a function of measures of basin gradient, material properties, burn severity, and storm rainfall. One example is shown in fig-
ure 3 (Cannon and others, 2003). Such a product can provide a dynamic representation of debris-flow probability during a developing storm.
A process-based approach uses deterministic analyses to delineate landslide potential. Quantitative theory for slope instability forms the basis of a model, which is then applied using digital elevation data and measures of soil properties. Slope-instability theory is commonly coupled to ground-water flow models to calculate grid-cell-scale factors of safety (e.g., Montgomery and Dietrich, 1994; Pack and others, 1998). This approach emerged in the last 10 years and is undergoing rapid evolution, driven in part by new observational technology. For example, in recent years, methods have advanced from the necessity of evaluating saturated soil thicknesses to models that evaluate time-dependent rainfall infiltration into unsatu-rated soils (Savage and others, 2003; Morrisey and others, 2004). These more advanced models can potentially be used to provide spatially and temporally explicit information on hillslope instability.
How Big? (Volume or Peak Discharge)
Debris-flow magnitudes are usually characterized either as a peak discharge that can issue from a basin outlet, the planimetric area that can be inundated, or the potential volume of material that can be mobilized from hillslopes and channels and thus deposited in the inundation zone (Rickenmann, 1999; Pierson, 2005b). Rickenmann (1999) recommends geomorphic
Figure �. Rainfall thresholds for La Honda study site in northern California.
Debris Flows 7

assessments of potential sediment volumes stored in chan-nels as the most reliable method of characterizing debris-flow volume. D’Agostino and Marchi (2003) describe such an approach for basins in the Dolomites in Italy. In a different approach, Cannon and others (2004) used data from recently burned basins throughout the Western United States to develop a multivariate statistical model that can be used to estimate the potential peak discharges of a debris flow issuing from a basin mouth as a function of the extent of the burn, basin gradient, material properties, and the triggering rainfall.
Note that, although peak discharge is the standard indica-tor for flood magnitude, it is not always a good representation for debris-flow magnitude. Because many debris flows occur in ungaged basins, and it is rare for a direct gaging system to survive a debris-flow event, it is necessary to rely on indirect methods to reconstruct peak discharges. Indirect methods for determining peak discharges are of limited use for debris-flow reconstructions because debris flows are non-Newtonian flows and orders-of-magnitude changes in peak discharge can occur over very short distances (hundreds of meters) downstream. Estimates of measurements of total planimetric area inundated or total volume delivered beyond a canyon mouth are con-sidered to be more useful data for some hazard assessments (Pierson, 2005b).
How Far? (Runout and Inundation-Area Mapping)
Traditionally, assessments of debris-flow hazards and runout are based on detailed mapping of the extents of debris-flow deposits and extrapolation of estimated inundation limits among drainage basins. Such methods are, however, highly subjective. Simulation models provide a somewhat more objective way of evaluating hazards, and a variety of empirical and numerical models have been proposed to simulate runout distances and inundation limits of debris flows (e.g., Hungr, 1995; O’Brien and others, 1993).
Although theoretical and numerical analyses of debris-flow mechanics are advancing, there is yet no universally accepted physically based model for routing debris flows across three-dimensional terrain. At present, the most practi-cal methods for identifying debris-flow runout and limits of inundation rely on empirical analyses that are based on histori-cal inundation patterns. However, reason suggests that the extent and distance of runout of a debris flow will be related to the flow volume (contributed from both the initial failure and channel bulking). One of the more useful empirical meth-ods for identifying debris-flow runout and inundation relies on relationships between flow volume and inundation area
Figure �. Probability of debris-flow occurrence after the 2002 Missionary Ridge fire in Colorado in response to 25-year recurrence, 1-hour duration rainstorm.
� NOAA-USGS Debris-Flow Warning System—Final Report

(Iverson and others, 1998). This method relies on a physically based, statistically constrained simulation model calibrated with data from historical debris flows from a variety of set-tings. It relies on scaling and statistical relationships among expected debris-flow volume, cross-sectional area of channel inundation, and planimetric area of inundation. Estimation of initial failure volume before an event is difficult, but by using a range of prospective debris-flow volumes, a range of inundation areas can be plotted for debris flows of increasing volume and decreasing probability. Detailed descriptions of a geographic information system (GIS) computer program for implementation of this approach, and discussion of limitations of the approach, are found in Iverson and others (1998), Schil-ling (1998), and Griswold (2004).
Precipitation
Measuring Precipitation
This section reviews the primary current methods for quantitative precipitation estimation (QPE) and quantitative precipitation forecasting (QPF).
Rain Gages
Rain gages are the oldest tool for measuring precipita-tion. Reports of daily precipitation are made by a network of approximately 10,000 cooperative observers across the United States. However, the vast majority of these reports are only of daily total accumulations, and they do not provide the kind of information on rainfall intensity, nor report it quickly enough, to be useful in flood- or debris-flow-forecasting applications. More useful for forecasting, but much less prevalent, are tipping bucket precipitation gages that provide time-resolved measurements of rainfall and snowfall (with heated gages). The reporting period of most tipping gages is usually 1 to 10 minutes, with a basic resolution amount of 0.01 to 0.04 inches per tip.
Although rain gages are often considered to be the standard of truth for QPE, their data are vulnerable to errors, including under-catch during windy conditions (especially for snowfall) and the inability of the tipping bucket mechanism to keep pace with intense rainfall. The tipping mechanism can also easily get out of proper balance, resulting in erroneous data for all rain rates, unless the gage is calibrated in the field periodically. More important, however, a gage provides only a point measurement, which may not be representative of other nearby locations and areas, particularly in mountainous terrain and for convective rain. Networks of gages are required to observe the area patterns of precipitation and to estimate the basin-average rainfall that contributes to debris-flow condi-tions. Denser networks of gages are preferable, but more expensive to install and maintain. Data from gage networks are
only useful for warning of precipitation-related hazards if they are communicated to users in real time. In spite of these short-comings, a well planned and maintained network of precipita-tion gages is essential for a debris-flow forecasting system. Fortunately these kinds of networks are already operational for flood-forecasting purposes in the debris-flow prototype region.
Radar
Radar has the ability to observe the intensity and spa-tial patterns of precipitation with resolutions that could only be duplicated by extremely dense networks of rain gages. Unlike gages, radar can also observe the precipitation aloft and offshore and can determine the trajectory of precipitation cells. Radar is able to detect approaching heavy rain cells, and its data are used to extrapolate rain amounts that are likely to fall within the next hour or two. This “nowcasting” capabil-ity provides precious forecast lead time for Warnings that cannot be obtained with a rain-gage network alone. Storm-surveillance radar is the cornerstone for short-term forecast and warning procedures for various weather hazards. The national network of operational storm-surveillance radars was tremendously improved with the arrival in the 1990s (at about the time the San Francisco Bay area debris-flow Warnings were terminated) of the WSR-88D (NEXRAD) radars. There are more than 100 of these Doppler radars across the United States operating around-the-clock with highly sophisticated displays and algorithms for detecting various weather haz-ards, including heavy rainfall (Crum and Alberty, 1993). The NEXRAD configuration and capabilities in southern Califor-nia are described in more detail in the section on “Existing Meteorological Systems.” Spatially detailed instantaneous maps of rainfall intensity and accumulation from these radars can provide vital input for Warnings of water-related hazards. Thus, the operational radars are essential for a new debris-flow forecast/warning system. But they too have limitations that must be addressed.
Radar transmits pulses of microwave energy that are reflected back to the radar antenna from raindrops, snow-flakes, and other particles in the atmosphere. For rainfall, the strength of the reflected signal (reflectivity, Z) is related to the rainfall intensity, R. However, the physical relationship is imprecise, because Z and R are fundamentally related to dif-ferent moments of the drop size distribution (DSD). The DSD can vary from one storm to another and within regions of the same storm, and it is almost never known a priori. Therefore, meteorologists usually resort to using empirical Z-R relations from past storms that may be inaccurate when applied to new storms, depending on the DSD actually present.
These reflectivity-based QPE may be further degraded by other circumstantial factors, including inaccurate hardware calibrations; partial beam filling; partial beam blockage by ter-rain; attenuation; and contaminations by the presence of hail, snow, and melting snow at the freezing level (which causes a signal enhancement called the “bright band”), ground clutter,
Precipitation �
and echoes from airborne nonhydrometeor targets. Many of these problems are accentuated with increasing distance from the radar because a horizontally directed radar beam increas-ingly departs from the ground and broadens with range. In carefully controlled analyses, where most problematic factors are ruled out, comparisons of radar-reflectivity-derived rainfall accumulations agree with coincident gage measurements to within about 20 percent. However, under more general condi-tions, comparisons frequently show differences of as much as a factor of 2. The situation is worse for radar estimates of snowfall.
Many of the problems associated with reflectivity-based radar QPE can be avoided or mitigated if the radar has polarimetric capability. Comparing the amplitude and (or) phase of the reflected signals in two orthogonal polarizations provides information about the shape of the scattering parti-cles. This allows polarimetric radar to distinguish raindrops, snowflakes, hail, and various other hydrometeors as the dominant particles within different portions of a storm cloud. The differential phase method uses the polarimetric informa-tion about raindrop shapes to obtain estimates of rainfall rate that avoid many of the problems related to reflectivity-based estimates (NRC, 2002). Only a few meteorological research radars worldwide now have these polarimetric capabilities. The national network of operational NEXRAD radars is expected to begin upgrades to include polarimetry starting in about 2008–10, however.
Unfortunately, many NEXRAD radars, especially in mountainous States, have large scan coverage gaps that occur because the beam is blocked at low levels by terrain features. Some NEXRAD radar antennas are mounted on peaks to minimize terrain blockage. However, this tactic also produces problems because the antenna does not point below the horizon, and, thus, key low altitudes of the atmosphere beneath the peak are not observed. This data-void region expands vertically with distance from the antenna. Although coverage at higher altitudes is good, precipitation generally exhibits sharp vertical gradients that render higher altitude observations poor indicators of the more important near-surface conditions.
The cost of relocating a NEXRAD radar for better scan coverage in a debris-flow warning system is prohibitive. How-ever, the data voids can be effectively filled using additional, much smaller radars that are mobile or transportable (NRC, 2002). Strategically positioned near a crucial basin or moun-tain range, these “gap-filling” radars can augment the WSR-88D coverage with high-resolution (~150 m) observations of the storms in and beyond the gaps. Upward-pointing profiling radars can also provide continuous high-resolution measure-ments of the boundary-layer winds that govern the upslope forcing of precipitation production and reveal microphysical features aloft of the precipitation itself, such as the height of the melting layer.
Transportable and mobile gap-filling radars and profil-ing radars are available from the NOAA research laboratories and other agencies. Prime examples include an X-band trans-
portable polarimetric radar (X-Pol) from NOAA’s Environ-mental Technology Laboratory (ETL), mobile Doppler radars (SMART-R) from NOAA’s National Severe Storms Labora-tory (NSSL), and 915-MHz wind-profiling and S-band pre-cipitation-profiling (S-PROF) radars from NOAA/ETL and NOAA’s Aeronomy Laboratory (AL). These are advanced remote-sensing instruments, currently used for research, have great potential as operational monitoring tools. The section “Precipitation Measurement” describes how they can imme-diately become important parts of an intensive research facet of the proposed debris-flow warning program in southern California to address anticipated weaknesses of the prototype system that will initially rely on operational, but limited, tools.
Multisensor Techniques
In addition to using better rain gages and radars, QPE inaccuracies can also be reduced by making intelligent use of the complementary nature of these and other sensors. One approach, simple in concept, is to use real-time point-specific data from gages beneath the radar beam as continu-ously updating “calibrators” of the radar data and then apply-ing these adjusted or “blended” estimates to the entire scan region, including the vast area between gages (Brandes, 1975).
More sophisticated multisensor (blended or hybrid) methods for improving area estimates of precipitation are now experiencing rapid development at NOAA’s Office of Hydro-logic Development (OHD) and NOAA/NSSL. Eventually a single system is expected to evolve from these beginnings to become an operational tool for the NWS. The method devel-oped at NSSL, for example, called Quantitative Precipitation Estimation and Segregation Using Multiple Sensors (QPE-SUMS) integrates and quality-controls data from rain gages, NEXRAD, and Federal Aviation Administration (FAA) Doppler radars, Geostationary Operational Environmental Satellites (GOES), lightning-detection networks, surface and upper-air meteorological data, and numerical-forecast mod-els to produce an ensemble of precipitation estimates. Each ensemble product has strengths and weaknesses that vary with season, geography, and precipitation type. For instance, research from a limited-area deployment (Gourley and others, 2002) showed that calibrated satellite-based estimates outper-form those from radar-only algorithms during the cool season in complex terrain (where NEXRAD data voids are a serious problem). An experimental national-scale implementation of this system begins in 2005. Blended precipitation estimates from systems, such as this, are another new key element for a debris-flow warning program.
Forecasting
Note: The information in points 1 through 9 in this sec-tion is adapted from Carter and others (1999).
10 NOAA-USGS Debris-Flow Warning System—Final Report

The current NWS forecast process for quantitative precip-itation forecasting (QPF) involves numerical weather predic-tion (NWP) and statistical guidance, the Hydrometeorological Prediction Center (HPC), Weather Forecasting Offices (WFO), and River Forecasting Centers (RFC). The final step, (10 below) “preparation of the National Digital Forecast Database (NDFD)” is available only in experimental fashion as of the writing of this report. Because of its importance to the debris-flow forecasting system, the separate steps involved in its preparation are also shown. Additional information is included in Appendix A “Functions of NWS Organizations Involved in the Preparation of Precipitation Forecasts.”
The fundamental steps for the preparation of precipitation forecasts at the NWS are:
1. The real-time collection of observations, which include all in situ and remotely sensed data;
2. The assimilation of data into operational NWP models in real time via the National Centers for Environmental Prediction (NCEP) model-based data assimilation sys-tems;
3. The application of the NCEP global, regional, and mesoscale atmospheric models and ensemble predic-tion systems;
4. The automated generation, dissemination, and use of national statistical guidance products;
5. The manual generation and dissemination of national QPF guidance products from the HPC of NCEP;
6. The manual production of local QPF products at WFOs and their dissemination to servicing RFCs and other users;
7. The assimilation of WFO-prepared QPFs by RFCs for input to the hydrologic forecast system;
8. The production of hydrologic and flood guidance at RFCs and its provision to the WFOs within the RFC forecast domain;
9. The preparation of all public hydrologic Forecast, Watch, and Warning products at WFOs, and the coor-dination of this information with emergency managers, the media, and other end users; and
10. Preparation of the National Digital Forecast Database (NDFD) (adapted from Boyer, 2003)
· WFOs send new forecast grids as they are updated; · gridded forecast data received from WFOs around
the clock; · WFO grids decoded at NDFD Central server every
5 minutes and stored to the relational database management system (RDBMS);
· NDFD mosaics are generated hourly, starting at 10 minutes prior to the top of the hour;
· mosaics are encoded in Gridded Binary Data Edi-tion 2 (GRIB2) format and transferred to NWS Telecommunications Gateway (NWSTG); and
· latest hour’s mosaics available for File Transfer Protocol (FTP) download at NWSTG by 15–20 minutes past the top of the hour.
Debris-Flow Warning Systems
This section starts with a review of existing debris-flow warning systems, followed by an evaluation of the current capabilities and limitations within NOAA and the USGS. “Elements of an Operational Debris-Flow Warning Sys-tem,” and the following section, “A Prototype Debris-Flow Warning System,” cover the prototype system that the Task Force recommends for implementation given the operational capabilities and limitations at the USGS. The same section includes a subheading with feedback received from potential users of the system. This feedback is compared to the charac-teristics of the recommended prototype debris-flow warning system.
Review of Existing Systems
Intensity-duration thresholds, in combination with rainfall forecasts and real-time rainfall measurements, have been the basis for operational landslide warning systems in several areas. These systems are typically operated over broad regions where people and infrastructure are at risk from shallow landslides. The Hong Kong Geotechnical Engineer-ing Office established a warning system in 1977 (Chan and others, 2003); continuous data collection and periodic review has resulted in significant improvement of the criteria for issuing and canceling Warnings of impending landslides. The USGS, in cooperation with the National Weather Service, operated a debris-flow warning system in the San Francisco Bay region from 1986 to 1995 (Keefer and others, 1987; Wilson and others, 1993; Wilson, 1997). In Rio de Janeiro, the Alerta Rio System consists of a network of 30 telemetered rain gages and weather radar and has been used by opera-tional forecasters to issue Warnings for landslides and (or) flash flooding to government agencies and the public during severe rainstorms (d’Orsi and others, 2004). The Soil and Water Conservation Bureau of the Council of Agriculture in Taiwan has developed a debris-flow warning system that consists of a linked network of real-time-reporting rain gages, a series of flow-detection devices, and cameras (Taiwan Soil and Water Conservation Bureau). The State of Oregon oper-ates a landslide warning system in western Oregon based on comparison of rainfall intensity-duration thresholds with measured rainfall accumulations (Mills, 2002). In the United Kingdom, data from an extensive instrument network that detects movement in a large landslide complex are combined with rainfall information to warn residents of periods when landslide activity can be expected (Cole and Davis, 2002). Baum and others (2005) proposed an integrated system consisting of field measurement of precipitation, soil wetness, and pore pressures coupled with time-dependent infiltration models for unsaturated soils, rainfall forecasts, and intensity-duration thresholds as a comprehensive early-warning system near Seattle, Wash.
Debris-Flow Warning Systems 11
Current NOAA-USGS Capabilities and Limitations
The NOAA-USGS Task Force determined early in the study that the initial concept—that called for the NWS to sup-ply the USGS with precipitation estimation and forecasts grids and for the USGS to operate the debris-flow warning sys-tem—would not be feasible under current funding constraints. The reason was lack of resources to establish a 24 hour × 7 day (24×7) operation. As a feasible, implementable, and work-able solution at the prototype level, the Task Force agreed to use the NWS Flash Flood Monitoring and Prediction Program, to be followed by a system operating under the initial concept, once resources for its operation could be procured.
Elements of a Debris-Flow Warning System
A Debris-Flow Warning System (DFWS) should ide-ally consist of separate products for Outlooks, Watches, and Warnings that are specific in both space and time to allow for useful lead and planning times for system users—emergency managers, planners, and responders. Training of USGS and NWS personnel to understand pertinent issues in debris-flow processes and hazard-assessment techniques as well as in precipitation forecasting and measurement is critical. Outreach and information products designed to inform both system users and the public of the uses and limitations of the system are necessary. And last, methods to verify, and thus improve, the effectiveness of a system are required. These elements are described below.
Products
Products issued by a DFWS should include Outlooks, Watches, and Warnings for debris-flow activity. (See defini-tions in “Terminology” section.)
In the event of a forecast for precipitation in excess of a 10-year recurrence storm for a given area, the USGS will develop an Outlook statement. The Outlook statement will identify those counties that have some potential to experience debris flows and will include information specific to the threat of debris flows. Outlook statements will be updated as more precise precipitation forecasts become available.
A Watch will be issued by the USGS when forecast precipitation input to detailed hydrological and geological models for debris-flow susceptibility, hillslope hydrology, and slope stability indicate that debris flows are probable. The Watch statement will identify those areas that are most susceptible to debris flows, given the precipitation forecast, and will reflect the spatial and temporal uncertainty associ-ated with the forecast. The statement will include informa-tion specific to the threat of debris flow. Watch statements will be updated as more precise precipitation forecasts become available.
Warnings will be issued by the USGS when radar-derived precipitation estimates, observed rainfall data from ALERT (Automated Local Evaluation in Real Time) net-works, spotter information, and other gage data input into detailed hydrological and geological models for debris-flow susceptibility, hillslope hydrology, and slope stability indicate that debris flows are imminent or have a high probability of occurring. A Warning statement may identify the probability of debris-flow activity for specific areas, and will reflect any uncertainty with the precipitation measures. The statement will include information specific to the threat of debris flow. Warning statements will be updated as real-time precipitation data and reports of debris-flow occurrences warrant.
Any Outlook, Watch, or Warning statement will indi-cate that the product is a joint NOAA-NWS/USGS product and is based on USGS guidance. The description of the potential hazard will be written in a way that is understandable by emergency managers and public officials. Any Outlook, Watch, or Warning statement will include the following information:
· Issuance time: Debris-flow products are nonscheduled, event-driven products;
· Valid time: Debris-flow products will be valid until a time/date specified in the product or until cancelled or updated by another debris-flow product as advised by USGS;
· Universal geographic code (UGC) type: County codes will be utilized for debris-flow products;
· Mass news disseminator (MND) product line: The product line will indicate “Debris-Flow Outlook,” “Debris-Flow Watch,” or “Debris-Flow Warning” as appropriate and as indicated by the USGS for the threat;
· Headline defining the type of event expected and addi-tional vernacular names (e.g., debris flow, mudslide, mudflow);
· Identification of the area covered by the statement; · Potential time period for which the event can be
expected; · Relevant factors (e.g., quantitative precipitation fore-
cast, soil conditions, heavy rainfall, relation to thresh-old conditions, etc.);
· Likelihood of potential event; · Call to action statements as appropriate for the
expected event; and · A closing statement indicating when additional infor-
mation will be provided by the USGS and NOAA-NWS.
Data Forms and Formats
To assess the potential for debris flows and to determine the necessity of issuing Outlooks, Watches, and Warnings, the NWS will provide the USGS with data in three primary forms: (1) quantitative precipitation forecasts (QPF), (2) radar-derived
1� NOAA-USGS Debris-Flow Warning System—Final Report

precipitation estimates, and (3) observed rainfall data from the ALERT networks as well as spotter information and other gage data available for the County Warning Areas (CWAs) of the NWS Weather Forecast Offices (WFOs) participating in the Debris-Flow Warning Program. These data can potentially be used as near-real-time input into detailed hydrological and geological models for debris-flow susceptibility, hillslope hydrology, and slope stability by the USGS.
NWS forecast (QPF) data and radar observations will be transmitted by the NWS to the USGS in a format that can be readily incorporated into a geographic information system (GIS). Such a format might be, for example, ASCII grids in a defined coordinate system at the highest resolution pos-sible. The NWS will post the data to a site that can be readily accessed by USGS systems and (or) push the data directly from NWS systems to USGS systems. NWS and USGS Infor-mation Technology (IT) personnel will determine the most efficient and effective methodology for these data transfers based on the systems capabilities of both agencies. The par-ticipating WFOs will provide USGS with information on QPF storm totals and durations. These forecasts would be made available on a routine basis at time frequencies ranging from twice daily (every 12 hours during routine hydrometeorologi-cal periods) to four times per day (every 6 hours during events) with more frequent updates as required by the hydrometeoro-logical and (or) geological conditions. Quantitative estimates of rainfall accumulations from radar will be made available by NWS to USGS in near-real-time. Radar derived precipita-tion will be available for each WFO area every 5 minutes and will include 5-minute, 1-hour, 3-hour, and 6-hour accumulated precipitation as well as storm-total precipitation. Rainfall accumulations from the ALERT rain gage network and (or) other local mesonets will be made available to the USGS in near-real-time via transfer from NWS WFOs or through direct collection by USGS via an ALERT base station. NWS and USGS IT personnel will determine the most efficient and effective methodology for each participating WFO area. Other rain gage data, spotter reports of rainfall, and (or) reports of debris flows collected at WFOs within the area(s) of inter-est will be transmitted to USGS as received using established data-exchange methods.
Procedures and Protocols
USGS personnel will contact the appropriate WFO to advise they are providing Outlook/Watch/Warning statements via the Advanced Weather Interactive Processing System (AWIPS). The message will be formatted to alert the fore-caster of its arrival via an “Alarm” message at the forecaster’s workstation and will be a text product. NWS will assist the USGS with the technical and IT security details of delivering messages to the NWS through AWIPS.
Upon receipt at the WFO(s) of a USGS message indicat-ing the need for a debris-flow Outlook, Watch, or Warning, the impacted WFO forecaster will format and disseminate the
recommended product via a Public Information Statement Product (PNS) and via NOAA All Hazards Radio (also known as a NOAA Weather Radio (NWR)). The NWS electronic product will be a text product with a unique “Debris Flow” product header that the NWS/Western Region Headquarters (WRH) will obtain from National Weather Services Headquar-ters (NWSH). In addition, the product will contain Valid Time Event Coding (VTEC) and a request for Emergency Alert System (EAS) activation as appropriate for the level of alert product being issued.
Any Outlook, Watch, or Warning statements will refer-ence the USGS Landslide Hazards Program Web page, where the statements will be posted along with maps that show potential locations of debris-flow activity and impact zones, as are appropriate to the level of alert. Any statements will be provided to the USGS Senior Advisor for Science Applica-tions, the USGS Associate Directors for Geology and Water, the Director of the USGS National Landslide Information Center, the appropriate USGS Water Science Center, and the appropriate USGS Regional and Headquarters Offices of Communication for their information. If considered newswor-thy by the USGS, a press release that includes the Outlook, Watch, or Warning statement will be issued through the USGS Communications Office, but only after the PNS has been dis-seminated.
Training
Training developed by the USGS will be provided to WFO and River Forecast Center (RFC) staff, interested spot-ters, and other NWS volunteers. Training will address how and where debris flows are generated, what physical and meteo-rologic conditions are most likely to produce debris flows, and what products the USGS will be using as the basis for issuing Outlooks, Watches, and Warnings. Training will occur as 1-day sessions at each WFO and RFC and (or) as digital products that can be accessed as needed.
Outreach and Information
The USGS Landslide Information Officer will coordinate with his/her counterpart in the NWS region to develop an Out-reach Plan for each region for which a DFWS is implemented. Possible outreach products include press releases that describe the DFWS, and Fact Sheets that describe controls on debris-flow generation. The USGS Landslide Information Center toll-free number will be available for inquiries. All products should be in both English and Spanish.
Validation Methodology
Although the exploratory debris-flow-forecast project in the San Francisco area from 1986–95 listed a number of
Debris-Flow Warning Systems 1�
successful Forecasts and early Warnings of debris flows (e.g., Wilson and others, 1993), the evidence cited was often anec-dotal and subjective rather than systematic and objective. Any warning system should be evaluated more rigorously, while not discarding the less quantitative, but informative, testimo-nies.
The NWS conducts ongoing assessments of its skill for predicting various weather features, including Forecasts of heavy precipitation, flash-flood Warnings (was a flood fore-cast and did it occur or not?), and flash-flood Warning lead time (how far in advance of the flood was a Warning issued?). Predictions of binary (yes/no) events, such as the forecast of a flood or whether heavy precipitation (1 inch in 24 hours) will occur, are often evaluated by their the false alarm rate (FAR) and probability of detection (POD) scores. The threat score, or critical success index (Glickman, 2000), combines aspects of both FAR and POD and is used by the NWS to assess the skill of its heavy-precipitation and flash-flood forecasting methods and to chart year-to-year improvements. These same metrics can also be applied to debris-flow forecasting, assuming that all significant flows will be reported. However, agreement must be reached before the forecasting tests begin as to exactly what constitutes a validating debris flow in the prototype forecast area. Must the flow (or combined flows) exceed some specified volume to qualify? Is a single flow in the area dur-ing the forecast period sufficient to justify a forecast success? Following storms, field reconnaissance by USGS will be required to survey the Forecast/Warning region for evidence of flows and to document them with video photography. NOAA’s Storm Data reports from a variety of sources, including spot-ters, newspaper reports, and damage surveys will all be useful in the debris-flow-occurrence assessments. Additional, more sophisticated monitoring methods will be available within the smaller Intensive Research Area.
The success or failure of any warning system, however, goes beyond simple forecasting skill measures. Another important facet is assessing the effectiveness of the Warnings. This includes determining whether the Watches and Warnings reach the at-risk population in a timely manner and if actions, such as evacuation, are actually taken to escape the imminent danger. Victims killed by a debris flow that was correctly forecast may not have heard the Warning, or may have heard but ignored it. Their deaths will be well publicized, but it may never be known how many other people escaped peril because of the forecasts. Evacuations in Warning areas where debris flows fail to materialize (false alarms) are disruptive, costly, and may cause future Warnings to go unheeded. These matters are much more difficult to evaluate, but speak more directly to the overall effectiveness of the system than an assessment of forecasting skill alone. Therefore, the prototype system must interact closely with emergency management (EM) agencies to ensure the Forecasts and Warnings achieve maximum useful-ness and that subjective evaluations by emergency managers will constitute part of the prototype’s assessment. The EM evaluations can be obtained from a scheduled program of direct interviews before, during, and after each winter season
and by Web-page-based questionnaires. The latter tactic was successfully employed in NOAA’s Pacific Jets Experiment (PACJET) storm research project to evaluate the usefulness of new profiling radar observations to NWS forecasters. Evalua-tions by EM agencies must be a planned part of the program, not an afterthought.
A Prototype Debris-Flow Warning System
Southern California Setting
History of Debris-Flow Activity
Although limited numbers of debris flows are likely to occur somewhere in southern California during any given year, some winter storms have resulted in particularly abundant debris flows over broad areas. Summer thunderstorms have produced debris flows over limited areas.
· Storms during the winter of 1937–38 produced the floods of record for most gaging sites throughout southern California. At the time, a clear distinction was not made between floods and debris flows, but these events were reported to be responsible for 90 deaths, and 5,600 homes were destroyed (Los Angeles Times, 2004, 2005). Approximately $65 million in damage was caused by these events.
· Three months after the Bel-Air Brentwood fires of 1962, storms triggered debris flows that traveled down Hollywood Boulevard. Twenty-one deaths were attrib-uted to the storms (Los Angeles Times, 2005).
· The winter of 1968–69 brought back-to-back storms in January and February. These storms resulted in flooding and debris flows in the San Gabriel and San Bernardino mountains that caused 11 deaths (California Department of Water Resources, 2005). Debris flows and flash floods from hillslopes burned the previous summer above the town of Glendora transported more than a million m3 of material from the burned basins (Scott, 1971).
· Heavy winter rainfall during February and March 1978 resulted in widespread landslide and debris-flow activ-ity in Ventura, Los Angeles, Orange, Riverside, and San Bernardino Counties (Weber and others, 1979).
· During the winter of 1979–80 1,450 homes were destroyed and $7 million damage was wrought by flooding and debris flows in Los Angeles, Orange, Riv-erside, and Ventura Counties (Weber and others, 1980). Some of this damage was caused by debris flows gen-erated from hillslopes burned the previous summer in the San Gabriel Mountains (Shuriman and others, 1985)
· Storms during the winter of 1982–83 resulted in $106 million in damages from flooding and debris flows.
· The winter of 1992–93 brought flash floods and debris flows which resulted in eight deaths in southern Cali-fornia (Los Angeles Times, 2005).
1� NOAA-USGS Debris-Flow Warning System—Final Report

· The winter of 1997–98 brought debris flows and floods to the entire southern California area. Activity was par-ticularly severe from recently burned basins (Cannon, 2000). One death occurred in Laguna Canyon.
· In late October and early November 2003, wildfires burned more than 700,000 acres in Los Angeles, Riv-erside, San Bernardino, San Diego, and Ventura Coun-ties. A storm on Christmas Day 2003, which caused 16 deaths, resulted in debris flows and flash floods from nearly all of the recently burned basins. In response, $26.5 million was spent to repair roads and to remove the 4.1 million m3 of material deposited in debris-retention basins (Pat Mead, San Bernardino Flood Control District, oral commun.).
· A series of storms from October 2004 through March 2005 impacted southern California, and many areas received record amounts of precipitation. These storms triggered widespread floods, landslides, and debris flows; losses are expected to reach $500 million.
Geology
Southern California consists of a series of prominent mountain ranges with intervening valleys, coastal plains, and river basins (fig. 4). The Peninsular Range, which includes the Santa Ana Mountains north of Los Angeles, is located south of the Los Angeles Basin and trends northwest to southeast following the San Andreas fault. The San Jacinto and San Bernardino mountains east of the Upper Santa Ana River basin follow a similar trend. Immediately north of the Los Angeles Basin, the mountains trend east-west, giving rise to the Trans-verse Range (the San Gabriel Mountains, the Santa Monica Mountains, the Topatopa Mountains, and the Santa Ynez Mountains). North of the Transverse Range, the Sierra Madre and Santa Lucia Ranges again trend northwest-southeast. Most of these mountains are bounded by faults and have broad alluvial plains extending to the south along which major high-way corridors have been built. Active uplift, combined with fractured, weak rocks and actively downcutting streams, create remarkably steep hillslopes that are susceptible to debris flows following heavy rainstorms.
The Transverse Ranges and San Bernardino Mountains are particularly well known for producing large flash floods and debris flows following wildfires (e.g., Anderson and others, 1959; Doehring, 1968; Campbell, 1986; Scott and Williams, 1978; Wells, 1981, 1982, 1987; Rice, 1974; Wohl-gemuth, 1986; Cannon, 2000). Watersheds are steep and rugged, rising abruptly from valley floors to general eleva-tions of 2,000 to 2,500 m, and to extreme elevations of more than 3,000 m. Drainage networks are deeply incised with steep side slopes. The mountains are composed of a complex assembly of easily weathered, extensively faulted, coarsely crystalline igneous and metamorphic rocks in the south, and sedimentary sequences in the north (State of California, 1967, 1969; Scott and Williams, 1978). Soils generally are composed of shallow, rocky, sandy loams, less than 1 m
thick, and they show little evidence of profile development (Wells, 1981).
The Peninsular Ranges, which include the Santa Ana Mountains, are generally less steep and less deeply incised than the Transverse Ranges and are composed primarily of weathered granite batholiths that intruded into marine sedi-ments and volcanic and metavolcanic rocks (State of Cali-fornia, 1965; Hart, 1991). The Sierra Madre and Santa Lucia mountains are composed principally of marine and nonmarine sedimentary rocks and some metamorphic rocks (State of California, 1958).
Vegetation
Mountain-front slopes are vegetated most commonly with combinations of annual grasses, coastal sage scrub, and chaparral—a vegetation complex that is composed predominantly of highly flammable, woody, shrub-like plants. Typical coastal sage scrub species include Salvia mellifera, Salvia apiana, Encelia farinosa, and Eriogonun fasciculatum (Morton, 1989). Typical chaparral species include chamise (Adenostoma fasiculatum), California lilac (Ceanothus spp.), manzanita (Arctostaphylos spp.), and scrub oak (Quercus Dumosa) (Campbell, 1986). In general, grasses and coastal sage scrub species occupy lower elevations and transition into chaparral at slightly higher elevations, owing to generally increasing precipita-tion and cooling temperatures with elevation (Minnich, 1989). Chaparral can be replaced by oak woodland and conifer forests at higher elevations (Mooney and Parsons, 1973; Minnich, 1989). Riparian woodland occupies stream courses (Mooney and Parsons, 1973).
Climatology and Meteorology
The Mediterranean climate of southern California is characterized by hot, dry summers and cool, wet winters. The driest months are July and August, and the period from August to November is one of hot, dry desiccating winds called Santa Anas. These winds blow across California in a south-southwesterly direction and can create conditions of extreme fire danger in a matter of hours (Wells, 1981). The rainy sea-son begins in December and lasts until mid-April; January and February are the wettest months.
Figure 5 shows a map of average annual precipitation for southern California. The orographic influence on the distri-bution of precipitation is apparent. Mountain ranges in the coastal region receive annual averages of approximately 40–45 inches per year, whereas adjacent basins receive less than half that amount. The seasonal distribution of precipitation is also very uneven. More than 90 percent of the annual aver-age precipitation at Los Angeles and San Diego falls in the November to April period. The spatial and temporal concen-trations of precipitation make the southern California coastal region highly susceptible to flash floods and debris flows in the winter months.
Debris-Flow Warning Systems 1�

The coastal mountains represent a significant barrier to lower tropospheric onshore flow. These mountains can pro-vide lift of moisture-laden air even under the typically stably stratified conditions found in Mediterranean-type climates. Indeed, substantial rainfall often occurs when strong winds associated with extratropical cyclones force high-humidity air up the mountain slopes. Not infrequently, a concentrated plume of moisture originating in the subtropics near Hawaii (the “pineapple express,” or atmospheric river (e.g., Ralph and others, 2004)) produces persistently heavy precipitation along California’s coast. The intense storm events usually involve relatively shallow bands of rain and showers. It is not uncom-mon to see tops of radar echoes reaching only 3 km or less above sea level. Despite a low-lying freezing level (around 2 km) during the winter months, the coastal convergence and orographic uplift may still result in significant concentrations of liquid water within the shallow warm cloud layer. In addi-tion to the broad-scale airflow that produces the orographically enhanced precipitation, embedded thunderstorms contribute even more intense localized downpours for short periods, thereby increasing flood and debris-flow threats. Thus, winter
storms can produce more than 200 mm (8 in.) of rain in 24 hours and strong surface winds in excess of 50 mph. Interan-nual variations in the mean storm track due to “El Niño” con-ditions often exacerbate the southern California flood problem by setting up a pattern of repeated heavy storms over a period of weeks. The recent 8–10 January 2005 event had recorded weekly precipitation amounts in excess of 28 inches at some mountain rain-gage locations
Existing Meteorological Operational Systems
Successful debris-flow Warnings will depend strongly upon accurate real-time observations and short-term forecasts of rainfall. The rainfall observation infrastructure in southern California has been augmented through the years to provide for a relatively high density distribution of rain gages and a few NWS radar sites (fig. 6).
The ALERT gage network, maintained by local flood- and water-control districts, is the backbone of this system. The ALERT system was developed by the National Weather Service (NWS) California-Nevada River Forecast Center
Figure �. Topography of southern California.
SAN LUISOBISPO
KERN
SAN BERNARDINO
SANTA BARBARA
VENTURA
LOS ANGELES
ORANGERIVERSIDE
SAN DIEGO
Los AngelesBasin
SAN BERNARDINO
MTS
SAN JACINTO MTS
SAN GABRIELMTS
SANTA MONICAMTS
SANTA YNEZMTS
SANTA LUCIA
RANGE
SANT
A ANA
MT
S
TOPATOPAMTS
SIERRA MAD
RE
CALIF
OR
NIA
STUDY AREA
0 50 miles
0 50 kilometers
County boundaries
EXPLANATION
1� NOAA-USGS Debris-Flow Warning System—Final Report
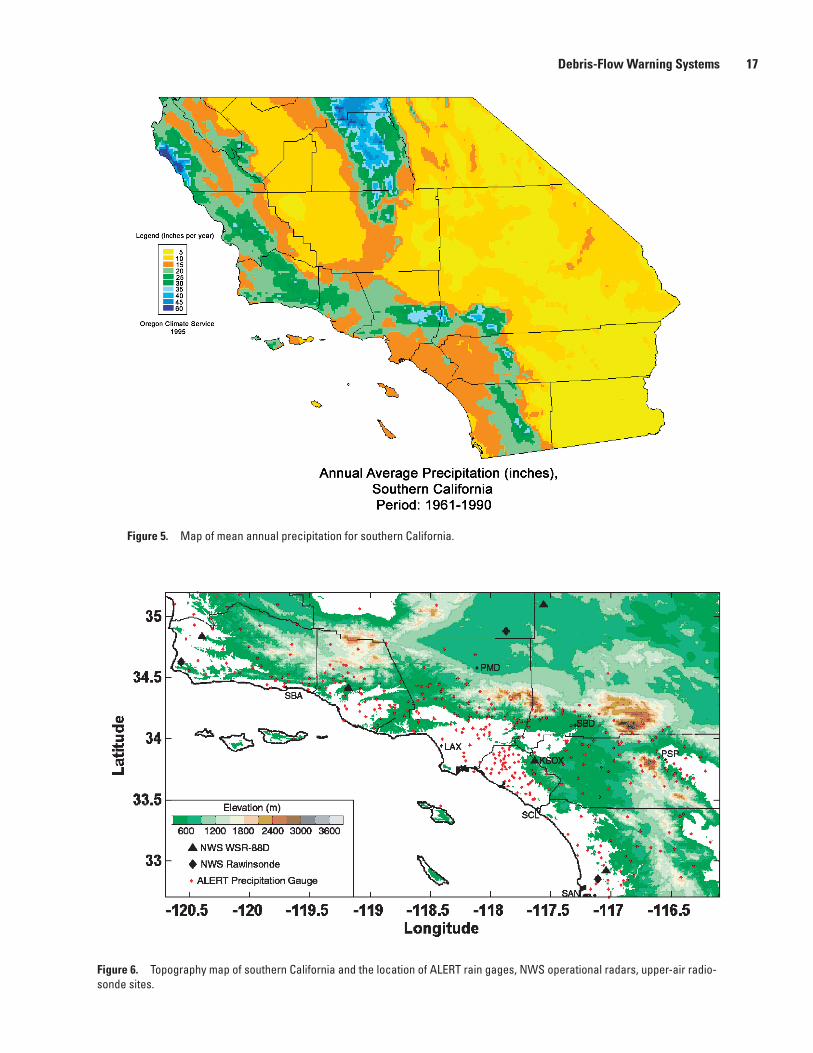
Figure �. Map of mean annual precipitation for southern California.
Figure �. Topography map of southern California and the location of ALERT rain gages, NWS operational radars, upper-air radio-sonde sites.
Debris-Flow Warning Systems 17

(CNRFC) in the late 1970s with the intention of provid-ing local communities with a low-cost means of acquiring real-time rainfall and streamflow data to better evaluate flood potential. Components of the ALERT system particularly relevant for debris-flow warning include precipitation and stream gages. Most ALERT precipitation gages are a stan-dard tipping bucket design. When the buckets tip (0.04 inches accumulation), a signal is sent to a central ALERT command center, which in turn transmits the information to a flood-control district office. Based on the history of precipitation at each ALERT station, an alarm will sound when the amount of precipitation reaches a threshold value that is known to result in flooding. Similarly, when river levels reach a predetermined stage, flood-stage sensors send information to the flood-con-trol district offices and the local office of the NWS. Real-time data also go directly to the county’s Emergency Operations Center and county road-crew supervisors to prepare them for the potential of flash flooding. Reports also are received from trained spotters and observers, emergency managers, law-enforcement officials, and the public to indicate where flood-ing has begun or is imminent. A number of other networks of rain gages are operated by various other agencies at more
limited locations. This includes USGS stream gages in some mountain ranges in southern California.
Figure 7 shows the distribution of ALERT rain gages and operational radar coverage in southern California from the network of NEXRAD radars. The coverage indicates where the radar beam can observe conditions less than 1 km above ground level. Significant gaps are evident in the low-level coverage due to beam blockage and other factors. Green lines are county boundaries. There are more than 300 ALERT rain gages in the region. Four NWS NEXRAD radars cover the region: San Diego (KNKX), Los Angeles–Santa Ana (KSOX), Sulphur Mountain–Ventura (KVTX), and Barstow (KEYX). NEXRAD radars operate continuously, scanning the three-dimensional volume surrounding the radar with prescribed coverage patterns. To produce rainfall maps, an empirical relationship between reflectivity and rainfall is used and the data converted to Cartesian (i.e., x, y, z) grids. The grids can be updated every volume scan (i.e., 5–6 minutes) and made avail-able on the Internet. (See fig. 8 and http://weather.noaa.gov/radar/mosaic/DS.p19r0/ar.us.conus.shtml.)
NEXRAD’s data-void problems were previously described in general terms. These scan-coverage gaps are par-
Figure 7. Southern California ALERT rain gage locations (red dots) and WSR-88D radar low-level (below 1 km above ground level) coverage (blue regions).
1� NOAA-USGS Debris-Flow Warning System—Final Report
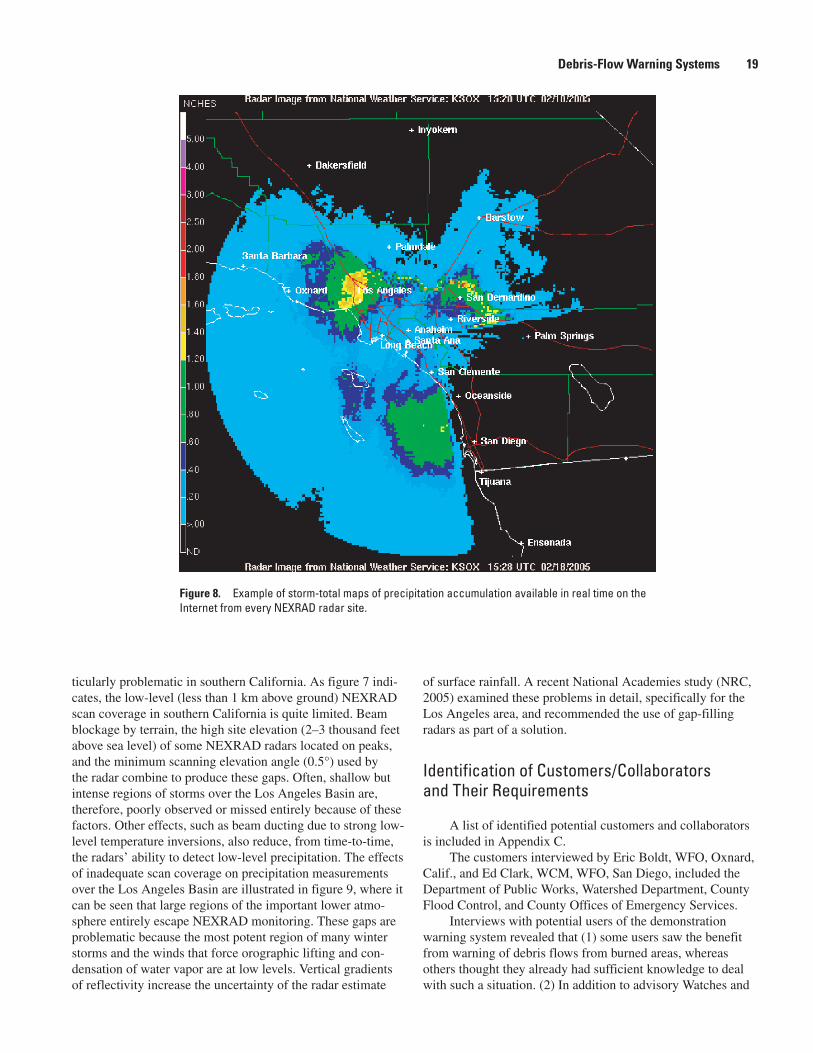
ticularly problematic in southern California. As figure 7 indi-cates, the low-level (less than 1 km above ground) NEXRAD scan coverage in southern California is quite limited. Beam blockage by terrain, the high site elevation (2–3 thousand feet above sea level) of some NEXRAD radars located on peaks, and the minimum scanning elevation angle (0.5°) used by the radar combine to produce these gaps. Often, shallow but intense regions of storms over the Los Angeles Basin are, therefore, poorly observed or missed entirely because of these factors. Other effects, such as beam ducting due to strong low-level temperature inversions, also reduce, from time-to-time, the radars’ ability to detect low-level precipitation. The effects of inadequate scan coverage on precipitation measurements over the Los Angeles Basin are illustrated in figure 9, where it can be seen that large regions of the important lower atmo-sphere entirely escape NEXRAD monitoring. These gaps are problematic because the most potent region of many winter storms and the winds that force orographic lifting and con-densation of water vapor are at low levels. Vertical gradients of reflectivity increase the uncertainty of the radar estimate
of surface rainfall. A recent National Academies study (NRC, 2005) examined these problems in detail, specifically for the Los Angeles area, and recommended the use of gap-filling radars as part of a solution.
Identification of Customers/Collaborators and Their Requirements
A list of identified potential customers and collaborators is included in Appendix C.
The customers interviewed by Eric Boldt, WFO, Oxnard, Calif., and Ed Clark, WCM, WFO, San Diego, included the Department of Public Works, Watershed Department, County Flood Control, and County Offices of Emergency Services.
Interviews with potential users of the demonstration warning system revealed that (1) some users saw the benefit from warning of debris flows from burned areas, whereas others thought they already had sufficient knowledge to deal with such a situation. (2) In addition to advisory Watches and
Figure �. Example of storm-total maps of precipitation accumulation available in real time on the Internet from every NEXRAD radar site.
Debris-Flow Warning Systems 1�
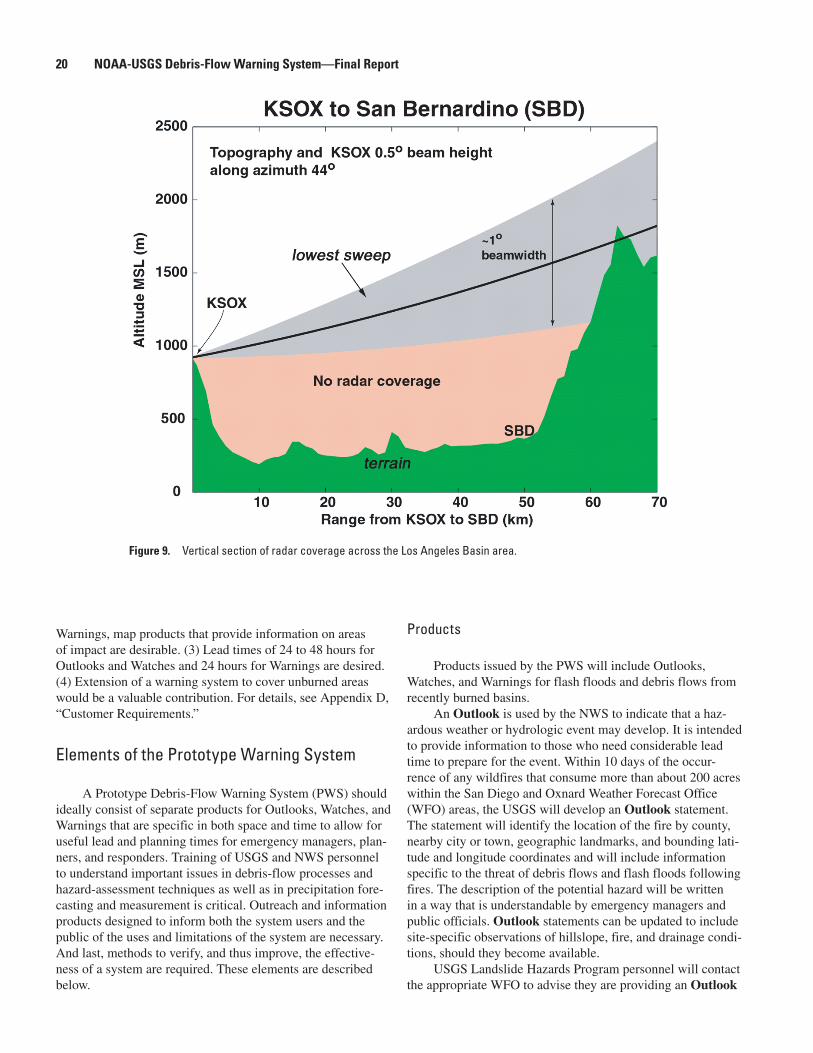
Warnings, map products that provide information on areas of impact are desirable. (3) Lead times of 24 to 48 hours for Outlooks and Watches and 24 hours for Warnings are desired. (4) Extension of a warning system to cover unburned areas would be a valuable contribution. For details, see Appendix D, “Customer Requirements.”
Elements of the Prototype Warning System
A Prototype Debris-Flow Warning System (PWS) should ideally consist of separate products for Outlooks, Watches, and Warnings that are specific in both space and time to allow for useful lead and planning times for emergency managers, plan-ners, and responders. Training of USGS and NWS personnel to understand important issues in debris-flow processes and hazard-assessment techniques as well as in precipitation fore-casting and measurement is critical. Outreach and information products designed to inform both the system users and the public of the uses and limitations of the system are necessary. And last, methods to verify, and thus improve, the effective-ness of a system are required. These elements are described below.
Products
Products issued by the PWS will include Outlooks, Watches, and Warnings for flash floods and debris flows from recently burned basins.
An Outlook is used by the NWS to indicate that a haz-ardous weather or hydrologic event may develop. It is intended to provide information to those who need considerable lead time to prepare for the event. Within 10 days of the occur-rence of any wildfires that consume more than about 200 acres within the San Diego and Oxnard Weather Forecast Office (WFO) areas, the USGS will develop an Outlook statement. The statement will identify the location of the fire by county, nearby city or town, geographic landmarks, and bounding lati-tude and longitude coordinates and will include information specific to the threat of debris flows and flash floods following fires. The description of the potential hazard will be written in a way that is understandable by emergency managers and public officials. Outlook statements can be updated to include site-specific observations of hillslope, fire, and drainage condi-tions, should they become available.
USGS Landslide Hazards Program personnel will contact the appropriate WFO to advise they are providing an Outlook
Figure �. Vertical section of radar coverage across the Los Angeles Basin area.
�0 NOAA-USGS Debris-Flow Warning System—Final Report

via the Advanced Weather Interactive Processing System (AWIPS). The message will be formatted to alert the fore-caster of its arrival via an “Alarm” message at the forecaster’s workstation and will be a text product. (NWS will assist the USGS with the technical and IT security details of delivering messages to the NWS through AWIPS.) Forecasters on duty will, in turn, disseminate the Outlook statement to emergency managers, responders and the general public through estab-lished dissemination procedures as a PNS (Public Information Statement product). The Outlook statements will reference the USGS Landslide Hazards Program Web page, where state-ments will be posted along with maps that show the locations of each fire. The Outlook statements will be provided to the USGS Senior Advisor for Science Applications, the USGS Associate Directors for Geology and Water, the Director of the National Landslide Information Center, the USGS California Water Science Center, and the USGS Western Region and Headquarters Offices of Communication for their informa-tion. If considered newsworthy by the USGS, a press release that includes the Outlook statement will be issued through the USGS Communications Office, but only after the PNS has been disseminated.
A Watch is issued by the NWS when the risk of a hazardous weather or hydrologic event has increased signifi-cantly, but its occurrence, location, and (or) timing are still uncertain. It is intended to provide enough lead time so that those who need to set their plans in motion can do so. Lead times are at most, less than 3 days, and can be as short as a few hours.
A Warning is issued when a hazardous weather or hydrologic event is occurring, is imminent, or has a very high probability of occurring. A Warning is used for condi-tions that pose a threat to life or property. Desired lead times would be within 1 day, but developing conditions might cause them to issued with lead times as short as 30 minutes. Within the PWS, Watches and Warnings will be issued by the NWS using the Flash Flood Monitoring and Prediction (FFMP) system described in the next paragraph. The system will use the debris-flow threshold curves developed by the USGS (see, for instance, fig. 2). Depending on whether the actual or forecast conditions fall within the orange or red zones, the NWS will issue a corresponding Watch or Warn-ing, respectively.
Implementation
To best utilize available personnel and operational resources, the PWS will use as its foundation the existing NWS procedures in place to monitor and forecast the potential for flash floods, including the Flash Flood Monitoring and Prediction (FFMP) system. With the tools available to the WFO forecaster, precipitation forecasts (QPF), quantitative estimates of rainfall accumulations and intensities from radar observations, and actual precipitation accumulations (AP) are compared in real time to user-defined guidance, or thresholds, for event occurrences. Information is evaluated relative to
counties and FFMP basins. Flash-flood thresholds, or flash-flood guidance, is provided to the WFOs by the River Forecast Centers (RFC) to assist the forecaster in determining if condi-tions warrant the issuance of a flash-flood Watch or Warning.
The USGS Landslide Hazards Program will provide geo-logic guidance for the onset of flash floods and debris flows from recently burned basins in the form of rainfall thresholds for each of the FFMP basins within the San Diego and Oxnard WFO areas in a form compatible with current NWS data structure. These data will be provided to the WFOs. NWS per-sonnel will use their meteorologic expertise in predicting and monitoring precipitation to determine when and if threshold conditions will be met and to determine if conditions warrant the issuance of a flash-flood Watch or Warning. USGS Land-slide Hazards Program personnel will be available through the AWIPS system for consultation during working hours, or on a 24×7 basis if conditions warrant, in the event that precipitation forecasts appear to exceed the provided thresholds.
Procedures and Protocols
Watches will be disseminated to emergency-response personnel and the public through AWIPS, with activation of the Emergency Broadcast System (EMS) when appropriate. Watch and Warning statements will include the elements pres-ently included in such statements (Issuance Time, Valid Time, etc.) in addition to language specific to recently burned areas provided by the USGS. USGS Landslide Hazards Program personnel will be informed when a Watch or Warning is issued through the AWIPS system. Landslide Hazards Pro-gram personnel will, in turn, provide information to the USGS Senior Advisor for Science Applications, the USGS Associate Directors for Geology and Water, the Director of the National Landslide Information Center, the USGS California Water Sci-ence Center, and the USGS Western Region and Headquarters Offices of Communication for their information.
Training
Training developed by the USGS will be provided to WFO and RFC staff, interested spotters, and other NWS volunteers. Training will address how surface hydrology is changed by wildfire, what processes result in the generation of fire-related debris flows (and how these processes differ from those that generate debris flows in unburned settings), what conditions are most likely to result in debris flows (short-recurrence-interval storms, material properties, etc.), the derivation of the rainfall thresholds, and our confidence in those thresholds. Training will occur as 1-day sessions at each WFO and at the RFC and (or) as digital products that can be accessed at one’s convenience.
Outreach and Information
The outreach and information plan for the prototype sys-tem is identical to the one for the full operational system.
Debris-Flow Warning Systems �1

Validation Methodology
The validation methodology for the prototype system is identical to the one for the full operational system.
Research
The initial prototype will be based on currently available operational capabilities and represents the lowest cost system that can provide a minimum of service. However, the proto-type system should also involve a strong research component to address various anticipated weaknesses of these capabilities for the sake of making near-term and future improvements. These research activities, to be conducted primarily within the Intensive Research Area, are described in the “Intensive Research Area” section and described more extensively in the “Future Development” section. Some of the research activities could begin as part of the initial deployment of the prototype
system as early as the winter of 2005–06; others involve longer lead times. All will require new funding beyond the requirements of the minimum system.
Implementation Plan of the Prototype Warning System
The time line and activities to be completed before Octo-ber 2005 are shown in table 1.
Implementation and Operational Costs of the Prototype Warning System
The activities required to operate the prototype warning system are part of ongoing project and (or) operations costs both at the USGS and at the NWS. Therefore, no additional
Table 1. Prototype implementation plan.
Accomplishment date Activity
June 15, 2005 USGS will establish agreements and procedures with Geospatial Multi-Agency Coordination (GeoMAC) and fire suppression agencies to provide burn perimeter and burn severity data to USGS in a timely manner.
June 15, 2005 An outreach plan will be developed by the USGS Landslide Information Officer and his/her counterpart in the NWS region.
June 15, 2005 FFMP basin coverage for the San Diego and Ventura/Oxnard WFO areas will be provided by the NWS to the USGS.
July 15, 2005 USGS will develop rainfall thresholds for debris flows and flash floods from recently burned areas within the San Diego and Ventura/Oxnard WFO areas.
August 1, 2005 FFMP basin coverage of the rainfall thresholds will be developed by the USGS and provided to the NWS.
August 1, 2005 NWS will provide USGS access to AWIPS system as the designated communication system. This access will be tested both by the WFOs and the USGS to ensure that two-way communication is established.
August 15, 2005 Base maps of the areas covered by the San Diego and Ventura/Oxnard WFOs showing cities, road networks, topography, and primary river systems will be assembled by USGS.
August 15, 2005 Text specific to flash-flood and debris-flow hazards from recently burned areas for inclusion in the Outlook, Watch, and Warning statements will be developed jointly by the WFOs and the USGS and approved by the appropriate officials.
September 1, 2005 The outreach plan developed by the USGS Landslide Information Officer and his/her counterpart in the NWS region will be implemented.
September 1, 2005 A training program for NWS personnel that includes digital products and 1-day hands-on training will be provided by the USGS.
October 1, 2005 Updated rainfall thresholds to account for seasonal-scale vegetation recovery and sediment source depletion will be developed by the USGS and provided to the NWS.
�� NOAA-USGS Debris-Flow Warning System—Final Report

operational costs are expected at either agency. Funding for the recommended research components of the system repre-sents additional costs.
Operational Considerations
Entrance/Exit Strategies
The proposed debris-flow warning system for recently burned areas in southern California is designed to be a prototype system and is being assembled with NOAA and USGS resources that are currently available. The organiza-tion and hardware are designed to be an experiment whose input and output can be adjusted and modified to optimize results. Once in place, if preliminary results are promising, a debris-flow warning system for recently burned areas in parts of southern California would be hardened; an infrastructure created to support data collection, warning systems, reliable Forecast criteria, and Warning dissemination; and additional capabilities added. We anticipate that once this activity is begun, we would continue to try to provide debris-flow Warnings for recently burned areas in southern California in perpetuity.
There are some circumstances under which this proto-type debris-flow warning system could be dismantled. Among these would be a lack of success in defining thresholds for debris-flow production in recently burned areas, or the fiscal inability of the USGS or NOAA to continue support for the program. In these cases, any instruments or measurement devices deployed in the affected areas will be removed and either returned to service in another project or activity in NOAA or the USGS, or turned over to local officials who may wish to continue monitoring recently burned areas for debris flows with local support and expertise. Any information, data, protocols, or procedures generated during this experience will be made readily available to any agency that may wish to continue operation of the system. The agreement between the NOAA and the USGS to operate a prototype system will be considered null and void.
Public Affairs Factors
Upon successful completion of preliminary testing, NOAA/NWS and USGS public affairs will work jointly to announce implementation (and expansion, if warranted) of the program. Ideally, timing of this announcement would be just prior to the southern California rainy season. Opportunities would likely exist to “show-off” the system to media, legisla-tors, and other key constituents.
Exiting the program brings with it a unique set of chal-lenges. Messages to be conveyed will depend largely on the rationale for exiting the program. It is fair to say that many constituents will be concerned about the loss of the program. In any event, announcements will be made that are simple and forthright. Briefings should be held with all major constituents prior to implementation of an exit strategy to:
· Determine whether other alternatives (to exiting) exist, · Explain and discuss rationale for exiting, and · Gather potential information for use in statement to
media and other constituents impacted by exiting.
Intensive Research Area
The prototype system also involves a research component to address the anticipated shortcomings of the initial warning system, which will be based entirely on operational, but less than ideal, observations and models. Most of this meteorologi-cal and geologic research will be conducted in an Intensive Research Area within the much broader Prototype Forecast and Warning Region (fig. 1). Recent USGS studies show that debris-flow-initiating downpours are sometimes highly local-ized deluges from intense thunderstorms embedded within widespread precipitation. The Intensive Research Area will be densely instrumented to address this and to facilitate other research activities. Specially deployed tools in this area will provide streamflow measurements and video documentation of flows as they occur, including detailed information on the type of runoff—water flood, hyperconcentrated flow, or debris flow. Dense arrays of nested soil tensiometers and runoff plots will be used to characterize infiltration, runoff, and erosive processes. Installing these instruments will aid in the under-standing of the debris-flow-triggering mechanisms, and hence, in the development of the more advanced physical-science-based models applicable to all areas, burned and unburned, across the United States. As described in the “Precipitation Measurement” section, the Intensive Precipitation Measure-ment Array (IPMA), composed of transportable gap-filling radars and other meteorological instruments, will augment the coarser documentation of atmospheric conditions available by existing operational networks. Post-storm ground crews will survey the flows and damage in the research area.
Validation Methodology
An important component of the Intensive Research Area should be an assessment of whether research fostered by the program has produced, or is likely to produce, improve-ments to the forecasting skill and Warning effectiveness. This research will also address the future transferability of techniques used in the prototype region to other parts of the country. For example, debris flows induced by rapid melting of mountain snow pack are not a factor in southern California, but they are a significant cause of debris flows in mountain ranges farther north. NOAA’s National Operational Hydro-logic Remote Sensing Center (NOHRSC) uses aerial remote sensing to regularly measure snow-pack water content across the United States. In addition to monitoring antecedent snow conditions, these snow survey flights can use GPS-coordinated aerial photography to verify and document the occurrence and extent of debris flows with the aid of GIS-based image-analysis techniques. The routine flights can be expanded to
Debris-Flow Warning Systems ��

cover potential debris-flow areas in detail, and NOHRSC’s sophisticated snow model will help identify the snow-water equivalent and temperature thresholds that produce snow-induced debris flows.
Implementation and Operation Costs
The implementation costs of the hydrometeorologi-cal equipment for the intensive research area are outlined in table 2. For a description of the acronyms on this table, please consult the “List of Selected Acronyms Used in this Report” in the table of contents. The role of the advanced instrumentation listed in the table is described in the “Precipitation Measure-ment” section.
research activities may be required. Nevertheless, the desirable research, including meteorological, hydrologic and geologic aspects of the problem, is outlined in this section. Most of it would be conducted in the localized Intensive Research Area within the much broader prototype Forecast/Warning region.
Precipitation Measurement
The limitations of precipitation measurement and now-casting with the current operational observing system were previously outlined, with specific examples of limitations in southern California. This section outlines the composition, design, logistical considerations, and costs of an enhanced observing network for precipitation measurement that could be used as improved input to a debris-flow warning system. The proposed Intensive Precipitation Measurement Array (fig. 10) has been conceived as a research effort to supplement operational precipitation-measurement tools that will initially be the inputs to the prototype debris-flow warning system for southern California. In this prototype warning system, recently burned mountainous areas will be emphasized, given their much greater susceptibility to debris flows. The IPMA will also focus on these areas. Therefore, depiction of the IPMA in figure 1 should not be viewed as fixed, but rather as an example of how the array might be organized had the recently burned area been in the eastern San Gabriel and western San Bernardino Mountains, such as occurred in late 2003.
Refined Precipitation Forecasts and Measurements
The emphasis of the IPMA will be on filling gaps in operational radar coverage for the purpose of improving quan-titative precipitation estimates (QPE)—the most critical input to the debris-flow warning system. Gaps in southern Califor-nia operational radar coverage were highlighted in the section “Existing Meteorological Operational Systems,” where the poor coverage by NEXRAD of the key low-altitude regions of the atmosphere was illustrated. In the IPMA, scanning radars from the NOAA research laboratories will be deployed to fill these gaps. Two different varieties of these radars are envisioned to be part of the array. One is a transportable 3-cm-wavelength (X-band) Doppler and polarimetric radar (X-POL) from the Environmental Technology Laboratory (ETL) and the other is a mobile 5-cm-wavelength (C-band) Doppler radar (SMART-R) from the National Severe Storms Laboratory (NSSL). X-POL, which has been used in dozens of field projects, has a 0.9° beam width and can collect 256 radial bins (gates) of data. At a radial resolution of 150 m, data can be collected out to a range of about 38 km. SMART-R has a 1.5° beam width and can collect 2,048 gates of data. At a pulse repetition frequency of 1,000 Hz, data can be collected out to a range of 150 km for radial resolutions greater than or equal to 75 m.
Table 2. Summary of estimated meteorologic and geologic implementation costs for a 5-month deployment of the Intensive Research Area.
Description Cost ($K)
LIDAR characterization of topography of the site and documentation of changes...................................... 40
Site logistics ......................................................................... 40 Integration of IPMA data into QPE algorithms
(one-time cost) (0.5 FTE) ........................................... 100 SMART-R.......................................................................... 100 X-POL/sfc. met. site .......................................................... 100 S-PROF/ disdrometer/ sfc. met. site .................................... 35 Rain-gage network (6 sites) ................................................. 10 Wind profiler /sfc. met. /GPS IWV/
GPS balloon sounding................................................. 115 Soil moisture and pore-pressure-gaging network................ 50 Laboratory testing of materials............................................ 10 Post-deployment analysis (2 FTE) .................................... 400 Total ................................................................................ 1,000
Future Development
The proposed prototype program will initially rely on the use of existing operational tools as a low-cost way to begin testing debris-flow forecasting and warning methods. These tools and the knowledge of debris-flow physics have advanced significantly since the end of the San Francisco Bay area exploratory program a decade ago. However, even with these advances, the current resources are less than ideal for the job. Therefore, it is essential that the program also include a strong research component to address anticipated shortcom-ings. This will require additional new funding, which is likely to take time to secure in the USGS and NOAA budgeting processes. Hence, a delayed or phased-in implementation of
�� NOAA-USGS Debris-Flow Warning System—Final Report

The strength of X-POL is its polarimetric capability, which allows derivation of fields such as differential reflec-tivity and specific differential propagation phase (Bringi and Chandrasekar, 2001). It has been shown that these parameters can (1) be used to make more accurate estimates of pre-cipitation than is possible from reflectivity alone (Zrnic and Ryzhkov, 1996; Matrosov and others, 2002) and (2) allow the types of hydrometeors (raindrops, snowflakes, graupel, etc.) present in the beam to be inferred. Polarimetry is also used for correcting attenuation, which diminishes X-band radar reflec-tivity values in moderate to intense precipitation. The strength of SMART-R is its mobility. As opposed to X-POL, which is transportable but takes a few days to set up and dismantle, SMART-R is truck mounted and thus, highly mobile, with the ability to deploy or stow in 10–20 minutes at each new loca-
tion. The SMART-R is also C-band and thus not as suscep-tible to attenuation of its signal by intervening precipitation as X-band. In addition, SMART-R is due to be upgraded to dual-polarization capability by 2006. From a practical stand-point, X-POL will be sited at a fixed location near the primary mountainous burn area for an entire winter season, whereas SMART-R could be moved to different locations throughout the much broader prototype Forecast/Warning region on a storm-by-storm basis over the course of a winter season.
The strategy for siting these two scanning radar systems in the IPMA takes advantage of their unique capabilities. This is illustrated in the IPMA base map that, for the purpose of example, assumes its location is focused on a recent major burn area in the eastern San Gabriel and western San Ber-nardino Mountains (fig. 10). In this scenario, X-POL is sited
Figure 10. Base map of an enhanced precipitation measurement network that could be deployed in and near a recently burned mountainous area susceptible to debris flows.
Future Development ��

within 30 km of mountainous areas with the highest likelihood of debris flows in an effort to take fullest advantage of its polarimetric capabilities. SMART-R could scan this region as well, but its mobility would also allow it to sample other burn areas in southern California. For example, figure 10 depicts a scenario where SMART-R scans a secondary burn area farther west in the central San Gabriel Mountains. Note that both X-POL and SMART-R are much closer to the target burn areas than the nearest operational NEXRAD radar (KSOX). Both are also located at much lower altitudes than KSOX. These sites allow the research radars to fill the crucial low-altitude NEXRAD gap.
Placement of X-POL and SMART-R in operational radar coverage gaps is not a solution to the QPE problem in and of itself. QPE algorithms need to be validated and their logic refined with better knowledge of the processes that lead to pre-cipitation development. The additional instrumentation shown in figure 10 is intended to help address these important issues. Several ETL rain gages will be deployed in the primary moun-tainous burn area to augment the existing operational ALERT network for the purpose of validating QPE algorithm output from KSOX, X-POL, and SMART-R. A vertically profiling 10-cm-wavelength (S-band) Doppler radar from ETL will be sited at a central location in the primary mountainous burn area. This instrument (S-PROF) provides the detailed vertical structure of reflectivity and particle fall speeds from just above the ground surface to the top of precipitating clouds. Its data allow precipitation rates aloft, at levels observed by the scan-ning radars, to be more accurately extrapolated to the surface. It also provides a continuous determination of the height of the melting level. A raindrop-counting and sizing instrument called a disdrometer will be collocated with S-PROF. The disdrometer is particularly helpful in validating output from polarimetric radar QPE algorithms. In addition, the disdrom-eter and S-PROF are both excellent tools for improving physi-cal knowledge of precipitation development processes.
Surface meteorology stations collocated with X-POL and S-PROF will have rain gages as well as sensors for measur-ing temperature, humidity, pressure, wind speed, and wind direction. These standard meteorological parameters provide further context for understanding precipitation-development processes. One such station will be sited southwest of KSOX, well upwind of the primary target burn area, along with a 915-MHz wind-profiling radar, a GPS balloon-sounding system, and a GPS integrated water vapor receiver. The wind profiling radar provides continuous monitoring of winds aloft through the depth of the atmospheric boundary layer. Its measure-ments have revealed critical altitudes at which the winds are highly correlated with downstream orographic rainfall rates in California’s coastal mountain ranges (Neiman and others, 2002). The instruments at this upwind site provide meteoro-logical context over a depth of the atmosphere where pre-cipitation-development processes are most active, especially those influenced by orography. Its upwind location near the coastline will allow sampling of air parcels that have not been altered by the inland topography.
Data from the various standard and advanced meteoro-logical instruments of the IPMA will be individually displayed in real time for NWS forecasters to view. The rainfall observa-tions will also be ingested by prototype next-generation QPE algorithms based on the National Mosaic and Multisensor QPE (NMQ, Seo and others, 2005). The NMQ is a data and algorithm test platform that merges in near-real-time ALERT, NEXRAD, satellite, and other observations to form a multi-sensor QPE that mitigates radar problems with beam blockage and nonmeteorological artifacts. Thus, the IPMA instrumenta-tion will serve both the operational forecasting and research aspects of the program.
Operational Costs and Impacts
Capabilities exist to implement the IPMA and begin its associated research as early as the winter of 2005–06, if sufficient funding is allocated for the task. However, a large part of the implementation effort involves preseason planning and preparations for instrument site logistics and communica-tions, data ingest, and display. Scheduling conflicts for some instruments could also pose problems for the next few winter seasons, particularly the winter of 2005–06. Furthermore, the budgetary processes at USGS and NOAA generally require substantial lead time for new programs. Thus, a phased-in implementation of the IPMA plan and its research over the next few years may be more realistic. Approximate costs asso-ciated with the components of the IPMA are outlined in table 2. Scaled-back versions of this plan would delay progress but may still be worthwhile, representing less expensive or more slowly implemented possibilities. However, the full IPMA described here would maximize benefits and is the recom-mended ultimate goal for advancing the meteorological side of debris-flow research.
Distributed Hydrologic Modeling Issues
Distributed hydrologic models have been available for a number of years for research purposes due to a number of factors such as the inadequate resolution of spatially distributed watershed data and QPE, and the still-excellent performance of properly calibrated lumped-parameter models (Reed and oth-ers, 2004). Because of improvements in the availability of both distributed watershed data and high-resolution gridded QPE and QPF, it is now foreseeable that distributed hydrologic mod-els will have an ever-expanding role in the day-to-day opera-tions of the National Weather Service RFCs and WFOs. In fact, their use in an operational setting in the National Weather Service is an area of active research and development, which is summarized in a special issue of the Journal of Hydrology dedicated to the recent Distributed Model Intercomparison Project (DMIP) (Smith, Georgakakos, and Liang, 2004; Smith, Seo, and others, 2004; Smith, Koren, and others, 2004; Reed and others, 2004; Carpenter and Georgakakos, 2004a, 2004b;
�� NOAA-USGS Debris-Flow Warning System—Final Report

Ivanov and others, 2004; Ajami and others, 2004; Di Luzio and Arnold, 2004; Vieux and others, 2004; Bandaragoda and others, 2004; Georgakakos and others, 2004; Butts and others, 2004; Liang and others, 2004; Guo and others, 2004).
In addition to the modeling of rainfall-runoff processes, the National Weather Service Office of Hydrologic Develop-ment is researching a new distributed-statistical approach to flash-flood modeling at ungaged sites that could prove useful in the development of high-resolution probabilistic assessment of debris-flow risk. In this approach, historical flow-frequency relationships for each cell in a high-resolution computational grid are developed using archived, gridded, radar rainfall estimates (Reed and others, 2005). In operations, real-time and forecast precipitation are input to the distributed model. The resulting flows are then evaluated against the historic flow-frequency curves to provide the forecaster a measure of severity.
One of the major payoffs of distributed hydrologic mod-els is their ability to model hydrologic processes at a resolu-tion limited only by the availability of observations. Using a combination of physically based and conceptual hydrologic models, the NWS Office of Hydrologic Development currently has the capacity to produce high-resolution forecasts of soil moisture (Koren and others, 2005) that include an estimation of the soil-moisture profile as a function of depth in each of the elements of the distributed model.
High-resolution observations of soil moisture and their assimilation into distributed hydrologic models is now an active research area. It is expected that adding remotely sensed observations and forecasts of soil moisture will not only improve distributed hydrologic models but also future physically based debris-flow initiation models. Expanding this research into physically based debris-flow forecasts is a natural progression. (See section “Developments in 10+-Year Time Frame for Unburned Areas.”)
Hydrology and Geology Modeling Issues for Burned Areas
Developments Possible Within 2 to 5 Years Time Frame to Expand Capability of the Existing Prototype System for Burned Areas in Southern California
Refining Existing Rainfall Thresholds
The establishment of the Prototype Debris-Flow and Flash-Flood Warning System for areas recently burned by wildfires in the two WFO areas in southern California is based on the assumption that the potential for flash floods and debris flows can be reasonably characterized by regional rainfall intensity-duration thresholds. The capability of the system within southern California can be expanded by refining exist-ing rainfall thresholds with additional storm/event data, by defining thresholds that are more geographically specific, and defining separate thresholds that are specific to flash floods
and debris flows (and thus warranting an operational system other than the FFMP).
Generation of Basin-Scale Debris-Flow Probability and Volume Maps
The potential also exists to expand the capability of the prototype system from simply identifying those storm conditions likely to result in flash floods and debris flows to identifying those basins that are most prone to post-fire debris-flow activity and characterizing the potential magnitude of the event. Cannon and others (2004) developed a statisti-cal method for calculating the probability that an individual basin will produce debris flows as a function of basin gradient, burned extent, material properties, and storm rainfall. With additional development, testing, and IT infrastructure expan-sion, this model could be implemented in near-real-time using measured precipitation to identify debris-flow-susceptible basins as a storm develops and to produce Web-based map products. The model could be made regionally specific by bet-ter characterizing the effects of basin shape and soil properties and by incorporating the elapsed time since the last fire (and erosive event) within burned basins. Cannon and others (2004) also developed a model for predicting the potential debris-flow peak discharge that can issue from a basin outlet as a function of basin gradient, burned extent, and storm rainfall. Again, with additional development, this model could be implemented in near-real-time using measured precipitation to identify those basins that can produce large events as a storm develops; the model could produce Web-based map products. The application of this approach could be broadened by devel-oping predictive relations for debris-flow volumes rather than peak discharges.
Generation of Debris-Flow-Inundation-Area Maps
Methods to accurately predict areas inundated by debris flows should be part of an expanded warning system. Although theoretical and numerical analyses of debris-flow mechanics are advancing, there is yet no universally accepted physically based model for routing debris flows across three-dimensional terrain. However, empirical methods for identifying two-dimensional debris-flow runout distance have been developed for unburned settings (e.g., Hungr, 1995; O’Brien and others, 1993). Further, a method that relies on a statistically constrained simulation model calibrated with data from debris flows throughout the world can be used to map potential inundation areas (Iverson and others, 1998; Griswold, 2004). The utility of these methods could be refined for burned areas by collecting data and devel-oping calibration coefficients specifically for these settings. The methods further require estimates of the volume of material involved in a flow. In burned areas, the majority of the sediment in a debris flow originates from progressive bulking of storm runoff with material entrained from hillslopes and channels, in contrast to unburned settings where an initial landslide failure typically contributes material. By developing methods to con-
Future Development �7
strain estimates of debris-flow volumes from recently burned areas, this statistically based inundation model holds promise for near-real-time implementation into a warning system. Maps showing potential inundation areas could be released as Web-based products.
Developments Possible Within 5 to 10 Years Time Frame to Expand Capability of the Existing Prototype System for Burned Areas in Southern California
Develop Magnitude/Frequency Relations for Debris Flows
The development of magnitude/frequency relations for post-wildfire debris flows would provide a necessary tool for characterizing recurrence intervals of flows of particular sizes. These relations could be used to quantify the probability of debris flow of a particular size to be expected with the issued Watch or Warning.
Develop Automated Warning System
Even though the human factor can never be removed from a warning system, it would be useful to develop an automated warning system that, in areas prone to repetitive debris flows, could warn in the event of a flow in progress. For example, an automated system could be used to close off roads cut by debris-flow channels if a flow is in progress. This would require implementation in coordination with regulatory agencies that have jurisdiction in these areas.
Developments Possible Within 2 to 5 Years Time Frame to Expand Prototype System to Burned Areas beyond Southern California
Definition of Rainfall Thresholds
Expansion of the prototype warning system in its present form to burned areas beyond southern California will require definition of region-specific rainfall intensity-duration thresh-olds. At present, such a threshold exists for recently burned areas in southern Colorado (Cannon and others, 2003), and data that might be used for preliminary definitions for western Montana and north-central New Mexico have been compiled, but not analyzed (Gartner and others, in press).
Generation of Basin-Scale Debris-Flow Probability and Volume Maps
Models developed by Cannon and others (2004) for estimating basin-scale debris-flow probability and magnitude as a function of basin morphology, burned extent, and storm rainfall could be implemented in near-real-time to gener-
ate Web-based map products with additional programming effort. The model could be improved by better characterizing the effects of basin shape and soil properties. As above, the application of this approach could be broadened by developing region-specific predictive relations for debris-flow volumes rather than peak discharges.
Developments Possible Within 5 to 10 Years to Expand Prototype System to Burned Areas beyond Southern California
Generation of Debris-Flow-Inundation-Area Maps
Region-specific threshold models or statistical models for predicting debris flows in burned areas can also be coupled to empirical models for predicting debris-flow-inundation bound-aries, but research is needed to develop techniques for predict-ing potential debris-flow volumes in burned areas (other than those in southern California) before such a model could be implemented in near-real-time.
Development and Calibration of Physically Based Models
The development and calibration of physically based models for post-fire erosional processes will provide means to advance a warning system from reliance on empirical and statistical models to one founded on more physically based analyses and will provide spatially and temporally specific hazard assessments. This effort will be leveraged by the devel-opment of high-resolution physically based hydrologic models that the NWS Office of Hydrologic Development is currently developing. These models will be able to produce soil-mois-ture forecasts at resolutions compatible with those required by physically based debris-flow models.
Hydrology and Geology Issues for Unburned Areas
The capability to predict debris flows in areas of the United States beyond burned areas is nontrivial. There are a variety of hydrological and geological mechanisms that can result in debris flows, including snowmelt, gravity, earthquakes, rapid drainage of natural and human-made dams, and volcanic eruptive processes. To understand and be able to issue reliable Watches and Warnings for debris flows beyond burned areas, the meteorological and geo-logical processes that can lead to debris flows in a variety of different settings must be appropriately characterized. Examples of meteorological processes that can trigger debris flows include localized convective thunderstorms in the Rocky Mountains, summer monsoon rains in Arizona, and hurricane rainfall in the Appalachian Mountains of the Eastern United States.
�� NOAA-USGS Debris-Flow Warning System—Final Report

Developments Possible Within 2 to 5 Years for Unburned Areas
Development of Rainfall Thresholds
The development of rainfall thresholds necessary for triggering debris flows under different meteorological con-ditions and in different parts of the United States is one of the most critical research needs for expanding the warning system. Well-defined thresholds exist in only a few specific areas, for example in Seattle (Baum and others, 2005); the San Francisco Bay Region (Cannon and Ellen, 1985; Wieczorek, 1987), the Blue Ridge in Virginia (Wieczorek and others, 2000), and Puerto Rico (Larsen and Simon, 1993). Some of these thresholds could be improved by better defining anteced-ent rainfall conditions and incorporating data from additional events. Because rainfall conditions that trigger debris flows are regionally specific, any expansion of the warning system to additional regions will require further data collection and analysis to define these thresholds. For areas for which data are not available, it might be possible to develop methods for extending thresholds beyond a local area where they were established.
Statistical and Physically Based Methods
Some statistical and physically based approaches exist for defining where within a landscape debris flows are most likely to initiate (e.g., Carrara, 1983; Carrara and others, 1991, 1992; Montgomery and Dietrich, 1994; Pack and others, 1998). These preliminary approaches could be used to identify areas of potential instability in the event of significant rainfall. They do not provide a means to evaluate the response to specific storm rainfall conditions.
Debris-Flow-Inundation Modeling
Methods to accurately predict areas inundated by debris flows should be part of an expanded warning system. Although theoretical and numerical analyses of debris-flow mechanics are advancing, there is yet no universally accepted physically based model for routing debris flows across three-dimensional terrain. However, empirical methods for identify-ing two-dimensional debris-flow-runout distance have been developed for unburned settings (e.g., Hungr, 1995; O’Brien and others, 1993). Further, a method that relies on a statis-tically constrained simulation model calibrated with data from debris flows throughout the world can be used to map potential inundation areas (Iverson and others, 1998; Gris-wold, 2004). The utility of these methods could be refined for different regions by collecting data and developing calibration coefficients specifically for these settings. The methods further require estimates of the volume of material involved in a flow. By developing methods to constrain estimates of debris-flow volumes, these methods hold promise for near-real-time imple-mentation into a warning system. Using a range of prospec-
tive debris-flow volumes, a range of inundation areas can be plotted for debris flows of increasing volume and decreasing probability. Maps showing potential inundation areas could be released as Web-based products.
Developments Possible Within 5 to 10 Years for Unburned Areas
Physically Based Models for Spatially and Temporally Specific Projections
Ideally, it is desirable to advance any warning system from reliance on empirically defined rainfall intensity-duration thresholds to one founded on more physically based analyses and to be able to provide spatially and temporally specific haz-ard assessments. Coupled models for time-dependent rainfall infiltration and slope stability can provide spatially and tempo-rally detailed projections of debris-flow activity (e.g., Savage and others, 2003; Morrissey and others, 2004). With additional development, testing, and IT infrastructure expansion, these models could be implemented in near-real-time using mea-sured precipitation to identify debris-flow-susceptible hill-slopes as a storm develops and to produce Web-based map products. Implementation of such models requires extensive data collection, including precipitation, soil moisture, and pore pressure. Additional research is needed to identify the neces-sary scales of data collection and to understand the details of storm-driven subsurface water movement over time. Informa-tion on soil-thickness distributions and other boundary condi-tions are also necessary to obtain reliable results.
Methods for Predicting Debris-Flow Volumes
Development of methods for predicting debris-flow volumes relative to storm characteristics would allow empirical methods for delineation of areas of inundation to be implemented in near-real-time and could produce Web-based map products. Methods for estimating potential volumes will require thorough understanding of channel-bed erosion and deposition relationships.
Refine Inundation-Area Mapping Using Ground-Based or Airborne-Based LiDAR
The detailed topographic information developed using LiDAR could provide vastly improved estimates of inundation areas.
Magnitude/Frequency Relations for Debris Flows
The development of magnitude/frequency relations of landslide-initiated debris flows would provide a necessary tool for characterizing recurrence intervals of flows of particular sizes. These relations could be used to quantify the probability of a debris flow of a particular size to be expected with the issued Watch or Warning. These probabilistic definitions of
Future Development ��
debris-flow risk could potentially be linked with precipitation forecast probabilities.
Develop Automated Warning System
Even though the human factor can never be removed from a warning system, it would be useful to develop an automated warning system that, in areas prone to repetitive debris flows, could warn in the event of a flow in progress. As examples, an automated system could be used to remotely close off roads cut by debris-flow channels if a flow is in prog-ress. This would require coordination with regulatory agencies that have jurisdiction in these areas.
Snowmelt-Triggered Debris Flows
To expand a warning system to alpine areas to address issues for snowmelt-triggered debris flows, it is necessary to have in-depth data on the current state of the snow pack in areas of concern. There are various models in existence that predict snow-water equivalence, including NOAA’s Operational Hydro-logic Remote Sensing Center (NOHRSC) snow model and the SNOW-17 models. The NOHRSC model provides estimates of snowmelt at the base of the snow pack and water release from rain-on-snow events, both of which can trigger debris flows. To document conditions under which snowmelt-induced debris flows occur and to develop predictive algorithms, remote-sens-ing tools such as aircraft, high-resolution MODIS satellite data, ground-based precipitation radars, and GIS can be used.
Developments in 10+-Year Time Frame for Unburned Areas
The operational use of remotely sensed soil-moisture and soil-thickness data can be used to deter-mine boundary and initial conditions for use in deter-ministic slope-stability modeling, but this will require great advances. The Office of Hydrologic Development of the National Weather Service will have soil-moisture data-assimilation systems in place in the 10+-year time frame. In coordination with high-resolution physically based models currently under development, the assimi-lation of remotely sensed information will assist in the improvement of debris-flow models.
Issues and Products Tables
The tables in this section summarize the issues, research needs, and potential products that can be developed with an expanded-capability warning system at several time scales for burned and unburned applications in southern California and beyond. The tables include issues for the near-term (2–5 years, table 3) and longer term (5–10 years, table 4); extension of the system beyond southern California in the near-term (2–5 years, table 5) and longer term (5–10 years, table 6); extension of the system in areas other than burns in the near-term (table 7), longer term (5–10 years, table 8), and more than 10 years (table 9).
Table 3. Issues and products by expanding capability of existing prototype—2–5 years.
Issue Products
Refine existing rainfall thresholds More accurate Outlooks, Watches, Warnings Define geographically specific rainfall thresholds More precise Outlooks, Watches, Warnings Refine existing model for debris-flow probability Region-specific model for debris-flow probability Implement model for basin-scale debris-flow probability Near-real time Web-based map Develop predictive model for debris-flow volume Region-specific model for debris-flow volume Implement models for basin-scale debris-flow volume Near-real-time Web-based map Implement technique for debris-flow-inundation mapping Near-real-time Web-based map Install additional rain gages, gap-filling radar, etc. More accurate and precise precipitation measurements for model input
Table 4. Issues and products by expanding capability of existing prototype—5–10 years.
Issue Products
Develop debris-flow magnitude/frequency relationships Quantified probability of debris flow in Outlooks, Watches, and Warnings Automated warning system Ability to remotely restrict access to dangerous areas in cooperation with egulatory agencies r
�0 NOAA-USGS Debris-Flow Warning System—Final Report

Table 5. Issues and products by expanding prototype to burned areas beyond southern California—2–5 years.
Issue Products
Definition of region-specific rainfall thresholds Ability to issue Outlooks, Watches, and Warnings Implement existing model for debris-flow probability Near-real-time Web-based map Develop predictive model for debris-flow volume Region-specific model for debris-flow volume Implement models for basin-scale debris-flow volume Near-real-time Web-based map Install additional rain gages, gap-filling radar, etc. More accurate and precise precipitation measurements for model input
Table 6. Issues and products by expanding prototype to burned areas beyond southern California—5–10 years.
Issue Products
Develop additional predictive models for debris-flow volume Region-specific models for debris flow volume Implement technique for debris-flow-inundation mapping Near-real-time Web-based map product of areas of impact Physically based models of post-fire erosion Spatially and temporally specific predictive models
Table 7. Issues and products to establish warning system in areas other than recent fires—2–5 years.
Issue Product
Refine existing thresholds with better information on antecedent Ability to issue Outlooks, Watches, and Warnings in some areas conditions and with additional data Definition of additional region-specific rainfall thresholds Ability to issue Outlooks, Watches, and Warnings in additional areas Link existing statistical and physically based stability models Near-real-time Web-based map product with real-time precipitation measurements Implement technique for debris-flow-inundation mapping Near-real-time probabilistic representation of area of impact as Web- ased map product b
Table 8. Issues and products to establish warning system to areas other than recent fires—5–10 years.
Issue Product
Implement coupled models for time-dependent rainfall Spatially and temporally specific predictive models that provide infiltration and slope stability in near-real-time near-real-time Web-based map product Develop predictive models for debris-flow volume Region-specific models for debris-flow volume Implement technique for debris-flow-inundation mapping Near-real-time Web-based map product of areas of impact Develop debris-flow magnitude/frequency relations Ability to characterize recurrence intervals of events of different sizes Development of automated warning system Ability to remotely restrict access to dangerous areas in cooperation with regulatory agencies Develop methods to address snowmelt-induced debris flows Ability to characterize effects of rain-on-snow and snowmelt in lpine areas a
Table 9. Issues and products to establish warning system in areas other than recent fires—10+ years.
Issue Product
Use of remotely sensed soil-moisture information In tial condition input for deterministic stability models i
Future Development �1
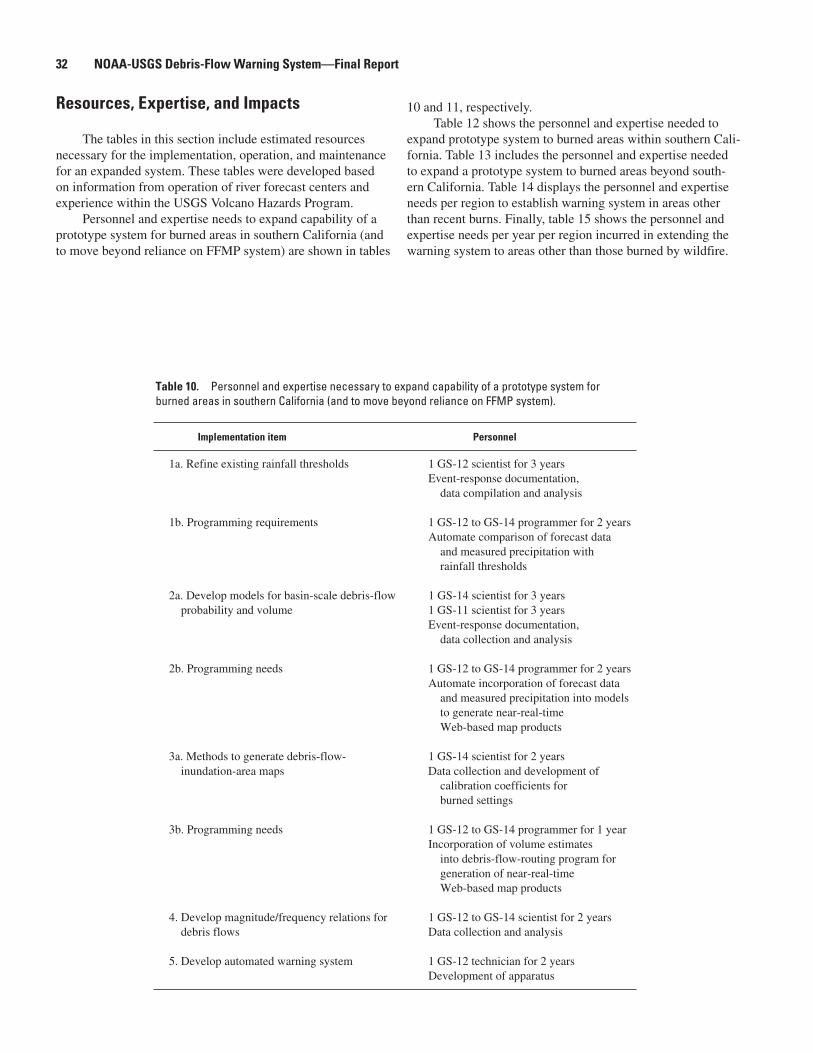
Resources, Expertise, and Impacts
The tables in this section include estimated resources necessary for the implementation, operation, and maintenance for an expanded system. These tables were developed based on information from operation of river forecast centers and experience within the USGS Volcano Hazards Program.
Personnel and expertise needs to expand capability of a prototype system for burned areas in southern California (and to move beyond reliance on FFMP system) are shown in tables
10 and 11, respectively.Table 12 shows the personnel and expertise needed to
expand prototype system to burned areas within southern Cali-fornia. Table 13 includes the personnel and expertise needed to expand a prototype system to burned areas beyond south-ern California. Table 14 displays the personnel and expertise needs per region to establish warning system in areas other than recent burns. Finally, table 15 shows the personnel and expertise needs per year per region incurred in extending the warning system to areas other than those burned by wildfire.
Table 10. Personnel and expertise necessary to expand capability of a prototype system for burned areas in southern California (and to move beyond reliance on FFMP system).
Implementation item Personnel
1a. Refine existing rainfall thresholds 1 GS-12 scientist for 3 years Event-response documentation, data compilation and analysis
1b. Programming requirements 1 GS-12 to GS-14 programmer for 2 years Automate comparison of forecast data and measured precipitation with rainfall thresholds
2a. Develop models for basin-scale debris-flow 1 GS-14 scientist for 3 years probability and volume 1 GS-11 scientist for 3 years Event-response documentation, data collection and analysis
2b. Programming needs 1 GS-12 to GS-14 programmer for 2 years Automate incorporation of forecast data and measured precipitation into models to generate near-real-time Web-based map products
3a. Methods to generate debris-flow- 1 GS-14 scientist for 2 years inundation-area maps Data collection and development of calibration coefficients for burned settings
3b. Programming needs 1 GS-12 to GS-14 programmer for 1 year Incorporation of volume estimates into debris-flow-routing program for generation of near-real-time Web-based map products
4. Develop magnitude/frequency relations for 1 GS-12 to GS-14 scientist for 2 years debris flows Data collection and analysis
5. Develop automated warning system 1 GS-12 technician for 2 years Development of apparatus
�� NOAA-USGS Debris-Flow Warning System—Final Report
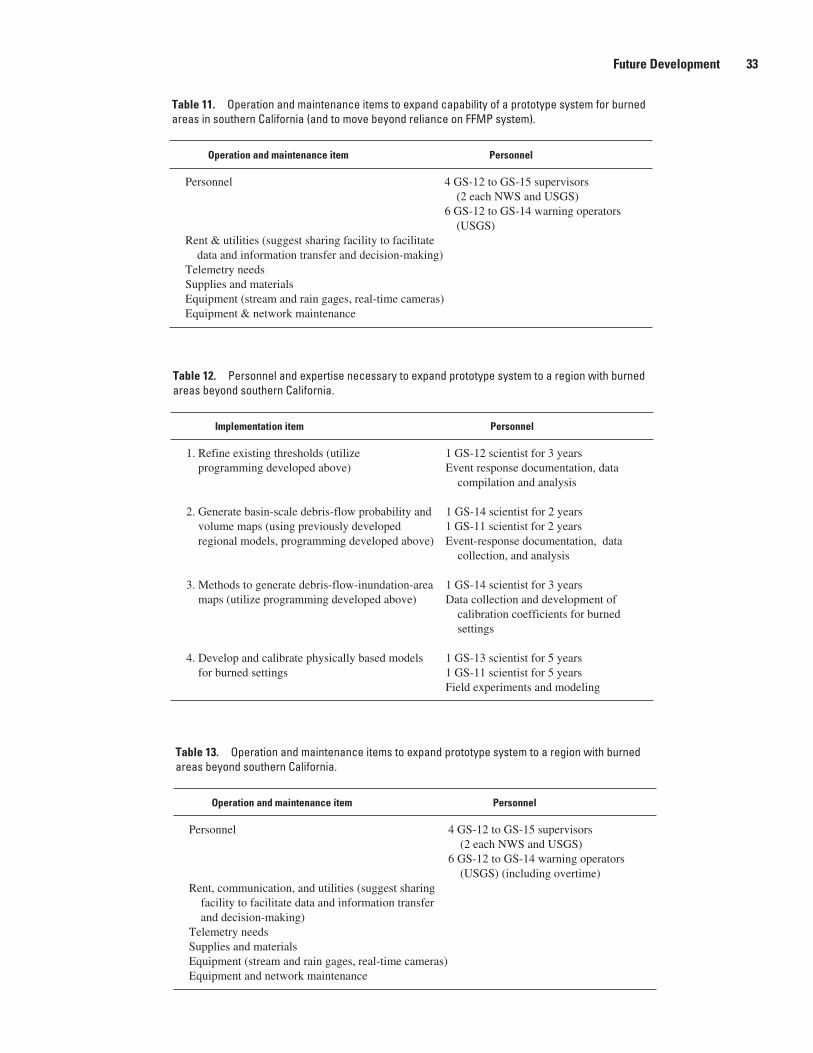
Table 11. Operation and maintenance items to expand capability of a prototype system for burned areas in southern California (and to move beyond reliance on FFMP system).
Operation and maintenance item Personnel
Personnel 4 GS-12 to GS-15 supervisors (2 each NWS and USGS) 6 GS-12 to GS-14 warning operators (USGS) Rent & utilities (suggest sharing facility to facilitate data and information transfer and decision-making) Telemetry needs Supplies and materials Equipment (stream and rain gages, real-time cameras) Equipment & network maintenance
Table 12. Personnel and expertise necessary to expand prototype system to a region with burned areas beyond southern California.
Implementation item Personnel
1. Refine existing thresholds (utilize 1 GS-12 scientist for 3 years programming developed above) Event response documentation, data compilation and analysis
2. Generate basin-scale debris-flow probability and 1 GS-14 scientist for 2 years volume maps (using previously developed 1 GS-11 scientist for 2 years regional models, programming developed above) Event-response documentation, data collection, and analysis
3. Methods to generate debris-flow-inundation-area 1 GS-14 scientist for 3 years maps (utilize programming developed above) Data collection and development of calibration coefficients for burned settings
4. Develop and calibrate physically based models 1 GS-13 scientist for 5 years for burned settings 1 GS-11 scientist for 5 years Field experiments and modeling
Table 13. Operation and maintenance items to expand prototype system to a region with burned areas beyond southern California.
Operation and maintenance item Personnel
Personnel 4 GS-12 to GS-15 supervisors (2 each NWS and USGS) 6 GS-12 to GS-14 warning operators (USGS) (including overtime) Rent, communication, and utilities (suggest sharing facility to facilitate data and information transfer and decision-making) Telemetry needs Supplies and materials Equipment (stream and rain gages, real-time cameras) Equipment and network maintenance
Future Development ��
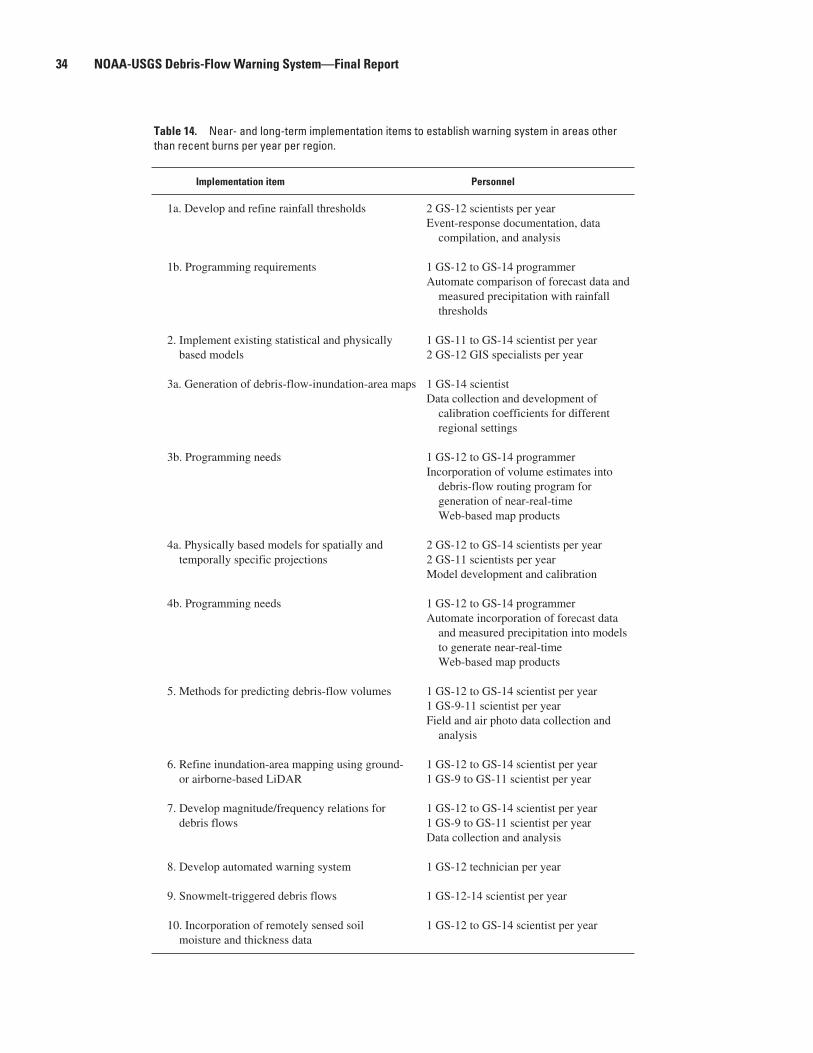
Table 14. Near- and long-term implementation items to establish warning system in areas other than recent burns per year per region.
Implementation item Personnel
1a. Develop and refine rainfall thresholds 2 GS-12 scientists per year Event-response documentation, data compilation, and analysis
1b. Programming requirements 1 GS-12 to GS-14 programmer Automate comparison of forecast data and measured precipitation with rainfall thresholds
2. Implement existing statistical and physically 1 GS-11 to GS-14 scientist per year based models 2 GS-12 GIS specialists per year
3a. Generation of debris-flow-inundation-area maps 1 GS-14 scientist Data collection and development of calibration coefficients for different regional settings
3b. Programming needs 1 GS-12 to GS-14 programmer Incorporation of volume estimates into debris-flow routing program for generation of near-real-time Web-based map products
4a. Physically based models for spatially and 2 GS-12 to GS-14 scientists per year temporally specific projections 2 GS-11 scientists per year Model development and calibration
4b. Programming needs 1 GS-12 to GS-14 programmer Automate incorporation of forecast data and measured precipitation into models to generate near-real-time Web-based map products
5. Methods for predicting debris-flow volumes 1 GS-12 to GS-14 scientist per year 1 GS-9-11 scientist per year Field and air photo data collection and analysis
6. Refine inundation-area mapping using ground- 1 GS-12 to GS-14 scientist per year or airborne-based LiDAR 1 GS-9 to GS-11 scientist per year
7. Develop magnitude/frequency relations for 1 GS-12 to GS-14 scientist per year debris flows 1 GS-9 to GS-11 scientist per year Data collection and analysis
8. Develop automated warning system 1 GS-12 technician per year
9. Snowmelt-triggered debris flows 1 GS-12-14 scientist per year
10. Incorporation of remotely sensed soil 1 GS-12 to GS-14 scientist per year moisture and thickness data
�� NOAA-USGS Debris-Flow Warning System—Final Report

Conclusions and Recommendations
Conclusions
The research carried out by the Task Force indicated that:
1. Support from potential customers ranged from people expressing that even though they felt the current level of service from their local systems was adequate, an enhanced NOAA-USGS system would be welcome, to individuals that would fully support and benefit from a joint NOAA-USGS debris- flow-warning system, even at the prototype level.
2. It is feasible to establish a joint NOAA-USGS debris-flow warning system for recently burned areas using rainfall intensity-duration thresholds developed by the USGS and applying those thresholds to the Flash-Flood Monitoring Program of the NWS, at no additional annual operating costs. Rainfall intensity-duration thresholds for debris-flow occurrence have been developed for parts of southern California using detailed analyses of rainfall and response data from recently burned areas. These quantitative thresholds provide an improvement over the present method of identification of dangerous rainfall conditions based on professional opinion and experience.
3. Given appropriate resources and scientific focus, con-siderable potential exists for enhancing and expanding the warning system to provide spatially and temporally explicit information specific to debris flows. Expan-sions include incorporating improved forecasts and measurements of precipitation as well as methods for delineating where debris flows might occur, how big the events might be, and what areas might be impacted. The Task Force defined the scientific and operational
requirements necessary to enhance the system in the near and long terms.
4. In the near term (2–5 years) the demonstration warning project can be refined and expanded to other burned areas within southern California. Expansion of the warning system beyond the demonstration project but within the FFMP framework would consist of refine-ment of existing rainfall thresholds and development of new regionally specific thresholds. Implementation of models to provide near-real-time mapping of basin-scale debris-flow probability, magnitude, and areas of inundation is possible but requires the development of an operational framework beyond that of the FFMP to address issues specific to debris flows.
5. Near term (2–5 years) expansion of the demonstra-tion warning system to burned areas beyond southern California is possible within the FFMP framework but will require the refinement of existing rainfall thresh-olds and development of new thresholds for additional areas. Development of models that provide near-real-time mapping of basin-scale debris-flow probability, magnitude, and areas of inundation is possible, but this requires the development of an operational framework beyond that of the FFMP. Physically based models that characterize the hydrological response of burned areas could be incorporated into a warning system.
6. Near-term (2–5 years) expansion of a warning system to areas other than burned areas requires development of an operational framework separate from the FFMP and requires, at a minimum, development of region-ally specific rainfall intensity-duration thresholds for unburned areas. An expanded warning system could provide map products that identify areas of potential instability in the event of heavy rainfall and areas of inundation for a range of possible debris-flow volumes.
Table 15. Operation and maintenance items to establish warning system in areas other than recent burns per year per region.
Operation and maintenance item Personnel
Personnel 4 GS-12 to GS-15 supervisors (2 each NWS and USGS) 6 GS-12 to GS-14 warning operators (USGS) (including overtime) 2 GS-12 technicians to operate and maintain field-monitoring arrays 1 GS-14 scientist to download and process remotely sensed data Rent, communication, and utilities (suggest sharing facility to facilitate data and information transfer and decision-making) Telemetry needs Equipment and network maintenance
Conclusions and Recommendations ��
7. More substantive development and expansion of a debris-flow warning system over the longer term (5–10 years) within burned areas in the United States includes the development and calibration of physi-cally based models for post-fire runoff and erosion and improvement of inundation-area mapping.
8. Longer term (5–10 years) development (table 12) and expansion to a national debris-flow warning system in areas other than those burned by wildfire requires development and implementation of physically based models for slope failure that, when linked with spa-tially distributed precipitation forecasts and measure-ments, can provide near-real-time information on where and when within a storm debris flows are likely to occur. Methods for predicting potential debris-flow volumes can be linked with inundation-area mapping to provide map products showing potential impacts. There are exciting research possibilities for advancing debris-flow and hydrometeorological instrumentation and science.
9. Although this report describes a likely fruitful collabo-ration between the NWS and the USGS, and potential capabilities of a debris-flow early warning system, the Task Force wishes to emphasize that both the human capital and financial resources required to successfully implement, operate, and advance such a system are beyond those available to either agency at this time. A long-term commitment of such resources from both agencies is needed prior to the implementation of a warning system.
Recommendations
The Task Force recommends:
1. Resources be made available for the implementation of the prototype debris-flow warning system in southern California before the end of FY 2005.
2. Resources be made available for the deployment of the Intensive Research Area monitoring program as quickly as possible
3. Once the system proves its value, resources be made available for expansion of the system to burned and unburned areas within southern California and other parts of the country.
References
Ajami, N.K., Gupta, H., Wagener, T., Soorooshian, S., 2004, Calibration of a semi-distributed hydrologic model for streamflow estimation along a river system: Journal of Hydrology, v. 298, p. 112–135.
Aleotti, P., 2004, A warning system for rainfall-induced shal-low failures: Engineering Geology, v. 73, p. 247–265.
Anderson, H.W., Coleman, G.B., and Zinke, P.J., 1959, Sum-mer slides and winter scour—Dry-wet erosion in south-ern California mountains: Berkeley, Calif., USDA Forest Service, Pacific Southwest Forest and Range Experiment Station, Technical Paper 36, 12 p.
Au, S.W.C., 1993, Rainfall and slope failure in Hong Kong: Engineering Geology, v. 36, p. 141–147.
Bandaragoda, C., Tarboton, D.G., and Woods, R., 2004, Appli-cation of TOPNET in the distributed model intercomparison project: Journal of Hydrology, v. 298, p. 178–201.
Bardou, E., and Delaloye, R., 2004, Effects of ground freez-ing and snow avalanche deposits on debris flows in alpine environments: Natural Hazards and Earth System Sciences, v. 4, p. 519–530.
Bardou, E., Niggli, M., and Musy, A., 2003, The role of snow in the generation of debris flow in small watersheds of the European Alps: Geophysical Research Abstracts, v. 5, Abstract no. EAEO3-A-05672.
Baum, R.L., Godt, J.W., Harp, E.L., McKenna, J.P., and McMullen, S.R., 2005, Early warning of landslides for rail traffic between Seattle and Everett, Washington, USA, in Proceedings of the 2005 International Conference on Land-slide Risk Management / 18th Annual Vancouver Geotech-nical Society Symposium, May 31 to June 3, 2005 Vancou-ver, British Columbia, Canada: Balkema, p. 731–740.
Baum, R.L., McKenna, J.W., Godt, J.P., Harp, E.L., and McMullen, S.R., 2005, Hydrologic monitoring of landslide-prone coastal bluffs near Edmonds and Everett, Washing-ton, 2001–2004: U.S. Geological Survey Open-File Report 2005-1063.
Blodgett, J., Poeschel, K., and Osterkamp, W., 1996, Char-acteristics of debris flows of noneruptive origin on Mount Shasta, northern California: U.S. Geological Survey Open-File Report 96-144.
Boyer, T., 2003, NOAA’s National Weather Service NDFD data flow, format, and statistics: [Powerpoint presentation for the National Digital Forecast Database, August 13, 2003].
Brandes, E.A., 1975, Optimizing rainfall estimates with the aid of radar: Journal of Applied Meteorology, v. 14, p. 1339–1345.
Bringi, V., and Chandrasekar, V., 2001, Polarimetric Doppler weather radar: Cambridge, Mass., Cambridge University Press, 636 p.
�� NOAA-USGS Debris-Flow Warning System—Final Report
Butts, M.B., Payne, J.T., Kristensen, M., and Madsen, H., 2004, An evaluation of the impact of model structure on hydrological modeling uncertainty for streamflow simula-tion: Journal of Hydrology, v. 298, p. 242–266.
California Department of Water Resources, 2005, Final Work Plan of the Alluvial Fan Task Force: California Department of Water Resources.
Campbell, A.G., 1986, Sediment storage trend in several channels along the San Gabriel mountain front, southern California: Fort Collins, Colo., Colorado State University, unpub. M.S. thesis, 130 p.
Campbell, R.H., 1975, Soil slopes, debris flows, and rain-storms in the Santa Monica Mountains and vicinity, south-ern California: U.S. Geological Survey Professional Paper 851, 51 p.
Cannon, S.H., and Gartner, J.E., 2005, Wildfire-related debris flow from a hazards perspective, chap. 15 of Hungr, O., and Jacob, M. eds., Debris-flow hazards and related phe-nomena: Springer-Praxis Books in Geophysical Sciences, p. 321–344.
Cannon, S.H., 1988, Regional rainfall-threshold conditions for abundant debris-flow activity, in Ellen, S.D., and Wiec-zorek, G.F., eds., Landslides, floods, and marine effects of the storm of January 3–5, 1982, in the San Francisco Bay region, California: U.S. Geological Survey Professional Paper 1434.
Cannon, S.H., 2000, Debris-flow response of southern Califor-nia watersheds recently burned by wildfire, in Wieczorek, G.F., and Naeser, N.D, eds., Debris-flow hazards mitiga-tion—Mechanics, prediction, and assessment—Proceedings of the Second International Conference on Debris-Flow Hazards Mitigation, Taipei, Taiwan, 16–18 August 2000: Rotterdam, A.A. Balkema, p. 45–52.
Cannon, S.H., and Ellen, S.D., 1985, Rainfall conditions for abundant debris avalanches, San Francisco Bay region, California: California Geology, v. 38, no. 12, p. 267–272.
Cannon, S.H., Gartner, J.E., Holland-Sears, A., Thurston, B.M., and Gleason, J.A., 2003, Debris-flow response of basins burned by the 2002 Coal Seam and Missionary Ridge fires, Colorado, in, Boyer, D.D., Santi, P.M., and Rogers, W.P., eds., Engineering geology in Colorado—Contribu-tions, trends, and case histories: AEG Special Publication 15, Colorado Geological Survey Special Publication 55, 31 p., [CD-ROM].
Cannon, S.H., Gartner, J.E., Parrett, C., and Parise, M., 2003, Wildfire-related debris flow generation through episodic progressive sediment bulking processes, western U.S.A., in Rickenmann, D. and Chen, C.L., eds., Debris-flow hazards mitigation—Mechanics, prediction, and assessment—Pro-ceedings of the Third International Conference on Debris-
Flow Hazards Mitigation, Davos, Switzerland, 10–12 September 2003: Rotterdam, A.A. Balkema, p. 71–82.
Cannon, S.H., Gartner, J.E., Rupert, M.G., and Michael, J.A., 2004, Emergency assessment of debris-flow hazards from basins burned by the Cedar and Paradise fires of 2003, southern California: U.S. Geological Survey Open-File Report 2004-1011, available at URL <http://pubs.usgs.gov/of/2003/ofr-04-1011/>.
Cannon, S.H., Kirkham, R.M., and Parise, M., 2001, Wildfire-related debris-flow initiation processes, Storm King Moun-tain, Colorado: Geomorphology, v. 39, no. 3-4, p. 171–188.
Carpenter, T.M., and Georgakakos, K.P., 2004a, Continu-ous streamflow simulation with the HRCDHM distributed hydrologic model: Journal of Hydrology, v. 298, p. 61–79.
Carpenter, T.M., and Georgakakos, K.P., 2004b, Impact of parametric and radar rainfall uncertainty on the ensemble streamflow simulations of a distributed hydrologic model: Journal of Hydrology, v. 298, p. 202–221.
Carrara, A., 1983, Multivariate models for landslide hazard evaluation: Mathematical Geology, v. 15, no. 3, p. 403–427.
Carrara, A., Cardinali, M., Detti, R., Guzzetti, F., 1992, Uncer-tainty in assessing landslide hazard and risk: ITC Journal, 1992-2, p. 172–183.
Carrara, A., Cardinali, M., Detti, R., Guzzetti, F., Pasqui, V., and Reichenbach, P., 1991, GIS techniques and statistical models in evaluating landslide hazard: Earth Surface Pro-cesses and Landforms, v. 16, no. 5, p. 427–445.
Carson, R., 2002, Take the a-frame: Debris flow during 1996 rain-on-snow event, Blue Mountains, Washington: Proceed-ings of the Geological Society of America Cordilleran Sec-tion, 98th Annual Meeting, May 13–15.
Carter, G., Graziano, T., Reynolds, D., Charba, J., Rishel, G., Pfost, R., Halquist, J., Page, E., and Pierce, R., 1999: Quan-titative precipitation forecast process assessment: National Weather Service.
Chan, R.K.S., Pang, P.L.R., and Pun, W.K., 2003, Recent developments in the Landslip Warning system in Hong Kong, in, Proceedings of the 14th Southeast Asian Geotech-nical Conference: Lisse, Holland, A.A. Balkema.
Cole, K., and Davis, G.M., 2002, Landslide warning and emergency planning systems in West Dorset, England, in McInnes, R.G., and Jakeways, J., eds., Instability, planning and management: London, Thomas Telford.
Costa, J.E., 1984, Physical geomorphology of debris flows, in Costa, J.E., and Fleisher, P.F., eds., Developments and appli-cations of geomorphology: Berlin, Heidelberg, Springer-Verlag.
References �7
Crozier, M.J., 1986, Landslides: Causes, consequences and environment: London, Routledge.
Crozier, M.J., 1999, Prediction of rainfall-triggered landslides: A test of the antecedent water status model: Earth Surface Processes and Landforms, v. 24, p. 825–833.
Crum, T.D., and Alberty, R.L., 1993, The WSR-88D and the WSR-88D operational support facility: Bulletin of the American Meteorological Society, v. 74, p. 1669–1687.
D’ Agostino, V., and Marchi, L., 2003, Geomorphological estimation of debris-flow volumes in alpine basins, in Rick-enmann, D., and Chen, C.L., eds., Debris-flow hazards miti-gation—Mechanics, prediction, and assessment—Proceed-ings of the Third International Conference on Debris-Flow Hazards Mitigation, Davos, Switzerland, 10–12 September 2003: Rotterdam, A.A. Balkema, p. 1097–1106.
Di Luzio, M and Arnold, J.G., 2004, Formulation of a hybrid calibration approach for a physically based distributed model with NEXRAD data input: Journal of Hydrology, v. 298, p. 136–154.
Doehring, D.O., 1968, The effect of fire on geomorphic pro-cesses in the San Gabriel Mountains, California, in Parker, R.B., ed., Contributions to geology: Laramie, Wyo. Univer-sity of Wyoming, v. 7, p. 43–65.
d’Orsi, R.N., Feijo, R.L., and Paes, N.M., 2004, 2,500 opera-tional days of Alerta Rio System—History and technical improvements of Rio de Janeiro Warning System for severe weather, in Lacerda, W.A., Ehrlich, M,. Fontana, G.D., and Sayao, A.S.F., eds., Landslides: Evaluation and stabiliza-tion: London, Taylor & Francis Group.
Evans, S.G., and Bent, A.L., 2004, The Las Colinas landslide, Santa Tecla: A highly destructive flowslide triggered by the January 13, 2001, El Salvador earthquake, in Rose, W.I., Bommer, J.J., Lopez, D.L., Carr, M.J., and Major, J.J.,eds., Natural hazards in El Salvador: Geological Society of America Special Paper 375, p. 25–37
Finlay, P.J., Fell, R., and Maguire, P.K., 1997, The relationship between the probability of landslide occurrence and rainfall: Canadian Geotechnical Journal, v. 34, p. 811–824.
Gallino, G.L., and Pierson, T.C., 1985, Polallie Creek debris flow and subsequent dam-break flood of 1980, East Fork Hood River basin, OR: U.S. Geological Survey Water-Sup-ply Paper 2273, 22 p.
Gartner, J.E., Cannon, S.H., Bigio, E.R., MacDonald, K., Rupert, M.G., Pierce, K.L., and Davis, N.K., 2005, Com-pilation of data relating to the erosive response of 606 recently burned basins in the western U.S.: U.S. Geological Survey Open-File Report 2005-1218.
Georgakakos, K.P., Seo, D.-J., Gupta, H., Schaake, J., and Butts, M.B., 2004, Towards the characterization of stream-flow simulation uncertainty through multimodel ensembles: Journal of Hydrology, v. 298, p. 222–241.
Glade, T., Crozier, M., and Smith, P., 2000, Applying prob-ability determination to refine landslide-triggering rainfall thresholds using an empirical “Antecedent Daily Rainfall Model:” Pure and Applied Geophysics, v. 157, no. 6-8, p. 1059–1079.
Glickman, T.S., 2000, Glossary of meteorology: Boston, Mass., American Meteorological Society, 855 p.
Gourley, J.J., Maddox, R.A., Howard, K.W., and Burgess, D.W., 2002, An exploratory multi-sensor technique for quantitative estimation of stratiform rainfall: Journal of Hydrometeorology, v. 3, p. 166–180.
Griswold, J.P., 2004, Mobility statistics and hazard mapping for non-volcanic debris flows and rock avalanches: Port-land, Oreg., Portland State University, M.S. thesis, 102 p.
Guo, J., Liang, X., and Leung, L.R., 2004, Impacts of differ-ent precipitation data sources on water budgets: Journal of Hydrology, v. 298, p. 311–334.
Haeberli, W., Kaab, A., Muhll, D., and Teysseire, P., 2001, Prevention of outburst floods from periglacial lakes at Grubengletscher, Valais, Swiss Alps: Journal of Glaciology, v. 47, p. 111–122.
Hanson, A., 1984, Landslide hazard analysis, in Brunsden, D., and Prior, D.B., eds., Slope instability: New York, John Wiley, p. 523–602.
Harris, R., Lisle, T., and Ziemer, R., 1997, Aftermath of the 1997 flood: Summary of a workshop: USDA Forest Service, April 8–9.
Hart, M.W., 1991, Landslides in the Peninsular Ranges, south-ern California, in Walawender, M.J., and Hanan, B.J., eds., Geological excursions in southern California and Mexico: Geological Society of American, Guidebook for 1991 Annual Meeting, p. 349–371.
Huggel, C., Kaab, A., Haeberli, W., and Krummenacher, B., 2003, Regional-scale GIS-models for assessment of hazards from glacier lake outbursts: Evaluation and application in the Swiss Alps: Natural Hazards and Earth System Sci-ences, v. 3, p. 647–662.
Hungr, O., 1995, A model for the runout analysis of rapid flow slide, debris flow, and avalanches: Canadian Geotechnical Journal, v. 32, p. 610–623.
Hungr, O., and Evans, S.G., 2004, Entrainment of debris in rock avalanches: An analysis of a long run-out mechanism: Geological Society of America Bulletin, v. 116, p. 1240–1252.
�� NOAA-USGS Debris-Flow Warning System—Final Report
Ivanov, V.Y., Vivoni, E.R., Bras, R.L., and Entekhabi, D., 2004, Preserving high-resolution surface and rainfall data in operational-scale basin hydrology: A fully-distributed physically-based approach: Journal of Hydrology, v. 298, p. 80–111.
Iverson, R.M., 1997, The physics of debris flow: Reviews in Geophysics, v. 35, p. 245–296.
Iverson, R.M., and Vallance, J.W., 2001, New views of granu-lar mass flows: Geology, v. 29, p. 115–118.
Iverson, R.M., Reid, M.E., and LaHusen, R.G., 1997, Debris-flow mobilization from landslides: Annual Reviews of Earth and Planetary Sciences, v. 25, p. 85–138
Iverson, R.M., Schilling, S.P., and Vallance, J.W., 1998, Objective delineation of lahar-inundation hazard zones: Geological Society of America Bulletin, v. 110, p. 972–984.
Johnson, A.M., with contributions from Rodine, J.R., 1984, Debris flow, in Brunsden, D., and Prior, D.B., eds., Slope instability: New York, John Wiley.
Keefer, D.K., Wilson, R.C., Mark, R.K,. Brabb, E.E., III, Ellen, S.D., Harp, E.L., Wieczorek, G.F., Alger, C.S., and Zatkin, R.S., 1987, Real-time landslide warning during heavy rainfall: Science v. 238, no.13, p. 921–925.
Koren, V., Reed, S., Moreda, F., Smith, M., and Zhang, Z., 2005, Evaluation of a grid-based distributed hydrological model over a large area: Model uncertainties at different scales: [Presented at VIIth General Assembly of the Interna-tional Association of Hydrological Sciences, Foz do Iguaçu, Brazil, session 7.1, April 3–9].
Larsen, M.C., and Simon, A., 1993, A rainfall intensity-duration threshold for landslides in a humid-tropical environment, Puerto Rico: Geografiska Annaler 75A, v. 1-2, p. 13–23.
Liang, X., Guo, J., and Leung, L.R., 2004, Assessment of the effects of spatial resolution on daily water flux simulations: Journal of Hydrology, v. 298, p. 287–310.
Los Angeles Times [Chong, J., Renaud, J. and Ailsworth, E.], 2004, Flash floods wash away lives, dreams: Los Angeles Times, Jan. 3, 2004, p. B.1.
Los Angeles Times [Rasmussen, C.], 2005, We’re drenched, but history has far worse tales: Los Angeles Times, Feb. 24, 2005, p. B.2.
Major, J.J., Pierson. T.C., and Scott, K.M., 2005, Debris flows at Mount St. Helens, Washington, USA, in Jakob, M., and Hugr. O., eds., Debris flow Hazards and related phenomena: Heidelberg, Springer-Praxis, p. 685–731.
Matrosov, S.Y., Clark, K.A., Marner, B.E., and Tokay, A., 2002, X-band polarimetric measurements of rainfall: Jour-nal of Applied Meteorology, v. 41, p. 941–952.
Meyer, G.A., and Wells, S.G., 1997, Fire-related sedimenta-tion events on alluvial fans, Yellowstone National Park, U.S.A.: Journal of Sedimentary Research, v. 67, no. 5, p. 776–791
Mills, K.A., 2002, Oregon’s debris flow warning system: Geo-logical Society of America Abstracts with Programs, v. 34, no. 5, p. 25.
Minnich, R.A., 1989, Climate, fire and landslide in southern California, in Sadler, P.M., and Morton, D.M., eds., Land-slides in a semi-arid environment: Publications of the Inland Geological Society, v. 2, p. 91–100.
Montgomery, D.R., and Dietrich, W.E., 1994, A physically-based model for the topographic control on shallow land-sliding: Water Resources Research, v. 30, p.1153–1171.
Mooney, H.A., and Parsons, D.J., 1973, Structure and function of the California chaparral: An example from San Dimas: Ecological Studies, v. 7, p. 83–112.
Morrissey, M., Wieczorek, G., and Morgan, B., 2004, Tran-sient hazard model using radar data for predicting debris flows in Madison County, Virginia: Environmental & Engi-neering Geosciences, v. X, no. 4, p. 285–296.
Morton, D.M., 1989, Distribution and frequency of storm-generated soil slips on burned and unburned slopes, San Timoteo Badlands, southern California, in Sadler, P.M., and Morton, D.M., eds., Landslides in a semi-arid environment with emphasis on the inland valleys of southern Califor-nia: Publications of the Inland Geological Society, v. 2, p. 279–284.
Morton, D.M., Alvarez, R.M., and Campbell, R.H., 2003, Preliminary soil-slip susceptibility maps, southwestern California: U.S. Geological Survey Open-File Report 03-017, available at URL <http://geopubs.wr.usgs.gov/open-file/of03-17/>.
National Research Council (NRC), 2005, Flash flood forecast-ing over complex terrain with an assessment of the Sulphur Mountain NEXRAD in southern California: Washington, D.C., National Academies Press, 191 p.
National Research Council, 2004, Partnerships for reduc-ing landslide risk—Assessment of the National Landslide Hazards Mitigation Strategy: Washington, D.C., National Academies Press, 131 p.
National Research Council, 2002, Weather radar technology beyond NEXRAD: Washington, D.C., National Academies Press, 81 p.
Neiman, P.J., Ralph, F.M., White, A.B., Kingsmill, D.E., and Persson, P.O.G., 2002, The statistical relationship between upslope flow and rainfall in California’s coastal mountains: Monthly Weather Review, v. 130, p. 1468–1492.
References ��

O’Brien, J.S., Julien, P.Y., and Fullerton, W.T., 1993, Two-dimensional water flood and mudflow simulation: Journal of Hydraulic Engineering, v. 119, no. 2, p. 244–259.
O’Connor, J., Hardison, J., and Costa, J., 2001, Debris flows from failures of neoglacial-age moraine dams in the Three Sisters and Mount Jefferson Wilderness Areas, Oregon: U.S. Geological Survey Professional Paper 1606.
Pack, R.T., Tarboton, D.G., and Goodwin, C.N., 1998, The SINMAP approach to terrain stability mapping: Proceed-ings of the 8th Congress of the Association of Engineering Geology, v. 2, p. 1157–1165.
Pierson, T.C., 2005a, Hyperconcentrated flow—Transitional process between water flow and debris flow, in Jakob, M., and Hungr, O., eds., Debris flow hazards and related phe-nomena: Heidelberg, Springer-Praxis, p. 159–200.
Pierson, T.C., 2005b, Distinguishing between debris flows and floods for field evidence in small watersheds: U.S. Geologi-cal Survey Fact Sheet 2004-3142.
Ralph, F.M., Neiman, P.J. , and Wick, G.A., 2004, Satellite and CALJET aircraft observations of atmospheric rivers over the eastern North Pacific Ocean during the winter of 1997/98: Monthly Weather Review, v. 132, p. 1721–1745.
Reed, S., Schaake, J., Koren, V., and Smith, M., 2005, Evalua-tion of a statistical-distributed model to address scale issues and uncertainties in flash flood prediction: [poster in VIIth International Association of Hydrological Sciences Sympo-sium, Session 7.6, Foz do Iguaçu, Brazil, April 3–9].
Reed, S., Koren, V., Smith, M., Zhang, Z., Moreda, F., Seo, D.-J, and DMIP participants, 2004, Overall distributed model intercomparison project results: Journal of Hydrol-ogy, v. 298 p. 29–60.
Rice, R.M., 1974, The hydrology of chaparral watersheds, in Rosenthal, M., ed., San Francisco, California, Sierra Club, California Division of Forestry, U.S. Forest Service—Sym-posium on living with chaparral: [Riverside, Calif., March 30–31, 1973, Conference Proceedings], p. 27–34.
Rickenmann, D., 1999, Empirical relationships for debris flows: Natural Hazards, v. 19, p. 47–77.
Rickenmann, D., and Zimmerman, M., 1993, The 1987 debris flows in Switzerland: Documentation and analysis: Geo-morphology, v. 8, p. 175–189.
Savage, W.Z., Godt, J.W., and Baum, R.L., 2003, A model for spatially and temporally distributed shallow landslide initiation by rainfall infiltration, in Rickenmann, D., and Chen, C., eds., Debris-flow hazards mitigation—Mechanics, prediction, and assessment—Proceedings of the 3rd Interna-tional Conference on Debris Flow Hazards, Davos, Switzer-land, September 10–13, 2003: Rotterdam, Millpress.
Schilling, S.P., 1998, LAHARZ—GIS programs for automated mapping of lahar-inundation hazard zones: U.S. Geological Survey Open-File Report 98-638, 80 p.
Schmidt, K.M., Roering, J.J., Stock, J.D., Dietrich, W.E., Montgomery, D.R. and Schuab, T., 2001, The variability of root cohesion as an influence on shallow landslide suscep-tibility in the Oregon Coast Range: Canadian Geotechnical Journal, v. 38, p. 995–1024.
Scott, K.M., and Williams, R.P., 1978, Erosion and sediment yields in the Transverse Ranges, southern California: U.S. Geological Survey Professional Paper 1030, 38 p.
Scott, K.M., 1971, Origin and sedimentology of 1969 debris flows near Glendora, California: U.S. Geological Survey Professional Paper 750-C, p. C242–C247.
Scott, K.M., 1988, Origin, behavior, and sedimentology of prehistoric catastrophic lahars at Mount St. Helens, Wash-ington, in Clifton, H.E., ed., Sedimentologic consequences of convulsive geologic events: Geological Society of America Special Paper 229, p. 23–36.
Scott, K.M., Vallance, J.W., Kerle, N., Macias, J.L., Strauch, W., and Devoli, G., 2005, Catastrophic precipitation-triggered lahar at Casita volcano, Nicaragua—Occurrence, bulking, and transformation: Earth Surface Processes and Landforms, v. 30, p. 59–79.
Seo, D.J., Kondragunta, C.R., Kitzmiller, D., Howard, K., Zhang, J., and Vasiloff, S.V., 2005, The National Mosaic and Multisensor QPE (NMQ) Project—Status and plans for a community testbed for high-resolution multisensor quantitative precipitation estimation (QPE) over the United States: 19th Conference on Hydrology, American Metero-logical Society.
Shuriman, G., Slosson, J.E., and Yoakum D., 1984, Relation-ship of fire/flood to debris flows, in Bowles, D.S., ed., Delineation of landslide, flash flood, and debris flow haz-ards in Utah—Proceedings of a Specialty Conference held at Utah State University, Logan, Utah, June 14–15, 1984: Utah Water Research Laboratory General Series UWRL/G-85/03.
Smith, M.B., Georgakakos, K.P., Liang, X., 2004, Preface—The distributed model intercomparison project: Journal of Hydrology, v. 298, p. 1–3.
Smith, M.B., Seo, D.-J., Koren, V.I., Reed, S.M., Zhang, Z., Duan, Q., Moreda, F., and Cong, S., 2004, The distributed model intercomparison project (DMIP)—Motivation and experiment design: Journal of Hydrology, v. 298.
Smith, M.B., Koren, V.I., Zhang, Z., Reed, S.M., Paj, J.-J. and Moreda, F., 2004, Runoff response to spatial variability in precipitation—An analysis of observed data: Journal of Hydrology, v. 298, p. 267–286.
�0 NOAA-USGS Debris-Flow Warning System—Final Report

State of California, 1958, Geologic map of California, Olaf P. Jenkins edition, San Luis Obispo sheet, compiled by C.W. Jennings: Department of Conservation, Division of Mines and Geology, scale 1:250,000.
State of California, 1965, Geologic map of California, Olaf P. Jenkins edition, Santa Ana sheet, compiled by T.H. Rogers: Department of Conservation, Division of Mines and Geol-ogy, scale 1:250,000.
State of California, 1967, Geologic map of California, Olaf P. Jenkins edition, San Bernardino sheet, compiled by T.H. Rogers: Department of Conservation, Division of Mines and Geology, scale 1:250,000.
State of California, 1969, Geologic map of California, Olaf P. Jenkins edition, Los Angeles sheet, compiled by C.W. Jennings and R.G. Strand: Department of Conservation, Division of Mines and Geology, scale 1:250,000.
Swanson, F.J., and Major, J.J., 2005, Physical events, envi-ronments, and geological-ecological interactions at Mount St. Helens: March 1980 to 2000, in Dale, V.H., Swanson, F.J., and Crisafulli, C.M., eds., Ecological responses to the 1980 eruptions of Mount St. Helens: New York, Springer, p. 27–44.
Taiwanese Soil and Water Conservation Bureau: Introduction of debris flow monitoring station.
Varnes, D.J., 1978, Landslide hazard zonation—A review of principles and practice: Paris, UNESCO Press, 63 p.
Vieux, B.E., Cui, Z., and Gaur, A., 2004, Evaluation of a phys-ics-based distributed hydrologic model for flood forecast-ing: Journal of Hydrology, v. 298, p. 155–177.
Waitt, R.B., Pierson, T.C., MacLeod, N.S., Janda, R.J., Voight, B., and Holcomb, R.T., 1983, Eruption triggered avalanche, flood, and lahar at Mount St. Helens—Effects of winter snowpack: Science, v. 221, p. 1394–1397.
Weber, F.H., and others, 1979, February-March 1978 rains in the Los Angeles region (Los Angeles, Orange, Riverside, San Bernardino, and Ventura Counties), southern California: DMG OFR 79-04.
Weber, F.H., and others, 1980, Effects on southern California of the rains of February 13–21 1980, Los Angeles, Orange, Riverside, and Ventura Counties, California: California Division of Mines and Geology Open-File Report 80-03.
Wells, W.G., 1987, The effects of fire on the generation of debris flows in southern California, in Costa, J.E, and Wieczorek, G.F., eds., Debris flows/avalanches, process,
recognition, and mitigation: Geological Society of America Reviews in Engineering Geology, v. 7, p. 105–114.
Wells, W.G., II, 1982, The storms of 1978 and 1980 and their effect on sediment movement in the eastern San Gabriel front, in Storms, floods and debris flows in southern California and Arizona, 1978 and 1980, [Proceedings of a Symposium, September 17–19, 1980]: Washington D.C., National Academy Press, Committee on Natural Disasters.
Wells, W.G., II., 1981, Some effects of brushfires on erosion processes in coastal southern California, in Erosion and sediment transport in Pacific Rim steeplands: Christchurch, New Zealand, International Association of Hydrological Science, no. 132, p. 305–342.
Wieczorek, G.F., 1987, Effect of rainfall intensity and duration on debris flows in central Santa Cruz Mountains, California, in Costa, J.E., and Wieczorek, G.F., eds., Debris flows/avalanches—Process, recognition, and mitigation: Reviews in Engineering Geology, Geological Society of America.
Wieczorek, G.F., Morgan, B.A., and Campbell, R.H., 2000, Debris-flow hazards in the Blue Ridge of central Virginia: Environmental and Engineering Geosciences, v. 6, p. 3–23.
Wilson, R.C., 1997, Operation of a landslide warning system during the California storm sequence of January and Febru-ary 1993, in Larson, R.A., and Slosson, J.E., eds., Reviews in engineering geology: Geological Society of America.
Wilson, R.C., and Wieczorek, G.F., 1995, Rainfall thresholds for the initiation of debris flows at La Honda, California: Environmental and Engineering Geoscience, v. 1, no. 1, p. 11–27.
Wilson, R.C., Mark, R.K., and Barbato, G., 1993, Operation of a real-time warning system for debris flows in the San Francisco Bay area, California, in Shen, H.W., Su, S.T., and Wen, F., eds., Hydraulic engineering ‘93: Proceedings of the 1993 Conference, San Francisco, Calif., July 25–30, 1993:Hydraulics Division, American Society of Civil Engineers, v. 2, p. 1908–1913.
Wohlgemuth, P.M., 1986, Surface sediment transport—a review of current knowledge and a field study of its spatial and temporal distributions in the San Dimas Experimental Forest, California: University of California, Northridge, Northridge, California, M.S. thesis, 282 p.
Zrnic, D.S., and Ryzhkov, A., 1996, Advantages of rain measurement using specific differential phase: Journal of Atmospheric and Oceanic Technology, v. 13, p. 454–464.
References �1

This Appendix is adapted and updated from Carter and others (1999).
Meteorological Development Laboratory
The Meteorological Development Laboratory has pro-duced statistical quantitative precipitation forecasts based on operational synoptic-scale NWP models for nearly 3 decades. Although much of this statistical guidance is disseminated rou-tinely to the field in categorical form, probabilistic forecasts (PQPF) have long been an integral part of this system.
Current operational synoptic-scale Model Output Statis-tics (MOS) QPF guidance is available in three distinct pack-ages from the Global Forecast System (GFS), the Eta model, and the Nested Grid Model (NGM). The GFS-based MOS guidance is available for 6- and 12-h periods for projections up to 72 hours after 0000, 0600, 1200, and 1800 UTC. The Eta-based MOS guidance is available for the same projections, but only during the 0000 and the 1200 UTC forecast cycles. An extended-range GFS-based MOS system for QPF provides guidance for 12- and 24-h periods out to 156 hours after 0000 UTC only. Both the GFS- and Eta-based MOS guidance pack-ages are available for more than 1,500 stations in the con-tiguous United States, Alaska, Hawaii, and Puerto Rico. The oldest MOS QPF system, based on the NGM, is available for almost 700 stations throughout the contiguous United States and 60 stations in Alaska. For all of these MOS systems, cat-egorical forecasts are available in alphanumeric form, whereas corresponding probabilistic forecasts are transmitted in binary format to all Weather Forecast Offices. Probabilistic and cat-egorical forecasts are provided in graphical form to the NCEP Hydrometeorological Prediction Center.
The synoptic-scale package of MDL QPF guidance is supplemented by short-range guidance from the Localized Aviation MOS Program (LAMP) QPF model. The LAMP system produces probabilistic, categorical, and expected-value forecasts on a 20-km grid for 1-, 3-, and 6-h periods in the 1- to 22-hour range. As input, the LAMP model uses the NGM-based MOS QPF probabilities together with a few direct model output fields from the NGM. Sub-synoptic-scale predictor input consists of objectively analyzed conventional surface observations and output from simple numerical models. Mesoscale predictor input includes fine-scale high-resolution precipitation climatology, hourly and 3-hourly antecedent precipitation analyses, and topography.
MDL plans to produce in late 2005 an extended-range MOS QPF system from the 1200 UTC cycle of the GFS. There are no plans at this time to develop a LAMP system based on either the GFS or Eta MOS guidance.
Hydrometeorological Prediction Center
Manual QPFs, representing spatially averaged precipita-tion and covering the continental United States, have been routinely prepared and issued since 1960 by forecasters in the National Precipitation Prediction Unit (NPPU) of the Forecast Operations Branch (FOB) of the HPC. Twenty-four-hour Day 1 QPFs are issued by FOB forecasters early each morning. These forecasts are valid from 1200 to 1200 UTC the follow-ing day, and are based on the 12- to 36-hour forecast from the 0000 UTC NWP model run. In addition, a Day 2 QPF and a Day 2 Update are issued, each valid for the 24-hour forecast period beginning 1200 UTC the following day. The Day 2 QPF and Day 2 Update products are issued in the early morn-ing and early afternoon, respectively.
Forecast guidance to support flash- and river-flood operations throughout the contiguous United States include the Excessive Rainfall Outlooks and short-range 6-h QPF product. The Excessive Rainfall Outlooks consist of a graphi-cal Rainfall Potential Exceeding RFC Flash Flood Guidance Product and an accompanying Excessive Rainfall Discussion. Six-hour forecasts are issued every 12 hours covering the 24-hour period from 1200–1200 UTC or 0000–0000 UTC. The forecasts for the first 18 hours of each of these two periods are updated once daily. The Excessive Rainfall Outlooks are produced three times per day with special issuances as needed. HPC guidance is not issued for Alaska, Hawaii, Guam, and Puerto Rico.
FOB forecasters reconcile differences between the obser-vational data, operational NCEP NWP models, and statisti-cal guidance during the preparation of the aforementioned manual, spatially averaged QPFs and associated guidance products. Verification of these manual products over the past 35 years has shown a steady improvement in forecast skill, with consistent improvements over the best NWP models. The HPC provides QPF products and services to a wide variety of partners and customers. A recent survey by the University Corporation of Atmospheric Research, as part of their review of the HPC, provided useful information as to which of the various HPC products are of most utility, and it also indicated the general level of user satisfaction with the products. The survey revealed that HPC QPF products are widely used and that the quality of these products appears to be acceptable. The private-sector meteorological community, in particular, uses both the graphic products and the text version of the isohyet locations to provide rainfall estimates to their customers in a repackaged format. The national media requires QPF to define areas of moderate to heavy rainfall across the contiguous United States. Other Government agencies including the Corps of Engineers, the Bureau of Reclamation, and various State
Appendix A—Functions of NWS Organizations Involved in the Preparation of Precipitation Forecasts
�� NOAA-USGS Debris-Flow Warning System—Final Report
and local water managers use the HPC products for water-resources management and flood management.
Weather Forecast Offices and River Forecast Centers
WFOs utilize NWP, MOS, and HPC guidance to produce QPF. In response, forecasters edit or “re-draw” QPF through a Graphical Forecast Editor. The QPF (for each 6-hour period out to 72 hours) is then sent to the National Digital Forecast Data-base (NDFD). Gridded QPF received from WFOs is mosaicked and available for access via the NDFD for the coterminous United States (CONUS), Alaska, and Puerto Rico.
RFCs create QPF for input to the NWSRFS in six hourly time steps. For RFCs, QPF is the prediction of basin average precipitation amounts accumulated over a river basin. RFCs utilize either the NMAP (Network Mapper) or Mountain Mapper software applications for QPF genera-tion and dissemination. RFCs who use Mountain Mapper in their operations convert point QPFs to forecast MAPs for inclusion in the river models. Western Region offices have traditionally produced point QPFs. This is largely due to the complexity in topography, precipitation climatology, and lack of high-resolution forecast guidance across the West.
WFOs and RFCs coordinate QPFs by way of telephone or 12Planet Chat software
Appendix B—Snowmelt and Rain-on-Snow Triggering of Debris Flows
The literature shows that snow-pack conditions com-monly cause or contribute to debris flows in mountainous areas throughout the world. Rain and snow events in 1983 resulted in widespread debris-flow activity in central and northern Utah, and throughout the Pacific Northwest in December 1996 through January 1997. In the Central Euro-pean Alps, the alpine areas are relatively densely populaated when compared with other alpine regions of the world. The large potential for the loss of life and property, combined with recent warming trends in the Alps, have lead to increased interest in studying, predicting, and mitigating debris flows there. Snow-triggered debris flows have also been studied in the Himalayas and other regions.
Numerous debris flows occurred in Switzerland during the summer of 1987. The initiation of several debris flows on the talus slopes of the upper part of alpine catchment basins was attributed to a blockage of water underneath a perennial snow patch at the toe of the rock wall (Rickenmann and Zim-merman, 1993). Snowmelt was considered a triggering factor for the initiation of the first pulse of these debris flows. The melting of old snow patches during the spring and summer months enhanced local water saturation of underlying uncon-solidated sediments. This was followed by a large second pulse of rain precipitation. The combination of the two pulses lead to more than 600 recorded debris flows in the Swiss Alps during the summer of 1987. There were two major rain storm events in July and August in the region. Air temperatures were high and the snow line was 3,000 m above mean sea level during most of the debris-flow events. Precipitation fell as rain-on-snow in the higher periglacial regions, resulting in pronounced debris-flow activity in the higher elevations. In
July, there was still significant snow cover, which resulted in the long-term saturation of loose debris by melting snow. This saturation led to rain-triggered debris-flow events in both July and August.
Another widely examined debris-flow hazard in the Swiss Alps involves the breaching of periglacial lakes. Snow plays an important role in the formation of these lakes. Four potentially hazardous periglacial lakes were studied near Valais in the Swiss Alps (Haeberli and others, 2001). Three of the lakes were naturally dammed by ice and snowdrifts. The lakes were formed in topographic depressions at their associ-ated glacier margins. During the 1960s and 1970s, the glaciers grew and the related depressions were filled year-round by accumulating snow and ice. From the late 1980s to present, during a general warming trend, the lakes have been enlarged by successive snow and ice melt toward the glaciers. Haeberli and others (2001) warn that the formation of slush avalanches in snow covering the outflow of these lakes can cause a sud-den increased discharge toward two of the lakes during spring and early summer. The recommendation the authors made for debris-flow-hazard mitigation was to establish a comprehen-sive observation system, combined with additional installation of protective barriers such as flood-release overflow structures.
Single-flow and multiple-flow GIS models were cre-ated for the assessment of hazards from glacier lake outbursts (Huggel and others, 2003). The models are topography based and use primarily ASTER satellite-derived digital elevation models. The model was applied to the Tasch Lake area of Switzerland, which experienced a devastating debris flow on June 25, 2001, during a period without any significant precipitation. Considerable parts of the village of Tasch were
Appendix B—Snowmelt and Rain-on-Snow Triggering of Debris Flows ��
destroyed or damaged by the event. Elevated air temperatures during the period prior to the event led to high snowmelt-water input to the lake. Tasch Lake had previously been dammed by pieces of lake ice and snow deposits. The elevated water level caused larger hydraulic gradients and piping in the moraine dam body. The snow and ice blockage ruptured, and the result-ing water initiated the debris flow that devastated the village. The single-flow GIS model was able to more accurately recre-ate the event than the multiple-flow version and was suggested as a possible predictive tool for the regional assessment of debris-flow hazards.
The winter of 1999 brought unprecedented amounts of snow to the European Alps. Switzerland was confronted with floods partly due to snowmelt (Bardou and Niggli, 2003). During the following two summers, large amounts of snow were still found in gullies down to 1,000 m above mean sea level. On average, more than 3 m of snow could be found in these gullies. The snow was found under a few centimeters of rock fragments that insulated the underlying snow. During the summers of 1999 and 2000, small debris flows occurred in many of the upper watersheds throughout the European Alps. Some of these debris flows occurred during clear weather and were not triggered by rain precipitation. The debris flows were observed to contain large amounts of snow. The authors performed statistical analyses over selected watersheds to correlate winter snowfall with the number of floods occur-ring during the following summers. They concluded that snow precipitation is often the underlying cause of debris flows in mountainous torrents during the first thunderstorms of the summer and that temperature and antecedent climatic history of the watershed must be examined in addition to rainfall to give a complete picture of debris-flow triggers.
Snow-avalanche deposits were examined as possible contributors to debris flows (Bardou and Delaloye, 2004). Snow avalanche deposits in gullies were shown to be both potential amplifying factors and potential reducing factors of debris flows in the Valais Alps of southwest Switzerland. Snow deposits increased the base flow under the snow pack and created a sliding plane for sediments, primarily during summer rain storms. Conversely, snow-avalanche deposits were shown to reduce the impact energy of raindrops, mainly during the time of winter storms. Bardou and Delaloye (2004) also contend that it is not currently possible to establish rain-fall threshold values for debris-flow triggering. The authors also state that it is difficult to attribute debris-flow triggering in alpine environments to rainfall alone due to hydrogeo-logical variability in these regions. In another study in the Himalayas (Wei and Gao, 1992), debris flows were triggered without simultaneous rainfall. An intense snowmelt in the early summer enhanced both superficial and subsurface runoff to provide the trigger for debris-flow initiation. The Swiss study discusses two contributions of snow-avalanche deposits to debris-flow triggering. The first is the increase in base flow of melt at the base of the snow pack. The second contribution occurs when the snow deposits are covered by sediments. Increased temperatures during the summer cause the upper
zone of the snow pack to soften, forming a very efficient sliding plane for the sediments covering it. Subsequent small slips in these sediments fill gullies with loose, highly mobile material. Consequent debris flows can result simply from the alternation of snowmelt events with these sediment slips. Bardou and Delaloye (2004) concluded through debris-flow- and snow-avalanche-event distributions that the number of debris flows is typically more significant during the two summers following a winter of large snow accumulation and subsequent avalanche activity. The severity of debris flows is generally the greatest during the second summer following significant snow avalanche activity. During the first summer, the extra deposits of very dense avalanche snow insulate the gully bed to reduce base flow.
Limited work has been done on the effects of snow pack on debris flows in the Pacific Northwest. The eruption of Mt. St. Helens in March of 1982 caused hot eruption products to interact with a thick snow pack (Waitt and others, 1983). The authors state that the eruption of Mt. St. Helens would have been confined to the crater and upper flanks of the volcano had it not been for the thick snow that mantled the steep crater wall. A lateral blast during the eruption generated a large snow avalanche that flowed 8 km down the volcano. The heat from the eruption also caused rapid snowmelt, creating a transient lake whose rapid discharge triggered a lahar (volcanic debris flow). There were two outlets to the transient lake. The snow melted faster than water could escape from the outlets, so the water discharged rapidly from the lake, creating a flood that swept down the crater breach. The flood picked up enough debris to emerge at the bottom as a lahar with a peak discharge of 13,800 m3/s. The lahar flowed into Spirit Lake and the Toutle River, severely eroding a debris retention dam 35 km downstream from the crater.
Debris flows resulting from the breach of neoglacial-age moraine dams in the Three Sisters and Mount Jefferson Wilderness Areas of Oregon have also been documented (O’Connor, Hardison, and Costa, 2001). This area has the highest concentration in the United States of lakes dammed by glacial moraines. There have been 11 moraine-breach debris flows described in this area since 1930. O’Connor, Hardison, and Costa (2001) state that many breaches were probably the result of erosion of steep lake outlet channels, triggered by unusually large discharges caused by avalanche waves in the lakes or by precipitation and melting snow and ice. The potential currently exists for at least five more neoglacial lake moraine-dam breaches in this area.
A debris flow created by a 1996 rain-on-snow event in the Blue Mountains of Washington was described at a Geolog-ical Society of America meeting (Carson, 2002). In February of 1996 there was a warm rain event on deep snow covering frozen ground in this area. Thousands of small slumps of loess and colluvium liquefied to become long, thin debris flows. Many of these flows were initiated at breaks in slope like road fills and farm berms. One particular flow originated from a logging road fill and formed a debris dam below the road. Continued runoff from this rain-on-snow event caused the dam
�� NOAA-USGS Debris-Flow Warning System—Final Report

to breach. The discharge, estimated at 62 m3/s, inundated a home with four residents.
Another debris flows in Washington was reported at the H.J. Andrews Experimental Forest in the central Cascades during a 1996 rain-on-snow storm (Harris and others, 1997). Runoff from snowmelt and rain generated 24 debris flows in the Lookout Creek basin.
Debris flows of noneruptive origin have also been studied on Mt. Shasta in northern California (Blodgett and others, 1996). The primary snow-related cause of debris flows in this area has been the release of meltwater into and over the ground. The area of historic debris-flow deposition below Mt. Shasta, the second largest volcano on the West Coast, is now being developed and populated. New noneruptive debris flows com-parable to those that have occurred in the past could be devas-tating to this community. Debris flows on Mt. Shasta generally originate near the termini of glaciers above 2,740 m a.s.l. Some debris flows also are caused by snowmelt streams originat-
ing in snow fields that are regions of permanent snow cover, such as the upper areas of Diller Canyon. Debris flows on Mt. Shasta have only been observed during the summer. Warm air temperatures and ablation of glaciers and snow pack are the primary triggers of debris flows on the mountain. The specific cause of these debris flows is generally a combination of water released from natural impoundments, snow and glacial melt, and precipitation on the stream basins during the summer snow and glacial melt season. Ground water recharged by snowmelt or rain precipitation may also cause slump failure and debris flows into stream channels. One debris flow resulting from the release of water from channels blocked by snow and ice was observed in 1934. Warm summer weather caused rapid snow melt on top of Konwakiton Glacier. This melt caused waterfalls that flowed into fissures in the glacier and reached the base. Large blocks of snow and ice were carried away from the gla-cier in the resulting torrent. Temporary dams were formed and then breached, resulting in a large debris flow.
Appendix C—List of Potential Customers and Collaborators
Appendix C—List of Potential Customers and Collaborators ��
Table C-1. List of potential customers and collaborators.
Agency
California Board of Mines and Geology California Department of Water Resources California Department of Transportation (CalTrans) California Geological Survey California Office of Emergency Services County Departments of Public Works County Flood Control Districts County Offices of Emergency Services Federal Emergency Management Agency (FEMA) Natural Resources Conservation Service NORAD/USNORTHCOM U.S. Department of Agriculture Forest Service
Customers in the WFO Oxnard Area
The following statement were compiled by Eric Boldt, WCM, WFO, Los Angeles/Oxnard, Calif., from interviews with the Department of Public Works, Watershed Department, County Flood Control, County Operations of Emergency Services (OES).
San Luis Obispo
Would like to see a 3- to 4-column product from USGS that uses different threat levels/categories similar to Advisory, Watch, Warning, or use a percent chance very similar to POPs.
Current USGS landslide Advisories have no concrete information included and would prefer advance notice before the Advisory is issued. SLO County would like to review and comment on any products proposed for development.
Santa Barbara
USGS currently shows a burn map with their Advi-sories, but would prefer a larger scale, county-specific map giving more detail. Do not think a flood Warning is appropriate for slides because floods have likely already occurred before Warning goes out. Maybe NWS needs an additional product to cover landslides? Like the idea of displaying landslide potential dangers on a Web site to get public attention.
Ventura
Would like better coordination between Federal, State, and county agencies on this type of project. Do not feel that the USGS is doing a good job of identifying their needs. Do not want redundant products and think there is an overload of Watch/Warning statements during big events. They have a good understanding of rainfall rates needed to create runoff problems near severely burned areas. Long lead time is pre-ferred.
Los Angeles
Department of Public Works issues a “Debris and Mudflow Potential Forecast” for severely burned areas of LA County during rain events, based on NWS QPS predictions at 0400 and 1600 hours. They do not foresee any benefit from a USGS statement for their purposes but thought it would be
useful if issued for unburned areas. Lead time would not help them in their decision-making
Customers in the WFO San Diego Area
The following statements were compiled by Ed Clark, WCM, WFO, San Diego, Calif., and from interviews with the Department of Public Works, Watershed Department, County Flood Control, County Operations of Emergency Services (OES).
Riverside
Riverside County does not seem concerned about their burn areas at the present time. Despite being offered, they did not ask for any special Flash Flood Criteria and have not had any significant mudslide or landslide problems.
San Diego
The primary agencies responding to flooding issues would be the Public Works and Roads Division, Sheriff’s Communication, EOC, and Flood Control. Outlook products for a significant event of 2 to 3 days would be ideal. As the event approaches at least 24 hours notice would be needed.
The initial criteria for the beginning of flooding and debris flows for the first two seasons has been 0.25 inch/hr for the beginning of flooding, and 0.25 inch/15 minutes for the beginning of moderate to severe flooding. That served them pretty well in the 2003–04 season. They still had some prob-lems in Oct. 2004, but not as bad as last season, even though the rain rates were pretty high. For the remainder of this cur-rent rainy season, they had several periods of heavy rain, but because they also had an explosion of vegetative growth with the abundant rains that held the soil in place, they saw almost no debris flows and encountered very few flooding problems. As a result, they are seriously considering relaxing their Warn-ing criteria (unless they get more fires) to maybe 0.35–0.50 inch/hr for the start of flooding/debris flows and 0.50 inch/15 minutes for the start of moderate flooding/debris flows. They had several periods this year where those new criteria were reached but encountered little problem.
San Bernardino
They want as much lead time as possible. The timing of Advisories, Watches, or Warnings is critical when preparing
Appendix D—Customer Requirements
�� NOAA-USGS Debris-Flow Warning System—Final Report

for evacuations. They would hope to be alerted by an Advisory or Watch 48 to 24 hours prior to a possible event and have a Warning 24 hours prior to an event.
Currently all Watches and Warnings pertaining to flood-ing are transmitted to their Flood Area Safety Task Force (FAST). They would expect this to continue for any debris-flow products. The FAST group includes many potential users including representatives from Public Works (Trans and
Flood), County Fire, OES, Sheriff, CHP, Red Cross, County Schools, and CALTRANS.
They also wanted more details on (1) What types of prod-ucts will be available? (2) Will this be similar to Advisories/Watches/Warnings issued for possible flooding or something similar to the Flash-Flood-Potential Index? and (3) It was stated that, hopefully, mapping that identifies areas at risk will be provided.
Published in the Central Region, Denver, ColoradoManuscript approved for publication August 8, 2005Editing, page layout, photocomposition—Richard W. Scott, Jr.Cover design—Carol A. QuesenberryGraphics by the authors
Appendix D—Customer Requirements �7