Embed Size (px)
Citation preview

Work ing PaPer Ser i e Sno 1202 /
involuntary
uneMPloyMent
and the BuSineSS
CyCle
by Lawrence J. Christiano, Mathias Trabandt and Karl Walentin
2010J une

WORKING PAPER SER IESNO 1202 /
In 2010 all ECB publications
feature a motif taken from the
€500 banknote.
INVOLUNTARY UNEMPLOYMENT
AND THE BUSINESS CYCLE1
by Lawrence J. Christiano 2, Mathias Trabandt 3 and Karl Walentin 4
1 We are grateful for the advice and comments of Gadi Barlevy, Marco Bassetto, Jeff Campbell, Mikael Carlsson, Ferre De Graeve, Martin Eichenbaum,
Jonas Fisher, Jordi Gali and Matthias Kehrig. We have also benefited from comments at the Journal of Economic Dynamics and Control
Conference on Frontiers in Structural Macroeconomic Modeling: Thirty Years after “Macroeconomics and Reality” and Five Years after “Nominal
Rigidities and the Dynamic Effects of a Shock to Monetary Policy”, Hitotsubashi University, Tokyo, Japan, January 23 2010. The views expressed
in this paper are solely the responsibility of the authors and should not be interpreted as reflecting the views of Sveriges Riksbank.
2 Northwestern University, Department of Economics, 2001 Sheridan Road, Evanston, Illinois 60208, USA, phone: +1-847-491-8231,
e-mail: [email protected]
3 Sveriges Riksbank and European Central Bank, Fiscal Policies Division, Kaiserstrasse 29, 60311 Frankfurt am Main,
Germany, phone: +49-69-1344-6321, e-mail: [email protected].
4 Sveriges Riksbank, Research Division, 103 37 Stockholm, Sweden, phone: +46-8-787- 0491,
e-mail: [email protected]
This paper can be downloaded without charge from http://www.ecb.europa.eu or from the Social Science Research Network electronic library at http://ssrn.com/abstract_id=1610151.
NOTE: This Working Paper should not be reported as representing the views of the European Central Bank (ECB). The views expressed are those of the authors
and do not necessarily reflect those of the ECB.
2010J une

© European Central Bank, 2010
AddressKaiserstrasse 2960311 Frankfurt am Main, Germany
Postal addressPostfach 16 03 1960066 Frankfurt am Main, Germany
Telephone+49 69 1344 0
Internethttp://www.ecb.europa.eu
Fax+49 69 1344 6000
All rights reserved.
Any reproduction, publication and reprint in the form of a different publication, whether printed or produced electronically, in whole or in part, is permitted only with the explicit written authorisation of the ECB or the authors.
Information on all of the papers published in the ECB Working Paper Series can be found on the ECB’s website, http://www.ecb.europa.eu/pub/scientific/wps/date/html/index.en.html
ISSN 1725-2806 (online)

3ECB
Working Paper Series No 1202
Abstract 4
Non-technical summary 5
1 Introduction 7
2 An unemployment-based Phillips curve 10
2.1 Families, households and the labor market 10
2.2 Goods production and price setting 17
2.3 Market clearing, aggregate resources and equilibrium 18
2.4 Log-linearizing the private sector equilibrium conditions 19
2.3 The NAIRU 22
3 Integrating unemployment into a medium-sized DSGE model 26
3.1 Final and intermediate goods 26
3.2 Family and household preferences 27
3.3 The family problem 29
3.4 Aggregate resource constraint, monetary policy and equilibrium 31
3.5 Aggregate labor force and unemployment in our model 32
3.6 The standard model 33
4 Estimation strategy 35
5 Estimation results for medium-sized model 37
5.1 Parameters 37
5.2 Impulse response functions of non-labor market variables 39
5.3 Impulse response functions of unemployment and the labor force 41
6 Concluding Remarks 42
References 45
Tables and fi gures 51
CONTENTS
2010June

4ECBWorking Paper Series No 1202
Abstract
We propose a monetary model in which the unemployed satisfy the o cial US de-nition of unemployment: they are people without jobs who are (i) currently makingconcrete e orts to nd work and (ii) willing and able to work. In addition, our modelhas the property that people searching for jobs are better o if they nd a job thanif they do not (i.e., unemployment is ‘involuntary’). We integrate our model of invol-untary unemployment into the simple New Keynesian framework with no capital anduse the resulting model to discuss the concept of the ‘non-accelerating in ation rate ofunemployment’. We then integrate the model into a medium sized DSGE model withcapital and show that the resulting model does as well as existing models at accountingfor the response of standard macroeconomic variables to monetary policy shocks andtwo technology shocks. In addition, the model does well at accounting for the responseof the labor force and unemployment rate to the three shocks.
Keywords: DSGE, unemployment, business cycles, monetary policy, Bayesian estima-tion.JEL codes: E2, E3, E5, J2, J6
2010June

5ECB
Working Paper Series No 1202
Non-Technical Summary
The unemployment rate is a key variable of interest to policy makers. Work has begun
recently on the task of introducing unemployment into DSGE models. However, the ap-
proaches taken to date assume the existence of perfect consumption insurance against labor
market outcomes, so that consumption is the same for employed and non-employed house-
holds. In contrast, the theory of unemployment developed here has the implication that the
unemployed are worse o than the employed. Our approach follows the work of Hopenhayn
and Nicolini (1997) and others, in which nding a job requires exerting a privately observed
e ort. In this type of environment, the higher utility enjoyed by employed households is
necessary for people to have the incentive to search for and keep jobs.
We de ne unemployment the way it is de ned by the agencies that collect the data. To
be o cially ‘unemployed’ a person must assert that she (i) has recently taken concrete steps
to secure employment and (ii) is currently available for work. To capture (i) we assume
that people who wish to be employed must undertake a costly e ort. Our model has the
implication that a person who asserts (i) and (ii) enjoys more utility if she nds a job than if
she does not, i.e., unemployment is ‘involuntary’. Empirical evidence appears to be consistent
with the notion that unemployment is in practice more of a burden than a blessing.
To highlight the mechanisms in our model, we introduce it into the simplest possible
DSGE framework, the model presented by Clarida, Gali and Gertler (1999) (CGG). The
CGG model has frictions in the setting of prices, but it has no capital accumulation and no
wage-setting frictions. In our model, households gather into families for the purpose of par-
tially ensuring themselves against bad labor market outcomes. Each household experiences
a privately observed shock that determines its aversion to work. Households that experience
a su ciently high aversion to work stay out of the labor force. The other households join the
labor force and are employed with a probability that is an increasing function of a privately
observed e ort. The only thing about a household that is observed is whether or not it is
employed. For simplicity we suppose the wage rate is determined competitively so that rms
and families take the wage rate as given. Firms face no search frictions and hire workers up
to the point where marginal costs and bene ts are equated.
Our environment has a simple representative agent formulation, in which the representa-
tive agent has an indirect utility function that is a function only of market consumption and
labor. As a result, our model is observationally equivalent to the CGG model when only the
data addressed by CGG are considered. In particular, our model implies the three equilib-
rium conditions of the New Keynesian model: an IS curve, a Phillips curve and a monetary
policy rule. The conditions can be written in the usual way, in terms of the ‘output gap’. In
our model there is a simple relation between the output gap and the ‘unemployment gap’:
2010June

6ECBWorking Paper Series No 1202
the di erence between actual and e cient unemployment. The presence of this gap in our
model allows us to discuss the microeconomic foundations of the non-accelerating in ation
rate of unemployment (NAIRU). The NAIRU plays a prominent role in public discussions
about the in ation outlook, as well as in discussions of monetary and labor market policies.
In practice, these discussions leave the formal economic foundations of the NAIRU unspec-
i ed. This paper, in e ect takes a step towards integrating the NAIRU into the formal
quantitative apparatus of monetary DSGE models.
Next, we introduce our model of unemployment into a medium-sized monetary DSGE
model that has been t to actual data. In particular, we work with a version of the model pro-
posed in Christiano, Eichenbaum and Evans (2005) (CEE). In this model there is monopoly
power in the setting of wages, there are wage setting frictions, capital accumulation and other
features. We estimate and evaluate our model using the Bayesian version of the impulse re-
sponse matching procedure proposed in Christiano, Trabandt and Walentin (2009a) (CTW).
The impulse response methodology has proved useful in the basic model formulation stage
of model construction, and this is why we use it here. The three shocks we consider are the
ones considered in Altig, Christiano, Eichenbaum and Linde (2004) (ACEL). In particular,
we consider VAR-based estimates of the impulse responses of macroeconomic variables to
a monetary policy shock, a neutral technology shock and an investment-speci c technology
shock. Our model can match the impulse responses of standard variables as well as the
standard model. However, our model also does a good job matching the responses of the
labor force and unemployment to the three shocks.
2010June

7ECB
Working Paper Series No 1202
1. Introduction
The unemployment rate is a key variable of interest to policy makers. A shortcoming of
standard monetary dynamic stochastic general equilibrium (DSGE) models is that they are
silent about this important variable. Work has begun recently on the task of introducing un-
employment into DSGEmodels. However, the approaches taken to date assume the existence
of perfect consumption insurance against labor market outcomes, so that consumption is the
same for employed and non-employed households. With this kind of insurance, a household
is delighted to be unemployed because it is an opportunity to enjoy leisure without a drop in
consumption.1 In contrast, the theory of unemployment developed here has the implication
that the unemployed are worse o than the employed. Our approach follows the work of
Hopenhayn and Nicolini (1997) and others, in which nding a job requires exerting a pri-
vately observed e ort.2 In this type of environment, the higher utility enjoyed by employed
households is necessary for people to have the incentive to search for and keep jobs.3
We de ne unemployment the way it is de ned by the agencies that collect the data. To
be o cially ‘unemployed’ a person must assert that she (i) has recently taken concrete steps
to secure employment and (ii) is currently available for work.4 To capture (i) we assume
that people who wish to be employed must undertake a costly e ort. Our model has the
implication that a person who asserts (i) and (ii) enjoys more utility if she nds a job than
if she does not, i.e., unemployment is ‘involuntary’. Empirical evidence appears to be con-
sistent with the notion that unemployment is in practice more of a burden than a blessing.5
For example, Chetty and Looney (2006) and Gruber (1997) nd that US households su er
roughly a 10 percent drop in consumption when they lose their job. Also, there is a substan-
tial literature which purports to nd evidence that insurance against labor market outcomes
1The drop in utility re ects that models typically assume preferences that are additively separable inconsumption and labor or that have the King, Plosser, Rebelo (1988) form. Examples include Blanchard andGali (2009), Christiano, Ilut, Motto and Rostagno (2008), Christiano, Trabandt and Walentin (2009,2009a),Christo el, Costain, de Walque, Kuester, Linzert, Millard, and Pierrard (2009), Christo el, and Kuester(2008), Christo el, Kuester and Linzert (2009), den Haan, Ramey and Watson (2000), Gali (2009), Gali,Smets and Wouters (2010), Gertler, Sala and Trigari (2009), Groshenny (2009), Krause, Lopez-Salido andLubik (2008), Lechthaler, Merkl and Snower (2009), Sala, Soderstrom and Trigari (2008), Sveen and Weinke(2008, 2009), Thomas (2008), Trigari (2009) and Walsh (2005).
2An early paper that considers unobserved e ort is Shavell and Weiss (1979). Our approach is also closelyrelated to the e ciency wage literature, as in Alexopoulos (2004).
3Lack of perfect insurance in practice probably re ects other factors too, such as adverse selection.Alternatively, Kocherlakota (1996) explores lack of commitment as a rationale for incomplete insurance.Lack of perfect insurance is not necessary for the unemployed to be worse o than the employed (seeRogerson and Wright, 1988).
4See the Bureau of Labor Statistics website, http://www.bls.gov/cps/cps_htgm.htm#unemployed, foran extended discussion of the de nition of unemployment, including the survey questions used to determinea household’s employment status.
5There is a substantial sociological literature that associates unemployment with an increased likelihoodof suicide and domestic violence.
2010June

8ECBWorking Paper Series No 1202
is imperfect. An early example is Cochrane (1991). These observations motivate our third
de ning characteristic of unemployment: (iii) a person looking for work is worse o if they
fail to nd a job than if they nd one.6
To highlight the mechanisms in our model, we introduce it into the simplest possible
DSGE framework, the model presented by Clarida, Gali and Gertler (1999) (CGG). The
CGG model has frictions in the setting of prices, but it has no capital accumulation and no
wage-setting frictions. In our model, households gather into families for the purpose of par-
tially ensuring themselves against bad labor market outcomes. Each household experiences
a privately observed shock that determines its aversion to work. Households that experience
a su ciently high aversion to work stay out of the labor force. The other households join the
labor force and are employed with a probability that is an increasing function of a privately
observed e ort. The only thing about a household that is observed is whether or not it is em-
ployed. Although consumption insurance is desirable in our environment, perfect insurance
is not feasible because everyone would claim high work aversion and stay out of the labor
force. We view the family as a stand-in for the various market and non-market arrangements
that actual households have for dealing with idiosyncratic labor market outcomes. Accord-
ingly, households are assumed to have no access to loan markets, while families have access
to complete markets.
In principle, in an environment like ours the wage would be set through a bargaining
mechanism. Instead, for simplicity we suppose the wage rate is determined competitively so
that rms and families take the wage rate as given.7 Firms face no search frictions and hire
workers up to the point where marginal costs and bene ts are equated. Although individual
households face uncertainty as to who will work and who will not, families are su ciently
large that there is no uncertainty at the family level. Once the family sets incentives by
allocating more consumption to employed households than to non-employed households, it
knows exactly how many households will nd work. The family takes the wage rate as given
and adjusts employment incentives until the marginal cost (in terms of foregone leisure and
6Although all the monetary DSGE models that we know of fail (iii), they do not fail (ii). In these modelsthere are workers who are not employed and who would say ‘yes’ in response to the question, ‘are youcurrently available for work?’. Although such people in e ect declare their willingness to take an actionthat reduces utility, they would in fact do so. This is because they are members of a large family insurancepool. They obey the family’s instruction that they value a job according to the value assigned by the family,not themselves. In these models everything about the individual household is observable to the family,and it is implicitly assumed that the family has the technology necessary to enforce veri able behavior.In our environment - and we suspect this is true in practice - the presence of private information makesit impossible to enforce a labor market allocation that does not completely re ect the preferences of theindividual household. (For further discussion, see Christiano, Trabandt and Walentin, 2009, 2009a).
7One interpretation of our environment is that job markets occur on Lucas-Phelps-Prescott type ‘islands’.E ort is required to reach those islands, but a person who nds the island nds a perfectly competitive labormarket. For recent work that uses a metaphor of this type, see Veracierto (2007).
2010June

9ECB
Working Paper Series No 1202
reduced consumption insurance) of additional market work equals the marginal bene t. The
rm and family rst order necessary conditions of optimization are su cient to determine
the equilibrium wage rate.
Our environment has a simple representative agent formulation, in which the representa-
tive agent has an indirect utility function that is a function only of market consumption and
labor. As a result, our model is observationally equivalent to the CGG model when only the
data addressed by CGG are considered. In particular, our model implies the three equilib-
rium conditions of the New Keynesian model: an IS curve, a Phillips curve and a monetary
policy rule. The conditions can be written in the usual way, in terms of the ‘output gap’. The
output gap is the di erence between actual output and output in the ‘e cient equilibrium’:
the equilibrium in which there are no price setting frictions and distortions from monopoly
power are extinguished. In our model there is a simple relation between the output gap and
the ‘unemployment gap’: the di erence between actual and e cient unemployment.8 The
presence of this gap in our model allows us to discuss the microeconomic foundations of the
non-accelerating in ation rate of unemployment (NAIRU). The NAIRU plays a prominent
role in public discussions about the in ation outlook, as well as in discussions of monetary
and labor market policies. In practice, these discussions leave the formal economic founda-
tions of the NAIRU unspeci ed. This paper, in e ect takes a step towards integrating the
NAIRU into the formal quantitative apparatus of monetary DSGE models.9
Next, we introduce our model of unemployment into a medium-sized monetary DSGE
model that has been t to actual data. In particular, we work with a version of the model pro-
posed in Christiano, Eichenbaum and Evans (2005) (CEE). In this model there is monopoly
power in the setting of wages, there are wage setting frictions, capital accumulation and other
features.10 We estimate and evaluate our model using the Bayesian version of the impulse re-
sponse matching procedure proposed in Christiano, Trabandt and Walentin (2009a) (CTW).
The impulse response methodology has proved useful in the basic model formulation stage
of model construction, and this is why we use it here. The three shocks we consider are the
ones considered in Altig, Christiano, Eichenbaum and Linde (2004) (ACEL). In particular,
we consider VAR-based estimates of the impulse responses of macroeconomic variables to
a monetary policy shock, a neutral technology shock and an investment-speci c technology
shock. Our model can match the impulse responses of standard variables as well as the
standard model. However, our model also does a good job matching the responses of the
labor force and unemployment to the three shocks.
The next two sections lay out our model in the context of the CGG and CEE models,
8This relationship is a formalization of the widely discussed ‘Okun’s law’.9For another approach, see Gali (2010).10The model of wage setting in the standard DSGE model is the one proposed in Erceg, Henderson and
Levin (2000).
2010June

10ECBWorking Paper Series No 1202
respectively. After that, we estimate the parameters of medium-sized model and report our
results. The paper ends with concluding remarks. In those remarks we draw attention to
some microeconomic implications of our model. We describe evidence that provides tentative
support for the model.
2. An Unemployment-based Phillips Curve
To highlight the mechanisms in our model of unemployment, we embed it into the framework
with price setting frictions, exible wages and no capital analyzed in CGG. The agents in
our model are heterogeneous, some households are in the labor force and some are out.
Moreover, of those who are in the labor force, some are employed and some are unemployed.
Despite this heterogeneity, the model has a representative agent representation. As a result,
the linearized equilibrium conditions of the model can be written in the same form as those
in CGG. Indeed, relative to a standard macroeconomic data set that includes consumption,
employment, in ation and the interest rate, but not unemployment and the labor force, our
model and CGG are observationally equivalent.11
In our environment, the output gap is proportional to what we call the unemployment
gap, the di erence between the actual and e cient rates of unemployment. As a result, the
Phillips curve can also be expressed in terms of the unemployment gap. We discuss the
implications of the theory developed here for the NAIRU and for the problem of forecasting
in ation.
2.1. Families, Households and the Labor Market
The economy is populated by a large number of identical families. The representative family’s
optimization problem is:
max{ +1}
0
X=0
( ) (0 1) (2.1)
subject to
+ +1 1 + +Transfers and pro ts (2.2)
11We found that there is a certain sense in which the welfare implications of the CGG model and ourmodel are also equivalent. In the technical appendix to this paper we display examples in which data aregenerated from our model of involuntary unemployment and provided to an econometrician who estimatesthe CGG model using a data set that does not include unemployment and the labor force. Consistent withthe observational equivalence result, the econometrician’s misspeci ed model ts the data as well as thetrue model (i.e., our involuntary unemployment model). To our suprise, when the econometrician computesthe welfare cost of business cycles, he nds that they coincide, to 11 digits after the decimal, with the truecost of business cycles. Thus, our model suggests that studies such as Lucas (1987), which abstract fromimperfections in labor market insurance, do not understate the welfare cost of business cycles. This ndingis consistent with similar ndings reported by Imrohoroglu (1989) and Atkeson and Phelan (1994).
2010June

11ECB
Working Paper Series No 1202
Here, denote family consumption and market work, respectively. In addition, +1
denotes the quantity of a nominal bond purchased by the family in period Also, denotes
the one-period gross nominal rate of interest on a bond purchased in period Finally,
denotes the competitively determined nominal wage rate. The family takes as given and
makes arrangements to set so that the relevant marginal conditions are satis ed.
The representative family is composed of a large number of ex ante identical households.
The households band together into families for the purpose of insuring themselves as best
they can against idiosyncratic labor market outcomes. Individual households have no access
to credit or insurance markets other than through their arrangements with the family. In
part, we view the family construct as a stand-in for the market and non-market arrangements
that actual households use to insure against idiosyncratic labor market experiences. In part,
we are following Andolfatto (1996) and Merz (1995), in using the family construct as a
technical device to prevent the appearance of di cult-to-model wealth dispersion among
households. We emphasize that, although there is no dispersion in household wealth in our
model, there is dispersion in consumption.
The family utility function, (· ·) in (2.1), is the utility attained by the solution to ane cient risk sharing problem subject to incentive constraints, for given values of and .
Our simplifying assumptions guarantee that (· ·) has a simple analytic representation. Animportant simplifying assumption is that consumption allocations across households within
the family are contingent only upon a household’s current employment status, and not on
its employment history.12
The representative family is composed of a unit measure of households. We follow Hansen
(1985) and Rogerson (1988) in supposing that household employment is indivisible. A house-
hold can either supply one unit of labor, or none at all.13 This assumption is consistent with
the fact that most variation in total hours worked over the business cycle re ects variations
in numbers of people employed, rather than in hours per person.
At the start of the period, each household in the family draws a privately observed idio-
syncratic shock, from a uniform distribution with support, [0 1] 14 The random variable,
determines the household’s utility cost of working:
+ (1 + ) (2.3)
The parameters, 0 and are common to all households. The object is potentially12The analysis of Atkeson and Lucas (1995) and Hopenhayn and Nicolini (1997) suggests that ex ante
utility would be greater if consumption allocations could be made contingent on a household’s reports of itspast labor market outcomes.13The indivisible labor assumption has attracted substantial attention recently. See, for example, Mulligan
(2001), and Krusell, Mukoyama, Rogerson, and Sahin (2008, 2009).14A recent paper which emphasizes a richer pattern of idiosyncracies at the individual rm and household
level is Brown, Merkl and Snower (2009).
2010June
12ECBWorking Paper Series No 1202
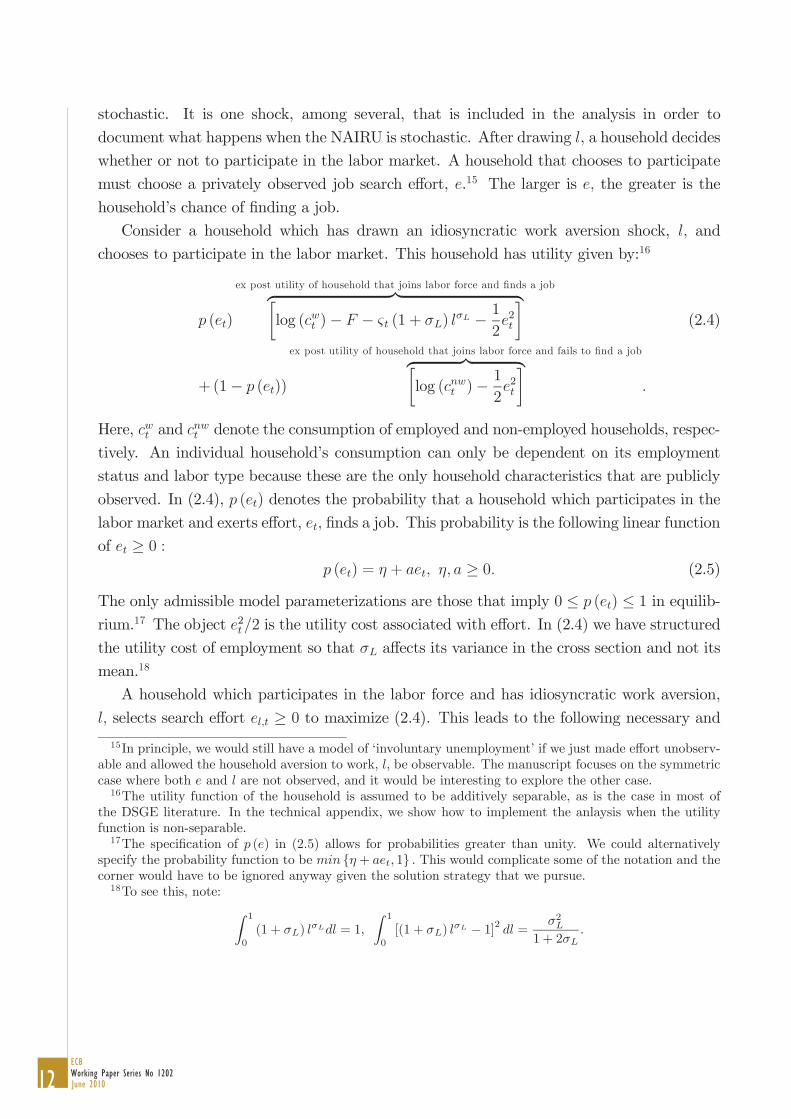
stochastic. It is one shock, among several, that is included in the analysis in order to
document what happens when the NAIRU is stochastic. After drawing , a household decides
whether or not to participate in the labor market. A household that chooses to participate
must choose a privately observed job search e ort, .15 The larger is the greater is the
household’s chance of nding a job.
Consider a household which has drawn an idiosyncratic work aversion shock, and
chooses to participate in the labor market. This household has utility given by:16
( )
ex post utility of household that joins labor force and nds a jobz }| {log ( ) (1 + )
1
22
¸(2.4)
+(1 ( ))
ex post utility of household that joins labor force and fails to nd a jobz }| {log ( )
1
22
¸Here, and denote the consumption of employed and non-employed households, respec-
tively. An individual household’s consumption can only be dependent on its employment
status and labor type because these are the only household characteristics that are publicly
observed. In (2.4), ( ) denotes the probability that a household which participates in the
labor market and exerts e ort, nds a job. This probability is the following linear function
of 0 :
( ) = + 0 (2.5)
The only admissible model parameterizations are those that imply 0 ( ) 1 in equilib-
rium.17 The object 2 2 is the utility cost associated with e ort. In (2.4) we have structured
the utility cost of employment so that a ects its variance in the cross section and not its
mean.18
A household which participates in the labor force and has idiosyncratic work aversion,
selects search e ort 0 to maximize (2.4). This leads to the following necessary and
15In principle, we would still have a model of ‘involuntary unemployment’ if we just made e ort unobserv-able and allowed the household aversion to work, be observable. The manuscript focuses on the symmetriccase where both and are not observed, and it would be interesting to explore the other case.16The utility function of the household is assumed to be additively separable, as is the case in most of
the DSGE literature. In the technical appendix, we show how to implement the anlaysis when the utilityfunction is non-separable.17The speci cation of ( ) in (2.5) allows for probabilities greater than unity. We could alternatively
specify the probability function to be { + 1} This would complicate some of the notation and thecorner would have to be ignored anyway given the solution strategy that we pursue.18To see this, note: Z 1
0
(1 + ) = 1
Z 1
0
[(1 + ) 1]2 =2
1 + 2
2010June

13ECB
Working Paper Series No 1202
su cient condition:
= max
½ μlog
¸(1 + )
¶0
¾The corresponding probability of nding a job is:
( ) = + 2max
½log
¸(1 + ) 0
¾(2.6)
Collect the terms in ( ) in (2.4) and then substitute out for ( ) using ( ) in (2.6).
We then nd that the utility of a household that draws work aversion index, and chooses
to participate in the labor force is:
+ 2max
½log
¸(1 + ) 0
¾¸(2.7)
× log
μ ¶(1 + )
¸+ log ( )
1
2max
½ μlog
¸(1 + )
¶0
¾¸2The utility of households which do not participate in the labor force is simply:
log ( ) (2.8)
Let denote the value of for which a household is just indi erent between participating
and not participating in the labor force (i.e., (2.7) is equal to (2.8)):
log
¸= + (1 + ) (2.9)
For households with 1 (2.7) is smaller than (2.8). They choose to be out of the
labor force. For households with 0 (2.7) is greater than (2.8), and they strictly
prefer to be in the labor force. By setting and according to (2.9) the family incentivizes
the households with the least work aversion to participate in the labor force. Imposing
(2.9) on (2.7), we nd that the ex ante utility of households which draw is:
(1 + ) ( ) +1
22 2 (1 + )2 ( )2 + log ( ) (2.10)
If households with work aversion index [0 ] participate in the labor force, then the
number of employed households, is:
=
Z0
( ) (2.11)
2010June

14ECBWorking Paper Series No 1202
or, after making use of (2.6) and (2.9) and rearranging,
= + 2 +1 (2.12)
Note that the right side is equal to zero for = 0 In addition, the right side of (2.12) is
unbounded above and monotonically increasing in As a result, for any value of 0
there exists a unique value of 0 that satis es (2.12), which we express as follows:
= ( ) (2.13)
where is monotonically increasing in
Let ¯ denote the largest value of ( ) Evidently, ¯ is the probability associated with
the household having the least aversion to work, = 0 Setting = 0 in (2.6) and imposing
(2.9):
¯ = + 2 (1 + ) (2.14)
We require
¯ 1 (2.15)
for all We assume that model parameters have been chosen to guarantee this condition
holds.
From (2.11) and the fact that ( ) is strictly decreasing in we see that
¯
It then follows from (2.15) that so that the unemployment rate,
(2.16)
is strictly positive. We gain insight into the determinants of the unemployment rate in the
model, by substituting out in (2.16) using (2.12):
= 1 2 (2.17)
According to (2.17), a rise in the labor force is associated with a proportionately greater
rise in employment, so that the unemployment rate falls. This greater rise in employment
re ects that an increase in the labor force requires raising employment incentives, and this
simultaneously generates an increase in search intensity. From (2.11) we see that is
linear in if search intensity is held constant, but that / increases with if search
intensity increases with That search intensity indeed does increase in can be seen by
substituting (2.9) into (2.6). It is important to note that the theory developed here does not
imply that the empirical scatter plot of the unemployment rate against the labor force lies
2010June

15ECB
Working Paper Series No 1202
rigidly on a negatively sloped line. Equation (2.17) shows that disturbances in (or in the
parameters of the search technology, (2.5)) would make the scatter of versus resemble
a shotgun blast rather than a line. A similar observation can be made about the relationship
between and in the context of (2.12).
Consider a household with aversion to work, which participates in the labor force. For
such a household the ex post utility of nding work minus the ex post utility of not nding
work is:
( ) = log
¸(1 + )
Condition (2.9) guarantees that, with one exception, ( ) 0 That is, among households
that participate in the labor force, those that nd work are strictly better o than those
that do not. The exceptional case is the marginal household with = , which sets search
e ort to zero and nds a job with probability The ex post utility enjoyed by the marginal
household is the same, whether its job search is successful or not.
In addition to the incentive constraint, the allocation of consumption across employed
and non-employed households must also satisfy the following resource constraint:
+ (1 ) = (2.18)
Here, is the aggregate consumption of the family and is the fraction of households that
is employed. Solving (2.18) and (2.9), for :
= ³+ (1+ ) 1
´+ 1
(2.19)
Integrating the utility, (2.10), of the households in the labor force and the utility,
(2.8), of the 1 households not in the labor force, we obtain:Z0
(1 + ) ( ) +1
22 2 (1 + )2 ( )2
¸+ log ( ) (2.20)
Evaluating the integral, and making use of (2.13) and (2.19), we obtain
( ) = log ( ) ( ) (2.21)
where
( ) = logh ³
+ (1+ ) ( ) 1´+ 1i
(2.22)2 2 (1 + ) 2
2 + 1( )2 +1 ( ) +1
In (2.22) the function, is de ned in (2.13).
2010June

16ECBWorking Paper Series No 1202
We now brie y discuss expression (2.21). First, note that the derivation of the utility
function, (2.21), involves no maximization problem by the family. This is because the family
incentive and resource constraints, (2.9) and (2.18), are su cient to determine and
conditional on and In general, the constraints would not be su cient to determine
the household consumption allocations, and the family problem would involve non-trivial
optimization. Second, we can see from (2.21) that our model is likely to be characterized by
a particular observational equivalence property. To see this, note that although the agents in
our model are in fact heterogeneous, and are chosen as if the economy were populated
by a representative agent with the utility function speci ed in (2.21). A model such as
CGG, which speci es representative agent utility as the sum of the log of consumption
and a constant elasticity disutility of labor is indistinguishable from our model, as long as
data on the labor force and unemployment are not used. This is particularly obvious if, as
is the case here, we only study the linearized dynamics of the model about steady state.
In this case, the only properties of a model’s utility function that are used are its second
order derivative properties in nonstochastic steady state. This observational equivalence
result re ects our simplifying assumptions. These assumptions are primarily driven by the
desire for analytic tractability, so that the economics of the environment are as transparent
as possible. Presumably, a careful analysis of microeconomic data would lead to di erent
functional forms and the resulting model would then not be observationally equivalent to
the standard model.
Our model and the standard CGG model are distinguished by two features. First, our
model addresses a larger set of time series than the standard model does. Second, in our
model the representative agent’s utility function is a reduced form object. Its properties
are determined by details of the technology of job search, and by cross-sectional variation
in preferences with regard to attitudes about market work. As a result, the basic structure
of the utility function in our model can in principle be informed by time use surveys and
studies of job search.19
With the representative family’s utility function in hand, we are in a position to state
the necessary conditions for optimization by the representative family:
1=
1
+1 +1(2.23)
( ) = (2.24)
19A similar point was made by Benhabib, Rogerson and Wright (1991). They argue that a representativeagent utility function of consumption and labor should be interpreted as a reduced form object, after non-market consumption and labor activities have been maximized out. From this perspective, construction ofthe representative agent’s utility function can in principle be guided by surveys of how time in the home isused.
2010June

17ECB
Working Paper Series No 1202
Here, +1 is the gross rate of in ation from to +1 The expression to the left of the equality
in (2.24) is the family’s marginal cost in consumption units of providing an extra unit of
market employment. This marginal cost takes into account the need for the family to provide
appropriate incentives to increase employment. A cost of the incentives, which involves
increasing the consumption di erential between employed and non-employed households, is
that consumption insurance to family members is reduced.
2.2. Goods Production and Price Setting
Production is standard in our model. Accordingly, we suppose that a nal good, is
produced using a continuum of inputs as follows:
=
Z 1
0
1¸
1 (2.25)
The good is produced by a competitive, representative rm which takes the price of output,
and the price of inputs, as given. The rst order necessary condition associated with
optimization is: μ ¶1
= (2.26)
A useful result is obtained by substituting out for in (2.25) from (2.26):
=
Z 1
0
( )11
¸ ( 1)(2.27)
Each intermediate good is produced by a monopolist using the following production
function:
=
where is an exogenous stochastic process whose growth rate,
1
is stationary. The marginal cost of the rm is, after dividing by :
= (1 ) = (1 )( )
(2.28)
after using (2.24) to substitute out for . Here, is a subsidy designed to remove the
e ects, in steady state, of monopoly power. To this end, we set
1 =1
(2.29)
2010June

18ECBWorking Paper Series No 1202
Monopolists are subject to Calvo price frictions. In particular, a fraction of interme-
diate good rms cannot change price:
= 1 (2.30)
and the complementary fraction, 1 set their price optimally:
= ˜
The monopolist that has the opportunity to reoptimize its price in the current period is
only concerned about future histories in which it cannot reoptimize its price. This leads to
the following problem:
max˜
X=0
¡ ¢+
h˜
+ + + +
i(2.31)
subject to (2.26). In (2.31), is the multiplier on the representative family’s time ow
budget constraint, (2.2), in the Lagrangian representation of its problem. Intermediate good
rms take + as given. The nature of the family’s preferences, (2.21), implies:
+ =1
+ +
2.3. Market Clearing, Aggregate Resources and Equilibrium
Clearing in the loan market requires +1 = 0 Clearing in the market for nal goods requires:
+ = (2.32)
where denotes government consumption. We model as follows:
= (2.33)
where log is a stationary stochastic process independent of any other shocks in the system,
such as The variable, appears in (2.33) in order to ensure that the model exhibits
balanced growth, and has the following representation:
= 11 0 1
In the extreme case, = 1, (2.33) reduces to the model of proposed in Christiano and
Eichenbaum (1992). That model implies, implausibly, that responds immediately to a
shock in . With close to zero, is proportional to a long average of past values of
2010June

19ECB
Working Paper Series No 1202
and the immediate impact of a disturbance in on is arbitrarily small. For any
admissible value of
(2.34)
converges in nonstochastic steady state. The law of motion of is:
=
μ1
¶1The relationship between aggregate output of the nal good, and aggregate employ-
ment, is given by (see Yun, 1996):
= (2.35)
where μ ¶1
=
"Z 1
0
1
# 1
(2.36)
The model is closed once we specify how monetary policy is conducted and time series
representations for the shocks. A sequence of markets equilibrium is a stochastic process for
prices and quantities which satis es market clearing and optimality conditions for the agents
in the model.
2.4. Log-Linearizing the Private Sector Equilibrium Conditions
It is convenient to express the equilibrium conditions in linearized form relative to the ‘ef-
cient’ equilibrium. We de ne the e cient equilibrium as the one in which = 1 for all
monopoly power does not distort the level of employment, and there are no price fric-
tions. We refer to the equilibrium in our market economy with sticky prices as simply the
‘equilibrium’, or the ‘actual equilibrium’ when clarity requires special emphasis.
2.4.1. The E cient Equilibrium
In the e cient equilibrium, the marginal cost of labor and the marginal product of labor are
equated:
( ) =
The resource constraint in the e cient equilibrium is + = which, when substituted
into the previous expression implies:
( ) ( ) = 1 (2.37)
where the ‘ ’ indicates an endogenous variable in the e cient equilibrium. Evidently, the
e cient level of employment, uctuates in response to disturbances in and It also
2010June

20ECBWorking Paper Series No 1202
responds to disturbances in in the plausible case, 1 The level of work in the
nonstochastic steady state of the e cient equilibrium coincides with the level of work in the
nonstochastic steady state of the actual equilibrium. This object is denoted by in both
cases. The values of all variables in nonstochastic steady state coincide across actual and
e cient equilibria.
Linearizing (2.37) about steady state,
ˆ =1
(ˆ + ˆ ) ˆ
11
+=1 +
¡1
¢ (ˆ + ˆ )1
1 +¡1
¢ ˆ (2.38)
where
(2.39)
denotes the steady state value of and
ˆ = (1 ) (ˆ 1 ˆ ) (2.40)
In (2.39), denotes the cross derivative of with respect to and ( = ), evaluated
in steady state and denotes the derivative of with respect to evaluated in steady
state. We follow the convention that a hat over a variable denotes percent deviation from
its steady state value.
The object, is a measure of the curvature of the function, in the neighborhood of
steady state. Also, 1 is a consumption-compensated elasticity of family labor supply in
steady state. Although 1 bears a formal similarity to the Frisch elasticity of labor supply,
there is an important distinction. In practice the Frisch elasticity refers to a household’s
willingness to change its labor supply on the intensive margin in response to a wage change.
In our environment, all changes in labor supply occur on the extensive margin.
The e cient rate of interest, is derived from (2.23) with consumption and in ation
set at their e cient rates:
=1
+1( +1 +1 +1)
¸Linearizing the e cient rate of interest expression about steady state, we obtain:
ˆ = ˆ +1 +1
1
³ˆ+1
ˆ´
1[(ˆ +1 + ˆ +1) (ˆ + ˆ )] (2.41)
where ˆ +1 ˆ are de ned in (2.38).
2010June
21ECB
Working Paper Series No 1202
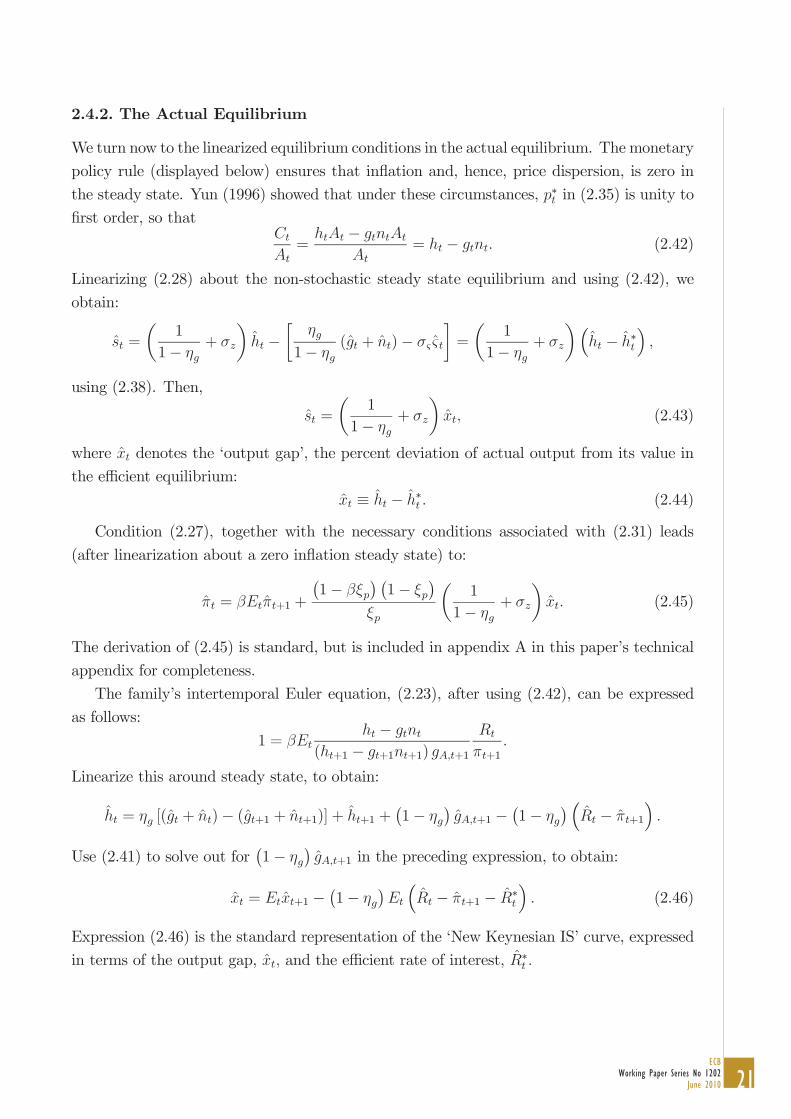
2.4.2. The Actual Equilibrium
We turn now to the linearized equilibrium conditions in the actual equilibrium. The monetary
policy rule (displayed below) ensures that in ation and, hence, price dispersion, is zero in
the steady state. Yun (1996) showed that under these circumstances, in (2.35) is unity to
rst order, so that
= = (2.42)
Linearizing (2.28) about the non-stochastic steady state equilibrium and using (2.42), we
obtain:
ˆ =
μ1
1+
¶ˆ
1(ˆ + ˆ ) ˆ
¸=
μ1
1+
¶³ˆ ˆ
´using (2.38). Then,
ˆ =
μ1
1+
¶ˆ (2.43)
where ˆ denotes the ‘output gap’, the percent deviation of actual output from its value in
the e cient equilibrium:
ˆ ˆ ˆ (2.44)
Condition (2.27), together with the necessary conditions associated with (2.31) leads
(after linearization about a zero in ation steady state) to:
ˆ = ˆ +1 +
¡1
¢ ¡1
¢ μ1
1+
¶ˆ (2.45)
The derivation of (2.45) is standard, but is included in appendix A in this paper’s technical
appendix for completeness.
The family’s intertemporal Euler equation, (2.23), after using (2.42), can be expressed
as follows:
1 =( +1 +1 +1) +1 +1
Linearize this around steady state, to obtain:
ˆ = [(ˆ + ˆ ) (ˆ +1 + ˆ +1)] + ˆ +1 +¡1
¢ˆ +1
¡1
¢ ³ˆ ˆ +1
´Use (2.41) to solve out for
¡1
¢ˆ +1 in the preceding expression, to obtain:
ˆ = ˆ +1¡1
¢ ³ˆ ˆ +1 ˆ
´(2.46)
Expression (2.46) is the standard representation of the ‘New Keynesian IS’ curve, expressed
in terms of the output gap, ˆ and the e cient rate of interest, ˆ
2010June
22ECBWorking Paper Series No 1202
The model is closed with the assumption that monetary policy follows a Taylor rule of
the following form:
ˆ = ˆ1 + (1 ) [ ˆ + ˆ ] + (2.47)
where is an iid monetary policy shock. The equilibrium conditions of the log-linearized
system are (2.38), (2.40), (2.41), (2.45), (2.46), and (2.47). These conditions determine the
equilibrium stochastic processes, ˆ ˆ ˆ ˆ ˆ and ˆ as a function of the exogenous
stochastic processes, ˆ , ˆ ˆ and The rst three stochastic processes enter the system
via the e cient rate of interest and employment as indicated in (2.38) and (2.41), and the
monetary policy shock enters via (2.47). The variables, ˆ can be solved using (2.38) and
(2.44).
The model parameters that enter the equilibrium conditions are ˆ and
Consistent with the observational equivalence discussion after (2.21), there is no way, absent
observations on unemployment and the labor force, to tell whether these parameters are the
ones associated with CGG or with our involuntary unemployment model. Thus, relative to
time series on the six variables, ˆ ˆ ˆ ˆ ˆ and ˆ our model and the standard CGG
model are observationally equivalent.
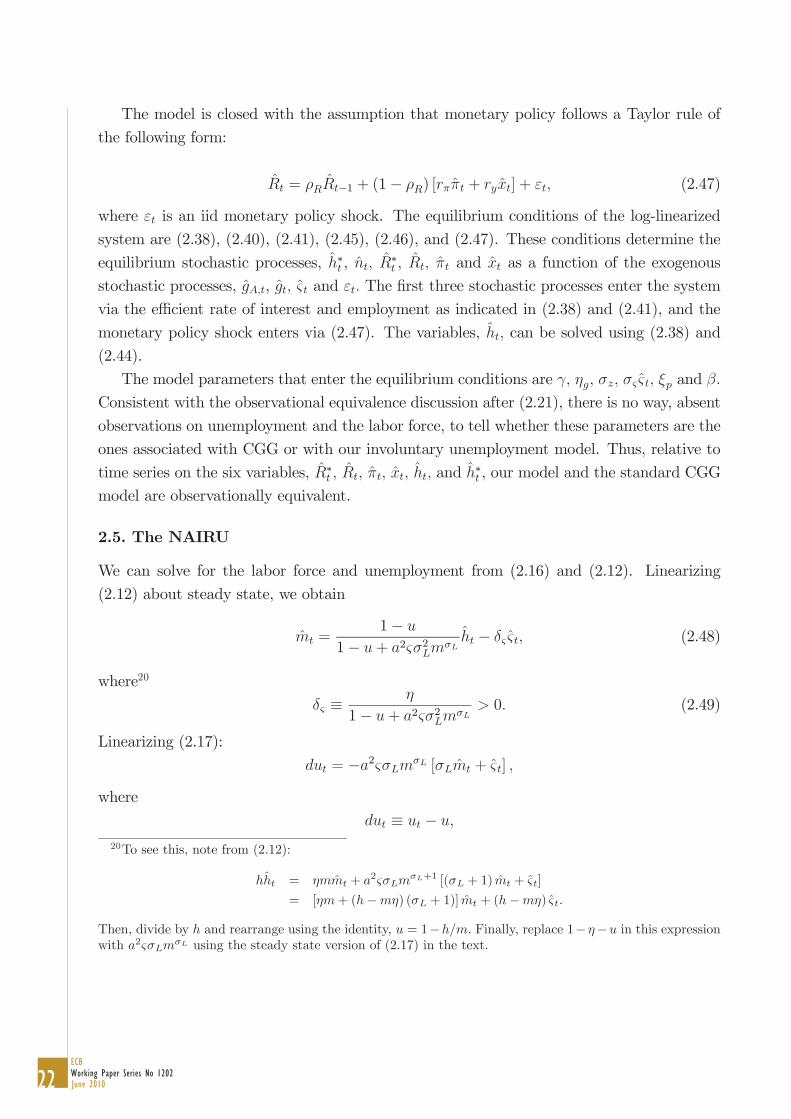
2.5. The NAIRU
We can solve for the labor force and unemployment from (2.16) and (2.12). Linearizing
(2.12) about steady state, we obtain
ˆ =1
1 + 2 2ˆ ˆ (2.48)
where20
1 + 2 20 (2.49)
Linearizing (2.17):
= 2 [ ˆ + ˆ ]
where
20To see this, note from (2.12):
ˆ = ˆ + 2 +1 [( + 1) ˆ + ˆ ]
= [ + ( ) ( + 1)] ˆ + ( )ˆ
Then, divide by and rearrange using the identity, = 1 Finally, replace 1 in this expressionwith 2 using the steady state version of (2.17) in the text.
2010June
23ECB
Working Paper Series No 1202
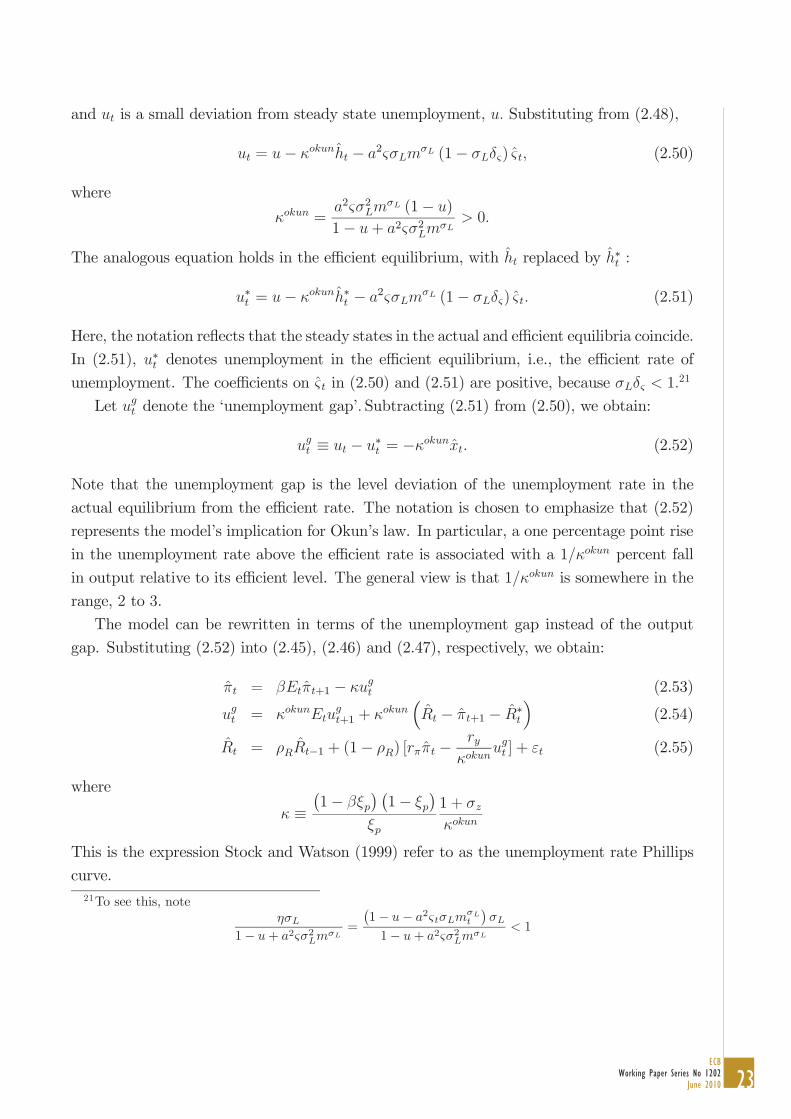
and is a small deviation from steady state unemployment, Substituting from (2.48),
= ˆ 2 (1 ) ˆ (2.50)
where
=2 2 (1 )
1 + 2 20
The analogous equation holds in the e cient equilibrium, with ˆ replaced by ˆ :
= ˆ 2 (1 )ˆ (2.51)
Here, the notation re ects that the steady states in the actual and e cient equilibria coincide.
In (2.51), denotes unemployment in the e cient equilibrium, i.e., the e cient rate of
unemployment. The coe cients on ˆ in (2.50) and (2.51) are positive, because 1 21
Let denote the ‘unemployment gap’ Subtracting (2.51) from (2.50), we obtain:
= ˆ (2.52)
Note that the unemployment gap is the level deviation of the unemployment rate in the
actual equilibrium from the e cient rate. The notation is chosen to emphasize that (2.52)
represents the model’s implication for Okun’s law. In particular, a one percentage point rise
in the unemployment rate above the e cient rate is associated with a 1 percent fall
in output relative to its e cient level. The general view is that 1 is somewhere in the
range, 2 to 3.
The model can be rewritten in terms of the unemployment gap instead of the output
gap. Substituting (2.52) into (2.45), (2.46) and (2.47), respectively, we obtain:
ˆ = ˆ +1 (2.53)
= +1 +³ˆ ˆ +1 ˆ
´(2.54)
ˆ = ˆ1 + (1 ) [ ˆ ] + (2.55)
where ¡1
¢ ¡1
¢1 +
This is the expression Stock and Watson (1999) refer to as the unemployment rate Phillips
curve.21To see this, note
1 + 2 2 =
¡1 2
¢1 + 2 2 1
2010June

24ECBWorking Paper Series No 1202
We can relate the theory derived here to the idea of a non-accelerating in ation rate of
unemployment (NAIRU). One interpretation of the NAIRU focuses on the rst di erence
of in ation. Under this interpretation, the NAIRU is a level of unemployment such that
whenever the actual unemployment rate lies below it, in ation is predicted to accelerate and
whenever the actual unemployment rate is above it, in ation is predicted to decelerate. The
e cient level of unemployment, does not in general satisfy this de nition of the NAIRU.
From (2.53) it is evident that a negative value of does not predict an acceleration of
in ation in the sense of predicting a positive value for
ˆ +1 ˆ (2.56)
On the contrary, according to the unemployment rate Phillips curve, (2.53), a negative value
of creates an anticipated deceleration in in ation.22 Testing this implication of the data
empirically is di cult, because is not an observed variable. However, some insight can be
gained if one places upper and lower bounds on For example, suppose (4 8) That
is, the e cient unemployment rate in the postwar US was never below 4 percent or above
8 percent. In the 593 months between February 1960 and July 2009, the unemployment
rate was below 4 percent in 52 months and above 8 percent in 42 months. Of the months
in which unemployment was above its upper threshold, the change in in ation from that
month to three months later was negative 79 percent of the time. Of the months in which
unemployment was below the 4 percent lower threshold, the corresponding change in in ation
was positive 67 percent of the time. If one accepts our assumption about the bounds on ,
these results lend empirical support to the proposition that there exists a NAIRU in the rst
di erence sense. They also represent evidence against the model developed here.23
An alternative interpretation of the NAIRU focuses on the level of in ation, rather than
its change. Under this interpretation, in the theory developed here is a NAIRU.24 To see
this, one must take into account that the theory (sensibly) implies that in ation returns to
steady state after a shock that causes to drop has disappeared. That is, the eventual
22In their discussion of the NAIRU, Ball and Mankiw (2002) implicitly reject (2.53) as a foundation for thenotion that is a NAIRU. Their discussion begins under a slightly di erent version of (2.53), with ˆ +1
replaced by 1ˆ . They take the position that in this framework is a NAIRU only when monetarypolicy generates the random walk outcome, 1ˆ = ˆ 1 In this case, a negative value of is associatedwith a deceleration of current in ation relative to what it was in the previous period. Ball and Mankiwargue that the random walk case is actually the relevant one for the US in recent decades.23Our bounds test follows the one implemented in Stiglitz (1997) and was executed as follows. Monthly
observations on the unemployment and the consumer price index were taken from the Federal Reserve Bankof St. Louis’ online data base, FRED. We worked with the raw unemployment rate. The consumer priceindex was logged, and we computed a year-over-year rate of in ation rate, The percentages reported inthe text represent the fraction of times that 4 and +3 0 and the fraction of times that 8and +3 024In his discussion of the NAIRU, Stiglitz (1997) appears to be open to either the rst di erence or level
interpretation of the NAIRU.
2010June

25ECB
Working Paper Series No 1202
e ect on in ation of a negative shock to must be zero. That a negative shock to also
creates the expectation of a deceleration in in ation then implies that in ation converges
back to steady state from above after a negative shock to That is, a shock that drives
below is expected to be followed by a higher level of in ation and a shock that drives
above is expected to be followed by a lower level of in ation.25
Thus, in the theory derived here is a NAIRU if one adopts the level interpretation of
the NAIRU and not if one adopts the rst di erence interpretation. Interestingly, is a
NAIRU under the rst di erence interpretation if one adopts the price indexation scheme
proposed in CEE, in which (2.30) is replaced by
= 1 1
In this case, ˆ and ˆ +1 in (2.53) are replaced by their rst di erences. Retracing the logic
of the previous two paragraphs establishes that with price indexation, is a NAIRU in the
rst di erence sense. Under our assumptions about the bounds on price indexation also
improves the empirical performance of the model on the dimensions emphasized here.
It is instructive to consider the implications of the theory for the regression of the period
+1 in ation rate on the period unemployment and in ation rates. In the very special case
that is a constant, the regression coe cient on would be and other variables would
not add to the forecast 26 However, these predictions depend crucially on the assumption
that is constant. If it is stochastic, then is part of the error term. Since is expected
to be correlated with all other variables in the model, then adding these variables to the
forecast equation is predicted to improve t.
25A quick way to formally verify the convergence properties just described is to consider the followingexample. Suppose the monetary policy shock, is an iid stochastic process. Let the response of theendogenous variables to be given by
= ˆ = ˆ =
where and are undetermined coe cients to be solved for. Substituting these into the equationsthat characterize equilibrium and imposing that the equations must be satis ed for every realization ofwe nd:
=1 + +
= =1
According to these expressions, a monetary policy shock drives and in the same direction. Thus, amonetary policy shock that drives the interest rate down also drives the unemployment gap down. The sameshock drives current in ation up.26In our model, is constant only under very special circumstances. For example, it is constant if
government spending is zero and the labor preference shock, is constant. However, as explained after(2.37), is a function of all three shocks when government spending is positive and 1
2010June

26ECBWorking Paper Series No 1202
3. Integrating Unemployment into a Medium-Sized DSGE Model
Our representation of the ‘standard DSGE model’ is a version of the medium-sized DSGE
model in CEE or Smets and Wouters (2003, 2007). The rst section below describes how we
introduce our model of involuntary unemployment into the standard model. The last section
derives the standard model as a special case of our model.
3.1. Final and Intermediate Goods
A nal good is produced by competitive rms using (2.25). The intermediate good is
produced by a monopolist with the following production function:
= ( )1 + (3.1)
where denotes capital services used for production by the intermediate good producer.
Also, log ( ) is a technology shock whose rst di erence has a positive mean and denotes
a xed production cost. The economy has two sources of growth: the positive drift in log ( )
and a positive drift in log ( ) where is the state of an investment-speci c technology
shock discussed below. The object, + in (3.1) is de ned as follows:
+ = 1
Along a non-stochastic steady state growth path, + and + converge to constants.
The two shocks, and are speci ed to be unit root processes in order to be consistent
with the assumptions we use in our VAR analysis to identify the dynamic response of the
economy to neutral and capital-embodied technology shocks. The two shocks have the
following time series representations:
log = + ( )2 = ( )2 (3.2)
log = + log 1 +³ ´2
= ( )2 (3.3)
Our assumption that the neutral technology shock follows a random walk with drift matches
closely the nding in Smets and Wouters (2007) who estimate log to be highly autocorre-
lated. The direct empirical analysis of Prescott (1986) also supports the notion that log
is a random walk with drift.
In (3.1), denotes homogeneous labor services hired by the intermediate good
producer. Intermediate good rms must borrow the wage bill in advance of production, so
that one unit of labor costs is given by
2010June

27ECB
Working Paper Series No 1202
where denotes the gross nominal rate of interest. Intermediate good rms are subject
to Calvo price-setting frictions. With probability the intermediate good rm cannot
reoptimize its price, in which case it is assumed to set its price according to the following
rule:
= ¯ 1 (3.4)
where ¯ is the steady state in ation rate. With probability 1 the intermediate good
rm can reoptimize its price. Apart from the xed cost, the intermediate good producer’s
pro ts are: X=0
+ { + + + + + }
where denotes the marginal cost of production, denominated in units of the homogeneous
good. The object, is a function only of the costs of capital and labor, and is described in
the technical appendix, section E. In the rm’s discounted pro ts, + is the multiplier on
the family’s nominal period + budget constraint. The equilibrium conditions associated
with this optimization problem are reported in section E of the technical appendix.
We suppose that the homogeneous labor hired by intermediate good producers is itself
‘produced’ by competitive labor contractors. Labor contractors produce homogeneous labor
by aggregating di erent types of specialized labor, (0 1) as follows:
=
Z 1
0
( )1
¸1 (3.5)
Labor contractors take the wage rate of and as given and equal to and
respectively. Pro t maximization by labor contractors leads to the following rst order
necessary condition:
=
μ ¶ 1
(3.6)
Equation (3.6) is the demand curve for the type of labor.
3.2. Family and Household Preferences
We integrate the model of unemployment in the previous section into the Erceg, Henderson
and Levin (2000) (EHL) model of sticky wages used in the standard DSGE model. Each
type, [0 1] of labor is assumed to be supplied by a particular family of households.
The family resembles the single representative family in the previous section, with one
exception. The exception is that the unit measure of households in the family is only
able to supply the type of labor service. Each household in the family has the utility
2010June

28ECBWorking Paper Series No 1202
cost of working, (2.3), and the technology for job search, (2.5). The ve parameters of these
functions are
where the rst three pertain to the cost of working and the last two pertain to job search.
In the analysis of the empirical model, the preference shock, is constant. We assume
that these parameters are identical across families. In order that the representative family in
the current section have habit persistence in consumption, we change the way consumption
enters the additive utility function of the household. In particular, we replace log ( ) and
log ( ) everywhere in the previous section with
log¡
1
¢log¡
1
¢respectively. Here, 1 denotes the family’s previous period’s level of consumption. When
the parameter, is positive, then each household in the family has habit in consumption.
Also, and denote the consumption levels allocated by the family to non-employed
and employed households within the family. Although families all enjoy the same level of
consumption, for reasons described momentarily each family experiences a di erent level
of employment, Because employment across families is di erent, each type family
chooses a di erent way to balance the trade-o between the need for consumption insurance
and the need to provide work incentives. For the type of family with high the
premium of consumption for working households to non-working households must be high.
It is easy to verify that the incentive constraint in the version of the model considered here
is the analog of (2.9):
log1
1
¸= + (1 + )
where solves the analog of (2.12):
= + 2 +1 (3.7)
Consider the family that enjoys a level of family consumption and employment, and
respectively. It is readily veri ed that the utility of this family, after it e ciently allocates
consumption across its member households subject to the private information constraints, is
given by:
( 1 ) = log ( 1) ( ) (3.8)
where the function in (3.8) is de ned in (2.22) with replaced by . The family’s
discounted utility is:
0
X=0
( 1 ) (3.9)
2010June

29ECB
Working Paper Series No 1202
Note that this utility function is additively separable, like the utility functions assumed for
the households. Additive separability is convenient because perfect consumption insurance
at the level of families implies that consumption is not indexed by labor type, . As we
show later, this simpli cation appears not to have come at a cost in terms of accounting for
aggregate data. Still, it would be interesting to explore the implications of non-separable
utility. The technical appendix to this paper derives (3.8) for two non-separable speci cations
of utility for households. Moreover, Guerron-Quintana (2008) shows how to handle the fact
that family consumption is now indexed by
3.3. The Family Problem
The family is the monopoly supplier of the type of labor service. The family un-
derstands that when it arranges work incentives for its households so that employment is
then takes on the value implied by the demand for its type of labor, (3.6). The
family therefore faces the standard monopoly problem of selecting to optimize the wel-
fare, (3.9), of its member households. It does so, subject to the requirement that it satisfy
the demand for labor, (3.6), in each period. We follow EHL in supposing that the family
experiences Calvo-style frictions in its choice of In particular, with probability 1
the family has the opportunity to reoptimize its wage rate. With the complementary
probability, the family must set its wage rate according to the following rule:
= ˜ 1 (3.10)
˜ = ( 1) (¯)(1 )+ (3.11)
where (0 1) Note that in a non-stochastic steady state, non-optimizing families raise
their real wage at the rate of growth of the economy. Because optimizing families also do
this in steady state, it follows that in the steady state, the wage of each type of family is the
same.
In principle, the presence of wage setting frictions implies that families have idiosyncratic
levels of wealth and, hence, consumption. However, we follow EHL in supposing that each
family has access to perfect consumption insurance. At the level of the family, there is
no private information about consumption or employment. The private information and
associated incentive problems all exist among the households inside a family. Because of
the additive separability of the family utility function, perfect consumption insurance at the
level of families implies equal consumption across families. We have used this property of
the equilibrium to simplify our notation and not include a subscript, on the family’s
consumption. Of course, we hasten to add that although consumption is equated across
families, it is not constant across households.
2010June

30ECBWorking Paper Series No 1202
The family’s period budget constraint is as follows:μ+1
¶+ +1 + ¯ + 1 + (3.12)
Here, +1 denotes the quantity of risk-free bonds purchased by the household, denotes
the gross nominal interest rate on bonds purchased in period 1 which pay o in period
and denotes the payments and receipts associated with the insurance on the timing of
wage reoptimization. Also, denotes the aggregate price level and denotes the quantity
of investment goods purchased for augmenting the beginning-of-period +1 stock of physical
capital, ¯ +1 The price of investment goods is where is the unit root process with
positive drift speci ed in (3.3). This is our way of capturing the trend decline in the relative
price of investment goods.27
The family owns the economy’s physical stock of capital, ¯ sets the utilization rate of
capital and rents the services of capital in a competitive market. The family accumulates
capital using the following technology:
¯+1 = (1 ) ¯ +
μ1
μ1
¶¶(3.13)
Here, is a convex function, with and 0 equal to zero on a steady state growth path.
The function, , is de ned in section H in the technical appendix The function has one
free parameter, its second derivative in the neighborhood of steady state, which we denote
simply by 00
For each unit of ¯ +1 acquired in period the family receives +1 in net cash payments
in period + 1
+1 = +1 +1 +1+1
+1( +1) (3.14)
where denotes the rate of utilization of capital. The rst term in (3.14) is the gross
nominal period +1 rental income from a unit of ¯ +1. The family supply of capital services
in period + 1 is:
+1 = +1¯+1
It is the services of capital that intermediate good producers rent and use in their production
functions, (3.1). The second term to the right of the equality in (3.14) represents the cost
of capital utilization, ( +1) +1 +1 See section H in the technical appendix for the
functional form of the capital utilization cost function. This function is constructed so the
27We suppose that there is an underlying technology for converting nal goods, one-to-one into andone to into investment goods. These technologies are operated by competitive rms which equate priceto marginal cost. The marginal cost of with this technology is and the marginal cost of is Weavoid a full description of this environment so as to not clutter the presentation, and simply impose theseproperties of equilibrium on the family budget constraint.
2010June
31ECB
Working Paper Series No 1202
steady state value of utilization is unity, and (1) = 0 (1) = 0 The function has one free
parameter, which we denote by Here, = 00 (1) 0 and corresponds to the curvature
of in steady state.
The family’s problem is to select sequences,©
+1¯+1
ªto maximize
(3.9) subject to (3.6), (3.10), (3.11), (3.12), (3.13), (3.14) and the mechanism determining
when wages can be reoptimized. The equilibrium conditions associated with this maximiza-
tion problem are standard, and so appear in section E of the technical appendix.
3.4. Aggregate Resource Constraint, Monetary Policy and Equilibrium
Goods market clearing dictates that the homogeneous output good is allocated among al-
ternative uses as follows:
= + + ˜ (3.15)
Here, denotes family consumption, denotes exogenous government consumption and˜ is a homogenous investment good which is de ned as follows:
˜ =1 ¡
+¡ ¢
¯¢
(3.16)
As discussed above, the investment goods, are used by the families to add to the physical
stock of capital, ¯ according to (3.13). The remaining investment goods are used to cover
maintenance costs,¡ ¢
¯ arising from capital utilization, . Finally, in (3.16) denotes
the unit root investment speci c technology shock with positive drift discussed after (3.1).
We suppose that monetary policy follows a Taylor rule of the following form:
log
μ ¶= log
μ1
¶+ (1 ) log
³+1´+ log
μ ¶¸+4
(3.17)
where is an iid monetary policy shock. As in CEE and ACEL, we assume that period
realizations of are not included in the period information set of households and rms.
Further, denotes scaled real GDP de ned as:
=+ +
+ (3.18)
and denotes the nonstochastic steady state value of . We adopt the model of
government spending suggested in Christiano and Eichenbaum (1992):
= +
Lump-sum transfers are assumed to balance the government budget.
An equilibrium is a stochastic process for the prices and quantities having the property
that the family and rm problems are satis ed, and goods and labor markets clear.
2010June

32ECBWorking Paper Series No 1202
3.5. Aggregate Labor Force and Unemployment in Our Model
We now derive our model’s implications for unemployment and the labor market. At the
level of the family, unemployment and the labor force are de ned in the same way as
in the previous section, except that the endogenous variables now have a subscript (the
parameters and shocks are the same across families). Thus, the family’s labor force,
, and total employment, , are related by (2.12) (or, (3.7)). We linearize the latter
expression as in (2.48):
ˆ =1
1 + 2 2ˆ (3.19)
though we ignore ˆ . Also, and denote the steady state values of unemployment and
the labor force in the family. Because we have made assumptions which guarantee that
each family is identical in steady state, we drop the subscripts from all steady state labor
market variables (see the discussion after (3.10)).
Aggregate household hours and the labor force are de ned as follows:Z 1
0
Z 1
0
Totally di erentiating,
ˆ =
Z 1
0
ˆ ˆ
Z 1
0
ˆ
Using the fact that, to rst order, type wage deviations from the aggregate wage cancel,
we obtain:ˆ = ˆ (3.20)
See section G in the technical appendix for a derivation. That is, to a rst order approxi-
mation, the percent deviation of aggregate household hours from steady state coincides with
the percent deviation of aggregate homogeneous hours from steady state. Integrating (3.19)
over all :
ˆ =
Z 1
0
ˆ =1
1 + 2 2ˆ
Aggregate unemployment is de ned as follows:
so that
=³ˆ ˆ
´Here, denotes he deviation of unemployment from its steady state value, not the percent
deviation.
2010June

33ECB
Working Paper Series No 1202
3.6. The Standard Model
We derive the utility function used in the standard model as a special case of the family utility
function in our involuntary unemployment model. In part, we do this to ensure consistency
across models. In part, we do this as a way of emphasizing that we interpret the labor
input in the utility function in the standard model as corresponding to the number of people
working, not, say, the hours worked of a representative person. With our interpretation,
the curvature of the labor disutility function corresponds to the (consumption compensated)
elasticity with which people enter or leave the labor force in response to a change in the wage
rate. In particular, this curvature does not correspond to the elasticity with which the typical
person adjusts the quantity of hours worked in response to a wage change. Empirically, the
latter elasticity is estimated to be small and it is xed at zero in the model.
Another advantage of deriving the standard model from ours is that it puts us in posi-
tion to exploit an insight by Gali (2010). In particular, Gali (2010) shows that the standard
model already has a theory of unemployment implicit in it. The monopoly power assumed
by EHL has the consequence that wages are on average higher than what they would be
under competition. The number of workers for which the wage is greater than the cost of
work exceeds the number of people employed. Gali suggests de ning this excess of work-
ers as ‘unemployed’. The implied unemployment rate and labor force represent a natural
benchmark to compare with our model.
Notably, deriving an unemployment rate and labor force in the standard model does not
introduce any new parameters. Moreover, there is no change in the equilibrium conditions
that determine non-labor market variables. Gali’s insight in e ect simply adds a block
recursive system of two equations to the standard DSGE model which determine the size of
the labor force and unemployment. Although the unemployment rate derived in this way
does not satisfy all the criteria for unemployment that we described in the introduction, it
nevertheless provides a natural benchmark for comparison with our model. An extensive
comparison of the economics of our approach to unemployment versus the approach implicit
in the standard model appears in section F in the technical appendix to this paper.
We suppose that the family has full information about its member households and that
households which join the labor force automatically receive a job without having to expend
any e ort. As in the previous subsections, we suppose that corresponding to each type
of labor, there is a unit measure of households which gather together into a family. At
the beginning of each period, each household draws a random variable, from a uniform
distribution with support, [0 1] The random variable, determines a household’s aversion
to work according to (2.3), with = 0 The fact that no e ort is needed to nd a job implies
= . Households with work and households with 1 take leisure.
2010June

34ECBWorking Paper Series No 1202
The type family allocation problem is to maximize the utility of its member households
with respect to consumption for non-working households, and consumption of working
households, subject to (2.18), and the given values of and In Lagrangian form,
the problem is:
( 1 ) = max
Z0
£log¡
1
¢(1 + )
¤+
Z 1
log¡
1
¢+
£(1 )
¤Here, 0 denotes the multiplier on the resource constraint. The rst order conditions
imply = = Imposing this result and evaluating the integral, we nd:
( 1 ) = log ( 1)1+ (3.21)
The problem of the family is identical to what it is in section 3.3, with the sole exception
that the utility function, (3.8), is replaced by (3.21).
A type household that draws work aversion index is de ned to be unemployed if the
following two conditions are satis ed:
( ) ( ) (3.22)
Here, denotes the multiplier on the budget constraint, (3.12), in the Lagrangian repre-
sentation of the family optimization problem. Expression (a) in (3.22) simply says that to
be unemployed, the household must not be employed. Expression (b) in (3.22) determines
whether a non-employed household is unemployed or not in the labor force. The object on
the left of the inequality in (b) is the value assigned by the family to the wage, The
object on the right of (b) is the xed cost of going to work for the household. Gali (2010)
suggests de ning households with satisfying (3.22) as unemployed. This approach to un-
employment does not satisfy properties (i) and (iii) in the introduction. The approach does
not meet the o cial de nition of unemployment because no one is exercising e ort to nd
a job. In addition, the existence of perfect consumption insurance implies that unemployed
workers enjoy higher utility that employed workers.
We use (3.22) to de ne the labor force, in the standard model. With and aggregate
employment, we obtain unemployment as follows
=
or, after linearization about steady state:
=³ˆ ˆ
´
2010June

35ECB
Working Paper Series No 1202
Here, because of the presence of monopoly power. The object, ˆ may be obtained
from (3.20) and the solution to the standard model. We now discuss the computation of the
aggregate labor force, We have Z 1
0
where is the labor force associated with the type of labor and is de ned by enforcing
(b) in (3.22) at equality. After linearization,
ˆZ 1
0
ˆ
We compute ˆ by linearizing the equation that de nes After scaling that equation, we
obtain
+ ¯ =¡ ¢
(3.23)
where
++ ¯ +
Linearizing (3.23) about steady state and integrating the result over all (0 1) :
ˆ+ + b +
Z 1
0
b = ˆ
From the result in section G in the technical appendix, the integral in the above expression
is zero, so that:
ˆ =ˆ
+ + b4. Estimation Strategy
We estimate the parameters of the model in the previous section using the impulse response
matching approach applied by Rotemberg and Woodford (1997), CEE, ACEL and other
papers. We apply the Bayesian version of that method proposed in CTW. To promote com-
parability of results across the two papers and to simplify the discussion here, we use the
impulse response functions and associated probability intervals estimated using the 14 vari-
able, 2 lag vector autoregression (VAR) estimated in CTW. Here, we consider the response of
11 variables to three shocks: the monetary policy shock, in equation (3.17), the neutral
technology shock, in equation (3.2), and the investment speci c shock, in equation
(3.3).28 Nine of the eleven variables whose responses we consider are the standard macro-
economic variables displayed in Figures 1-3. The other two variables are the unemployment28The VAR in CTW also includes data on vacancies, job ndings and job separations, but these variables
do not appear in the models in this paper and so we do not include their impulse responses in the analysis.
2010June

36ECBWorking Paper Series No 1202
rate and the labor force which shown in Figure 4. The VAR is estimated using quarterly,
seasonally adjusted data covering the period 1952Q1 to 2008Q4.
The assumptions that allow us to identify the e ects of our three shocks are the ones
implemented in ACEL. To identify the monetary policy shock we suppose all variables aside
from the nominal rate of interest are una ected contemporaneously by the policy shock. We
make two assumptions to identify the dynamic response to the technology shocks: (i) the
only shocks that a ect labor productivity in the long run are the two technology shocks
and (ii) the only shock that a ects the price of investment relative to consumption is the
innovation to the investment speci c shock. All these identi cation assumptions are satis ed
in our model. Details of our strategy for computing impulse response functions imposing the
shock identi cation are discussed in ACEL.
Let ˆ denote the vector of impulse responses used in the analysis here. Since we consider
15 lags in the impulses, there are in principle 3 (i.e., the number of shocks) times 11 (number
of variables) times 15 (number of lags) = 495 elements in ˆ However, we do not include
in ˆ the 10 contemporaneous responses to the monetary policy shock that are required to
be zero by our monetary policy identifying assumption. Taking the latter into account, the
vector ˆ has 485 elements. To conduct a Bayesian analysis, we require a likelihood function
for our ‘data’, ˆ For this, we use an approximation based on asymptotic sampling theory.
In particular, when the number of observations, is large, we have³ˆ ( 0)
´˜ (0 ( 0 0)) (4.1)
Here, 0 and 0 are the parameters of the model that generated the data, evaluated at their
true values. The parameter vector, 0 is the set of parameters that is explicit in our model,
while 0 contains the parameters of stochastic processes not included in the analysis. In (4.1),
( 0 0) is the asymptotic sampling variance of ˆ , which - as indicated by the notation -
is a function of all model parameters. We nd it convenient to express (4.1) in the following
form:ˆ ˜ ( ( 0) ( 0 0 )) (4.2)
where
( 0 0 )( 0 0)
We treat ( 0 0 ) as though it were known. In practice, we work with a consistent
estimator of ( 0 0 ) in our analysis (for details, see CTW). That estimator is a diagonal
matrix with only the variances along the diagonal. An advantage of this diagonality property
is that our estimator has a simple graphical representation.
We treat the following object as the likelihood of the ‘data’, ˆ conditional on the model
2010June

37ECB
Working Paper Series No 1202
parameters, :³ˆ | ( 0 0 )
´=
μ1
2
¶2
| ( 0 0 )| 12
× exp 1
2
³ˆ ( )
´0( 0 0 ) 1
³ˆ ( )
´¸(4.3)
The Bayesian posterior of conditional on ˆ and ( 0 0 ) is:
³|ˆ ( 0 0 )
´=
³ˆ | ( 0 0 )
´( )³
ˆ | ( 0 0 )´ (4.4)
where ( ) denotes the priors on and³ˆ | ( 0 0 )
´denotes the marginal density of
ˆ : ³ˆ | ( 0 0 )
´=
Z ³ˆ| ( 0 0 )
´( )
As usual, the mode of the posterior distribution of can be computed by simply maximizing
the value of the numerator in (4.4), since the denominator is not a function of The marginal
density of ˆ is required when we want an overall measure of the t of our model and when
we want to report the shape of the posterior marginal distribution of individual elements in
We do this using the MCMC algorithm.
5. Estimation Results for Medium-sized Model
The rst section discusses model parameter values. We then show that our model of invol-
untary unemployment does well at accounting for the dynamics of unemployment and the
labor force. Fortunately, the model is able to do this without compromising its ability to
ability to account for the dynamics of standard macroeconomic variables.
5.1. Parameters
Parameters whose values are set a priori are listed in Table 1. We found that when we
estimated the parameters, and the estimator drove them to their boundaries. This
is why we simply set to a value near unity and we set = 1. The steady state value of
in ation (a parameter in the monetary policy rule and the price and wage updating equa-
tions), the steady state government consumption to output ratio, and the growth rate of
the investment-speci c technology were chosen to coincide with their corresponding sample
means in our data set.29 The growth rate of neutral technology was chosen so that, condi-
tional on the growth rate of investment-speci c technology, the steady state growth rate of29In our model, the relative price of investment goods represents a direct observation of the technology
shock for producing investment goods.
2010June

38ECBWorking Paper Series No 1202
output in the model coincides with the corresponding sample average in the data. We set
= 0 75 so that the model implies wages are reoptimized once a year on average. We
did not estimate this parameter because we found that it is di cult to separately identify
the value of and the curvature of family labor disutility. Finally, to ensure that we only
consider parameterizations that imply an admissible probability function, ( ) we simply
x the maximal value of this probability in steady state, ¯ to 0.97 (see (2.14).)
The parameters for which we report priors and posteriors are listed in Table 2. We report
results for two estimation exercises. In the rst exercise we estimate the standard DSGE
model discussed in section 3.6. In this exercise we only use the impulse responses of standard
macroeconomic variables in the likelihood criterion, (4.3). In particular, we do not include
the impulse responses of the unemployment rate or the labor force when we estimate the
standard DSGE model. Results based on this exercise appear under the heading, ‘standard
model’. In the second exercise we estimate our model with involuntary unemployment and
we report those results under the heading, ‘involuntary unemployment model’.
We make several observations about the parameters listed in Table 2. First, the results
in the last two columns are similar. This re ects that the two models (i) are observationally
equivalent relative to the impulse responses of standard macroeconomic variables and (ii) no
substantial adjustments to the parameters are required for the involuntary unemployment
model to t the unemployment and labor force data.
Second, the list of household parameters contains one endogenous parameter, the curva-
ture of utility, de ned in (2.39). Moreover, the list seems to be missing the structural
parameters of the search technology and disutility of labor. We begin by explaining this in
the context of the involuntary unemployment model. Throughout the estimation, we x the
steady state unemployment rate, at its sample average, 0 056, and the steady state labor
force participation rate, at a value of 2 3 For given values of the four objects, , ¯
and we can uniquely compute values for:30
(5.1)
This is why is included in the list of estimated parameters in Table 2, while the four
parameters in (5.1) are not. The parameter, appears in Table 2 because it is distinct from
and separately identi able. We apply an analogous treatment to household parameter
values in the case of the standard model. In particular, throughout estimation we x the
steady state level of hours worked, to the value implicit in the and used for the
involuntary unemployment model. We choose the value of so that conditional on the other
standard model parameter values, steady state hours worked coincides with Since =
in the standard model (see (3.21)), we only report estimation results for in Table 2.
30For details, see section E.4.2 in the technical appendix to this paper.
2010June

39ECB
Working Paper Series No 1202
Turning to the parameter values themselves, note rst that the degree of price stickiness,
is modest. The implied time between price reoptimizations is a little less than 3 quarters.
The amount of information in the likelihood, (4.3), about the value of is reasonably
large. The posterior standard deviation is roughly an order of magnitude smaller than the
prior standard deviation and the posterior probability interval is half the length of the prior
probability interval. Generally, the amount of information in the likelihood about all the
parameters is large in this sense. An exception to this pattern is the coe cient on in ation
in the Taylor rule, There appears to be relatively little information about this parameter
in the likelihood. Note that is estimated to be quite small, implying a consumption-
compensated labor supply elasticity for the family of around 8. Such a high elasticity would
be regarded as empirically implausible if it were interpreted as the elasticity of supply of
hours by a representative agent. However, as discussed above, this is not our interpretation.
Table 3 reports steady state properties of the two models, evaluated at the posterior mean
of the parameters. According to the results, the capital output ratio is a little lower than the
empirical value of 12 typically reported in the real business cycle literature. The replacement
ratio, is a novel feature of our model, that does not appear in standard monetary
DSGE models. The replacement ratio is estimated to be roughly 80 percent. This is a
somewhat lower replacement ratio than the 90 percent number reported in the introduction.
It is higher than the number reported for developed countries in OECD (2006). However,
those replacement ratios pertain to income, rather than consumption.31 So, they are likely
to underestimate the consumption concept relevant for us.
Not surprisingly, our model’s implications for the consumption replacement ratio is very
sensitive to the habit persistence parameter, If we set the value of that parameter to zero,
then our model’s steady state replacement ratio drops to 20 percent.
5.2. Impulse Response Functions of Non-labor Market Variables
Figures 1-3 display the results of the indicated macroeconomic variables to our three shocks.
In each case, the solid black line is the point estimate of the dynamic response generated
by our estimated VAR. The grey area is an estimate of the corresponding 95% probability
interval.32 Our estimation strategy selects a model parameterization that places the model-
implied impulse response functions as close as possible to the center of the grey area, while
31The income replacement ratio for the US is reported to be 54 percent in Table 3.2, which can be foundat http://www.oecd.org/dataoecd/28/9/36965805.pdf.32We compute the probability interval as follows. We simulate 2,500 sets of impulse response functions by
generating an equal number of arti cial data sets, each of length T, using the VAR estimated from the data.Here, T denotes the number of observations in our actual data set. We compute the standard deviations ofthe arti cial impulse response functions. The grey areas in Figures 1-5 are the estimated impulse responsefunctions plus and minus 1.96 times the corresponding standard deviation.
2010June

40ECBWorking Paper Series No 1202
not su ering too much of a penalty from the priors. The estimation criterion is less con-
cerned about reproducing VAR-based impulse response functions where the grey areas are
the widest.
The thick solid line and the line with solid squares in the gures display the impulse
responses of the standard model and the involuntary unemployment models, respectively,
at the posterior mode of the parameters. Note in Figures 1-3 that in many cases only
one of these two lines is visible. Moreover, in cases where a distinction between the two
lines can be discerned, they are nevertheless very close. This re ects that the two models
account roughly equally well for the impulse responses to the three shocks. This is a key
result. Expanding the standard model to include unemployment and the labor force does
not produce a deterioration in the model’s ability to account for the estimated dynamic
responses of standard macroeconomic variables to monetary policy and technology shocks.
Consider Figure 1, which displays the response of standard macroeconomic variables to a
monetary policy shock. Note how the model captures the slow response of in ation. Indeed,
the model even captures the ‘price puzzle’ phenomenon, according to which in ation moves
in the ‘wrong’ direction initially. This apparently perverse initial response of in ation is
interpreted by the model as re ecting the reduction in labor costs associated with the cut in
the nominal rate of interest.33 It is interesting that the slow response of in ation is accounted
for with a fairly modest degree of wage and price-setting frictions. The model captures the
response of output and consumption to a monetary policy shock reasonably well. However,
there is a substantial miss on capacity utilization. Also, the model apparently does not
have the exibility to capture the relatively sharp rise and fall in the investment response,
although the model responses lie inside the grey area. The relatively large estimate of the
curvature in the investment adjustment cost function, 00 re ects that to allow a greater
response of investment to a monetary policy shock would cause the model’s prediction of
investment to lie outside the grey area in the initial and later quarters. These ndings for
monetary policy shocks are broadly similar to those reported in CEE, ACEL and CTW.
Figure 2 displays the response of standard macroeconomic variables to a neutral technol-
ogy shock. Note that the models do reasonably well at reproducing the empirically estimated
responses. The dynamic response of in ation is particularly notable. The estimation results
in ACEL suggest that the sharp and precisely estimated drop in in ation in response to
a neutral technology shock is di cult to reproduce in a model like the standard monetary
DSGE model. In describing this problem for their model, ACEL express a concern that
the failure re ects a deeper problem with sticky price models. Perhaps the emphasis on
price and wage setting frictions, largely motivated by the inertial response of in ation to a
33For a defense, based on rm-level data, of the existence of this ‘working capital’ channel of monetarypolicy, see Barth and Ramey (2001).
2010June

41ECB
Working Paper Series No 1202
monetary shock, is shown to be misguided by the evidence that in ation responds rapidly
to technology shocks.34 Our results suggest a far more mundane possibility. There are two
di erences between our model and the one in ACEL which allow it to reproduce the response
of in ation to a technology shock more or less exactly without hampering its ability to ac-
count for the slow response of in ation to a monetary policy shock. First, as discussed above
(see (3.4)), in our model there is no indexation of prices to lagged in ation. ACEL follows
CEE in supposing that when rms cannot optimize their price, they index it fully to lagged
aggregate in ation. The position of our model on price indexation is a key reason why we can
account for the rapid fall in in ation after a neutral technology shock while ACEL cannot.
We suspect that our way of treating indexation is a step in the right direction from the point
of view of the microeconomic data. Micro observations suggest that individual prices do not
change for extended periods of time. A second distinction between our model and the one
in ACEL is that we specify the neutral technology shock to be a random walk (see (3.2)),
while in ACEL the growth rate of the estimated technology shock is highly autocorrelated.
In ACEL, a technology shock triggers a strong wealth e ect which stimulates a surge in
demand that places upward pressure on marginal cost and thus in ation.35
Figure 3 displays dynamic responses of macroeconomic variables to an investment-speci c
shock. The evidence indicates that the two models, parameterized at their posterior means,
do well in accounting for these responses.
5.3. Impulse Response Functions of Unemployment and the Labor Force
Figure 4 displays the response of unemployment and the labor force to our three shocks. The
key thing to note is that the model has no di culty accounting for the pattern of responses.
The probability bands are large, but the point estimates suggest that unemployment falls
about 0.2 percentage points and the labor force rises a small amount after an expansionary
monetary policy shock. The model roughly reproduces this pattern. In the case of each
response, the model generates opposing movements in the labor force and the unemployment
rate. This appears to be consistent with the evidence.
As discussed in section 3.6 above, Gali (2010) points out that the standard model has
implicit in it a theory of unemployment and the labor force. Figure 5 adds the implications
34The concern is reinforced by the fact that an alternative approach, one based on information imperfec-tions and minimal price/wage setting frictions, seems like a natural one for explaining the puzzle of the slowresponse of in ation to monetary policy shocks and the quick response to technology shocks (see Mackowiakand Wiederholt, 2009, Mendes, 2009, and Paciello, 2009). Dupor, Han and Tsai (2009) suggest more modestchanges in the model structure to accommodate the in ation puzzle.35An additional, important, factor accounting for the damped response of in ation to a monetary policy
shock (indeed, the perverse initial ‘price puzzle’ phenomenon) is the assumption that rms must borrow inadvance to pay for their variable production costs. But, this model feature is present in both our model andACEL as well as CEE.
2010June
42ECBWorking Paper Series No 1202
of the standard model for these variables to the impulses displayed in Figure 4. Note that
the impulses implied by the standard model are so large that they distort the scale in
Figure 5. Consider, for example, the rst panel of graphs in the gure, which pertain to the
monetary policy shock. The standard model predicts a massive fall in the labor force after an
expansionary monetary policy shock. The reason is that the rise in aggregate consumption
(see Figure 1) reduces the value of work by reducing in (3.22). The resulting sharp drop
in labor supply strongly contradicts our VAR-based evidence which suggests a small rise.
Given the standard model’s prediction for the labor force, it is not surprising that the model
massively over-predicts the fall in the unemployment rate after a monetary expansion.
The failure of the standard model raises a puzzle. Why does our involuntary unemploy-
ment model do so well at accounting for the unemployment rate and the labor force? The
puzzle is interesting because the two models share essentially the same utility function at
the level of the household. One might imagine that our model would have the same problem
with wealth e ects. In fact, it does not have the same problem because there is a connection
in our model between the labor force and employment that does not exist in the standard
model. In our model, the increased incentive to work hard that occurs in response to an ex-
pansionary monetary policy shock simultaneously encourages households to search for work
more intensely, and to substitute into the labor force.
The standard model’s prediction for the response of the unemployment rate and the labor
force to neutral and investment-speci c technology shocks is also strongly counterfactual.
The problem is always the same, and re ects the operation of wealth e ects on labor supply.
The problems in Figure 5 with the standard model motivate Gali (2010), Gali, Smets and
Wouters (2010) and CTW to modify the household utility function in the standard model
in ways that reduce wealth e ects on labor. In e ect, our involuntary unemployment model
represents an alternative strategy for dealing with these wealth e ects. Our model has the
added advantage of being consistent with all three characteristics (i)-(iii) of unemployment
described in the introduction.
6. Concluding Remarks
We constructed a model in which households must make an e ort to nd work. Because
e ort is privately observed, perfect insurance against labor market outcomes is not feasible.
To ensure that people have an incentive to nd work, workers that nd jobs must be better
o than people who do not work. With additively separable utility, this translates into the
proposition that employed workers have higher consumption than the non-employed. We
integrate our model of unemployment into a standard monetary DSGE model and nd that
the model’s ability to account for standard macroeconomic variables is not diminished. At
2010June

43ECB
Working Paper Series No 1202
the same time, the new model appears to account well for the dynamics of variables like
unemployment and the labor force.
We leave it to future research to quantify the various ways in which the new model may
contribute to policy analysis. In part, we hope that the model is useful simply because labor
market data are of interest in their own right. But, we expect the model to be useful even
when labor market data are not the central variables of concern. An important input into
policy analysis is the estimation of ‘latent variables’ such as the output gap and the e cient,
or ‘natural’, rate of interest. Other important inputs into policy analysis are forecasts of
in ation and output. By allowing one to systematically integrate labor market information
into the usual macroeconomic dataset, our model can be expected to provide more precise
forecasts, as well as better estimates of latent variables.36
Our model of unemployment has several interesting microeconomic implications that
deserve closer attention. The model implies that the consumption premium of employed
workers over the non-employed, is procyclical. Although Chetty and Looney (2006)
and Gruber (1997) report that there is a premium on average, we cannot infer anything
about the cyclicality of the premium from the evidence they present. Studies of the cross
section variance of log household consumption are a potential source of evidence on the
cyclical behavior of the premium. To see this, let denote the variance of log household
consumption in the period cross section in our model:37
= (1 )
μlog
μ ¶¶2According to this expression, the model posits two countervailing forces on the cross-sectional
dispersion of consumption, in a recession. First, for a given distribution of the popula-
tion across employed and non-employed households (i.e., holding xed), a decrease in the
consumption premium leads to a decrease in consumption dispersion in a recession. Second,
holding the consumption premium xed, consumption dispersion increases as people move
36For an elaboration on this point, see Basistha and Startz (2004).37Strictly speaking, this formula is correct only for the model in the second section of this paper. The
relevant formula is more complicated for the model with capital because that requires a non-trivial aggre-gation across households that supply di erent types of labor services. To see how we derived the formula inthe text, note that the cross sectional mean of log household consumption is:
= log ( ) + (1 ) log ( )
so that
= (log )2 + (1 ) (log )2
= (1 ) (log log )2
2010June

44ECBWorking Paper Series No 1202
from employment to non-employment with the fall in 38 These observations suggest that
(i) if is observed to drop in recessions, this is evidence in favor of the model’s prediction
that the consumption premium is procyclical and (ii) if is observed to stay constant or
rise in recessions then we cannot conclude anything about the cyclicality of the consumption
premium. Evidence in Heathcote, Perri and Violante (2010) suggests that the US was in case
(i) in three of the previous ve recessions.39 In particular, they show that the dispersion in
log household non-durable consumption decreased in the 1980, 2001 and 2007 recessions.40
We conclude tentatively that the observed cross sectional dispersion of consumption across
households lends support to our model’s implication that the consumption premium is pro-
cyclical.
Another interesting implication of the model is its prediction that high unemployment
in recessions re ects the procyclicality of e ort in job search. There is some evidence that
supports this implication of the model. The Bureau of Labor Statistics (2009) constructs
a measure of the number of ‘discouraged workers’. These are people who are available to
work and have looked for work in the past 12 months, but are not currently looking because
they believe no jobs are available. This statistic has only been gathered since 1994, and
so it covers just two recessions. However, in both the recessions for which we have data,
the number of discouraged workers increased substantially. For example, the number of
discouraged workers jumped 70 percent from 2008Q1 to 2009Q1. In fact, the number of
discouraged workers is only a tiny fraction of the labor force. However, to the extent that
the sentiments of discouraged workers are shared by workers more generally, a jump in the
number of discouraged workers could be a signal of a general decline in job search intensity
in recessions. But, this is an issue that demands a more careful investigation.
38This statement assumes that the empirically relevant case, 1 2.39Of course, we cannot rule out that the drop in in recessions has nothing to do with the mechanism in
our model but rather re ects some other source of heterogeneity in the data.40A similar observation was made about the 2007 recession in Parker and Vissing-Jorgensen (2009).
2010June

45ECB
Working Paper Series No 1202
References
[1] Altig, David, Christiano, Lawrence J, Martin Eichenbaum and Jesper Linde, 2004,
“Firm-Speci c Capital, Nominal Rigidities and the Business Cycle”, manuscript, North-
western University.
[2] Alexopoulos, Michelle, 2004, “Unemployment and the business cycle”, Journal of Mon-
etary Economics, Vol. 51 (2), pages 257—298.
[3] Andolfatto, David, 1996, “Business Cycles and Labor Market Search”, American Eco-
nomic Review, Vol. 86, pages 112-132.
[4] Atkeson, Andrew and Robert E. Lucas, Jr., 1995, “E ciency and Equality in a Simple
Model of E cient Unemployment Insurance”, Journal of Economic Theory, Vol. 66 (1),
pages 64-88.
[5] Atkeson, Andrew and Christopher Phelan, 1994, “Reconsidering the Costs of Business
Cycles with Incomplete Markets”, NBER Macroeconomics Annual, Vol. 9, pages 187-
207.
[6] Ball, Laurence and N. Gregory Mankiw, 2002, “The NAIRU in Theory and Practice”,
Journal of Economic Perspectives, Vol. 16 (4), pages 115—136.
[7] Barth, Marvin J. III and Valerie A. Ramey, 2001, “The Cost Channel of Monetary
Transmission”, NBER Macroeconomics Annual, Vol. 16, pages 199-240.
[8] Basistha, Arabinda and Richard Startz, 2004, “Measuring the NAIRU with Reduced
Uncertainty: A Multiple Indicator-Common Component Approach”, manuscript, Uni-
versity of Washington.
[9] Benhabib, Jess, Richard Rogerson and Randall Wright, 1991, “Homework in Macroeco-
nomics: Household Production and Aggregate Fluctuations”, The Journal of Political
Economy, Vol. 99 (6), pages 1166-1187.
[10] Blanchard, Olivier and Jordi Gali, 2009, “Labor Markets and Monetary Policy: A New
Keynesian Model with Unemployment”, forthcoming, American Economic Journal -
Macroeconomics.
[11] Brown, Alessio J. G., Christian Merkl, and Dennis J. Snower, 2009, “An Incentive
Theory of Matching”, manuscript, Kiel Institute for the World Economy.
2010June

46ECBWorking Paper Series No 1202
[12] Bureau of Labor Statistics, 2009, “Ranks of DiscouragedWorkers and Others Marginally
Attached to the Labor Force Rise During Recession”, Issues in Labor Statistics, U.S.
Department of Labor, U.S. Bureau of Labor Statistics, Summary 09-04/April, available
at: http://www.bls.gov/opub/ils/pdf/opbils74.pdf.
[13] Chetty, Raj and Adam Looney, 2006, “Income Risk and the Bene ts of Social Insurance:
Evidence from Indonesia and the United States”, National Bureau of Economic Research
Working Paper Number 11708.
[14] Christiano, Lawrence J., and Martin Eichenbaum, 1992, “Current Real-Business-Cycle
Theories and Aggregate Labor-Market Fluctuations”, The American Economic Review,
Vol. 82 (3), pages 430-450.
[15] Christiano, Lawrence J., Martin Eichenbaum, and Charles L. Evans. 2005. “Nominal
Rigidities and the Dynamic E ects of a Shock to Monetary Policy”, Journal of Political
Economy, Vol. 113 (1), pages 1-45.
[16] Christiano, Lawrence J., Cosmin Ilut, Roberto Motto and Massimo Rostagno, 2008,
“Monetary Policy and Stock Market Boom-bust Cycles”, European Central BankWork-
ing Paper No. 955.
[17] Christiano, Lawrence J., Mathias Trabandt and Karl Walentin, 2009, “Introducing Fi-
nancial Frictions and Unemployment into a Small Open Economy Model”, Swedish
Riksbank Working Paper No. 214, April 21.
[18] Christiano, Lawrence J., Mathias Trabandt and Karl Walentin, 2009a,
“DSGE Models for Monetary Policy,” draft for the Handbook of
Monetary Economics, edited by Friedman and Woodford, available
at: http://www.ecb.int/events/pdf/conferences/monetaryeconomics/item11_paper.pdf?
c947ef13b6b394ef7036c6e64d288194
[19] Christiano, Lawrence J., Mathias Trabandt and Karl Walentin,
2009b, “Technical Appendix for: Involuntary Unemploy-
ment and the Business Cycle”, manuscript, available at:
http://www.faculty.econ.northwestern.edu/faculty/christiano/research/Riksbank/technicalappendix.pdf
[20] Christo el, Kai, and Keith Kuester, 2008, “Resuscitating the wage channel in models
with unemployment uctuations”, Journal of Monetary Economics Vol. 55, pages 865—
887.
2010June

47ECB
Working Paper Series No 1202
[21] Christo el, Kai, Keith Kuester and Tobias Linzert, 2009, “The role of labor markets for
euro area monetary policy”, European Economic Review, Vol. 53, pages 908—936.
[22] Christo el, Kai, James Costain, Gregory de Walque, Keith Kuester, Tobias Linzert,
Stephen Millard, and Olivier Pierrard, 2009, “In ation Dynamics with Labour Market
Matching: Asessing Alternative Speci cations”, Working Paper No. 09-6, National Bank
of Belgium.
[23] Clarida, Richard, Jordi Gali and Mark Gertler, 1999, “The Science of Monetary Pol-
icy: A New Keynesian Perspective”, Journal of Economic Literature, Vol. XXXVII
(December), pages 1661-1707.
[24] Cochrane, John H., 1991, “A Simple Test of Consumption Insurance”, The Journal of
Political Economy, Vol. 99 (5), pages 957-97.
[25] den Haan, Wouter J., Ramey, Garey, Watson, J., 2000, “Job destruction and propaga-
tion of shocks”, American Economic Review, Vol. 90 (3), pages 482—498.
[26] Dupor, Bill , Jing Han, Yi-Chan Tsai, 2009, “What do technology shocks tell us about
the New Keynesian paradigm?”, Journal of Monetary Economics 56, pages 560—569
[27] Erceg, Christopher J., Henderson, Dale, W., and Andrew T. Levin (2000), “Optimal
Monetary Policy with Staggered Wage and Price Contracts”, Journal of Monetary Eco-
nomics, Vol 46, pages 281-313.
[28] Gali, Jordi, 2009, “The Return of the Wage Phillips Curve”, manuscript, June.
[29] Gali, Jordi, Frank Smets and Raf Wouters, 2010, “Unemployment in Estimated DSGE
Models”, work presented at Journal of Economic Dynamics and Control Conference on
Frontiers in Structural Macroeconomic Modeling: Thirty Years after “Macroeconomics
and Reality” and Five Years after “Nominal Rigidities and the Dynamic E ects of a
Shock to Monetary Policy”, Hitotsubashi University, Tokyo, Japan, January 23.
[30] Gertler, Mark, Luca Sala and Antonella Trigari, 2008, “An Estimated Monetary DSGE
Model with Unemployment and Staggered Nominal Wage Bargaining”, Journal of
Money, Credit and Banking, December, Vol. 40 (8), pages 1713-1764.
[31] Groshenny, Nicolas, 2009, “Evaluating a monetary business cycle model with unemploy-
ment for the euro area”, National Bank of Belgium Working Paper No. 173, July.
[32] Gruber, Jonathan, 1997, “The Consumption Smoothing Bene ts of Unemployment In-
surance”, The American Economic Review, Vol. 87 (1), pages 192-205.
2010June

48ECBWorking Paper Series No 1202
[33] Guerron-Quintana, Pablo, 2008, “Re nements on Macroeconomic Modeling: The Role
of Non-Separability and Heterogeneous Labor Supply”, Journal of Economic Dynamics
and Control, Vol. 32, pages 3613 — 3630.
[34] Hansen, Gary D., 1985, “Indivisible Labor and the Business Cycle”, Journal of Monetary
Economics, 16 (3), pages 309-27.
[35] Heathcote, Jonathan, Fabrizio Perri and Giovanni L. Violante, 2010, “Inequality in
Times of Crisis: Lessons From the Past and a First Look at the Current Recession”,
manuscript, University of Minnesota.
[36] Hopenhayn, Hugo and Juan Pablo Nicolini, 1997, “Optimal Unemployment Insurance”,
Journal of Political Economy, Vol. 105, No. 2, pages 412-438.
[37] Imrohoroglu, Ayse, 1989, “Cost of Business Cycles with Indivisibilities and Liquidity
Constraints”, The Journal of Political Economy, Vol. 97, No. 6 (Dec.), pages 1364-1383.
[38] Robert G. King, Charles I. Plosser, Sergio T. Rebelo, 1988, “Production, growth and
business cycles : I. The basic neoclassical model”, Journal of Monetary Economics, Vol.
21 (2-3), pages 195-232.
[39] Kocherlakota, Narayana, 1996, “Implications of e cient risk sharing without commit-
ment”, Review of Economic Studies, 63, pages 595-609.
[40] Krusell, Per, Toshihiko Mukoyama, Richard Rogerson, Aysegul Sahin, 2008, “Aggregate
Implications of Indivisible Labor, Incomplete Markets and Labor Market Frictions”,
Journal of Monetary Economics Vol. 55, 961-979.
[41] Krusell, Per, Toshihiko Mukoyama, Richard Rogerson, Aysegul Sahin, 2009, “A Three
State Model of Worker ows in General Equilibrium”, National Bureau of Economic
Research Working Paper 15251, August.
[42] Krause, Michael U., David Lopez-Salido, and Thomas A. Lubik, 2008, “In ation dy-
namics with search frictions: A structural econometric analysis”, Journal of Monetary
Economics Vol. 55, pages 892— 916.
[43] Lechthaler, Wolfgang, Christian Merkl and Dennis Snower, 2009, “Monetary Persistence
and the Labor Market: A New Perspective”, manuscript, Kiel Institute for the World
Economy, December.
[44] Lucas, Robert E., Jr., 1987, “Models of business cycles”, New York: Basil Blackwell.
2010June
49ECB
Working Paper Series No 1202
[45] Mackowiak, Bartosz and Mirko Wiederholt, 2009, “Optimal Sticky Prices under Ratio-
nal Inattention”, American Economic Review, June, Volume 99(3), pages 769-803.
[46] Mendes, Rhys, 2009, “Information, Expectations, and the Business Cycle”, manuscript,
Research Department, Bank of Canada.
[47] Merz, Monika, 1995, “Search in the Labor Market and the Real Business Cycle”, Journal
of Monetary Economics, Vol. 36, pages 269-300.
[48] Mulligan, Casey, 2001, “Aggregate Implications of Indivisible Labor”, Advances in
Macroeconomics, Vol. 1 (1), article 4.
[49] OECD, 2006, “OECD Employment Outlook 2006: Boosting Jobs and Incomes”, Or-
ganization for Economic Cooperation and Development, Renouf Pub Co Ltd, ISBN
92-64-02384-4.
[50] Paciello, Luigi, 2009, “Does In ation Adjust Faster to Aggregate Technology Shocks
than to Monetary Policy Shocks?”, manuscript, Einaudi Institute for Economics and
Finance, Rome.
[51] Parker Jonathan and A. Vissing-Jorgensen, 2009, “Who Bears Aggregate Fluctuations
and How?”, American Economic Review, Vol. 99(2), pages 399-405.
[52] Prescott, Edward, 1986, “Theory Ahead of Business Cycle Measurement”, Quarterly
Review, Federal Reserve Bank of Minneapolis, issue Fall, pages 9-22.
[53] Rogerson, Richard, 1988, “Indivisible Labor, Lotteries and Equilibrium”, Journal of
Monetary Economics, 21 (1), pages 3-16.
[54] Rogerson, Richard and Randall Wright, 1988, “Involuntary Unemployment in
Economies with E cient Risk Sharing”, Journal of Monetary Economics, Vol. 22, pages
501-515.
[55] Rotemberg, Julio and Michael Woodford, 1997, “An Optimization-Based Econometric
Framework for the Evaluation of Monetary Policy”, in Bernanke, B. and J. Rotemberg,
eds., NBER, Macroeconomics Annual, Cambridge, MA: MIT Press.
[56] Sala, Luca, Ulf Soderstrom, and Antonella Trigari, 2008, “Monetary policy under un-
certainty in an estimated model with labor market frictions”, Journal of Monetary
Economics, Vol. 55, pages 983— 1006.
[57] Shavell, Steven, and Laurence Weiss, 1979, “The optimal payment of unemployment
insurance over time”, Journal of Political Economy, vol. 87 (6), pages 1347-1362.
2010June

50ECBWorking Paper Series No 1202
[58] Stiglitz, Joseph, 1997, “Re ections on the Natural Rate Hypothesis”, The Journal of
Economic Perspectives, Vol. 11 (1), pages 3-10.
[59] Smets, Frank, and Raf Wouters, 2003, “An Estimated Dynamic Stochastic General
Equilibrium Model of the Euro Area”, Journal of the European Economic Association,
Vol. 1(5), pages 1123—75.
[60] Smets, Frank, and Raf Wouters, 2007, “Shocks and Frictions in US Business Cycles”,
American Economic Review, Vol. 97 (3), pages 586-606.
[61] Stock, James and Mark Watson, 1999, “Forecasting In ation”, Journal of Monetary
Economics, Vol. 44, pages 293-335.
[62] Sveen, Tommy and Lutz Weinke, 2008, “New Keynesian perspectives on labor market
dynamics”, Journal of Monetary Economics, Vol. 55, pages 921— 930.
[63] Sveen, Tommy and Lutz Weinke, 2009, “In ation and labor market dynamics revisited”,
Journal of Monetary Economics, Vol. 56, pages 1096—1100.
[64] Thomas, Carlos, 2008, “Search frictions, real rigidities and in ation dynamics”, manu-
script, Bank of Spain.
[65] Trigari, Antonella, 2009, “Equilibrium Unemployment, Job Flows, and In ation Dy-
namics”, Journal of Money, Credit and Banking, Vol. 41 (1), pages 1-30.
[66] Veracierto, Marcelo, 2007, “Establishments Dynamics and Matching Frictions in Clas-
sical Competitive Equilibrium”, Federal Reserve Bank of Chicago Working Paper
WP2007-16.
[67] Walsh, Carl, 2005, “Labor market search, sticky prices, and interest rate policies”,
Review of Economic Dynamics, Vol. 8, pages 829—849.
[68] Yun, Tack, 1996, “Nominal Price Rigidity, Money Supply Endogeneity, and Business
Cycles”, Journal of Monetary Economics, Vol. 37(2), pages 345-370.
2010June

51ECB
Working Paper Series No 1202
Table 1: Non-Estimated Parameters in Medium-sized Model
Parameter Value Description0.25 Capital share0.025 Depreciation rate0.999 Discount factor1.0083 Gross in ation rate0.2 Government consumption to GDP ratio1 Wage indexation to 1
1.01 Wage markup0.75 Wage stickiness0.97 Max, ( )1.0041 Gross neutral tech. growth1.0018 Gross invest. tech. growth
Table 3: Medium-sized Model Steady State at Posterior Mean for Parameters
VariableStandardModel
InvoluntaryUnemp. Model
Description
0 7.73 7.73 Capital to GDP ratio (quarterly)0.56 0.56 Consumption to GDP ratio0.24 0.24 Investment to GDP ratio
= 0.63 0.63 Steady state labor input1.0 0.81 Replacement ratio1.014 1.014 Gross nom. int. rate (quarterly)
real 1.006 1.006 Gross real int. rate (quarterly)0.033 0.033 Capital rental rate (quarterly)0.077 0.056 Unemployment rate- 0.67 Labor force (involuntary unemployment model)0.68 - Labor force (standard model)1.98 1.95 Slope, labor disutility- 0.75 Intercept, labor disutility- 0.52 Slope, ( )- 0.75 Intercept, ( )
2010June

52ECBWorking Paper Series No 1202
Table 2: Priors and Posteriors of Parameters for Medium-sized ModelParameter Prior Posteriora
Distribution Mean, Std.Dev. Mean, Std.Dev.[bounds] [5% and 95%] [5% and 95%]
Standard InvoluntaryModel Unemp. Model
Price setting parametersPrice Stickiness Beta 0.50, 0.15 0.63, 0.04 0.64, 0.04
[0, 0.8] [0.23, 0.72] [0.57, 0.70] [0.58, 0.70]Price Markup Gamma 1.20, 0.15 1.15, 0.07 1.36, 0.09
[1.01, ] [1.04, 1.50] [1.03, 1.26] [1.21, 1.50]Monetary authority parameters
Taylor Rule: Int. Smoothing Beta 0.80, 0.10 0.87, 0.02 0.89, 0.01[0, 1] [0.62, 0.94] [0.85, 0.90] [0.87, 0.91]
Taylor Rule: In ation Coef. Gamma 1.60, 0.15 1.49, 0.11 1.47, 0.11[1.01, 4] [1.38, 1.87] [1.30, 1.66] [1.30, 1.65]
Taylor Rule: GDP Coef. Gamma 0.20, 0.10 0.06, 0.03 0.06, 0.02[0, 2] [0.07, 0.39] [0.02, 0.10] [0.02, 0.09]Household parameters
Consumption Habit Beta 0.75, 0.15 0.76, 0.02 0.79, 0.02[0, 1] [0.47, 0.95] [0.73, 0.79] [0.76, 0.81]
Power, labor disutilityb Uniform 10.0, 5.77 7.40, 0.47[0, 20] [1.00, 19.0] [6.61, 8.14]
Inverse labor supply elast.b Gamma 0.30, 0.20 0.13, 0.03 0.13, 0.02[0, ] [0.06, 0.69] [0.08, 0.17] [0.09, 0.17]
Capacity Adj. Costs Curv. Gamma 1.00, 0.75 0.34, 0.09 0.30, 0.09[0, ] [0.15, 2.46] [0.18, 0.48] [0.15, 0.44]
Inv. Adj. Costs Curv.00
Gamma 12.00, 8.00 15.63, 3.28 20.26, 4.06[0, ] [2.45, 27.43] [10.5, 20.7] [14.0, 26.6]
ShocksAutocorr. Invest. Tech. Uniform 0.50, 0.29 0.60, 0.08 0.59, 0.08
[0, 1] [0.05, 0.95] [0.48, 0.72] [0.47, 0.71]Std.Dev. Neutral Tech. Shock Inv. Gamma 0.20, 0.10 0.22, 0.02 0.22, 0.02
[0, ] [0.10, 0.37] [0.19, 0.25] [0.19, 0.24]Std.Dev. Invest. Tech. Shock Inv. Gamma 0.20, 0.10 0.16, 0.02 0.16, 0.02
[0, ] [0.10, 0.37] [0.12, 0.19] [0.12, 0.20]Std.Dev. Monetary Shock Inv. Gamma 0.40, 0.20 0.45, 0.03 0.43, 0.03
[0, ] [0.21, 0.74] [0.39, 0.50] [0.38, 0.48]Based on standard random walk metropolis algorithm. 150 000 draws, 30 000 for burn-in, acceptance rate 26%.
In the case of the baseline model, and coincide. In the case of the involuntary unemployment model
these two parameters are di erent.
2010June

53ECB
Working Paper Series No 1202 2010June

54ECBWorking Paper Series No 1202
2010June
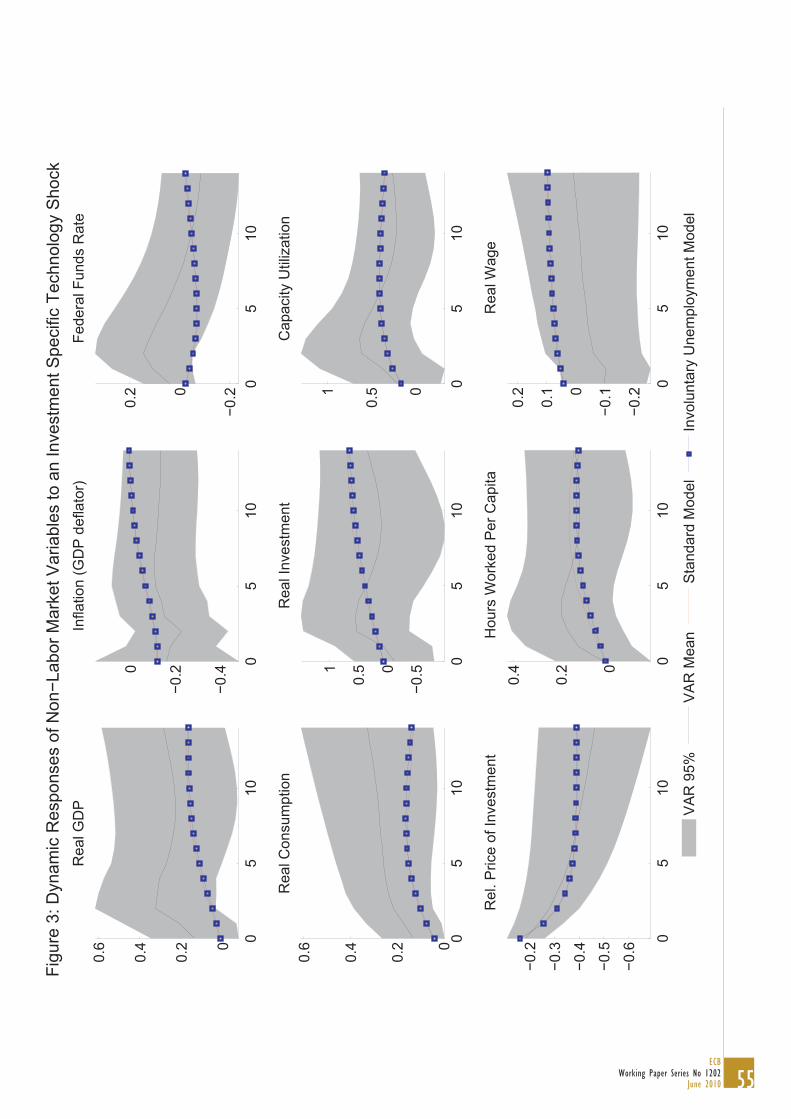
55ECB
Working Paper Series No 1202 2010June

56ECBWorking Paper Series No 1202
2010June

57ECB
Working Paper Series No 1202 2010June

Work ing PaPer Ser i e Sno 1118 / november 2009
DiScretionary FiScal PolicieS over the cycle
neW eviDence baSeD on the eScb DiSaggregateD aPProach
by Luca Agnello and Jacopo Cimadomo