Embed Size (px)
Citation preview
2013-2014 Big Game Status2013-2014 Big Game Status
Nevada Department Nevada Department of Wildlifeof Wildlife
2013-2014 Big Game Status2013-2014 Big Game Status

This publication will be made available in an alternative format upon request. Nevada Department of Wildlife receives funding through the Federal Aid in Wildlife Restoration. Federal Laws prohibit discrimination
on the basis of race, color, national origin, age, sex, or disability. If you believe you’ve been discriminated against in any NDOW program, activity, or facility, please write to the following:
Diversity Program Manager or Director U.S. Fish and Wildlife Service Nevada Department of Wildlife
4401 North Fairfax Drive, Mailstop: 7072-43 1100 Valley Road Arlington, VA 22203 Reno, Nevada 89512-2817 Individuals with hearing impairments may contact the Department via telecommunications device at our Headquarters at 775-688-1500
via a text telephone (TTY) telecommunications device by first calling the State of Nevada Relay Operator at 1-800-326-6868.
STATE OF NEVADA
Brian Sandoval, Governor
DEPARTMENT OF WILDLIFE Tony Wasley, Director
GAME DIVISION
Larry Gilbertson, Chief
Mike Cox, Big Game Staff Biologist Cody Schroeder, Mule Deer Staff Biologist
Pete Bradley, Carnivore Staff Biologist
Jody Wilkinson, Administrative Assistant
Western Region Southern Region
Eastern Region
Regional Supervisors
Mike Dobel Steve Kimble Ken Gray
Big Game Biologists
Chris Hampson Pat Cummings Curt Baughman
Carl Lackey Tom Donham Kari Huebner
Kyle Neill Mike Scott Matt Jeffress
Ed Partee Jeremy Lutz
Jason Salisbury Caleb McAdoo
Mike Podborny
Scott Roberts
Cover Photo by: Tim Torell, to see more of his wildlife photos go to his website at http://digitalwildlifeimages.com
NEVADA DEPARTMENT OF WILDLIFE
2013-2014 BIG GAME STATUS
This Program Receives Federal Aid for the Nevada Department of Wildlife (NDOW) Wildlife Restoration, Game Management Grant
F13AF00457.
Compiled and Edited by:
Mike Cox, Big Game Staff Biologist Cody Schroeder, Mule Deer Staff Biologist
Larry Gilbertson, Game Division Chief Jody Wilkinson, Administrative Assistant
Mike Dobel, Regional Supervising Biologist Ken Gray, Regional Supervising Biologist
Steve Kimble, Regional Supervising Biologist Pete Bradley, Carnivore Staff Biologist
i
TABLE OF CONTENTS FOR STATUS REPORTS BIG GAME STATUS STATEWIDE SUMMARY ................................. SS1-SS10
MULE DEER ............................................................................... 1 Units 011 - 015, Northern Washoe and Western Humboldt Counties .................................................. 1 Units 021, 022, Southern Washoe County ................................................................................. 2 Units 031, 032, 034, 035: Western Humboldt County ................................................................... 4 Unit 033, Sheldon National Wildlife Refuge: Washoe and Humboldt Counties ...................................... 5 Units 041, 042: Western Pershing and Southern Humboldt Counties ................................................. 6 Units 043 - 046: Eastern Pershing and Southern Humboldt Counties.................................................. 6 Unit 051: Santa Rosa Mountains; Eastern Humboldt County ............................................................ 7 Units 061 - 062, 064, 066 – 068: Independence and Tuscarora Ranges; Elko County ............................... 8 Unit 065 Piñon Range: Southwestern Elko County ..................................................................... 10 Units 071 – 079, 091: Northeastern Elko County ....................................................................... 10 Unit 081: Goose Creek Area; Northeastern Elko County .............................................................. 11 Units 101 - 109: Southern Elko and Northwestern White Pine Counties ............................................ 12 Units 111 – 113: Eastern White Pine County ............................................................................ 13 Units 114 – 115: Snake Range; Southeastern White Pine County .................................................... 14 Unit 121: North Egan, Cherry Creek Ranges; White Pine and Elko Counties ....................................... 15 Units 131 - 134: Southern White Pine, Eastern Nye and Western Lincoln Counties .............................. 16 Units 141 - 145: Eureka and Eastern White Pine Counties ............................................................ 16 Units 151, 152, 154, 155: Lander and Western Eureka Counties .................................................... 17 Units 161 - 164: North-Central Nye and Southern Lander and Eureka Counties ................................... 18 Units 171 - 173: Northwestern Nye and Southern Lander Counties ................................................. 19 Units 181 - 184: Churchill, Southern Pershing, and Western Lander Counties .................................... 20 Unit 192: Carson River Interstate Herd; Douglas County .............................................................. 21 Unit 194, 196: Carson Range and Peavine Mountain Interstate Herd; Washoe and Carson City Counties ..... 21 Unit 195: Virginia Range Herd; Storey, Washoe and Lyon Counties ................................................. 22 Units 201, 202, 204 – 208: Walker / Mono Interstate Deer Herd; Douglas, Lyon, and ............................ 22 Unit 203: Mason and Smith Valley Resident Herds; Lyon County .................................................... 23 Units 211, 212: Esmeralda County ........................................................................................ 23 Units 221 - 223: Northern Lincoln and Southern White Pine Counties .............................................. 24 Unit 231: Wilson Creek Range; Northeastern Lincoln County ........................................................ 24 Units 241 – 245: Clover, Delamar, and Meadow Valley Mountain Ranges; Lincoln County ....................... 25 Units 251-253: South Central Nye County ............................................................................... 26 Units 261 – 268: Clark and Southern Nye Counties ..................................................................... 26 Units 271, 272: Southern Lincoln and Northeastern Clark Counties ................................................. 27 Unit 291, Pinenut Mountain Herd: Douglas County .................................................................... 27
PRONGHORN ANTELOPE .............................................................. 28 Units 011 - 015, 021, 022: Washoe and Western Humboldt Counties ............................................... 28 Units 031, 032, 034, 035, 051: Humboldt County ...................................................................... 29 Unit 033, Sheldon National Wildlife Refuge: Washoe and Humboldt Counties .................................... 30 Units 041, 042: Western Pershing and Southern Humboldt Counties ............................................... 31 Units 043 - 046: Eastern Pershing and Southern Humboldt Counties................................................ 32 Units 061, 062, 064, 071, 073: North Central Elko County ........................................................... 33 Units 065, 142, portion of 144: Southern Elko County, Northern Eureka County ................................. 34 Unit 066: Owyhee Desert; Northwestern Elko County ................................................................. 35 Units 067, 068: Western Elko and Northern Lander and Eureka Counties .......................................... 35 Units 072, 074, 075: Northeastern Elko County ........................................................................ 36 Units 076, 077, 079, 081, 091: Northeastern Elko County ............................................................ 37 Units 078, 105 – 107, 121: Southeastern Elko and Central White Pine Counties .................................. 37 Units 101 – 104, 108, 109 portion of 144: South Central Elko and Western White Pine Counties .............. 38 Units 111 – 114: Eastern White Pine County ............................................................................ 38 Units 115, 231, 242: Eastern Lincoln and Southern White Pine Counties .......................................... 39 Units 131, 145, 163, 164: Southern Eureka, Northeastern Nye, and Southwestern White Pine Counties ..... 39
ii
Units 132-134, 245: Eastern Nye and Western Lincoln Counties ..................................................... 40 Units 141, 143, 151 – 156: Eastern Lander and Eureka Counties..................................................... 40 Units 161, 162: Northern Nye, Southeastern Lander, and Southwestern Eureka Counties ...................... 41 Units 171 – 173: Northwestern Nye and Southern Lander Counties ................................................. 42 Units 181-184: Churchill, Southern Pershing, Western Lander and Northern Mineral Counties ................ 43 Units 202, 204: Lyon and Mineral Counties ............................................................................. 44 Units 203, 291: Lyon, Douglas Counties ................................................................................. 44 Units 205-208: Eastern Mineral County ................................................................................. 45 Units 211 - 213: Esmeralda County ....................................................................................... 46 Units 221 – 223, 241: Lincoln and Southern White Pine Counties .................................................... 46 Unit 251, Central Nye County ............................................................................................. 47
ROCKY MOUNTAIN ELK ................................................................ 48 Units 061, 071: Bruneau River and Merritt Mountain Area: Northern Elko County ................................ 48 Units 062, 064, 066 – 068: Independence and Tuscarora Ranges; Western Elko and Northern Eureka and
Lander Counties ........................................................................................................... 49 Unit 065: Pinion Range, Cedar Ridge Area; Southwestern Elko and Eastern Eureka Counties .................. 50 Units 072, 073, 074: Jarbidge Mountains; Northern Elko County .................................................... 51 Unit 075: Snake Mountains; Elko County ................................................................................ 51 Units 076, 077, 079, 081: Thousand Springs, Goose Creek, and Pequop Mountains Area; Northern Elko
County ....................................................................................................................... 52 Units 078, portion of 104, 105 – 107,109: Spruce Mountain; Elko County .......................................... 53 Unit 091: Pilot Range; Eastern Elko County ............................................................................. 54 Unit 101 – 103: East Humboldt and Ruby Mountains; Elko County ................................................... 54 Units 111 - 115, 221-222: Schell, Egan, and Snake Ranges; Eastern White Pine, and Northern Lincoln
Counties..................................................................................................................... 55 Unit 121 and portion of Units 104 and 108: Cherry Creek, North Egan, Butte, Maverick Springs, and
Medicine Ranges; Northern White Pine County, Southern Elko County ........................................... 56 Units 131, 132: White Pine, Grant and Quinn Canyon Ranges; Southern White Pine and Eastern Nye
Counties..................................................................................................................... 57 Units 144 & 145: Diamond, Fish Creek and Mountain Boy Ranges; Southern Eureka County .................... 58 Units 161 - 164: North-Central Nye and Southern Lander and Eureka Counties ................................... 58 Units 171 - 173: North-Western Nye and Southern Lander and Counties ........................................... 59 Unit 231: Wilson Creek Range; Lincoln County ......................................................................... 60 Unit 241-242: Delamar and Clover Mountains; Lincoln County ....................................................... 61 Unit 262: Spring Mountains; Clark and Southern Nye Counties ...................................................... 61
DESERT BIGHORN SHEEP .............................................................. 63 Units 044, 182: East and Stillwater Ranges; Pershing and Churchill Counties .................................... 63 Units 045, 153: Tobin Range and Fish Creek Mountains; Pershing and Lander Counties ......................... 63 Units 131 and 164: Duckwater Hills, White Pine Range and North Pancake Range; Southern White Pine and
Eastern Nye Counties ..................................................................................................... 64 Unit 132: Grant Range and Quinn Canyon Range; Eastern Nye County ............................................ 64 Unit 133, 245: Pahranagat and Mount Irish Ranges; Lincoln County ................................................ 65 Unit 134: Pancake Range; Nye County ................................................................................... 65 Unit 161: Toquima Range; Northern Nye County ....................................................................... 66 Units 162, 163: Monitor and Hot Creek Ranges; Nye County ......................................................... 67 Unit 173: Toiyabe Range; Northern Nye County ........................................................................ 67 Unit 181: Fairview Peak, Slate Mountain, and Sand Springs Range; Churchill County ........................... 68 Unit 183: Clan Alpine Range; Churchill County ......................................................................... 69 Unit 184: Desatoya Range; Churchill and Lander Counties ........................................................... 69 Unit 195: Virginia Range; Storey County................................................................................. 70 Unit 202: Wassuk Range; Mineral County ................................................................................ 70 Unit 204: East Walker River; Lyon County ............................................................................... 71 Unit 205, 207: Gabbs Valley Range, Gillis Range, Pilot Mountains; Eastern Mineral County .................... 71 Unit 206, 208: Excelsior Range, Candelaria and Miller Mountain; Mineral County ................................ 72 Unit 211 (Previously Unit 211S): Silver Peak Range and Volcanic Hills; Esmeralda County ..................... 73 Unit 212: Lone Mountain; Esmeralda County ........................................................................... 73
iii
Unit 213 (Previously Unit 211N): Monte Cristo Range; Esmeralda County ......................................... 74 Unit 221: South Egan Range; Lincoln County ........................................................................... 75 Unit 223, 241: Hiko, Pahroc, and Delamar Ranges; Lincoln County ................................................. 75 Unit 243: Meadow Valley Mountains; Lincoln County .................................................................. 76 Unit 244: Arrow Canyon Range; Northern Clark County ............................................................... 76 Unit 252: Stonewall Mountain; Nye County ............................................................................. 77 Unit 253: Bare Mountain; Southern Nye County ........................................................................ 77 Unit 254: Specter Range; Southern Nye County ........................................................................ 79 Unit 261: Last Chance Range; Southeastern Nye County ............................................................. 80 Unit 262: Spring Mountains (La Madre, Red Rock and South Spring Mountains) and Bird Spring Range;
Western Clark County..................................................................................................... 81 Unit 263: McCullough Range and Highland Range; Southern Clark County ......................................... 82 Unit 264: Newberry Mountains; Southern Clark County ............................................................... 84 Unit 265: South Eldorado Mountains; Southeastern Clark County ................................................... 85 Unit 266: North Eldorado Mountains; Southeastern Clark County ................................................... 86 Unit 267: Black Mountains; Eastern Clark County ...................................................................... 87 Unit 268: Muddy Mountains; Clark County ............................................................................... 87 Unit 271: Mormon Mountains; Lincoln County .......................................................................... 89 Unit 272: Virgin Mountains and Gold Butte; Northeastern Clark County ........................................... 89 Unit 280: Spotted Range; Northwestern Clark County ................................................................ 90 Unit 281: Pintwater Range; Northwestern Clark County .............................................................. 91 Unit 282: Desert Range and Desert Hills; Northwestern Clark County .............................................. 91 Unit 283, 284: East Desert Range and Sheep Range; Northern Clark County ...................................... 92 Unit 286: Las Vegas Range; North Clark County ........................................................................ 93
CALIFORNIA BIGHORN SHEEP ........................................................ 94 Unit 012, Calico Mountains and High Rock Canyon: Western Humboldt and Washoe Counties ................. 94 Unit 014, Granite Range: Washoe County ............................................................................... 95 Units 021, 022, Virginia Mountains: Washoe County ................................................................... 95 Unit 031: Double H, Montana and Trout Creek Mountains; Humboldt County ..................................... 96 Unit 032: Pine Forest Range and McGee Mountain; Humboldt County .............................................. 97 Unit 033, Sheldon National Wildlife Refuge: Washoe and Humboldt Counties .................................... 97 Unit 034: Black Rock Range; Humboldt County ........................................................................ 98 Unit 035: Jackson Mountains; Humboldt County ....................................................................... 99 Unit 051: Santa Rosa Range; Humboldt County ....................................................................... 100 Units 068: Sheep Creek; Northern Lander and Eureka Counties .................................................... 100
ROCKY MOUNTAIN BIGHORN SHEEP .............................................. 102 Unit 074: The Badlands; Elko County ................................................................................... 102 Unit 091: Pilot Range; Elko County ...................................................................................... 102 Unit 114: North Snake Range – Mount Moriah; Eastern White Pine County ....................................... 103 Unit 115: South Snake Range – Mount Wheeler: Eastern White Pine County ..................................... 104
MOUNTAIN GOAT ..................................................................... 105 Unit 101: East Humboldt Range; Elko County .......................................................................... 105 Unit 102: Ruby Mountains; Elko County ................................................................................. 105 Unit 103: South Ruby Mountains; Elko and White Pine Counties .................................................... 105
MOUNTAIN LION ...................................................................... 107 Western Region Areas: 1, 2, 3, 4, 5, 18, 19, 20, and 29 ............................................................. 107 Eastern Region: Areas 6, 7, 8, 9, 10, 11, 12, 13, 14, and 15 ........................................................ 108 Southern Region: Areas 16, 17, 21, 22, 23, 24, 25, 26 and 27 ...................................................... 111
BLACK BEAR ........................................................................... 115 Western Region ............................................................................................................. 115

SUMMARY
SS-1
BIG GAME STATUS STATEWIDE SUMMARY MULE DEER The 2013 total statewide mule deer tag quota of 22,656 was 6.5% lower than the 24,257 set in 2012. The decrease in quota and tag sales resulted in a total deer harvest of 9,367 compared to 10,112 deer harvested in 2012. Of the 9,364 deer harvested in 2013, 8,230 were bucks and 975 were does. The 2013 statewide hunter success for all deer hunters was nearly 44%, up from the 42% hunter success observed during 2012. The 2013 aerial post-season survey effort was down from the 2012 survey with approximately 21,300 mule deer classified statewide compared to 34,000 in 2012, and 27,000 deer classified in 2010. The aerial survey flights were hampered by weather-related delays and helicopter mechanical issues in several large hunt units. Mule deer were also widely scattered during post-season surveys due to mild conditions across much of the state. Fawn production was slightly down during 2013 with 51 fawns:100 does counted in late fall/early winter survey, likely a result of persistent drought conditions across much of the state. The post-season buck ratio was measured at 30 bucks:100 does. This buck ratio meets the statewide management objective and reflects the successful implementation of increased tag quotas during the previous two years designed to lower the buck ratio to meet management objectives. The 2013 spring deer surveys classified 27,888 deer compared to 33,346 in spring 2012. The survey results showed a slight improvement over the 2012 survey with 33 fawns:100 adults observed, likely due to very mild winter conditions. However, combined with the observed decline in fall fawn ratios, overall this equates to an approximate 17% over-winter fawn loss across the state. Population estimates across the state will continue to remain static given the poor recruitment observed during the past several years which is undoubtedly related to persistent drought and degraded rangeland conditions. Nevada’s mule deer populations have been stable to slightly declining over the past two years. Following a modest population decline (3%) in 2012, the 2013 population is estimated to be approximately 108,000 down from the estimated 109,000 in 2012. Because sizeable increases in deer tag quotas were realized during the 2011-2012 hunting seasons, the 2013 post-season survey revealed a management objective of 30 bucks:100 does were finally met. Maintaining a healthy buck ratio will be even more important in the persistent drought conditions Nevada has been experiencing over the past several years. Not only will tag quotas reflect the lower recruitment levels, but antler growth is expected to suffer due to poor forage quality and range conditions for mule deer. The Game Division continues to conduct a large-scale research and monitoring study that was initiated in 2011. The results of this study have provided valuable information with regards to survival rates, body condition, and migration corridors. To date over 800 mule deer collars have been deployed throughout the state since the study began. During January 2014, NDOW deployed an additional 20 GPS satellite collars in the Pequop Range and 20 GPS satellite collars in the Southern Rubies to gather baseline information and monitor mining related impacts to mule deer migration corridors. The data gathered will be instrumental in understanding the relationship between habitat conditions and population performance, especially given the challenges that mule deer herds face in the coming decade. PRONGHORN ANTELOPE Nevada pronghorn hunters had 3,814 tags available last year. This represents a 3% increase over what was available in 2012 and a 40% increase from the past 10-year average. Total pronghorn harvest in 2013 was 2,330, a 5% increase over what was harvested in 2012 and a 27% increase over the last 10-year average. Buck harvest actually declined slightly from the 2012 level while female harvest rose 100% over the previous year due to an increase in tag availability. A total of 762 tags were available across 15 unit groups targeting female pronghorn in an attempt to: reduce rancher conflicts, maintain herds within compromised carrying capacities, or provide hunting opportunity. During these hunts a total of 408 adult does were harvested by hunters. These hunts remain popular with 3 applicants competing for each available tag.
SUMMARY
SS-2
Division biologists observed a total of 12,254 pronghorn while conducting their annual composition surveys both from the ground and air. These surveys yielded ratios of 34 bucks:100 does:35 fawns. This buck ratio was slightly below the 2012 ratio but is well within acceptable levels especially considering that Nevada consists of almost entirely public lands hunting. The trend in both observed post-season buck ratios and percent of bucks with 15 inch or longer horns of the total buck harvest has been downward since 2010. The percent of 15+ inch bucks of the total harvested bucks in 2010 was 37% and in 2013 it was 24%. This decline is likely due to both increases in pronghorn buck tags to provide more opportunity to sportsmen and also due to the lower precipitation and even drought conditions that have persisted over the last 3 years that impacts horn growth during the late winter and spring months. The 2013 statewide fawn ratio improved by 6 fawns per 100 does despite near record low precipitation levels that resulted in poor range conditions this past year. The 2014 statewide pronghorn population estimate is 27,500, which is relatively static when compared to the 2013 estimate. Just a decade ago the statewide pronghorn estimate was only 18,000. ROCKY MOUNTAIN ELK Nevada’s elk resource continues to provide substantial elk hunting opportunity for the sportsmen of the state. The sale of 7,936 elk tags in 2013 resulted in the harvest of 2,857 elk compared to 6,035 tags sold in 2012 with a harvest of 2,461 elk. The 2013 reported elk harvest consisted of 1,209 bulls and 1,648 antlerless elk. The 2012 reported elk harvest consisted of 943 bulls and 1,518 antlerless elk. Bull quality remains high with 73% of harvested bulls reported as being 6-points-or-better (71% in 2012). Harvest strategies are designed to maintain elk herd numbers within individual unit population objectives. In units where elk populations are below objectives, elk harvest management is designed to allow those populations to increase. The Department's Elk Management on Private Lands Program continued to be a success and benefit to landowners with 96 elk-incentive tags sold for an estimated revenue generation of more than $846,000.00 for private landowners in 2013. There were 13,547 elk classified during aerial winter composition surveys yielding statewide ratios of 34 bulls:100 cows: 35 calves compared to the previous year when 11,473 animals were classified, yielding ratios of 37 bulls:100 cows:44 calves. Calf recruitment was fair in 2013 and resulted in slight population increases in most herds throughout the state. The statewide adult elk population estimate increased from 16,600 last year to 17,500 for 2014. Nevada’s elk harvest management continues to be based on meeting population objectives within the guidelines of the state’s Elk Species Management Plan. Statewide population increases resulted in a substantial increase in overall recommended tag quotas. Nevada’s elk harvest management continues to be based on meeting population objectives within the guidelines of the state’s Elk Species Management Plan. To this end the State Wildlife Commission adopted several new hunts for the upcoming 2014 season including antlerless elk management tags, September antlerless hunts, wilderness antlerless hunts, spike hunts, and a new antlerless elk landowner tag program. DESERT BIGHORN SHEEP The Department made 274 tags available in 2013, compared to 182 in 2012. Hunter success continued to be strong at 91% for both resident and non-resident hunters compared to 86% in 2012. Hunters averaged 5.8 days in the field compared to the 20-year average of 6.2 days. The 2013 statewide average age of harvested rams was 6.2 years compared to the 20-year average of 6.3. The statewide average unofficial B&C score was 153 points. The 2013 hunting season was record setting at 251 rams and for the number of trophy quality rams at 19 rams scoring 170+ B&C from 7 different units; the most ever in a single season. The statewide desert bighorn survey in 2013 classified 4,207 bighorn in 2013. This represents a slight increase when compared to 4,015 in 2012. Observed lambs increased over 2012 with 29 lambs per 100 ewes to 34 lambs per 100 ewes in the 2013 survey. The statewide desert bighorn population estimate remained stable at 8,900 adults.
SUMMARY
SS-3
During the 2013 capture and transplant operations 50 desert bighorn were captured from the Bare Mountains and released in the Candelaria Hills, Mineral County (30) and Excelsior Mountains, Mineral County (20). NDOW has given Utah Division of Wildlife Resources 185 desert bighorn since 1999 to help them in restoring desert bighorn into unoccupied desert bighorn habitat in the Kaiparowits Plateau region of southern Utah. The Muddy Mountains herd in Clark County was captured in early November 2013 with 49 ewes and lambs relocated to the Glen Canyon National Recreation Area in Utah. To mitigate potential negative impacts of the predicted and ongoing drought conditions in southern Nevada this summer, temporary water stations are planned for two mountain ranges. This should reduce the need to haul water to replenish existing wildlife water developments using helicopter transport. Disease surveillance and detection continues to be a priority effort statewide for all bighorn subspecies herds. Disease sampling has been conducted through both 1) passive disease surveillance and 2) active disease investigation. Passive disease surveillance consists of performing in depth herd health screening during captures for transplant or collaring operations as well as testing certain tissues recovered from hunter harvested animals. Health screening samples are tested for bacteria, virus, parasites and trace mineral levels. During the 2013-2014 sampling period both disease surveillance and active investigations were conducted in desert bighorn herds. A total of 100 desert bighorn were screened during capture and transplant operations in the Muddy Mountains and Bare Mountains. Additional surveillance screening was conducted in the newly established Quinn Canyon Range herd with 4 animals captured and sampled. Samples from these herds were all negative for the bacteria Mycoplasma ovipneumoniae which in Nevada plays a significant role in bighorn sheep pneumonia complex. All of Nevada’s tested sheep herds have blood antibody titers (indicating exposure) to a number of respiratory viruses. We also find lung worms in many of our herds and ear mites in some desert bighorn herds. Several desert bighorn hunters had submitted lung and trachea samples and even skulls from their harvested rams for Mycoplasma ovipneumoniae testing. Samples were received from 17 different desert bighorn hunt units throughout the state. Of these, 4 were positive for PCR (indicating presence of the organism) from Units 164, 212, 281, and 264. Unit 164 experienced a disease outbreak in 2011, where M. ovipneumoniae was isolated and the population has suffered poor lamb recruitment since then, so the test results were not unexpected in this unit. The remaining positive samples came from other southern Nevada herds where we either had suspected active or past disease events in that herd or adjacent herds. Pneumonia was noted by microscopic examination of lung or trachea tissues in 5 of these ram samples consistent with lungworm infections. Four desert bighorn sheep herds were targeted for active disease investigation after reports were received of coughing sheep and unusual numbers of mortalities were identified in spring and summer 2013. Concurrently an outbreak of pneumonia was documented in a number of herds in the Mojave Preserve just south of the border in California and there was concern about its spread into Nevada. There were 38 animals captured and sampled from the River, Eldorado, and McCullough Mountains, as well as the Spring Range. Testing was similar to that performed for surveillance and Mycoplasma ovipneumoniae was isolated from all populations. Two animals showing clinical signs of disease were lethally harvested for more extensive testing and both had pneumonia consistent with Mycoplasma infection on microscopic examination. DNA testing of the isolated Mycoplasma bacteria showed that the Spring Range contained an M. ovipneumoniae common to the other 3 Nevada herds tested as well as the M. ovipneumoniae strain found in the Mojave Preserve die-off. Once infected with this bacteria bighorn sheep, especially rams can spread the infection through dispersal movements, thus accounting for strain movement between California and Nevada. Through both passive surveillance and active disease investigation we are gradually establishing a health profile for each of Nevada’s bighorn herds. The results of this on-going effort provide wildlife managers with the critical information they need to maintain healthy and productive bighorn sheep populations for generations to come.
SUMMARY
SS-4
CALIFORNIA BIGHORN SHEEP During the 2013 California bighorn season a total of 67 tags were issued including 5 nonresident tags, and 3 special tags (Heritage, Dream, and PIW). This was the highest California bighorn tag quota ever in Nevada. Also, the highest ever recorded in a single season was 61 successful hunters in 2013. The average age of all harvested rams was 7.2 years with an average Boone and Crockett score of 153 5/8 inches. There were 2 rams harvested over 170 B&C. The number of California bighorn applicants, especially nonresidents, has steadily grown over the years. The 2003 applicants were 4,021 residents and 2,414 nonresidents. These numbers have increased considerably to 5,902 resident and 5,670 nonresident applicants in 2013. Biologist’s classified 1,000 California bighorn sheep in 2013 with a lamb ratio of 39 lambs:100 ewes. There has been a steady decline in statewide lamb ratios each year since 2009. The lamb ratio in 2009 was 49 per 100 ewes, and 2011 it was 44. The suspected causes for these declines include cumulative effects of rangeland degradation by overgrazing in some mountain ranges, prolonged multi-year drought conditions in all habitat areas, and a few herds likely reaching their habitat carrying capacity. The 2014 statewide California bighorn population is estimated at 1,900 sheep a decline of 10% from 2013. This statewide decline was primarily due to declines realized in Unit 012 and 033 herds. Only 1 primary capture and transplant operation was conducted this past year with 20 California bighorn removed from the Double H Mountains and translocated to the Coleman Rim area of northern Washoe County near the Oregon border. Disease surveillance and detection continues to be a priority effort statewide for all bighorn subspecies herds. Disease sampling has been conducted through both 1) passive disease surveillance and 2) active disease investigation. Passive disease surveillance consists of performing in depth herd health screening during captures for transplant or collaring operations as well as testing certain tissues recovered from hunter harvested animals. Health screening samples are tested for bacteria, virus, parasites and trace mineral levels. During the 2013-2014 sampling period both disease surveillance and investigations were conducted. A total of 23 bighorn were sampled during captures for transplants and collaring in the Double H Mountains and the Pine Forest Range. All were negative for Mycoplasma ovipneumoniae which in Nevada this bacteria plays a significant role in the bighorn sheep pneumonia complex. The Santa Rosa Range experienced a die-off event in 2003-04 and has struggled to recover population numbers since that time. Archived tissues from the die-off were re-sampled and M. ovipneumoniae was isolated indicating that it was involved in this die-off. This herd has been sampled for disease over the past 3 years. Titers to M. ovipneumoniae antibodies were identified (indicating continued exposure) however no organism was identified. In January 2014, 2 ewes were captured in the southern portion of the range. These 2 sheep were part of an augmentation originating from the Black Rock Range in 2013. Both ewes were negative for M. ovipneumoniae antibodies and organism when they were captured in 2013, but positive for M. ovipneumoniae on recapture in January 2014. Currently the strain of M. ovipneumoniae from the 2003-04 die-off is being compared to the strain isolated from these 2 ewes to determine if it has been circulating within the herd for the past 10 years and likely accounting for persistent low population numbers within this herd. There is evidence that sheep introduced into a population that contains M. ovipneumoniae carriers may be more susceptible to infection from the bacteria then resident adult animals that may have a degree of immunity. NDOW is utilizing this pattern of disease transmission is to determine if there are chronic M. ovipneumoniae carrier animals in the northern part of the Santa Rosa Range. Three ewes from the Pine Forest Range (Unit 032) were captured, collared and sampled before being released into this area. The Pine Forest herd has been repeatedly used as a source population and no M. ovipneumoniae has been isolated from this herd. These ewes and their lambs will be closely monitored and resampled over the next 12 months to determine if they have contracted M. ovipneumoniae. Five animals were also tested from McGee Mountain (Unit 032) and adjacent habitat in Unit 033. Area biologists had questioned whether the stagnant population growth could be due to disease. Preliminary

SUMMARY
SS-5
testing of these animals indicated that the herd does not carry M. ovipneumoniae as all 5 animals were negative for exposure to blood antibodies. As of mid April 2014, 7 hunter harvested California bighorn rams were sampled and all were negative for M. ovipneumoniae. Through both passive surveillance and active disease investigation we are gradually establishing a health profile for each of Nevada’s bighorn herds. The results of this on-going effort provide wildlife managers with the critical information they need to maintain healthy and productive bighorn sheep populations for generations to come. ROCKY MOUNTAIN BIGHORN SHEEP A total of 7 Rocky Mountain bighorn sheep tags were issued in 2013, 1 less than in 2012. All 7 bighorn hunters were successful. The average age of 6.6 and average B&C green-score was 153 3/8, much lower than the long-term average but to be expected without ram harvest from Units 101 or 102. Helicopter surveys in 2013 – 2014 were conducted in Units 074, 091, 114, and 115. A total of 150 bighorns were classified with ratios of 46 rams:100 ewes:32 lambs. This compares to the 2012 - 2013 surveys of 124 classified with ratios of 59 rams:100 ewes:24 lambs. The low average lamb ratio was again primarily due to the Pilot Peak/Leppy Hills herd in Unit 091 that only had 7 lambs:100 ewes (only 4 the previous survey) in 2013), This is to be expected with this herd being positive for Mycoplasma ovipneumoniae and associated with domestic sheep that trail within a few miles of the herd. The statewide 2014 Rocky Mountain bighorn sheep population is estimated to be approximately 260, with no change from 2013. As part of a larger research project in monitoring potential disease transmission between mountain goats and bighorn sheep on the East Humboldt Range, intensive ground monitoring efforts were made of the recently transplanted 20 Rocky Mountain bighorn from Alberta from May – September 2013. In addition, periodic aerial telemetry surveys and monitoring of satellite collars were conducted year round on the marked ewes and rams. It was estimated that by February 2014 the herd included 3 rams, 15 ewes, and 12 lambs. One ewe had crossed Interstate 80 during the summer and was hit and killed by a train. Both passive disease surveillance and active disease investigation was conducted on 4 of our Rocky Mountain Bighorn herds in early 2014. Since the 2009-2010 die-off in the Ruby Mountians and East Humboldt Range, NDOW has regularly sampled the survivors in the Ruby Mountains. Seven sheep were sampled, some showing evidence that they may have cleared the infection, whereas others have consistently tested positive for the presence of M. ovipneumoniae consistent with a chronic carrier state. In 2012, 20 Rocky Mountain bighorn were reintroduced into the East Humboldt’s from Alberta, Canada. A subset of this population will be sampled annually to determine if they have contracted disease. This year 7 animals were tested and were negative for exposure to M. ovipneumoniae as well as other respiratory viruses. A collaring effort in January 2014 was conducted on the Great Basin National Park (Unit 115) with 5 bighorns being sampled and all were negative for M. ovipneumoniae. Additionally, 2 bighorn ewes were captured and collared in Hunt Unit 074. This herd had suffered a die-off in 1998 and had not been actively sampled since. Mycoplasma ovipneumoniae was isolated from a very old aged ewe (a likely die-off survivor) which may indicate that M. ovi was one of the pathogens likely involved in the original die-off. Lastly, there were 4 harvested rams in 2013 from Units 074 and 114 that were tested and all were negative for M. ovipneumoniae. MOUNTAIN GOAT See page 105 for the statewide mountain goat report. MOUNTAIN LION The 2013 cougar hunting season (1 March 2013 – 28 February 2014) resulted in an overall mortality of 153 Nevada lions. The 5 and 10-year average for statewide mortality of lions was 186 and 181 respectively. Sport hunter harvest accounted for 118 lions or 77% of the total lions killed. The 2013 sport harvest represented a
SUMMARY
SS-6
35% decrease over the 2012 sport harvest (compared to a 75% increase in 2012 from 2011). Poor winter and spring snow conditions likely accounted for much of the decrease in cougar harvest from 2012. Cougars removed for the protection of livestock or human safety (depredation) decreased by 1 from 21 in 2012 to 20 in 2013. Depredating lions represented 13% of the overall 2013 mortalities. During 2013, 10 lions were killed as part of the Predation Management Program, down 5 from 15 in 2012 and accounted for 7% of the overall 2013 mortalities. Taken together, depredation and predation management mortalities accounted for 20% and 16% of total cougar mortalities in 2013 and 2012 respectively. During 2013, 1 lion was poached, 1 was killed in self defense and the remaining 3 lions (2%) were killed incidentally, either through vehicle collisions or died of undetermined natural causes. Total cougar mortality represented 58% of the statewide harvest limit of 265 for 2013, up from 45% in 2012. This increase was an artifact of lowering the harvest limit to published sustainable levels of 20% in 2013 from that of 38% (500) in 2012. Total cougar mortality also represented approximately 11% of the estimated adult population of cougars in the state. Eastern, Western and Southern Regions accounted for 49%, 32% and 19% of the total statewide cougar mortality respectively in 2013 as compared to 59%, 26% and 15% in 2012. Females accounted for 41% of the total mortality in 2013. Adult female cougars in the female cougar harvest accounted for 62% of the female harvest. Mean age of harvested male cougars averaged 3.7 years. These harvest parameters combined with the total state harvest of 153 cougars pointed to a moderate harvest for 2013 (Table 1). Over 72% of successful lion hunters in 2013 were Nevada residents. Nearly 28% of successful out-of-state hunters came from 2 foreign countries (Norway and South Africa). The remaining out-of-state lion hunters came from18 different states.
Table 1. Cougar Harvest Parameters
Parameter Light
Harvest Moderate Harvest
Heavy Harvest
% females in harvest <30% 30-40% >40%
% adult females within female harvest (>3) >55% 45-55% <45%
Mean age of harvested males >4 years 3-4 years <3 years
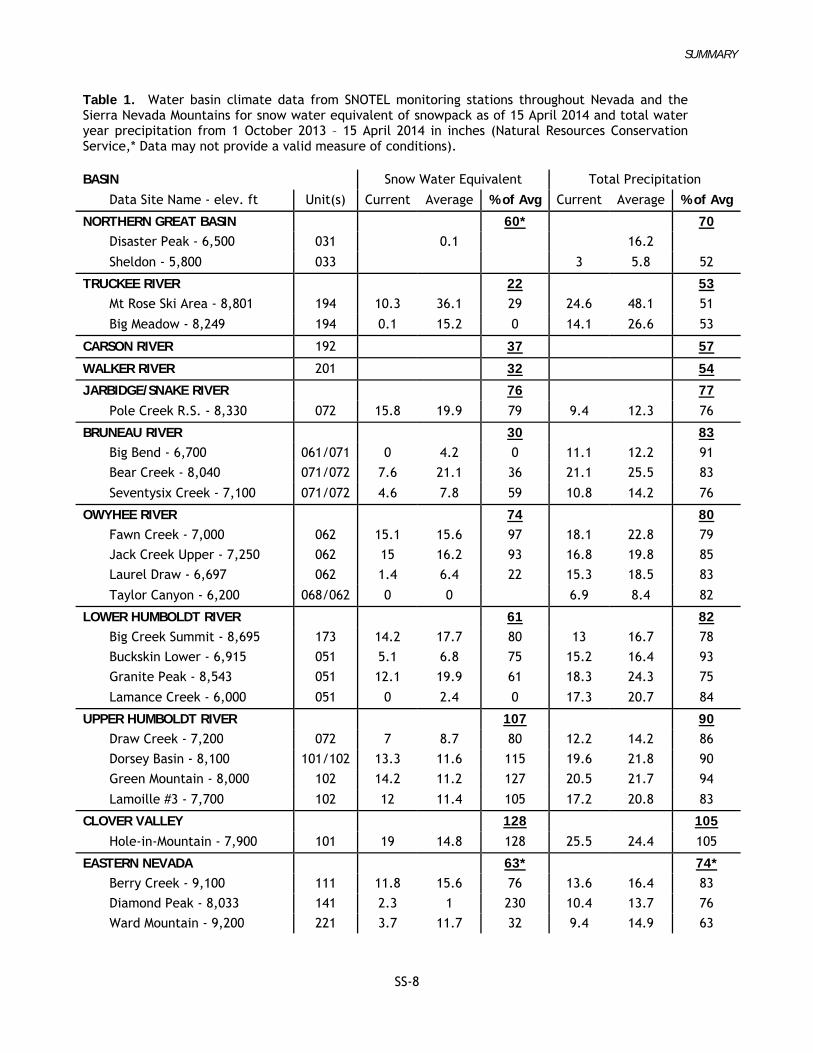
BLACK BEAR See page 113 for the statewide black bear report. WEATHER AND CLIMATE EFFECTS This year’s summary of Nevada weather and climatic data that affected big game herds October 2013 through April 2014 is based on active SNOTEL sites in Nevada that are located in selected water basins in the northern half of the state. Table 1 displays the snow water equivalent of snowpack and precipitation from October 2013 – April 2014 for select SNOTEL sites located in the following Mountain Ranges/Areas: Carson Range and Sierra Front (Area 19), Sheldon NWR (Unit 033), Trout Creek Mountains (Unit 031), Jarbidge Mountains (Area 7), Independence and Tuscarora Mountains (Area 6), Santa Rosa Range (Area 5), Toiyabe Range (Area 17), East Humboldt Range and Ruby Mountains (Area 10), Diamond Mountains (Area 14), Schell Creek Range (Area 11) and Egan Range (Area 22). October-April precipitation was marginal in most water basins from 53% - 95%
SUMMARY
SS-7
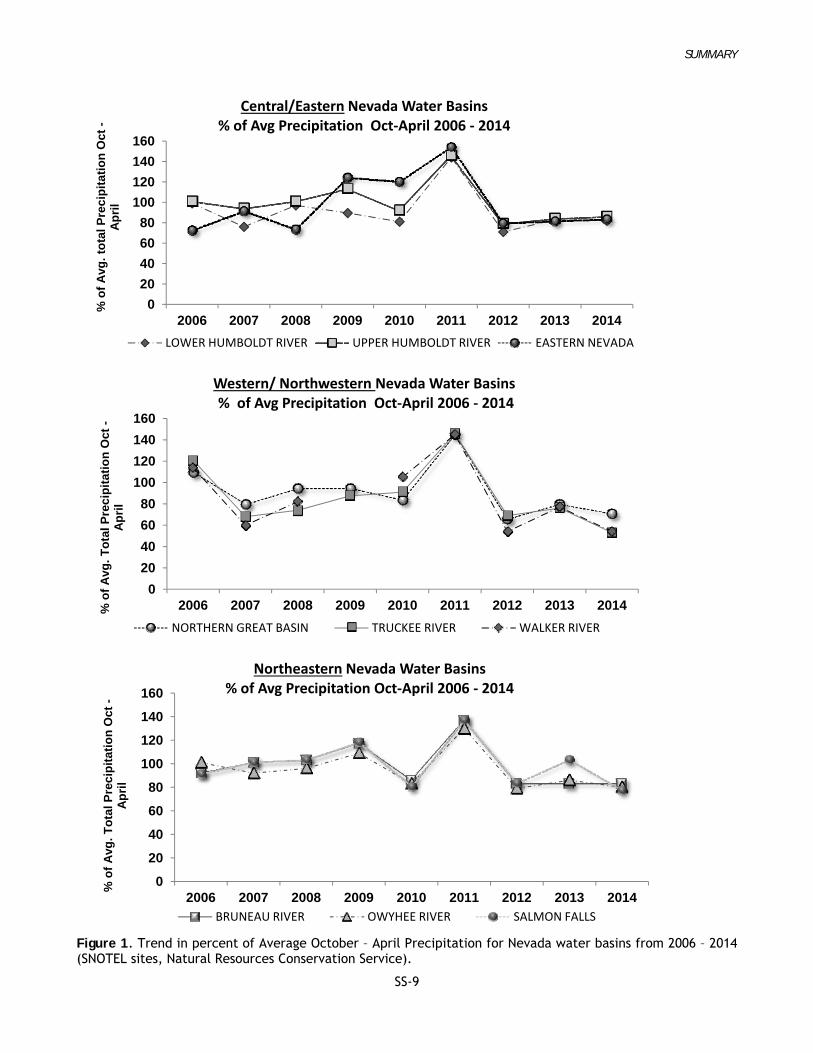
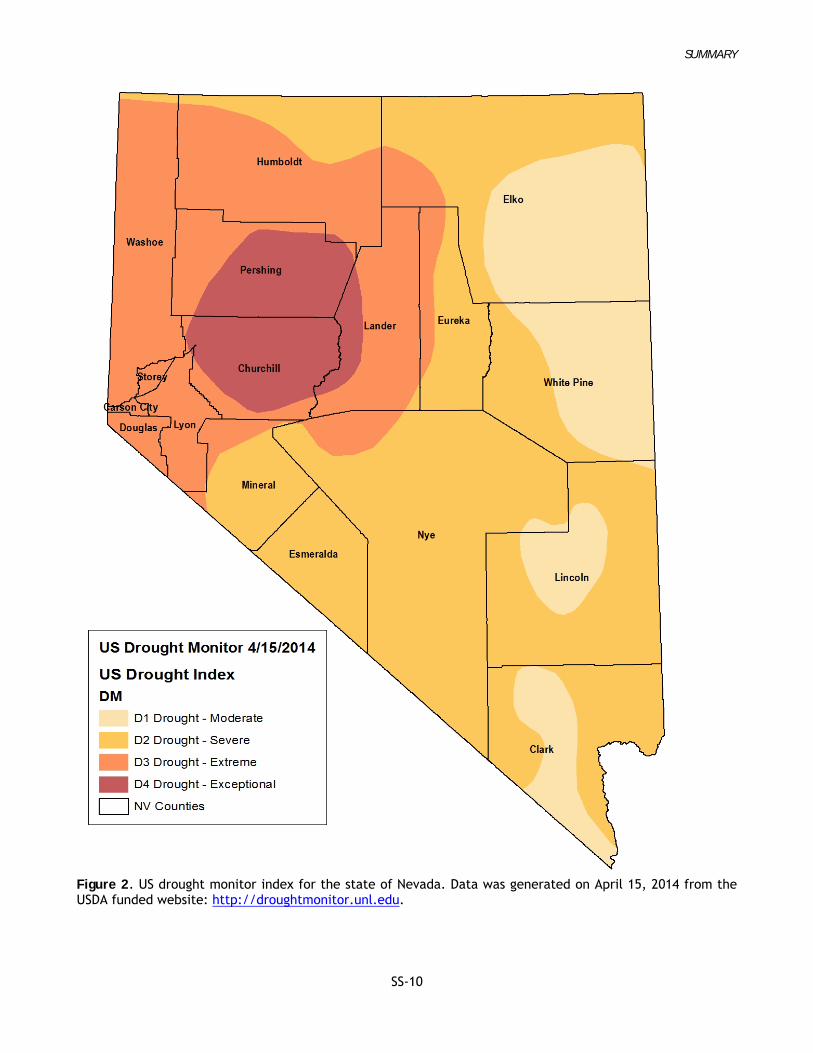
of the long-term average, with the Clover Valley being above average at 105%. These values were comparably poor to the 2012-2013 observed values (Table 1). The snowpack was poor overall, albeit highly variable, this past winter with basin averages between 22% - 128% of the long-term values. Without snowpack many of Nevada’s high elevation summer ranges and streams from July – September will be extremely dry which could have a profound effect on young survival this summer and fall and body condition of our big game animals going into next winter. Figure 1 shows the trend in total water year precipitation for these same water basins from 2006 – 2014. Although the 2010-2011 fall and winter precipitation was close to record setting in most water basins, the last 3 years have experienced a dramatic reduction in precipitation and snowpack. As of April 15 2014 the majority of Nevada has experienced moderate to extreme drought conditions as quantified by the U. S. Drought Monitor Index (Figure 2). Significant portions of Pershing, Churchill, and Lander counties have been categorized a “exceptional” drought conditions, the highest category defined by the Drought Monitor Index. Expect low fawn ratios to continue statewide in response to low precipitation and snowpack. Antler growth and body condition is also expected to diminish if late spring and summer moisture do not return to normal levels.
SUMMARY
SS-8
Table 1. Water basin climate data from SNOTEL monitoring stations throughout Nevada and the Sierra Nevada Mountains for snow water equivalent of snowpack as of 15 April 2014 and total water year precipitation from 1 October 2013 – 15 April 2014 in inches (Natural Resources Conservation Service,* Data may not provide a valid measure of conditions). BASIN Snow Water Equivalent Total Precipitation
Data Site Name - elev. ft Unit(s) Current Average % of Avg Current Average % of Avg
NORTHERN GREAT BASIN 60* 70
Disaster Peak - 6,500 031
0.1
16.2
Sheldon - 5,800 033 3 5.8 52
TRUCKEE RIVER 22 53
Mt Rose Ski Area - 8,801 194 10.3 36.1 29 24.6 48.1 51
Big Meadow - 8,249 194 0.1 15.2 0 14.1 26.6 53
CARSON RIVER 192 37 57
WALKER RIVER 201 32 54
JARBIDGE/SNAKE RIVER 76 77
Pole Creek R.S. - 8,330 072 15.8 19.9 79 9.4 12.3 76
BRUNEAU RIVER 30 83
Big Bend - 6,700 061/071 0 4.2 0 11.1 12.2 91
Bear Creek - 8,040 071/072 7.6 21.1 36 21.1 25.5 83
Seventysix Creek - 7,100 071/072 4.6 7.8 59 10.8 14.2 76
OWYHEE RIVER 74 80
Fawn Creek - 7,000 062 15.1 15.6 97 18.1 22.8 79
Jack Creek Upper - 7,250 062 15 16.2 93 16.8 19.8 85
Laurel Draw - 6,697 062 1.4 6.4 22 15.3 18.5 83
Taylor Canyon - 6,200 068/062 0 0 6.9 8.4 82
LOWER HUMBOLDT RIVER 61 82
Big Creek Summit - 8,695 173 14.2 17.7 80 13 16.7 78
Buckskin Lower - 6,915 051 5.1 6.8 75 15.2 16.4 93
Granite Peak - 8,543 051 12.1 19.9 61 18.3 24.3 75
Lamance Creek - 6,000 051 0 2.4 0 17.3 20.7 84
UPPER HUMBOLDT RIVER 107 90
Draw Creek - 7,200 072 7 8.7 80 12.2 14.2 86
Dorsey Basin - 8,100 101/102 13.3 11.6 115 19.6 21.8 90
Green Mountain - 8,000 102 14.2 11.2 127 20.5 21.7 94
Lamoille #3 - 7,700 102 12 11.4 105 17.2 20.8 83
CLOVER VALLEY 128 105
Hole-in-Mountain - 7,900 101 19 14.8 128 25.5 24.4 105
EASTERN NEVADA 63* 74*
Berry Creek - 9,100 111 11.8 15.6 76 13.6 16.4 83
Diamond Peak - 8,033 141 2.3 1 230 10.4 13.7 76
Ward Mountain - 9,200 221 3.7 11.7 32 9.4 14.9 63
SUMMARY
SS-9
Figure 1. Trend in percent of Average October – April Precipitation for Nevada water basins from 2006 – 2014 (SNOTEL sites, Natural Resources Conservation Service).
0
20
40
60
80
100
120
140
160
2006 2007 2008 2009 2010 2011 2012 2013 2014
% o
f A
vg.
tota
l Pre
cip
itat
ion
Oct
-A
pri
lCentral/Eastern Nevada Water Basins
% of Avg Precipitation Oct‐April 2006 ‐ 2014
LOWER HUMBOLDT RIVER UPPER HUMBOLDT RIVER EASTERN NEVADA
0
20
40
60
80
100
120
140
160
2006 2007 2008 2009 2010 2011 2012 2013 2014% o
f A
vg.
To
tal P
reci
pit
atio
n O
ct -
Ap
ril
Western/ Northwestern Nevada Water Basins% of Avg Precipitation Oct‐April 2006 ‐ 2014
NORTHERN GREAT BASIN TRUCKEE RIVER WALKER RIVER
0
20
40
60
80
100
120
140
160
2006 2007 2008 2009 2010 2011 2012 2013 2014
% o
f A
vg.
To
tal P
reci
pit
atio
n O
ct -
Ap
ril
Northeastern Nevada Water Basins% of Avg Precipitation Oct‐April 2006 ‐ 2014
BRUNEAU RIVER OWYHEE RIVER SALMON FALLS
SUMMARY
SS-10
Figure 2. US drought monitor index for the state of Nevada. Data was generated on April 15, 2014 from the USDA funded website: http://droughtmonitor.unl.edu.
BIG GAME HERD STATUS REPORTS

MULE DEER
1
MULE DEER Units 011 - 015, Northern Washoe and Western Humboldt Counties Report by: Chris Hampson Harvest Hunter success rates for the 2013 hunting season were similar to those of recent years for most Washoe County hunt units. The largest change was in unit 015 where the hunter success rate jumped from a low of 23% in 2012 to 41% in 2013. The hunter success rates for migratory deer populations along the California/Nevada border can fluctuate from year to year based upon the severity of the winter and the number of deemr that move from California into Nevada to spend the winter. No new fires burned in Management Area 1 during the summer or fall of 2013. In 2012, two large wildfires burned important mule deer habitat in hunt units 012, 013 and 015. The Rush Fire burned approximately 350,000 acres and represented the second largest wildfire in California history (300,000 acres in California and 50,000 acres in Nevada). Restoration of this large wildfire was made much more difficult due to the lack of available sagebrush seed. Additional restoration work occurred this past year (second year after the fire) due to more seed and other resources being available. Overall, deer harvest within Management area 1 was generally below the various hunt unit harvest objectives this year. In Unit Group 011-013, the total harvest of 150 bucks was 16% below the harvest objective of 178 bucks. In hunt unit 014, the actual harvest was 12% below the harvest objective of 141 deer. Youth hunters had good success this year and harvested a total of 75 bucks and 7 does during the 2013 hunting season. Survey Data Post season surveys were conducted during the middle of November in an effort to conduct fall composition surveys during the peak of the rut. Biologists believe that the later timing of the flights gives a unique opportunity to observe and assess the buck ratios within the various herds. Unfortunately, the mild conditions this past fall and winter pushed back the peak of the rut and many mule deer bucks were still not running with does in mid November. Post-season surveys within Management Area 1 classified a total of 695 mule deer with a computed ratio of 44 bucks/100 does/36 fawns. Mule deer were scattered and much more difficult to locate on this year’s survey. Mild weather conditions and little to no snowfall prior to the surveys allowed for a good green-up that distributed deer over wide areas. No post-season surveys were conducted by the California Department of Fish and Wildlife (CDFW) in hunt unit X5B this past fall. California biologists have traditionally flown the interstate deer herd in the fall due to the fact that the migrating deer are still concentrated on the California side of the line and have not begun their migration into Nevada. The CDFW was forced to temporarily cancel these surveys following a tragic helicopter crash a few years ago. The post-season surveys are scheduled to be reinstated in the fall of 2014. Due to a mechanical problem with the fuel truck, spring surveys were flown out of the Alturas airport where fuel could be obtained. The breakdown caused limitations on the number of areas that could be surveyed. The surveys were conducted in early March 2014 and classified a total of 402 mule deer with a ratio of 38 fawns per 100 Adults. Recruitment this year was very similar to the 40 fawns per 100 adults average ratio observed in the spring of 2013. Mule deer were once again difficult to locate due to the extremely mild winter and warm temperatures that allowed deer to scatter out and not to be concentrated on traditional winter range. Some areas within hunt units 012 and 013 were not surveyed this year.

MULE DEER
2
Habitat No major wildfires occurred within Management Area 1 during the summer or fall of 2013. Two major wildfires burned approximately 400,000 acres of deer habitat in Management Area 1 and in adjacent California hunt unit X5B in 2012. Habitat restoration within the burned areas continued in 2013 with additional plantings of sagebrush and bitterbrush seedlings. The Surprise and Eagle Lake Field offices of the Bureau of Land Management, NDOW and volunteers from several conservation groups helped with the restoration efforts. Additional areas were reseeded with native seed species. The Bureau of Land Management Surprise District also evaluated the success of the 2012 restoration efforts and found a surprisingly high success rate on the bitterbrush seedlings that were hand planted in the winter of 2012-13. Monitoring of the 2012-13 bitterbrush seedling project on the east side of Cherry Mountain of unit 013 showed an excellent survival rate for the bitterbrush plants of 58%. The winter of 2013-14 looks to be another well below average water year. This represents the third consecutive dry winter for the northwestern portion of the state. Habitat conditions and water availability this coming summer and fall will be negatively affected. Many of the high elevation lake beds were dry by the middle of the summer 2013. Spring sources throughout the region suffered from reduced flows or had dried up entirely by mid-summer. Habitat conditions are expected to deteriorate quickly this coming summer and water availability could be much reduced. Population Status and Trend Mule deer populations in northwestern Nevada have had to whether their third consecutive below average water year. Drought conditions have been graded as “severe” in Northwestern Nevada by the US Drought Monitor (as of 15 April 2014). The drier portions of the Management Area are even drier due to the long-term drought while some higher elevation areas to the west have received at least some precipitation. Numerous spring sources went dry this past summer and there has not been sufficient precipitation this winter to recharge the flow to those spring sources. Many other spring sources are still flowing but are currently suffering reduced flows. Additional spring sources are expected to go dry this coming summer. Hunt units on the western portion of Management Area 1 are generally higher in elevation and normally receive more precipitation from passing storms. Those deer populations that can move to higher elevation areas in the summer have been able to whether the drought better than those deer herds that live on the eastern portion of the Management Area where the deer habitat is lower in elevation and generally much drier. The recent wildfires within Management Area 1 have impacted deer herds that live year round in hunt units 012, 013, and 015 as well as the resident and interstate deer herds that move into the hunt units to spend the winter. The loss of important browse species and thermal cover will affect the herds for the long-term. Restoration efforts have helped but the burned areas will take more than a decade to for many of the areas to recover. Wildlife Services continued to conduct lion removal efforts in the Granite Range of unit 014 during 2013. The project is currently in its 10th and final year. NDOW continues to conduct both post-season and spring composition helicopter surveys in the Granite Range. The 2014 quota recommendations are expected to mimic deer population trend. Units 021, 022, Southern Washoe County Report by: Chris Hampson Harvest Resident rifle hunter success rates were once again very strong in Management Area 2. Hunters in hunt unit 021 showed a strong increase in success from 60% in 2012 to 78% in 2013. Hunters in unit 022 experienced a 5% decrease in success when compared with the 2012 hunting season but the success remained strong at 55%.
MULE DEER
3
Overall, the 4pt or better in the harvest fell in 2013 but was still strong in hunt unit 022 at 58%. In hunt unit 021 the 4pt or better in the harvest was measured at 37% slightly down from the 2012 level of 41%. Youth tag holders harvested a total of 23 bucks and 2 does from Management Area 2 hunt units during the 2013 hunting season. Harvest objectives for both of the hunt units within the Management Area were met or exceeded this past year. The hunting seasons within Management Area 2 remained similar to what has been the norm over the past several years. Unit 021 is a late season hunt designed to take advantage of migrating deer and occurs in the month of December on winter range. The unit 022 hunting season is a more typical, almost month long season that starts in early October and runs through the end of the month. The mule deer in hunt unit 022 are resident mule deer and generally do not migrate out of the hunt unit in the winter. Deer that are hunted in hunt unit 021 are mostly migrating deer from California hunt units X6B and X7A. The deer migrate into Nevada to spend the winter and usually do not arrive until at least mid-November. There is a small resident Nevada herd in hunt unit 021 that provides additional opportunity to those hunting deer in the unit. Both herds have been doing very well in recent years and hunters have enjoyed good success. Survey Data No post-season surveys were conducted in Management Area 2 or in California hunt units X6B or X7A this past year. California biologists historically conducted the survey due to the fact that deer are on the California side of the state-line in the fall. In unit 022, surveys are not conducted because the herd is a low density herd and samples can be difficult to obtain. Spring mule deer surveys were conducted by NDOW biologists during early March 2014. Sample sizes were down this year due to the mild conditions and lack of snowfall. Surveys in hunt unit 021 classified a small sample of deer with a composition ratio of 38 fawns:100 adults. In hunt unit 022, deer were also scattered due to an extensive green-up at all elevations. The small sample provided a fawn to adult ratio of 28 fawns:100 adults. Spring surveys were also hampered by a mechanical breakdown of the fuel truck. Portions of unit 022 were not flown due to the breakdown. Habitat The winter of 2013-14 was once again very dry and well below average for total precipitation and snowfall received. This represents the third consecutive dry winter in northwestern Nevada and the entire region was classified as being in “severe drought”. Stream flows are forecast to be well below average and the amount of water available to wildlife at important lakebeds and spring sources could be substantially reduced. In Management Area 2 a lightning caused wildfire on Seven Lakes Mountain burned over 5,300 acres in July 2013. The fire burned in the same general area of the 2009 Trailer 1 Fire and the Gooseberry Mine Fire that burned in 2008. The recent wildfire unfortunately consumed areas that had been rehabilitated following the 2008 and 2009 wildfires. Due to the extensive wildfires that have plagued Management Area 2 for several decades, mule deer habitat within the region has been compromised and fragmented. Only small areas of intact sagebrush and bitterbrush remain. Sagebrush is slowly returning on many northern and eastern aspects within the burned areas. Additional restoration efforts have been undertaken but have met with limited success due to limited spring moisture and competition with cheatgrass and other annuals. The fire cycle throughout much of Management Area 2 has been shortened considerably, especially in the Petersen Mountains, where wildfires have become increasingly frequent. Maintaining the remaining stands of sagebrush and bitterbrush will be critical to the future of this deer herd. Expanding the amount of sagebrush cover and important browse communities within the burned areas will be necessary to help reverse the trend. Habitat restoration projects have recently been completed in Black Canyon of the Virginia Mountains. The Carson City District of the BLM, NDOW, NRCS, Washoe County, Nevada Bighorns Unlimited and private landowners have all been involved in trying to improve wildlife habitat within the region.
MULE DEER
4
Additional restoration efforts to try and restore brush species and improve riparian condition for both mule deer and sage grouse in the Virginia Mountains are planned. Population Status and Trend Recruitment in 2013-14 was observed to be adequate for maintaining deer numbers within hunt unit 022. In 021 and California hunt units X6b and X7a recruitment was measured at 38 fawns per 100 adults and will allow for a continued increasing trend for the interstate deer herds. In recent years, the deer herds within Management Area 2 have generally exhibited an upward trend. Harvest numbers and hunter success rates have also improved over the past several years. However, over the long-term, the deer herds within Management Area 2 are limited by numerous factors including loss of habitat due to extensive wildfires, housing development, proposed energy development, and other forms of human encroachment such as motorcycle and ATV recreational use. Due to the fact these deer herds live in close proximity to the Reno/Sparks area, human encroachment issues will continue to be a major problem for the deer herds in Management Area 2. Quota recommendations for the Management Area 2 deer herds for the 2014 hunting season are expected to be similar to slightly higher than the previous year’s quotas. Units 031, 032, 034, 035: Western Humboldt County Reported by: Ed Partee Survey Data Post season surveys were conducted during late November and resulted in a total of 1,182 deer being classified. Overall, ratios obtained from these surveys were 31 bucks: 100 does: 51 fawns. The past 5-year average for these units is 34 bucks:100 does:53 fawns. This year’s ratios are comparable to the past five year average. Spring deer surveys were conducted during mid March 2014. A total of 1,030 deer were classified which was down from 1,588 deer classified during the spring of 2013. This survey yielded a ratio of 37 fawns:100 adults. This ratio is up slightly from last year’s ratio of 31 fawns:100 adults. This ratio is close to the past 5-year average of 38 fawns: 100 adults. Habitat The fall of 2013 began with good snow conditions during early December however, the storm track shifted north and relatively little moisture was received for the rest of the winter. As of 1 March, snowpack conditions remain well below average. In August 2012 Unit 031 was affected by a major wild land fire that burned approximately 215,000 acres of mule deer habitat. Rehabilitation efforts continue in areas affected by this fire. Sagebrush planting projects in other areas affected by wild fire have continued in Management Area 3. Other projects are being evaluated that will protect existing habitat and enhance those areas in need or rehabilitation. Population Status and Trend Population estimates for Management Area 3 have remained relatively stable for the last two years. Competition for forage will likely have an effect on these herds during the upcoming summer months. Impacts to winter range in most of these units remains the limiting factor due to wild fires which have converted shrub lands to annual grass.
MULE DEER
5
Unit 033, Sheldon National Wildlife Refuge: Washoe and Humboldt Counties Report by: Chris Hampson Harvest Fire restrictions that closed most of the access roads to major hunting areas during the 2012 hunting season were lifted prior to the start of the 2013 deer season. Road closures were lifted earlier this year due to improved moisture and a drop in temperatures. However, the government shutdown that lasted approximately three weeks may have impacted a small portion of the hunters who had tags for the Sheldon in 2013. The decision to close roads to vehicle access was not supported by NDOW because vehicle-caused fires are uncommon and no other public hunting areas or access roads in the state of Nevada (BLM or Forest Service) have been closed due to the threat of fire danger. The closure of major access roads on the Sheldon significantly reduces the ability for most hunters to hunt many of the traditional hunting areas. Hunter success rates and the quality of bucks taken during the season dropped significantly when the road closure policy was enacted during the 2012 hunting season. The hunter success rates for resident rifle hunters increased this year by 10% during the early hunting season and 15% in the late season when compared with the 2012 hunting season. The increases were at least partially due to the fact that hunters were able to once again gain access and hunt the traditional hunting areas. The harvest of 4 point or better bucks on the Sheldon increased to more normal levels this year with the access roads open. Fifty-nine percent of the hunters who drew the late season tag on the Sheldon harvested a buck with 4 points or better. Youth hunters once again had the highest success rate this past hunting season. Parents generally expend significant time and energy ensuring that their sons or daughters have a successful and enjoyable hunt. Youth tag holders harvested 17 bucks in 2013, three more than the 2012 hunting season. No doe harvest was reported. The harvest objective for all mule deer hunts on the Sheldon was 77 bucks. Hunters reported 76 bucks harvested, which was 1 deer below the harvest objective for the 2013 hunting season. Survey Data The current drought conditions and hunting pressure from the recently completed deer season resulted in mule deer being pushed off of their normal upper elevation summer ranges. Mule deer were difficult to locate this year on survey and a small sample of 106 mule deer was classified. The computed ratio from the sample was 27 bucks:100 does:39 fawns. Spring surveys were just as difficult or even more so as the warm temperatures and lack of snow had deer scattered out over wide areas. Some small groups of deer were observed on winter range but most deer were scattered out due to an extensive green-up and very mild temperatures. Biologists conducted survey flights in several new areas this year to expand the typical search areas. Unfortunately, only a few small groups of deer were observed in the Sage Hen Hills and along the south slopes of Big Springs Table. Some traditional winter ranges were not flown this year due to the mild conditions that had deer scattered out over their vast transitional ranges. Habitat The third consecutive below average winter will result in the continuation of long-term drought conditions that have hampered the Sheldon deer herd. Since the record-setting dry year of 2007, the Sheldon has suffered numerous below average water years and very dry conditions. Water availability and forage quality will once again be issues this coming summer and fall. Mule deer summer range will be drier than normal and forage species important to mule deer will dry out quickly. Mule deer have been responding to the drought conditions by dropping in elevation and living on northern and eastern aspects that have the best available forage and water.
MULE DEER
6
In addition to drought conditions, a major impact to the Sheldon deer herd has been from expansive fires that have burned approximately 50% of the best mule deer summer range on the Sheldon. Large fires burned crucial habitat on Catnip Mountain, Badger Mountain, Alkali Peak, Devaney Mountain, Mahogany Mountain and Bald Mountain. The fires occurred from 1988 through the early 2000’s. The largest fire was in 1999 and burned a tremendous amount of important deer habitat on Badger Mountain, Alkali Peak, Devaney Mountain and Mahogany Mountain. The fire that burned on Catnip Mountain also burned crucial mule deer habitat for the Sheldon deer herd. The loss of important browse species and cover such as mountain mahogany will impact the herd for the long-term. Sagebrush and other browse species are finally making a comeback on some of the higher elevation burned areas. However, mountain mahogany does not appear to be coming back or expanding from its pre-fire distribution. Population Status and Trend The third consecutive dry winter will impact water availability and overall habitat conditions for mule deer on the Sheldon. Water availability could be even worse this year as many springs had reduced flows or went completely dry last year. Unless significant spring or summer precipitation is received, mule deer summer ranges will once again be very dry by late summer to early fall. Mule deer will move off these dry areas to north slopes that have the best available water and forage. Quotas are expected to be very similar to those recommended in recent years. Units 041, 042: Western Pershing and Southern Humboldt Counties Report by: Kyle Neill Survey Data Post-season surveys were not conducted in 2013. Spring surveys were performed in mid-March and were conducted from the ground in the Selenite, Kamma, Seven Troughs, Majuba and Trinity Ranges. A brief aerial survey was performed in the Eugene Mountains. Combined surveys resulted in the observation of 54 mule deer. This sample provided a fawn ratio of 29 fawns: 100 adults. The 2014 spring fawn ratio has remained below its long-term average of 35 fawns: 100 adults for the second straight year. Population Status and Trend Western Pershing County’s mule deer population is estimated at approximately 750 animals and continues to demonstrate a stable population trend. Overall, this herd is expected to remain stable with minimal yearly growth or decline due to significant conversion of habitat by wildfires and limited annual moisture levels. Field observations from this past year continue to document mule deer in the following mountain ranges: Nightingale, Sahwave, Selenite, Lava Beds, Seven Troughs, Kamma, Trinity, Majuba, Antelope and Eugene Mountains. Units 043 - 046: Eastern Pershing and Southern Humboldt Counties Report by: Kyle Neill Harvest Results There were a total of 447 any legal weapon buck tags (Hunt 1331 resident and nonresident) issued in 2013 which represented an 89% increase from the 2012 quota. This increase in buck tags was an effort to take advantage of extremely high buck ratios observed in this population. This effort proved successful and hunters were able to lower buck ratios to near objective levels, which will likely contribute to better herd health and quality bucks in the future.

MULE DEER
7
A resident any legal weapon doe harvest (Hunt 1181) was offered last year for the unit group and was the first doe hunt approved since 2002. The Wildlife Commission approved 107 tags and hunter success was 54%. This effort was also intended to reduce deer density and improve the overall health of the herd. Survey Data Post-season aerial surveys were conducted during late November 2013. All units were surveyed. A total of 805 animals were classified with sex and age ratios of 32 bucks: 100 does: 34 fawns. The 2013 post-season buck ratio is near the long-term average of 33 bucks: 100 does, while the fawn ratio was observed to be very low for the second year in a row. Spring aerial surveys were conducted during mid-March and resulted in the classification of 718 animals with a ratio of 22 fawns: 100 adults. The 2014 spring fawn ratio indicates a 21% winter fawn loss. Habitat Several wildfires occurred last year in the northern portion of Unit 044, in the East Range. These include the Dun Glen, Raspberry and Cosgrave Fires. The Dun Glen Fire burned 335 acres. Rehab included drill seeding 160 acres with big sagebrush, Sandberg’s bluegrass, spiny hop sage and Indian rice grass. The Raspberry Fire burned 685 acres and 337 acres were aerial seeded with big sagebrush and Sandberg’s bluegrass. A total of 556 acres burned on the Cosgrave Fire. BLM aerial seeded approximately 100 acres with big sagebrush and Sandberg’s bluegrass. Both the Raspberry and Cosgrave areas previously burned in 1999. These wildfires are not thought to negatively affect the unit’s mule deer population. Overall, winter range within the unit group continues to remain in a degraded state, most noticeably the southern portion of Unit 046, Sonoma Range and most of the lower elevations of Unit 043, Humboldt Range. Winter range in the Humboldt Range continues to remain poor. Plausible causes could be due to domestic sheep grazing that occurs yearly from 25 April to 30 September, which is likely limiting the recovery of shrub establishment from past wildfires. Population Status and Trend Eastern Pershing County’s mule deer population reached an all time high estimate of 3,400 in 2012. Biologists believed that this population was at or near its carrying capacity given herd size in relation to existing habitat conditions. After two straight years of low recruitment rates, this population has declined to an estimated 2,700 mule deer in 2014. Moreover, this population is now approximately 6% below its long-term average of 2,861 mule deer. Last year’s management objectives were met. Future objectives include maintaining a post-season buck ratio of 30 bucks: 100 does and maintaining the population near the long-term average. Unit 051: Santa Rosa Mountains; Eastern Humboldt County Report by: Ed Partee Survey Data Post-season helicopter flights were conducted during late November 2013. A total of 284 deer were classified this year which is a significant drop from last year’s observations. Ratios obtained from deer classified during these flights were 27 bucks:100 does:56 fawns. These ratios remain similar to the past five year average. Spring survey flights were conducted during mid-March 2014. A total of 533 deer were classified with a ratio of 40 fawns:100 adults. This recruitment rate is similar to the past five year average. Habitat During August 2012 the Santa Rosa Range lost an additional 10,000 acres of mule deer habitat to wildfire. Several bitterbrush and sagebrush planting projects have taken place to help in the recovery of the burned area. The success of all rehab work will depend on the amount of precipitation received in future years.
MULE DEER
8
Population Status and Trend The population estimate for Unit 051 has dropped from what was reported during the past two years. A decline in fawn production followed by poor fawn recruitment has affected this herd. Much of the summer range is in fairly good condition however, winter range remains in poor condition despite past rehabilitation efforts. Units 061 - 062, 064, 066 – 068: Independence and Tuscarora Ranges; Elko County Report by: Matthew Jeffress Harvest Results There were 1,621 rifle buck tags (resident and nonresident) available in 2013. The quota represents a 22% decrease over 2012 quotas. The average hunter success rate for all rifle buck hunters was 44%, which represents a 1% decrease from 2012. Forty-one percent of all bucks harvested last season were 4-point or better. For more specific hunting results, please refer to 2013 Harvest Tables in the Appendix. Survey Data A fall helicopter survey was conducted in December 2013. A total of 4,912 deer were classified yielding ratios of 30 bucks:100 does:65 fawns. This was the highest fall sample obtained since 1998. The buck ratio mirrored our desired post season buck ratio objective. The fawn ratio was 10 below the long-term average and was likely attributed to persistent drought conditions. A spring helicopter survey was conducted in April 2014. A total of 1,970 deer were classified yielding a ratio of 42 fawns:100 adults. This was the second lowest spring sample on record. The small sample size is attributed to the extremely mild winter, with deer being able to utilize much of their summer range throughout the year. The spring ratio represented a 19% winter fawn loss. Habitat Below-average snowpack and spring precipitation made for a 2nd dry summer in 2013. Range conditions through January remained dry. Poor range conditions throughout the 25 Allotment continues to negatively impact wintering mule deer. Of great concern was the high utilization of seedings in the Santa Renia, Izzenhood and Sheep Creek Ranges. As of early March 2013, the snowpack for northern Elko County was 62% of normal. Given the deficit of soil moisture last year, 62% snowpack is far from what was needed to offset the drought of 2011, 2012 and 2013. We continue to lose mountain brush communities at an accelerated rate; with fires consuming important mule deer habitat each year since 2011. Several fires burned within the unit group during the spring and summer months of 2012. The 5 largest fires, Willow, Browns Gulch, Mustang, Lime and Homer primarily burned summer and transitional mountain brush communities. Deer rely heavily on these mountain brush communities for building fat reserves prior to being forced onto degraded winter range. The 5 fires combined burned over 91,000 acres. Portions of each fire have negatively impacted mule deer. Mountain brush communities lost in the Willow and Mustang fires were the last large-scale blocks of intact habitat remaining for mule deer as they transition from summer range to degraded winter ranges. To further compound the loss of the 42,000 acres consumed by the 2012 Willow Fire, in 2013 another 20,000 acres of habitat was lost in the North Tuscarora Range and South Independence Range. BLM and NDOW, in cooperation with landowners, Elko Bighorns and Midas NBU, seeded much of what was lost in the Red Cow, Water Pipe and Wieland fires with wildlife friendly seed mixes, including a new cultivar Snowstorm Forage Kochia. While hopeful for full establishment of seeded species, NDOW is mindful of the challenges associated with fire rehab, especially with sagebrush. Between the years of 1999 and 2011, over 1.5 million acres of rangeland burned in Area 6, much of which was important deer habitat. In response to the significant amount of habitat loss, tens of thousands of acres of winter range has been reseeded with desirable forage species. Success of these seedings is heavily reliant on timely moisture, proper grazing practices, and prevention of reoccurring fires. While positive recovery has been observed at mid to upper elevations, recovery of critical low-elevation winter range continues to be a struggle in Area 6. NDOW continues to ask BLM to develop a grazing management plan for the 25 Allotment. Over a million dollars has been spent on fire rehab and habitat

MULE DEER
9
enhancement projects to provide forage and cover for wildlife on this important big game winter range. Many of these past investments near the Izzenhood Range and Sheep Creek Range have been lost or greatly compromised due to a combination of unregulated livestock grazing and drought conditions. With gold prices around $1,300 per ounce, mining activity continues to increase throughout Area 6. Direct and indirect impacts to mule deer migration corridors remain the highest concern with increased mining and exploration. NDOW is hopeful mining companies will continue to follow recommendations of the January 2012 Area 6 Mule Deer Working Coalition publication on habitat management practices. In an effort to better delineate mule deer migration corridors through the Carlin Trend, 40 adult mule deer does were fitted with GPS collars between December 2012 and January 2013. Data obtained from the collars this summer should help support management recommendations for maintaining suitable corridors for migrating deer. Of equal importance, location data obtained from the collars will allow NDOW to identify important stop-over habitats, winter range, and sites for targeted habitat enhancements. Population Status and Trend The population estimate for the Area 6 deer herd increased slightly over last year. The stable population was planned with harvest objectives of last season’s hunts designed to maintain the population within the confines of the carrying capacity of the Area 6 winter range. Given the limited available winter habitat during prolonged periods of snow and below-zero temperatures, it is imperative to structure harvest towards maintaining an overall population between 8,000 to 9,000 adults. Post-season buck ratios above 30 introduce extra competition for limited forage, likely leading to high over-winter fawn loss and overall decreased body condition of all deer. The same can be said for allowing the overall population to outgrow the carrying capacity of seasonal habitats. Too many deer competing for limited forage can decrease overall body condition of all deer and, under unfavorable environmental conditions, can lead to all age die-offs. This deer herd is capable of increasing rapidly due to the excellent summer habitat and high fawn producing capabilities associated with Area 6. That being said, it is imperative to remember poor winter range conditions in Area 6 will dictate long-term population levels as it has done since the 1960’s. Targeted winter range restoration will only be successful with proper grazing practices in place to ensure the long term viability of such investments and to ensure the rehabilitation seedings benefit wildlife in the form of forage and cover during critical winter months. With the successful restoration efforts realized on the Marsh Creek Bench, the Izzenhood Range and the north Tuscarora Range, it was believed the carrying capacity of these winter ranges had increased over the past decade. However, with recent impacts to these seedings by drought conditions, livestock grazing, and the loss of an additional 325,000 acres of habitat since 2011, the carrying capacity of this herd has once again decreased. Both fire suppression priorities and techniques have been inadequate in Area 6. If fire management in this region remains the same, then major wildfires will continue to burn crucial mule deer habitat. At this rate, no level of habitat restoration will be enough to maintain the current population and we will likely see a decline in the Area 6 mule deer herd. Several past fire restoration sites have been compromised by improper livestock grazing. Utilization criteria need to be implemented to ensure the success of seedings for the benefit wildlife and livestock. Recommended buck quotas for 2013 will be slightly lower than 2013. As was the case last year, doe harvest is necessary to maintain the deer population within the confines of the carrying capacity of winter range. Population management through the implementation of doe harvest will alleviate competition among deer for limited resources during moderate to severe winters. Doe harvest is the best way to control populations and can prevent the risk of catastrophic winter die-offs observed in years past. Currently, doe harvest is the best available tool for properly managing populations; particularly those at or above the carrying capacity of seasonal habitats. The recommended doe harvest for 2014 will be much higher than the 2013 quota, primarily to address concerns about the recent loss of past restoration efforts and the overall decrease in carrying capacity of Area 6 winter range.
MULE DEER
10
Unit 065 Piñon Range: Southwestern Elko County Report by: Scott Roberts Harvest Results There were 84 tags issued in 2013 across all weapon classes for both residents and nonresidents, with 62% of all tag holders being successful in harvesting deer. Fifty-eight percent of the harvested bucks were 4 points or better, which was slightly below the previous 10-year average of 60%. For more specific harvest results please refer to Harvest Tables in the Appendix Section. Survey Data A combination aerial and ground post-season deer survey was conducted in Unit 065 in the fall of 2013. A total of 361 deer was classified; yielding ratios of 31 bucks:100 does:49 fawns. The survey was conducted prior to the peak of the rut, which may have biased the observed buck ratio low. The survey was hampered by warm temperatures and high winds. Habitat The US Drought Monitor Index has this entire area classified as exhibiting moderate to severe drought conditions. These dry conditions have led to significantly lower production of grasses and forbs the past 2 summers throughout the unit and have led to greater competition for the limited resources. Drought conditions were most evident in lower elevation sites that have burned in the past 15 years. In February, 2014 the Elko BLM released a district wide Environmental Assessment (EA) to address the Management and Mitigation for Drought Impacted Rangelands (for more information visit: www.blm.gov/nv/st/en.html). The implementation of the management measures outlined in the EA will be paramount in protecting the stressed and compromised habitat on public lands throughout this unit. Mineral exploration throughout the area continues to be a concern as companies are concentrating on much of the higher elevations of the Piñon Range. Most of the areas with increased drilling sites represent some of the most productive summer range in Unit 065. Population Status and Trend This deer herd has exhibited static population growth during the past 2 years. A break from the current drought pattern and improved range conditions will be needed to resume the growth that this unit has realized in the recent past. Units 071 – 079, 091: Northeastern Elko County Report by: Kari Huebner Harvest Results The 2013 hunter success for the early and late season any-legal-weapon hunts were the same as 2012, 51% and 63% respectively. In 2012 the harvest of 4-point or better bucks was 34% early and 54% late. This years harvest of 4-point or better bucks was lower in the early season with 22% and higher in the late season with 57%. The 2013 archery success was 14% for the early season, the same as last year. Late season success dropped from 35% in 2012 to 28% in 2013. Survey Data Post-season helicopter surveys were not flown in the Area 7 this year. Spring surveys were flown in early April of 2014. A total of 1,557 mule deer were classified; yielding a ratio of 32 fawns:100 adults. This year’s
MULE DEER
11
recruitment rate is slightly lower than the previous 5-year-average of 35 fawns:100 adults. The spring sample size was down due to deer being scattered because of the early spring like conditions and the lack of snow. Habitat Deer habitat in this unit group has been reduced following the large wildfires that occurred in the area since 1999. Invasive weeds such as cheatgrass and mustard have invaded deer habitat and now dominate many of the lower elevations. Even in areas where perennial grasses and forbs are found, it will take years for shrubs such as sagebrush and bitterbrush to return to these burned areas. The majority of the Area 7 deer herd winters south of Interstate 80 in the Pequop and Toano Mountains. As these deer attempt to make their way to winter range from Jarbidge and other summer ranges, they are often struck by vehicles either on Highway 93 or Interstate 80. During the fall of 2010, 1 overpass and 2 under-crossings near Ten Mile Summit on Highway 93 were functional for the fall deer migration. By the fall of 2011, another overpass and 1 under-crossing were completed on HD Summit on Highway 93. So far over 22,000 individual deer crossings have been recorded on cameras at the 5 crossings on Highway 93. It has also been noted that deer/vehicle collisions have been reduced each year the crossings have been in place, making the road safer for motorists as well as deer. Sixty-five deer have been radio collared in a collaborative effort between NDOW, Newmont Mining Corp. and UNR in the Pequop winter range. As of the spring of 2014, there were 45 collars still active. Fifteen of these collars are expected to drop off by early summer. The collar data has and will continue to be used to assess impacts from exploration and potential mine development in Long Canyon on wintering and migrating deer and to better define migration corridors and winter use areas. Population Status and Trend Data indicate the Area 7 deer herd experienced a significant set-back during the winter of 2001-02. Since then this deer herd appears to have been stable to slightly increasing. Due to a combination of recent fires, drought conditions, and possible plant senescence, it is highly unlikely deer habitat in Area 7 can support the high numbers of deer documented in past decades. Recent deer collaring has been instrumental in better understanding migration triggers, timing, paths, length of migrations (some deer are moving more than 100 miles to winter range) and seasonal use patterns for the Area 7 Deer Herd. The information garnered through the collars may also help identify potential habitat projects to address limiting factors for this deer herd. Unit 081: Goose Creek Area; Northeastern Elko County Report by: Kari Huebner Survey Data No surveys were conducted for this deer herd. Habitat The 081 deer herd’s winter range and some summer range were significantly impacted by the West Fork Fire in 2007. The fire burned 154,943 acres of prime winter habitat. The fire burned very hot and left few islands of habitat. Although the area was intensely seeded the 1st winter following the fire, it will be several years, if ever, until the brush community fully recovers in this area. Population Status and Trend Overall this is a relatively small deer resource in terms of resident deer populations with some migration from both Idaho and Utah. The magnitude of migration from surrounding states is dependent on weather conditions during the hunting season and timing of the hunt. In an attempt to take advantage of these later migrations,
MULE DEER
12
the muzzleloader and any legal weapon hunts have been scheduled later than in previous years. The intended result was to harvest more of the migratory herd and lessen the harvest on the small resident deer populations in the area. Hunter success increased this past year during the any legal weapon season. This herd has been managed as a trophy area in the past and with current challenges such as the reduction of winter range, the recommended tag quota will remain conservative. Units 101 - 109: Southern Elko and Northwestern White Pine Counties Report by: Caleb McAdoo Harvest Results The long-term average hunter success for the early any-legal-weapon season continues to remain at approximately 25%. For 2013, however, hunter success was 28%, down from 31% in 2012, but significantly greater than the long-term average. The mid-season success rate was 27%, which was down from 33% last year. The 2013 late season hunter success was 53% which was up from 43% in 2012. Additionally, 824 antlerless tags were issued and yielded success rates of 48%, slightly down from 52% in 2012. Late season hunter success typically varies with weather conditions but is usually over 50%. The percent of 4 points or better harvested in Area 10 in the 2013 season was 28%, which was well below the 10-year average of 33%. The statewide average of 4 point or better was 37%. For specific 2013 hunting season results, please refer to Harvest Tables in the Appendix Section. Survey Data Post season aerial deer surveys were attempted during the late fall of 2013, however, due to mechanical issues with the survey helicopter as well as weather constraints, the survey was cancelled shortly after commencement. A spring helicopter survey was conducted in late March and early April 2014. During this survey, 8,422 deer were classified, yielding a ratio of 31 fawns:100 adults. This was up 3 fawns:100 adults from last year’s spring survey. Habitat The single biggest threat to the Area 10 Deer Herd at this time continues to be the proposed expansion of Bald Mountain Mine (Bald Mountain Mine North and South Expansion EIS). While past mining operations in the area have afforded the necessary movement corridors for migrating deer through the mine site, NDOW and members of the public remain concerned that the proposed expansion could have negative population level effects to mule deer and could be potentially devastating by curtailing the life-history strategy of mule deer migration. However, NDOW is hopeful that the final mine facility design features identified in the EIS will reduce the negative impacts which would likely come from such a mining operation. NDOW remains committed to working with the BLM and Bald Mountain Mine to find the most effective solutions for mule deer passage through the mine operation areas, while still allowing access to mineral reserves. Area 10 was again spared from large catastrophic wildfires in the summer of 2013; however, some relatively small acreage (less than 3,000) fires did occur most of which were in Unit 102. The Smith Ranch fire was the largest of these, but should provide long-term benefit to wildlife. Smaller fires occurred around Lone Butte and Valley Mountain in Unit 109. This fire has high potential to not recover, despite rehabilitation efforts by the Bureau of Land Management. In addition to fires, there were some relatively significant habitat alterations on the east side of Unit 102 in the vicinity of Shorty Creek. These treatments were mosaic mowing of bitterbrush and sagebrush. Both long-term and short-term benefits will likely result from these treatments. Large components of young sagebrush and bitterbrush are responding to the treatments. Throughout much of the unit group, sagebrush “die-offs” continue to occur, however the majority of these are in lower elevation pronghorn habitat. Generally speaking, 2013 was a very mild year. In some portions of the unit group, most notably unit 104 and 105, monsoonal rains occurred in late summer and early fall. Snow levels were insignificant on transition and winter ranges, however, as of this writing, moisture levels are between 100-130% of normal in the Ruby and East Humboldt Ranges due to some late storms. The relatively mild conditions combined with the high elevation snow pack should provide for excellent summer range conditions in units 101, 102 and 103.

MULE DEER
13
The Department of Wildlife, along with land management agencies, continue to work on several large-scale mule deer habitat enhancement projects in Area 10 such as the Overland-Big Wash pinyon-juniper thinning project and the Spruce Mountain Restoration Project. These Projects were initiated to improve mule deer winter and transitional range by setting back the successional stage of the area to a more browse dominated site. These efforts should increase wildlife diversity and reduce the potential of catastrophic wildfires by reducing the fuel load. These areas are, and have been, extremely important winter and transitional range for thousands of mule deer that reside in Management Area 10. Efforts were initiated in the Spruce Mountain area in the fall/winter of 2013 and up to 2,500 acres are planned to be treated in 2014. Population Status and Trend The Area 10 population is the largest deer herd in the state, accounting for over 20% of the statewide mule deer population and is considered a stronghold for Nevada’s deer population. The Area 10 deer herd has been stable with the exception of 2 winter-related loss events, 1 in the mid 1980’s and the other in the winter of 1992-1993. Additionally, an unprecedented growth period occurred in the late 1980’s and was likely a density-dependent response to the winter loss in the mid-80’s coupled with ideal weather conditions. While recovering from 1992-1993 winter mortality losses, the Area 10 deer population showed an upward growth trend from 1997 through 2007. In 2008, the herd began to stabilize near the current population level. Fawn recruitment continues to be repressed in spite of relatively ideal weather conditions and good production. While carrying capacity is illusive in definition and dynamic in nature, the observed fawn recruitment values provide further evidence that the population has stabilized to current limiting factors (carrying capacity). This year’s population estimate increased from 23,000 to 24,000 due to a relatively strong fawn recruitment. Post-season buck ratio objectives remain high (30 bucks:100 does) in Area 10 and older age-class bucks continue to be well represented in this population. It is anticipated that fawn recruitment will remain repressed until a density-dependent event occurs or until limiting factors are addressed that increase the carrying capacity of the range. Furthermore, depending on the effectiveness of the “mule deer alternatives” identified in the Bald Mountain Mine EIS, population level responses could be realized if deer are unable to navigate to historical winter ranges. The Department of Wildlife continues to place a large emphasis on mule deer populations by investing time and resources into beneficial projects and scientifically sound research to increase understanding of the population dynamics of mule deer resources. From 2010 through the present, the Department of Wildlife, in cooperation with the University of Nevada, Reno, initiated mule deer migration and survivorship studies in areas, 10, 15, and 19, with goals of identifying age and sex specific mortality rates; defining summer, winter, and transitional ranges to help prioritize population enhancement projects; and to determine costs and benefits of various mule deer migration strategies. Bald Mountain Mine has also contributed collars as part of their baseline data collection for the North and South Operations EIS. For Area 10, over 325 radio-telemetry collars have been deployed. This ongoing study should provide valuable insight to the population dynamics of these herds and will be utilized to monitor effectiveness of mule deer design features and impacts from the mining operations. Units 111 – 113: Eastern White Pine County Report by: Curt Baughman Survey Data A post-season herd composition survey was flown in December 2013 for the 2nd straight year. Conditions for the survey were inferior to those of 2012, however flight time was sufficient and area coverage was good. A sample of 2,102 deer yielded ratios of 30 bucks:100 does: 61 fawns. This followed a sample of 2,234 deer classified in 2012 with ratios of 29 bucks:100 does:52 fawns. The buck:100 doe ratios documented the past 2 post-seasons have been the highest observed since 1977. The spring survey was conducted along with the elk survey in late February and early March, 2014. Advanced spring conditions resulted in deer being found lower than normal for late February. A sample of 2,510 deer yielded a ratio of 31 fawns:100 adults, or 40 fawns:100 does. During the 2013 spring survey, 2,009 deer were classified with ratios of 30 fawns:100 adults, or 39 fawns:100 does. Over-winter fawn loss was 35%. The previous 10-year-average (2003-2012) spring sample has been 1,954 deer with fawn recruitment of 29 fawns:100 adults. The long-term-average (1975-2013) fawn recruitment has been 34 fawns:100 adults for this unit-group. Since the spring of 2002, only 2006 and 2007 witnessed fawn recruitment above this average.
MULE DEER
14
Habitat Habitat and climatic conditions have been challenging for mule deer since 2007. Years that featured severe drought, dry summers or severe winters resulted in below-average fawn recruitment including 2 of the lowest years on record. A wet 2011 brought short-term habitat improvements that allowed deer to rebuild body condition. Unfortunately, this was followed by a May-June 2012 with above-average temperatures and 7% of average precipitation. Habitat conditions suffered, as did the condition of the does prior to and after parturition. This had a negative influence on early summer fawn survival. Late summer and fall precipitation was very generous in 2012, producing a tremendous fall green-up. This improved habitat conditions in the short-term as well as through the winter, allowing deer to improve body condition and handle the subsequent severe winter weather. Again in 2013, the late spring/summer period was hot and dry. Monsoon moisture finally arrived in late August and September, producing a substantial fall green-up. Both of these late-summer precipitation events prevented habitat conditions from becoming critical, but they failed to reverse the effects of late spring/summer drought on the survivorship of fawns. Weather Service measurements at the Ely Airport show current water-year precipitation near average; however local NRCS Snotel sites have recorded 65% to 88% of average water-year precipitation and 43% to 80% of average snow-water content. Abnormally warm temperatures in late February and March have produced good spring conditions for mule deer, but favorable conditions are needed through the spring and summer to produce meaningful improvements in short-term habitat conditions. Long-term habitat potential for mule deer is slowly declining due to the encroachment of pinyon and juniper trees (P/J) upward into mountain brush zones and downward onto bench areas. The threat of a wind energy development on top of the north Antelope Range (Unit 112) has been downgraded. Over the past several years, habitat enhancement projects have included 2 new water developments and several thousand acres of chaining and other P/J removal in north Unit 112 and a 5,700 acre chaining (seeded) on the east side of northern Unit 111. Numerous other projects with potential benefits to mule deer are in the planning stage. These include a large USFS project in northern Unit 111 to reduce P/J and conduct burning in white fir/aspen mixes, substantial removal of P/J and green-stripping in Duck Creek Basin (Unit 111) and a large BLM/USFS project on the east Schell Bench of Unit 111 to reestablish native shrubs, forbs and grasses in crucial deer winter range. In June 2012, the Range and North Schell fires burned approximately 15,000 acres on the west side of the Duck Creek Range and from the Muncy Creek drainage north on the east side of the Schell Creek Range. Some valuable deer habitat was lost, however much of the North Schell fire occurred in areas forested with P/J. Mule deer should benefit in the long-term. Population Status and Trend Population trend was downward between 2007 and 2011 due to the negative effects of climatic conditions on habitat which resulted in poor mule deer body condition, productivity and fawn recruitment. The population has increased slightly since 2011. Opportunities for larger gains in recent years have been dashed by the climatic events described above. This herd is considered to be below carrying capacity, outside of recent climate-related limiting factors. The near-average fawn recruitment observed the past 3 years has resulted in a slight upward trend. Units 114 – 115: Snake Range; Southeastern White Pine County Report by: Curt Baughman Survey Data In December 2013 a post-season herd composition survey was flown for the 2nd consecutive year. Flight time and area coverage was slightly greater than in 2012; however survey conditions were not as good. The sample of 466 deer had a composition of 47 bucks:100 does:49 fawns. The 2012 survey netted a sample of 658 deer with ratios of 39 bucks:100 does:48 fawns. The spring 2014 survey took place along with the elk and bighorn survey in early March. The sample of 448 deer had a composition of 26 fawns:100 adults, up slightly from the 2013 spring sample of 421 deer which yielded a ratio of 23 fawns:100 adults. Over-winter fawn loss was 21% during the past winter vs. 33% during the 2012-13 winter. The previous 10-year-average (2003-2012) spring
MULE DEER
15
sample has been 464 deer with fawn recruitment of 28 fawns:100 adults. Since 1975, fawn recruitment has averaged 31 fawns:100 adults for this unit-group. Habitat Please see the discussion of climatic conditions above for Unit-Group 111-113. Long-term habitat potential for mule deer is slowly declining due to encroachment of pinyon and juniper trees upward into mountain brush zones and downward onto bench areas. In some areas, recurrent drought has resulted in loss of native vegetation and expansion of cheatgrass and noxious weeds. Large-scale projects designed to control the encroachment of trees without imposing long-term impacts to shrub communities will be needed to reverse this trend. Great Basin National Park is developing plans to utilize prescribed fire to create openings in expansive areas of conifers, many of which hold the remnants of aspen stands that are being out-competed by conifers such as white fir. These actions could benefit mule-deer far into the future. Population Status and Trend This unit group has experienced below-average fawn recruitment in all but 4 years since 1999. The population trend was downward from 2001 to 2005 followed by some recovery between 2005 and 2007 and then another decline since that time. The negative climatic conditions described above were detrimental to mule deer survival and productivity, resulting in below-average fawn recruitment in all but one year between 2008 and the present. Two of these years witnessed recruitment rates among the lowest on record. Population trend over the past year was static to slightly downward. The combination of low deer density, conservative tag quotas, mediocre hunter success and the presence of the National Park in Unit 115 have resulted in a very high buck ratio in this unit group. Apart from the climate-related limiting factors of the past 6 years, this population is considered well below carrying capacity. The prospects for population expansion in the short-term are not bright unless weather patterns become favorable. In addition, approximately 53 mountain lions have been removed from the Snake Range by sportsmen and Wildlife Services since the beginning of 2009. This is a high rate of removal for this unit-group and should be achieving a better balance between the Snake Range lion population and ungulate resources. Unit 121: North Egan, Cherry Creek Ranges; White Pine and Elko Counties Report by: Scott Roberts Harvest Results The 2013 combined harvest of 244 deer (239 bucks, 5 does) represents the highest harvest level since 1992. The harvest of 4 point or better buck was 36%, which is significantly higher than the previous 10-year average of 29%. For specific 2013 hunting season results, please refer to Harvest Tables in the Appendix Section. Survey Data There was no post-season deer survey conducted in 2013. An aerial spring mule deer survey was conducted during March 2014. A sample of 1,467 deer was classified in Unit 121, yielding a ratio of 37 fawns:100 adults. The survey was marked by less than ideal conditions with low light conditions and high winds. Habitat The exceptional precipitation that was received in late summer/early fall of both 2012 and 2013 has produced spring-like range conditions with significant forage production. The deer herd has benefitted from the improved conditions and entered the past 2 winters in excellent shape. The Snow Creek Fire burned approx. 1,100 acres of mountain brush and mixed conifer on the south face of the Snow Creek drainage in Unit 121. As with past high elevation fires in this area the resulting burn scar should provide excellent deer summer range in coming years. Pinyon/Juniper (PJ) encroachment continues to plague a significant portion of this unit. Several large scale habitat enhancement projects are proposed in the near future. The Combs Creeks project has been approved to reduce or remove PJ on 7,000 acres of high quality
MULE DEER
16
habitat on BLM managed lands in the southern portion of Unit 121, with work beginning in 2014. This project will protect and enhance some of the most productive summer and winter range that Area 12 has to offer. Population Status and Trend This spring’s fawn ratio was slightly above the previous 10-year average and resulted in a slightly growing population. The planned enhancement of thousands of acres of summer, winter, and/or transitional range could allow for significant population growth in coming years. Units 131 - 134: Southern White Pine, Eastern Nye and Western Lincoln Counties Report by: Mike Podborny Survey Data The first post-season herd composition survey since 2010 was conducted in December 2013 by helicopter. There were 1,030 deer classified; yielding ratios of 36 bucks:100 does: 60 fawns. The survey was conducted during the rut with good snow at higher elevations. This was the highest fall sample obtained since 1988. In March 2014, a helicopter spring deer survey was conducted with 1,228 deer classified; yielding a ratio of 30 fawns:100 adults. There was very little snow during the spring survey but green-up had deer concentrated along the migration trail making them accessible for survey. The 2013 spring survey resulted in 1,711 deer classified with a ratio of 31 fawns:100 adults. The ten-year-average spring fawn to adult ratio was 33. Habitat Drought conditions existed during the first half of 2012 and 2013 which lasted until substantial August rains relieved the drought conditions in White Pine and Eastern Nye counties. Habitat conditions for deer improved before winter throughout this unit group. The lack of snow has resulted in springs going dry in many parts of the summer range for deer. The long-term quality and quantity of summer ranges are slowly being reduced by pinyon/juniper forests taking over brush zones thereby lowering the carrying capacity for mule deer. Since the summer of 2010, the Forest Service has hired crews with chainsaws to cut small pinyon and juniper trees encroaching into open grass and brush zones of the White Pine, Grant and Quinn Canyon Ranges. This project will be ongoing for several years and will prevent tree domination of some brush communities, maintaining their value for deer and other wildlife. Population Status and Trend The harvest of 341 bucks was the highest in this unit group since 1989 and quality remained high with 43% of bucks 4-points or better. The buck ratio obtained during the post-season survey was higher than expected even with the high buck harvest. The model was adjusted upward to account for the high buck ratio. The computer modeled population estimate was 3,900 deer. The recommended deer quota for 2014 will be based on a post-season buck ratio objective of 30 bucks:100 does. Units 141 - 145: Eureka and Eastern White Pine Counties Report by: Mike Podborny Survey Data The post-season composition survey was conducted in November 2013 by helicopter. A sample of 1,342 deer was classified yielding ratios of 28 bucks:100 does:49 fawns. In December 2012 the previous post-season survey was conducted with 1,386 deer classified yielding ratios of 30 bucks:100 does:51 fawns. In March 2014, a helicopter spring deer survey was conducted with 1,215 deer classified; yielding a ratio of 38 fawns:100 adults. The previous spring survey in 2013 resulted in 1,323 deer classified; yielding a ratio of 33 fawns:100 adults. In 2008 and 2009 the spring surveys resulted in near record low fawn:adult ratios of only 19:100 and 21:100 respectfully. The ten-year-average spring fawn recruitment was 30 fawns:100 adults.
MULE DEER
17
Habitat The first half of 2013 had below normal precipitation until August and September when significant rains in southern Eureka County relieved some drought affects. The southern portion of the Diamond Mountains and the Fish Creek Range received this monsoon moisture which improved range conditions during the fall. The Cortez Range (Unit 141) received little rain and was extremely dry for the second consecutive year and range conditions were poor. There were 982 trespass horses counted during the fall deer survey in the Cortez Range with only 115 deer classified. The high number of horses and continued drought are likely having a negative effect on deer and other wildlife in the Cortez Range. The Mt. Hope Mine began construction in January 2013 in Unit 143 but only minimal disturbance occurred as economic factors stopped construction. The BLM conducted a horse round-up in the Diamond Mountains in January 2013; removing 792 horses. Eureka County and the Eureka County Advisory Board to Manage Wildlife have organized crews with chain saws to cut pinyon and juniper trees on private range lands in the Diamonds and Roberts Mountains. The funding came from Eureka County, The Wildlife Heritage account and the NDOW Private Lands Program. The removal of horses should provide for a short term or immediate improvement of range conditions while the reduction of trees will benefit deer and other wildlife in the future. Population Status and Trend The spring fawn recruitment was above average in 2014 and should result in an increasing population trend. However, the post-season buck ratio of 28:100 was below the buck ratio objective of 32:100. This was the third year the observed ratio has been 4 to 6 points lower than expected. The population model has been adjusted downward to account for those lower than expected buck ratios negating the good spring fawn recruitment. The modeled population estimate for 2014 was 3,900 deer compared to 4,200 in 2013. Units 151, 152, 154, 155: Lander and Western Eureka Counties Report by: Jeremy Lutz Harvest Results There were 368 rifle buck tags (resident and nonresident) and 156 (Unit 152 and Unit 155) resident rifle antlerless tags available during the 2013 season. The buck tags represented a 60% decrease from the 2012 quota of 923 buck tags. Hunters harvested 222 bucks and 72 does from MA 15 during the 2013 hunting season. Four point or better bucks resulted in 31% of the harvest in 2013. Survey Data A fall helicopter survey was conducted in November 2013. A total of 1,468 deer was classified yielding a ratio of 24 bucks:100 does:40 fawns. This is the 2nd highest fall sample recorded for this management area. The fawn ratio was the second lowest observed since 1982. Adult deer appeared to be in poor condition once again. A spring helicopter survey was conducted in March 2014. A total of 671 deer was classified yielding a ratio of 20 fawns:100 adults. This was the second lowest observed fawn ratio since 1982. The resulting fawn loss was approximately 40%. Habitat Drought has plagued the Area 15 deer herd for the 3rd consecutive year and has resulted in limited growth of essential mule deer forage. Forbs, grasses and leader growth on mountain shrubs were essentially nonexistent. Deer were utilizing stream and riparian habitats by early summer as these areas offered the only succulent vegetation. Many springs and perennial streams were dry by August. Spring green-up in 2014 was spotty throughout Area 15 with large tracks of land being void of any vegetation. In June 2012, the Battle Mountain BLM signed a record of decision for the Battle Mountain District Drought EA. Due to the severity of range conditions attributed to the 2011-present drought, several thousand AUM’s of voluntary non-use has been, and will continue to be, implemented across much of Lander and Eureka counties.

MULE DEER
18
In 2013, the Battle Mountain BLM issued 2 grazing decisions within the district based on livestock non-compliance. The Battle Mountain range (Unit 151) and Bates Mountain (Unit 155) will be rested from livestock for the duration of the drought plus 1 growing season. The Argenta allotment is undergoing an evaluation which should result in improved range conditions. According to the National Drought Monitoring Index, Lander and Eureka Counties are within the severe to moderate drought category. The long-range drought monitoring forecast indicates north central Nevada will remain in this dry pattern. Population Status and Trend Deer went into the winter of 2013-2014 in poor condition; however, late summer rains offered some relief in the form of green-up that lasted throughout the winter. Due to the mild winter adult mule deer wintered well and very little adult mortality was documented; however, for the 2nd year fawn mortality was high with an estimated 40% fawn loss. This population will ultimately be regulated by the amount and timing of precipitation received in MA 15. During extended periods of drought this population will decline and will perform poorly. The lack of resilient habitat due to historical livestock use has exacerbated this population’s ability to rebound from drought conditions. Through continued female harvest this dramatic fluctuation can be moderated by bringing this population down to a more sustainable population which is more in balance with the carrying capacity. Units 161 - 164: North-Central Nye and Southern Lander and Eureka Counties Report by: Tom Donham Harvest Results 2013 was the seventh consecutive year of the Any Legal Weapon, Early/Late split season hunts in Management Areas (MA) 16 and 17. In 2007, the season changed from a single 23-day season to a split 16-day Early/Late season structure. The split season is intended to allow those hunters willing to deal with larger crowds and comparatively more difficult hunting conditions a greater chance of obtaining a deer tag on a regular basis, while at the same time offering a hunt later in the fall with significantly smaller crowds and cooler temperatures for those willing to wait longer between deer tags. Since the inception of the split hunt, the MA 16 Early Resident Any Legal Weapon season success has averaged 42%, while the Late Resident Any Legal Weapon season success has averaged 62%. During the same 7-year period, the average harvest percentage of 4-points or better during the early and late seasons has been 32% and 57%, respectively. Survey Data Aerial post-season composition surveys were conducted in MA 16 during early December 2013. During the survey, a total of 801 mule deer was classified as 157 bucks, 450 does, and 194 fawns. While observed fawn ratios indicate the herd experienced below average production in 2013, observed buck ratios signal that the male segment of the MA 16 mule deer population remains strong. Due to time constraints and conflicting survey responsibilities, the MA 16 spring deer survey was somewhat shortened in 2014. A total of 848 deer was classified as 681 adults and 167 fawns. The low observed fawn ratio (25 fawns:100 adults) indicates the MA 16 mule deer herd experienced depressed recruitment rates, due to drought, for the second consecutive year. In comparison, the 2013 spring composition survey saw a total of 734 animals classified as 594 adults and 140 fawns.
MULE DEER
19
Population Status and Trend The MA 16 mule deer population has remained relatively static for most of the past decade. Regularly occurring periods of drought, excessive feral horse numbers, aging of browse species, and increasing P/J densities have collectively managed to keep mule deer populations in central Nevada from experiencing any significant growth. More recently, three consecutive years of drought during the winter/spring period in central Nevada have resulted in two consecutive years of depressed production and recruitment of fawns. While monsoonal moisture received during the summer and early fall has helped to somewhat lessen the blow, overall habitat conditions continue to suffer. The MA 16 mule deer population is believed to be static to slightly decreasing due to recent reductions in fawn production and recruitment caused primarily by drought conditions. Units 171 - 173: Northwestern Nye and Southern Lander Counties Report by: Tom Donham Harvest Results The 2013 mule deer season represents the seventh consecutive year of the 16-day Early/Late split Any Legal Weapon season in Management Area (MA) 17. The split season is intended to allow those willing to deal with larger crowds and comparatively more difficult hunting conditions a greater chance of obtaining a deer tag on a regular basis, while at the same time offering a hunt later in the fall with significantly smaller crowds, and cooler temperatures for those sportsmen willing to wait longer between deer tags. Since the inception the split hunt, the Early Resident Any Legal Weapon season success has averaged 28%, while the Late Resident Any Legal Weapon season success has averaged 40%. During the same 7-year period, the average harvest percentage of 4-points or better during the early and late seasons has been 28% and 44%, respectively. Survey Data The 2013, MA 17, post-season aerial mule deer composition survey effort took place in early December. A total of 1,488 mule deer was classified as 285 bucks, 889 does, and 314 fawns. The noticeably low observed fawn ratio indicates the MA 17 mule deer population experienced depressed fawn production and recruitment rates in 2013, likely due to drought conditions. The observed buck ratio, however, indicates the buck segment of this herd remains strong. In comparison, the previous MA 17 post-season survey which took place in December 2012, saw a total of 1,611 mule deer classified as 313 bucks, 855 does, and 443 fawns. The 2014, MA 17, spring aerial composition survey was conducted in early-April. Due to time constraints and conflicting survey responsibilities, the survey was somewhat shortened. A total of 584 mule deer was classified as 467 adults and 117 fawns. The low observed fawn ratio indicates the herd experienced its second consecutive year of depressed production and recruitment. This is likely due to drought conditions experienced over the past three winter/spring periods in central Nevada. In comparison, the 2013 spring aerial composition survey saw a total of 576 mule deer classified as 456 adults, and 120 fawns. Population Status and Trend Consistent periods of drought have plagued central Nevada during most years over the past decade or more. This, along with various other factors, has resulted in very little overall growth of mule deer populations and a relatively static trend. More recently, drought conditions experienced over the past three winter/spring periods in central Nevada have resulted in two consecutive years of depressed production and recruitment of fawns. While some relief has come in the form of summer and fall monsoonal moisture patterns, overall, conditions continue to suffer.
MULE DEER
20
Due to reduced fawn recruitment, the MA 17 mule deer population is currently experiencing a static to decreasing trend. Units 181 - 184: Churchill, Southern Pershing, and Western Lander Counties Report by: Jason Salisbury Survey Data Post-season aerial composition surveys were conducted in January 2014. A total of 130 mule deer were classified as 28 bucks, 73 does, and 29 fawns yielding ratios of 38 bucks: 100 does: 40 fawns. Two and half hours were expended obtaining the above survey numbers. A small ground survey in March resulted in the classification of 84 mule deer; yielding a ratio of 29 fawns: 100 adults. Habitat Currently there is a lot of focus in the Desatoya Mountains for improving habitat for sage grouse which in turn benefits mule deer. The Desatoya Mountain’s habitat resiliency, health and restoration project aims to improve habitat and prevent any future habitat loss. Projects that have been identified include cutting 100% of pinyon and juniper from 17,400 acres and 20-75% of pinyon and juniper from 14,170 acres. Another goal is to keep feral horse numbers within AML. In 2012, the BLM started the process by removing a total of 433 feral horses out of the Desatoya Horse Management Area (HMA). The removal of these horses, especially on the top of the Desatoya Mountains, will help alleviate long term conflict between mule deer and feral horses for available water and forage. A pinyon juniper removal project in the Big Dens area was completed in 2012. This project utilized a mechanical masticator as well as ground crews to remove individual trees encompassing 2,700 acres of habitat. This project will enable the browse component to reestablish on the western slopes of the Desatoya Mountains. A follow up project entailing removal of small trees will be necessary in the future to insure the success of this project. In 2012, the Gilbert fire consumed more than 29,000 acres of the New Pass Range located in Unit 183. Most of the burn occurred in an old fire scar and will most likely recover on its own with perennial bunch grasses surviving the fire. On a positive note, the eastern side of Gilbert Creek burn was covered in a pinyon juniper canopy with strong bunch grass understory. The area was seeded by NDOW with four-wing salt brush strips. Additionally, the BLM seeded 2,500 acres in the Gilbert Creek Basin. Following post fire these areas will provide new habitat for mule deer to occupy where previously pinyon canopy hampered occupancy. Population Status and Trend The mule deer herd occupying Area 18 has remained reasonably stable over the long term. Consistent periods of drought have been a common occurrence over the past decade. The winter of 2013 was relatively mild and deer were able to spend a considerable time in the higher elevations throughout most of the winter. Also, important to mule deer, was the increased availability of green up in the form of grasses which was present and prevalent from December through spring. This should have afforded the population the ability to increase their nutritive intake during these lush conditions. The 2013 hunter data indicates that 32% of harvested bucks were four point or better with the ten year average being 37% four points or better. Although the overall four point or better data is down in 2013, it is comparative to what we are experiencing in neighboring management units like area 17.

MULE DEER
21
Unit 192: Carson River Interstate Herd; Douglas County Report by: Carl Lackey Survey Data Post-season survey flights were conducted in January 2014. Survey conditions were adequate but as expected, deer were difficult to locate due to the drought and resulting lack of snow that would concentrate the deer. Biologists classified 191 deer with a ratio of 18 bucks and 54 fawns:100 does. A spring flight in early April resulted in a classification of 143 deer with a ratio of 36 fawns:100 adults. Habitat There were no significant changes to the habitat in 2013 occupied by this deer herd. The majority of this herd uses the eastern slopes of the Carson Range as critical winter range, migrating from the Tahoe basin and Hope Valley summer range. Dry conditions persisted in 2013 and throughout this last winter. Precipitation that fell recently in late March has allowed for some green-up which the deer are utilizing. Population Status and Trend The modeled pre-hunt population estimate is between 900-1000 animals and it has been at this approximate level for the last several years. Survey and harvest data indicate this deer herd has probably maintained itself over the last few years, with adequate fawn recruitment rates and generally good age cohort distribution. NDOW and the University of Nevada, Reno continue to study this deer herd, providing survival rates, mortality data and migration information from over 100 collared deer. Unit 194, 196: Carson Range and Peavine Mountain Interstate Herd; Washoe and Carson City Counties Report by: Carl Lackey Survey Data Post-season survey flights were conducted in January 2014. Survey conditions were adequate but as expected, deer were difficult to locate due to the drought and resulting lack of snow that would concentrate the deer. Biologists classified 203 deer with a ratio of 12 bucks and 50 fawns:100 does. Spring flights were flown in April and resulted in the classification of 501 deer with a ratio of 37 fawns:100 adults. Habitat Housing development and the accompanying human recreation associated with it are the most important issues facing the Carson Front deer herds. There were no noteworthy fires or other catastrophic habitat changes in 2013 which would have had significant impacts on the landscape. As expected, drought conditions persisted through the spring and summer of 2013 that likely effected fawn recruitment, and body condition of deer entering the winter of 2013-14. This was noted in the lower spring recruitment rate. The majority of this herd uses the eastern slopes of the Carson Range as critical winter range, migrating from their Tahoe basin summer range. Population Status and Trend The 2013 modeled pre-hunt population estimate is around 1700 and it has been at this level for the last few years. Over the last few years this deer herd has appeared healthy with adequate fawn recruitment rates and generally good age cohort distribution. Despite this, the long-term trend in abundance is downward, mostly due to habitat loss and fragmentation. This unit remains a much desired area to hunt deer for locals and non-residents, with high success rates and good point-class distribution.
MULE DEER
22
Unit 195: Virginia Range Herd; Storey, Washoe and Lyon Counties Report by: Carl Lackey Survey Data Formal post-season and spring surveys have not been completed for Unit 195 since 2002. Habitat The majority of land in this unit is privately owned and a significant portion is being developed, commercially and residentially. The resulting fragmentation and loss of habitat, along with increased traffic on U.S 395 has decreased this once migratory herd to a resident herd. Population Status and Trend There is no modeled population estimate for this herd. The population estimate of 500 adult deer for this herd is derived from harvest statistics and is based upon total buck harvest. Deer are fairly common along the Truckee River corridor on mostly private lands. Significant portions of the unit contain monocultures of pinion-juniper and the deer in this unit spend a considerable amount of time in these pinion-juniper forests, making them hard to detect. Deer also seem to be fairly well distributed in the southern part of the unit near Jumbo Grade. Hunter success indicates an adequate number of deer for the tags sold. Units 201, 202, 204 – 208: Walker / Mono Interstate Deer Herd; Douglas, Lyon, and Mineral Counties Report by: Jason Salisbury Survey Data Post-season aerial surveys were completed by the Nevada Department of Wildlife in early January 2014 and resulted in the classification of 834 mule deer. This sample consisted of 131 bucks, 546 does, and 157 fawns for a ratio of 24 bucks: 100 does: 29 fawns. A spring ground survey was conducted by California Fish and Game in late March 2014 and resulted in the classification of 366 deer. This sample consisted of 326 adults and 40 fawns, yielding a ratio of 12 fawns: 100 adults. Habitat In 2013, the Spring Peak fire consumed over 14,000 acres in Nevada and California. In early fall 2013 the Nevada Department of Wildlife as well as the Forest Service conducted a field trip evaluating the fire’s aftermath. The Nevada Department of Wildlife determined it would conduct some sort of seeding effort concentrating on north facing slopes and some of the burned Pinyon pine canopy. It appeared that many of the perennial bunch grasses survived the fire and it is unknown at this time if any of the bitterbrush will crown sprout. Overall, the area should respond favorably following this fire and will enable the mule deer herd the ability to occupy Nevada during the summer time. Additionally 30,000-40,000 bitterbrush and sagebrush seedlings have been purchased that will go out on the ground in early fall. Population Status and Trend The winter of 2013 was mild therefore mule deer were found from 6,500 to 9,000 feet in mahogany tree zones spread over a large geographic area. The majority of deer for the West Walker herd did not even migrate into Nevada which is reflected in the low overall success for 4 point or better bucks. Hunt statistics for units 201-204 show the 10 year average for 4 point or better was 34% last year compared to a meager 19% this year. Currently the East and West Walker Mule deer herds are experiencing a decline in population trend. Consistent drought has plagued this herd resulting in low recruitment rates, which suggests that this herd could be
MULE DEER
23
exhibiting a density-dependent response due to limited resources. Mule deer are thought to be in poor body condition. This assumption is based on continued low fawn ratios. Biologists also believe that degraded summer range in California leaves mule deer in poor condition when entering winter. Research suggests that reducing competition for limited resources may enable this population to exhibit an upward growth trend following positive climatic conditions. One way to reduce competition is to introduce a management doe hunt which will allow biologists to access body condition. Body condition scoring information could then be utilized to evaluate carrying capacity of this interstate herd. Future habitat projects that address pinyon-juniper encroachment will allow for early seral brush communities to establish, improving the overall health of winter range. Improvements on winter range are important, but addressing habitat conditions on the California side is also needed to allow for a positive growth in the future. The 2013 population estimate is 4,800 animals. This reflects an 8% decrease in the overall population and is a result of low overall fawn recruitment into the population. Unit 203: Mason and Smith Valley Resident Herds; Lyon County Report by: Jason Salisbury Survey data Currently, no formal surveys have been conducted in Unit 203 for the last several years. Harvest information is used to derive the management of buck harvest. Population Status and Trend The Mason and Smith Valley mule deer herds are believed to be stable at this time. The 1331 any legal weapon hunt can be an indicator of stability. The 2013 overall hunter success rate was 57% respectively with 40% of the bucks as 4-point or better racks. The percentage of 4-point bucks is 7% above last year’s reported harvest but well within the past 10 year average of 35%. The best mule deer habitat within Mason Valley consists of alfalfa fields surrounded by buffalo berry and salt desert shrub communities. The MVWMA contributes the most to this mule deer herd in Mason Valley and serves as a sanctuary to the habitat fragmentation that surrounds it in the valley. The highest concentrations of deer exist in and around the Walker River corridor which provides thick stands of willows creating shelter and escape cover. Future plans for a new copper mine in Mason Valley will convert more brush land and farm land into housing tracts within Mason Valley. Further fragmentation of habitat within Mason Valley will not afford the population the ability to grow or expand. The Unit 203 herd occupies rural farm areas interspaced with housing tracts and single dwelling homes. The Mason Valley area over the last several years has converted many alfalfa farms into monocultures of varying agricultural produce. The increase in these types of agricultural practices will further hinder the mule deer herd within Mason Valley. Units 211, 212: Esmeralda County Report by: Tom Donham Survey Data Currently, no formal surveys are conducted in MA 21. Past survey efforts have not resulted in sufficient sample sizes for use in monitoring population dynamics. Population Status and Trend Based upon annual harvest data, random observations, and informal survey data, the MA 21 mule deer population appears to have remained static at comparatively low levels for quite some time. The consistent occurrence of drought over most of the past decade or more have kept mule deer populations in west central Nevada from showing any noticeable growth. In addition, conversion of sagebrush habitats to pinyon and
MULE DEER
24
juniper woodland, as well as the loss of productivity of browse species due to aging, has impacted the quantity and quality of available habitat. Aerial survey data gathered in adjacent Units indicate that fawn production and recruitment rates in 2014 were once again depressed due to continuing drought conditions. The same phenomenon is expected to have occurred throughout MA 21. Currently, the MA 21 mule deer population is considered to be static to decreasing in trend. Units 221 - 223: Northern Lincoln and Southern White Pine Counties Report by: Mike Scott Survey Data Post season aerial surveys were completed in December 2013 with a total of 1,465 deer observed. These were classified as 233 bucks, 834 does, and 398 fawns for a ratio of 28 bucks:100 does:48 fawns. Spring deer surveys were completed in March 2014 with a total of 852 deer observed. These were classified as 580 adults and 272 fawns which provides a ratio of 47 fawns:100 adults. The conditions during the spring survey were such that most of the deer were in transition to summer range and resulted in a lower-than-average sample. Habitat Habitat conditions are poor to fair throughout Area 22 as a result of below average precipitation. According to CEMP precipitation data, Lincoln County received just over 74% of the previous ten-year average of precipitation. Year-to-date totals, however, indicate that Lincoln County is only at about 59% of average for 2014. Multiple threats exist for mule deer throughout Area 22. Pinyon-Juniper forest continues to expand in both elevation and density into all seasonal ranges for mule deer. Although P/J provides thermal cover for mule deer, it reduces the understory and limits forage availability for deer. Fire suppression continues to allow dense P/J stands to remain undisturbed throughout large expanses in Area 22. Multiple off-road vehicle issues can increase stress for mule deer in Area 22. The Silver State Trail system, various motor vehicle races, and shed antler hunters use areas occupied by mule deer during winter and spring, increasing stress on animals at a difficult time of year. Wilderness areas prohibit projects that would benefit mule deer through vast acreages of Area 22. A solar energy zone is being proposed in Dry Lake Valley, adjacent to several crucial mule deer wintering areas. Feral horse numbers are excessive in some parts of the area, leading to decreased use of those areas by mule deer. And lastly, there is still a proposal to pipe water from places in Area 22 to southern Nevada. Despite all these challenges to the mule deer in Area 22, it still holds a fair number of mule deer, although they are not thriving. Population Status and Trend The population is estimated at approximately 4,100 adult animals. Unit 231: Wilson Creek Range; Northeastern Lincoln County Report by: Mike Scott Survey Data Post-season aerial surveys were completed in December 2013 and resulted in a total of 1,239 deer observed. These were classified as 168 bucks, 729 does, and 342 fawns which provides a ratio of 23 bucks:100 does:47 fawns. Post-season flights were conducted well after the peak of the rut, which results in lower than normal buck ratios due to bucks no longer being in attendance with does.
MULE DEER
25
Spring deer surveys were completed in March and April 2014 and resulted in a total of 1,163 deer observed. These were classified as 813 adults and 350 fawns which provides a ratio of 43 fawns:100 adults. Habitat Habitat conditions are poor to fair throughout Area 23 due to lower-than-average precipitation during 2013 and early 2014. Heavy precipitation fell during September 2013, which resulted in good habitat conditions during the fall of 2013. Deer likely went into winter in good condition due to the timing of this precipitation. According to CEMP, Lincoln County received just 74% of average annual precipitation during 2013 and is only at 59% thus far in 2014. Landowners in Area 23 encourage mule deer to utilize alfalfa and other agricultural lands in late fall and early winter and thus receive landowner compensation tags. Having this feed available probably helps those deer that utilize agricultural fields to enter the winter in better condition. Mule deer habitat is Area 23 is threatened by continued invasion of Pinyon and Juniper into both upper and lower elevations, as well as increasing in density in areas already invaded. Fire suppression efforts in dense P/J forest result in continued stagnation of large expanses of degraded habitat. Excessive numbers of feral horses continue to result in degraded habitat and water sources, with no outlook for any relief. Large numbers of shed hunters continue to place added stress on mule deer and other wildlife in late winter and early spring. Although the added stress may not adversely affect deer numbers, there may be other indirect effects from increased stress during the late winter. Various other threats to mule deer habitat exist throughout Area 23, but are lesser threats than continued P/J invasion Population Estimates and Trend The population is similar to last year with the 2013 population estimate of 3,300 adult mule deer. Units 241 – 245: Clover, Delamar, and Meadow Valley Mountain Ranges; Lincoln County Report by: Mike Scott Survey Data Post-season aerial surveys were completed in December 2013 and resulted in a total of 519 deer observed. These were classified as 85 bucks, 258 does, and 176 fawns which yields a ratio of 33 bucks:100 does:68 fawns. Spring surveys were completed in April 2014 and resulted in a total of 106 deer observed. These were classified as 76 adults and 30 fawns which provides a ratio of 39 fawns:100 adults. Spring surveys were conducted too late to provide any meaningful data, as the deer had largely left the winter ranges and were likely in transition to summer range. Habitat Habitat conditions are poor to fair throughout most of Area 24 due to lower-than-average precipitation during 2013 and early 2014. According to CEMP, a total of 74% of the previous 10-year average precipitation was received during 2013. Thus far in 2014, only about 59% of average precipitation has fallen. Although mule deer exist in all units of Area 24, the bulk of mule deer habitat is found in units 241 and 242. In the Clover Mountains of unit 242, Pinyon and Juniper densities are such that mule deer habitat is limited by lack of understory. The highest densities of deer are found in areas which have either burned or been chained. Many deer are also found near private agricultural land as well. The Delamar Mountains of unit 241 also contain mule deer in somewhat lower densities. Many of these deer are also found associated with areas that burned about a decade ago. Although some large fires have burned in both of these units in the past, vast areas of dense, closed-canopy Pinyon-Juniper exist in both areas. Feral horses exist in both units 241 and 242 in very high densities. These are both areas that have been declared horse-free by BLM and had the AML set at zero. A proposal for a new large powerline down through the Clover Mountains has the potential to bring increased development and traffic into that area.
MULE DEER
26
Population Estimates and Trend The 2014 population estimate is 860 adult animals. Units 251-253: South Central Nye County Report by: Tom Donham Survey Data Presently, neither post-season nor spring surveys are conducted in these units. The last survey conducted was in 1998 and failed to yield a sufficient sample for analysis. Population Status and Trend Management Area 25 (MA 25) has limited amounts of good quality mule deer habitat. The greatest amount and best quality habitat, and therefore the majority of the deer population in MA 25 occurs in Unit 251. Due to regularly occurring drought periods, impacts from excessive numbers of feral horses, pinyon-juniper expansion, and senescence of browse species, the mule deer population in Unit 251 has remained static at relatively low numbers for some time. The past three winter/spring periods have been plagued by drought, and wildlife habitats and the species that depend on them have suffered. Aerial survey data gathered in adjacent Units indicate that fawn production and recruitment rates in much of central Nevada in 2014 were noticeably depressed for the second consecutive year. This situation is expected to have impacted mule deer in MA 25 as well. Due to depressed fawn production and recruitment, and continuing impacts to habitat, the MA 25 mule deer population is currently experiencing a static to decreasing trend. Units 261 – 268: Clark and Southern Nye Counties Report by: Pat Cummings Survey Data The majority of the mule deer in Management Area 26 inhabit the Spring Mountains (Unit 262). Mule deer occur in low densities in the Newberry Mountains, Crescent Peak and southern portion of the McCullough Range. Overall, mule deer habitat is marginal; consequently, deer densities are low and below levels that warrant annual or periodic aerial surveys. The lack of composition data precludes development of a useful model that would demonstrate herd population dynamics and generate population estimates. Habitat Management Area 26 is in proximity to Las Vegas and other growing cities. Recreational pursuits that include OHV and mountain bike use and the resultant proliferation of roads and trails coupled with suburban sprawl, serve to degrade mule deer habitat. In the Spring Mountains, mule deer habitat is also impacted by feral horses and burros. On 1 July 2013, the Carpenter 1 Fire was ignited by lightning. The fire consumed vegetation across 27,869 acres. The 43.5-square-mile fire consumed plants within several vegetative associations along a 5,560’-elevation gradient. Mule deer summer and winter ranges were impacted in Trout Canyon, Lovell Canyon, Harris Springs Canyon and Kyle Canyon. In June 2004, the Humboldt-Toiyabe National Forest issued a Decision Notice and Finding of No Significant Impact for Spring Mountains National Recreation Area Motorized Trails Designation Project. The decision to implement alternative 5 (with modifications) as summarized in the respective Environmental Assessment involves minimal closure of newly established roads. Thus, the recently authorized management prescription for motorized trails ensures the status quo for the foreseeable future.
MULE DEER
27
Population Status and Trend Precipitation receipts in 2012 exceeded normal due to an active monsoon season. However, environmental conditions in 2013 and early 2014 range from fair to good due to limited winter and spring storms. Moisture receipts in the first quarter of 2014 were below average, and the likelihood for an overall dry year appears high. In the seasonal drought outlook valid for late March through June 2014, the National Weather Service forecasted drought conditions to persist or intensify. Based on environmental conditions, it is reasoned the mule deer population in Management Unit 262 is stable. Units 271, 272: Southern Lincoln and Northeastern Clark Counties Report by: Mike Scott Survey Data No mule deer surveys were conducted in Units 271 or 272 during the reporting period. Mule deer densities are low enough that standard surveys do not result in enough data for analysis. The harvest strategy is based on hunter demand and success. Habitat Mule deer habitat is limited in Area 27. Although better mule deer habitat is found in the Virgin Mountains, it is still a low density mule deer area. Both units are within Mojave Desert ecotypes with Pinyon/Juniper found at higher elevations. Water is very limited and mule deer are generally found in areas not far from water, at least during the warmer times of the year. Below-average precipitation during 2013 and early 2014 will likely result in poor to fair habitat conditions in Area 27. Unit 291, Pinenut Mountain Herd: Douglas County Report by: Carl Lackey Survey Data No formal surveys were conducted in this unit. General observations and anecdotal reports indicate that this herd is stable over the short-term but has declined significantly over the long-term. Habitat Loss of brush communities over the long-term in this unit continues to keep the deer population at low levels. Expansion of the pinion forest over the past few decades, increased human recreational activity and increased urbanization on the perimeter with corresponding traffic have all contributed to loss of habitat and the decline of mule deer in Unit 291. Significant portions of the unit contain monocultures of pinion-juniper, much of which is dead. Habitat improvement projects have been recommended to reduce the pinion-juniper coverage, yet short of a catastrophic habitat regime change affecting thousands of acres, the deer herd will likely not increase significantly in numbers. Fortunately a catastrophic fire occurred in July of 2013. The Bison Fire burned over 24,000 acres in the southern Pinenuts and extending several miles up the eastern flank from Smith Valley to Big Meadows. Overall this fire was seen as a positive because it burned several thick pinion-juniper stands. Fire rehab took place in late 2013 and early 2014 but only a fraction of the burned area was treated. NDOW and the BLM are conducting habitat treatment on several riparian areas under the Pinenut Health Project funded in part by Habitat and Upland Game stamp funds. Population Status and Trend There is no modeled population estimate for this herd. This population is believed to be stable, but has the potential to increase under more ideal habitat conditions. Many of the deer, particularly in the northern part of the management area, are resident deer. The 2013 population for Area 29, estimated at 500-700 adult animals, based on buck harvest, is well below the historic levels recorded for the Pinenut Mountains.
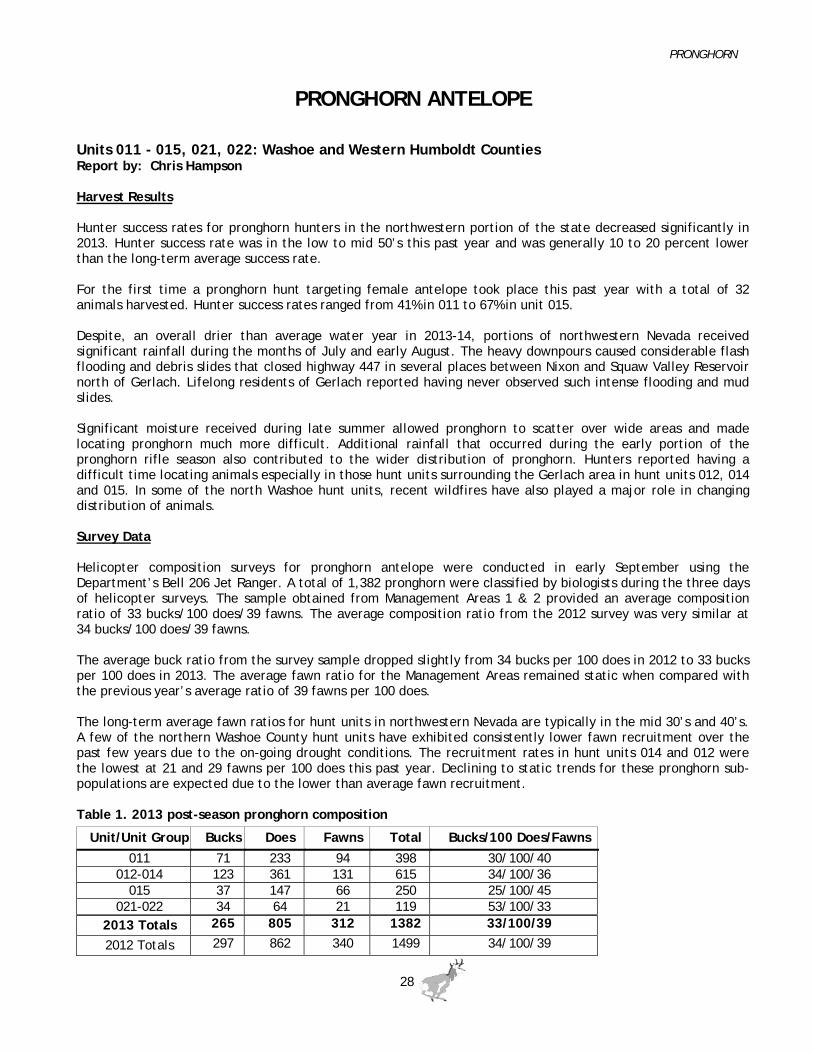
PRONGHORN
28
PRONGHORN ANTELOPE Units 011 - 015, 021, 022: Washoe and Western Humboldt Counties Report by: Chris Hampson Harvest Results Hunter success rates for pronghorn hunters in the northwestern portion of the state decreased significantly in 2013. Hunter success rate was in the low to mid 50’s this past year and was generally 10 to 20 percent lower than the long-term average success rate. For the first time a pronghorn hunt targeting female antelope took place this past year with a total of 32 animals harvested. Hunter success rates ranged from 41% in 011 to 67% in unit 015. Despite, an overall drier than average water year in 2013-14, portions of northwestern Nevada received significant rainfall during the months of July and early August. The heavy downpours caused considerable flash flooding and debris slides that closed highway 447 in several places between Nixon and Squaw Valley Reservoir north of Gerlach. Lifelong residents of Gerlach reported having never observed such intense flooding and mud slides. Significant moisture received during late summer allowed pronghorn to scatter over wide areas and made locating pronghorn much more difficult. Additional rainfall that occurred during the early portion of the pronghorn rifle season also contributed to the wider distribution of pronghorn. Hunters reported having a difficult time locating animals especially in those hunt units surrounding the Gerlach area in hunt units 012, 014 and 015. In some of the north Washoe hunt units, recent wildfires have also played a major role in changing distribution of animals. Survey Data Helicopter composition surveys for pronghorn antelope were conducted in early September using the Department’s Bell 206 Jet Ranger. A total of 1,382 pronghorn were classified by biologists during the three days of helicopter surveys. The sample obtained from Management Areas 1 & 2 provided an average composition ratio of 33 bucks/100 does/39 fawns. The average composition ratio from the 2012 survey was very similar at 34 bucks/100 does/39 fawns. The average buck ratio from the survey sample dropped slightly from 34 bucks per 100 does in 2012 to 33 bucks per 100 does in 2013. The average fawn ratio for the Management Areas remained static when compared with the previous year’s average ratio of 39 fawns per 100 does. The long-term average fawn ratios for hunt units in northwestern Nevada are typically in the mid 30’s and 40’s. A few of the northern Washoe County hunt units have exhibited consistently lower fawn recruitment over the past few years due to the on-going drought conditions. The recruitment rates in hunt units 014 and 012 were the lowest at 21 and 29 fawns per 100 does this past year. Declining to static trends for these pronghorn sub-populations are expected due to the lower than average fawn recruitment. Table 1. 2013 post-season pronghorn composition
Unit/Unit Group Bucks Does Fawns Total Bucks/100 Does/Fawns
011 71 233 94 398 30/100/40 012-014 123 361 131 615 34/100/36
015 37 147 66 250 25/100/45 021-022 34 64 21 119 53/100/33
2013 Totals 265 805 312 1382 33/100/39
2012 Totals 297 862 340 1499 34/100/39
PRONGHORN
29
Habitat Severe summer thundershowers during the month of July caused unprecedented flash flooding across many areas of Washoe County. The significant rainfall events caused mud and debris slides that closed portions of highway 447 between Pyramid Lake and Squaw Creek Reservoir. Other areas throughout the northwestern portion of the state also received heavy precipitation. The rainfall, although destructive in terms of the flashfloods, provided much needed moisture to most areas in Washoe and western Humboldt Counties. Warm temperatures and mild conditions continued into mid-November 2013. Temperatures approached 70 degrees during the middle portion of the month. Finally, in late November and early December, successive storm fronts had covered much of northwestern Nevada with 4 to 12 inches of snow. Accumulations were not significant but several weeks of cold temperatures and inversions allowed the snow to remain in both valley and mountain locations through mid-December. Unfortunately, dry and warmer than normal conditions returned and little to no precipitation was received during the latter half of December and in the month of January. Limited precipitation during the months of February and March provided only a slight benefit to the overall water supply outlook. Most basins were measured at between 50 and 70 percent of average for total snow accumulations and total precipitation received as of 15 March 2014. No major wildfires occurred within Management Area 1 this past year. However, in 2012, two major wildfires burned approximately 95,000 acres within hunt units 012, 013 and 015 in Nevada. The Rush Fire also burned an additional 300,000 acres of habitat in California hunt unit X5B which lies to just to the west of hunt unit 015. The Lost Fire burned approximately 50,000 acres between the eastern side of Cherry Mountain (unit 013) and High Rock Canyon (Unit 012). Both of the fires destroyed a significant amount of pronghorn, mule deer and sage grouse habitat. In Management Area 2 a lightning caused wildfire on Seven Lakes Mountain burned over 5,300 acres in July 2013. The fire burned in the same general area of the 2009 Trailer 1 Fire and the Gooseberry Mine Fire that burned in 2008. This recent wildfire unfortunately consumed areas that had been rehabilitated following the 2008 and 2009 wildfires. Population Status and Trend Severe drought conditions have negatively impacted pronghorn populations in the northwestern portion of the state. Water availability was poor this past summer and many upper elevation lakebeds and spring sources went dry by mid-summer 2013. Due to the lack of precipitation received this past fall and winter, water availability and forage quality is expected to once again be poor by the summer of 2014. Fawn recruitment has been lower than average or in some cases has been below or near maintenance levels for several consecutive years. Population estimates for most herds in the northwestern portion of the state have been downgraded due to the ongoing drought conditions and loss of habitat due to recent wildfires. Recommended quotas will mimic population trend for the various sub-populations. Units 031, 032, 034, 035, 051: Humboldt County Report by: Ed Partee Survey Data Post-season aerial composition surveys were conducted in Management Areas 3 and 5 during mid September 2013. The overall number of antelope observed during surveys this past year declined from what has been observed in recent years. Recent large scale wildfires have reduced or changed habitat conditions to the point that pronghorn are not utilizing traditional use areas. Pronghorn that were located were found in small groups. All units within Management Area 3 and 5 exhibited declines in the total number of animals observed. Overall there were approximately 250 less pronghorn observed in Humboldt County when compared to 2012 survey numbers.
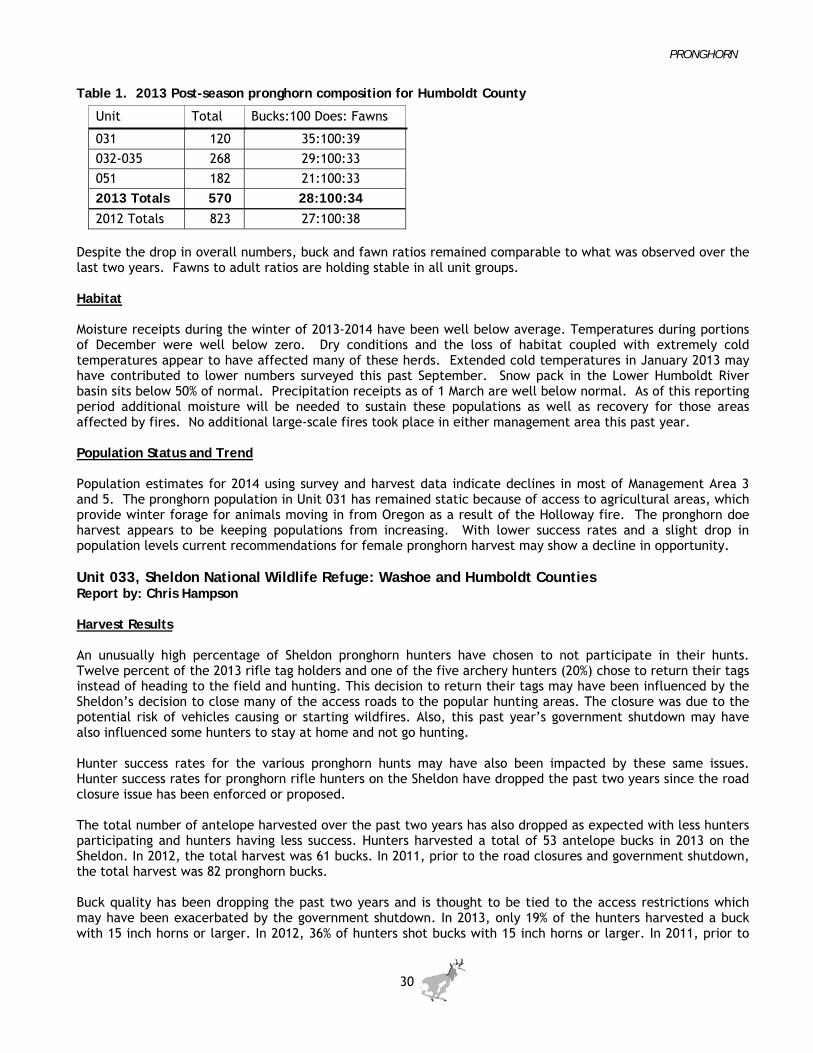
PRONGHORN
30
Table 1. 2013 Post-season pronghorn composition for Humboldt County
Unit Total Bucks:100 Does: Fawns
031 120 35:100:39
032-035 268 29:100:33
051 182 21:100:33
2013 Totals 570 28:100:34
2012 Totals 823 27:100:38 Despite the drop in overall numbers, buck and fawn ratios remained comparable to what was observed over the last two years. Fawns to adult ratios are holding stable in all unit groups. Habitat Moisture receipts during the winter of 2013-2014 have been well below average. Temperatures during portions of December were well below zero. Dry conditions and the loss of habitat coupled with extremely cold temperatures appear to have affected many of these herds. Extended cold temperatures in January 2013 may have contributed to lower numbers surveyed this past September. Snow pack in the Lower Humboldt River basin sits below 50% of normal. Precipitation receipts as of 1 March are well below normal. As of this reporting period additional moisture will be needed to sustain these populations as well as recovery for those areas affected by fires. No additional large-scale fires took place in either management area this past year. Population Status and Trend Population estimates for 2014 using survey and harvest data indicate declines in most of Management Area 3 and 5. The pronghorn population in Unit 031 has remained static because of access to agricultural areas, which provide winter forage for animals moving in from Oregon as a result of the Holloway fire. The pronghorn doe harvest appears to be keeping populations from increasing. With lower success rates and a slight drop in population levels current recommendations for female pronghorn harvest may show a decline in opportunity. Unit 033, Sheldon National Wildlife Refuge: Washoe and Humboldt Counties Report by: Chris Hampson Harvest Results An unusually high percentage of Sheldon pronghorn hunters have chosen to not participate in their hunts. Twelve percent of the 2013 rifle tag holders and one of the five archery hunters (20%) chose to return their tags instead of heading to the field and hunting. This decision to return their tags may have been influenced by the Sheldon’s decision to close many of the access roads to the popular hunting areas. The closure was due to the potential risk of vehicles causing or starting wildfires. Also, this past year’s government shutdown may have also influenced some hunters to stay at home and not go hunting. Hunter success rates for the various pronghorn hunts may have also been impacted by these same issues. Hunter success rates for pronghorn rifle hunters on the Sheldon have dropped the past two years since the road closure issue has been enforced or proposed. The total number of antelope harvested over the past two years has also dropped as expected with less hunters participating and hunters having less success. Hunters harvested a total of 53 antelope bucks in 2013 on the Sheldon. In 2012, the total harvest was 61 bucks. In 2011, prior to the road closures and government shutdown, the total harvest was 82 pronghorn bucks. Buck quality has been dropping the past two years and is thought to be tied to the access restrictions which may have been exacerbated by the government shutdown. In 2013, only 19% of the hunters harvested a buck with 15 inch horns or larger. In 2012, 36% of hunters shot bucks with 15 inch horns or larger. In 2011, prior to

PRONGHORN
31
the shutdown and restrictions were put in place on the Sheldon, 55% of the hunters harvest bucks that had at least 15 inch horns. Survey Data Approximately 2.5 hours of survey effort were expended using the Departments 206 Bell Ranger helicopter. The post-season composition surveys took place on September 4, 2013 and resulted in the classification of 455 pronghorn. The average ratio for the sample was 37 bucks/100 does/35 fawns.
The average buck ratio remains strong on the Sheldon and continues to be higher in the more remote locations where access to hunting by vehicle is more difficult. Fawn ratios were once again only slightly above maintenance levels and were 5 fawns per 100 does higher this year than in 2012. Recruitment levels have remained near maintenance levels the past several years on the Sheldon due to the long-term drought conditions. Water sources on many of the major pronghorn summer ranges continue to go dry by mid to late summer. This was a fairly rare occurrence a decade or more ago. Habitat Habitat conditions on the Sheldon improved dramatically in 2011-12 following a very wet and productive winter and spring. However, since that time very dry conditions have returned and the past two winters have been below normal. The winter of 2013-14 has been very dry in the Northern Great Basin as of mid-March 2014 and total precipitation was only 63% of average. The Sheldon moisture conditions are even more concerning, at just 43% of average for this same period. Significant moisture is needed in March and April in order to offset the drier than normal winter. Habitat conditions may continue to worsen if precipitation receipts do not improve over the late winter and spring. Fawn recruitment has suffered over the past several years under these same types of conditions. Current stream flow projections are forecasting well below average runoff for this coming spring. Horse and burro gathers are once again planned for the summer/fall of 2013. USFWS personnel on the Sheldon plan to remove over 400 horses and burros. Riparian conditions will continue to improve as horse numbers are brought under control. NDOW warns hunters that issues or conflicts may occur while hunting on the Sheldon by including a pop-up box that alerts the hunters of the pending horse gathers during the on-line application process. Population Status and Trend Pronghorn recruitment on the Sheldon has been near or slightly below maintenance levels over the past 7 years. The population continues to experience decreasing trends primarily due to the long-term drought conditions. Buck quality and buck numbers remain strong within the Sheldon pronghorn population. Hunters should continue to experience quality hunting on the Sheldon but may encounter conflicts because of ongoing horse captures. Quota recommendations for 2014 will reflect the slightly decreasing population trend. Units 041, 042: Western Pershing and Southern Humboldt Counties Report by: Kyle Neill Survey Data In this unit group ground surveys were traditionally performed in late September to early October. However, the 2013 post-season survey was conducted in late January to early February 2014. This delayed survey effort was necessary due to change in season structure to accommodate a new two week long hunt in September which targets doe antelope. Additionally, the 2013 composition survey timeframe was selected so as not to interfere with deer and upland game hunters whose seasons occur after the late 2151 hunt. Antelope proved difficult to locate during this time period due to lack of dependence on water sources and the expansive winter range that exists within the unit group. Results from the late January to early February survey are summarized in Table 1.

PRONGHORN
32
Table 1. Pronghorn composition survey results for Units 041 and 042.
Year Bucks Does Fawns Total Bucks:100 Does:Fawns
2012 152 433 145 730 35/100/33
2013 28 80 17 125 35/100/21 5-year average 114 309 132 555 37/100/43
The post-season buck ratio of 35 bucks/100 does remains near the harvest objective. The fawn ratio has declined for the second straight year and is well below the five-year and long-term averages. Habitat Intense summer rains resulted in numerous washouts within the unit group. Spring sources that suffered damage from these storms included Sage Hen Spring. However, the permitee completely rebuilt this water source adding three stock tanks to keep up with increased demand from feral horses and burros. Feral horse and burro numbers within the unit group continue to be substantially over their Appropriate Management Level (AML). The Bluewing-Seven Troughs Allotment, which encompasses Unit 041 and some of Unit 042, is made up of five BLM Horse Management Areas (HMAs) named Bluewing Mountains, Nightingale Mountains, Selenite Range, Seven Troughs Range and Kamma Mountains. In 2014, BLM-Winnemucca Office estimated the feral horse population within these HMAs at approximately 930 and the burro population to be approximately 170. BLM’s AML for these HMAs is 200-330 feral horses and 45-75 burros, which equates to approximately 368% to 182% over AML for feral horses and approximately 280% to 131% over AML for burros. However, the BLM did remove 203 horses from the Bluewing-Seven Troughs Allotment in the summer of 2013. For 2014, BLM-Winnemucca has no plans for any horse or burro gathers within Units 041,042. Anecdotally, there continues to be an observation of habitat destruction from out of state dirt bike enthusiasts. Areas where damage has been documented include Toulon Area/Trinity Range, Stonehouse Canyon/ Nightingale Range and the Sahwave Mountains. Population Status and Trend Since 1990, this herd of pronghorn antelope has exhibited an increasing trend. However, 2014 marks the first year that this population has shown a decline. Currently, western Pershing County’s antelope population is estimated to be near 1,700 animals which represent a 7% decline from what was reported last year. Since 2007, hunters who harvested antelope bucks were asked to provide horn length as part of their questionnaire data. Harvest data since 2007 show that 42% of the bucks harvested in Hunt Units 041,042 had horn lengths of 15 inches or longer. Harvest results from 2013 indicate that of the 139 bucks measured, 32% had horn lengths of 15 inches or longer. The 2013 statewide average indicates 24% of the total bucks harvested had horn lengths of 15 inches or longer. Overall, biologists believe that future population growth will be limited by available water sources supplying enough water to antelope during the July-September timeframe. Units 043 - 046: Eastern Pershing and Southern Humboldt Counties Report by: Kyle Neill Survey Data Eastern Pershing County’s antelope survey was conducted in early February 2014. This survey has been performed during the winter months for the last four years. A total of 108 animals was classified as 44 bucks:100 does:25 fawns. The buck ratio remains strong and near its average, while the fawn ratio is substantially below average and will not provide for herd growth.
PRONGHORN
33
Habitat Several wildfires occurred last year in the northern portion of Unit 044, East Range, BLM’s White Horse Allotment. These include the Dun Glen, Raspberry and Cosgrave Fires. The Dun Glen Fire burned 335 acres. Rehab included drill seeding 160 acres with big sagebrush, Sandberg’s bluegrass, spiny hopsage and Indian rice grass. The Raspberry Fire burned 685 acres and 337 acres were aerial seeded with big sagebrush and Sandberg’s bluegrass. A total of 556 acres burned on the Cosgrave Fire. BLM aerial seeded approximately 100 acres with big sagebrush and Sandberg’s bluegrass. Both the Raspberry and Cosgrave areas previously burned in 1999. Overall, antelope should respond positively to these burned areas. Population Status and Trend Eastern Pershing County’s pioneering antelope herd continues to expand into new areas. Field and hunter observations from this past year indicate an increased number of antelope sightings in all units. Antelope use on agricultural fields has also continued and compensation tags have been given out for private land agricultural areas within Unit 044 for the past two years. Currently, this herd’s population trend is considered static. Primary use areas in Unit 043 are around Lovelock Prison/Coal Canyon Road to Dago Pass turnoff, Limerick Canyon and Coyote Canyon north to Creek Hill. Areas of use in Unit 044 are Dun Glen Flat, Table Mountain, Willow, Inskip, Milch, Reed and Spaulding Canyons. Areas of antelope distribtuion in Unit 045 include the base of Miller Basin north to Pollard Canyon on the west side of the Tobin Range and the base of Morning View Canyon to the base of Flag Canyon. In Unit 046 antelope use occurs around Pole Creek/Kramer Hill, east side of Edna Mountains and Smesler Pass. Occasionally, antelope are observed on the west side of the Sonoma Range near the base of Clearwater Canyon. Units 061, 062, 064, 071, 073: North Central Elko County Report by: Matthew Jeffress Survey Data A ground survey was conducted in the 061-073 unit group in September of 2013. A sample of 931 pronghorn was counted; yielding ratios of 32 bucks:100 does:49 fawns. The sample size was the 2nd largest ever obtained. The fawn ratio was higher than last year and was above the 10-year average (Table 1). Table 1. Observed buck ratios, fawn ratios and sample size for pronghorn in Units 061-073.
Parameter 2013 2012 2003-2012 Average
Bucks:100 does from fall surveys 32 40 43
Fawns:100 does from fall surveys 49 42 48
Sample size from fall surveys 931 848 659
Habitat Below-average snowpack and below-average spring precipitation made for a second consecutive dry summer. Range conditions remained dry through the year with sporadic precipitation events realized in late summer and early winter. As of early March 2013, the snowpack for northern Elko County was 62% of normal. Of great concern was the high utilization of riparian areas and herbaceous vegetation on the BLM portion of the Saval Bench. The Marsh Creek Bench continues to provide excellent spring, summer and fall habitat for pronghorn. Much of this success can be attributed to highly successful range restoration efforts following the 2006 Snow Canyon Fire. Population Status and Trend The mild winter likely lead to high overwinter survival with pronghorn observed returning to summer ranges in late February. The higher than average fawn ratios may be a tribute to the fact this herd is being managed well
PRONGHORN
34
below the carrying capacity of the summer range. The low buck ratio is likely a product of low fawn recruitment the past 2 years. Last year the pronghorn population was at the estimated carrying capacity of the winter range. Doe and buck harvest during the 2013 hunting season worked to keep the herd at a sustainable level. Harvest recommendations will remain focused on keeping the southern pronghorn population within the confines of the unit group’s winter carrying capacity of approximately 1,100. It is necessary to gain a better understanding of the number of pronghorn using BLM administered lands on the northern portions of GMU’s 061 and 071. Since the 2007 Murphy Fire, this portion of the population has continued to grow and continues to offer great opportunities for hunters. Units 065, 142, portion of 144: Southern Elko County, Northern Eureka County Report by: Scott Roberts Harvest Data This was the first year there were tags available for doe antelope in Units 065 and 142, and also marked the return of doe hunt in the Eureka County portion of Unit 144. After assessing the effectiveness of these 2 hunts it was determined that they will be combined for the 2014 season. It was also the first year that there was a muzzleloader hunt offered for this unit group. Though limited, it did provide a few hunters the opportunity to pursue pronghorn in late September. Survey Data A ground survey was conducted in November of 2013. The survey concluded with a total of 272 antelope being classified with age and sex ratios of 70 bucks:100 does:49 fawns. The survey was marked with unseasonably warm weather that led to sporadic pronghorn distribution. Only a small portion of Unit 142 was surveyed and minimal portions of Unit 144. The resulting fawn ratio was surprisingly high when accounting for the poor range conditions following 2 dry summers and heavy annual use by livestock. Habitat The US Drought Monitor Index has this entire area classified as exhibiting moderate to severe drought conditions. These dry conditions have led to significantly lower production of grasses and forbs the past 2 summers throughout the unit group and have led to greater competition for the limited resources. Drought conditions were most evident in lower elevation sites that have burned in the past 15 years. In February, 2014 the Elko BLM released a district wide Environmental Assessment (EA) to address the Management and Mitigation for Drought Impacted Rangelands (BLM website). The implementation of the management measures outlined in the EA will be paramount in protecting the stressed and compromised habitat on public lands throughout the unit group. Population Status and Trend The population estimate in this unit group is slightly higher than the previous year and is a direct result of the strong fawn ratio. All assessed variables (success rates, horn length, and observed buck ratio) for the buck hunt in this unit group continue to be significantly higher than the statewide averages. These indices illustrate that this pronghorn herd continues to provide hunters with a high quality pronghorn hunt. The high buck ratio that has been observed in this unit group recently will facilitate increases in recommended tag quotas.
PRONGHORN
35
Unit 066: Owyhee Desert; Northwestern Elko County Report by: Matthew Jeffress Survey Data No surveys were conducted in 2013. Long term averages were used for recruitment values. Habitat No large landscape scale changes occurred in 2013. Since 1995, 7 big game water developments have been constructed on the 066 portion of the Owyhee Desert. The addition of perennial water sources has had little effect on increasing the Owyhee Desert portion of the population. Several guzzlers are slated for upgrades or complete rebuilds this summer. Vast expanses of winter range are available on the eastern portion of the unit; however degraded winter range along the southern and western portions of the Snowstorms has limited the winter carrying capacity of this herd. Increases in mining exploration across the Snowstorm Mountains and wintering grounds south of Chimney Reservoir in Humboldt County have been observed in recent years. The impacts of such activities to pronghorn are not fully understood. A feral horse gather was conducted during the winter of 2012/2013 in an effort to reduce Owyhee Complex horse numbers in both Elko and Winnemucca BLM districts. A total of 808 horses were removed from the Little Humboldt HMA. The pre-gather estimate of 1,097 horses was well above the AML for the Little Humboldt HMA of 197 to 298 horses. The reduction should alleviate constraints on vegetative resources within the Little Humboldt HMA. Greater than 500 horses occupy the area between the Dry Hills and Snowstorms. Many of these horses are outside set HMA’s. An emergency gather to remove excess horses from this area was canceled last summer. Population Status and Trend The population estimate for pronghorn within Unit 066 is slightly lower than last year’s. The 2013 harvest rates remained stable with a 74% success rate for the general buck season. Given the majority of pronghorn within this unit group reside in the Snowstorm Mountains, the limited availability of winter range on the western portion of the unit and competition for limited resources with the Unit Group 067-068 pronghorn on harsh winters, NDOW initiated a horn shorter than ears hunt for 2013. Units 067, 068: Western Elko and Northern Lander and Eureka Counties Report by: Matthew Jeffress Survey Data A ground survey was conducted in February 2014. A sample of 453 pronghorn was obtained; yielding ratios of 37 bucks:100 does:36 fawns (Table 1).
Table 1. Observed buck ratios, fawn ratios and sample size for pronghorn in Units 067,068.
Parameter 2013 2012 2003-2012 Average
Bucks:100 does from winter surveys 37 38 44
Fawns:100 does from winter surveys 36 30 34
Sample size from winter surveys 453 1104 781
Habitat Below-average snowpack and spring precipitation made for a second dry summer in 2013. Range conditions through January remained dry. Poor range conditions throughout the 25 Allotment continued to negatively impact wintering pronghorn. As of early March 2013, the snowpack for northern Elko County was 62% of normal.

PRONGHORN
36
Given the deficit of soil moisture last year of 80% normal, 62% snowpack is far from what is needed to offset the drought of 2011, 2012 and 2013. Similar to the Area 6 deer herd, pronghorn have been greatly affected by wildfires and the loss of vital sagebrush communities. In 2011, 212,000 acres of rangeland burned in Unit Group 067-068 including 208,000 acres that were lost the first week of October. In spite of the challenges with range rehabilitation, Elko BLM, Newmont Gold Company, NDOW, private landowners and sportsman’s organizations seeded over 39,800 acres of scorched private land and 52,500 acres of scorched public land during the fall/winter of 2011. Seed appeared to take well in many of the treatment areas, however much of the burned area has remained bare ground through 2013, particularly those areas near the I-80 corridor. In 2012, the Willow Fire consumed over 42,000 acres within the North Tuscarora Range. Several thousand acres re-burned rangeland affected by the 2005 Esmeralda Fire and 2006 Winters Fire; however the majority of what burned was intact mountain shrub community. BLM and Barrick Gold Corporation seeded several thousand acres with desirable forbs, grasses and shrubs in early 2013. Again in 2013 another 20,000 acres of habitat was lost in the North Tuscarora Range and South Independence Range. BLM and NDOW, in cooperation with landowners, reseeded much of what was lost in the Red Cow, Water Pipe and Wieland fires. Such high elevation burns have benefitted pronghorn and we continue to observe pronghorn occupy much of the North Tuscarora Range. Even with the expansion of summer range, habitat conditions on southern winter ranges will dictate the long-term trend of this population. It is important to properly maintain the viability and production of seedings on transitional and winter ranges. If seedings are over-utilized prior to the onset of winter, the survivorship of several hundred pronghorn could be compromised during a moderate to severe winter. Poor range conditions have existed throughout much of the 25 Allotment for the past 3 years. While pronghorn were not forced to move south of the Midas/Tuscarora road this winter, poor range conditions will negatively affect pronghorn if normal winter conditions force pronghorn onto traditional winter ranges next winter. It is recommended that BLM develop a grazing management plan for the 25 Allotment and use criteria that protects seedings that are crucial for the survival of wildlife. Population Status and Trend The 067-068 population estimate is slightly lower than last year’s. 2013 harvest levels were successful at maintaining the population within the carrying capacity of the winter range, especially with regard to horns shorter than ears. A total of 129 horns shorter than ears tags were issued to address poor range conditions in 2013 and NDOW will attempt to do the same with 2014 quota recommendations. Units 072, 074, 075: Northeastern Elko County Report by: Kari Huebner Survey Data Ground surveys resulted in 404 antelope classified in mid August 2013. The resulting sex and age ratios for the sample were 39 bucks:100 does:39 fawns. The buck ratio was down from 43 bucks:100 does observed last year. Fawn production was similar to the past 10-year average. This survey is typically conducted between the archery and rifle season in this unit group due to the migration of antelope out of the northern end of Unit 072 into Idaho during and after the rifle season. Habitat This unit group was significantly affected by wildfire in 2007 and 2008 (approximately 700,000 acres). On summer range the effects of these fires have been beneficial with perennial grasses and forbs dominating the recovering burned areas; however on winter range, brush species on which pronghorn depend for winter survival, were negatively impacted. Sagebrush is now beginning to recover and will once again provide forage and cover during the critical winter months.
PRONGHORN
37
Population Status and Trend Overall, this pronghorn herd appears to be stable to slightly increasing. Despite the dry summer months, production was decent for this herd. Pronghorn are now taking advantage of the increase in perennial grasses and forbs due to the maturation of the burns. The past 2 winters have been mild which has benefited this herd while the sagebrush continues to recover. With natural recovery in addition to extensive seeding efforts in Nevada and Idaho within these burned areas, the herd’s carrying capacity has increased. Units 076, 077, 079, 081, 091: Northeastern Elko County Report by: Kari Huebner Survey Data Ground surveys conducted in August 2013 resulted in 150 antelope classified. The resulting sex and age ratios for the sample were 44 bucks:100 does:30 fawns. The buck ratio was lower than last year’s ratio of 57 bucks:100 does while the fawn ratio was up from the previous year’s ratio of 24 fawns:100 does. Habitat Major fires impacted this herd’s habitat in 2007 (approximately 244,000 acres). The long-term effects of these fires are proving to be beneficial to pronghorn as perennial grasses and forbs dominate the recovering burned areas. Sagebrush is beginning to recover and will once again be available as forage and cover during the critical winter months. Population Status and Trend Overall, this pronghorn herd appears to be stable. Although production was up slightly from last year, it is still lower than surrounding units. This is likely a result of much of the unit group (such as Pilot Valley) experiencing low precipitation and lower forage quality. This herd has been utilizing the northern portions of Unit 076 and Unit 081 more than in previous years. This is a result of the recovering burns, higher precipitation and thus better forage quality. With favorable precipitation these burned areas will likely facilitate increases in the pronghorn herd in coming years. Units 078, 105 – 107, 121: Southeastern Elko and Central White Pine Counties Report by: Scott Roberts Survey Data A ground survey was conducted in December 2013 resulting in the classification of 545 antelope yielding sex and age ratios of 36 bucks:100 does:38 fawns. This year’s fawn ratio was the highest observed since 2005. As usual the majority of the sampled pronghorn (80%) were observed in Unit 121. Habitat The significant monsoonal moisture received in the last 2 summers has enabled the antelope to capitalize on considerable fall green up and to go into winter in relatively good condition. The great fall conditions coupled with a relatively mild winter have led to high winter survival and should provide high quality late spring/early summer conditions. During the 2013 survey, all of the guzzlers that were monitored were at 95% or more of capacity. With the addition of subsequent storms to hit the area, water availability should not be an issue even in the more arid portions of this unit group. Population Status and Trend The 2014 population estimate exhibited a modest increase over last year. This year’s fawn ratio was considerably higher than the previous 5 year-average of 25 fawns:100 does and helped to reverse the slightly
PRONGHORN
38
decreasing trend of this population in recent years. The stable buck ratio and strong doe component of this population will ensure tag availability for the coming season. Units 101 – 104, 108, 109 portion of 144: South Central Elko and Western White Pine Counties Report by: Caleb McAdoo Harvest Data This year’s harvest results indicate that hunter success was near the statewide average of 70 percent for the resident any legal weapon hunt and was above the statewide average for all other hunts including doe antelope. The total pronghorn harvested during the 2013 season included 39 bucks and 12 does. Doe hunts will continue to be a part of the harvest strategy as long as populations remain stable at moderate to high levels. Survey Data This unit group was surveyed from the ground in mid-October of 2013. A sample of 793 animals was classified yielding sex and age ratios of 24 bucks:100 does:32 fawns. The observed buck ratio was down from last year’s observations of 32, however, the observed fawn ratio recovered from the 2nd lowest ever observed in 2012 to a level more consistent with past performance. Habitat Persistent drought conditions occurred throughout most of the region, however; isolated monsoonal moisture patterns appear to have benefited the southern end of the unit group this summer creating more favorable range conditions for fawn survival. However, by October, range conditions were poor and were negatively impacted by wild horse utilization in several areas, especially within the Triple B Complex. The Smith Ranch Fire burned approximately 2,700 acres on the western flank of the Ruby Mountains in Unit 102 this past summer. This fire should provide benefit to local antelope populations by setting back the successional stage from a shrub dominated site to that dominated by grasses and forbs favored by antelope. Population Status and Trend The current population estimate for the unit Group is approximately 900 animals, up from last year’s estimate of 800. The 5-year trend for this population is stable to slightly increasing. Units 111 – 114: Eastern White Pine County Report by: Curt Baughman Survey Data The 2013 post-season survey was conducted from the ground in late October. The survey consumed 16 man-days and resulted in excellent area coverage. Due to abundant fall green-up and earlier survey timing, group size was modest and pronghorn were scattered. The record sample of 1,338 pronghorn yielded sex and age ratios of 28 bucks:100 does:37 fawns. An additional 54 pronghorn were observed but unclassified. During the 2012 postseason survey 1,217 pronghorn were classified with ratios of 33 bucks:100 does:22 fawns. Sample composition has averaged 31 bucks:100 does:25 fawns for the previous 10 surveys. The 2013 post-season fawn:100 doe ratio was the highest observed since the fall of 2005. It was also the first to equal or exceed the long term (1970-2012) average of 35 fawns:100 does over that same period. Habitat For the second straight year, a dry spring/early-summer period was followed by above-average moisture during the late summer and fall. The lack of precipitation during the early growing season has been detrimental to the growth of vegetation during this critical time for pronghorn. This has limited the nutrition and cover values of vegetation and had a negative influence on the body condition of does and the survival of kids. Although the

PRONGHORN
39
monsoon moisture of 2013 was only about half of that received in 2012, it still brought beneficial green-up and nutritional relief for pronghorn in eastern Nevada. In 2012, an incredible 6.17 inches of moisture fell during the July-October period. This created spring-like conditions in the fall and also improved the nutritional value of winter forage. The resulting improvement to pronghorn body condition was likely reflected in the higher fawn production and recruitment observed in 2013. According to National Weather Service precipitation totals measured at the Ely Airport, calendar-year precipitation was 85% of normal during 2013, following 127% in 2012. Current (mid-March) water-year precipitation stands at 103%. The recent winter was very mild, with early green-up that should be positive for body condition and 2014 pronghorn fawn production. Habitat projects have reduced tree-cover over many acres in north Spring Valley as well as the north end of the Antelope Range. Pronghorn are taking advantage of these habitat improvements. Population Status and Trend The effects of severe drought and hard winters produced a downward population trend from 2007 through 2010, followed by herd expansion in 2011. Unusual climatic conditions in 2012 cancelled what could have been a good year for fawn production, survival and recruitment. Below-average fawn recruitment instead resulted in a stable to slight downward trend. The above-average fawn ratio observed in the fall of 2013 indicates modest population growth over the past year. Productivity potential for 2014 could again be average or above, depending on climatic conditions through the balance of the spring and early summer. Units 115, 231, 242: Eastern Lincoln and Southern White Pine Counties Report by: Mike Scott Survey Data Ground surveys were conducted for pronghorn in this hunt unit during October 2013. A total of 471 antelope were classified, consisting of 72 bucks, 293 does, and 106 fawns. This classification survey resulted in a ratio of 25 bucks:100 does:36 fawns. Antelope were classified in Lake, South Spring, Hamlin, and Snake Valleys. Habitat Habitat conditions during the survey were very good due to heavy precipitation in September. However, Lincoln County experienced approximately 74% of average precipitation during 2013. Pronghorn were observed in many of the recent habitat enhancements and water developments. Feral horse numbers are extremely high and continue to be well above Appropriate Management Levels, which has resulted in degraded habitat conditions for antelope and other wildlife. Pinyon-juniper expansion into lower elevations continues to slowly reduce available habitat for pronghorn. Sagebrush and P/J removal projects that are in the initial planning stages for the benefit of sage grouse may eventually result in improved habitat for pronghorn. A large scale wind-energy project, currently in the planning stages, for the northern portion of Hamlin Valley and southern Snake Valley has potential to affect pronghorn in this area. Population Status, and Trend This antelope population went through a few years of low recruitment and reduced population, but appears to be stable. Ongoing drought conditions may limit the population growth to some extent, but habitat improvements and new water developments should allow for expanded antelope populations. The computer-generated population estimate for 2014 is above the estimate from 2013. Units 131, 145, 163, 164: Southern Eureka, Northeastern Nye, and Southwestern White Pine Counties Report by: Mike Podborny Survey Data Post-season herd composition surveys were conducted from the ground in September and October 2013. A record sample of 612 antelope was classified; yielding sex and age ratios of 30 bucks:100 does:27 fawns. The
PRONGHORN
40
survey was conducted in Antelope, Jakes, Little Smokey, Railroad and Big Sand Springs Valley. There were an additional 77 antelope observed but not classified during the survey. In 2012 the sample was 500 antelope yielding age and sex ratios of 35 bucks:100 does:18 fawns. The 10-year-average (2003-2012) fawn ratio was 28 and has ranged from 5 to 53 during that same time period. Habitat Range conditions throughout occupied antelope habitat declined in 2013 due to drought conditions until August when monsoon rains resulted in abundant grass and forb growth in the fall. This is the second year of below average precipitation the first half of the year followed by heavy rains in the fall thus improving range conditions prior to winter. There have been no major wildfires or other land actions to degrade the overall habitat for antelope. Population Status and Trend The record sample and high buck ratio indicate the population is at all time highs. The computer model was adjusted upward based on the record high sample and the 2014 population estimate was approximately 740 antelope. Units 132-134, 245: Eastern Nye and Western Lincoln Counties Report by: Mike Podborny Survey Data Post-season antelope surveys were conducted by helicopter in October 2013. There were 348 antelope classified; yielding sex and age ratios of 31 bucks:100 does:25 fawns. The previous survey was conducted from the ground in 2012 with 360 antelope classified; yielding ratios of 34 bucks:100 does:14 fawns. The helicopter survey, the first conducted for antelope in this unit group, did not result in an increased overall sample as was expected. The sample was highly skewed to the northern half with 300 antelope classified in White River and Railroad Valleys of Unit 132. The remaining antelope classified came from Coal, Garden and Sand Springs Valleys. There were no antelope found around the agricultural fields at Rachel in Unit 245. The average fawn ratio for the previous 20 years during years when surveys were conducted was 28 and has ranged from 6 to 45. Habitat Sagebrush valleys of the northern portion of this area transition into very dry Mohave Desert with desert shrub and cactus in the south. These range types are less productive than typical antelope habitats in northern Nevada. There were 3 years of above-average precipitation from 2009 through 2011 improving habitat conditions in the short-term. In 2012 and 2013 drought conditions were experienced until late summer monsoon rains caused some severe flooding and abundant forbs and grasses in the fall. There have been no major land actions negatively affecting the overall habitat for antelope. Population Status and Trend The computer modeled population estimate shows a stable population trend in 2014 at approximately 490 animals. There may be a distribution shift from some southern valleys to northern areas. The agricultural fields around Rachel had no antelope in late summer 2013. Early summer drought conditions may have caused this shift in antelope distribution. Units 141, 143, 151 – 156: Eastern Lander and Eureka Counties Report by: Jeremy Lutz Harvest The 2013 hunter success rate on bucks was 77%. This was above last year’s success rate of 73%. Management Area 14-15 had the 2nd highest recorded male harvest in the state with 152 animals being harvested. Due to increased pronghorn use within agriculture areas combined with poor winter ranges, the first doe hunt for this
PRONGHORN
41
management area was initiated in 2013. The 2013 hunter success rate on does was 74% with 148 animals harvested. Survey Data Post-season antelope surveys were conducted from the ground which started in October 2013 and continued into February 2014. Areas surveyed included Crescent Valley, Grass Valley, Antelope Valley, Reese River Valley, and the Simpson Park Mountains. There were 1,591 animals classified during the surveys, yielding sex and age ratios of 48 bucks:100 does:45 fawns. The average fawn ratio for the past 6-years for this management unit was 50 fawns:100 does. This was the highest sample ever obtained for this management area. Habitat Long-term habitat conditions for antelope continue to improve across much of Lander and Eureka counties with the exception of Unit 141, where feral horse numbers and use have been noted as being severe (Administered by the Elko BLM). According to the National Drought Monitor index most of Lander and Eureka counties have experienced severe drought like conditions over the last 4 years. Since 1999 over 450,000 acres have burned in Management Areas 14-15. Upper elevation burns have responded exceptionally well with a mixture of brush, native grasses and forbs; however, the lower elevation burns have been less successful with exotic annuals like cheatgrass and mustard dominating the landscape. Areas that were identified as crucial wintering areas for wildlife were seeded resulting in the successful establishment of forage kochia and crested wheatgrass. With successful rehabilitation of fires since 1999 and a maturity of the established plant community, antelope numbers have responded positively to these large scale disturbances. In June 2012, the Battle Mountain BLM signed a record of decision for the Battle Mountain District Drought Environmental Assessment (EA). Due to the severity of range conditions attributed to the 2011to present drought conditions; several thousand AUM’s of voluntary non-use have been and will continue to be implemented across much of Lander and Eureka counties. Population Status and Trend The large scale fires of 1999 have created ideal habitat for antelope with the increase of annual and perennial grasses and forbs. The total amount and timing of precipitation will ultimately regulate this population’s ability to grow and expand. The high fawn recruitment the past several years has resulted in strong population growth for this herd. Units 161, 162: Northern Nye, Southeastern Lander, and Southwestern Eureka Counties Report by: Tom Donham Survey Data Pronghorn composition surveys were conducted from the ground in Units 161 and 162 during late September/early October, 2013. A total sample of 289 pronghorn was classified as 60 bucks, 196 does, and 33 fawns. The very low observed fawn ratio indicates the herd experienced very poor production and recruitment for the second straight year. These reduced rates are almost certainly due to severe drought conditions experienced over the past three years. Observed buck ratios indicate the mature buck segment of the herd remains relatively strong. The previous composition survey was conducted during late September/early October, 2012. During that survey, a total sample of 256 pronghorn was classified as 57 bucks, 170 does, and 29 fawns. Although the majority of animals observed during these surveys reside primarily in Units 161 and 162, there is some movement of pronghorn between theses and adjacent units. This is taken into account in the population modeling and quota setting processes.
PRONGHORN
42
Habitat Pronghorn populations and the habitats they depend on in central Nevada have suffered through regularly occurring periods of drought over much of the past decade. While some improvements were realized due to favorable climatic conditions from 2009 thru much of 2011, recently drought has returned to central Nevada and pronghorn populations have felt the impact. Precipitation receipts and snow pack accumulations have been well below average for the past three winters. Fortunately, late summer/early fall moisture patterns have been very favorable, and it is only due to this fact that conditions are not much worse than they currently are throughout central Nevada. At the time of this report, data published by the United States Department of Agriculture (USDA), Natural Resources Conservation Service, (NRCS) indicate that central Nevada approximates 80% of average for the current water year. The completion of 3 water developments in the southern portion of Unit 162 should benefit pronghorn that have been impacted by the degradation of natural spring sources caused by feral horses and drought Population Status and Trend In response to very favorable climatic conditions and resultant improvements in habitat, central Nevada pronghorn populations experienced very good production and recruitment rates for two consecutive years in 2010 and 2011. This increase in production allowed for a welcomed boost to these herds. Unfortunately, due to a return to severe drought conditions, production and recruitment rates plummeted in 2012 and 2013. The very poor production and recruitment rates experienced over the past two years has resulted in noticeable reductions in overall pronghorn population levels in central Nevada. While pronghorn are locally abundant in some areas, such as near agricultural areas in Big Smoky Valley, overall the herd is showing a declining trend which will likely continue until climatic conditions improve. Units 171 – 173: Northwestern Nye and Southern Lander Counties Report by: Tom Donham Survey Data Unit 171-173 post-season composition surveys were accomplished, from the ground, during mid-September, 2013. A total of 180 pronghorn was classified as 60 bucks, 103 does and 17 fawns. The very low observed fawn ratio indicates the MA 17 pronghorn herd experienced its second straight year of very poor fawn production and recruitment. The previous composition survey took place during late September, 2012, when a total sample of 137 pronghorn was classified as 36 bucks, 88 does, and 13 fawns. Habitat Following favorable climatic conditions experienced during the 2009 – 2011 period, severe drought returned to central Nevada during the winter and spring of 2012. While habitat conditions suffered due to drought during the winter and spring of 2012, central Nevada received significant amounts of moisture during July and August, 2012, which provided a much needed boost. Unfortunately, drought once again returned to central Nevada during the winter of 2012-13. While late summer and early fall moisture patterns in 2013 once again helped temper overall impacts to range conditions, another drought period during the winter of 2013-14 has continued to plague the region. At the time of this report, data published by the United States Department of Agriculture (USDA), Natural Resources Conservation Service (NRCS) indicate that total precipitation receipts for the current water year are approximately 80% of normal levels. Population Status and Trend Much like pronghorn populations in adjacent Units, the 171-173 pronghorn herd had shown increases due to favorable conditions experienced during 2009-2011. Unfortunately, very poor recruitment rates experienced in
PRONGHORN
43
2012 and 2013 have brought this growth to an end, and have begun to result in a decreasing trend in these populations. Seemingly independent of the trend of pronghorn numbers in other portions of Units 171-173, which is heavily influenced by prevailing climatic patterns and habitat conditions, a consistent increase in pronghorn numbers is occurring in and around the agricultural areas in north Reese River Valley. Due to regular movements of pronghorn between Nye, Esmeralda, Mineral, and Churchill counties, the total number of pronghorn in the unit group can vary widely on a seasonal basis. This is taken into account in the computer model when estimating population size. Units 181-184: Churchill, Southern Pershing, Western Lander and Northern Mineral Counties Report by: Jason Salisbury Survey Data Ground surveys were conducted for pronghorn in Management Area 18 during September and October 2013. There were 528 antelope classified as 82 bucks, 360 does, and 86 fawns, yielding sex and age ratios of 23 bucks: 100 does: 24 fawns. Habitat Severe drought during the last two summers has limited the Area 18 herd. The winter months of 2013 were considered mild consisting of sporadic storms combined with warm weather allowing pronghorn more availability to green grass throughout the winter months. This improvement in range conditions should have allowed for improved body condition. The Bureau of Land Management conducted an herbicide treatment project on the east side of Fairview Peak (Unit 181). The intent of the project was to control cheat grass and other less desirable vegetation but allow for the perennial grass to respond more favorably which would create a fire break for Middlegate Station. Following this treatment, the area was seeded with forage kochia and other grasses. If successful, this project could serve as a template for future restoration projects to control cheat grass and other less desirables. In 2012, the Gilbert fire consumed more than 29,000 acres of the New Pass Range located in Unit 183. Most of the burn occurred in an old fire scar and will most likely recover on its own with perennial bunch grasses surviving the fire. On a positive note, the eastern side of Gilbert Creek that burned was covered in a pinyon juniper canopy with strong bunch grass prevalence. The area was seeded by NDOW with four-wing salt brush. Additionally the BLM seeded 2,500 acres in the Gilbert Creek Basin. Following post-fire reseeding these areas will provide new habitat for pronghorn to occupy where previously pinyon canopy hampered occupancy. A potential new water source for pronghorn is located in Smith Creek Valley and is named Corral Spring. A hog wire fence will be replaced with a new pipe rail fence to allow wildlife access to water indefinitely. This new water source will allow the Area 18 antelope herd to utilize more of the western side of Smith Creek Valley. Population Status and Trend The Area 18 pronghorn population has shown an increasing population trend up until 2012-2013. Two consecutive years of poor recruitment has lead to a static population trend. Persistent drought conditions have lead to large numbers of antelope utilizing agricultural areas more often because of the abundance of feed and water in these areas. This year’s sample size is the largest number ever recorded for this herd. Hunter success for the general rifle hunt was 76%, with 19% of harvested bucks measuring over 15 inches. This represents a slight increase when compared to last year’s 13% of harvested bucks measuring over 15 inches. This year’s observed buck ratio was lower than normal and may have been the result of conducting the composition survey close to the end of the general rifle season. Following the general rifle season many antelope are harder to find because of their wariness.
PRONGHORN
44
Units 202, 204: Lyon and Mineral Counties Report by: Jason Salisbury Survey Ground surveys in units 202 and 204 resulted in 65 antelope classified in February 2014. The resulting sex and age ratios for the sample were 54 bucks: 100 does: 13 fawns. This year’s buck ratio is up considerably compared to last year’s 20 bucks: 100 does. Habitat In 2013, the Spring Peak fire consumed over 14,000 acres in Nevada and California. In early fall 2013, the Nevada Department of Wildlife as well as the Forest Service conducted a field trip to evaluate the effect of this fire. It appeared that many of the perennial bunch grasses survived the fire and it is unknown at this time if any of the bitterbrush will re-sprout. In January 2014, the Nevada Department of Wildlife seeded approximately 1,552 acres within the Spring Peak Fire area. Overall, the area should respond favorably following the fire and will enable pronghorn to occupy more area in Nevada consistently in the summer time. Additionally, 30,000-40,000 bitterbrush and sagebrush seedlings have been purchased that will go out on the ground in early fall. This antelope herd is shared with California and utilizes upper elevation summer range in the Bodie Hills of California. These antelope winter primarily in Nevada and because of the rain shadow effect from the Sierra Nevada, the Nevada portion of this winter range is often in poor shape. Water developments on Fletcher Flat were built for antelope many years ago. They function properly but have archaic fence designs that preclude use by antelope. The replacement of these old fences with pipe rail type designs will encourage both winter and possibly summer use on Fletcher Flat and the surrounding areas. Population Status and Trend In March of 2014, 10 pronghorn does were captured and fitted with satellite/telemetry receivers in the Rough Creek Aldridge Grade area. This was a collaborative project between the Nevada Department of Wildlife and the California Departmetn of Fish and Wildlife to look at pronghorn distribution patterns and migration routes of the Bodie interstate herd. The follow up of this antelope herd will determine if fawns are being lost on summer range or on winter range. A September count may be conducted in California to look at fawn survival and overall numbers prior to the herd moving onto Nevada winter range. It is believed that persistent drought in the area reduces the Bodie interstate herd’s ability to produce offspring. The 2013 population estimate is 140 and approximates the estimate from last year. Improved climatic conditions are needed in the short term to allow for increased fawn survival and insure the overall health of this herd. Units 203, 291: Lyon, Douglas Counties Report by: Jason Salisbury Survey Data A ground survey was conducted in October of 2013 for unit groups 203 and 291. A sample of 64 antelope was obtained providing a composition ratio of 40 bucks: 100 does: 29 fawns. Habitat The Bison fire occurred in 2013, and burned over 24,000 acres of pinyon and juniper woodland. One third of the area was reseeded by the Bureau of Land Management. The area that burned is adjacent to the Sunrise burn area and will enable the antelope herd to extend from the Sunrise area into the Bison area. Most of the large playa lakes that exist on the table top mountains of the Pine Nut Mountains were dry this year. Antelope were using the playa lake areas for grasses and forbs and then going through tree cover to access springs in the pinyon and juniper woodlands. During normal precipitation years, these lakes provide
PRONGHORN
45
needed water to the pronghorn herd. Spring and summer moisture is required in 2014 to replenish these lakes and provide for a higher elevation foraging area. Numerous acres of pinyon and juniper within the Pine Nut Mountains has been cut down or masticated to enhance and protect important Sage Grouse habitat. In the process, this has opened up travel corridors and grazing opportunities for the pronghorn population as well. Future projects that target the removal of trees will only enhance the landscape for the antelope herd. Horse numbers continue to climb in the Pinenut Mountains. Severe drought during recent years will continue to limit available feed and habitat for the pronghorn. Future horse gathers are needed to address habitat degradation and populations that are over the BLM’s recommended Appropriate Management Levels. Population Status and Trend Lower fawn recruitment over the last several years has resulted in a static trend in overall population which is estimated at 80 animals. Areas of new disturbance such as the Bison fire will allow for limited growth and new areas for a core population to become established following post recovery of grasses and forbs. If reasonable precipitation is received in 2014, improvements in available forage and water will allow for increased survival in fawns going through the coming year. Units 205-208: Eastern Mineral County Report by: Jason Salisbury Survey Data Post-season herd composition surveys were conducted from the ground in October of 2013. In total, a sample of 78 pronghorn was observed yielding a ratio of 74 bucks: 100 does: 26 fawns. Habitat Over the last seven years, numerous water developments have been rebuilt in Mineral County. Many of the water developments were primarily designed to provide water for the desert sheep population in the area. We have found, through the use of trail cameras, that these water developments are extensively used by pronghorn herds as well, which is likely enhancing this valuable resource. Three new water developments were built in the Candelaria hills in 2013. Trail cameras have captured antelope using one of the new water developments named Town site. Based on these observations, it is reasonable to assume that antelope will eventually discover Miller Mountain and Mine Pad water developments also. In the summer of 2014, three new water developments will be built in the Garfield Hills. These new additions to the landscape will allow more antelope to occupy the eastern face of the Garfield Hills toward the highway. Range conditions throughout Units 205-208 has declined in the valley bottoms due to the ongoing drought that has persisted for the last two years. Population Status and Trend The Mineral county population of antelope had been stable in recent years despite the landscape they inhabit could be considered marginal. Small groups of antelope occupy meager areas of land during the summer months. In the winter the antelope have the ability to spread out over a large geographic area. Over the past 8 years numerous water developments have been rebuilt and new water developments have been constructed. These new areas will afford the population to grow and expand their summer range throughout management area 20. Reducing competition between native wildlife and domestic livestock will allow for increased resources for all wildlife.

PRONGHORN
46
Units 211 - 213: Esmeralda County Report by: Tom Donham Survey Data No formal surveys were completed during the reporting period. Habitat Three winters of drought have impacted wildlife habitats throughout central and west central Nevada. While late summer/early fall moisture patterns have been favorable, and have provided some relief, overall habitat conditions continue to suffer. Much of Esmeralda County is considered marginal pronghorn habitat to begin with, and these conditions have had a more pronounced impact in this area than in more productive areas in neighboring units. Habitat conditions in Esmeralda County are expected to continue to decline until a return to more favorable climatic conditions occurs. Population Status and Trend As pronghorn populations in surrounding areas increased in number and expanded in distribution over the past 15 years, pronghorn moved into the Great Basin/Mohave transition zone in Esmeralda County in greater numbers than had previously been seen. While many animals continue to drift into and out of the area based upon season and prevailing climatic conditions, more and more animals have become permanent residents of the county. The majority of the Esmeralda County pronghorn population is made up of two core herds. One herd currently resides in and around the Monte Cristo Range in northern Esmeralda County, while the other typically inhabits the region near, and between, the towns of Goldfield and Silver Peak, Nevada, in east central Esmeralda County. Pronghorn also occur, albeit in smaller numbers, throughout many other areas of the county. Due to a lack of formal data, this population has yet to be modeled. Based on general observations, anecdotal reports, and hunter harvest data from the past two seasons, the Management Area 21 pronghorn population appears to be stable at low densities to slightly decreasing. Units 221 – 223, 241: Lincoln and Southern White Pine Counties Report by: Mike Scott Survey Data Ground surveys were conducted for pronghorn in these units during October 2013. A total of 365 antelope were classified consisting of 84 bucks, 224 does, and 57 fawns, which results in a ratio of 38 bucks:100 does:25 fawns. Antelope were classified in Delamar, Dry Lake, Cave, Lake, South Spring, and Steptoe Valleys. Habitat Habitat conditions appeared to be very good during the survey due to heavy precipitation in September. Pronghorn seem to like the recently completed habitat enhancement projects in Cave Valley, which were done for the benefit of sage grouse. New water developments in Delamar Valley should allow expanded use of habitat in that area. Feral horse numbers continue to be well above AML in some parts of this hunt unit. A solar energy zone is being designated in Dry Lake Valley that will be a major threat to pronghorn habitat in that area. Pinyon-Juniper expansion into the lower elevations continues to reduce habitat quality and quantity for pronghorn. Population Status and Trend Although this population has seen low fawn recruitment over the past few years, it seems to be doing reasonably well despite drought conditions. Habitat improvements and water developments are contributing to
PRONGHORN
47
antelope utilization throughout the management area. The computer-generated population estimate for 2014 is higher than the 2013 estimate. Unit 251, Central Nye County Report by: Tom Donham Survey Data During post-season composition surveys conducted in Unit 251 during late September/early October 2013, a total of 137 pronghorn were classified as 33 bucks, 79 does and 25 fawns. The observed fawn ratio indicates that the herd saw some improvement in fawn production and recruitment over the very low levels experienced in 2012. During the 2012 survey period, a total of 134 pronghorn was classified as 58 bucks, 72 does, and 4 fawns. In both 2012 and 2013, a period of very good moisture receipts occurring during late summer resulted in extensive green up throughout central Nevada, and pronghorn dispersed away from cultivated lands. This in turn resulted in a somewhat smaller than average number of animals being located on alfalfa pivots adjacent to the NTTR during the survey period. Habitat Pronghorn habitats in Unit 251 have been impacted by unreasonably high numbers of feral horses and regularly occurring periods of drought for years. Many natural water sources have been severely degraded in this Unit, possibly irreparably. For the past three winters, drought conditions have plagued central Nevada. While periods of favorable moisture receipts during the late summer/early fall of 2012 and 2013 have provided a much needed respite, wildlife populations and their habitats are still being negatively affected by drought. It is unlikely habitat conditions will improve significantly until such time as a combination of favorable climatic conditions and responsible management of feral horses occurs. Population Status and Trend The Unit 251 pronghorn population is currently showing a static to decreasing trend due to regularly occurring periods of drought and resultant impacts to habitat conditions. However, similarly to some other central Nevada herds, a steady increase in pronghorn numbers has been occurring in and around agricultural areas in the unit regardless of fluctuations in other areas where pronghorn occur in more natural habitats. This increase is likely due to regularly occurring drought periods which have made the forage and water available in the agricultural areas more attractive to pronghorn, drawing them to the area from within withdrawn lands of the NTTR.

ELK
48
ROCKY MOUNTAIN ELK Units 061, 071: Bruneau River and Merritt Mountain Area: Northern Elko County Report by: Matthew Jeffress Harvest Results There were 230 rifle bull elk tags available for the 2013 season including resident, nonresident and incentive tags. This represented an 18% increase from the 2012 quota. Hunter success for the resident rifle bull hunt was the same as the 2012 hunting season of 49%. Antlerless rifle tags were increased from 432 in 2012 to 596 in 2013. The 2013 hunter success rate for these hunts was 25%. For more specific hunting results, please refer to 2013 Harvest Tables in the Appendix. Survey Data A total of 3,111 elk was classified during an aerial survey in January 2014. The sex and age ratios of the sample was 32 bulls:100 cows:29 calves (Table 1). This year’s calf ratio was 16 calves lower than the 10-year average. Table 1. Observed bull ratios, calf ratios and sample size for elk in Units 061-071.
Parameter 2013 2012 2003-2012 Average
Bulls:100 cows from winter surveys 32 39 33
Calves:100 cows from winter surveys 29 55 45
Sample size from winter surveys 3,111 2,179 1,257
Habitat Drought conditions appear to be affecting elk winter range on the Diamond A Desert. Much of the area burned in the 2007 Murphy Fire and up until this year, the perennial grass communities were in good ecological condition. A combination of drought and livestock utilization of the area between the Jarbidge and Bruneau Rivers in Idaho has decreased the availability of perennial bunchgrasses. The droughty conditions observed on survey may explain the apparent shift in elk use away from traditional wintering grounds to more favorable bunchgrass communities found west of the Bruneau River. Two fires burned within the unit group in 2012. The Browns Gulch and Mustang Fires burned primarily on USFS administered lands within Unit 061. The 2 fires combined burned over 31,000 acres. Much of the higher elevations of these burns are providing a flush of perennial grasses. The flush of highly nutritious grasses will benefit elk over the long-term. Population Status and Trend Survival rates in the population model this year were increase for all age classes to mirror survival rates of the Independence Mountains Elk Herd. These changes show a population estimate for 2013 being 3,500 adult elk. The average annual rate of increase for this population over the past 10 years has been 16%. The 2014 population estimate is 3,500 animals. The lack of growth is in part due to harvest levels, but mostly reflective of decreased recruitment values. It has been reported by a number of sources that a few hundred elk reside on the deserts of Idaho year-round. In addition, a segment of this herd lives on the Duck Valley Indian Reservation for most of the year. In 2012, a summer fixed-wing survey of the Nevada/Idaho border documented summer elk use of potions of Idaho and the Duck Valley Indian Reservation. Additional observations of elk the fall 2013 suggest 100-300 elk are residing north of the border between Duck Valley and Idaho. Tags issued for this elk herd in Idaho remain focused on conservative bull harvest, with no cow harvest adjacent to GMU 061 and minimal cow harvest adjacent to GMU 071. NDOW biologists continue to work with Idaho Fish and Game biologists to advance our understanding of elk distribution along the Nevada/Idaho border in an effort to

ELK
49
improve harvest in both states. To our knowledge, harvest strategies on the Duck Valley Indian Reservation remain focused on bulls.
The split season structure for rifle bull and cow tags was implemented for the 2011 hunting season. The harvest strategy appears to be working for bulls; however, the harvest data suggests the strategy is not effective at reducing the cow segment of this herd. In an effort to curb herd growth and to manage this herd at or near its current level for a series of years, the antlerless season structure was adjusted to provide longer seasons with earlier harvest during the any legal weapon season. Also new for 2014 are the elk management tags associated with mule deer buck tags. These hunts will allow for added antlerless elk harvest while not contributing to hunter congestion. In addition, a late season antlerless hunt was initiated for 2014 as was spike hunts. Spike hunts will allow for additional bull harvest without placing added pressure on the mature bull segment. Results of the new season structure will assessed over the next few years to determine if future changes are required. A collaborative collaring project with Idaho Department of Fish and Game is slated for the winter of 2014/2015 to better delineate movements between Nevada, Idaho and Duck Valley. Units 062, 064, 066 – 068: Independence and Tuscarora Ranges; Western Elko and Northern Eureka and Lander Counties Report by: Matthew Jeffress Hunt Data There were 127 rifle bull tags issued in 2013. This represents an increase of 21 tags over 2012 quotas. Hunter success for resident rifle hunters was 65%, which was an increase over last year. Antlerless rifle tags were increased from 114 in 2011, 293 in 2012 to 352 in 2013. Resident rifle cow elk hunter success was 18% in 2011, 33% in 2012 and 17% in 2013. Low antlerless success rates are attributed to increases in tag numbers, shifts in use patterns of elk and reduced access to large tracks of public land through private land. Survey Data Aerial surveys in January 2014 resulted in the classification of 992 elk. The sex and age ratios of the sample was 42 bulls:100 cows:48 calves. The sample includes 378 elk observed in Idaho between the East Fork and South Fork of the Owyhee River. This is the first year NDOW has documented elk on the YP Desert of Idaho. Habitat Between 2005 and 2007 over 677,000 acres burned within occupied elk habitat. Many of these burns have recovered and are now dominated by perennial grasslands. An additional 176,000 acres of occupied elk habitat burned in 2011. Elko BLM, Newmont Gold Company, NDOW, private landowners and sportsman’s organizations seeded over 75,000 acres of scorched rangeland during the fall and winter 2011. The grass dominated vegetative communities favor elk, which is evident by the previous 5-year average calf recruitment of 52 calves:100 cows. In 2012, the Willow Fire consumed over 42,000 acres within the North Tuscarora Range. Several thousand acres of this fire re-burned rangeland affected by the 2005 Esmeralda Fire and 2006 Winters Fire. However, the majority of what burned was intact mountain shrub community. BLM and Barrick Gold Corporation seeded several thousand acres with desirable forbs, grasses and shrubs in early 2013. Elk are expected to benefit from the increase of perennial grasses that will likely establish within the fire perimeter. The fall 2013 had an additional 16,000 acres within the North Tuscarora Range burned by the Red Cow Fire and 5,900 acres was consumed between the Wieland and Water Pipe fires in the south Independence Mountains. All 3 of the 2013 fires were heavily seeded by BLM and NDOW in cooperation with private landowners. While the rehabilitation efforts were targeted at sagebrush obligates, elk will no doubt benefit from the flush of perennial grasses seeded for watershed stabilization and those that naturally respond to the fires. Population Status and Trend A combination of adjustments to the population model in the form of adding additional elk to the starting
ELK
50
population and low hunter success rates generate a population estimate of 1,200 adult elk for 2014. The population increased by an average of 14% annually between 2003 and 2012, however the growth of this herd has slowed over the past 2 years to a 4% annual rate of increase. A new split-season structure for rifle bull and cow tags was implemented in 2011. A third late cow elk season was added in 2012 and in 2013 there was a new late split-season structure for cow elk. The split late season structure was added to address depredation problems on private lands along the east side of the Owyhee Desert. The split season harvest strategy appears to be working for bulls, but harvest data suggests the strategy is not effective at reducing the cow segment of this herd. In an effort to curb elk herd growth and to reduce the overall population, the antlerless season structure was adjusted to provide longer seasons with earlier harvest during the any legal weapon season. Also new for 2014 are the elk management tags associated with mule deer buck tags. These hunts will allow for added antlerless elk harvest, while not contributing to hunter congestion. In addition, spike hunts were initiated for this herd. Spike hunts will allow for additional bull harvest without putting added pressure on the mature bull segment, contributing to the overall reduction of this herd. Results of the new season structure will assessed over the next few years to determine if future changes are required. An objective of 500 adult elk was agreed upon in the current Western Elko County Elk Management Plan. The objective of 500 adult elk translates to 100 adult elk per mountain range; Independence, Bull Run, Tuscarora, Snowstorm and Sheep Creek. Harvest objectives will be aimed at a stepwise reduction of the herd over the next few years. Harvest in recent years has slowed growth and the objective of this seasons harvest will be to reduce the overall population. This will be difficult given the northern shift of elk distribution and the known interchange between Idaho populations. To further complicate the issue, recent collar data suggests elk spend a significant proportion of time on the Duck Valley Indian Reservation and private lands adjacent to US Forest Service administered lands, where hunting pressure is limited. A collaborative collaring project with Idaho Department of Fish and Game is slated for the winter of 2014/2015 to better delineate movements between Nevada, Idaho and Duck Valley. Unit 065: Pinion Range, Cedar Ridge Area; Southwestern Elko and Eastern Eureka Counties Report by: Scott Roberts Hunt Data The 2013 hunting season marked the inaugural year for elk harvest in Unit 065. There were 2 tags available for the September bull season, with both hunters being successful. The Dream Tag holder was also successful in harvesting a bull out of this new unit. The success rate for the first cow hunt was surprisingly low with only 2 out 11 hunters harvesting an elk. Survey Data An incidental survey was conducted in December 2013 in conjunction with the Area 10 deer survey. The survey concluded with 48 elk being classified and yielding ratios of 3 bulls:100 cows:40 calves. The extremely low bull ratio is due to only finding the one cow/calf group during the survey. Habitat The Cedar Ridge WSA, the Red Springs WSA, and the Huntington Creek corridor provide year round habitat for a majority of the unit’s elk herd. The mixture of relatively recent burns and the pinyon/juniper forests provide adequate resources for the resident elk. To the west of the core population center, there is an abundance of suitable habitat in the Pinion Range that will allow for future expansion in coming years. Population Status and Trend This relatively new population continues to exhibit strong growth. There will continue to be a high level of management in this area as we near the relatively low population objective that was designated by the Western Elko County Elk Plan.
ELK
51
Units 072, 073, 074: Jarbidge Mountains; Northern Elko County Report by: Kari Huebner Harvest Results This unit group had an early and late any-legal-weapon bull hunt in 2013. The hunter success was lower this year with 57% success in the early season and 52% in the late season. There were 3 antlerless elk seasons aimed at reducing the population. Tags were increased and hunter success dropped in all 3 seasons compared to last year. Survey Data Post-season surveys conducted in January 2014 resulted in the classification of 1,693 elk with observed sex and age ratios of 45 bulls:100 cows:33 calves. The calf ratio was similar to last year’s ratio. The bull ratio was lower than last year’s observed ratio of 60 bulls:100 cows. Habitat This herd has been positively impacted by the large amount of acreage burned in 2006, 2007, and 2008. The recovery of perennial grasses and forbs has been phenomenal in most of the burned areas. The resulting habitat created by these burns has been excellent for elk and has facilitated good calf production despite drought-like conditions throughout the summer and fall. A 6,700 acre fire burned in Stud Creek in August 2012. This fire is recovering and providing a benefit to elk. Vegetation monitoring that occurred on the Forest in 2010 and 2012 has been analyzed and documented. Although elk use was found in nearly all aspen stands sampled, the use was minimal and not enough to lead to the overall decline of aspen stands. The same holds true for the mountain mahogany stands. It was recommended that both aspen and mahogany that are recovering from the East Slide Rock Ridge fire be closely monitored to determine if recovery is being compromised by elk, domestic livestock or a combination of both. Population Status and Trend Due to the known interchange of elk between the 3 units (072, 073, and 074), Unit 073 was added to the previous unit group of 072, 074. This elk population is now modeled as 1 elk herd, with the antlerless elk tags to be issued by unit in order to maintain population objectives. The Jarbidge Mountains Elk Herd Management Plan identified an objective to maintain the elk herd at 1,000 adult animals plus or minus 10% on the Forest portion of Unit 072. There were also 220 elk allotted for the BLM portions of Units 072 and Unit 074, and the east side of Unit 073 in the Wells Resource Area Elk Plan. The Western Elko County elk plan added another 200 elk for the west side of Unit 073. The 3 plans combined set a population objective for this elk herd of 1,420 elk. In response to the low success of antlerless elk hunters in this area, the antlerless tag quota recommendations will be increased to keep up with population growth in order to meet management objectives. Also new for 2014 are the elk management tags associated with mule deer buck tags. These hunts will allow for added antlerless elk harvest, while not contributing to hunter congestion. Unit 075: Snake Mountains; Elko County Report by: Kari Huebner Survey Data Post-season surveys conducted in January 2014 resulted in the classification of 304 elk yielding age and sex ratios of 54 bulls:100 cows:28 calves. The bull ratio was lower than last year. The calf ratio was considerably lower than the 57 calves:100 cows observed last year. Due to light snow cover, elk were not found in their typical winter ranges during this survey.

ELK
52
Habitat A 16,720 acre wildfire burned in the Deer Creek portion of this unit in the summer 2006. Although initial impacts for wildlife were negative, the elk herd is now utilizing this area due to the release of perennial grasses, forbs, and aspen as the burn recovers. Elk are taking advantage of the recovering 2007 Hepworth Fire on the southern end of the unit as well. Population Status and Trend The recommendations for both antlerless and antlered quotas will remain aggressive in order to keep this herd at population objectives. This year antlered elk hunters will have a choice to also put in for a management antlerless tag to increase elk harvest while reducing the number of hunters in the field. Although adequate harvest was reported and calf ratios were down, elk tags will be increased due to the large sample size of elk observed on survey. The number of elk incentive tags that private landowners in this unit qualified for increased by 225% compared to the previous year. The increase can be explained by the growing elk population and subsequent increase in antlered elk tags offered, which combined with elk use days are all part of the formula for calculating incentive tags. Units 076, 077, 079, 081: Thousand Springs, Goose Creek, and Pequop Mountains Area; Northern Elko County Report by: Kari Huebner Harvest Results Both early and late bull rifle hunter success dropped slightly this year. Unit 081 antlerless tags have been split from the rest of the unit group since the 2009 hunting season. In 2013 Unit 081 was added back to the main unit group and 5 antlerless depredation hunts were implemented for the northeast portion of Unit 081. The average hunter success was 48% for these depredation hunts and they will be offered again in 2014. Survey Data Post-season surveys in January 2013 resulted in the record classification of 1,658 elk yielding age and sex ratios of 43 bulls:100 cows:48 calves. The observed bull ratio was higher than last year’s ratio of 26 bulls:100 cows. The calf ratio was similar to last year’s ratio of 45 calves:100 cows. Habitat Nearly 240,000 acres burned in this unit group during the summer 2007. Extensive seeding efforts were expended to rehabilitate fire-ravaged areas. The habitat is responding favorably as it did after the fires in 1999 and 2000. The long-term outlook is positive for elk. Most water developments that were proposed for the area have been built and are currently being used by elk. Increased water availability has helped distribute elk throughout the unit group. Existing cable fences around water developments are being replaced with pipe-rail fences in an attempt to more effectively exclude livestock. Population Status and Trend Elk spend a significant amount of time on private lands in this area as a result of the checker board land pattern. There are currently 12 landowners that participate in the elk incentive tag program who qualified for 51 elk incentive tags for elk use incurred on private rangeland in 2013. This is up from the 38 incentive tags allotted last year. The depredation hunts in Unit 081 were a response to low hunting pressure in the past and increasing elk numbers attracted to the extensive grass component of recovering burns in this unit. The goal is to reduce elk
ELK
53
numbers in this area to alleviate pressure on private land. More effort will be spent working with Utah and Idaho to obtain a better understanding of elk movement patterns among the 3 states. Units 078, portion of 104, 105 – 107,109: Spruce Mountain; Elko County Report by: Caleb McAdoo Harvest Results For 2013, 23 any-legal-weapon bull elk tags were available with 15 being successful. Six muzzleloader bull tags and 11 archery bull tags were also available with success rates of 50% for each hunt. Across all weapon classes, 83% of the bulls harvested had 6 or more points indicating the presence of a strong mature bull segment. A total of 30 cow elk were harvested in the archery, muzzleloader and rifle seasons combined. For more specific 2013 hunting results, please refer to Harvest Tables in the Appendix Section. Survey Data Elk surveys were completed in February 2014. A total of 208 elk was observed during this survey yielding sex and age ratios of 66 bulls:100 cows:53 calves. The observed calf ratio was up significantly from last year’s observed ratio of 20, and is the second highest observed ratio on record. Calf-ratios in this unit are largely driven by precipitation, and as such, are cyclic with the differing moisture patterns. Monsoonal moisture was received in early fall 2013 and appears to have greatly benefited calf recruitment. Weather and Habitat This unit group consists of a relatively arid environment and forage production and quality in this area are largely dictated by spring and summer precipitation. While many other areas in Elko County were experiencing drought-like conditions, monsoonal moisture patterns hit the Spruce Mountain area in mid-summer to early fall. Despite this increase in early fall moisture which benefited range conditions, feral horse populations which are above Appropriate Management Levels (AML) continue to compromise the overall rangeland health and will have negative impacts on wildlife diversity abundance and potential in the long-run. Year round over-utilization of the grass and forb component by unmanaged feral horses has set the stage for long-term impacts related to conversions of native perennial understory to an understory dominated by non-native invasive annuals. Perennial springs in the area have been decimated by abuse of feral horses and riparian vegetation is almost non-existent as a result. While feral horse utilization is the single biggest threat to the unit group, there are some positive changes to speak to as well. The Spruce Mountain Restoration project was recently approved and up to 10,000 acres of habitat restoration will be occurring in the vicinity of Spruce Mountain within the next 10 years. In late 2013, restoration activities commenced with 200 acres of treatment activities being completed. This restoration effort as a whole should create more favorable habitat conditions in the area for both elk and mule deer by promoting more healthy rangelands. Population Status and Trend In the winter of 1997, 146 elk were released in Unit 105 on Spruce Mountain. It has been 17 years since the release and elk have established themselves throughout the entire unit group. Dispersal to other units has also occurred. Increased cow harvest has effectively curtailed population growth of this herd. High percentages of mature bulls continue to be harvested and cow hunters have been extremely successful. Elk are now well established in Unit 078 and Unit 107. More frequent observations of elk in Unit 106 continue to occur. Movement between adjacent units such as 077, and especially Unit 121, is also occurring and is evidenced by elk numbers observed in Unit 121 during aerial surveys. Collaring efforts were initiated to investigate the immigration/emigration dynamics of this herd and to determine seasonal movements. As collaring investigations continue to reveal insight into seasonal movement patterns of this population, the population estimate will be adjusted accordingly. Until 2011, herd growth was promoted towards the population objective of 340 elk. Since cow harvest has been implemented to maintain the herd at objective. Cow harvest has been a successful tool in reconciling population objectives with calf recruitment values. This year’s modeled
ELK
54
estimate of 370 individuals is a testament to the success of cow harvest. While this population estimate change is down from last year’s estimate, the difference is more reflective of changes to model parameters (past observed recruitment values with low sample sizes) than an actual population drop. Thus, in comparison to last year’s published estimate, the 2014 population is stable. Despite the significant increase in calf recruitment, more aggressive cow harvest brought total population numbers more in line with desired objectives. Unit 091: Pilot Range; Eastern Elko County Report by: Kari Huebner Harvest Results Four bulls were harvested in Unit 091 in the 2013 hunting season, 2 by Utah hunters and 2 by Nevada hunters. An additional 4 cows and 2 rag-horn bulls were harvested by UDWR personnel in response to depredation complaints on the TLBar Ranch. Hunters that draw this tag will be able to hunt Pilot Mountain (both in Utah and Nevada). There is an exception for Unit 091 that will preclude PIW, Dream, and Silver State Tag elk hunters from hunting elk in Unit 091 due to low tag numbers and the cooperative agreement with Utah that both states will evenly share the elk resource and resulting quotas based on the elk population estimate. Survey Data A composition survey was conducted in August 2013. A total of 114 elk was classified. The resulting age and sex ratios were 53 bulls:100 cows:25 calves. The calf ratio was significantly lower than last year’s ratio of 59 calves:100 cows. Habitat The Rhyolite Fire burned approximately 4,500 acres on the northeast portion of Pilot Mountain this past summer. The habitat is expected to recover and the long-term outlook is positive for elk. A water development south of Miners Canyon was recently upgraded. An old saucer style unit was replaced with a new metal apron collection with 4 storage tank capacity. The unit should provide a benefit for the bighorn in the area as well as elk. Population Status and Trend The long-term trend for this elk herd is stable to slightly increasing. Calf recruitment is lower in this unit compared to surrounding units. This most likely can be attributed to the drier conditions that exist on Pilot Mtn. There are limited spring sources as well as low annual precipitation levels. A population objective of 250 elk was set for this herd in the Wells Resource Area Elk Plan. The objective was based on the original Unit 079 boundary that has now been divided into current Units 079 and 091. The habitat assessed in the plan included only that on the Nevada portion of Pilot Mtn. The elk herd currently spends the majority of its time on the Utah side of Pilot Mtn. therefore this herd remains below the objective level. Unit 101 – 103: East Humboldt and Ruby Mountains; Elko County Report by: Caleb McAdoo Tag Quotas and Harvest Results For 2013, aggressive strategies for achieving harvest of elk within the elk restricted zone was continued with increases in both cow and bull tags. For the last few years, there were 40 cow elk tags issued in 4 separate seasons with success rates ranging from 10-20 percent and approximately 4-6 cows harvested. In 2013, 176 cow tags were issued and 15 cows were harvested. Of the 15 cows harvested, 7 were harvested in Unit 101, 5 were harvested in 102, and 3 were harvested in Unit 103. There were 75 tags issued for the early depredation bull
ELK
55
hunt in 2013, up from 50 in 2012. There were 31 bulls harvested (43% hunter success) of which 68% were 6-points or better. Quotas were also increased to 50 tags for the late season, which resulted in the harvest of 10 bulls and a success rate of 21%. Fifty percent of the 10 bulls taken in the late season were 6-points or better. The distribution of harvest for the 41 bulls killed in both seasons included 14 harvested in Unit 101, 18 in Unit 102, and 9 in Unit 103. For specific 2013 hunting season results, please refer to Harvest Tables in the Appendix Section. Survey Data Specific elk surveys were not conducted for this unit group and incidental observations remain limited from other surveys in the area. Landowner complaints regarding elk damages in this unit group have been extremely minimal in the last 10 years and have not occurred since 2010. As such, the harvest management practices which have been implemented are considered a success. Population Status and Trend The objective of the hunt strategy is to eliminate elk or keep elk numbers at a level where depredation on agriculture does not occur and a viable elk herd does not become established. This hunt strategy has been quite effective so far. However, it does appear elk are gradually increasing in some areas, especially the bull segment. In some areas, elk observations have increased as small groups of elk have been found within, crossing, or on the periphery of these hunt units. Units 111 - 115, 221-222: Schell, Egan, and Snake Ranges; Eastern White Pine, and Northern Lincoln Counties Report by: Curt Baughman Seasons, Tag Quotas and Harvest Results In 2012 the Wildlife Commission supported the county advisory board recommendations to create separate bull quotas for 111-115 and 221-222 Units-Groups. This concept arbitrarily split the core of this elk herd for the purpose of bull harvest. Because the Department’s population estimate is for a single elk population within the greater unit group, bull quotas over the past 2 years were designed to achieve the previous short-term harvest distribution of approximately 56% for Units 111-115 and 44% for Units 221-222. The actual harvest distribution has been 55%/45% for the past 2 seasons. The 419 bull tags available in 2013 represented a 14% increase over 2012 quotas; however the 2013 bull harvest increased by only 4% over the 2012 harvest. The overall success rate for bull elk hunters dropped from 63% in 2012 to 57% in 2013. This follows an increasing trend from 47% in 2007 to 67% in 2011. Archery and muzzleloader bull hunters experienced 46% and 67% success respectively. One Heritage and 1 Silver State tagholder took a bull in this unit-group. The total reported elk harvest was 573 in 2013 following 646 in 2012. Based on the number of antler points and the length of main beams, trophy quality of the harvest set a record for the 2nd consecutive year. Six-point-or-better bulls made up 77% of the harvest. This contrasts with the long-term (1981-2012) average of 52%. The reported length of main beams was the strongest on record in the 7 years that this data has been collected. Bulls with main beams 50” or longer made up 40% of the harvest. Overall, the harvest objective for antlerless elk was not reached in 2013. Success rates were lower than anticipated for many of the any-legal-weapon hunts, especially the middle and late hunts. Cold weather during the first half of December may have limited hunter participation and effectiveness. With the higher success rates consistently experienced during the October hunts, it is critical in most units that overall antlerless rifle quotas be weighed strongly towards the earlier hunts. Late season hunts are at risk for low hunter success if winter weather causes access and other issues for hunters. Achieving the Department’s projected antlerless elk harvest is vital to meeting population objectives. Survey Data For the fifth consecutive year, the elk herd composition survey was combined with 2014 spring deer surveys. A
ELK
56
sample of 3,233 elk was classified; yielding sex and age ratios of 26 bulls:100 cows:33 calves. This year’s raw sample was inflated by a large number of elk from the Goshute Indian Reservation that were encountered on Nevada BLM land in Unit 113, as well as by a sample of 51 elk from the recently added Unit 223. During the spring 2013 survey 2,855 elk were classified yielding sex and age ratios of 30 bulls:100 cows:32 calves. Survey samples have averaged 2,427 elk with sex and age composition of 29 bulls:100 cows:37 calves over the previous 10 years. Computer generated population models suggest that less than 40% of the bulls in this population are normally observed during surveys. This is due to their widespread distribution, small group size and use of tree cover. Habitat Similar to 2012, the late spring and summer of 2013 was abnormally warm and dry prior to beneficial monsoon moisture in late-summer/fall. Whereas the 2012 monsoon began in July, 2013’s version did not begin to provide some relief until late August. Once again, the dry, hot period during and after the birth pulse had a negative effect on habitat conditions, the condition of cow elk and the survival of calves during this critical time. The late August/September rains triggered a substantial green-up, but nowhere near that of 2012. Precipitation during the 2012-13 water year totaled 90% of normal. Due to favorable fall conditions and a short, mild winter, elk appear to be in good condition coming into the spring. Based on National Weather Service precipitation data collected at the Ely Airport, the current (end of March) water-year precipitation totals are near long-term averages. Local Snotel (NRCS) data report 70+% water-year precipitation and 50+% snow-water content. The threat to mountain top elk habitat from the development of renewable energy facilities has faded, and no projects appear imminent at this time. Habitat values are being compromised by excessive numbers of feral horses in some areas. The subdivision and/or sale of private parcels in quality habitat is still a threat. The encroachment of pinyon and juniper is degrading and/or eliminating habitat in the longer-term. On the positive side, elk are already benefiting from many thousands of acres of chainings, tree thinning and other tree removal projects completed over the past few years by the Ely District BLM and the USFS Ely Ranger District. Additional project areas that are in various stages of planning/NEPA analysis include the north Schell Creek Range (USFS), Ward Mountain (USFS/BLM), South Steptoe/Cave Valleys (BLM) and Duck Creek Basin (BLM and USFS). During June 2012, 3 substantial wildfires burned approximately 20,000 acres in Units 111 and 221. Much of this acreage was formerly dominated by pinyon and juniper. Elk are beginning to be seen in these burns as the process of re-vegetation begins. These areas will be very beneficial to elk in the future. Population Status and Trend Due to climatic conditions and its effects on habitat quality calf recruitment has been below average for 7 consecutive years. Although this has not been a problem from a population standpoint, it has contributed to lower tag quotas. Last year’s harvest succeeded in reducing this population, though not as much as anticipated. The addition of Unit 223 to the unit-group results in a similar overall population estimate to last year. A substantial increase in quotas and harvest of both males and females is needed to bring this herd down to objective levels without driving the bull:100 cow ratio much higher. Unit 121 and portion of Units 104 and 108: Cherry Creek, North Egan, Butte, Maverick Springs, and Medicine Ranges; Northern White Pine County, Southern Elko County Report by: Scott Roberts Tag Quotas and Harvest Results There were 64 bull tags issued across all weapon classes in 2013 and 55% of the tag holders were successful. Of the 35 bulls harvested in this unit group, 74% were 6 points or better, and 91% came from Unit 121. There were 104 antlerless tags issued across all weapon classes with 61 tagholders being successful. There was also 2 antlerless depredation hunts initiated in an attempt to limit elk use on private lands in Steptoe Valley in Unit 121. An additional emergency depredation hunt that was restricted to the same hunt area as the depredation hunts was initiated in mid October to bolster the number of hunters in the field. There were 79 tags issued for the hunts that ran from 1 August 2013 – 1 January 2014, with 42% of tagholders being successful.
ELK
57
Survey Data Aerial post-season elk surveys were conducted in January 2014. The survey concluded with 449 elk being classified and yielding ratios of 20 bulls:100 cows:40 calves. The survey conditions were poor, with patchy 6 week old snow and unseasonably warm temperatures. With the abundance of trees within this unit group the bull segment continues to be difficult to survey. Of the small number of bulls that were surveyed, 48% were spikes. The reported numbers include 133 elk that were located on Palomino Ridge. This herd continues to be difficult to delineate from the Unit 105 elk due to the constant mixing and movement between both populations. Habitat The Snow Creek Fire burned approximately 1,100 acres of mountain brush and mixed conifer on the south face of the Snow Creek drainage in Unit 121. As with past high elevation fires in this area the resulting burn scar should provide excellent elk habitat in the coming years. Pinyon/Juniper (PJ) encroachment continues to plague a significant portion of this unit group. Several large scale habitat enhancement projects are proposed in Unit 121 in the near future. The Combs Creeks project has been approved to reduce or remove PJ encroachment on 7,000 acres of high quality habitat in the southern portion of Unit 121, with work beginning in 2014. There were marked habitat improvements following horse round-ups conducted in the Cherry Creek Range and Butte Valley during the summers of 2006 and 2011, but horse competition continues to a be a factor with 510 horses being observed during the January survey. The high levels of precipitation that were received in the late summer of 2012 and 2013 have allowed for excellent range conditions preceding the last 2 winters. Population Status and Trend During January 2011, 3 cow elk were radio collared in Unit 104 and 3 cow elk were collared in Unit 121. Objectives of this project were to determine seasonal use and distribution within the unit group, quantify elk use on private land, and begin delineating winter range use between this herd and the Unit 105 herd. In January 2012, 4 cow elk were radio collared on Palomino Ridge in Unit 121 and 2 cow elk were collared at the base of Spruce Mountain in Unit 105. The intent of this project was to further our understanding of winter habitat utilization between these 2 herds. The collaring project has not produced use pattern results yet as 3 of the 6 collars are still on elk and one collar is still on the ground at the top of Cottonwood Canyon. Of the 3 collars that are deployed, 2 of the cows were found in the herd wintering on Palomino Ridge. The last remaining collar from the 2011 collaring project was observed on survey in a herd north of Snow Canyon. With the addition of the Unit 121 depredation hunt, the antlerless harvest in this unit group negated the strong calf ratio and curbed the steady population growth that has been experienced in the past few years. NDOW is fully committed to minimizing the damage done by elk in Steptoe Valley while still providing opportunity to sportsmen to harvest elk. With this goal in mind the depredation season structure will be altered in the 2014 season to have monthly hunts from August-October, and then a late extended hunt from 1 November – 15 January. The intention of this season structure is to keep constant pressure on the offending elk by increasing the number of opening day pulses into the area. The high harvest realized in the 2013 season will lead to similar antlerless quota recommendations and slightly higher bull quota recommendations for the upcoming hunt season. Units 131, 132: White Pine, Grant and Quinn Canyon Ranges; Southern White Pine and Eastern Nye Counties Report by: Mike Podborny Survey Data A helicopter post-season herd composition survey was conducted in February 2014. There were 184 elk classified yielding ratios of 48 bulls:100 cows:29 calves. The warm weather with rain immediately preceding the survey eliminated all snow below 8,500 feet increasing the difficulty in finding elk on winter ranges. There were 2 distinct areas where normally large wintering groups of elk have been found in the past with no elk found during the survey. The previous survey in 2013 yielded ratios of 29 bulls:100 cows:37 calves from a
ELK
58
sample of 369 elk. The 10-year-average calf ratio (2004 to 2013) was 37 calves:100 cows. Habitat Drought conditions existed the first half of 2013 until heavy monsoon rains began in August. The rains washed out many roads in the White Pine, Grant and Quinn Canyon ranges while at the same time filling guzzlers and improving range conditions with extensive grass and forb growth that existed through the fall. The Forest Service had crews cutting small pinion and juniper trees with chainsaws that were encroaching into the open grass and brush zones in both Units 131 and 132. These projects will continue in 2014 and although not specific for elk, the projects should benefit elk and other wildlife in the future. Population Status and Trend The record harvest of 63 cows and 33 bulls combined with the below average calf recruitment resulted in a downward trend in the 2014 population estimate to 390 elk from 450 estimated in 2013. The reduction was by design to lower this elk population closer to the objective level identified in the White Pine County Elk Management Plan (300 elk + or - 20%). The 2014 quota recommendations will also be designed to reduce this elk population again. Units 144 & 145: Diamond, Fish Creek and Mountain Boy Ranges; Southern Eureka County Report by: Mike Podborny Background Depredation bull and cow hunts were initiated in 2012 to reduce the elk population in concurrence with the Central Nevada Elk Plan. The 2013 season was 4 months long with 20 bull tags and 25 cow tags. Ten bulls and 4 cows were harvested during the 2013 hunt. Survey Data There was no formal elk composition surveys conducted but one bull elk was found during the post-season deer survey in December 2013. The previous year during the spring 2013 mule deer helicopter survey; 23 elk were classified as 5 bulls, 12 cows and 6 calves. Population Status and Trend It is estimated there are approximately 30 to 35 elk in Unit 145 with a few elk wandering through Unit 144. There will be 3 separate bull seasons and 4 separate cow season in 2014. The NDOW recommended quotas for 2014 will be spread out among the several seasons to reduce hunter congestion and increase harvest. The goal of the hunts is to reduce this elk population in line with the objectives of the Central Nevada Elk Plan. Units 161 - 164: North-Central Nye and Southern Lander and Eureka Counties Report by: Tom Donham Survey Data The 2014 aerial elk composition survey in Management Area (MA) 16 was conducted mid-January 2014. A record sample of 812 elk was classified as 151 bulls, 506 cows, and 155 calves. Cow/calf groups were easily located in valley bottoms despite the lack of significant snow accumulations at high elevations. The comparatively low observed calf ratio indicates MA 16’s elk population is feeling the impacts of recent drought like most other wildlife populations in the area. The previous aerial elk composition survey was conducted in MA 16 during mid-January 2013. A total sample of 612 animals was classified as 90 bulls, 375 cows, and 147 calves. Habitat Elk populations and the habitats they depend on in central Nevada have suffered through reoccurring drought
ELK
59
periods over much of the past decade. While some improvements were realized due to favorable climatic conditions from 2009 through much of 2011, recently drought has returned to central Nevada and even very resilient elk populations have felt the impact. Precipitation receipts and snow pack accumulations have been well below average for the past 3 winters. Fortunately, late summer/early fall moisture patterns have been very favorable, and it is only due to this fact that conditions are not much worse than they currently are throughout central Nevada. At the time of this report, data published by the United States Department of Agriculture (USDA), Natural Resources Conservation Service, (NRCS) indicate that central Nevada hovers near 80% of average for the current water year. Population Status and Trend Following approval of the Central Nevada Elk Plan (CNEP) in January 2004, which included updated elk population objectives, the Management Area 16 elk population was allowed to begin increasing toward the newly agreed upon objective level of 850 adult animals. Between 2004 and the present, the harvest of female elk continued at moderate levels to ensure the herd did not increase too rapidly. Ten years later, the MA 16 elk population has reached population objectives and harvest management strategies will now be designed to maintain the herd at a static level. Due to poor hunter success during recent antlerless seasons, quotas will see significant increases for the 2014-15 seasons in order to meet objectives. Units 171 - 173: North-Western Nye and Southern Lander and Counties Report by: Tom Donham Survey Data The Management Area (MA) 17 aerial elk composition survey was conducted in mid-January 2014. During the survey, a total of 49 elk was classified as 16 bulls, 26 cows, and 7 calves. The entire sample was obtained in Unit 184, in and along the eastern bench of the Desatoya Range in Smith Creek Valley. The previous MA 17 aerial elk composition survey was conducted during mid-January 2013. A total sample of 41 elk was classified as 6 bulls, 26 cows, and 9 calves. Similarly to the 2014 survey, the entire survey sample was obtained in Unit 184. While the small sample sizes make observed ratios statistically suspect, it appears the MA 17 elk population is at least continuing to maintain itself at a stable level. Habitat Following favorable climatic conditions experienced during the 2009 – 2011 period, severe drought returned to central Nevada during the winter and spring of 2012. While habitat conditions suffered due to drought during the winter and spring of 2012, central Nevada received significant amounts of moisture during July and August 2012, which provided a much needed boost. Unfortunately, drought once again returned to central Nevada during the winter of 2012-2013. While late summer and early fall moisture patterns in 2013 once again helped temper overall impacts to range conditions, another drought period during the winter of 2013-2014 has continued to plague the region. At the time of this report, data published by the United States Department of Agriculture (USDA), Natural Resources Conservation Service (NRCS) indicate that total precipitation receipts for the current water year hover near 80%. Population Status and Trend For many years, small numbers of elk were sporadically reported in Units 171-173. Presumably, these elk were moving between Unit 173 and adjacent Units 161 and 162. By the early 2000’s, reports had become more frequent, and the NDOW determined that a small, permanent, resident herd had established itself in the southern portions of MA 17. In 2007, several cow elk were fitted with radio collars in Units 172 and 173 to aid in delineating seasonal use patterns, and to help more accurately determine herd size. Through the collaring effort, it was determined that the core elk population was inhabiting the southern portions of the Toiyabe and Shoshone Ranges during

ELK
60
the summer and fall, and transitioning to Units 171 and 184, in Ione and Smith Creek Valleys, during the winter and spring periods. These movements have remained consistent to the present time. The MA 17 elk herd has remained relatively static at low levels for several years now. Regular observations of the core herd continue to hover around 40-50 animals. This has held true for all seasons and seasonal ranges. This has occurred despite the fact that no female elk harvest has been allowed in the area. The failure of this herd to show any noticeable increase over the past few years is perplexing. Rumors abound of the illegal killing of elk in the Unit, but no hard evidence of this has been documented thus far. Currently the MA 17 elk herd is considered to be stable at a low level. Unit 231: Wilson Creek Range; Lincoln County Report by: Mike Scott Survey Data Aerial surveys were conducted during January 2014 and resulted in the classification of 524 elk consisting of 102 bulls, 298 cows, and 124 calves. These totals result in a ratio of 34 bulls:100 cows:42 calves. Of the 102 bulls observed, 60% were classified as spikes to 4-points. There were 134 elk observed n the Fortification Range, adjacent to the Geyser Ranch. This is relatively new, as in previous years very few elk were found in the Fortification Range. Habitat According to CEMP, Lincoln County received approximately 74% of average annual precipitation during 2013. Thus far in 2014, Lincoln County has received approximately 59% of average annual precipitation. According to the US Drought Monitor, the US Seasonal Drought Outlook is predicting that the drought conditions in this area will persist or intensify. Feral horse numbers are at alarming levels with BLM indicating that no horses will be gathered in the foreseeable future. This puts unnecessary pressure on NDOW personnel and livestock permittees by pitting them against each other because BLM is not willing to manage horses at appropriate management levels. Pinyon-Juniper invasion continues to reduce both quality and quantity of elk habitat. Unfortunately, wildfires that would result in transition of dense pinyon-juniper stands to grasses and shrubs are being quickly suppressed. Habitat projects that are being done are very costly due to both planning and use of mechanized equipment. Many of the areas that have burned in the past few decades are providing the bulk of the habitat for elk in Area 23. Recent installation of water developments, by both BLM and local sportsmen, are allowing elk to use habitat in an attempt to reduce conflicts with both livestock operators and private landowners. Shed antler hunters continue to place added stress on elk during the late winter and early spring. Although this does not appear to be having detrimental effects on elk population numbers, it may have unseen effects on elk. Population Status and Trend According to hunt return data, a total of 191 elk were harvested from Area 23 during the 2013 season. These included 95 cows and 96 bulls. This represents a 16% increase in harvest from the 2012 season, when 164 elk were harvested. The number of elk in Area 23 remains high despite the continuing high harvest numbers. NDOW will continue to provide high numbers of tags in an attempt to keep elk numbers down. Elk move freely between Area 23 and both Utah and Area 22, each of which have much higher elk populations. Many of the elk in Area 23 forage on private property, which NDOW addresses through the elk damage or incentive tag programs. According to recent radio and satellite telemetry info, many of the elk also spend some amount of time across the state line in Utah.
ELK
61
Unit 241-242: Delamar and Clover Mountains; Lincoln County Report by: Mike Scott Survey Data Surveys were conducted during January 2014, and resulted in a total of 83 elk observed. These were classified as 12 bulls, 42 cows, and 29 calves with a ratio 29 bulls:100 cows:69 calves. Habitat Habitat conditions are poor to moderate due to lower-than-average precipitation during 2013 and early 2014. Feral horse numbers are excessive in both units 242 and 241, where the AML is set at zero. BLM has done some habitat projects that may eventually benefit elk. Several water developments have been installed in the past few years that are allowing elk to use habitats not available to them in previous years. Fire suppression continues to limit habitat for elk as well as increasing competition between feral horses, livestock, and wildlife. Population Status and Trend No elk population model has been developed yet for the Area 24 herd. Hunt return data indicates that 1 cow and 3 bulls were harvested from Area 24 in 2013. The 2014 survey, combined with reports, and sightings indicate that there may be up to 100 elk in Area 24. Unit 262: Spring Mountains; Clark and Southern Nye Counties Report by: Patrick Cummings Survey Data In January 2014, a brief 2.6-hour aerial survey conducted in the Spring Mountains yielded a sample of 85 elk. The sample included 9 bulls, 64 cows and 12 calves. Elk were encountered south of Cold Creek, and north and south of Wheeler Pass. In September 2012, a brief aerial survey conducted in the Spring Mountains yielded a sample of 70 elk. The sample included 15 bulls, 40 cows, and 15 calves. In January 2012, a brief 3.1-hour aerial survey conducted in the Spring Mountains yielded a sample of 80 elk. The sample included 1 spike bull, 64 cows, and 15 calves. Habitat Severely degraded vegetative conditions on the McFarland Burn were noted in 12 aerial surveys conducted between 2002 and 2014, and likely the reason no elk were encountered in the area. Degraded habitat is largely the result of an over population of feral horses aggravated by the effects of periodic drought conditions. Presently, the United States Forest Service (USFS) is engaged in a preliminary National Environmental Policy Act, 1970 (NEPA) process in support of producing a comprehensive herd management plan. The plan will cover horse and burro gathers and resetting Appropriate Management Levels (AML). Initially the USFS announced the decision would be signed in late fall 2013, and then USFS would request to be put on the gather schedule. As of April 2014, progress in producing a comprehensive herd management plan has been impeded by horse advocacy groups. Elk avoidance of roads and decrease in habitat use adjacent to roads has been reported in literature. Moreover, avoidance behavior becomes exacerbated in roaded areas adjacent to openings (burns) and meadows. Based on well-documented findings, another factor that has influenced elk distribution has been increased off-highway vehicle (OHV) use. In recent years, recreational use of OHVs in the Cold Creek area and on the McFarland Burn has increased substantially. In June 2004, the Humboldt-Toiyabe National Forest issued a Decision Notice and Finding of No Significant Impact for Spring Mountains National Recreation Area Motorized Trails Designation Project. The decision to
ELK
62
implement alternative 5 (with modifications) as summarized in the respective Environmental Assessment involves minimal closure of newly established roads on the McFarland Burn. Thus, the recently authorized management prescription for motorized trails ensures the status quo on the McFarland Burn for the near future. Population Status and Trend The population estimate for elk inhabiting the Spring Mountains reflects a modest contraction relative to the estimate reported last year. Elk habitat quality throughout most of Unit 262 is marginal. Elk have existed on a low nutritional plane limiting reproduction and recruitment. Calf recruitment in many years has been low. Formerly, under ideal conditions marked by lower horse numbers and normal precipitation receipts, the McFarland Burn afforded quality early-seral forage necessary for maintenance, growth, and reproduction. In the near future, meaningful efforts to improve elk habitat must entail management of horse and burro numbers consistent with AMLs and completion of habitat improvements. Elk habitat in the Spring Mountains can be enhanced by seeding recently burned areas, increasing water availability and decommissioning/restoring newly created roads and trails. As of this writing in April 2014, environmental conditions range from fair to good due to limited winter and spring storms. Moisture receipts in the first quarter of 2014 were below average, and the likelihood for an overall dry year appears high. In the seasonal drought outlook valid for late March through June 2014, the National Weather Service forecasted drought conditions to persist or intensify. Based on environmental conditions, it is reasoned the elk population in Management Unit 262 is stable.
DESERT BIGHORN
63
DESERT BIGHORN SHEEP Units 044, 182: East and Stillwater Ranges; Pershing and Churchill Counties Report by: Jason Salisbury Survey Data A 3-hour aerial survey was conducted in the Stillwater’s and East Range during September 2013 and resulted in the classification of 119 bighorns consisting of 34 rams, 64 ewes, and 21 lambs. The ratio of classified animals was 53 rams:100 ewes:33 lambs. Habitat Continued expansion of pinyon juniper is limiting bighorn sheep habitat within the Stillwater Range. Prescribed fires and/or lightning fires are needed in most of the northern half of the Stillwater’s to expand suitable bighorn habitat. Past fires such as the Table Mountain fire have removed tree cover allowing bighorn expansion into these areas. Certain portions of the Stillwater Range have extremely high feral horse numbers. These areas are severely degraded and limit bighorn use. Population Status and Trend The Stillwater and East Range population of desert bighorn sheep continues to show a slight upward trend. Observations of bighorn occupying new portions of the Stillwater Range and East Range are increasing. In 2009, 25 bighorn sheep were released at the bottom of Shirttail Canyon on the southwest side of the Stillwater Range. In January 2014, the Nevada Department of Wildlife personnel observed 17 bighorn wintering at the top of Big Box Canyon. Over half of these sheep had ear tags from the 2009 release. Future augmentations on the south end of the Stillwater’s would bolster the southernmost subherd. Units 045, 153: Tobin Range and Fish Creek Mountains; Pershing and Lander Counties Report by: Kyle Neill Hunt Results In 2013, Unit 153 was combined with Unit 045 for harvest purposes. A total of 3 tags were approved by the Wildlife Commission and all 3 hunters harvested rams from Unit 045. Survey Data An aerial survey of Unit 045 was performed in early August and resulted in the observation of 116 bighorns. This was the largest composition sample to date. Bighorns encountered during the survey were well distributed throughout the southern end of the Tobin Range from the top of Mount Tobin south to the Indian Caves. Age and sex ratios were 54 rams:100 ewes:49 lambs. Both ram and lamb ratios were near their respective 10-year averages. Population Estimate and Trend Augmentations of bighorn into the Tobin Range that occurred in 2003 and 2008 have been successful in establishing a viable population. However, a few bighorns from these release efforts dispersed eastward to Unit 153, Mount Moses in the Fish Creek Range, establishing a resident bighorn herd. Unfortunately, these bighorns are living within an active domestic sheep allotment. Past collaring projects that took place in Unit 153 have demonstrated movement of rams between Unit 153 and 045. The Unit 153 population will likely remain at low levels.
DESERT BIGHORN
64
The Tobin herd has demonstrated an average growth rate of 15% since the 2008 augmentation. This rapid rate of growth can be attributed to lamb recruitment rates that have averaged 54 lambs:100 ewes over the last 10 years. The 2014 population estimate for Unit 045 is 160 bighorns. Field and hunter observations continue to indicate that the Unit 045 herd is expanding its use areas. Bighorns now inhabit the top of the Tobin Range from Wood Canyon south to Mount Tobin throughout the year. Primary bighorn use areas in Unit 045 include Cottonwood Canyon, Bushee Creek area, Rim Peak, Golconda Canyon, Little Miller and Miller Basins and utilization of the Indian Caves area has been regularly documented at various times during the year. Units 131 and 164: Duckwater Hills, White Pine Range and North Pancake Range; Southern White Pine and Eastern Nye Counties Report by: Mike Podborny Survey Data A helicopter composition survey was conducted in Unit 164 in October 2013. There were 59 bighorns classified, yielding sex and age ratios of 93 rams:100 ewes:18 lambs. In February 2014, 46 bighorns were classified during a helicopter survey in Unit 131, yielding a ratio of 46 rams:100 ewes:18 lambs. The combined unit group data resulted in 105 bighorn classified; yielding ratios of 70 rams:100 ewe:18 lambs. The previous survey was conducted in January 2013 with 143 bighorns classified, yielding a ratio of 43 rams:100 ewes:14 lambs. The lamb ratio has been in the teens for 3 consecutive years. Habitat The range conditions during the first half of 2013 were poor due to drought. Heavy monsoon rains in August and September 2013 resulted in flash floods and improved range conditions in the fall with abundant grass and forb growth. Population Status and Trend All 3 sub-populations of bighorns: the Currant Mountain, Duckwater Hills and the Pancake herds have all been exposed to the disease agent Mycoplasma ovipneumoniae. The disease has expressed itself in lower lamb survival for the past 3 years and resulted in a declining population. The disease does not seem to be affecting the adult population. The high number of adult bighorns classified during surveys demonstrates the presence of ample adult rams available for harvest. There have been 3 rams harvested in Unit 131 that have been confirmed through DNA testing to be Rocky Mountain bighorn and 1 ram harvested was a Rocky Mountain/Desert hyrbrid. Rams harvested from these units will only be accepted into official record books as Rocky Mountain Bighorns because of subspecies interbreeding. Unit 132: Grant Range and Quinn Canyon Range; Eastern Nye County Report by: Mike Podborny Survey Data A helicopter composition survey was conducted in February 2014 of the Grant Range and Quinn Canyon Range. Only 10 bighorn were classified in the Grant Range as 1 ram, 7 ewes, and 2 lambs. During the March 2014 deer survey, 20 bighorns were classified in the Grant Range; yielding sex and age ratios of 31 rams:100 ewes:23 lambs. The previous survey was conducted in 2013 in the Grant Range resulted in 43 bighorns classified, yielding sex and age ratios of 19 rams:100 ewes:31 lambs. The previous 5-year average lamb ratio was 38 lambs:100 ewes. There were 15 bighorn found on the February 2014 survey in the Quinn Canyon Range as 10 adults and 5 newborn lambs. This followed the trail camera pictures from August 2013 in which over 30 individual bighorns

DESERT BIGHORN
65
were identified at Red Bluff Spring. These were the first bighorn documented by NDOW in the Quinn Canyon Range. Habitat Drought conditions existed the first half of 2013 with abundant summer rains beginning in August causing flooding and good grass and forb growth in the fall. This is the 2nd year of below normal precipitation early in the year followed by heavy rains in the late summer and fall. Population Status and Trend The population in the Grant Range has expanded in size and distribution since the 2 releases in Troy Canyon in 2005. The low number of bighorns found on survey and low lamb ratio indicates the population is static or slightly declining in 2014. The computer-modeled population estimate was approximately 90 bighorn. The Quinn Canyon population of bighorns may be an additional 40 animals. Hunters have reported ear-tagged bighorns in the Quinn Canyon Range that may have come from a November 2011 release in the South Pahroc Range 50 miles to the east. The animals transplanted into the South Pahroc Range came from the Bare Mountains. Four bighorns from the Quinn Canyon Range were captured in January 2014. Biological samples were collected for genetic and disease testing with 3 radio collars deployed. Unit 133, 245: Pahranagat and Mount Irish Ranges; Lincoln County Report by: Mike Scott Survey Data No surveys were conducted during the reporting period. The previous survey was an abbreviated survey completed in January 2012 following reports and removal of an exotic sheep. The survey resulted in the classification of 48 sheep consisting of 10 rams, 25 ewes, and 13 lambs, with a ratio of 40 rams:100 ewes:52 lambs. Habitat Habitat conditions were likely poor to moderate during the spring of 2013 due to lower than average precipitation. Above-average precipitation fell during the late summer of 2013 leading to very good range conditions. According to CEMP (Desert Research Institute’s Community and Environmental Modelling Program) precipitation data the annual precipitation received in Alamo during 2013 was approximately 60% of the previous 10-year average. All of the water developments in the North and East Pahranagats were holding good amounts of water in February 2014. The timing of the precipitation was not ideal, but should have allowed sheep to go into the winter in good condition. Population Status, and Trend This population has shown a static trend for the past few years. The computer-generated population estimate for 2014 is similar to last year. Unit 134: Pancake Range; Nye County Report by: Tom Donham Survey Data The Unit 134 aerial desert bighorn sheep composition survey was accomplished during late September 2013. A total of 144 desert bighorn was classified as 52 rams, 90 ewes, and 2 lambs. The dismal observed lamb ratio indicates the herd is still suffering lingering effects of a pneumonia outbreak that began in 2011. In comparison, the previous aerial composition survey, from mid-September 2012, resulted in a total of 211 animals classified as 68 rams, 141 ewes, and 2 lambs.
DESERT BIGHORN
66
Habitat Central Nevada continues to be plagued by regular periods of severe drought. Fortunately, favorable moisture receipts during the summer/early fall have somewhat tempered the impacts of drought. However, overall habitat conditions will likely continue to deteriorate until climatic conditions improve for a comparatively greater length of time. Population Status and Trend The Unit 134 desert sheep population is the result of a bighorn reintroduction that took place in 1984. During that effort, a total of 26 bighorn were released into Unit 134. The herd immediately began a steady increase which continued through the late 80’s and early 90’s. The herd did so well during that time period that it has been used as a source of transplant stock on three different occasions. Trapping and transplanting operations conducted in 1996, 1998, and 2003 have resulted in the successful translocation of 78 bighorns into other mountain ranges in the state of Nevada. More recently, the Unit 134 desert sheep population experienced a major setback. In November 2011, it was determined the herd was experiencing a pneumonia outbreak. It is believed that adult mortality due to the disease event was likely 25% or more, and lamb mortality has been nearly 100% since 2011. Due to the effects of the disease event, the herd is experiencing a sharply decreasing trend. Monitoring of the herd will continue, with emphasis placed on determining the timing and magnitude of lamb mortality, continued morbidity rates, subherd pathogen exposure, and overall herd status. Neighboring Units will also be monitored for any indications of disease. The 2014 population estimate reflects a downward trend due to the continued lack of lamb recruitment and has been modeled at approximately 170 adult animals. Survey data indicates the mature ram segment of the herd is still sufficient to provide for limited harvest. Unit 161: Toquima Range; Northern Nye County Report by: Tom Donham Survey Data No aerial composition survey was conducted in 2013. The most recent Unit 161 aerial composition survey was conducted during early September 2012. During that survey, a total of 187 desert sheep was classified as 35 rams, 92 ewes, and 60 lambs. The observed lamb ratio indicates the herd experienced above average lamb production in 2012. In comparison, the previous aerial survey from August 2010 had a total of 144 desert sheep classified as 27 rams, 82 ewes, and 35 lambs. Population Status and Trend The Unit 161 desert sheep population was re-established through the release of 22 animals in 1982. In 1983 an additional 4 animals were released in the area. Since the initial release, the Unit 161 sheep population has thrived. The population has fared so well that it has served as a source of transplant stock on 5 occasions. A total of 123 sheep has been captured and relocated in 2002, 2003, 2006, 2007, and most recently in 2008. Animals from Mount Jefferson have been relocated to the Clan Alpine and Tobin Ranges of Churchill and Pershing Counties, respectively, and to the Grant/Quinn and southern White Pine Ranges of Nye County. The core Unit 161 desert bighorn sheep population inhabits the area on and around Mount Jefferson, in the Alta Toquima Wilderness, during the summer and fall. The majority of these animals move to lower elevations in the surrounding area during the winter and spring months. However, a smaller herd has established itself further north in the Northumberland area in recent years. While the herd is stable at a moderate level, it’s been experiencing reoccurring drought periods and is plagued by unreasonably high numbers of feral horses.
DESERT BIGHORN
67
Units 162, 163: Monitor and Hot Creek Ranges; Nye County Report by: Tom Donham Survey Data No aerial composition surveys were completed in Unit 163 during the 2013 reporting period. The most recent aerial composition survey was conducted in early September 2012. The survey yielded a record sample of 146 sheep classified as 35 rams, 78 ewes, and 33 lambs. The observed lamb ratio indicates the herd experienced above average lamb production in 2012. In comparison, the previous aerial composition survey was conducted in late August 2010 when a total of 136 animals were classified as 29 rams, 75 ewes, and 32 lambs. Population Status and Trend A small number of desert bighorn sheep occurred in the Hot Creek Range prior to the 1990’s, but the population remained static at very low levels. Releases of desert sheep in 1994 and 1995 augmented the existing population and stimulated herd growth. Increased production and recruitment in the relatively recent past allowed the Unit 163 desert sheep herd to reach its highest level in recent memory. An ever increasing number of animals continue to utilize the southern extent of the Hot Creek Range in the Warm Springs area, and movement between the Hot Creeks and the Kawich Range to the south during the cool season has increased concurrently. There is some concern that an epizootic pneumonia outbreak discovered in adjacent Unit 134 in 2011 could find its way to Unit 163. However, current observations indicate the Hot Creek population remains healthy. In order to take advantage of an increasing number of sheep inhabiting the Hunt’s Canyon area, Unit 162 was combined with Unit 163 for the desert sheep hunt in 2005. While the number of sheep inhabiting the Hunt’s Canyon area has remained relatively static, an increase in sheep use has been observed in the southern portion of Unit 162 over the past several years. A small scale radio collaring project was initiated in this area in January 2013, and the monitoring of a collared ewe and a collared ram has provided interesting data concerning sheep movements, lambing areas, and connectivity to adjacent herds. A series of recent drought periods have impacted wildlife populations throughout central Nevada, and Unit 163 is no exception. While no formal surveys were conducted in Unit 163 during 2013, it is likely the herd experienced decreased production and recruitment similar to many other central Nevada sheep populations. Currently, the Unit 163 desert sheep population is considered to be stable. A population model for Unit 162 has yet to be developed, but data indicate the population remains stable to increasing at low levels. Unit 173: Toiyabe Range; Northern Nye County Report by: Tom Donham Survey Data No aerial composition surveys were conducted in Unit 173 during the 2013 reporting period. The most recent aerial composition survey occurred in mid-September 2012. Due to moist, green conditions on the range, animals were widely dispersed which resulted in a smaller than average total sample size. During the survey, a total of 54 desert sheep was classified as 15 rams, 36 ewes, and 3 lambs. The low observed lamb ratio indicates low herd production in 2012. This may have been due to severe drought conditions experienced through the winter and spring of 2012. In comparison, the previous aerial composition survey conducted in 2010 resulted in a total sample of 121 desert sheep being classified as 10 rams, 79 ewes, and 32 lambs. Habitat The majority of the Unit 173 desert sheep population inhabits the southern 1/3 of the Toiyabe Range. The core of this herd’s range is in and around the Peavine Canyon/Seyler Peak area. Due to the consistent occurrence of drought over most of the past decade or more, desert sheep in this area have become accustomed to using private lands in Peavine Canyon that are more moist and lush than adjacent habitats. This behavior has been
DESERT BIGHORN
68
passed along to several generations of sheep and the problem is likely to continue even if climatic conditions return to more favorable patterns. Bighorn sheep depredation of private lands is likely to continue until an acceptable solution to landowners, NDOW, and sportsmen can be devised. Population Status and Trend The Toiyabe desert sheep population is one of only a few remnant sheep herds that exist in central Nevada. This population was nearly extirpated along with many other sheep herds in the state and had been reduced to an estimated 50 animals by the early 1980’s. During 1983 and 1984, a total of 21 desert sheep were captured in southern Nevada and transplanted into the Toiyabe Range. In 1993, an additional 9 rams were released. The releases were intended to augment and stimulate the existing herd. In 1988 the desert sheep hunting season, which had been closed since 1969, was reopened. Although the majority of the Unit 173 desert sheep herd inhabits the southern portions of the Toiyabe Range, a small number of animals occur in various locations along the range as far north as Bunker Hill and Birch Creek, north of Kingston Canyon. This area contains an active domestic sheep allotment, and expansion of this small portion of the desert sheep population will not be encouraged until such time as domestic sheep grazing is discontinued in the area. Recent regularly occurring drought periods have resulted in decreased lamb production and recruitment in many central Nevada desert sheep populations, and Unit 173 is no exception. Due to this fact, the Unit 173 desert sheep population is considered static to slightly decreasing. Unit 181: Fairview Peak, Slate Mountain, and Sand Springs Range; Churchill County Report by: Jason Salisbury Survey Data In September 2013, a 3-hour survey yielded a sample of 154 bighorn sheep. The observed sex and age ratios were 115 rams:100 ewes:42 lambs. Areas surveyed included the Fairview Range, Sand Springs Range, and Monte Cristo Mountains. Habitat The summer of 2013 experienced increased drought leading to degraded habitat in the Sand Springs Range. During the late summer period of 2013, the south rail fence water project started to run out of water from increased use by bighorn as well as an increase in evaporative loss. Department of Wildlife personnel recharged this unit with 7,000 gallons to insure that there was adequate water for sheep throughout the summer. Shortly after this water haul; increased precipitation allowed areas to green-up concentrating sheep in a few isolated canyons during survey. In the spring of 2014, two new big game water developments will be built in the Sand Springs Range to improve water availability for bighorn sheep. These new developments will reduce concentrations on perennial water sources and should allow bighorn to better distribute themselves throughout the landscape. A new water development was built in the Monte Cristo Mountains in 2012. Bighorn sheep in this range have yet to utilize this new water development. Trail cameras will be placed in 2014 on the Monte Cristo Mountain guzzler to document the first use by bighorn sheep. Population Status and Trend The Unit 181 bighorn herd is currently stable. Future harvest recommendations will be made to increase ram harvest in the Sand Springs Range. Ram ratios within the Sand Springs Range are high and opportunities exist to increase ram harvest. The future outlook is bright for the Unit 181 herd as long as numbers are controlled to the current habitat carrying capacity of the rangelands.
DESERT BIGHORN
69
Unit 183: Clan Alpine Range; Churchill County Report by: Jason Salisbury Survey Data During an aerial composition survey in September of 2013, a total of 159 bighorn sheep were classified as 34 rams, 87 ewes, and 38 lambs. Habitat During the summer of 2013, habitat conditions were marginal at best. Persistent drought plagued the Clan Alpine herd. In the late summer months the Little Angel water development water level was extremely low. Department personnel delivered a total of 5,000 gallons to this unit in the early fall months to insure adequate water was available to the bighorn herd. The Bench Creek Spur consistently has numerous bighorns occupying it, but the summer of 2013 left almost no bunch grasses for bighorns to eat because of drought and consistent use by feral horses. Feral horse numbers need to be reduced in the Bench Creek and Little Angel Spur area if bighorn sheep are to persist in the area. The Cow Creek bighorn subherd is also experiencing an increasing feral horse population within its drainages. A reduction of feral horses in the Deep Creek and Cow Creek drainages is needed to allow for increased feed available to bighorn sheep. Increased use by bighorn sheep has been documented at both the Hercules water development as well as the Lauderback unit. These areas have abundant bunch grasses and should provide needed resources for a growing herd. Population Status and Trend The 2013 population estimate for the Clan Alpine Mountains is 280 bighorn, similar to last year’s estimate. The lamb ratio of 44 lambs:100 ewes will allow for a slight increase in population trend. Unit 184: Desatoya Range; Churchill and Lander Counties Report by: Jason Salisbury Survey Data In September of 2013, a 3-hour survey yielded a sample of 93 bighorn sheep. The observed sex and age ratios were 39 rams:100 ewes: 63 lambs. Areas surveyed included the Desatoya Mountains, Eastgate Hills, and Greyback. This year’s sample is the largest since 2009 when 92 bighorn sheep were observed. Habitat In 2012, the BLM removed a total of 433 feral horses out of Desatoya Horse Management Area. The removal of the horses, especially on the top of the Desatoya Mountains, will afford relief to riparian areas as well as reduce competition between bighorns and feral horses for available forage and water. Habitat conditions for the Desatoya Mountains in 2013 were sufficient in providing adequate perennial grass and forage. The Eastgate Hills are considerably lower in elevation than the Desatoya Mountains and normally receives less precipitation. This in turn reduces the quality and quantity available to the bighorn herd occupying the Eastgate Hills. Population Status and Trend The modeled population estimate for the Unit 184 herd for 2013 is comparable to last year’s estimate.
DESERT BIGHORN
70
Unit 195: Virginia Range; Storey County Report by: Carl Lackey Survey Data A ground survey was conducted in February 2014 resulting in the classification of 57 sheep, including 44 animals in ewe/lamb groups and 13 rams. The ewe/lamb groups were too far away to classify lamb numbers. Animals were seen on Clark Mountain in the vicinity of both water developments, in the Gooseberry Hills and near the Eagle Pritchard Mine overlooking the Truckee River. Habitat Habitat conditions in this unit are marginal after 2 years of drought. Additionally, the feral horse population in the Virginia Range is estimated at over 1500 by the Nevada Department of Agriculture which has management responsibilities in this unit. One additional water development was installed by Nevada Bighorns Unlimited-Reno in February 2014 in the Gooseberry Hills east of Clark Mountain. Population Status and Trend The modeled population estimate shows an upward trend despite the drought conditions. Sheep inhabit Clark Mountain, the Gooseberry Hills, the Derby Dam cliffs and the area around the Eagle Pritchard Mine. There are continued reports of small groups near Six-mile Canyon in the Flowery Range. Unit 202: Wassuk Range; Mineral County Report by: Jason Salisbury Survey Data In September 2013, an aerial survey occurred in the Wassuk Range yielding a sample of 53 bighorn sheep. The sample consisted of 32 rams:100 ewes:39 lambs. Habitat In November of 2012, approximately 457 feral horses were removed from the Wassuk Mountain Range. The appropriate management level for the Wassuk herd is 110-165 horses. This removal should help alleviate rangeland health concerns for the short term and benefit the bighorn herd. Pinyon and juniper expansion continually plagues the eastern face of the Wassuk Mountain Range. Prescribed fires or naturally occurring lightning fires are needed in the middle and higher elevations inundated with type 2 and type 3 pinyon canopies. Areas like Cat Canyon have adequate sheep habitat at the bottom and mid slope but needs some prescribed fires to open up country for bighorn use. In 2013, plans were discussed to tap into the Cottonwood Canyon pipeline located on the Hawthorne Army Depot. The intention of the proposed project was to provide an upper elevational water source located in open terrain within the Cottonwood Canyon drainage. This project is needed to allow for reduced predation risk at a single water source and provide more available habitat to the growing bighorn herd. Population Status and Trend The population of bighorn sheep occupying the Wassuk Range continues to grow and expand its range from the core population that exists near Cottonwood Creek. Recent observations have been made on the upper portions of Mount Grant where a small herd of bighorns are residing. Increased observations of bighorn north of Cottonwood are a commonplace. It is believed following the 2009 bighorn release on the Hawthorne Army Depot, that bighorn expanded into numerous drainages north of Cottonwood Canyon.
DESERT BIGHORN
71
Unit 204: East Walker River; Lyon County Report by: Jason Salisbury Survey Data An aerial composition survey was conducted in Unit 204 in September 2013. A 1.5 hour survey revealed a total of 14 bighorn sheep classified as 2 rams, 10 ewes, and 2 lambs in the East Walker drainages. This was one of the lowest samples recorded compared to the previous year in which a record sample of 68 bighorn sheep was attained. Population Estimates and Trend In October 2011, a group of hunters scouting Unit 204 located a domestic ewe in the vicinity of the Elbow area of the East Walker River. The Elbow area is considered a high-use area for the bighorn herd. After investigation, Department personnel made contact with the owner and removed the domestic sheep. The domestic sheep carcass was collected, delivered to the Nevada Department of Agriculture, tissue samples taken, and submitted for testing. This animal had traveled at least 35 miles from its known location. In March 2013, a domestic sheep was discovered near the Elbow area along the East Walker River by a sportsman who then reported it to Nevada Department of Wildlife personnel. Again, the Nevada Department of Wildlife made contact with the owner and removed the domestic sheep. After testing the animal, it was determined the domestic sheep had chronic, localized pneumonia and an old, walled abscess in the chest with adhesions from the lung to the chest cavity. This indicates the animal had a previous bout with pneumonia. These instances are alarming from the standpoint of back-to-back years and proximity to the core bighorn habitat use areas. The ability to maintain a viable bighorn herd in the East Walker River into the future is questionable. Vigilant observers that witness domestic sheep in the bighorn herd area are the key to detecting and helping reduce interaction between the two different species. Future plans may entail placing signs at various locations along the East Walker alerting people if they see a domestic sheep in specified areas to please notify the Nevada Department of Wildlife of its location. Following the removal of the domestic sheep, the Nevada Department of Wildlife captured 4 rams near the location of the Elbow. The animals were sampled for disease testing. The results from the WADDL laboratories indicated that the bighorn rams had no present or past exposure to Mycoplasma ovipneumoniae. One of the 4 rams was collared with a satellite/telemetry collar to monitor movement and survival, but after several months the collar failed. A follow up flight with a contract plane was unable to even pick up a telemetry signal. The 2013 composition survey revealed a low overall number of bighorn sheep as well as a low lamb ratio. This survey could have easily missed sheep but it might indicate that contact of the domestic sheep was made to the naïve bighorn herd which may have resulted in a disease event. Follow up in the summer of 2014 is needed to substantiate the possibility of a recent disease event. The population model will remain the same until new data is presented that shows the contrary. Unit 205, 207: Gabbs Valley Range, Gillis Range, Pilot Mountains; Eastern Mineral County Report by: Jason Salisbury Survey Data In September 2013, a 6.5-hour aerial survey yielded a sample of 281 bighorn sheep consisting of 68 rams, 206 ewes, and 75 lambs. The resulting sex and age ratios were 49 rams:100 ewes:54 lambs. Habitat The water developments within Units 205 and 207 have experienced small renovations over the years. Many of the water developments range from 5,000 to 7,500 gallon capacity. These improvements were necessary to allow for the expansion and occupation of bighorn subherds throughout the units.
DESERT BIGHORN
72
The next step in improving available water to bighorns is to protect important riparian areas and to shield the water source with fencing projects. Unit 205 has many riparian areas in a degraded state because overutilization by longhorn cattle. There is a real need to improve and protect some of these water sources for both livestock and wildlife. Population Status and Trend The 2013 modeled estimate for Units 205 and 207 is 600 bighorns and it appears to be stable at this time. The recent lamb ratio of 54 lambs:100 ewes will allow a short-term population increase. It is known that mountain lions prey heavily on the bighorn sheep in Units 205 and 207. Trail cameras on water sources have documented numerous lions, additionally numerous bighorn carcasses have been discovered over the years. It is believed that lions can play a crucial role in regulating population levels. Because of the efficiency of lion hunting strategies, numerous rams have been lost. It will be recommended that some mountain lions be removed from core bighorn areas to moderate the predation losses. The Unit 205, 207 herds have room to grow on Pilot Mountain and the northern end of the Gillis Range. The limiting factor for both of these potential core herd areas is water. Future projects consisting of well placed water in open terrain will be indentified to allow for herd expansion. Unit 206, 208: Excelsior Range, Candelaria and Miller Mountain; Mineral County Report by: Jason Salisbury Survey Data Aerial surveys were completed in September 2013 and resulted in the observation of 90 bighorn sheep classified as 19 rams, 49 ewes and 22 lambs. This survey was the highest recorded survey to date. The observed lamb ratio of 45 lambs:100 ewes indicates very good production and will enable herd growth. Habitat In the spring and summer of 2013, a total of 4 new water developments were completed for bighorn sheep in the Candelaria Hills, Miller Mountain, and the Excelsior Range. The one water development in the Excelsior Range named Marrietta has a total capacity of 7,500 gallons. The other 3 located in Candelaria and Miller Mountain had a capacity of 10,000 gallons a piece. These water developments are instrumental in allowing the population to occupy these areas year round. Population Status and Trend In early November 2013, a total of 50 bighorns were captured off of the Bare Mountains, Unit 253 for an augmentation in the Excelsior Mountains and the Candelaria Hills. Of the 50 bighorn sheep, 30 bighorn sheep were released into the Candelaria Hills, and 20 were released into the Excelsior Mountains. Five bighorn sheep were fitted with real time Vectronic satellite collars for the Candelaria Hills release and two were fitted with collars for the Excelsior release. To date, the data has shown that sheep are utilizing areas around the newly created water developments in the Excelsior Mountains as well as the Candelaria Hills. During the fall 2013, trail cameras were placed at the Defender water development located in the Excelsior Mountain Range. In a 3-month period photos were captured of numerous sheep with ear tags from previous releases. In October 2011, 20 bighorn sheep from Stonewall Mountain were released below the Defender guzzler. During 2013, trail camera footage revealed 11 of the 20 bighorn sheep were observed with different ear tag numbers. In November 2012, 25 bighorns sheep were captured off of Lone Mountain (Unit 212) and released below the Defender guzzler. Surveillance footage captured 16 positively identified sheep of the 25 sheep released. The two previous releases near the Defender guzzler achieved the intended purpose of imprinting sheep on a water development and establishing a subherd in the western portions of the Excelsior Range.
DESERT BIGHORN
73
The Unit 206 desert sheep population continues to exhibit good production rates and continues to grow and occupy newly created terrain. The addition of the new water developments will allow the Excelsior’s core population to grow and occupy the Candelaria Hills as well as Miller Mountain. Unit 211 (Previously Unit 211S): Silver Peak Range and Volcanic Hills; Esmeralda County Report by: Tom Donham Survey Data An aerial composition survey was accomplished in Unit 211 in early September 2013. A total of 268 desert sheep was classified as 87 rams, 136 ewes, and 45 lambs. The comparatively low observed lamb ratio is likely due to recurring drought conditions in the area. In comparison, the previous aerial survey, which took place in 2011, saw a total of 221 animals classified as 75 rams, 95 ewes, and 51 lambs. Population Status and Trend The Unit 211 desert sheep herd is one of only a few remnant herds in central Nevada. Historically, sheep movement occurred regularly between the Silver Peak Range (Unit 211) and the Monte Cristo Range (Unit 213). The Monte Cristo Range served primarily as winter range for many of the sheep in the Silver Peaks. Over the years this movement has nearly ceased, and each of the 2 ranges now support distinct populations. The vast majority of the desert sheep inhabiting Unit 211 occur in the Silver Peak Range and the Volcanic Hills. However, some incidental use does occur on the Nevada portion of the White Mountains in the general area of Boundary Peak. Seasonal movements also occur between the Volcanic Hills and Miller Mountain/Candelaria Hills portions of western Esmeralda and eastern Mineral Counties, Unit 208. Due to the steadily increasing bighorn population inhabiting Unit 211, the herd was utilized as a source of transplant stock in 2009 when a total of 25 animals was captured for relocation in Churchill County (Unit 182). The release compliment consisted of 21 ewes and 4 lambs. The Unit 211 desert sheep population has experienced impressive growth in the recent past due to good lamb production and recruitment rates, and while recent drought has impacted this trend somewhat, the herd is still considered to be stable to slightly increasing. Unit 212: Lone Mountain; Esmeralda County Report by: Tom Donham Survey Data An aerial composition survey was conducted in Unit 212 during early September. A record sample of 400 desert sheep was classified as 168 rams, 202 ewes, and 30 lambs. The very low observed lamb ratio was cause for concern, and further investigation into the cause of the depressed production and recruitment rate is ongoing. In comparison, the previous aerial composition survey for this unit was conducted in October 2011. During the 2011 survey, a total of 305 animals was classified as 96 rams, 139 ewes, and 70 lambs. Population Status and Trend The Unit 212 desert sheep population is one of a few remnant herds that survived extirpation during the 19th and 20th centuries due to a variety of anthropogenic causes. Once regulations that provided for reasonable protections to bighorn sheep were put into place, the Lone Mountain bighorn herd began increasing steadily. By the late 1980’s the estimated population was over 200 animals. This population served as transplant stock during 2 successive years in the late 1980’s. Immediately following these captures, the herd experienced a sharp decline, and by 1991 the herd’s estimated population was less than 50 animals. Due to excellent production and recruitment rates experienced most years for over a decade, the Unit 212 desert sheep population has increased at a phenomenal rate. Due to the steadily increasing
DESERT BIGHORN
74
population, and a desire to control densities, the Unit 212 desert bighorn sheep herd was utilized as a source of transplant stock in November 2012. A total of 25 animals was captured and relocated to the Excelsior Mountains, Mineral County, Unit 206. The release compliment consisted of 21 ewes and 4 lambs.
In the past few years, desert sheep densities on Lone Mountain have begun to become excessive, and biologists have begun recommending reduction of the population to ensure the continued health of the herd. In 2012, animals were trapped and relocated from Lone Mountain in an effort to begin reducing densities in the area. During the 2013 aerial composition survey, a very low observed lamb ratio raised concerns further. Possible causes of this drop in production and recruitment ranged from drought and density to an unknown pathogen. During the winter 2013 a ewe hunt was proposed in Unit 212 to help reduce densities further, and more quickly. Unfortunately, these measures may have taken place too late. In late March 2014, a hunter harvested ram from Lone Mountain that had been submitted for testing came back as positive for Mycoplasma ovipneumoniae. Further testing of animals from Unit 212 will be necessary in order to determine the extent and severity of the situation. The hunter that submitted the ram for testing also reported seeing sheep he believed were coughing while scouting the area as early as July 2013. He did not report these sightings to NDOW until November, which may have resulted in a lost opportunity to take action and investigate the potential disease event early on. Further investigations are ongoing. Unit 213 (Previously Unit 211N): Monte Cristo Range; Esmeralda County Report by: Tom Donham Survey Data No aerial composition surveys were conducted in Unit 213 during the 2013 reporting period. The most recent aerial composition survey was conducted in early September 2012. A record sample of 338 desert sheep was classified as 105 rams, 186 ewes, and 47 lambs. While reduced rates of production and recruitment have been observed over the past few years and are likely to be density related, drought conditions during the winter and spring of 2012 and 2013 may have further impacted production in this herd. The previous aerial composition survey accomplished in Unit 213 was conducted in late August 2010. During the 2010 survey, a total of 311 desert bighorn sheep was classified as 78 rams, 176 ewes, and 57 lambs. Habitat Due to effects from drought and feral horses, several natural water sources in the Monte Cristo range are becoming less and less reliable. In 2005, a fourth water development was constructed in order to augment existing water sources in the range. Plans are being made for an additional 2 water developments in the Monte Cristo Range to help ensure water availability does not become a problem if natural waters fail. During the spring of 2011 a water development on the east side of the range, Monte Cristo #1, was rebuilt. The unit now has increased storage capacity and a self-leveling drinker, which should provide a more reliable source of water. The location of the drinker was also moved to a new location to reduce the risk of predation. Population Status and Trend The Monte Cristo desert sheep population is one of only a few remnant sheep herds in central Nevada. The herd has exhibited steady growth over the past 7 to 10 years. Very good production and recruitment rates have allowed this population to increase at a greater rate than most surrounding herds. The population has reached a level where there is concern over animal densities. During the fall 2011, a capture project was conducted in the Monte Cristo Range. The project not only provided valuable transplant stock for a desert sheep reintroduction in the Virginia Range, Unit 195, but also served to reduce animal densities on the southern portion of the Monte Cristo Range. A total of 34 animals were captured and relocated including 19 ewes, 12 lambs, and 3 yearling rams. Currently, desert sheep densities in the Monte Cristo Range are considered to be excessive and reduction of the population is considered essential to ensure the continued health of the herd. While removal of animals
DESERT BIGHORN
75
through capture and translocation efforts is expected to continue to be an important method to reduce sheep densities, other methods of sheep removal will be necessary to achieve objectives. A change in harvest management in 2014 will include, for the first time, the harvest of ewes in order to help reduce densities. It is anticipated that in the future a combination of ewe harvest and capture/translocation will be necessary to maintain a healthy and sustainable population level. Due to recently reduced production and recruitment rates, the current population model for Unit 213 shows a slowdown in the recent rate of increase of this herd. Unit 221: South Egan Range; Lincoln County Report by: Mike Scott
Survey Data
No surveys were completed during the reporting period. Four ewes and one lamb were observed during deer surveys in March 2013. Population Status, and Trend Domestic sheep have been reported, observed, and removed on several occasions from the South Egans. At this point in time, it appears that the population has been essentially lost, despite the presence of a few remaining bighorns. No new releases will be done in this area unless the domestic sheep trailing route is eliminated. Existing survey data cannot provide enough information to make a reasonable population estimate, and this unit will remain closed indefinitely. Unit 223, 241: Hiko, Pahroc, and Delamar Ranges; Lincoln County Report by: Mike Scott
Survey Data
No aerial surveys were completed during the reporting period. The previous survey was completed in September 2012 and produced a combined sample of 19 rams, 39 ewes and 13 lambs. Habitat Habitat conditions throughout this area will likely be poor to moderate due to lower-than-average precipitation during 2013 and early 2014. Water development surveys show several of the sheep guzzlers at or near capacity, but a few well below capacity. The Judy water development in the Delamars was rebuilt after being destroyed by fire. Two water developments in the South Hiko Range are scheduled to be rebuilt in the spring 2014. Bighorn sheep in these areas are faced with a host of varied issues including OHV races and rock-crawling courses, new power lines, development, and domestic sheep interaction. Population Status and Trend Two releases were completed in the Delamar and South Pahroc ranges in fall 2011. A total of 75 sheep were released into these areas. Bighorn released in these areas have been observed to commonly move to adjacent ranges. It appears that some of the sheep from the South Pahroc release have possibly even moved some 60 miles northwest to the Quinn Canyon Range. The computer-generated population estimate for 2014 is similar to the estimate for 2013.

DESERT BIGHORN
76
Unit 243: Meadow Valley Mountains; Lincoln County Report by: Mike Scott
Survey Data
No surveys were completed during the reporting period. The previous survey was completed in September 2012, and resulted in the classification of 72 sheep. The survey sample was comprised of 17 rams, 40 ewes, and 15 lambs. Habitat According to CEMP, this area should have received about 74% of average annual precipitation during 2013. Concerns over lack of precipitation continue with early 2014 being well below average. Water developments were observed to be holding decent amounts of water in February 2014. Wilderness, private land issues, and limited roads combine to make access into the Meadow Valley Range difficult for sheep hunters. Population Status and Trend
Recent releases of sheep into the Meadow Valleys and Delamars, combined with poor to moderate habitat conditions should result in a static trend in the population. The computer-generated population estimate for 2014 is similar to the 2013 estimate. Unit 244: Arrow Canyon Range; Northern Clark County Report by: Pat Cummings Survey Data The last aerial bighorn sheep survey conducted over the Arrow Canyon Range was in September 2010. The aerial survey yielded a sample of 83 bighorn sheep. The observed sex and age ratios were 83 rams:100 ewes:47 lambs. Bighorn sheep were encountered throughout much of the interior of the Arrow Canyon Range, and within 2.5 miles of available water. The survey sample included 6 rams, 9 ewes, and 7 lambs that were encountered in the adjacent Battleship Hills. The next aerial survey over the Arrow Canyon Range is expected to occur in fall 2014. Habitat Bighorn sheep inhabiting the Arrow Canyon Range and Meadow Valley Mountains will likely be impacted by impending infrastructure construction and other anthropogenic influences from the Coyote Springs master planned community. This 43,000-acre parcel situated northeast of the junction of U.S. 93 and State Route 168 is the largest privately held property for development in Southern Nevada. Construction of the master planned community commenced in 2005; however, construction has stalled in recent years, likely due to the economic recession and tangled litigation. In January 2014, the 231-mile long One Nevada Transmission Line that electrically connects northern and southern Nevada was commissioned. The 500-kV transmission line runs from the Harry Allen Generating Station north through the Arrow Canyon Range approximately 1.5 miles south of the Arrow Canyon #1 water development. The line continues north closely skirting the west side of the Arrow Canyon Range to the new Robinson Summit Substation located west of Ely, Nevada. The new line will provide transmission access to otherwise isolated renewable energy projects in parts of northern and eastern Nevada. The southwest end of the Arrow Canyon Range, given close proximity to Las Vegas, continues to attract recreational shooters and recreational vehicle enthusiasts. It appears bighorn sheep tend to avoid the area as result of increased human use and presence.

DESERT BIGHORN
77
Population Status and Trend With very limited information, the current bighorn sheep population estimate reflects no change relative to the estimate reported last year. An accurate assessment of herd status requires completion of an aerial survey in fall 2014. The 2014 population estimate notwithstanding, the bighorn herd may have experienced a contraction in response to overall dry conditions in 2013. Unit 252: Stonewall Mountain; Nye County Report by: Tom Donham Survey Data An aerial composition survey was conducted in Unit 252 during early September 2013. A total of 272 desert sheep was classified as 73 rams, 153 ewes, and 46 lambs. The observed lamb ratio indicates that this herd, similarly to many central Nevada herds, has been impacted by recent drought. In comparison, the previous aerial composition survey for this unit was conducted in September 2011. During the 2011 survey, a record sample of 384 animals was classified as 117 rams, 193 ewes, and 74 lambs. Population Status and Trend Recently, Stonewall Mountain has seen a noticeable increase in the desert bighorn population level. This increase is believed, in part, to be the result of sheep movements into the Stonewall Mountain area from areas deeper within the Nevada Test and Training Range (NTTR). This movement is likely attributable to regularly occurring periods of drought, and the resultant impacts to habitat conditions. Unlike within the NTTR, there are currently low numbers of feral horses occupying Stonewall Mountain making it more attractive to desert bighorn sheep during drought periods. It is difficult to accurately model this population due to the continual movement of desert bighorn sheep between Stonewall Mountain and the NTTR. In an effort to decrease densities of desert bighorn sheep in the Stonewall Mountain area, a capture project was conducted in fall of 2011. A total of 28 animals was successfully captured. The first 20 animals captured were transported to the Excelsior Range (Unit 206) where they were successfully released in order to augment an existing sheep population. The final 8 animals captured were successfully released in Unit 195, Storey County, as part of a desert bighorn sheep reintroduction effort. During the past 2 desert sheep hunting seasons, animal distribution has made hunting a greater challenge than usual. Substantial moisture receipts during the summer/early fall periods of the past 2 years have allowed sheep to disperse away from perennial water sources to areas where forage is more abundant during the late summer/fall time frame. This has resulted in larger than normal numbers of animals drifting out of the hunt area during the season. Currently, the Unit 252 bighorn sheep population is considered stable at high levels. Unit 253: Bare Mountain; Southern Nye County Report by: Pat Cummings Survey Data In September 2013, an aerial bighorn survey on Bare Mountain yielded a sample of 211 sheep. The sample was comprised of 63 rams, 91 ewes and 57 lambs. In October 2011, the largest aerial survey sample recorded yielded a sample of 235 bighorn sheep. The sample reflected sex and age ratios of 53 rams:100 ewes:73 lambs. Habitat Bighorn sheep inhabiting Bare Mountain have endured prolonged dry conditions. Scant precipitation receipts have resulted in reduced forage plant production, and contributed to early drying of Specie Spring. In the last 3 years, precipitation receipts in winter and spring months were insufficient to adequately recharge bighorn
DESERT BIGHORN
78
water developments on Bare Mountain. In spring 2012 and again in 2013, costly aerial water haul operations were undertaken to partially recharge water developments. During this time, many bighorn on Bare Mountain frequented and relied on the water available at 2 troughs on the Sterling Gold Mine property. Environmental conditions in early 2014 remain largely unchanged. As of late February 2014, total water storage inclusive of 4 water developments equated to only 30% of total capacity. This spring, there will be a new approach to address the already current year water storage deficit. Rather than undertaking costly aerial water haul operations, temporary water stations will be established on the west and north sides of Bare Mountain. The water stations will entail situating storage tanks designed with built-in drinkers adjacent to bighorn sheep escape terrain. The water stations will also be accessible by water tender. Bighorn sheep inhabiting Bare Mountain not only cope with lingering drought conditions marked by limited forage plant production and scarce water resources, but also environmental impacts brought about by excess burros. The northern half of Bare Mountain lies within the Bullfrog Herd Management Area. The town of Beatty, Nevada is centrally located within the Herd Management Area (HMA), and US 95 divides the HMA into eastern and western portions. The Bureau of Land Management (BLM) established the appropriate management level (AML) for feral burros in the herd management area (HMA) at 58-91. In January 2012, BLM finalized planning efforts to capture and remove excess feral burros from the Bullfrog HMA, and all burros beyond the established boundaries of the HMA. At that time, an aerial burro census resulted in 195 feral burros counted, of which 42 were encountered outside of the HMA. Undetected burros notwithstanding, the census over 2 years ago reflected a burro population 236% above the lower end of AML. According to BLM, the burro population of 195 would continue to increase at an estimated rate of 16% annually. The BLM identified the burro gather would begin in March 2012. However, the burro gather was never accomplished and was postponed indefinitely due to lack of funding and limited space at short-term holding facilities. Consequently, the burro population has likely expanded (16% annually) to over 250 in 2014. In August 2009, the Bureau of Land Management (BLM) issued a Decision Record approving the Reward Mine project on Bare Mountain. The CR Reward Corporation (CRRC) planned to build an open pit gold mine and heap leach processing facility. CRRC holds claims on an area of approximately 2,006 acres. The project area is located on the west side of Bare Mountain including and surrounding the site of the old Gold Ace Mine. The northern boundary of the project area is within one-half mile of the Bare #2 water development. Last year, CRRC recently announced indefinite suspension of mine operations. In April 2013, a fourth water development was constructed on the southwest side of Bare Mountain. The new development incorporated a cross-leveling design (no float valve), a steel collection apron, 5 low profile tanks and an offset steel drinker. The total storage capacity of the new project is approximately 11,000 gallons. The water development is located 0.5 mile northwest of existing Bare #1, and was originally intended to replace the older and less reliable water development. In late April 2010, Fraternity of the Desert Bighorn members and NDOW personnel performed important upgrades to the Bare #3 water development. The improvements included increased storage capacity and installation of a cross-leveling system that incorporates new, low-profile tanks and a new drinker. Population Status and Trend In early November 2013, a bighorn sheep capture and removal operation was conducted on Bare Mountain to reduce the population, and to fulfill population augmentation objectives in Mineral County. In the course of a single day, 38 ewes, 8 lambs and 4 young rams were captured, translocated and released. Body conditions scores trended notably lower than the scores recorded during the capture operation in fall 2011. The 2014 population estimate for bighorn sheep inhabiting Bare Mountain reflects a decrease relative to the estimate reported last year. The lowered population estimate is the result of fall 2013 bighorn captures and removals. The apparent rapid and substantial herd expansion detected in successive aerial surveys conducted in 2009 and 2011 could not be simulated in the population model. It was reasoned that much of the population
DESERT BIGHORN
79
expansion was due to ewe and ram ingress from adjacent areas administered by Department of Defense (DOD-Nellis Test and Training Range) and Department of Energy (DOE-Nevada Test Site). Population expansion in 2012 was primarily attributable to the many lambs encountered during the aerial survey conducted in October 2011. In November 2011, due to concerns centered on the apparent profound population expansion coupled with dry range conditions, 26 bighorn sheep were captured and translocated to the South Pahroc Range. The capture contingent was comprised of 20 ewes, 5 lambs and 1 ram. Bighorn sheep movements through the Beatty Wash—west Yucca Mountain area serve to maintain connectivity between sheep on Bare Mountain and sheep in adjacent mountains on DOD and DOE lands. The area may be characterized as hills bisected by washes. Due to relatively low topographic relief and lack of water, bighorn sheep use of the area is reasoned to be primarily seasonal (late fall/winter/spring). Although the Beatty Wash area is not high quality bighorn habitat, its value as a movement corridor should be recognized in land use planning. In 2009, the Bureau of Land Management (BLM) made a land use decision that may jeopardize continued bighorn sheep use of the Beatty Wash—west Yucca Mountain area. The BLM Tonopah Field Station issued a Decision Record that approved what has become the annual off-road, TSCO Vegas to Reno Race. The race attracts over 300 entrants competing in several vehicle classes including: motorcycles, ATVs, UTVs, high clearance SUVs, 4x4 trucks, and dune buggies. The event has been advertised as, “THE LONGEST OFF-ROAD RACE IN THE UNITED STATES.” The decision to approve the race is an indication that BLM officials failed to adequately consider impacts from establishment of a new road segment through a roadless area recovering from the 2006 Beatty Fire. NDOW remains concerned the decision process failed to adequately analyze direct, indirect and cumulative impacts of the annual race and newly created thoroughfare. One of the anticipated impacts of a race course through the Beatty Burn and Beatty Wash area centers on bighorn sheep avoidance as a result of the route becoming a year-round attractant for casual users of recreational OHVs. Unit 254: Specter Range; Southern Nye County Report by: Pat Cummings Survey Data No aerial bighorn sheep survey was conducted over the Specter Range in 2013. The last aerial survey was conducted in late September 2010. The brief 2.5-hour aerial survey yielded a sample of 56 bighorn sheep. The sample reflected sex and age ratios of 68 rams:100 ewes:32 lambs. The next aerial survey over the Specter Range is expected to occur in fall 2014 Habitat Bighorn sheep inhabiting the Specter Range have endured overall prolonged dry conditions. Scant precipitation receipts have resulted in reduced forage plant production, and only partial recharge of six water developments. Water development inspections conducted in February 2014 revealed total water storage inclusive of 6 water developments equated to 77% of total capacity. There are no known springs or seeps in the Specter Range. Several years ago, evidence (i.e., scat) of feral burros was encountered in the western portion of the Specter Range. Subsequently, in the course of conducting water development inspections in February 2011, NDOW personnel observed 6 feral burros one mile southwest of Specter #4 (Redtail). It is strongly suspected these animals ventured south over 30 miles from the Bullfrog Herd Management Area. It is known that burros moved south from the Herd Management Area (HMA) to access the pond at the Sterling Gold Mine and further south to access the Cinder Cone Pit. Google Imagery portrays burro trails that link the pond at the Sterling Gold Mine to Cinder Cone Pit along US 95, and intermittent trail segments that reach and emanate from Lathrop Wells. Trails may be discerned linking Lathrop Wells and the Striped Hills (western extent of the Specter Range). In 2011, the BLM Tonopah Field Office was notified of burro ingress to the Specter Range. Later in 2011, BLM
DESERT BIGHORN
80
issued a draft Bullfrog HMA feral burro gather plan and Environmental Assessment (EA). The final gather plan, EA and Decision Record were issued in January 2012. The BLM identified the burro gather would begin in March 2012, and cited as high priority the capture and removal of burros outside the HMA boundary. The burro gather was never accomplished and was postponed indefinitely due to lack of funding and limited space at short-term holding facilities. In February 2008, the Eagle Basin water development in the Specter Range was upgraded. The water storage capacity of the new, cross-leveling system was expanded from 6,900 gallons to 9,000+ gallons. Population Status and Trend In the Specter Range, events beginning at least as early as Fall 2002 indicated the population was coping with disease. Available evidence suggested bacterial pneumonia may have been a factor in high mortality among lambs. Recruitment in 6 consecutive years (2002-07) was low to negligible. In spring 2008, several observations were made of ewes with attendant lambs. Remote cameras installed at water developments in late spring and summer documented lamb survival through summer 2008. Lamb survival was further noted in the subsequent aerial surveys conducted in 2008 and 2010. Although the Specter Range bighorn sheep population appears to be no longer on a downward trend, successive years of poor lamb recruitment have resulted in comparatively fewer rams in older age cohorts. The bighorn population estimate approximates the estimate reported last year. The last aerial bighorn sheep survey over the Specter Range was conducted in fall 2010. Completion of an aerial survey in fall 2014 is a priority to accurately assess current bighorn population status. Unit 261: Last Chance Range; Southeastern Nye County Report by: Pat Cummings Survey Data No aerial bighorn sheep survey was conducted over the Last Chance Range in 2013. The last aerial survey was conducted in fall 2011. The survey yielded a sample of 111 bighorn sheep. The sample reflected sex and age ratios of 89 rams:100 ewes:47 lambs. Bighorn sheep were encountered primarily on the northwest ridges and the high prominent southeast ridge. Two years earlier, an aerial survey yielded a sample of 162 bighorn sheep. The sample was the largest recorded and reflected sex and age ratios of 54 rams:100 ewes:41 lambs. Habitat Range conditions in the Last Chance Range may be characterized as fair. Based on inspections of the seven water developments in the Last Chance Range in February 2014, the collective amount of stored water leading into the spring and summer months amounted to 89% of total capacity. The inspections also revealed universally heavy sheep use of the water developments during summer 2013. A consequence of the expanding human population in the Pahrump Valley is habitat degradation resulting from dispersed recreational use of off-highway-vehicles (OHV), and in the recent past, permitted OHV races. Population Status and Trend The 2014 population estimate for bighorn sheep inhabiting the Last Chance Range approximates the estimate reported last year. Recent population estimates reflect a sharp increase relative to 120 reported in 2009. The higher population estimate is consistent with fall 2009 and 2011 aerial survey sample sizes and gender and age classifications. However, in that the apparent scale and abruptness of the expansion could not be simulated in the population model, it was postulated that there was ingress of ewes and older age-class rams from adjacent ranges. Nearby areas from which sheep may have originated include: Nopah Range, Resting Spring Range, Funeral Mountains and Spring Mountains.

DESERT BIGHORN
81
In October 2007, 2 Pahrump residents encountered an undetermined number of bighorn carcasses at and near the Last Chance #5 water development. Based on the initial report and follow up investigation, it was believed that 10 bighorn sheep died during summer 2007. In the absence of rain, the 2 central water developments were expected to go dry in early summer 2007. It was deemed cost prohibitive to haul water to LC #5 and LC #4, and reasoned that sheep under hydration stress in the central areas would move to water developments situated to the north or south. Unit 262: Spring Mountains (La Madre, Red Rock and South Spring Mountains) and Bird Spring Range; Western Clark County Report by: Pat Cummings Survey Data The bighorn sheep population inhabiting Unit 262 was again extensively surveyed due to concerns related to low observed lamb ratios in 2010 and 2012, and reports beginning in spring 2011 of sick animals on the north end of the Red Rock Escarpment. Aerial survey efforts equated to 23.4 hours, and were focused over the following areas: La Madre Mountain, Brownstone Basin, Calico Hills, Red Rock Escarpment, Potosi Mountain (east and south), Bird Spring Range, Shenandoah Peak complex, Table Mountain, Little Devil Peak and Devil Peak. The survey yielded a sample of 216 bighorn sheep. The observed sex and age ratios were 60 rams:100 ewes:30 lambs. In October 2012, extensive aerial survey efforts equated to 16.5 hours, and yielded the largest sample recorded. The sample of 235 sheep) reflected sex and age ratios of 41 rams:100 ewes:22 lambs. Surveys from past years in the La Madre Mountain and Red Rock Escarpment areas are being reassessed as part of the investigation into their recent disease events and subherd declines. In September 2010, an aerial survey of the 2 areas totaled 56 bighorn sheep. The observed sex and age ratios were 29 rams:100 ewes:18 lambs. In October 2006, an aerial survey conducted in the 2 areas yielded a sample of 104 bighorn sheep with an observed sex and age ratios of 55 rams:100 ewes:42 lambs. At the time, the survey effort resulted in the largest recorded sample, and documented bighorn presence and distribution along the prominent south ridge that defines Box Canyon. Habitat Unit 262 tends to receive more precipitation than most other areas in Clark County. Bighorn sheep generally benefit from adequate range conditions on a consistent basis; however, due to proximity to Las Vegas, recreational pursuits (e.g., OHV and mountain bike use/proliferation of roads and trails, rock climbing), feral horses and burros, and suburban sprawl serve to degrade habitat. On 22 June 2005, lightning strikes in the higher elevations near Potosi Peak ignited the Goodsprings Fire. The heavy accumulation of fine fuels coupled with high winds allowed the fire to spread along ridgelines and ultimately consume vegetation across 33,484 acres. The Goodsprings Fire consumed plants within 3 vegetative associations: Creosote-Bursage Flats, Mojave Desert Scrub, and Pinyon-Juniper Woodland along a 3,940’-elevation gradient. Landmark areas within the Goodsprings Fire included: northern portion of the Bird Springs Range; eastern portion of Cottonwood Valley, northern portion of Goodsprings Valley, eastern and southern Potosi Mountain and Shenandoah Peak. Severely and extensively burned areas with little to no remaining vegetation included: northern portion of Goodsprings Valley, Double Up Mine canyon, Cave Spring canyon and Shenandoah Peak. Areas burned that contained a few small mosaics of remaining vegetation included: the northern portion of the Bird Spring Range, Ninety-nine Spring canyon, and areas southwest, south and east of Shenandoah Peak. In addition, vegetation associated with approximately 3 springs and numerous wash complexes were impacted by fire. Population Status and Trend In September 2010, aerial bighorn sheep survey data portrayed low lamb representation in population segments inhabiting La Madre Mountain, Brownstone Basin, Calico Hills and the Red Rock Escarpment. Several months
DESERT BIGHORN
82
after the fall 2010 aerial survey, beginning in spring 2011, reports of adult bighorn sheep coughing and apparently sneezing, were received from people recreating along the lower elevations of the north portion of the Red Rock Escarpment. In May 2011, in the course of investigating whether a disease process was impacting the bighorn sheep population, seven penned domestic sheep were located on a private parcel in Calico Basin. The small rural community in Calico Basin is nestled within bighorn habitat. The community lies below red sandstone ridges and cliffs that characterize Red Rock Canyon. The distance from bighorn sheep escape terrain and the penned domestic sheep was approximately 100 yards. The possibility of earlier nose-to-nose contact between bighorn and domestic was quite real. In 2012, aerial bighorn sheep surveys conducted north of State Route 160 reflected few lambs (11 lambs per 100 ewes) in the population, while population data collected south of the highway reflected an otherwise expected lamb component (42 lambs per 100 ewes). The most extensive aerial bighorn sheep survey conducted in Unit 262 to date was accomplished in fall 2013. Relative to survey results in 2012, the recent survey reflected greater lamb representation in the population. Overall, recent population data portray 30 lambs per 100 ewes. North of State Route 160, the lamb ratio was 29 per100 ewes; south of State Route 160, the lamb ratio was 31 per 100 ewes. In early November 2013, in response to reports of sick bighorn sheep and unsettling aerial survey results, NDOW undertook disease surveillance measures in the Spring Mountains and the Bird Spring Range. A total of 13 bighorn sheep was captured, sampled (i.e., blood, nasal swabs) and released. Eight bighorn sheep were sampled south of State Route 160 inclusive of the Bird Spring Range and 5 sheep were sampled north of the highway. On the south end of the Red Rock Escarpment, 2 animals were fitted with satellite GPS telemetry collars and released. Diagnostic results demonstrated that a proportion of sampled bighorn sheep inhabiting the Spring Mountains and Bird Spring Range tested positive for two strains of Mycoplasma ovipneumoniae. A proportion of the sampled individuals tested positive for the strain detected in bighorn herds occupying the McCullough Range, River Mountains and Eldorado Mountains. The results also confirmed a second strain of M. ovipneumoniae in common with bighorn populations on the Mojave National Preserve. In the near term, efforts to better assess the status of the bighorn sheep population should include additional extensive aerial surveys and periodic captures and physical examinations of sheep. Desert bighorn sheep in the Spring Mountains face a host of challenges with respect to habitat degradation, fragmentation and loss. In the La Madre Ridge area, human encroachment in the form of suburban sprawl and OHV use has eliminated and degraded bighorn sheep habitat. Increasingly, land management emphasis in the Red Rock area is to accommodate human recreational pursuits that are often incompatible with habitat and wildlife conservation. Future large-scale projects include an upgrade of the Sandy Valley Road and likely development of a wind-energy power generation plant in the Table Mountain area. In the late 1990s, the Las Vegas District Bureau of Land Management (BLM) administratively designated a large area (approximately 3,641 acres) east of La Madre Ridge as the Lone Mountain Community Pit (LMCP). The intent of the designation was to accommodate local demand for an additional source of sand and gravel to support development in Southern Nevada. However, the BLM designated LMCP without adequate evaluation of environmental impacts or review of existing documents. In the 1960s, BLM identified much of the area now within the boundary of LMCP as seasonally important for bighorn sheep. Unit 263: McCullough Range and Highland Range; Southern Clark County Report by: Pat Cummings Survey Data In October 2013, aerial bighorn sheep surveys were accomplished in the Highland Range and McCullough Range. In the Highland Range, 5 rams, 14 ewes and 6 lambs were encountered. In the McCullough Range, 274 sheep
DESERT BIGHORN
83
were classified reflecting sex and age ratios of 52 rams:100 ewes:15 lambs. Bighorn sheep were encountered on the prominent ridge south of Railroad Pass, the hills south and west of the Blue Quartz Mine, the north end of the range, near Roy and Linda water developments and north and south of McCullough Pass. In October 2012, aerial bighorn sheep surveys over the north McCullough Range yielded a sample of 231 bighorn sheep. The sample reflected sex and age ratios of 38 rams:100 ewes:14 lambs. In September 2011, aerial bighorn sheep surveys were accomplished in the Highland Range and McCullough Range. In the Highland Range, 10 rams, 12 ewes and 2 lambs were encountered. In the McCullough Range, 153 sheep were classified reflecting sex and age ratios of 51 rams:100 ewes:43 lambs. Habitat In February 2013, the Poppy water development was reconstructed. Situated in the North McCullough Wilderness, the existing 3 upright poly tanks were replaced with low profile IRM tanks (manufactured by Innovative Rotational Molding). The old drinker and float valve were replaced with a new drinker to complete the leveled system. Water storage capacity was nearly doubled from 4,650 gallons to 8,800 gallons. As of early April 2013, the Poppy unit is filled to approximately 52% capacity and the remaining 3 water developments in the North McCullough Range are filled to capacity. Several projects to construct recreation trails in bighorn sheep habitat are underway or completed. The City of Henderson is constructing trails on the north end of the McCullough Range, and BLM will ultimately complete a network of linking trails in Sloan Canyon National Conservation Area and in 2 wilderness areas. The Record of Decision for the Eldorado—Ivanpah Transmission Line Project was signed in May 2011. Southern California Edison recently constructed a new 230-kV transmission line through north McCullough Pass that now links the Eldorado Substation and the Ivanpah Substation near Mountain Pass in California. Population Status and Trend In 2012, aerial bighorn sheep surveys conducted over the northern half of the McCullough Range reflected few lambs in the population. Subsequently, 3 bighorn sheep hunters and a guide reported inordinate bighorn mortalities during the 2012 hunt season. One tagholder indicated several dead lambs unrelated to predation. Two hunters noted bighorn that seemed sick (i.e., coughing, running noses, excessive licking). A master guide, familiar with Unit 263, stressed the point that there were fewer bighorn sheep in the McCullough Range. In December 2012 and January 2013, ground-based efforts to assess bighorn health status through use of optics failed to detect clinically sick animals. However, remains of several adult bighorn sheep were noted. Similar to accounts from reporting bighorn sheep hunters, the condition of remains suggest the sheep died in the latter half of 2011. However, aerial survey data from September 2011 were in line with expectations, and no hunters in 2011 reported excessive mortalities or sick animals. In early November 2013, in response to reports of sick bighorn sheep and inordinate skeletal remains coupled with unsettling aerial survey results, NDOW undertook disease surveillance measures in the McCullough Range. Ten bighorn sheep were captured, sampled (i.e., blood, nasal swabs) and released. Animals were captured and sampled north and south of McCullough Pass. In the McCullough Pass area, two animals were fitted with satellite GPS telemetry collars and released. Diagnostic results demonstrated that a proportion of sampled bighorn sheep inhabiting the McCullough Range tested positive for Mycoplasma ovipneumoniae. The results also indicated some of the sampled sheep in the River Mountains, Eldorado Mountains and Spring Mountains tested positive for the same strain of M. ovipneumoniae. Tests further revealed a separate strain of M. ovipneumoniae recently detected in bighorn sheep in the McCullough Range is not the same strain found in sheep on the Mojave National Preserve. In the near term, efforts to better assess the status of the population should include additional extensive aerial surveys and periodic captures and physical examinations of sheep.
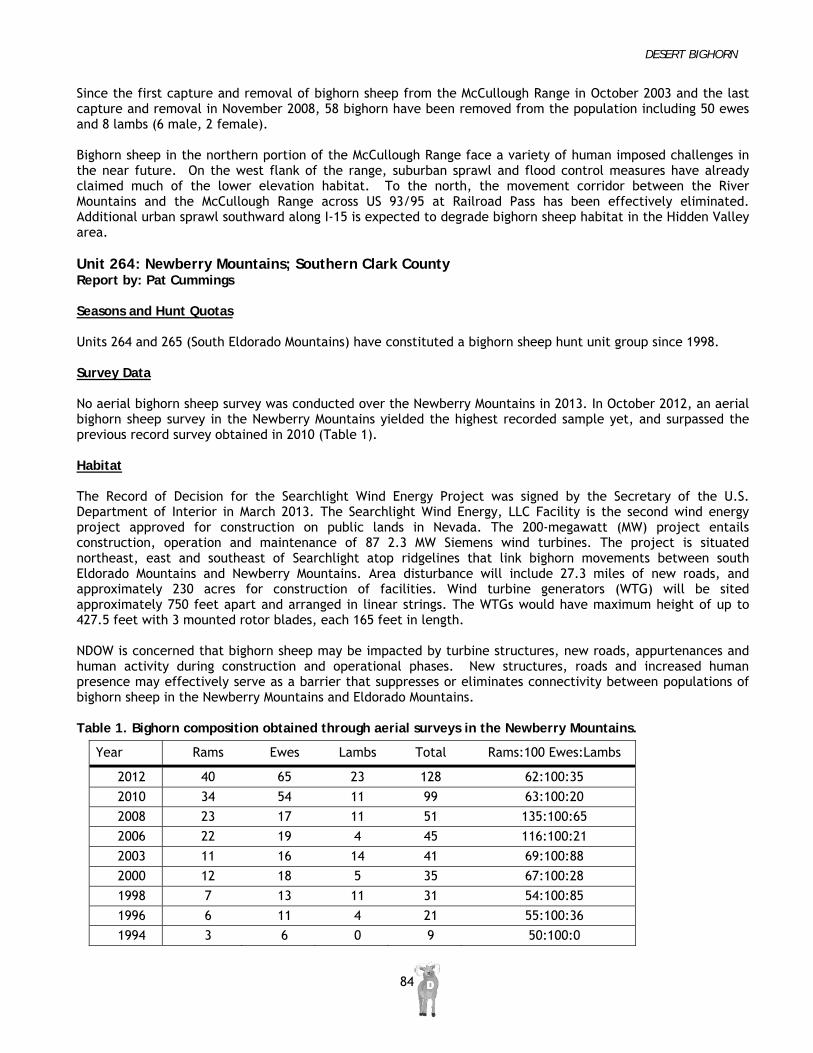
DESERT BIGHORN
84
Since the first capture and removal of bighorn sheep from the McCullough Range in October 2003 and the last capture and removal in November 2008, 58 bighorn have been removed from the population including 50 ewes and 8 lambs (6 male, 2 female). Bighorn sheep in the northern portion of the McCullough Range face a variety of human imposed challenges in the near future. On the west flank of the range, suburban sprawl and flood control measures have already claimed much of the lower elevation habitat. To the north, the movement corridor between the River Mountains and the McCullough Range across US 93/95 at Railroad Pass has been effectively eliminated. Additional urban sprawl southward along I-15 is expected to degrade bighorn sheep habitat in the Hidden Valley area. Unit 264: Newberry Mountains; Southern Clark County Report by: Pat Cummings Seasons and Hunt Quotas Units 264 and 265 (South Eldorado Mountains) have constituted a bighorn sheep hunt unit group since 1998. Survey Data No aerial bighorn sheep survey was conducted over the Newberry Mountains in 2013. In October 2012, an aerial bighorn sheep survey in the Newberry Mountains yielded the highest recorded sample yet, and surpassed the previous record survey obtained in 2010 (Table 1). Habitat The Record of Decision for the Searchlight Wind Energy Project was signed by the Secretary of the U.S. Department of Interior in March 2013. The Searchlight Wind Energy, LLC Facility is the second wind energy project approved for construction on public lands in Nevada. The 200-megawatt (MW) project entails construction, operation and maintenance of 87 2.3 MW Siemens wind turbines. The project is situated northeast, east and southeast of Searchlight atop ridgelines that link bighorn movements between south Eldorado Mountains and Newberry Mountains. Area disturbance will include 27.3 miles of new roads, and approximately 230 acres for construction of facilities. Wind turbine generators (WTG) will be sited approximately 750 feet apart and arranged in linear strings. The WTGs would have maximum height of up to 427.5 feet with 3 mounted rotor blades, each 165 feet in length. NDOW is concerned that bighorn sheep may be impacted by turbine structures, new roads, appurtenances and human activity during construction and operational phases. New structures, roads and increased human presence may effectively serve as a barrier that suppresses or eliminates connectivity between populations of bighorn sheep in the Newberry Mountains and Eldorado Mountains. Table 1. Bighorn composition obtained through aerial surveys in the Newberry Mountains.
Year Rams Ewes Lambs Total Rams:100 Ewes:Lambs
2012 40 65 23 128 62:100:35
2010 34 54 11 99 63:100:20
2008 23 17 11 51 135:100:65
2006 22 19 4 45 116:100:21
2003 11 16 14 41 69:100:88
2000 12 18 5 35 67:100:28
1998 7 13 11 31 54:100:85
1996 6 11 4 21 55:100:36
1994 3 6 0 9 50:100:0
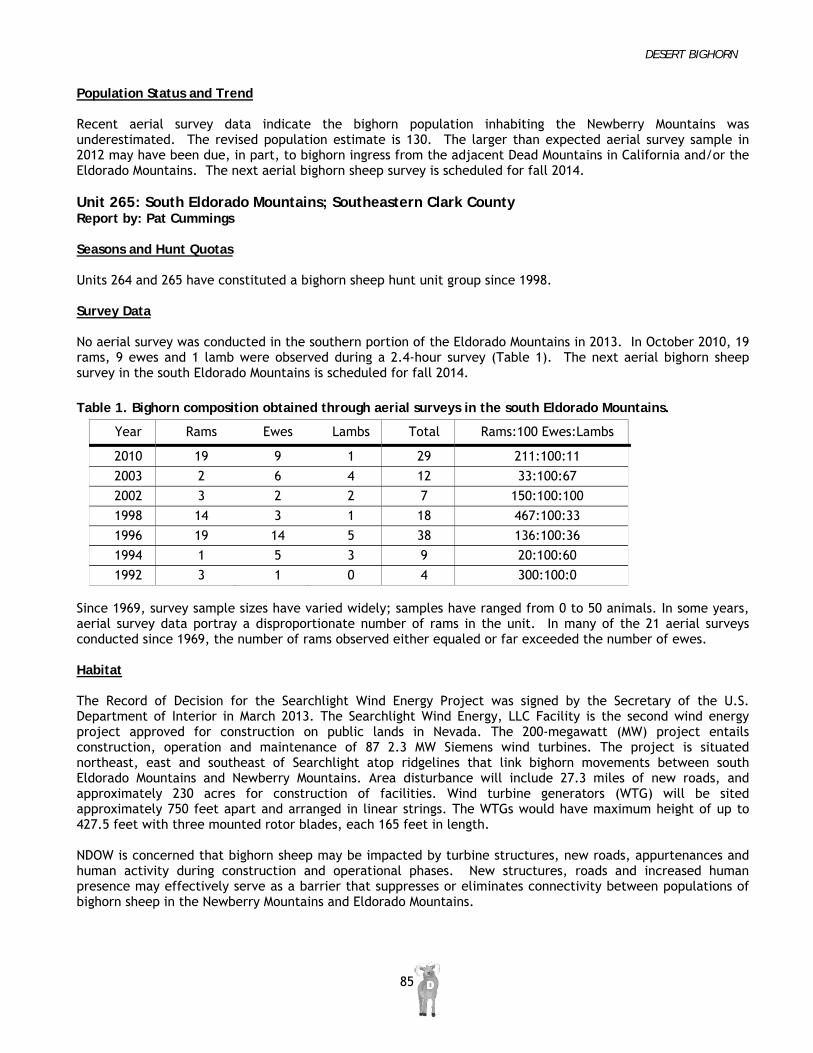
DESERT BIGHORN
85
Population Status and Trend Recent aerial survey data indicate the bighorn population inhabiting the Newberry Mountains was underestimated. The revised population estimate is 130. The larger than expected aerial survey sample in 2012 may have been due, in part, to bighorn ingress from the adjacent Dead Mountains in California and/or the Eldorado Mountains. The next aerial bighorn sheep survey is scheduled for fall 2014. Unit 265: South Eldorado Mountains; Southeastern Clark County Report by: Pat Cummings Seasons and Hunt Quotas Units 264 and 265 have constituted a bighorn sheep hunt unit group since 1998. Survey Data No aerial survey was conducted in the southern portion of the Eldorado Mountains in 2013. In October 2010, 19 rams, 9 ewes and 1 lamb were observed during a 2.4-hour survey (Table 1). The next aerial bighorn sheep survey in the south Eldorado Mountains is scheduled for fall 2014.
Table 1. Bighorn composition obtained through aerial surveys in the south Eldorado Mountains.
Year Rams Ewes Lambs Total Rams:100 Ewes:Lambs
2010 19 9 1 29 211:100:11
2003 2 6 4 12 33:100:67
2002 3 2 2 7 150:100:100
1998 14 3 1 18 467:100:33
1996 19 14 5 38 136:100:36
1994 1 5 3 9 20:100:60
1992 3 1 0 4 300:100:0 Since 1969, survey sample sizes have varied widely; samples have ranged from 0 to 50 animals. In some years, aerial survey data portray a disproportionate number of rams in the unit. In many of the 21 aerial surveys conducted since 1969, the number of rams observed either equaled or far exceeded the number of ewes. Habitat The Record of Decision for the Searchlight Wind Energy Project was signed by the Secretary of the U.S. Department of Interior in March 2013. The Searchlight Wind Energy, LLC Facility is the second wind energy project approved for construction on public lands in Nevada. The 200-megawatt (MW) project entails construction, operation and maintenance of 87 2.3 MW Siemens wind turbines. The project is situated northeast, east and southeast of Searchlight atop ridgelines that link bighorn movements between south Eldorado Mountains and Newberry Mountains. Area disturbance will include 27.3 miles of new roads, and approximately 230 acres for construction of facilities. Wind turbine generators (WTG) will be sited approximately 750 feet apart and arranged in linear strings. The WTGs would have maximum height of up to 427.5 feet with three mounted rotor blades, each 165 feet in length. NDOW is concerned that bighorn sheep may be impacted by turbine structures, new roads, appurtenances and human activity during construction and operational phases. New structures, roads and increased human presence may effectively serve as a barrier that suppresses or eliminates connectivity between populations of bighorn sheep in the Newberry Mountains and Eldorado Mountains.
DESERT BIGHORN
86
Population Status and Trend In early September 2013, given concerns that pathogenic bacteria were associated with or causing pneumonia in bighorn sheep inhabiting the River Mountains, a female lamb exhibiting coughing and nasal discharge was chemically immobilized in Hemenway Park, Boulder City. The lamb was subsequently euthanized and necropsied. Through necropsy and diagnostic tests, it was confirmed the sheep was battling pneumonia and was positive for Mycoplasma ovipneumoniae. Bighorn sheep in the River Mountains often cross US 93 and move into the Eldorado Mountains. The respiratory disease confirmed in the lamb from the River Mountains coupled with unsettling aerial survey results prompted concerns relative to the health status of bighorn sheep in the Eldorado Mountains. In early November 2013, NDOW undertook disease surveillance measures in the Eldorado Mountains. Nine bighorn sheep were captured, sampled (i.e., blood, nasal swabs) and released. A tenth sheep, a lamb, was captured, euthanized and subsequently necropsied. Diagnostic results demonstrated that a proportion of sampled bighorn sheep inhabiting the Eldorado Mountains tested positive for M. ovipneumoniae. Furthermore, it was subsequently confirmed the necropsied lamb was battling pneumonia and was positive for M. ovipneumoniae. The results also indicated some of the sampled sheep in the River Mountains, McCullough Range and Spring Mountains tested positive for the same strain of M. ovipneumoniae. Tests further revealed the strain of M. ovipneumoniae recently detected in bighorn sheep in the Eldorado Mountains is not the same strain found in sheep on the Mojave National Preserve. In the near term, efforts to better assess the status of the population should include additional extensive aerial surveys and periodic bighorn captures and physical examinations. The southern Eldorado Mountains support a low-density resident bighorn herd, as well as a fall migrant segment from the northern portion of the range. The 2014 population estimate for the herd inhabiting the entire Eldorado Mountains (Units 265 and 266) reflects a decline relative to the estimate reported last year. The modeled population decline was an attempt to account for substantially reduced lamb survival in 2013 and 2014. Unit 266: North Eldorado Mountains; Southeastern Clark County Report by: Pat Cummings Survey Data In October 2013, an aerial survey conducted over the north Eldorado Mountains yielded a sample of 75 bighorn sheep. The observed sex and age ratios were 41 rams:100 ewes:12 lambs. As was the case in 2012, bighorn sheep encountered during the aerial survey were noted as not exhibiting normal startle responses (i.e., fleeing). Upon initial detections, bighorn sheep were standing or lying down. It is strongly suspected bighorn sheep have become habituated to the consistent outbound and inbound tour helicopters that originate out of the Boulder City Airport enroute to the Grand Canyon. In that motionless animals are difficult to detect, it is anticipated there will be that added challenge in conducting future aerial surveys. In late September 2011, an aerial survey yielded a sample of 75 bighorn sheep. The observed sex and age ratios were 81 rams:100 ewes:53 lambs. Habitat The bighorn sheep herd in the Eldorado Mountains has and will continue to face additional human imposed challenges. Two massive highway projects are intended to divert traffic from Hoover Dam and Boulder City. The Hoover Dam Bypass Bridge and new U.S. 93 alignment was opened to traffic in October 2010. The new bridge spans the Colorado River approximately 1,500 feet downstream of the dam. The second bypass project is planned to extend the new U.S. 93 alignment east and south of Boulder City through the northern portion and western flank of the Eldorado Mountains. On the northern end of the Eldorado Mountains, the herd has coped not only with persistent drought conditions (2000-02 and 2006-09), but also periodic deaths consequential to collisions with vehicles along U.S. 93. The highway traverses through a bighorn sheep core-use area and likely represents a population sink. The

DESERT BIGHORN
87
magnitude of the problem is somewhat unclear as it is expected only a fraction of bighorn-vehicle collisions are reported. In October 2003, in efforts to better understand how the Hoover Dam Bypass project may impact bighorn sheep, the Federal Highway Administration, National Park Service and Nevada Department of Wildlife cooperated in capture of 20 bighorn sheep subsequently fitted with GPS and VHF telemetry subsystems. The objectives were to obtain baseline information on bighorn movements and distributions before and during construction phases. The information would later facilitate identification of impacts that may be mitigated, as well as impacts that may be irreversible. Population Status and Trend See the Unit 265 report’s Population Status and Trend section (first 2 paragraphs) for details on disease detection and surveillance in both the North and South Eldorado Mountains. The 2014 population estimate for the herd inhabiting the entire Eldorado Mountains (Units 265 and 266) reflects a decline relative to the estimate reported last year. The modeled population decline was an attempt to account for substantially reduced lamb survival in 2013 and 2014. Unit 267: Black Mountains; Eastern Clark County Report by: Pat Cummings Survey Data In late October 2013, an aerial survey conducted over the Black Mountains yielded a sample of 284 bighorn sheep. The observed sex and age ratios were 35 rams:100 ewes:41 lambs. Given generally higher bighorn sheep density, the majority of the aerial survey was focused between Echo Bay and Boathouse Cove Road. Since the early 1980s, aerial survey sample sizes, lamb-to-ewe ratios and encounter rates generally trended downward. In late October 2010, an aerial survey yielded a sample of 185 bighorn sheep. The observed sex and age ratios were 66 rams:100 ewes:17 lambs. Habitat Environmental conditions as of this writing in April 2014 are fair. Thus far in 2014, precipitation receipts are below normal. The National Weather Service issued the seasonal drought outlook (late March through June 2014), and forecasted drought conditions to persist or intensify. Population Status and Trend Desert bighorn sheep occupying the Black Mountains and Muddy Mountains comprise a single population given the high degree of movement between ranges. However, environmental conditions and local population dynamics have differed markedly. Over the long term, aerial survey data portray a decline in the number of bighorn sheep inhabiting the Black Mountains, and an increase in sheep numbers in the adjacent Muddy Mountains. The bighorn sheep population inhabiting the Black Mountains and Muddy Mountains experienced an expansion in 2012 due to high lamb recruitment. Likewise, the 2014 population estimate for bighorn sheep inhabiting the Black Mountains and Muddy Mountains reflects an increase relative to the estimate reported last year. Unit 268: Muddy Mountains; Clark County Report by: Pat Cummings Survey Data In October 2013, 11.3 hours of flight time were expended to conduct an extensive aerial bighorn sheep survey over the Muddy Mountains. The survey yielded a sample of 439 bighorn sheep. The observed sex and age ratios
DESERT BIGHORN
88
were 93 rams:100 ewes:55 lambs. Bighorn sheep were widely distributed and encountered throughout much of the survey route. The survey was undertaken over the course of 3 days, and commenced over Muddy Peak. In October 2011, an aerial survey conducted over the Muddy Mountains yielded a sample of 485 bighorn sheep. The observed sex ad age ratios were 81 rams:100 ewes:63 lambs. Habitat In March 2013, the Cliff Site water development was reconstructed. The hypalon apron was replaced with a metal apron, and the four upright poly tanks were replaced with low profile IRM tanks (manufactured by Innovative Rotational Molding). The two old drinkers and float valves were replaced with a new drinker to complete the leveled system. Water storage capacity was increased 1,000 gallons from 7,800 gallons to 8,800 gallons. As of early April 2014, the Cliff Site unit is nearly filled to capacity. However, due to overall dry conditions in 2013 and early 2014, the 2 water developments situated on the south end of Muddy Peak are very nearly dry. Viewed collectively among the 6 water developments, the current water store equates to only 53% of total storage capacity. This spring, there will be a new approach to address the already current year water storage deficit. Rather than undertaking costly aerial water haul operations, temporary water stations will be established in west and central areas. The water stations will entail situating storage tanks designed with built-in drinkers adjacent to bighorn sheep escape terrain. The water stations will also be accessible by water tender. In late March 2012, the Five Ram water development was upgraded. Notably, the project was fully converted to a leveled system, thus eliminating the need for a float valve. The upgrade also entailed removal of 3 aged, high profile poly tanks and installation of 5 new, low profile tanks and a drinker. The upgrade augmented the water storage capacity from roughly 10,350 gallons to approximately 13,600 gallons. Environmental conditions as of this writing in April 2014 are fair to good. Thus far in 2014, precipitation receipts are below normal. The National Weather Service issued the seasonal drought outlook (late March through June 2014), and forecasted drought conditions to persist or intensify. Population Status and Trend Desert bighorn sheep occupying the Muddy Mountains and Black Mountains comprise a single population given the high degree of movement between ranges. However, environmental conditions and local population dynamics have differed markedly. Over the long term, aerial survey data portray a decline in the number of bighorn sheep inhabiting the Black Mountains, and an increase in sheep numbers in the adjacent Muddy Mountains. The bighorn sheep population inhabiting the Black Mountains and Muddy Mountains experienced an expansion in 2012 due to high lamb recruitment. Likewise, the 2014 population estimate for bighorn sheep inhabiting the Black Mountains and Muddy Mountains reflects an increase relative to the estimate reported last year. In early November 2013, a bighorn sheep capture and removal operation was conducted in the Muddy Mountains to reduce the population, and to accommodate the request for bighorn sheep from Utah Division of Wildlife Resources (UDWR). In the course of 2 days, 40 ewes, 7 lambs and 3 young rams were captured and furnished to UDWR. One ewe was necessarily euthanized due to capture related injuries. The 49 sheep were released in the Glen Canyon National Recreation Area. In early November 2012, a bighorn sheep capture removed 18 ewes, 4 lambs and 3 18-month-old rams for the UDWR. The sheep were released in the south-central portion of the Kaiparowits Plateau north of Lake Powell. In late October and early November 2011, a bighorn sheep capture removed 50 bighorn over 2 days for augmentations of herds inhabiting the Delamar Mountains and Meadow Valley Mountains. In early November 2009, 19 ewes and 1 lamb were captured and furnished to UDWR. The sheep were released into the Grand Staircase—Escalante National Monument in southern Utah.
DESERT BIGHORN
89
Unit 271: Mormon Mountains; Lincoln County Report by: Mike Scott Survey Data No surveys were conducted during the reporting period. The previous survey was conducted in September 2012, and resulted in the classification of 181 sheep. The survey sample was comprised of 55 rams, 102 ewes, and 24 lambs. The resulting sex and age ratios were 54 rams:100 ewes:24 lambs. Habitat Habitat conditions in the Mormon Mountains are likely poor to moderate due to below-average precipitation during 2013 and the first few months of 2014. Three of the 5 water developments appear to be holding reasonable amounts of water as of February 2014. All 5 water developments are in need of upgrade. Bighorn seem to utilize some of the areas burned in the last decade. According to the US Drought Monitor, the US Seasonal Drought Outlook is predicting that the drought conditions in this area will persist or intensify. Population Status, and Trend The Mormon Mountain bighorn population appears to be stable, and the 2014 estimate is similar to the estimate from 2013. Unit 272: Virgin Mountains and Gold Butte; Northeastern Clark County Report by: Pat Cummings Survey Data No aerial survey was conducted in Unit 272 in 2013. In late September 2011, an aerial bighorn sheep survey was conducted over the southern portion of the Virgin Mountains, Whitney Ridge, Bitter Ridge, Lime Ridge, Tramp Ridge, Iceberg Canyon, Indian Hills and The Cockscomb (Arizona). The survey yielded a sample of 11 rams, 11 ewes and 5 lambs. Habitat Environmental conditions as of this writing in April 2014 are fair to good. Thus far in 2014, precipitation receipts are below normal. The National Weather Service issued the seasonal drought outlook (late March through June 2014), and forecasted drought conditions to persist or intensify. In May 2010, reconditioning of structures and components of the spring development at New Spring was completed. The restoration was a collaborative effort between BLM, Fraternity of the Desert Bighorn and NDOW. Historically, New Spring was an important water source for wildlife and livestock. In 2000, it was noted that water was no longer available in the cement trough. In May 2004, the Virgin #1 water development was constructed northwest of Whitney Pocket to enhance habitat prior to the bighorn sheep release (augmentation) that was accomplished in October 2005. On 18 March 2006, Virgin #2 was constructed north of Whitney Pocket. In July 2006, lightning strikes ignited 4 wildland fires in the southern portion of the Virgin Mountains. The aptly named Whitney Pass Fire consumed vegetation across 230 acres on the northeast end of Whitney Ridge. The Virgin Gold Fire burned to within yards of the Virgin #2 water development before a slurry drop extinguished the fire. The Virgin Gold Fire consumed mid-elevation (Mojave Desert Scrub) and upper-elevation (pinion-juniper woodland) vegetation across 2,700 acres. At its northern point, the Virgin Gold Fire burned to within a half mile of the Virgin #1 water development. The Jeep Fire occurred northeast of the Virgin #1 water development in the vicinity of the Virgin Gold Fire, and consumed vegetation over 196 acres. East of the Key West Mine, the Double Nickel Fire consumed vegetation across 523 acres.
DESERT BIGHORN
90
In late June 2005, lightning strikes in the Gold Buttes ignited the Fork Fire and Tramp Fire. Landmarks within the burned areas included: Tramp Ridge, Gold Butte, Mica Peak, Cedar Basin, Jumbo Peak, Jumbo Basin, Anderson Ridge, Rattlesnake Peak, Garnet Valley and the north face of Bonelli Peak. Burned-over areas that included Tramp Ridge, Gold Butte, Cedar Basin and Mica Peak had a few remaining small mosaics of vegetation. Areas marked by little to no remaining vegetation included Jumbo Peak, Jumbo Basin, Anderson Ridge, Rattlesnake Peak, Garnet Valley and the north face of Bonelli Peak. In addition, vegetation associated with approximately 11 springs and at least 7 wash complexes were impacted by fire. The Fork Fire consumed plants over 44,314 acres along a 3,300’-elevation gradient (2,460’ to 5,760’) within 3 vegetative associations: Creosote-Bursage Flats, Mojave Desert Scrub, and Pinyon-Juniper Woodland. The Tramp fire consumed vegetation over 26,817 acres. Population Status and Trend On 30 October 2011, 17 bighorn sheep trapped in the River Mountains were released from the Old Gold Butte Road midway along the east side of Lime Ridge. The release complement was comprised of 12 ewes, 2 male lambs and 3 young rams. Bighorn sheep were released in the Virgin Mountains and Gold Buttes to fulfill population augmentation objectives as early as 1979. Since then, approximately 182 sheep from 4 source populations have comprised 10 release contingents. Overall, it has been difficult to assess the effectiveness of individual augmentations over time due to a variety of factors. The region’s expansiveness, remote location and complex topography have created challenges to monitoring efforts for nearly 3 decades. In view of 4 bighorn sheep augmentations since 2005, monitoring efforts in recent years have expanded beyond biennial aerial surveys and ground-based monitoring of a few marked sheep. Recent enhanced monitoring efforts entail the following: increased numbers of telemetered (VHF) animals, deployment of store-on-board GPS collars (USGS and NDOW), regular fixed-wing aerial telemetry surveys, deployment of trail cameras at water sources, and even occasional reported observations of marked animals from an avid sheep hunter familiar with Virgin Mountains and Gold Buttes. Monitoring efforts in recent years have revealed that some of the ewes released in the Virgin Mountains have dispersed. At least several ewes released in the Virgin Mountains have created home ranges in the northern portion of the Gold Buttes. Much of the precipitous bighorn sheep habitat in the Gold Buttes consists of ridges interspersed by areas of moderate terrain. Bighorn sheep released in the Virgin Mountains and Gold Buttes since 2005 inhabit the south Virgin Mountains, Whitney Ridge, Lime Ridge, Tramp Ridge, Bitter Ridge and the Cockscomb (Arizona). Presently, information remains lacking on the distribution and abundance of bighorn sheep in Iceberg Canyon, Indian Hills and Azure Ridge. In 2014, the bighorn sheep population estimate reflects a modest decline relative to the estimate reported last year. Unit 280: Spotted Range; Northwestern Clark County Report by: Pat Cummings Survey Data In October 2012, a 4.2-hour aerial survey yielded a sample of 65 bighorn sheep. Two additional sheep were encountered but were not classified. The sample was comprised of 23 rams, 36 ewes and 6 lambs. In the last 4 aerial surveys conducted since 2009, comparatively few lambs were encountered (Table 1).
Table 1. Bighorn composition obtained through aerial surveys in the Spotted Range
Year Rams Ewes Lambs Total Rams: 100 Ewes: Lambs
2012 23 36 6 65 64:100:17
2011 28 58 10 96 48:100:17
2010 33 57 11 101 58:100:19
2009 24 29 8 61 83:100:28
DESERT BIGHORN
91
2008 21 36 15 72 58:100:42
2007 24 47 28 99 51:100:60
2006 15 40 18 73 38:100:45
2005 23 49 9 81 47:100:18
2004 11 21 11 43 52:100:52
2003 7 13 1 21 54:100:8
2002 13 18 6 37 72:100:33
2001 32 26 5 63 123:100:19
2000 18 20 10 48 90:100:50 Habitat The Spotted Range is located just north of Indian Springs and resides within the boundary of the Nevada Test and Training Range. The predominant habitat type for this range is desert shrub which is typically characterized by creosote bush and black bush communities. Access to this unit is only allowed during the bighorn sheep hunt. Population Status and Trend The bighorn sheep population in Unit 280 was established through releases in 1993 and 1996. The initial release complement captured from the River Mountains, Clark County was comprised of 2 rams, 13 ewes and 10 lambs. The 1996 release contingent was also obtained from the River Mountains and consisted of 8 rams, 16 ewes and 1 lamb. The 2014 bighorn population estimate reflects a contraction due to successive years of low recruitment. Habitat improvements in the Spotted Range involve 6 water developments. Unit 281: Pintwater Range; Northwestern Clark County Report by: Pat Cummings Survey Data In September 2013, a 5.2-hour aerial survey conducted over the Pintwater Range yielded a sample of 66 bighorn sheep. The observed sex and age ratios were 41rams:100 ewes:32 lambs. In September 2012, a 5.2-hour aerial survey yielded a sample of 49 bighorn sheep. The sample was comprised of 12 rams, 28 ewes and 9 lambs. Given time of year, the survey was focused over areas within proximity to water sources. The majority of bighorn sheep encountered were within 2 miles of springs and water developments Population Status and Trend The 2014 population estimate for bighorn sheep inhabiting the Pintwater Range approximates the estimate reported last year. Unit 282: Desert Range and Desert Hills; Northwestern Clark County Report by: Pat Cummings Survey Data In September 2013, an aerial survey yielded a sample of 53 bighorn sheep. The sample was comprised of 12 rams, 29 ewes and 11 lambs. One animal was not classified. In September 2012, 83 bighorn sheep were encountered and classified during a 5.5-hour aerial survey. The sample was comprised of 27 rams, 52 ewes and 4 lambs. In September 2011, an aerial survey yielded a sample of 93 bighorn sheep. The sample was the largest recorded since 1977. The observed sex and age ratios were 117 rams:100 ewes:42 lambs. Given time of year, the survey
DESERT BIGHORN
92
was focused over areas within proximity to water sources. Habitat Bighorn sheep endured overall dry conditions in 2013 and early 2014. Forage plant species are in fair to good condition in early 2014. The 5 water developments collectively are recharged to 79% of total storage capacity. In March 2011, a new water development was constructed in White Sage Gap. The new unit was situated less than 400 yards west of the older, smaller water development, and was constructed to better ensure water availability on the south end of the range. Population Status and Trend The bighorn sheep population inhabiting the Desert Range contracted in 2013 due to low recruitment. Indications are the population may have experienced a modest rebound in 2014. Historically, many bighorn sheep occupying the Desert Range were fall and winter migrants from the adjacent Sheep Range. Over the long term, the observed proportion of lambs to ewes obtained through aerial surveys has been low. Unit 283, 284: East Desert Range and Sheep Range; Northern Clark County Report by: Pat Cummings Survey Data No aerial bighorn sheep survey was conducted over the Sheep Range or East Desert Range in 2013. In September 2012, aerial bighorn sheep surveys were conducted over the northeast, northwest, south and southwest portions of the Sheep Range, Black Hills, East Desert Range and Enclosure Ridge. In the course of 16 hours of survey, 168 bighorn sheep were classified. The observed sex and age ratios were 44 rams:100 ewes:14 lambs. Habitat In a 3-year period (2004-06), wildland fires ignited by lightning strikes during summer months burned vegetation along thousands of acres on the east side of the Sheep Range. In bighorn sheep habitat, fires consumed vegetation at low, mid and high elevations. Much of the fire-caused damage occurred at low elevations. Present concerns relate to the likely establishment of fire-adapted invasive and exotic annual grasses at low and mid elevations. Population Status and Trend Indications are the bighorn sheep population inhabiting the Sheep Range and East Desert Range is experiencing a continued contraction that began in 2012. Moreover, with the exception of the Pintwater herd, adjacent populations on the Desert National Wildlife Range (DNWR) appear to be on a similar downward trend. Respiratory disease was recently confirmed in nearby bighorn populations. It is quite possible, that dispersing bighorn have translocated pathogenic bacteria associated with or responsible for causing respiratory disease onto DNWR. Thus, bighorn populations on DNWR may be coping with disease. In an effort to hasten recovery of the bighorn population in the Sheep Range, and in conformance with NDOW’s Big Game Release Plan, 35 sheep captured in late October 1998 from the Muddy Mountains, Arrow Canyon Range, and Specter Range were released at the mouth of Joe May Canyon. Subsequent monitoring efforts and aerial survey data suggest the release was not effective in achieving the objective.

DESERT BIGHORN
93
Unit 286: Las Vegas Range; North Clark County Report by: Pat Cummings Survey Data No aerial bighorn sheep survey was conducted over the Las Vegas Range in 2013. In September 2012, an aerial survey yielded a sample of 84 bighorn sheep. The sex and age ratios were 74 rams:100 ewes:21 lambs. The aerial survey was conducted over Gass Peak, Castle Rock, Fossil Ridge, Peek-a-boo Canyon, Quail Spring, and the area near Frozen Toe water development. Habitat In 2005 and 2006, wildland fires sparked by lightning strikes during summer months burned vegetation along thousands of acres in the Las Vegas Range. In bighorn sheep habitat, fires consumed vegetation at low, mid and high elevations. Much of the fire-caused damage occurred at low and mid elevations. Present concerns relate to the likely establishment of fire-adapted invasive and exotic annual grasses at low and mid elevations. Members of the Fraternity of the Desert Bighorn and NDOW personnel repaired fire-caused damage to 3 water developments (Juniper Peak, Hidden Valley and Frozen Toe). The Las Vegas Range is situated immediately north of the Las Vegas Valley, and in recent years suburban development has approached the southern boundary of the Desert National Wildlife Range. Increasingly, off-highway-vehicle (OHV) use has resulted in proliferation of unauthorized roads and trails. Despite federal regulation prohibiting the use of unlicensed vehicles on the refuge, the newly established network of roads and trails allows OHV users access to formerly undisturbed bighorn habitat. Population Status and Trend The bighorn sheep population inhabiting the Las Vegas Range may be experiencing a contraction that began in 2012. Respiratory disease was recently confirmed in nearby bighorn populations. It is quite possible, that dispersing bighorn have translocated pathogenic bacteria associated with or responsible for causing respiratory disease onto DNWR. Thus, bighorn populations on DNWR may be coping with disease. In 2014, the population estimate for bighorn sheep inhabiting the Las Vegas Range reflects a decline that is related to low recruitment since 2012.
CALIFORNIA BIGHORN
94
CALIFORNIA BIGHORN SHEEP Unit 012, Calico Mountains and High Rock Canyon: Western Humboldt and Washoe Counties Report by: Chris Hampson Harvest Results Eleven rams were harvested during the 2013 hunting season from Unit 012. Two hunters reported being unsuccessful. One of the 11 harvested rams was taken by a PIW tagholder. The average age of harvested rams in 2013 was 7.0 years. Hunters expended an average of 8.5 days hunting sheep. This represents an increase of almost 2 days per hunter when compared with the 2012 hunting season. The Boone and Crockett scores ranged between a low of 136 inches to a high of 161 inches. The average score for the 11 rams taken was 151. In 2012, the average score was very similar at 150 inches. Survey Data Bighorn composition surveys were conducted in mid-August 2013. A total of 105 bighorn were classified and the sample provided an average ratio of 19 rams:100 ewes:26 lambs. Bighorn were generally more difficult to locate during this survey (especially ram groups) and a total of 4 hours of flight time was expended. The lamb ratio of 26 lambs per 100 ewes is the lowest lamb ratio ever recorded for this herd. Recruitment for this herd has fallen off sharply since the current long dry cycle started back in 2007. The average lamb ratio since the record dry year of 2007 has been 35 lambs per 100 ewes. Observations of bighorn coughing and sneezing (mostly in the eastern portions of the unit) have been reported by several hunters over the past few years. An intensive effort to determine the extent of the health issues in this sheep population was undertaken in February 2012. Seven bighorn were captured from various areas within Unit 012 and numerous biological samples were taken from each of the bighorn. Lab results determined that this herd was experiencing a non-lethal, low grade, viral infection. However, the infection could have contributed to animals being in poor body condition and may have played a role in the lower recruitment values and poor performance observed for this herd over the past several years. The herd also experienced a serious Contagious Ecthyma (Soremouth) outbreak during the fall and winter 2009. A lighter outbreak was also confirmed in adjacent Unit 014 the same year. Soremouth was observed in both hunt units again in 2010, but was thought to be a much milder outbreak than what was observed in 2009. Soremouth can have a negative effect on lamb survival if outbreak is during the lamb weaning period. Habitat Extremely dry conditions are once again plaguing northwestern Nevada and the winter of 2013-14 has thus far been well below average for both total precipitation and snowfall. As of 1 March 2014, the Northern Great Basin is at approximately 58% of normal for total precipitation received and only 48% percent of normal for snow water equivalent precipitation. To make things worse, since the record dry year of 2007, below average water years have been almost the norm. Unless much more moisture is received over the next few months, drought conditions are predicted to continue into the summer and fall. Stream forecasts are also predicted to be well below average this coming spring and early summer. Population Status and Trend The 2014 population estimate for this herd has been drastically reduced from the 2013 estimate due to the continued poor recruitment and severe drought conditions that have become almost the norm over the past 7 years. Unit 012 generally receives much less precipitation than surrounding hunt units and is impacted the most when consecutive dry years or extreme drought conditions occur. Below average lamb recruitment observed this year will result in a continued downward trend for the High Rock/Calico bighorn herd. Health issues

CALIFORNIA BIGHORN
95
experienced over the past few years are also believed to have played a role in lower productivity and vitality of this herd. Quotas will more than likely be reduced this coming year due to the downward population trend. Unit 014, Granite Range: Washoe County Report by: Chris Hampson Harvest Results All 4 ram tagholders in 2013 were successful. The average age of the rams was 6.8 years. Boone and Crockett scores ranged from 139 to 166 inches. The second largest ram ever killed in the hunt unit was killed on the southern portion of the hunt unit near Granite Peak. This was the first ram to be killed in that portion of the hunt unit since 2000. All the other 20 rams since 2000 have been harvested from the Negro Creek subpopulation on the northeastern corner of the Granite Range. Hunters expended an average of 6.8 days hunting sheep in the Granite Range in 2013 which was very close to the long-term average hunter days of 6.5 days. Survey Data Mid-August 2013 surveys in the Granite Range classified 42 bighorns with a ratio of 15 rams:100 ewes:41 lambs. Due to the antelope hunting season, bighorn were scattered and pushed away from their normal use areas. Ram groups were thought to be scattered out at the higher elevations due to the current drought conditions and the hunting pressure. The 2013 lamb ratio was very similar to the 2012 ratio of 42 lambs:100 ewes. Observed ram ratios are known to be biased low compared to actual ram numbers in the population due to several factors. As such, the current population model has the ram ratio near 68 rams:100 ewes, typical for a herd with average harvested ram age over 6 years old. Habitat Unless significant precipitation and snowfall occurs in March and April, the winter of 2013-14 will once again be well below average for total precipitation and snowfall. The current cycle of drier than normal winters and overall below average water years began back in the record setting dry year of 2007. Since, that time the northwestern portion of the state has had many more dry years than wet years and habitat conditions and water availability have suffered. Many of the spring sources that normally have at least some water flowing this time of year are currently dry and are not providing much needed water for wildlife. If the current dry conditions persist thru the spring months, water availability and forage quality will be issues for wildlife this coming summer. Population Status and Trend Lamb recruitment observed this past year will allow for continued herd growth for the Granite Range bighorn population. Hunters have reported observing good numbers of mature rams and the quota for the Granite bighorn hunt is expected to increase in 2014. The estimate for this herd has increased to approximately 160 animals. Units 021, 022, Virginia Mountains: Washoe County Report by: Chris Hampson Harvest Data The 3 ram tagholders for Unit Group 021,022 were all successful in 2013. Boone and Crockett scores for the rams ranged between 134 and 156 inches. Ages for the harvested rams were 4, 5 and 10 years of age. The 10-year-old ram represented the oldest ram taken in this unit group since hunting began in 1997. The bighorn hunting season was closed in 021,022 from 2001-2006 and then reopened in 2007.

CALIFORNIA BIGHORN
96
Survey Data The 2013 helicopter surveys occurred in mid-August and a record high 67 animals were classified. The sample provided an average composition ratio of 25 rams:100 ewes:43 lambs. Ram groups were difficult to locate during the flight and were thought to be hiding in the significant tree cover that exists within the Virginia Mountains. During the 2011 survey, biologists located several large groups of rams that provided good insight into the age classes of rams within this population. In 2013, hunters also reported observing a fair number of mature rams during the hunting season and averaged only 3.3 days hunting. One hunter reported that he had scouted and hunted in the Petersen Mountains of Unit 021 but was unable to locate sheep. Population Status and Trend The good lamb recruitment observed this year will allow for continued herd growth. In 2012, the ratio was slightly higher at 51 lambs per 100 ewes. The bighorn herd in the Virginia Mountains continues to show an increasing trend and was given a positive boost by the release of 22 additional sheep in December of 2007. Quotas for the 021,022 Unit Group are expected to increase from 3 to 4 tags in 2014. The population estimate for this herd now stands at approximately 130 animals. Unit 031: Double H, Montana and Trout Creek Mountains; Humboldt County Report By: Ed Partee Survey Data Composition flights were conducted in early August 2013. Areas surveyed included the Double H, Montana, and Trout Creek Mountains. A total of 118 animals were observed. Sheep remain well distributed throughout both the Double H and Montana Mountains. Ratios obtained from this survey were 21 rams: 100 ewes: 36 lambs. The observed ram ratio dropped below the past 5-year average. However, radio collaring data and hunter observations point to a higher number of rams in this unit which indicates that ram observability was poor during survey efforts. Habitat Habitat conditions were less than ideal during this past year. Conditions were extremely dry throughout the year to the extent that even upper elevations produced marginal forage. Precipitation amounts at this point are still well below normal and one of the lowest amounts recorded for the winter months. Forage conditions going into the winter months were already stressed due to the lack of moisture and continued conditions will have a dramatic effect on habitat conditions this spring and additional rehabilitation efforts for the 2012 Holloway Fire. Population Status and Trend This population continues to have good lamb recruitment which has produced a steady increase in this population. With the continued increase in sheep numbers using this area it has provided source stock for 4 different augmentations. Eighty-five sheep have been removed from this unit over the last of 8 years. Despite the number of sheep that have been removed through capture and harvest, this population continues to do well. Recovery efforts from the fire that took place in 2012 have been positive. Sheep have continually used the areas that burned. With the lack of winter precipitation this year’s spring moisture will be important to this herd. Early green-up will be vital to this year’s lamb crop. A collaring project that took place in the Montana Mountains for the Lithium exploration project has concluded. Information gained from this project will benefit not only future projects but provides a better understanding
CALIFORNIA BIGHORN
97
of additional bighorn use areas and travel corridors. These types of projects continue to provide irrefutable data that was only assumed prior to the project taking place. Unit 032: Pine Forest Range and McGee Mountain; Humboldt County Report by: Ed Partee Survey Data Aerial surveys were conducted in early August 2013. This hunt unit is very large with 3 distinct mountain ranges. McGee Mountain, Pueblos, and the Pine Forest Range were surveyed with most of the sheep observed in the Pine Forest Range. A total of 182 sheep was classified with ratios of 50 rams:100 ewes:38 lambs. Habitat With the extreme drought conditions that have occurred over the last year habitat conditions are less then desirable. With the lack of moisture received, forage has been lacking and stressed. The past winter was one of the driest on record and snowpack through January was pretty much non-existent. Early December experienced extremely cold temperatures which lasted for nearly a week. Since that time temperatures have been mild with little to no precipitation. As of 1 March 2014, precipitation conditions have improved slightly however, conditions have been well below normal on snow pack in the Lower Humboldt River Basin. Spring moisture will be critical to provide forage green up for ewes and attendant lambs to support lamb survival and recruitment. Population Status and Trend The population estimate for this herd remains static at high levels. Ram ratios remain above the past 5-year average while the observed lamb ratio declined from both the past 5-year average and the 2012 observed ratio. This population has shown a steady increase even with significant numbers of sheep being removed to support NDOW’s capture and transplant program. Over the course of the last 3 years 113 bighorn sheep have been removed from this population. Sheep are well distributed throughout the Pine Forest Range and surveys indicate good distribution of age classes. Unit 033, Sheldon National Wildlife Refuge: Washoe and Humboldt Counties Report by: Chris Hampson Harvest Results The 2013 hunting season was extremely difficult. Two hunters reported being unsuccessful and one hunter was unable to participate in the hunt. The 2 successful hunters had completely different hunting experiences. One hunter was able to harvest a ram on the first day of the hunting season while the other successful hunter struggled to locate sheep and expended 16 days before finally harvesting his ram. Historically, the Sheldon bighorn hunt takes hunters 2 to 3 days longer than surrounding California bighorn hunt units to harvest their rams. The two harvested rams were aged at 5 and 7 years old and scored 129.875 and 160.500 B&C inches. Hunters reported having difficulty locating sheep in the traditional use areas of Hell Creek, Big Mountain, Alkali Peak, Devaney Mountain, Badger Mountain, Thousand Creek Gorge and Virgin Creek. Hunters were able to find bighorn along the Guano Rim in the northwestern corner of the Sheldon early in the season but the sheep became much harder to locate later in the hunting season. Bighorn on the Sheldon appear to be shifting their use areas based upon several factors including the long term drought conditions affecting water availability and forage quality as well as the potential for horse gathering activities causing sheep to move to adjacent habitat. The gathers have taken place over the past several years and both hunters and NDOW surveys have noted a significant reduction in the number of bighorn using their traditional core use areas during that time period. These gathers are necessary to control the feral horse numbers but may be having an negative influence on the current distribution and number of bighorn that remain within the borders of the Sheldon.
CALIFORNIA BIGHORN
98
Survey Data The 2013 helicopter survey occurred in mid-August and a relatively small sample of 34 bighorn was classified. The average composition ratio for the sample was 89 rams:100 ewes:39 lambs. A majority of the animals that were classified were located along the Guano Rim. Surveys failed to locate sheep in many of the core use areas where bighorn had historically been found. One group of rams was located along the Massacre Rim on the Little Sheldon. These rams are more than likely associated with the original release of bighorn in 1995 on the Massacre/Long Valley Rim of the Little Sheldon. The observed lamb ratio of 39 lambs:100 ewes was above maintenance levels and was much improved when compared with the 2012 observe lamb ratio of just 17 lambs per 100 ewes. However, it is believed that fewer bighorn exist within the borders of the Sheldon today than what occurred just a few years ago. Five bighorns were captured and sampled in January 2014 in Unit 032 near McGee Mountain (along the eastern border of the Sheldon)to discern if disease was responsible for lower bighorn numbers on the Sheldon and McGee Mountain in recent years. Lab results indicated that the animals were negative for Mycoplasma ovipneumoniae and that the reduction in bighorn was likely not due to pathogens. Habitat Once again the winter of 2013-2014 has been well below normal for total precipitation received and total snow accumulation. Consecutive years of below average rainfall have negatively affected water availability and overall habitat conditions for all wildlife living on the Sheldon. Water sources such as springs, streams, and lakebeds will have diminished flows or levels this coming spring and summer. The USFWS is once again planning horse and burro gathers on the Sheldon for August and September 2014. The current objective is to remove as many of the 400–500 horses and burros left on the Sheldon. The USFWS plans on starting the captures in mid to late August and then coming back in early to mid September to gather any remaining animals. Unfortunately, bighorn hunters could be impacted by the ongoing horse gathering activities. Certain areas on the Sheldon may be off limits and closed to hunters during the removal efforts. The removal effort is aimed at reducing the amount of competition between wildlife and horses for food, water and space. Impacts by horses on both riparian and upland habitats will be lessened once horse numbers have been controlled. The USFWS is also again warning that they may consider closing vehicle access roads during the late summer and fall due to the potential for high fire danger. This could impede access to many of the traditional hunting areas on the Sheldon. Population Status and Trend Bighorn numbers and densities on the Sheldon are believed to be much lower within the boundaries of the Sheldon than what was observed just a few years ago. Bighorn habitat on the Sheldon is contiguous and sheep can move freely between adjacent hunt units as well as move to the north into Oregon. Recent helicopter surveys and reports from those hunting bighorn on the Sheldon have confirmed lower numbers of bighorn being observed over the past few years. Due to the lower numbers of bighorn available, tag quotas for the Sheldon are expected to decrease significantly this year. NDOW has recommended the closure of the non-resident sheep season for the Sheldon due to the planned reduction in tag numbers. Unit 034: Black Rock Range; Humboldt County Report by: Ed Partee Survey Data Aerial surveys in this unit took place during the first part of August. A total of 121 animals were classified yielding ratios of 43 rams:100 ewes:49 lambs. Ram numbers declined from what was observed during the

CALIFORNIA BIGHORN
99
previous year but they were within the past 5-year average. The bulk of the rams observed on this flight were associated with Big Mountain and Coleman Creek. Habitat This unit like many others in Humboldt County has experienced dry conditions throughout the fall and most of the winter. During December and January there was virtually no snow pack. If these conditions continue, the increased competition for available forage will likely have an effect on lamb survival in this unit. As of 1 March 2014 precipitation amounts are still well below normal and additional moisture will be needed to sustain this herd. Population Status and Trend The 2013 population estimate for this herd shows a slight increase from the previous year with sheep numbers at high levels. Both lamb and ram ratios are within the 5-year average and holding stable at this time. The age class of rams observed on this survey is well distributed with a strong middle age class. Sheep are dispersing well throughout this range providing plenty of opportunity for harvest in several different locations. At this point this herd is trending upward, however, with the increased competition for water by horses this may have a detrimental effect on bighorn in the future. Hunter access has been altered by the designation of the Black Rock/High Rock Immigrant Trail National Conservation Area (NCA) and Wilderness Areas within the NCA. The BLM has marked the majority of the restricted access points and hunters who apply for this area need to understand these restrictions. Despite access issues in this area, hunter success has been good in this unit. Unit 035: Jackson Mountains; Humboldt County Report by: Ed Partee Survey Data Aerial composition surveys were conducted during the first week of August 2013. A total of 82 sheep were classified with ratios of 11 rams: 100 ewes: 43 lambs. The low ram ratio is well below last year’s survey as well as the 5-year average. Ram groups were not located in traditional use areas possibly because of the earlier survey timing and warm dry conditions. Ewe and lamb numbers have increased from previous surveys and seem to be doing well. Habitat This unit like many others in Humboldt County has experienced dry conditions throughout the fall and most of the winter. During December and January there was virtually no snow pack. Currently the snowpack is less than 50% of average in the Lower Humboldt River Basin. Precipitation amounts at this point are below normal and additional moisture will be needed to maintain these herds. Competition for forage and water between bighorn and feral horses may be an issue as the year progresses. Population Status and Trend The 2014 population estimate has increase to 180 animals. With the increase in ewe numbers and good lamb ratios we are starting to see this population rise above the lower thresholds. The 2010 and 2013 releases have helped this herd tremendously. We are starting to see some of this population expand into areas that have not had sheep in the past. At this point this population is starting to show an upward trend with better quality rams showing up in the harvest. Hunter access has been influenced by the designation of the Black Rock/High Rock Immigrant Trail National Conservation Area and Wilderness Areas (NCA). The NCA boundaries embrace bighorn concentration areas of King Lear Peak and Parrot Peak. The Bureau of Land Management (BLM) has marked the majority of the restricted access points and hunters who apply for this area need to understand these restrictions.
CALIFORNIA BIGHORN
100
Unit 051: Santa Rosa Range; Humboldt County Report by: Ed Partee Survey Data In early August 2013 the Santa Rosa Range was flown for composition data. A total of 132 bighorn were observed yielding a ratio or 35 rams: 100 ewes: 57 lambs. Lamb production remains good and the ram ratio is within the past 5-year average. This range now has 4 main areas that are surveyed: the north end, south end, Hinkey Summit east side, and the addition of the Calico Mountains (Capitol Peak). The last several years we have seen a drop in the number of rams using the north end. Several rams have been collared in the pass to track movement. Preliminary results are starting to show movement between Oregon and Nevada. With the addition of the Calico’s in 2012, sheep numbers are doing well in this area. Habitat Due to the prolonged drought that has affected Humboldt County some of the areas are starting to be affected. This last December/January had one of the lowest snowfalls on record. At this point there is virtually no significant snowpack on this range. As of 1 March, 2014, the Lower Humboldt River Basin is well below normal for precipitation. Continued dry conditions may lead to added stress in these herds. Population Status and Trend The 2014 population estimate for this unit is approximately 225 animals. This unit is starting to show some slight increases in the population. Of the areas surveyed, lamb production has varied among the areas being surveyed. None the less the population is still showing slight increases. Monitoring is taking place on the north end of the range on several radio collared ewes to evaluate both movement and lamb production and survival. Cooperative efforts between Nevada and Oregon are taking place to identify movement patterns of bighorn between the states. Units 068: Sheep Creek; Northern Lander and Eureka Counties Report by: Jeremy Lutz Harvest Results Five tags were available in Unit 068 for the 2013 season. All 5 hunters were successful in harvesting a ram. The average age of the rams was 5.2 years and the average B&C score was 144 6/8. For more specific harvest results, please review the 2013 harvest tables in the Appendix. Survey Data In February of 2014, a total of 70 bighorns were observed with 62 classified from the ground yielding ratios of 38 rams:100 ewes:18 lambs. Black Mountain and the Rock Creek Gorge were not surveyed due to time constraints. Habitat Due to the lack of moisture associated with the prolonged drought of 2011 to the present, habitat conditions in the Sheep Creek Range were poor. Very little growth occurred on grasses and forbs and leader growth on shrubs was marginal. Large areas of land were completely void of any vegetation with bare ground being the dominate feature on the landscape. High utilization on ephedra and native grass species by bighorn sheep was noted along the face of the Sheep Creek Range for the third year in a row. During 2012 both big game guzzlers went dry in the Sheep Creek Range due to prolonged drought conditions and high use by bighorn. In 2013 and 2014 both big game units were retrofitted with new aprons and tanks. This should help the guzzlers from going dry in the future by increasing the amount of catchment and increasing the storage capacity to nearly 9,000 gallons per units.

CALIFORNIA BIGHORN
101
Over utilization by livestock on the 25 Allotment continued to negatively impact bighorn sheep habitat. Population Status and Trend Bighorn sheep habitat conditions in the Sheep Creek Range continue to spiral downward. If current drought conditions and high levels of livestock use continue, negative impacts to the 068 bighorn herd are expected to continue. In 2013, the Nevada Wildlife Commission passed a new bighorn ewe season to be used as a management tool for herds that are above sustainable management levels in relation to the habitat carry. The objective of this hunt will be to bring the population down so that it is compatible with existing habitat conditions.
ROCKY MOUNTAIN BIGHORN
102
ROCKY MOUNTAIN BIGHORN SHEEP Unit 074: The Badlands; Elko County Report by: Kari Huebner Harvest Results Three resident tags were issued for Unit 074 in 2013. All hunters were successful. Two hunters harvested 5-year-old rams while 1 hunter took a 6-year-old ram. Survey Data A composition survey was conducted in August 2013. There were 38 bighorns classified resulting in sex and age ratios of 42 rams:100 ewes:58 lambs. The lamb ratio was similar to last year’s ratio. Habitat There was a burn on the west side of Black Mountain (Salmon Fire 4,846 acres) in August 2011. There was also a small burn (Black Mountain Fire) in the southern portion of the unit and a larger fire (Scott Creek Fire) in the northern portion of the unit in 2007. These fires are expected to have minimal impacts on this bighorn herd. Population Status and Trend This herd appears to be stable. However, there are concerns regarding the small sample sizes that have been observed during the past couple of years. Despite adequate lamb recruitment, this herd does not appear to be increasing. A predator control project aimed at mountain lion removal has been proposed for this area. Two ewes have been collared to aid in bighorn distribution mapping and target areas for mountain lion removal. Another 3 bighorn will be collared next winter. One of the ewes collared this winter was very old and tested positive for Mycoplasma ovipneumoniae for both blood antibodies and presence of organism on PCR. The other 5-year old ewe was negative. Unit 091: Pilot Range; Elko County Report by: Kari Huebner Harvest Results Two tags were offered in this unit for the 2013 season. One was a Nevada resident and the other was a Utah resident. Both hunters were successful and harvested 6-year-old rams. One tag will be offered to a Utah resident in 2014. Survey Data A composition survey was conducted in August 2013. There were 39 bighorns classified with resulting sex and age ratios of 37 rams:100 ewes:7 lambs. Habitat A recent effort was made to make water available to bighorn on the mountain as opposed to the benches in order to reduce the probability of bighorn sheep coming into contact with domestic sheep. The bighorn seem to be reacting favorably to this available water. There are active domestic sheep allotments and trailing routes on the east side of Pilot and in the Leppy Hills. Providing separation between the bighorns and the domestic sheep will be critical if bighorn sheep are to survive in this area.

ROCKY MOUNTAIN BIGHORN
103
Population Status and Trend In 2010, several bighorn were observed coughing, shaking their heads and were in poor body condition. Three bighorn sheep within the population were tested for disease which confirmed bacterial pneumonia was present in the population. It appears the disease event is severely impacting lamb recruitment. Three bighorns, 2 ewes and 1 ram, were radio collared with the objective to learn more about their movement patterns and if they are coming into contact with domestic sheep. The 2 ewes have moved very little from where they were first captured. The young ram has had 2 failed satellite collars so very little information has been obtained from him. The bighorns were tested during the collaring operation and all of them had antibodies for Mycoplasma ovipneumoniae and 1 was still actively shedding the organism. The short-term outlook for this herd is poor. Lambs are being born, but they are not being recruited into the population. Future recommendations for the ram hunt will be dependent on population monitoring and documented lamb recruitment. Unit 114: North Snake Range – Mount Moriah; Eastern White Pine County Report by: Curt Baughman Harvest Results In 2013, 2 tags were available for the 6th consecutive year. The 2013 hunt was complicated by a monsoon weather pattern that brought nearly daily thunderstorms during September. In spite of this challenge, both hunters were successful for the first time since 2010. The rams were 8 and 5 years respectively. Since this unit reopened for ram harvest in 2007, 10 rams have been harvested with an average age of 6.0 years. This hunt remains difficult due to the large amount of rugged and roadless terrain involved. Survey Data Aerial herd composition surveys were conducted during the December 2013 post-season and 2014 spring deer surveys. Between the 2 surveys, a sample of 46 different bighorn could be accounted for with sex and age ratios of 54 rams:100 ewes:38 lambs. This follows samples of 34 bighorn in March 2013 and 48 bighorn in March 2012. The composition of these samples was 32 rams:100 ewes:22 lambs in 2013 and 58 rams:100 ewes:27 lambs in March 2012. Weather and Habitat Including the current water-year, local NRCS Snotel sites have documented below-average snow packs for the past 3 winters. Coupled with late spring/early summer periods that have been dryer and warmer than average, high country bighorn habitats have been desiccating earlier than normal. This has reduced water distribution and forage quality within these alpine habitats. On the positive side, habitat conditions in both 2012 and 2013 were salvaged somewhat by late summer/fall monsoon moisture that triggered improved vegetative conditions at all elevations. These conditions helped bighorn to improve their body condition prior to winter, but may not have been the best for lambing and lamb survival during the first couple months of life. The 2013-14 winter was mild, and spring green-up came early on bighorn winter ranges. As of late March, local mountain Snotel sites were averaging 71% of average precipitation and 54% of normal snow-water content. Long-term habitat limitations in this unit are related to the dense band of mixed conifer and mountain mahogany that effectively separate seasonal ranges in much of the area presently occupied by bighorn. The use of prescribed fire and managed natural fire are key components to future habitat modifications that could increase the carrying capacity of this unit and the viability of the population. Population Status and Trend This bighorn herd has experienced inconsistent lamb recruitment since late 2006 when 73 lambs/100 ewes were observed in the first winter following the January 2006 augmentation of 30 bighorn from Unit 101. Survey
ROCKY MOUNTAIN BIGHORN
104
samples suggest that lamb recruitment has ranged from 17 lambs:100 ewes to 43 lambs:100 ewes with an average of 29 lambs:100 ewes over that period. This is reflected in a nearly stable population trend over the past several years following declines in 2008 and 2009. Recruitment was likely influenced by adverse climatic conditions (severe drought and harsh winters) as well as predation. Lion predation was documented as a substantial cause of mortality in collared bighorn ewes from 2006 through 2009. Additional evidence includes random discovery of bighorn remains with signs of lion predation. This period coincided with a drought-related decline in the Snake Range deer herd. It is felt the Snake Range had become top-heavy with lions that turned increasingly to bighorn for a prey base because of the decline in the mule deer herd. There have been 53 mountain lions removed from the Snake Range by sportsmen and Wildlife Services since the beginning of 2009. This high rate of removal should have helped strike a better balance between the Snake Range Mountain lion population and ungulate resources. The number of mature rams in the population is sufficient to sustain continued harvest. Current conditions are favorable for lamb production to again be average or above, however recruitment and short-term population trend will largely depend on climatic conditions through the spring and summer. Unit 115: South Snake Range – Mount Wheeler: Eastern White Pine County Report by: Curt Baughman Background The last recorded observation of historic bighorn sheep in the south Snake Range was made by Elwin A. Robison in 1971. Bighorn sheep were reestablished in the south Snake Range in 1979 and 1980 with the release of 20 sheep transported from Colorado. These release compliments totaled 3 rams, 11 ewes and 6 lambs. Hunting seasons were held in 1985-86 with 1 and 2 tags respectively. No rams were harvested in 1985 and 2 rams were taken in 1986. The season was then closed due to the establishment of Great Basin National Park in October 1986 and concerns about declining population trend. An increasing bighorn population trend was observed in Unit 115 in the mid 2000s, similar to the trend in nearby Unit 114. NDOW and Great Basin National Park have worked cooperatively since 2008 with the goal of enhancing both bighorn habitats and the bighorn population in this unit. Capture projects in 2009-10 and again in 2013-14 resulted in the outfitting of bighorn with satellite GPS/VHF collars to increase knowledge of seasonal ranges and habitat use by this bighorn herd. Population data collected for this herd support a minimal ram harvest over the short-term. Harvest recommendations will continue to be made based on herd viability and performance. A December 20 through February 20 season was established to ensure the tag holder has the opportunity to pursue rams below the Park boundary when they descend from higher elevations in late winter. Harvest Results An 11 year old ram was taken by the 2013-14 tagholder. Survey Data With the aid of 3 functional VHF/GPS collars that were deployed in January 2014, a new record sample of 27 bighorn was classified during aerial spring deer surveys in March. Sex and age ratios of the sample were 57 rams:100 ewes:36 lambs. The previous record sample of 24 bighorn was obtained during postseason deer surveys in December 2012. The composition of that sample was 73 rams:100 ewes:46 lambs.
MOUNTAIN GOAT
105
MOUNTAIN GOAT Unit 101: East Humboldt Range; Elko County Unit 102: Ruby Mountains; Elko County Unit 103: South Ruby Mountains; Elko and White Pine Counties Report by: Caleb McAdoo Tag Quotas and Harvest Results There were 7 general season mountain goat tags issued in the 2013 season and due to concerns from sportsmen of low kid recruitment, no PIW tags were issued. Five tag holders were successful and of the 5 goats harvested, 40% were nannies. The trend of increasing nanny harvest has been a more common occurrence for Nevada’s mountain goat hunters in recent years. The percent of Nanny’s of the total harvest in 2008, 2009, 2010, 2011, and 2012 was 22, 30, 40, 27, and 33, respectively. Nanny harvest will continue to be monitored closely and assessed relative to quota development to minimize any potential impacts to overall production and recruitment following the recent disease event documented in the mountain goat population. In an effort to curtail nanny harvest, the Department of Wildlife has initiated a non-mandatory online, “Mountain Goat Hunting Orientation” document to help hunters identify and determine sex of mountain goats in the field. Although quotas have been reduced in recent years, hunter success continues to be excellent and most hunters reported seeing many adult goats in the 2013 season. For specific 2013 hunting season results, please refer to Harvest Tables in the Appendix Section. Survey Data Mountain goat surveys were performed in late December of 2013 and in early January, 2014. In Unit 101, 79 goats were observed, down from 104 last year. While the sample size declined from last year, there were 4 kids observed. While this ratio is extremely low, it is an improvement over last year’s observed ratio of zero. In contrast to Unit 101, Unit 102 had a sample size of 102 goats, yielding a ratio of 17 kids:100 adults, similar to last year’s ratio of 20 kids:100 adults. A limited sample of 13 goats were observed in Unit 103, with a ratio of 8 kids:100 adults. Weather and Habitat Goats live amongst the highest, rockiest, and steepest slopes in the mountains. Fortunately, snow banks accumulate throughout the winter and sustain preferred forage for goats during most of the hot and dry summer months. Even in the dry years with little precipitation, sufficient snow usually falls in the high country to facilitate goat survival. Precipitation received during the 2013/2014 winter was approximately 90-109 percent of normal (depending on the exact locale) and should be adequate to produce high quality forage on summer range. Nevada’s mountain goat populations are limited by winter range and heavy spring snow loads that have the potential to cover their forage, limit their movements, and increase their chances of fatalities from falls and avalanches. Population Status and Trend Goat populations in Unit 101 continue to raise concerns with observations of extremely limited kid recruitment. These recruitment levels are not enough to maintain a stable population. It is very likely that the increased mortality in the kid segment of the population was a residual effect of the bacterial pneumonia which afflicted the bighorn sheep and goats in the Ruby and East Humboldt mountain ranges during the winter of 2009-2010. Generally speaking, poor kid recruitment is a lingering effect of pneumonia die-offs which exacerbate the initial population declines realized from a disease event and can create stagnant or declining herds. Minimal recruitment was realized for Unit 101 in 2013. For Unit 101, the 2014 estimate is 120 individuals, down from 130 last year. For Unit 102, the 2014 population estimate has increased to 190 individuals. Unit 103 remains stable at an estimated 30 individuals. The Department will continue its disease surveillance for both bighorn sheep and mountain goats in Units 101-103 as part of post-die-off monitoring efforts to continue to gather information about the implications of the

MOUNTAIN GOAT
106
disease for future management decisions. In 2013, a total of 17 mountain goats were captured, collared and sampled as part of this effort and in early 2014 an additional 27 mountain goats were captured, collared and sampled. Furthermore, hunters have provided invaluable biological samples from harvested mountain goats that will further our knowledge of pathogens. Hunters and others on the mountain who observe any abnormal animal behavior in wild goats or sheep such as coughing and abnormal nasal discharge have been encouraged to report their findings immediately to the Nevada Department of Wildlife.
MOUNTAIN LION
107
MOUNTAIN LION Western Region Areas: 1, 2, 3, 4, 5, 18, 19, 20, and 29 Report by: Carl Lackey Harvest Results Referencing all available reports for this report period, 1 March 2013 through 28 February 2014, biologists recorded 49 mountain lion mortalities for the Western Region (Table 1). This included 28 animals taken under valid sport tags and 17 by USDA - Wildlife Services for depredation and predator control. Total recorded mortalities were in line with the 10-year average. Sport harvest decreased for the second consecutive year (Table 3), and was likely due to dry climatic hunting conditions in the early part of the season. This is the third consecutive year that total lion mortalities decreased in the Western Region. Since its inception the year-round season has had little effect on total overall sport harvest. Additionally, increasing the sport harvest limits, as done in 2011, has not had an effect on total sport harvest.
Table 1. Western Region mountain lion harvest limits and mortalities by type for 2013-2014.
Management Area
Harvest Limit
Harvest Type
Sport Depredation Predator Projects
Other Total
1
Regional
9 2 8 1 20 2 2 0 1 0 3 3 0 0 0 0 0 4 8 0 0 0 8 5 2 0 0 1 3 18 1 0 0 0 1 19 5 0 0 2 7 20 1 6 0 0 7 29 0 0 0 0 0
Totals 89 28 8 9 4 49 Table 2. Western Region mountain lion sport harvest – 10-year sex and age comparisons.
Season/Year Harvest Average Age
# Males # Females Ratio
Male:Female Males Females All Lions
2004-2005 22 11 1m:0.5f 4.5 3.2 4.1 2005-2006 15 21 1m:1.4f 3.7 2.6 3.1 2006-2007 25 26 1m:1.0f 3.7 3.3 3.5 2007-2008 33 24 1m:0.7f 3.8 3.1 3.4 2008-2009 24 14 1m:0.6f 3.4 3.7 3.5 2009-2010 19 14 1m:0.7f 4.4 3.4 3.9 2010-2011 26 24 1m:0.9f 3.9 5.0 4.5 2011-2012 8 10 1m:1.3f 4.1 2.8 3.4 2012-2013 14 25 1m:1.8f NA NA NA 2013-2014 15 13 1m:0.9f 3.5 2.8 3.2
Note: two mortalities (unknown sex) in 2008 The sport harvest consisted of 15 male lions and 13 females. A total of 9 lions were killed by USDA-WS as part of predator control projects. All salvageable lion hides from around the state were skinned, dried and then most were sold at the Nevada Trapper’s Association’s annual fur sale in Fallon. A total of 16 hides were sold this year bringing an average price of $284 with a high of $561. Time spent by hunters actively hunting lions
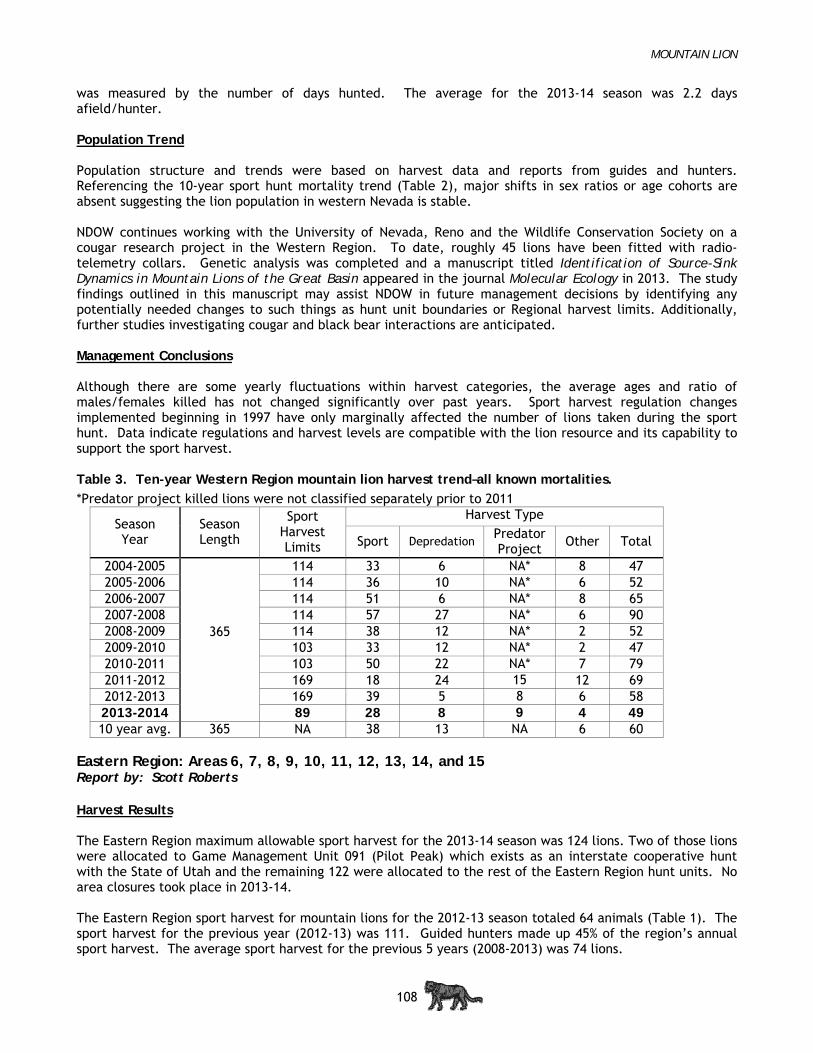
MOUNTAIN LION
108
was measured by the number of days hunted. The average for the 2013-14 season was 2.2 days afield/hunter. Population Trend Population structure and trends were based on harvest data and reports from guides and hunters. Referencing the 10-year sport hunt mortality trend (Table 2), major shifts in sex ratios or age cohorts are absent suggesting the lion population in western Nevada is stable. NDOW continues working with the University of Nevada, Reno and the Wildlife Conservation Society on a cougar research project in the Western Region. To date, roughly 45 lions have been fitted with radio-telemetry collars. Genetic analysis was completed and a manuscript titled Identification of Source-Sink Dynamics in Mountain Lions of the Great Basin appeared in the journal Molecular Ecology in 2013. The study findings outlined in this manuscript may assist NDOW in future management decisions by identifying any potentially needed changes to such things as hunt unit boundaries or Regional harvest limits. Additionally, further studies investigating cougar and black bear interactions are anticipated. Management Conclusions Although there are some yearly fluctuations within harvest categories, the average ages and ratio of males/females killed has not changed significantly over past years. Sport harvest regulation changes implemented beginning in 1997 have only marginally affected the number of lions taken during the sport hunt. Data indicate regulations and harvest levels are compatible with the lion resource and its capability to support the sport harvest. Table 3. Ten-year Western Region mountain lion harvest trend–all known mortalities.
*Predator project killed lions were not classified separately prior to 2011
Season Year
Season Length
Sport Harvest Limits
Harvest Type
Sport Depredation Predator Project
Other Total
2004-2005
365
114 33 6 NA* 8 47 2005-2006 114 36 10 NA* 6 52 2006-2007 114 51 6 NA* 8 65 2007-2008 114 57 27 NA* 6 90 2008-2009 114 38 12 NA* 2 52 2009-2010 103 33 12 NA* 2 47 2010-2011 103 50 22 NA* 7 79 2011-2012 169 18 24 15 12 69 2012-2013 169 39 5 8 6 58 2013-2014 89 28 8 9 4 49 10 year avg. 365 NA 38 13 NA 6 60
Eastern Region: Areas 6, 7, 8, 9, 10, 11, 12, 13, 14, and 15 Report by: Scott Roberts Harvest Results The Eastern Region maximum allowable sport harvest for the 2013-14 season was 124 lions. Two of those lions were allocated to Game Management Unit 091 (Pilot Peak) which exists as an interstate cooperative hunt with the State of Utah and the remaining 122 were allocated to the rest of the Eastern Region hunt units. No area closures took place in 2013-14. The Eastern Region sport harvest for mountain lions for the 2012-13 season totaled 64 animals (Table 1). The sport harvest for the previous year (2012-13) was 111. Guided hunters made up 45% of the region’s annual sport harvest. The average sport harvest for the previous 5 years (2008-2013) was 74 lions.
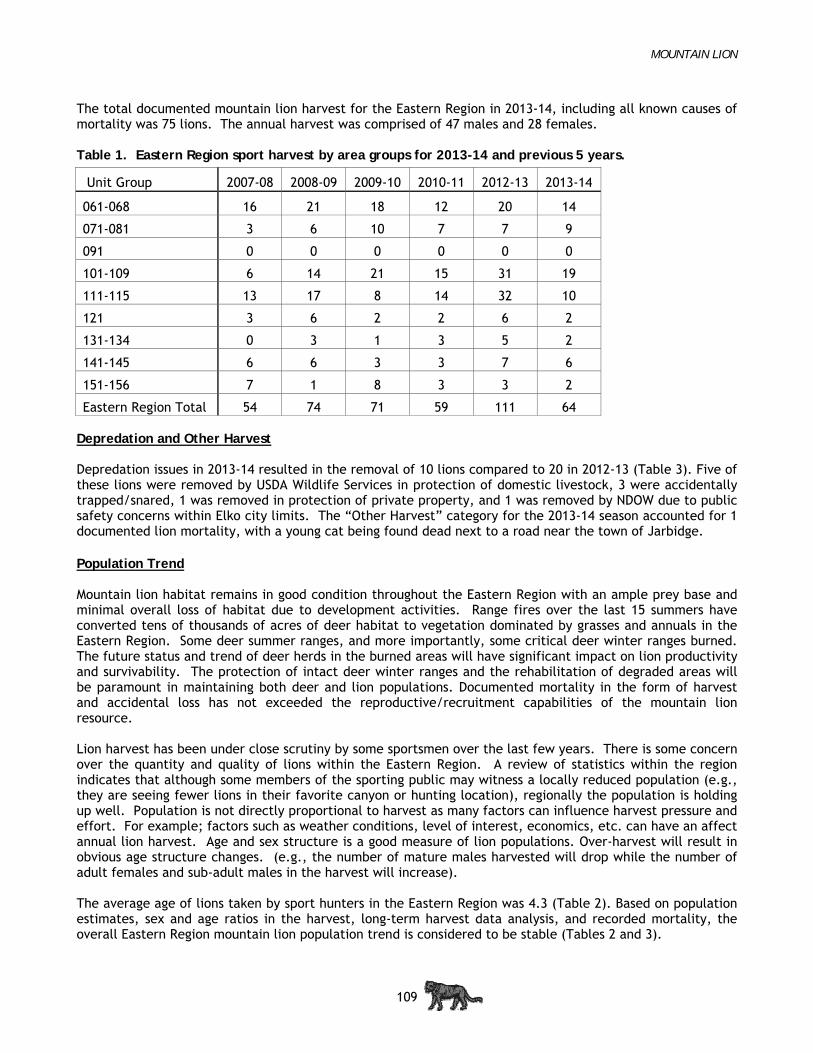
MOUNTAIN LION
109
The total documented mountain lion harvest for the Eastern Region in 2013-14, including all known causes of mortality was 75 lions. The annual harvest was comprised of 47 males and 28 females. Table 1. Eastern Region sport harvest by area groups for 2013-14 and previous 5 years.
Unit Group 2007-08 2008-09 2009-10 2010-11 2012-13 2013-14
061-068 16 21 18 12 20 14
071-081 3 6 10 7 7 9
091 0 0 0 0 0 0
101-109 6 14 21 15 31 19
111-115 13 17 8 14 32 10
121 3 6 2 2 6 2
131-134 0 3 1 3 5 2
141-145 6 6 3 3 7 6
151-156 7 1 8 3 3 2
Eastern Region Total 54 74 71 59 111 64 Depredation and Other Harvest Depredation issues in 2013-14 resulted in the removal of 10 lions compared to 20 in 2012-13 (Table 3). Five of these lions were removed by USDA Wildlife Services in protection of domestic livestock, 3 were accidentally trapped/snared, 1 was removed in protection of private property, and 1 was removed by NDOW due to public safety concerns within Elko city limits. The “Other Harvest” category for the 2013-14 season accounted for 1 documented lion mortality, with a young cat being found dead next to a road near the town of Jarbidge. Population Trend Mountain lion habitat remains in good condition throughout the Eastern Region with an ample prey base and minimal overall loss of habitat due to development activities. Range fires over the last 15 summers have converted tens of thousands of acres of deer habitat to vegetation dominated by grasses and annuals in the Eastern Region. Some deer summer ranges, and more importantly, some critical deer winter ranges burned. The future status and trend of deer herds in the burned areas will have significant impact on lion productivity and survivability. The protection of intact deer winter ranges and the rehabilitation of degraded areas will be paramount in maintaining both deer and lion populations. Documented mortality in the form of harvest and accidental loss has not exceeded the reproductive/recruitment capabilities of the mountain lion resource. Lion harvest has been under close scrutiny by some sportsmen over the last few years. There is some concern over the quantity and quality of lions within the Eastern Region. A review of statistics within the region indicates that although some members of the sporting public may witness a locally reduced population (e.g., they are seeing fewer lions in their favorite canyon or hunting location), regionally the population is holding up well. Population is not directly proportional to harvest as many factors can influence harvest pressure and effort. For example; factors such as weather conditions, level of interest, economics, etc. can have an affect annual lion harvest. Age and sex structure is a good measure of lion populations. Over-harvest will result in obvious age structure changes. (e.g., the number of mature males harvested will drop while the number of adult females and sub-adult males in the harvest will increase). The average age of lions taken by sport hunters in the Eastern Region was 4.3 (Table 2). Based on population estimates, sex and age ratios in the harvest, long-term harvest data analysis, and recorded mortality, the overall Eastern Region mountain lion population trend is considered to be stable (Tables 2 and 3).
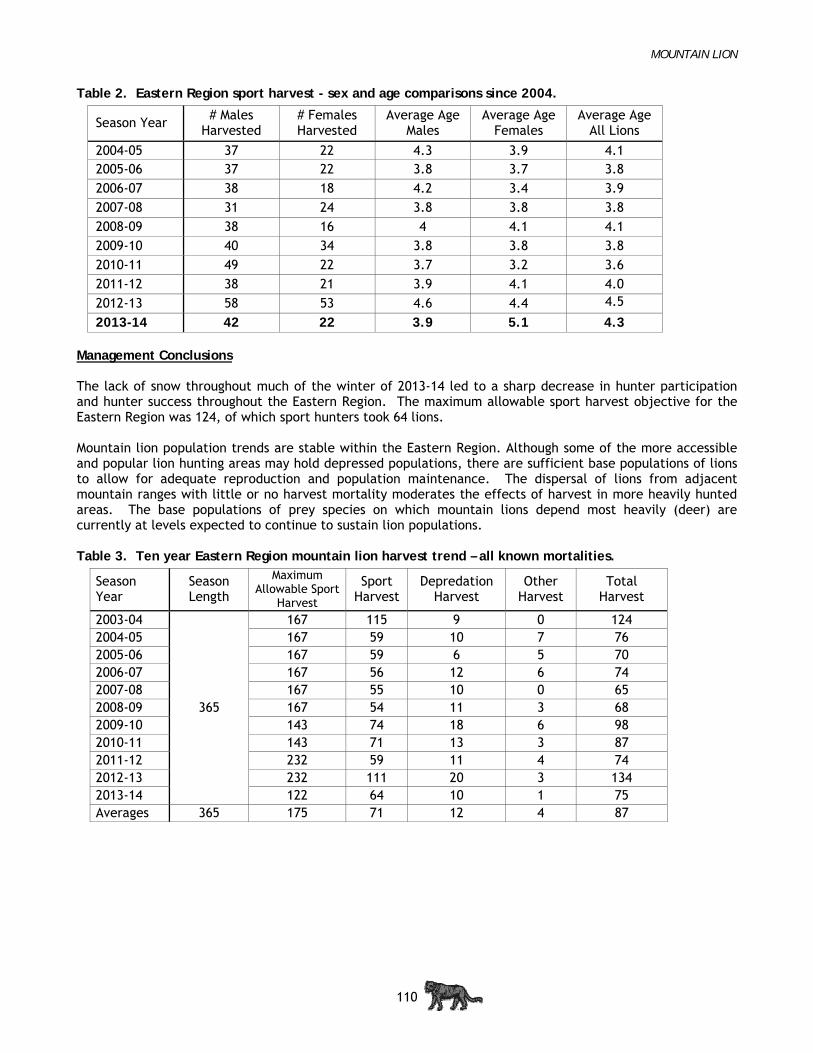
MOUNTAIN LION
110
Table 2. Eastern Region sport harvest - sex and age comparisons since 2004.
Season Year # Males
Harvested # Females Harvested
Average Age Males
Average Age Females
Average Age All Lions
2004-05 37 22 4.3 3.9 4.1 2005-06 37 22 3.8 3.7 3.8 2006-07 38 18 4.2 3.4 3.9 2007-08 31 24 3.8 3.8 3.8 2008-09 38 16 4 4.1 4.1 2009-10 40 34 3.8 3.8 3.8 2010-11 49 22 3.7 3.2 3.6 2011-12 38 21 3.9 4.1 4.0 2012-13 58 53 4.6 4.4 4.5
2013-14 42 22 3.9 5.1 4.3 Management Conclusions The lack of snow throughout much of the winter of 2013-14 led to a sharp decrease in hunter participation and hunter success throughout the Eastern Region. The maximum allowable sport harvest objective for the Eastern Region was 124, of which sport hunters took 64 lions. Mountain lion population trends are stable within the Eastern Region. Although some of the more accessible and popular lion hunting areas may hold depressed populations, there are sufficient base populations of lions to allow for adequate reproduction and population maintenance. The dispersal of lions from adjacent mountain ranges with little or no harvest mortality moderates the effects of harvest in more heavily hunted areas. The base populations of prey species on which mountain lions depend most heavily (deer) are currently at levels expected to continue to sustain lion populations. Table 3. Ten year Eastern Region mountain lion harvest trend – all known mortalities.
Season Year
Season Length
Maximum Allowable Sport
Harvest
Sport Harvest
Depredation Harvest
Other Harvest
Total Harvest
2003-04
365
167 115 9 0 124 2004-05 167 59 10 7 76 2005-06 167 59 6 5 70 2006-07 167 56 12 6 74 2007-08 167 55 10 0 65 2008-09 167 54 11 3 68 2009-10 143 74 18 6 98 2010-11 143 71 13 3 87 2011-12 232 59 11 4 74 2012-13 232 111 20 3 134 2013-14 122 64 10 1 75 Averages 365 175 71 12 4 87

MOUNTAIN LION
111
Southern Region: Areas 16, 17, 21, 22, 23, 24, 25, 26 and 27 Report by: Mike Scott Harvest Results The 2013-2014 mountain lion season ran from 1 March 2013 through 28 February 2014 in all areas of the Southern Region, with the exception of Area 28, which remains closed to mountain lion hunting. The harvest limits in all areas were combined to form a regional harvest limit of 52 lions. Table 1 displays a comparison of harvest for the last 10 years. Table 2 displays the regional lion harvest for the 2013 – 2014 season. Table 1: Comparison of Southern Region Harvest by area groups for the last 10 years
Area Group
2004-05 2005-06 2006-07 2007-08 2008-09 2009-10 2010-11 2011-12 2012-13 2013-14
161-164 0 4 5 6 3 11 8 5 3 2
171-173 3 7 10 10 8 4 4 3 3 7
211-212 0 0 2 1 0 0 0 0 0 0
221-223 5 4 1 6 6 3 6 12 12 8
231 0 5 1 1 6 2 4 2 9 4
241-245 2 3 4 5 4 4 7 5 6 6
251-253 0 0 0 1 3 1 1 0 1 0
261-268 3 0 2 4 2 0 1 1 1 2
271-272 0 0 2 0 0 0 0 1 0 0
Totals 13 23 27 34 32 25 31 29 35 29 Table 2: All Southern Region Mountain Lion Mortalities by Type/ Distribution for 2013-2014
Management Area Groups
Harvest Limit
Sport Harvest
Depredation Harvest
Other Harvest
Total Harvest
161-164
Regional
2 0 0 2
171-173 6 1 0 7
211-212 0 0 0 0
221-223 7 1 0 8
231 4 0 0 4
241-245 5 0 1 6
251-253 0 0 0 0
261-268 2 0 0 2
271-272 0 0 0 0
Totals: 52 26 2 1 29 Regional sport harvest for the 2013-2014 season consisted of 26 lions which is lower than the 32 lions harvested during the 2012-13 season. Two lions were removed for depredation purposes. One lion was taken as part of the Delamar Mountain Bighorn Protection Project. Regional depredation complaints have averaged 1.8 per year (range 0 to 5) during the last 10 seasons (2004-2014). Population Trend The 2013-2014 Southern Region mountain lion sport harvest consisted of 16 males and 10 females for a male to female ratio of 1.6:1. The 5-year average is 1.7:1. Number of lions taken decreased over the previous season with 29 lions harvested during 2013-2014. Average age of males was 3.6, which is below the ten-year average age of 4.6. Average age of females was 3.6, which is below the ten-year average age of 3.8. Overall, the average of 3.5 is below the ten-year average of 4.2 years of age. The total harvest of 29 lions is
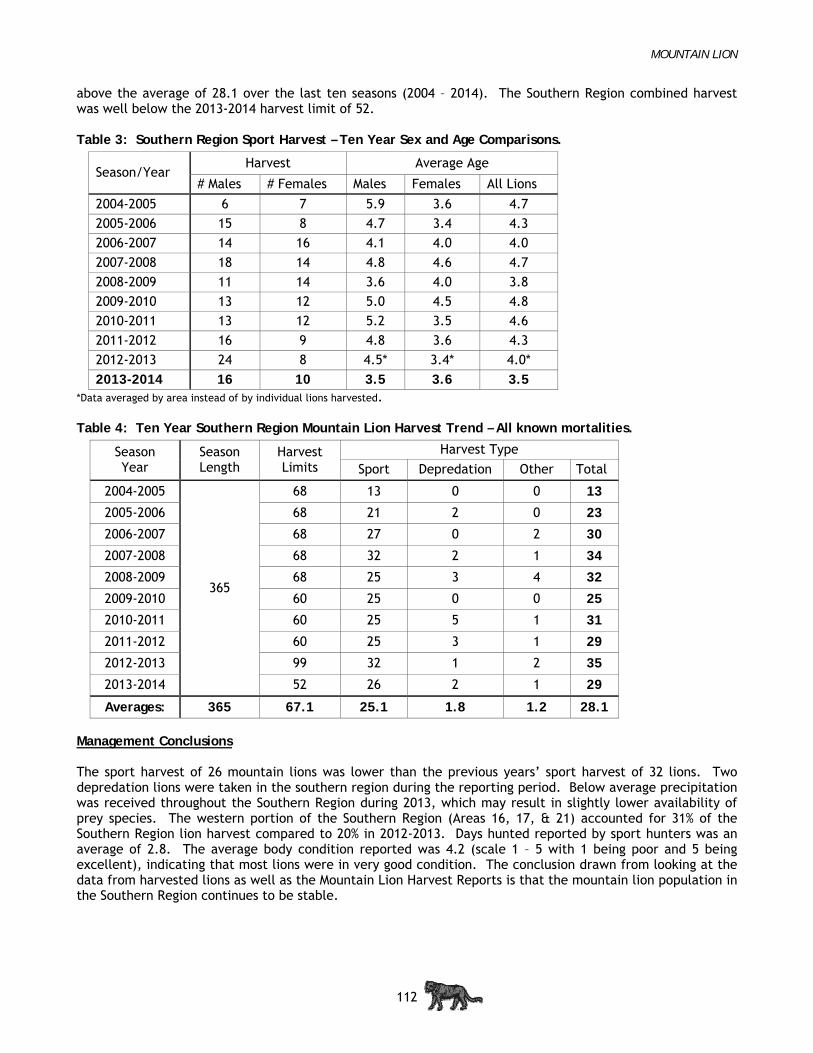
MOUNTAIN LION
112
above the average of 28.1 over the last ten seasons (2004 – 2014). The Southern Region combined harvest was well below the 2013-2014 harvest limit of 52. Table 3: Southern Region Sport Harvest – Ten Year Sex and Age Comparisons.
Season/Year Harvest Average Age
# Males # Females Males Females All Lions
2004-2005 6 7 5.9 3.6 4.7
2005-2006 15 8 4.7 3.4 4.3
2006-2007 14 16 4.1 4.0 4.0
2007-2008 18 14 4.8 4.6 4.7
2008-2009 11 14 3.6 4.0 3.8
2009-2010 13 12 5.0 4.5 4.8
2010-2011 13 12 5.2 3.5 4.6
2011-2012 16 9 4.8 3.6 4.3
2012-2013 24 8 4.5* 3.4* 4.0*
2013-2014 16 10 3.5 3.6 3.5 *Data averaged by area instead of by individual lions harvested. Table 4: Ten Year Southern Region Mountain Lion Harvest Trend – All known mortalities.
Season Year
Season Length
Harvest Limits
Harvest Type
Sport Depredation Other Total
2004-2005
365
68 13 0 0 13
2005-2006 68 21 2 0 23
2006-2007 68 27 0 2 30
2007-2008 68 32 2 1 34
2008-2009 68 25 3 4 32
2009-2010 60 25 0 0 25
2010-2011 60 25 5 1 31
2011-2012 60 25 3 1 29
2012-2013 99 32 1 2 35
2013-2014 52 26 2 1 29
Averages: 365 67.1 25.1 1.8 1.2 28.1 Management Conclusions The sport harvest of 26 mountain lions was lower than the previous years’ sport harvest of 32 lions. Two depredation lions were taken in the southern region during the reporting period. Below average precipitation was received throughout the Southern Region during 2013, which may result in slightly lower availability of prey species. The western portion of the Southern Region (Areas 16, 17, & 21) accounted for 31% of the Southern Region lion harvest compared to 20% in 2012-2013. Days hunted reported by sport hunters was an average of 2.8. The average body condition reported was 4.2 (scale 1 – 5 with 1 being poor and 5 being excellent), indicating that most lions were in very good condition. The conclusion drawn from looking at the data from harvested lions as well as the Mountain Lion Harvest Reports is that the mountain lion population in the Southern Region continues to be stable.
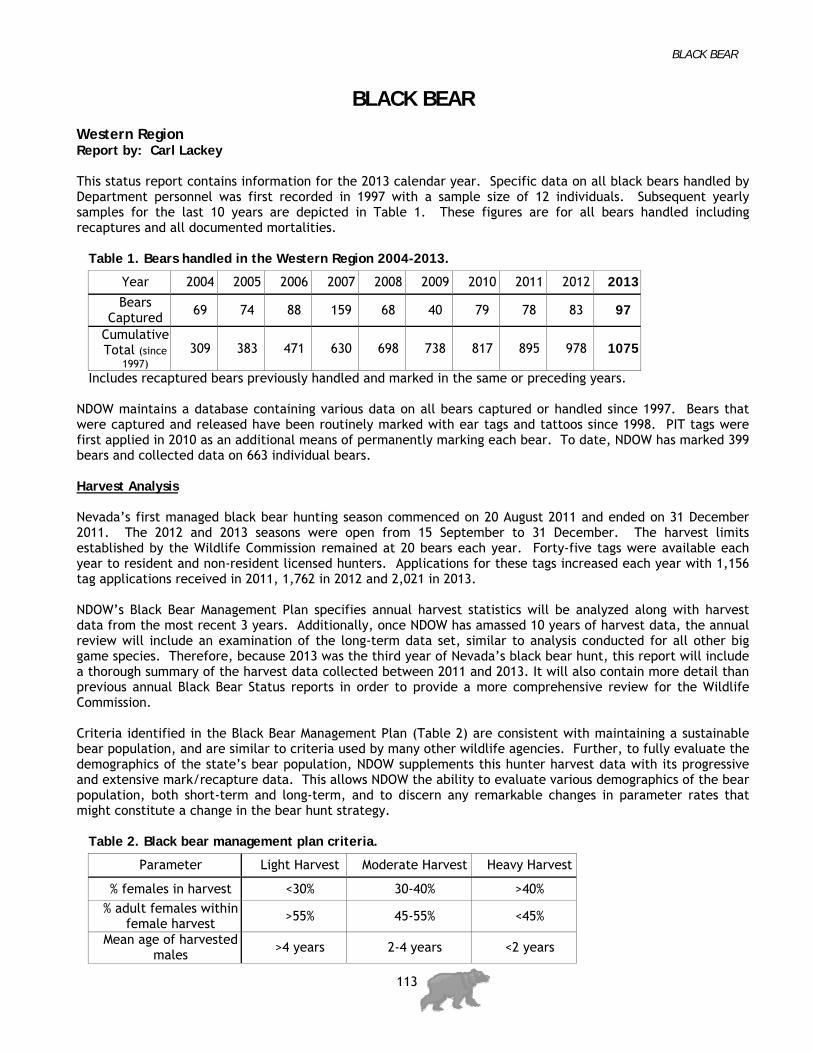
BLACK BEAR
113
BLACK BEAR Western Region Report by: Carl Lackey This status report contains information for the 2013 calendar year. Specific data on all black bears handled by Department personnel was first recorded in 1997 with a sample size of 12 individuals. Subsequent yearly samples for the last 10 years are depicted in Table 1. These figures are for all bears handled including recaptures and all documented mortalities. Table 1. Bears handled in the Western Region 2004-2013.
Year 2004 2005 2006 2007 2008 2009 2010 2011 2012 2013
Bears Captured
69 74 88 159 68 40 79 78 83 97
Cumulative Total (since
1997) 309 383 471 630 698 738 817 895 978 1075
Includes recaptured bears previously handled and marked in the same or preceding years. NDOW maintains a database containing various data on all bears captured or handled since 1997. Bears that were captured and released have been routinely marked with ear tags and tattoos since 1998. PIT tags were first applied in 2010 as an additional means of permanently marking each bear. To date, NDOW has marked 399 bears and collected data on 663 individual bears. Harvest Analysis Nevada’s first managed black bear hunting season commenced on 20 August 2011 and ended on 31 December 2011. The 2012 and 2013 seasons were open from 15 September to 31 December. The harvest limits established by the Wildlife Commission remained at 20 bears each year. Forty-five tags were available each year to resident and non-resident licensed hunters. Applications for these tags increased each year with 1,156 tag applications received in 2011, 1,762 in 2012 and 2,021 in 2013. NDOW’s Black Bear Management Plan specifies annual harvest statistics will be analyzed along with harvest data from the most recent 3 years. Additionally, once NDOW has amassed 10 years of harvest data, the annual review will include an examination of the long-term data set, similar to analysis conducted for all other big game species. Therefore, because 2013 was the third year of Nevada’s black bear hunt, this report will include a thorough summary of the harvest data collected between 2011 and 2013. It will also contain more detail than previous annual Black Bear Status reports in order to provide a more comprehensive review for the Wildlife Commission. Criteria identified in the Black Bear Management Plan (Table 2) are consistent with maintaining a sustainable bear population, and are similar to criteria used by many other wildlife agencies. Further, to fully evaluate the demographics of the state’s bear population, NDOW supplements this hunter harvest data with its progressive and extensive mark/recapture data. This allows NDOW the ability to evaluate various demographics of the bear population, both short-term and long-term, and to discern any remarkable changes in parameter rates that might constitute a change in the bear hunt strategy. Table 2. Black bear management plan criteria.
Parameter Light Harvest Moderate Harvest Heavy Harvest
% females in harvest <30% 30-40% >40%
% adult females within female harvest >55% 45-55% <45%
Mean age of harvested males
>4 years 2-4 years <2 years

BLACK BEAR
114
Table 3. Number and average age, all bears 1997-2013.
Each tag holder or their licensed guide was required to attend a mandatory Bear Hunt indoctrination course prior to receiving their tag. Indoctrination courses were held in Reno and Las Vegas and covered information pertaining to bear behavior, bear gender and size identification, legal hunting areas, hunting methods, and field care of the hide and meat. Additionally, attendees were thoroughly instructed about open hunting units and specifically, on areas to avoid such as private Indian lands and the Tahoe Basin. All hunters were required to personally bring the hide and skull of harvested bears to a Department representative for check-in. Information on each kill was acquired including the gender of each bear, estimated age, physical condition, location of kill, method of hunt, etcetera. A total of 39 bears was killed in the first 3 years of Nevada’s black bear hunt (Table 4). Based on the availability of 45 tags/year, hunter success was 29%. Examining all criteria outlined in Table 2 above, analysis of harvest data from the last 3 years indicate the bear harvest was conservative. Of the 39 bears killed, 29 were males and 10 were females, with average ages of 5.7 and 7.0 years respectively (Table 4). Interestingly, when data from all bears handled 1997-2013 is examined (Table 3) and compared to data specific to the hunt data, hunter harvested bears are slightly older than first-event bears handled for all reasons (n=484). The average age of 295 first-event male bears and 189 female bears handled from 1997-2013 is 4.6 years and 6.0 years, respectively. Additionally, the percent of first-event adult females (≥4 years) handled during the same period was 61% compared to 80% of hunter harvested bears. This indicates older age cohorts are prevalent within the population. All indications are that the number and age cohorts of bears killed during the hunt can be considered light and well within criteria adopted to facilitate maintenance of a sustainable bear population (Table 3). Other hunt results involving the successful tagholders include: 87% of the hunters packed out the bear meat, 7 were guided by professional guides, 2 were non-residents, and 1 killed their bear on private Indian lands in Douglas County after being invited to do so by the landowner. Table 4. Hunter harvest data.
Age cohort Gender # 1997-2013
Cubs ≤12 months
♂ 73
♀ 71
Sub-adults 1-3 years
♂ 148
♀ 73
Adults 4+ yrs/avg age
♂ 147
7.2 yrs
♀ 116
8.6 yrs
All bears average age
♂ 295
4.6 yrs
♀ 189
6.0 yrs
2011 2012 2013 3 year Harvest criteria indicator
Male bears killed 9 10 10 29
Female bears killed 5 1 4 10
% females in harvest 36% 9% 29% 26% Light harvest
% adult females within female harvest
80% 100% 75% 80% Light harvest
Mean age males 5.9 5.1 6.1 5.7 Light harvest
Mean age females 6.9 9.0 7.8 7.0
Mean age all 5.9 5.5 6.6 6.0
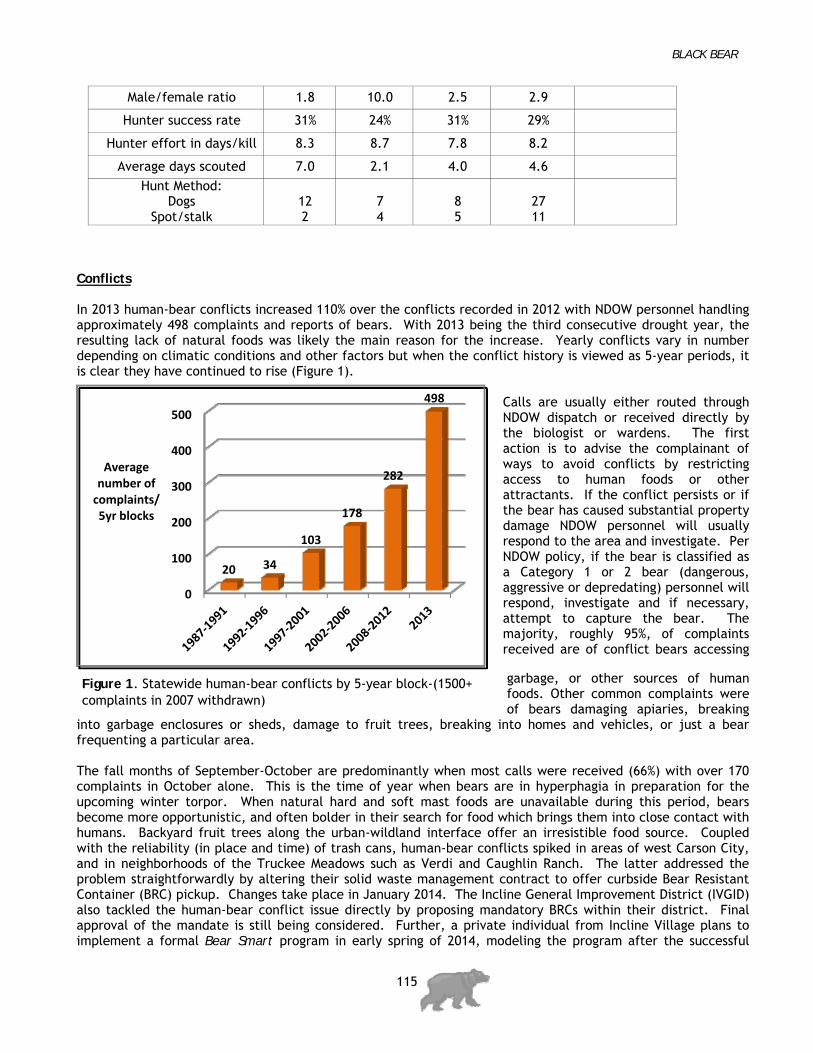
BLACK BEAR
115
Figure 1. Statewide human-bear conflicts by 5-year block-(1500+ complaints in 2007 withdrawn)
0
100
200
300
400
500
20 34
103
178
282
498
Average number of complaints/5yr blocks
Conflicts In 2013 human-bear conflicts increased 110% over the conflicts recorded in 2012 with NDOW personnel handling approximately 498 complaints and reports of bears. With 2013 being the third consecutive drought year, the resulting lack of natural foods was likely the main reason for the increase. Yearly conflicts vary in number depending on climatic conditions and other factors but when the conflict history is viewed as 5-year periods, it is clear they have continued to rise (Figure 1).
Calls are usually either routed through NDOW dispatch or received directly by the biologist or wardens. The first action is to advise the complainant of ways to avoid conflicts by restricting access to human foods or other attractants. If the conflict persists or if the bear has caused substantial property damage NDOW personnel will usually respond to the area and investigate. Per NDOW policy, if the bear is classified as a Category 1 or 2 bear (dangerous, aggressive or depredating) personnel will respond, investigate and if necessary, attempt to capture the bear. The majority, roughly 95%, of complaints received are of conflict bears accessing
garbage, or other sources of human foods. Other common complaints were of bears damaging apiaries, breaking
into garbage enclosures or sheds, damage to fruit trees, breaking into homes and vehicles, or just a bear frequenting a particular area. The fall months of September-October are predominantly when most calls were received (66%) with over 170 complaints in October alone. This is the time of year when bears are in hyperphagia in preparation for the upcoming winter torpor. When natural hard and soft mast foods are unavailable during this period, bears become more opportunistic, and often bolder in their search for food which brings them into close contact with humans. Backyard fruit trees along the urban-wildland interface offer an irresistible food source. Coupled with the reliability (in place and time) of trash cans, human-bear conflicts spiked in areas of west Carson City, and in neighborhoods of the Truckee Meadows such as Verdi and Caughlin Ranch. The latter addressed the problem straightforwardly by altering their solid waste management contract to offer curbside Bear Resistant Container (BRC) pickup. Changes take place in January 2014. The Incline General Improvement District (IVGID) also tackled the human-bear conflict issue directly by proposing mandatory BRCs within their district. Final approval of the mandate is still being considered. Further, a private individual from Incline Village plans to implement a formal Bear Smart program in early spring of 2014, modeling the program after the successful
Male/female ratio 1.8 10.0 2.5 2.9
Hunter success rate 31% 24% 31% 29%
Hunter effort in days/kill 8.3 8.7 7.8 8.2
Average days scouted 7.0 2.1 4.0 4.6
Hunt Method: Dogs
Spot/stalk
12 2
7 4
8 5
27 11
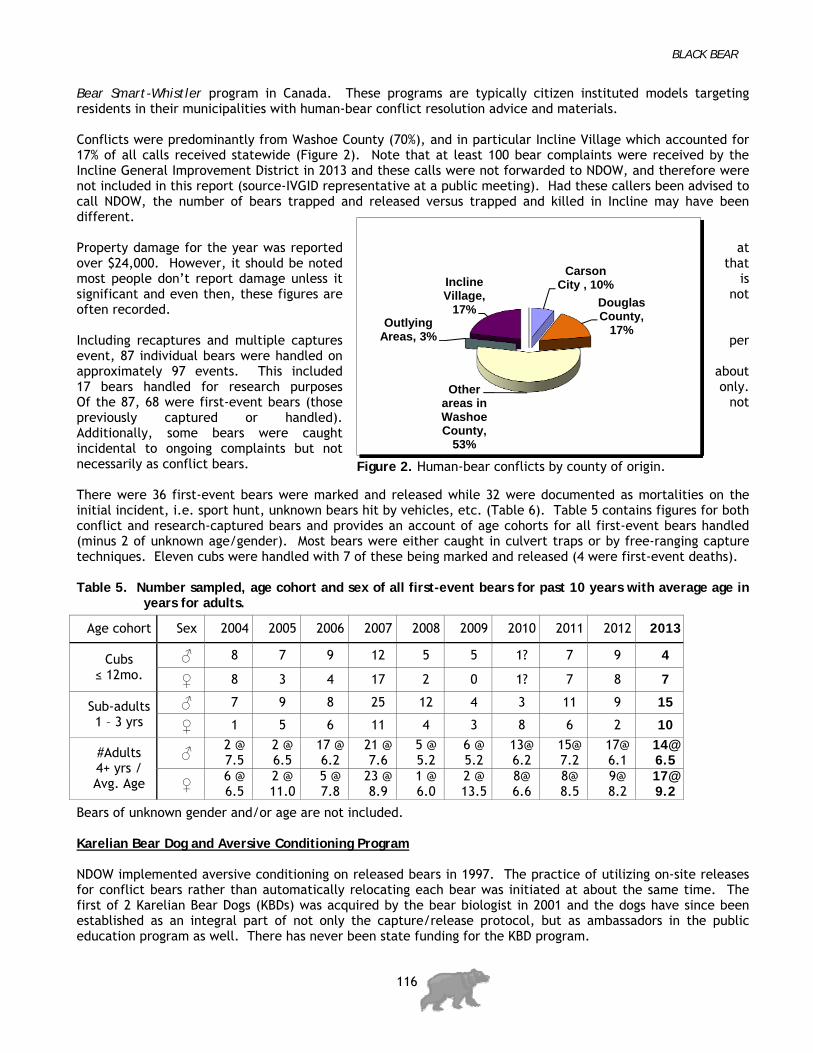
BLACK BEAR
116
Figure 2. Human-bear conflicts by county of origin.
Carson City , 10%
Douglas County,
17%
Other areas in Washoe County,
53%
Outlying Areas, 3%
Incline Village,
17%
Bear Smart-Whistler program in Canada. These programs are typically citizen instituted models targeting residents in their municipalities with human-bear conflict resolution advice and materials. Conflicts were predominantly from Washoe County (70%), and in particular Incline Village which accounted for 17% of all calls received statewide (Figure 2). Note that at least 100 bear complaints were received by the Incline General Improvement District in 2013 and these calls were not forwarded to NDOW, and therefore were not included in this report (source-IVGID representative at a public meeting). Had these callers been advised to call NDOW, the number of bears trapped and released versus trapped and killed in Incline may have been different. Property damage for the year was reported at over $24,000. However, it should be noted that most people don’t report damage unless it is significant and even then, these figures are not often recorded. Including recaptures and multiple captures per event, 87 individual bears were handled on approximately 97 events. This included about 17 bears handled for research purposes only. Of the 87, 68 were first-event bears (those not previously captured or handled). Additionally, some bears were caught incidental to ongoing complaints but not necessarily as conflict bears. There were 36 first-event bears were marked and released while 32 were documented as mortalities on the initial incident, i.e. sport hunt, unknown bears hit by vehicles, etc. (Table 6). Table 5 contains figures for both conflict and research-captured bears and provides an account of age cohorts for all first-event bears handled (minus 2 of unknown age/gender). Most bears were either caught in culvert traps or by free-ranging capture techniques. Eleven cubs were handled with 7 of these being marked and released (4 were first-event deaths). Table 5. Number sampled, age cohort and sex of all first-event bears for past 10 years with average age in
years for adults.
Age cohort Sex 2004 2005 2006 2007 2008 2009 2010 2011 2012 2013
Cubs ≤ 12mo.
♂ 8 7 9 12 5 5 1? 7 9 4
♀ 8 3 4 17 2 0 1? 7 8 7
Sub-adults 1 – 3 yrs
♂ 7 9 8 25 12 4 3 11 9 15
♀ 1 5 6 11 4 3 8 6 2 10
#Adults 4+ yrs / Avg. Age
♂ 2 @ 7.5
2 @ 6.5
17 @ 6.2
21 @ 7.6
5 @ 5.2
6 @ 5.2
13@ 6.2
15@ 7.2
17@ 6.1
14@ 6.5
♀ 6 @ 6.5
2 @ 11.0
5 @ 7.8
23 @ 8.9
1 @ 6.0
2 @ 13.5
8@ 6.6
8@ 8.5
9@ 8.2
17@ 9.2
Bears of unknown gender and/or age are not included. Karelian Bear Dog and Aversive Conditioning Program NDOW implemented aversive conditioning on released bears in 1997. The practice of utilizing on-site releases for conflict bears rather than automatically relocating each bear was initiated at about the same time. The first of 2 Karelian Bear Dogs (KBDs) was acquired by the bear biologist in 2001 and the dogs have since been established as an integral part of not only the capture/release protocol, but as ambassadors in the public education program as well. There has never been state funding for the KBD program.
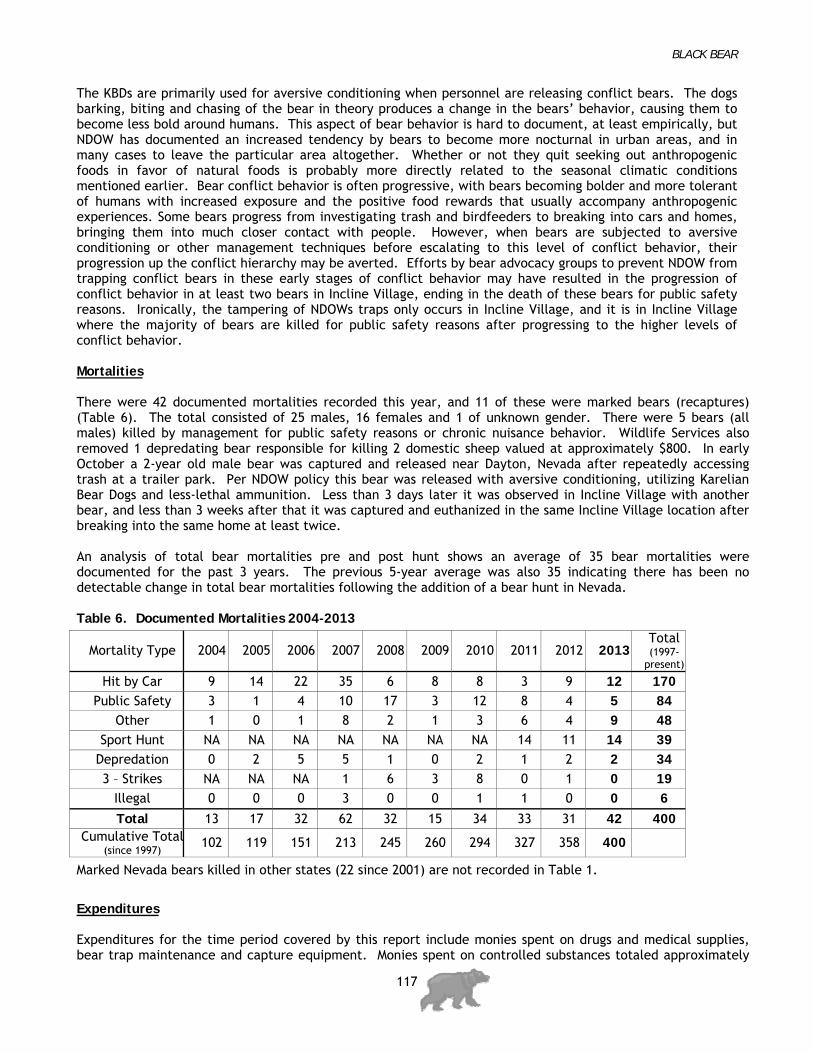
BLACK BEAR
117
The KBDs are primarily used for aversive conditioning when personnel are releasing conflict bears. The dogs barking, biting and chasing of the bear in theory produces a change in the bears’ behavior, causing them to become less bold around humans. This aspect of bear behavior is hard to document, at least empirically, but NDOW has documented an increased tendency by bears to become more nocturnal in urban areas, and in many cases to leave the particular area altogether. Whether or not they quit seeking out anthropogenic foods in favor of natural foods is probably more directly related to the seasonal climatic conditions mentioned earlier. Bear conflict behavior is often progressive, with bears becoming bolder and more tolerant of humans with increased exposure and the positive food rewards that usually accompany anthropogenic experiences. Some bears progress from investigating trash and birdfeeders to breaking into cars and homes, bringing them into much closer contact with people. However, when bears are subjected to aversive conditioning or other management techniques before escalating to this level of conflict behavior, their progression up the conflict hierarchy may be averted. Efforts by bear advocacy groups to prevent NDOW from trapping conflict bears in these early stages of conflict behavior may have resulted in the progression of conflict behavior in at least two bears in Incline Village, ending in the death of these bears for public safety reasons. Ironically, the tampering of NDOWs traps only occurs in Incline Village, and it is in Incline Village where the majority of bears are killed for public safety reasons after progressing to the higher levels of conflict behavior. Mortalities There were 42 documented mortalities recorded this year, and 11 of these were marked bears (recaptures) (Table 6). The total consisted of 25 males, 16 females and 1 of unknown gender. There were 5 bears (all males) killed by management for public safety reasons or chronic nuisance behavior. Wildlife Services also removed 1 depredating bear responsible for killing 2 domestic sheep valued at approximately $800. In early October a 2-year old male bear was captured and released near Dayton, Nevada after repeatedly accessing trash at a trailer park. Per NDOW policy this bear was released with aversive conditioning, utilizing Karelian Bear Dogs and less-lethal ammunition. Less than 3 days later it was observed in Incline Village with another bear, and less than 3 weeks after that it was captured and euthanized in the same Incline Village location after breaking into the same home at least twice. An analysis of total bear mortalities pre and post hunt shows an average of 35 bear mortalities were documented for the past 3 years. The previous 5-year average was also 35 indicating there has been no detectable change in total bear mortalities following the addition of a bear hunt in Nevada. Table 6. Documented Mortalities 2004-2013
Mortality Type 2004 2005 2006 2007 2008 2009 2010 2011 2012 2013 Total (1997-
present) Hit by Car 9 14 22 35 6 8 8 3 9 12 170
Public Safety 3 1 4 10 17 3 12 8 4 5 84
Other 1 0 1 8 2 1 3 6 4 9 48
Sport Hunt NA NA NA NA NA NA NA 14 11 14 39
Depredation 0 2 5 5 1 0 2 1 2 2 34
3 – Strikes NA NA NA 1 6 3 8 0 1 0 19
Illegal 0 0 0 3 0 0 1 1 0 0 6
Total 13 17 32 62 32 15 34 33 31 42 400 Cumulative Total
(since 1997) 102 119 151 213 245 260 294 327 358 400
Marked Nevada bears killed in other states (22 since 2001) are not recorded in Table 1.
Expenditures Expenditures for the time period covered by this report include monies spent on drugs and medical supplies, bear trap maintenance and capture equipment. Monies spent on controlled substances totaled approximately

BLACK BEAR
118
$2,500. For all operating accounts (Category 58) a total of $15,085.64 was expended in calendar year 2013 for bear management related activities. The Departments public education program, Bear Logic (formerly Bear Aware), has remained static over the last four years due to funding shortfalls. Handout materials are limited to stock on hand. Regardless, several public presentations were given throughout the year. Research NDOW continues to cooperate with the Wildlife Conservation Society, the University of Nevada, Reno, Columbia University (New York) and the University of Tennessee on ongoing research projects. Ongoing projects include: DNA mapping; Production and recruitment of wildland bears; and an Isotope analysis of urban/wildland bears. As a result of Heritage funding NDOW currently has 9 adult female bears deployed with satellite collars as part of the study looking at production potential and recruitment in wildland bears. Status Nevada’s bear population is believed to be part of the larger Sierra Nevada population, estimated at 10,000-15,000 bears. A viable population of black bears exists in the Carson Range of the Sierra Nevada, the Pinenut Mountains, Virginia Range, Peavine Mountain, Pine Grove Hills, Wassuk Range, Sweetwater Mountains, East Walker River area, and likely the Excelsior Range. Occupation in historic habitat has been documented but it is likely viable populations do not exist at this time and these are just bears in a transient state. One can conclude from these analyses and long-term trends in the data set, along with empirical data collected from captured bears, sightings and mortalities that Nevada’s black bear population is thriving, and likely increasing in distribution, both numerically and geographically. The thresholds of harvest criteria set forth in the Black Bear Management plan were not met in 2011, 2012, or 2013 indicating sport harvest was conservative. The bear population, as evidenced by annual conflict complaints, depends on adequate production of natural food resources such as soft mast (berries), hard mast (pine nuts), forbs, grasses, insects and a mammalian prey base. These resources are most often dependent upon annual climatic conditions, thus when northern Nevada experiences drought conditions bears will seek out other sources of food causing human-bear conflicts to increase. The winters of 2011, 2012 and 2013-14 registered below average for precipitation. This resulted in the increased number of conflicts reported in 2013, and should precipitation levels remain depressed for the remainder of 2014 then human/bear conflicts could reach levels not seen since 2007. Nonetheless, the long-term viability of the bear population appears favorable. Modeled population estimates were calculated in 2008 at 262 ±31, and in 2011 at 456 ±39 for the area encompassing the Carson Range, the Virginia Range and the western portion of the Pinenut Mountains. Using data collected over the past year in the Game Division’s deterministic reconstructive population model that is used for all big game species, the preliminary updated estimate for 2014 is just over 600 animals. This updated estimate compares favorably with the Mark estimate calculated in 2011 that put Western Nevada’s bear population between 400-700 animals.
APPENDIX
Harvest, Survey, and Population Tables


i
APPENDIX - TABLE OF CONTENTS Harvest, Survey, and Population Tables
TABLE 1. 2013 MULE DEER HARVEST BY POINT CLASS AND UNIT FOR ALL HUNTS ....................... 1
TABLE 2. FOUR-POINT OR BETTER MULE DEER HARVEST BY UNIT GROUP, 2004 - 2013 .............. 4
TABLE 3. 2013 MULE DEER JUNIOR HUNT RESULTS BY UNIT GROUP ............................................... 5
TABLE 4. 2013 MULE DEER HUNT RESULTS BY HUNT AND UNIT GROUP .......................................... 6
TABLE 5. 2013 PRONGHORN HARVEST BY GENDER BY UNIT FOR ALL HUNTS ................................ 16
TABLE 6. 2013 PRONGHORN HUNT RESULTS BY HUNT AND UNIT GROUP ....................................... 19
TABLE 7. 2013 PRONGHORN BUCK HORN LENGTH BY UNIT AND UNIT GROUP ............................... 24
TABLE 8. 2013 ELK HARVEST BY UNIT AND UNIT GROUP FOR ALL HUNTS ....................................... 27
TABLE 9. 2013 ELK HUNT RESULTS BY HUNT AND UNIT GROUP ........................................................ 29
TABLE 10. 2013 BULL ELK HARVEST MAIN BEAM LENGTH* BY UNIT GROUP .................................... 36
TABLE 11. 2013 BIGHORN SHEEP HUNT RESULTS BY HUNT AND UNIT GROUP............................... 37
TABLE 12. BIGHORN SHEEP HARVEST HISTORY .................................................................................. 40
TABLE 13. 2013 MOUNTAIN GOAT HUNT RESULTS BY HUNT AND UNIT GROUP .............................. 45
TABLE 14. 2013 BLACK BEAR DRAW AND HUNT RESULTS ................................................................... 46
TABLE 15. FALL 2013 AND SPRING 2014 MULE DEER SURVEY COMPOSITION .................................. 47
TABLE 16. LATE SUMMER/FALL/WINTER 2013 PRONGHORN SURVEY COMPOSITION .................... 48
TABLE 17. LATE SUMMER/FALL 2013 DESERT BIGHORN SHEEP SURVEY COMPOSITION .............. 49
TABLE 18. LATE SUMMER/FALL 2013 CALIFORNIA BIGHORN SHEEP SURVEY COMPOSITION ........................................................................................................................... 50
TABLE 19. SUMMER/WINTER/EARLY SPRING 2013-2014 ROCKY MOUNTAIN BIGHORN SHEEP SURVEY COMPOSITION .............................................................................................. 50
TABLE 20. JANUARY 2014 MOUNTAIN GOAT SURVEY COMPOSITION ................................................ 51
TABLE 21. FALL/WINTER 2013-2014 ROCKY MOUNTAIN ELK SURVEY COMPOSITION ..................... 51
TABLE 22. 2014 MULE DEER POPULATION ESTIMATES ........................................................................ 52
TABLE 23. 2014 ROCKY MOUNTAIN ELK POPULATION ESTIMATES .................................................... 53
TABLE 24. 2014 PRONGHORN POPULATION ESTIMATES ..................................................................... 54
TABLE 25. 2014 DESERT BIGHORN POPULATION ESTIMATES ............................................................ 55
TABLE 26. 2014 CALIFORNIA BIGHORN POPULATION ESTIMATES ..................................................... 56
TABLE 27. 2014 ROCKY MOUNTAIN BIGHORN POPULATION ESTIMATES .......................................... 56
TABLE 28. 2014 MOUNTAIN GOAT POPULATION ESTIMATES .............................................................. 56
TABLE 29. BIG GAME POPULATION ESTIMATE HISTORY 1978 - 2014 ................................................. 57
TABLE 30. BIG GAME TAG SALES AND HARVEST HISTORY BY SPECIES, 1984 - 2013 ...................... 58
TABLE 31. MOUNTAIN LION HARVEST BY SEX AND MANAGEMENT AREA, 1 MARCH 2013 – 28 FEBRUARY 2014 ................................................................................................................ 59
TABLE 32. NEVADA MOUNTAIN LION HARVEST AND MORTALITY TYPE, 1 MARCH 2013 – 28 FEBRUARY 2014 ................................................................................................................... 59
TABLE 33. NEVADA MOUNTAIN LION TAG SALES, SPORT HARVEST AND HUNTER SUCCESS BY HUNTER CLASS ................................................................................................. 60
TABLE 34. NEVADA MOUNTAIN LION DEPREDATION HARVEST .......................................................... 61
TABLE 35. NEVADA MOUNTAIN LION SEASON HISTORY, 1970-2013 ................................................... 62
TABLE 36. HUNT NUMBER DESCRIPTIONS ............................................................................................. 63

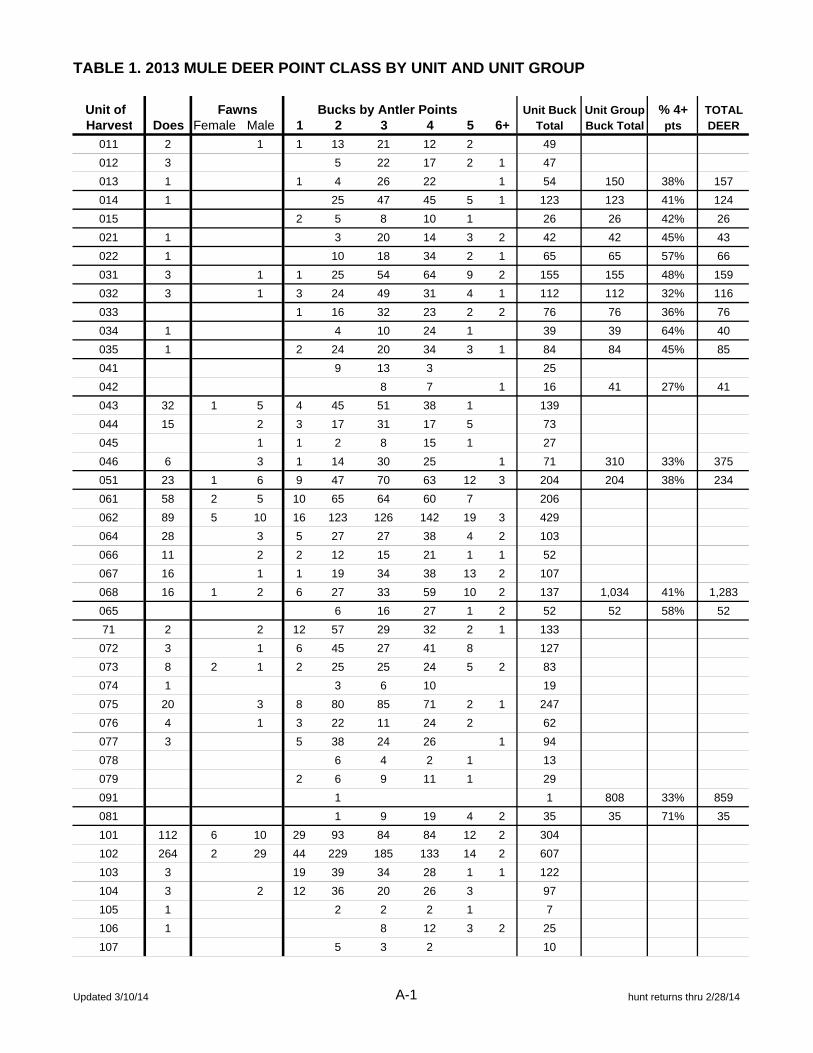
TABLE 1. 2013 MULE DEER POINT CLASS BY UNIT AND UNIT GROUP
Unit of Bucks by Antler Points Unit Buck Unit Group % 4+ TOTALHarvest Does Female Male 1 2 3 4 5 6+ Total Buck Total pts DEER
011 2 1 1 13 21 12 2 49
012 3 5 22 17 2 1 47
013 1 1 4 26 22 1 54 150 38% 157
014 1 25 47 45 5 1 123 123 41% 124
015 2 5 8 10 1 26 26 42% 26
021 1 3 20 14 3 2 42 42 45% 43
022 1 10 18 34 2 1 65 65 57% 66
031 3 1 1 25 54 64 9 2 155 155 48% 159
032 3 1 3 24 49 31 4 1 112 112 32% 116
033 1 16 32 23 2 2 76 76 36% 76
034 1 4 10 24 1 39 39 64% 40
035 1 2 24 20 34 3 1 84 84 45% 85
041 9 13 3 25
042 8 7 1 16 41 27% 41
043 32 1 5 4 45 51 38 1 139
044 15 2 3 17 31 17 5 73
045 1 1 2 8 15 1 27
046 6 3 1 14 30 25 1 71 310 33% 375
051 23 1 6 9 47 70 63 12 3 204 204 38% 234
061 58 2 5 10 65 64 60 7 206
062 89 5 10 16 123 126 142 19 3 429
064 28 3 5 27 27 38 4 2 103
066 11 2 2 12 15 21 1 1 52
067 16 1 1 19 34 38 13 2 107
068 16 1 2 6 27 33 59 10 2 137 1,034 41% 1,283
065 6 16 27 1 2 52 52 58% 52
71 2 2 12 57 29 32 2 1 133
072 3 1 6 45 27 41 8 127
073 8 2 1 2 25 25 24 5 2 83
074 1 3 6 10 19
075 20 3 8 80 85 71 2 1 247
076 4 1 3 22 11 24 2 62
077 3 5 38 24 26 1 94
078 6 4 2 1 13
079 2 6 9 11 1 29
091 1 1 808 33% 859
081 1 9 19 4 2 35 35 71% 35
101 112 6 10 29 93 84 84 12 2 304
102 264 2 29 44 229 185 133 14 2 607
103 3 19 39 34 28 1 1 122
104 3 2 12 36 20 26 3 97
105 1 2 2 2 1 7
106 1 8 12 3 2 25
107 5 3 2 10
Fawns
Updated 3/10/14 A-1 hunt returns thru 2/28/14

TABLE 1. 2013 MULE DEER POINT CLASS BY UNIT AND UNIT GROUP
Unit of Bucks by Antler Points Unit Buck Unit Group % 4+ TOTALHarvest Does Female Male 1 2 3 4 5 6+ Total Buck Total pts DEER
Fawns
108 1 4 24 27 13 2 2 72
109 6 1 2 4 2 5 1 14 1,258 28% 1,699
111 34 2 6 24 128 82 70 10 2 316
112 3 7 2 12
113 2 5 2 3 2 1 13 341 26% 385
114 6 1 2 7 11 17 2 39
115 11 1 4 3 13 27 20 2 3 68 107 41% 130
121 4 1 16 78 59 71 12 3 239 239 36% 244
131 4 1 5 60 77 81 7 3 233
132 1 3 16 23 31 11 2 86
133 3 4 6 2 15
134 1 1 1 5 7 341 43% 348
141 24 29 27 4 84
142 2 4 4 10 18
143 2 1 10 6 10 1 28
144 8 3 3 58 39 31 131
145 2 8 19 9 7 3 1 47 308 31% 325
151 5 2 4 25 22 14 65
152 44 1 4 17 20 14 2 53
153 1 2 3 4 5 14
154 3 1 1 2 17 11 15 1 46
155 18 2 3 1 9 9 15 34
156 1 1 3 4 1 1 10 222 31% 308
161 10 3 3 3 29 56 44 7 1 140
162 3 1 1 3 36 30 39 5 1 114
163 2 2 11 13 17 43
164 2 7 8 17 314 39% 337
171 3 1 1 3 22 20 17 2 64
172 4 4 15 21 12 2 1 55
173 15 1 13 45 46 51 6 161 280 33% 305
181 1 5 18 14 9 3 1 50
182 1 1 1 1 4
183 1 6 7 6 1 20
184 4 4 8 7 1 20 94 32% 100
192 1 1 2 4 11 20 37 37 54% 39
194 9 14 29 2 4 58
196 1 14 17 5 1 37 95 61% 96
195 1 2 4 12 4 2 24 24 25% 25
201 2 17 22 8 1 50
204 1 3 10 3 1 18 68 19% 68
202 2 6 25 27 2 2 64
205 1 1
206 1 2 5 8
207 1 1
Updated 3/10/14 A-2 hunt returns thru 2/28/14

TABLE 1. 2013 MULE DEER POINT CLASS BY UNIT AND UNIT GROUP
Unit of Bucks by Antler Points Unit Buck Unit Group % 4+ TOTALHarvest Does Female Male 1 2 3 4 5 6+ Total Buck Total pts DEER
Fawns
208 1 1 75 49% 75
203 3 2 9 23 19 2 4 59 59 42% 62
211 1 1 9 6 17
212 3 3 9 15
213 2 2 34 44% 34
221 6 1 1 50 53 50 4 3 161
222 13 6 48 66 95 17 5 237
223 3 4 17 18 16 5 1 61 459 43% 482
231 2 1 47 67 103 25 10 253 253 55% 255
241 1 4 14 14 6 5 44
242 1 5 9 17 6 4 41
243 1 1 2
245 1 3 2 6 93 62% 94
251 3 9 7 14 2 1 33
252 1 1 34 53% 37
261 2 2 2 1 7
262 2 10 18 11 39
263 1 2 1 4
264 1 1
265 0 51 27% 53
271 3 2 5
272 1 1 4 9 10 2 26 31 45% 32
291 3 5 13 13 25 1 57 57 46% 60
TOTAL 975 37 122 360 2,246 2,550 2,626 339 109 8,230 37% 9,364
Total Antlerless Harvest 1,134
SPECIAL TAGHOLDER HARVEST BY UNITHUNT UNIT # HUNT UNIT # HUNT UNIT #
PIW 021 1 PIW 195 1 SILVER 242 1
PIW 065 1 PIW 196 1 DREAM 081 1
PIW 067 1 PIW 222 3 HERITAGE 241 1
PIW 068 1 PIW 223 1 HERITAGE 242 1PIW 081 1 PIW 231 1PIW 131 1 PIW 242 4PIW 194 1 PIW 272 1
Updated 3/10/14 A-3 hunt returns thru 2/28/14
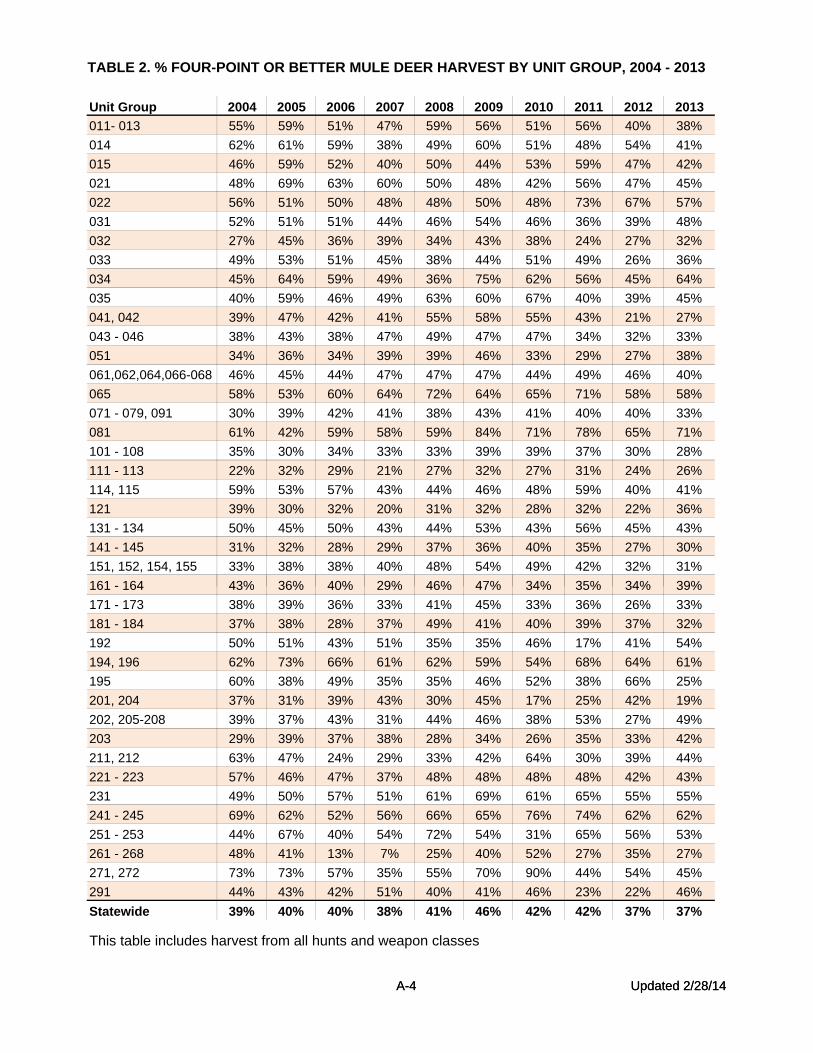
TABLE 2. % FOUR-POINT OR BETTER MULE DEER HARVEST BY UNIT GROUP, 2004 - 2013
Unit Group 2004 2005 2006 2007 2008 2009 2010 2011 2012 2013
011- 013 55% 59% 51% 47% 59% 56% 51% 56% 40% 38%
014 62% 61% 59% 38% 49% 60% 51% 48% 54% 41%
015 46% 59% 52% 40% 50% 44% 53% 59% 47% 42%
021 48% 69% 63% 60% 50% 48% 42% 56% 47% 45%
022 56% 51% 50% 48% 48% 50% 48% 73% 67% 57%
031 52% 51% 51% 44% 46% 54% 46% 36% 39% 48%
032 27% 45% 36% 39% 34% 43% 38% 24% 27% 32%
033 49% 53% 51% 45% 38% 44% 51% 49% 26% 36%
034 45% 64% 59% 49% 36% 75% 62% 56% 45% 64%
035 40% 59% 46% 49% 63% 60% 67% 40% 39% 45%
041, 042 39% 47% 42% 41% 55% 58% 55% 43% 21% 27%
043 - 046 38% 43% 38% 47% 49% 47% 47% 34% 32% 33%
051 34% 36% 34% 39% 39% 46% 33% 29% 27% 38%
061,062,064,066-068 46% 45% 44% 47% 47% 47% 44% 49% 46% 40%
065 58% 53% 60% 64% 72% 64% 65% 71% 58% 58%
071 - 079, 091 30% 39% 42% 41% 38% 43% 41% 40% 40% 33%
081 61% 42% 59% 58% 59% 84% 71% 78% 65% 71%
101 - 108 35% 30% 34% 33% 33% 39% 39% 37% 30% 28%
111 - 113 22% 32% 29% 21% 27% 32% 27% 31% 24% 26%
114, 115 59% 53% 57% 43% 44% 46% 48% 59% 40% 41%
121 39% 30% 32% 20% 31% 32% 28% 32% 22% 36%
131 - 134 50% 45% 50% 43% 44% 53% 43% 56% 45% 43%
141 - 145 31% 32% 28% 29% 37% 36% 40% 35% 27% 30%
151, 152, 154, 155 33% 38% 38% 40% 48% 54% 49% 42% 32% 31%
161 - 164 43% 36% 40% 29% 46% 47% 34% 35% 34% 39%
A-4 Updated 2/28/14
161 - 164 43% 36% 40% 29% 46% 47% 34% 35% 34% 39%
171 - 173 38% 39% 36% 33% 41% 45% 33% 36% 26% 33%
181 - 184 37% 38% 28% 37% 49% 41% 40% 39% 37% 32%
192 50% 51% 43% 51% 35% 35% 46% 17% 41% 54%
194, 196 62% 73% 66% 61% 62% 59% 54% 68% 64% 61%
195 60% 38% 49% 35% 35% 46% 52% 38% 66% 25%
201, 204 37% 31% 39% 43% 30% 45% 17% 25% 42% 19%
202, 205-208 39% 37% 43% 31% 44% 46% 38% 53% 27% 49%
203 29% 39% 37% 38% 28% 34% 26% 35% 33% 42%
211, 212 63% 47% 24% 29% 33% 42% 64% 30% 39% 44%
221 - 223 57% 46% 47% 37% 48% 48% 48% 48% 42% 43%
231 49% 50% 57% 51% 61% 69% 61% 65% 55% 55%
241 - 245 69% 62% 52% 56% 66% 65% 76% 74% 62% 62%
251 - 253 44% 67% 40% 54% 72% 54% 31% 65% 56% 53%
261 - 268 48% 41% 13% 7% 25% 40% 52% 27% 35% 27%
271, 272 73% 73% 57% 35% 55% 70% 90% 44% 54% 45%
291 44% 43% 42% 51% 40% 41% 46% 23% 22% 46%
Statewide 39% 40% 40% 38% 41% 46% 42% 42% 37% 37%
This table includes harvest from all hunts and weapon classes
A-4 Updated 2/28/14

TABLE 3. 2013 MULE DEER JUNIOR HUNT HARVEST BY UNIT GROUP
1st Choice 1st Draw Tags Tags % # Succ. % Hunter %
UNIT GROUP Apps. tag sales Sold Avail Draw Odds Return Hunters Success Bucks
011 - 013 108 90 90 90 2 to 1 91% 40 47% 85%
014 68 48 48 48 2 to 1 96% 34 73% 97%
015 23 17 17 16 2 to 1 100% 8 50% 100%
021 33 12 12 12 3 to 1 92% 9 75% 89%
022 38 21 21 21 2 to 1 95% 16 76% 94%
031 54 49 49 49 2 to 1 94% 32 67% 88%
032 55 55 56 56 1 to 1 89% 32 61% 88%
033 27 27 27 27 1 to 1 100% 17 63% 100%
034 12 12 12 12 1 to 1 92% 5 42% 80%
035 32 32 32 32 1 to 1 88% 20 66% 95%
041, 042 25 22 22 22 2 to 1 91% 9 41% 100%
043 - 046A 124 112 112 112 2 to 1 95% 70 64% 86%
051 102 102 128 128 1 to 1 89% 66 55% 70%
061, 062, 064, 066 - 068 375 358 358 358 1 to 1 91% 204 60% 77%
065 21 15 15 15 2 to 1 100% 11 73% 100%
071 - 079, 091 365 351 351 351 1 to 1 96% 229 67% 78%
081 15 11 11 11 2 to 1 91% 5 45% 100%
101 - 108 242 242 308 307 1 to 1 93% 153 51% 59%
111 - 113 205 200 200 200 1 to 1 90% 112 60% 61%
114, 115 79 79 89 88 1 to 1 93% 32 38% 81%
121 92 86 86 86 1 to 1 90% 60 74% 90%
131 - 134 152 129 129 129 2 to 1 93% 90 72% 92%
141 - 145 123 123 152 152 1 to 1 95% 101 68% 83%
151, 152, 154, 155 115 115 124 122 1 to 1 97% 75 62% 67%
161 - 164 148 148 171 171 1 to 1 92% 101 61% 77%
171 - 173 102 102 137 137 1 to 1 93% 59 45% 58%
181 - 184 84 84 88 87 1 to 1 91% 25 30% 76%
192 35 19 19 19 2 to 1 74% 10 63% 80%
194, 196 151 27 27 27 6 to 1 93% 23 89% 96%
195 23 11 11 11 3 to 1 82% 5 55% 80%
201, 204 39 26 26 26 2 to 1 96% 22 85% 100%
202, 205, 206 27 20 20 20 2 to 1 95% 14 70% 100%
203 34 30 30 30 2 to 1 90% 18 63% 83%
211, 212 13 13 13 13 1 to 1 85% 6 54% 100%
221 - 223 232 196 196 196 2 to 1 90% 117 63% 80%
231 168 84 84 84 2 to 1 95% 62 76% 97%
241 - 245 78 32 32 32 3 to 1 94% 22 72% 95%
251 - 253 17 17 26 26 1 to 1 100% 14 54% 79%
261 - 268 39 20 20 20 2 to 1 100% 15 75% 87%
271, 272 19 14 14 14 2 to 1 93% 7 50% 86%291 37 23 23 23 2 to 1 100% 16 70% 81%TOTALS 3,731 3,174 3,386 3,380 2 to 1 93% 1,966 60% 79%
Apps - # of unsuccessful 1st choice applicants plus successful 1st - 5th choice applicants for given unit group
Tags Avail - Available tags at season opener - accounts for tags returned for any reason
Draw Odds - # of 1st choice applicants plus successful applicants for every one tag sold% Hunter Success - based on # of successful hunters divided by total tags sold (includes did not hunts; a portion of nonreturns are assumed to be successful based on past trends of hunt records not yet returned)
Tags Sold - total tags sold from first 2 draws and tags sold during the first come first serve process; Commission approved tag quota in 2013 was 3,535 for the Junior 1107 Hunt
Updated 3/10/14 A-5 hunt returns thru 2/28/14
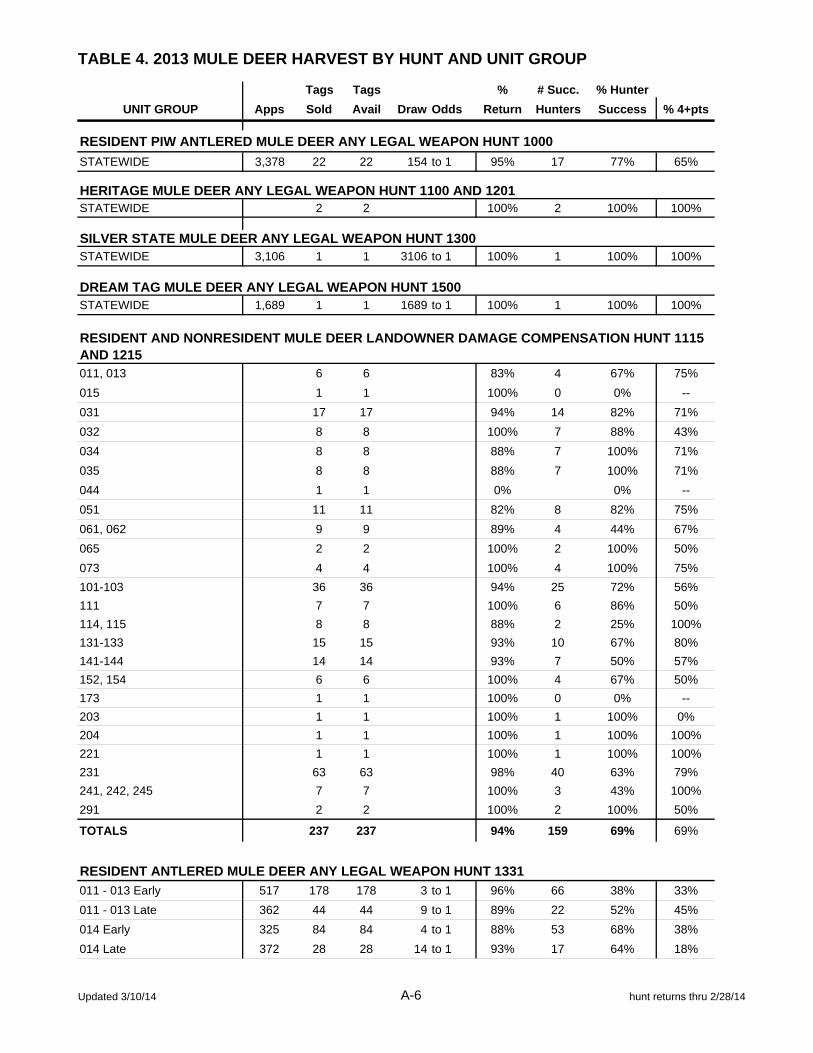
TABLE 4. 2013 MULE DEER HARVEST BY HUNT AND UNIT GROUP
Tags Tags % # Succ. % Hunter
UNIT GROUP Apps Sold Avail Draw Odds Return Hunters Success % 4+pts
RESIDENT PIW ANTLERED MULE DEER ANY LEGAL WEAPON HUNT 1000
STATEWIDE 3,378 22 22 154 to 1 95% 17 77% 65%
HERITAGE MULE DEER ANY LEGAL WEAPON HUNT 1100 AND 1201 STATEWIDE 2 2 100% 2 100% 100%
SILVER STATE MULE DEER ANY LEGAL WEAPON HUNT 1300STATEWIDE 3,106 1 1 3106 to 1 100% 1 100% 100%
DREAM TAG MULE DEER ANY LEGAL WEAPON HUNT 1500STATEWIDE 1,689 1 1 1689 to 1 100% 1 100% 100%
011, 013 6 6 83% 4 67% 75%
015 1 1 100% 0 0% --
031 17 17 94% 14 82% 71%
032 8 8 100% 7 88% 43%
034 8 8 88% 7 100% 71%
035 8 8 88% 7 100% 71%
044 1 1 0% 0% --
051 11 11 82% 8 82% 75%
061, 062 9 9 89% 4 44% 67%
065 2 2 100% 2 100% 50%
073 4 4 100% 4 100% 75%
101-103 36 36 94% 25 72% 56%
111 7 7 100% 6 86% 50%
114, 115 8 8 88% 2 25% 100%
131-133 15 15 93% 10 67% 80%
141-144 14 14 93% 7 50% 57%
152, 154 6 6 100% 4 67% 50%
173 1 1 100% 0 0% --
203 1 1 100% 1 100% 0%
204 1 1 100% 1 100% 100%
221 1 1 100% 1 100% 100%
231 63 63 98% 40 63% 79%
241, 242, 245 7 7 100% 3 43% 100%
291 2 2 100% 2 100% 50%
TOTALS 237 237 94% 159 69% 69%
RESIDENT ANTLERED MULE DEER ANY LEGAL WEAPON HUNT 1331
011 - 013 Early 517 178 178 3 to 1 96% 66 38% 33%
011 - 013 Late 362 44 44 9 to 1 89% 22 52% 45%
014 Early 325 84 84 4 to 1 88% 53 68% 38%
014 Late 372 28 28 14 to 1 93% 17 64% 18%
RESIDENT AND NONRESIDENT MULE DEER LANDOWNER DAMAGE COMPENSATION HUNT 1115 AND 1215
Updated 3/10/14 A-6 hunt returns thru 2/28/14

TABLE 4. 2013 MULE DEER HARVEST BY HUNT AND UNIT GROUP
Tags Tags % # Succ. % Hunter
UNIT GROUP Apps Sold Avail Draw Odds Return Hunters Success % 4+pts
015 127 34 34 4 to 1 88% 13 41% 38%
021 358 36 36 10 to 1 94% 27 78% 37%
022 331 63 63 6 to 1 95% 33 54% 58%
031 383 168 168 3 to 1 95% 88 54% 44%
032 245 146 146 2 to 1 93% 54 38% 39%
033 Early 117 68 68 2 to 1 88% 25 40% 32%
033 Late 143 38 38 4 to 1 97% 22 58% 59%
034 103 43 43 3 to 1 91% 21 51% 57%
035 180 96 96 2 to 1 95% 47 50% 40%
041, 042 187 52 52 4 to 1 98% 27 52% 26%
043 - 046 Early 468 264 264 2 to 1 97% 128 49% 27%
043 - 046 Late 371 174 174 3 to 1 91% 79 48% 33%
051 488 295 295 2 to 1 93% 101 36% 37%
061, 062, 064, 066 - 068 E 2,169 1,403 1,403 2 to 1 93% 590 44% 34%061, 062, 064, 066 - 068 L 982 154 154 7 to 1 94% 90 60% 66%
065 420 49 49 9 to 1 94% 33 69% 64%
071 - 079, 091 Early 1,432 768 768 2 to 1 93% 373 51% 22%
071 - 079. 091 Late 910 135 135 7 to 1 96% 83 63% 57%
081 253 47 47 6 to 1 89% 22 49% 73%
101 - 109 Early 1,365 1,240 1,240 2 to 1 91% 335 28% 16%
101 - 109 Mid 1,297 1,240 1,240 1 to 1 92% 322 27% 21%
101 - 109 Late 689 358 358 2 to 1 93% 182 53% 36%
111 - 113 Early 959 526 526 2 to 1 91% 166 33% 16%
111 - 113 Late 275 57 57 5 to 1 98% 33 58% 55%
114, 115 Early 122 73 73 2 to 1 95% 16 22% 38%
114, 115 Late 73 32 32 3 to 1 94% 12 38% 67%
121 Early 342 202 202 2 to 1 96% 124 63% 26%
121 Late 157 22 22 8 to 1 91% 17 82% 53%
131 - 134 Early 662 256 256 3 to 1 92% 154 63% 35%
131 - 134 Late 454 30 30 16 to 1 100% 23 77% 61%
141 - 145 Early 494 355 355 2 to 1 93% 132 39% 30%
141 - 145 Late 179 55 55 4 to 1 95% 27 51% 48%
151 - 156 Early 464 309 309 2 to 1 91% 102 35% 23%
151 - 156 Late 141 35 35 5 to 1 86% 17 51% 53%
161 - 164 Early 577 348 348 2 to 1 95% 138 41% 30%
161 - 164 Late 268 40 40 7 to 1 93% 22 58% 68%
171 - 173 Early 668 514 514 2 to 1 93% 125 25% 27%
171 - 173 Late 298 140 140 3 to 1 94% 45 33% 38%
181 - 184 355 168 168 3 to 1 93% 52 32% 29%
192 236 34 34 7 to 1 94% 20 62% 50%
194, 196 1,683 65 65 26 to 1 92% 52 83% 73%
195 147 20 20 8 to 1 100% 12 60% 33%
201, 204 333 58 58 6 to 1 91% 32 59% 16%
202, 205, 206 225 60 60 4 to 1 100% 41 68% 56%
Updated 3/10/14 A-7 hunt returns thru 2/28/14
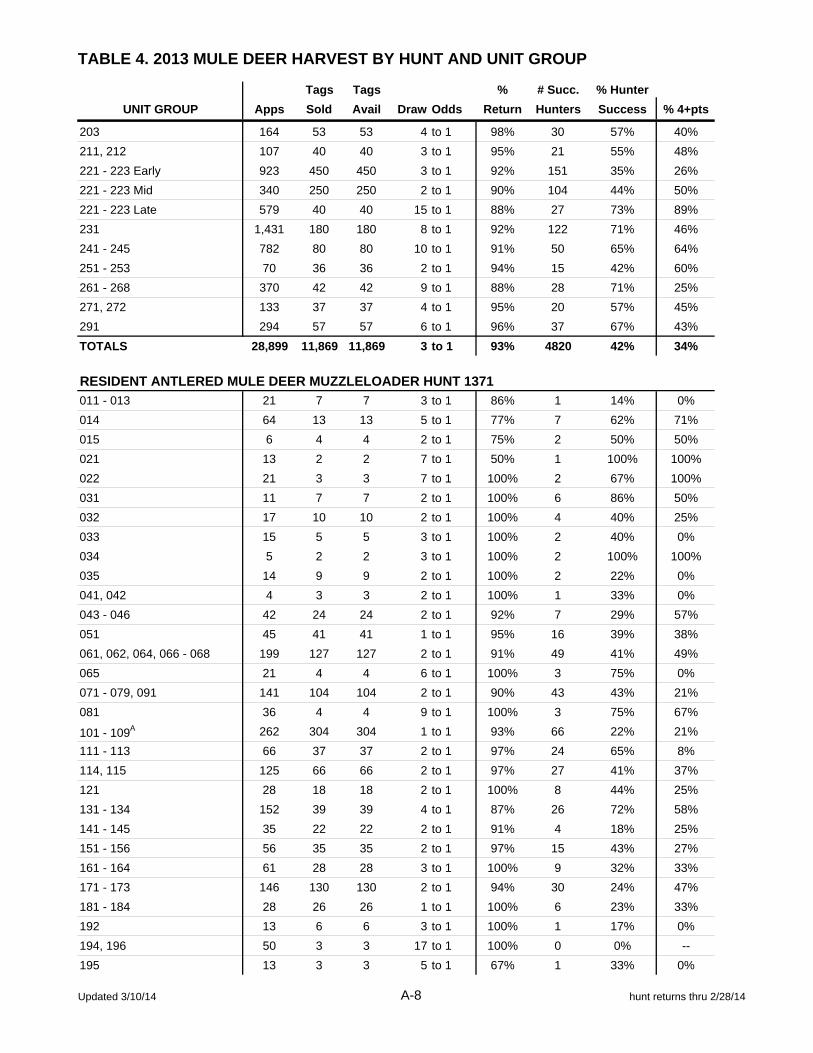
TABLE 4. 2013 MULE DEER HARVEST BY HUNT AND UNIT GROUP
Tags Tags % # Succ. % Hunter
UNIT GROUP Apps Sold Avail Draw Odds Return Hunters Success % 4+pts
203 164 53 53 4 to 1 98% 30 57% 40%
211, 212 107 40 40 3 to 1 95% 21 55% 48%
221 - 223 Early 923 450 450 3 to 1 92% 151 35% 26%
221 - 223 Mid 340 250 250 2 to 1 90% 104 44% 50%
221 - 223 Late 579 40 40 15 to 1 88% 27 73% 89%
231 1,431 180 180 8 to 1 92% 122 71% 46%
241 - 245 782 80 80 10 to 1 91% 50 65% 64%
251 - 253 70 36 36 2 to 1 94% 15 42% 60%
261 - 268 370 42 42 9 to 1 88% 28 71% 25%
271, 272 133 37 37 4 to 1 95% 20 57% 45%
291 294 57 57 6 to 1 96% 37 67% 43%
TOTALS 28,899 11,869 11,869 3 to 1 93% 4820 42% 34%
RESIDENT ANTLERED MULE DEER MUZZLELOADER HUNT 1371
011 - 013 21 7 7 3 to 1 86% 1 14% 0%
014 64 13 13 5 to 1 77% 7 62% 71%
015 6 4 4 2 to 1 75% 2 50% 50%
021 13 2 2 7 to 1 50% 1 100% 100%
022 21 3 3 7 to 1 100% 2 67% 100%
031 11 7 7 2 to 1 100% 6 86% 50%
032 17 10 10 2 to 1 100% 4 40% 25%
033 15 5 5 3 to 1 100% 2 40% 0%
034 5 2 2 3 to 1 100% 2 100% 100%
035 14 9 9 2 to 1 100% 2 22% 0%
041, 042 4 3 3 2 to 1 100% 1 33% 0%
043 - 046 42 24 24 2 to 1 92% 7 29% 57%
051 45 41 41 1 to 1 95% 16 39% 38%
061, 062, 064, 066 - 068 199 127 127 2 to 1 91% 49 41% 49%
065 21 4 4 6 to 1 100% 3 75% 0%
071 - 079, 091 141 104 104 2 to 1 90% 43 43% 21%
081 36 4 4 9 to 1 100% 3 75% 67%
101 - 109A 262 304 304 1 to 1 93% 66 22% 21%
111 - 113 66 37 37 2 to 1 97% 24 65% 8%
114, 115 125 66 66 2 to 1 97% 27 41% 37%
121 28 18 18 2 to 1 100% 8 44% 25%
131 - 134 152 39 39 4 to 1 87% 26 72% 58%
141 - 145 35 22 22 2 to 1 91% 4 18% 25%
151 - 156 56 35 35 2 to 1 97% 15 43% 27%
161 - 164 61 28 28 3 to 1 100% 9 32% 33%
171 - 173 146 130 130 2 to 1 94% 30 24% 47%
181 - 184 28 26 26 1 to 1 100% 6 23% 33%
192 13 6 6 3 to 1 100% 1 17% 0%
194, 196 50 3 3 17 to 1 100% 0 0% --
195 13 3 3 5 to 1 67% 1 33% 0%
Updated 3/10/14 A-8 hunt returns thru 2/28/14
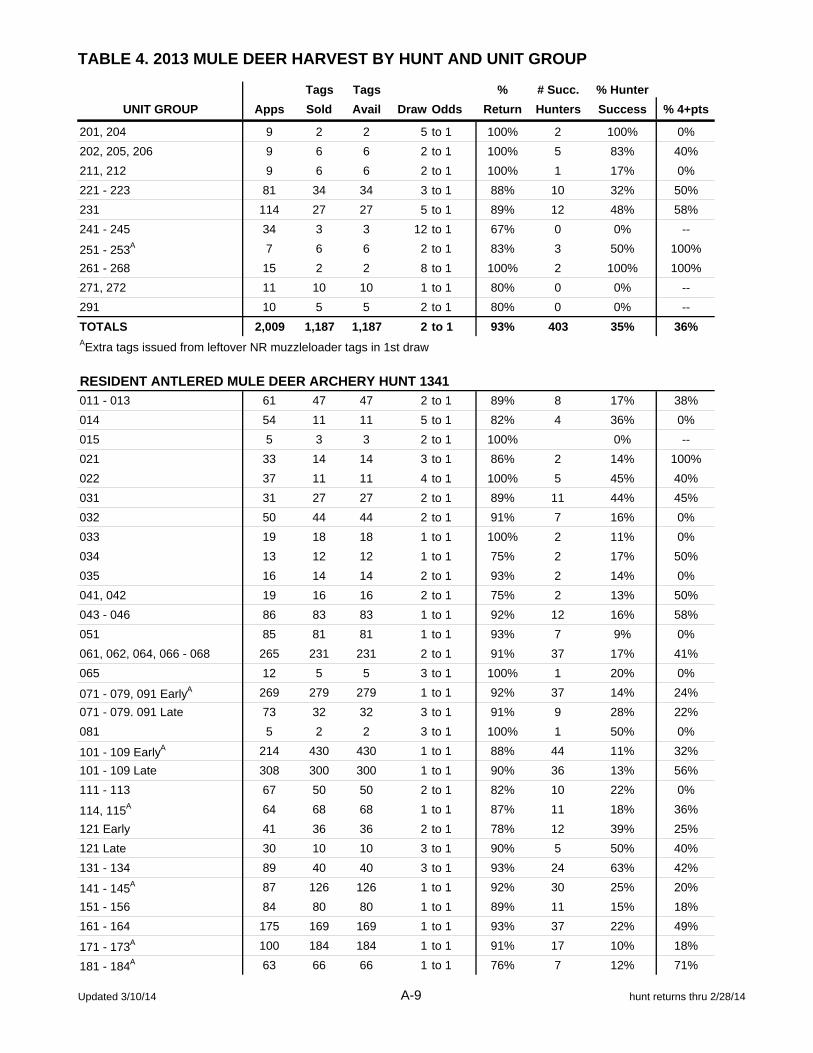
TABLE 4. 2013 MULE DEER HARVEST BY HUNT AND UNIT GROUP
Tags Tags % # Succ. % Hunter
UNIT GROUP Apps Sold Avail Draw Odds Return Hunters Success % 4+pts
201, 204 9 2 2 5 to 1 100% 2 100% 0%
202, 205, 206 9 6 6 2 to 1 100% 5 83% 40%
211, 212 9 6 6 2 to 1 100% 1 17% 0%
221 - 223 81 34 34 3 to 1 88% 10 32% 50%
231 114 27 27 5 to 1 89% 12 48% 58%
241 - 245 34 3 3 12 to 1 67% 0 0% --
251 - 253A 7 6 6 2 to 1 83% 3 50% 100%
261 - 268 15 2 2 8 to 1 100% 2 100% 100%
271, 272 11 10 10 1 to 1 80% 0 0% --
291 10 5 5 2 to 1 80% 0 0% --
TOTALS 2,009 1,187 1,187 2 to 1 93% 403 35% 36%AExtra tags issued from leftover NR muzzleloader tags in 1st draw
RESIDENT ANTLERED MULE DEER ARCHERY HUNT 1341
011 - 013 61 47 47 2 to 1 89% 8 17% 38%
014 54 11 11 5 to 1 82% 4 36% 0%
015 5 3 3 2 to 1 100% 0% --
021 33 14 14 3 to 1 86% 2 14% 100%
022 37 11 11 4 to 1 100% 5 45% 40%
031 31 27 27 2 to 1 89% 11 44% 45%
032 50 44 44 2 to 1 91% 7 16% 0%
033 19 18 18 1 to 1 100% 2 11% 0%
034 13 12 12 1 to 1 75% 2 17% 50%
035 16 14 14 2 to 1 93% 2 14% 0%
041, 042 19 16 16 2 to 1 75% 2 13% 50%
043 - 046 86 83 83 1 to 1 92% 12 16% 58%
051 85 81 81 1 to 1 93% 7 9% 0%
061, 062, 064, 066 - 068 265 231 231 2 to 1 91% 37 17% 41%
065 12 5 5 3 to 1 100% 1 20% 0%
071 - 079, 091 EarlyA 269 279 279 1 to 1 92% 37 14% 24%
071 - 079. 091 Late 73 32 32 3 to 1 91% 9 28% 22%
081 5 2 2 3 to 1 100% 1 50% 0%
101 - 109 EarlyA 214 430 430 1 to 1 88% 44 11% 32%
101 - 109 Late 308 300 300 1 to 1 90% 36 13% 56%
111 - 113 67 50 50 2 to 1 82% 10 22% 0%
114, 115A 64 68 68 1 to 1 87% 11 18% 36%
121 Early 41 36 36 2 to 1 78% 12 39% 25%
121 Late 30 10 10 3 to 1 90% 5 50% 40%
131 - 134 89 40 40 3 to 1 93% 24 63% 42%
141 - 145A 87 126 126 1 to 1 92% 30 25% 20%
151 - 156 84 80 80 1 to 1 89% 11 15% 18%
161 - 164 175 169 169 1 to 1 93% 37 22% 49%
171 - 173A 100 184 184 1 to 1 91% 17 10% 18%
181 - 184A 63 66 66 1 to 1 76% 7 12% 71%
Updated 3/10/14 A-9 hunt returns thru 2/28/14
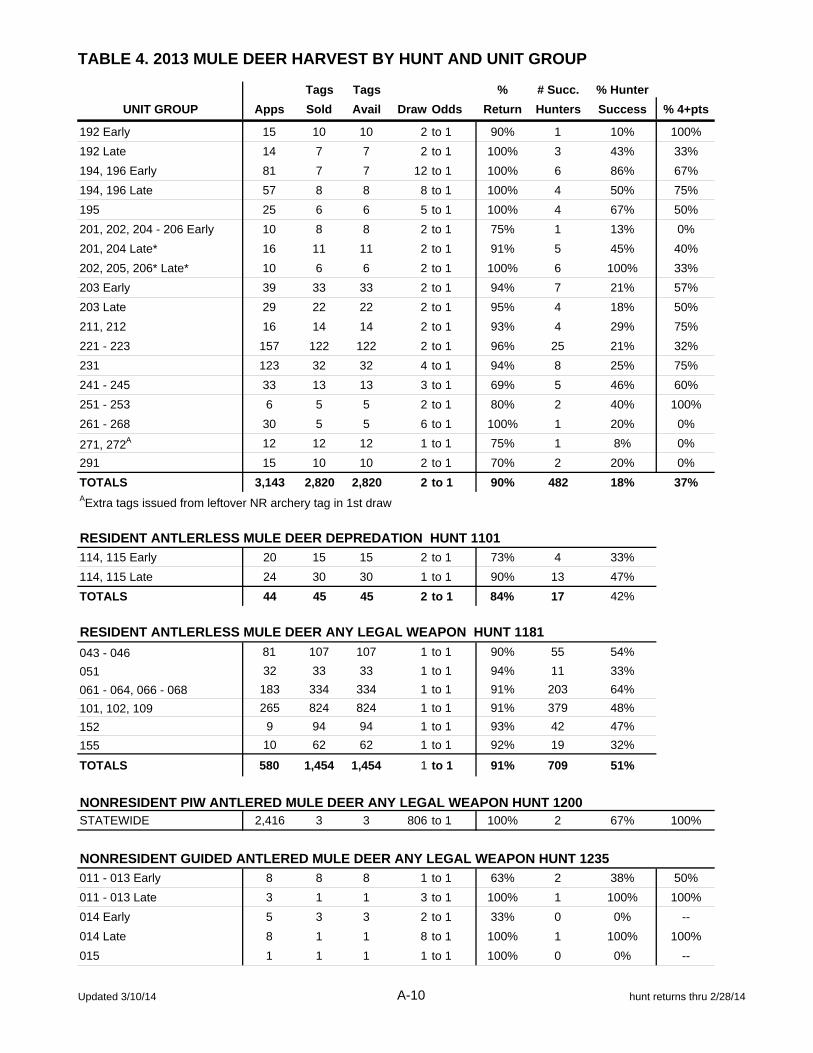
TABLE 4. 2013 MULE DEER HARVEST BY HUNT AND UNIT GROUP
Tags Tags % # Succ. % Hunter
UNIT GROUP Apps Sold Avail Draw Odds Return Hunters Success % 4+pts
192 Early 15 10 10 2 to 1 90% 1 10% 100%
192 Late 14 7 7 2 to 1 100% 3 43% 33%
194, 196 Early 81 7 7 12 to 1 100% 6 86% 67%
194, 196 Late 57 8 8 8 to 1 100% 4 50% 75%
195 25 6 6 5 to 1 100% 4 67% 50%
201, 202, 204 - 206 Early 10 8 8 2 to 1 75% 1 13% 0%
201, 204 Late* 16 11 11 2 to 1 91% 5 45% 40%
202, 205, 206* Late* 10 6 6 2 to 1 100% 6 100% 33%
203 Early 39 33 33 2 to 1 94% 7 21% 57%
203 Late 29 22 22 2 to 1 95% 4 18% 50%
211, 212 16 14 14 2 to 1 93% 4 29% 75%
221 - 223 157 122 122 2 to 1 96% 25 21% 32%
231 123 32 32 4 to 1 94% 8 25% 75%
241 - 245 33 13 13 3 to 1 69% 5 46% 60%
251 - 253 6 5 5 2 to 1 80% 2 40% 100%
261 - 268 30 5 5 6 to 1 100% 1 20% 0%
271, 272A 12 12 12 1 to 1 75% 1 8% 0%
291 15 10 10 2 to 1 70% 2 20% 0%
TOTALS 3,143 2,820 2,820 2 to 1 90% 482 18% 37%AExtra tags issued from leftover NR archery tag in 1st draw
RESIDENT ANTLERLESS MULE DEER DEPREDATION HUNT 1101
114, 115 Early 20 15 15 2 to 1 73% 4 33%
114, 115 Late 24 30 30 1 to 1 90% 13 47%
TOTALS 44 45 45 2 to 1 84% 17 42%
RESIDENT ANTLERLESS MULE DEER ANY LEGAL WEAPON HUNT 1181
043 - 046 81 107 107 1 to 1 90% 55 54%
051 32 33 33 1 to 1 94% 11 33%
061 - 064, 066 - 068 183 334 334 1 to 1 91% 203 64%
101, 102, 109 265 824 824 1 to 1 91% 379 48%
152 9 94 94 1 to 1 93% 42 47%
155 10 62 62 1 to 1 92% 19 32%
TOTALS 580 1,454 1,454 1 to 1 91% 709 51%
NONRESIDENT PIW ANTLERED MULE DEER ANY LEGAL WEAPON HUNT 1200STATEWIDE 2,416 3 3 806 to 1 100% 2 67% 100%
NONRESIDENT GUIDED ANTLERED MULE DEER ANY LEGAL WEAPON HUNT 1235
011 - 013 Early 8 8 8 1 to 1 63% 2 38% 50%
011 - 013 Late 3 1 1 3 to 1 100% 1 100% 100%
014 Early 5 3 3 2 to 1 33% 0 0% --
014 Late 8 1 1 8 to 1 100% 1 100% 100%
015 1 1 1 1 to 1 100% 0 0% --
Updated 3/10/14 A-10 hunt returns thru 2/28/14
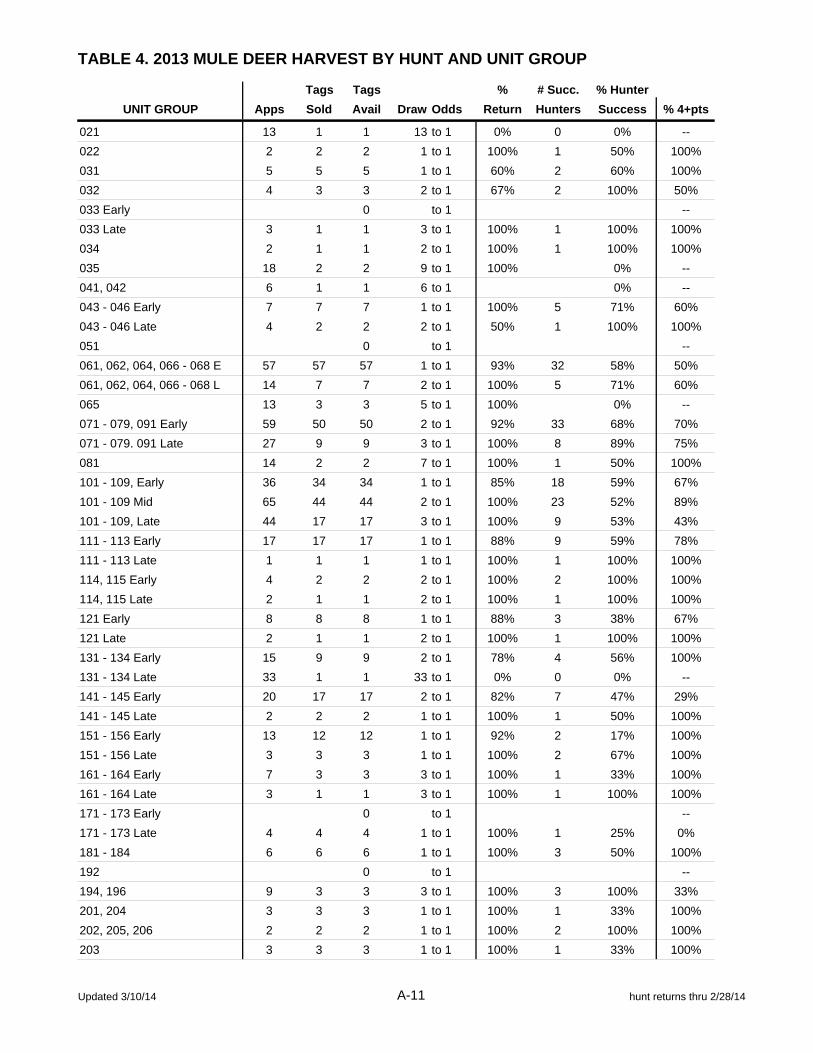
TABLE 4. 2013 MULE DEER HARVEST BY HUNT AND UNIT GROUP
Tags Tags % # Succ. % Hunter
UNIT GROUP Apps Sold Avail Draw Odds Return Hunters Success % 4+pts
021 13 1 1 13 to 1 0% 0 0% --
022 2 2 2 1 to 1 100% 1 50% 100%
031 5 5 5 1 to 1 60% 2 60% 100%
032 4 3 3 2 to 1 67% 2 100% 50%
033 Early 0 to 1 --
033 Late 3 1 1 3 to 1 100% 1 100% 100%
034 2 1 1 2 to 1 100% 1 100% 100%
035 18 2 2 9 to 1 100% 0% --
041, 042 6 1 1 6 to 1 0% --
043 - 046 Early 7 7 7 1 to 1 100% 5 71% 60%
043 - 046 Late 4 2 2 2 to 1 50% 1 100% 100%
051 0 to 1 --
061, 062, 064, 066 - 068 E 57 57 57 1 to 1 93% 32 58% 50%
061, 062, 064, 066 - 068 L 14 7 7 2 to 1 100% 5 71% 60%
065 13 3 3 5 to 1 100% 0% --
071 - 079, 091 Early 59 50 50 2 to 1 92% 33 68% 70%
071 - 079. 091 Late 27 9 9 3 to 1 100% 8 89% 75%
081 14 2 2 7 to 1 100% 1 50% 100%
101 - 109, Early 36 34 34 1 to 1 85% 18 59% 67%
101 - 109 Mid 65 44 44 2 to 1 100% 23 52% 89%
101 - 109, Late 44 17 17 3 to 1 100% 9 53% 43%
111 - 113 Early 17 17 17 1 to 1 88% 9 59% 78%
111 - 113 Late 1 1 1 1 to 1 100% 1 100% 100%
114, 115 Early 4 2 2 2 to 1 100% 2 100% 100%
114, 115 Late 2 1 1 2 to 1 100% 1 100% 100%
121 Early 8 8 8 1 to 1 88% 3 38% 67%
121 Late 2 1 1 2 to 1 100% 1 100% 100%
131 - 134 Early 15 9 9 2 to 1 78% 4 56% 100%
131 - 134 Late 33 1 1 33 to 1 0% 0 0% --
141 - 145 Early 20 17 17 2 to 1 82% 7 47% 29%
141 - 145 Late 2 2 2 1 to 1 100% 1 50% 100%
151 - 156 Early 13 12 12 1 to 1 92% 2 17% 100%
151 - 156 Late 3 3 3 1 to 1 100% 2 67% 100%
161 - 164 Early 7 3 3 3 to 1 100% 1 33% 100%
161 - 164 Late 3 1 1 3 to 1 100% 1 100% 100%
171 - 173 Early 0 to 1 --
171 - 173 Late 4 4 4 1 to 1 100% 1 25% 0%
181 - 184 6 6 6 1 to 1 100% 3 50% 100%
192 0 to 1 --
194, 196 9 3 3 3 to 1 100% 3 100% 33%
201, 204 3 3 3 1 to 1 100% 1 33% 100%
202, 205, 206 2 2 2 1 to 1 100% 2 100% 100%
203 3 3 3 1 to 1 100% 1 33% 100%
Updated 3/10/14 A-11 hunt returns thru 2/28/14
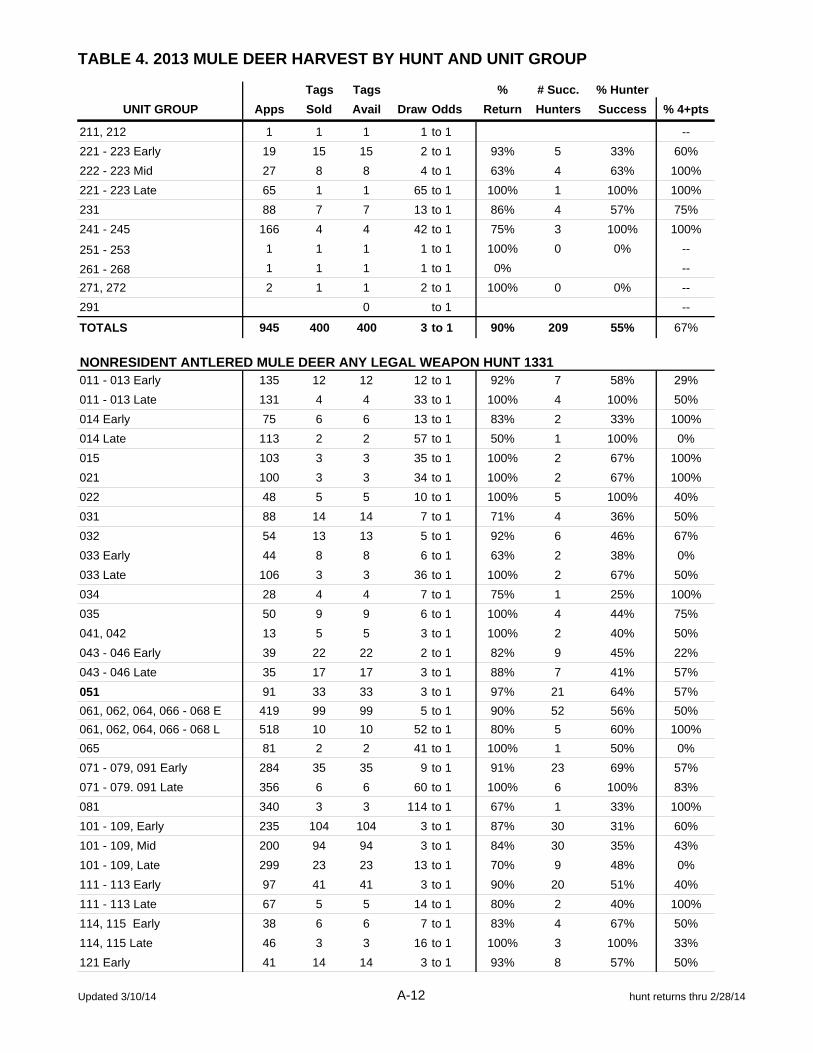
TABLE 4. 2013 MULE DEER HARVEST BY HUNT AND UNIT GROUP
Tags Tags % # Succ. % Hunter
UNIT GROUP Apps Sold Avail Draw Odds Return Hunters Success % 4+pts
211, 212 1 1 1 1 to 1 --
221 - 223 Early 19 15 15 2 to 1 93% 5 33% 60%
222 - 223 Mid 27 8 8 4 to 1 63% 4 63% 100%
221 - 223 Late 65 1 1 65 to 1 100% 1 100% 100%
231 88 7 7 13 to 1 86% 4 57% 75%
241 - 245 166 4 4 42 to 1 75% 3 100% 100%
251 - 253 1 1 1 1 to 1 100% 0 0% --
261 - 268 1 1 1 1 to 1 0% --
271, 272 2 1 1 2 to 1 100% 0 0% --
291 0 to 1 --
TOTALS 945 400 400 3 to 1 90% 209 55% 67%
NONRESIDENT ANTLERED MULE DEER ANY LEGAL WEAPON HUNT 1331011 - 013 Early 135 12 12 12 to 1 92% 7 58% 29%
011 - 013 Late 131 4 4 33 to 1 100% 4 100% 50%
014 Early 75 6 6 13 to 1 83% 2 33% 100%
014 Late 113 2 2 57 to 1 50% 1 100% 0%
015 103 3 3 35 to 1 100% 2 67% 100%
021 100 3 3 34 to 1 100% 2 67% 100%
022 48 5 5 10 to 1 100% 5 100% 40%
031 88 14 14 7 to 1 71% 4 36% 50%
032 54 13 13 5 to 1 92% 6 46% 67%
033 Early 44 8 8 6 to 1 63% 2 38% 0%
033 Late 106 3 3 36 to 1 100% 2 67% 50%
034 28 4 4 7 to 1 75% 1 25% 100%
035 50 9 9 6 to 1 100% 4 44% 75%
041, 042 13 5 5 3 to 1 100% 2 40% 50%
043 - 046 Early 39 22 22 2 to 1 82% 9 45% 22%
043 - 046 Late 35 17 17 3 to 1 88% 7 41% 57%
051 91 33 33 3 to 1 97% 21 64% 57%
061, 062, 064, 066 - 068 E 419 99 99 5 to 1 90% 52 56% 50%
061, 062, 064, 066 - 068 L 518 10 10 52 to 1 80% 5 60% 100%
065 81 2 2 41 to 1 100% 1 50% 0%
071 - 079, 091 Early 284 35 35 9 to 1 91% 23 69% 57%
071 - 079. 091 Late 356 6 6 60 to 1 100% 6 100% 83%
081 340 3 3 114 to 1 67% 1 33% 100%
101 - 109, Early 235 104 104 3 to 1 87% 30 31% 60%
101 - 109, Mid 200 94 94 3 to 1 84% 30 35% 43%
101 - 109, Late 299 23 23 13 to 1 70% 9 48% 0%
111 - 113 Early 97 41 41 3 to 1 90% 20 51% 40%
111 - 113 Late 67 5 5 14 to 1 80% 2 40% 100%
114, 115 Early 38 6 6 7 to 1 83% 4 67% 50%
114, 115 Late 46 3 3 16 to 1 100% 3 100% 33%
121 Early 41 14 14 3 to 1 93% 8 57% 50%
Updated 3/10/14 A-12 hunt returns thru 2/28/14

TABLE 4. 2013 MULE DEER HARVEST BY HUNT AND UNIT GROUP
Tags Tags % # Succ. % Hunter
UNIT GROUP Apps Sold Avail Draw Odds Return Hunters Success % 4+pts
121 Late 31 2 2 16 to 1 100% 1 50% 100%
131 - 134 Early 92 19 19 5 to 1 79% 10 58% 40%
131 - 134 Late 224 2 2 112 to 1 50% 1 100% 100%
141 - 145 Early 67 22 22 4 to 1 86% 11 55% 36%
141 - 145 Late 37 4 4 10 to 1 100% 4 100% 25%
151 - 156 Early 50 22 22 3 to 1 82% 11 55% 27%
151 - 156 Late 43 2 2 22 to 1 100% 1 50% 0%
161 - 164 Early 88 36 36 3 to 1 89% 19 56% 53%
161 - 164 Late 53 3 3 18 to 1 100% 1 33% 0%
171 - 173 Early 84 57 57 2 to 1 95% 18 33% 61%
171 - 173 Late 45 12 12 4 to 1 75% 6 58% 33%
181 - 184 32 13 13 3 to 1 100% 6 46% 17%
192 22 4 4 6 to 1 100% 3 75% 100%
194, 196 503 4 4 126 to 1 75% 3 100% 67%
195 11 2 2 6 to 1 100% 1 50% 0%
201, 204 49 3 3 17 to 1 33% 1 67% 100%
202, 205, 206 34 5 5 7 to 1 100% 5 100% 40%
203 14 3 3 5 to 1 33% 1 67% 0%
211, 212 22 3 3 8 to 1 33% 1 67% 100%
221 - 223 Early 114 35 35 4 to 1 77% 15 49% 53%
222 - 223 Mid 46 20 20 3 to 1 100% 13 65% 77%
221 - 223 Late 1,071 3 3 357 to 1 100% 2 67% 100%
231 312 13 13 24 to 1 85% 3 23% 100%
241 - 245 832 5 5 167 to 1 80% 3 60% 67%
251 - 253 17 3 3 6 to 1 100% 2 67% 0%
261 - 268 18 4 4 5 to 1 100% 4 100% 0%
271, 272 26 3 3 9 to 1 67% 2 100% 100%
291 22 6 6 4 to 1 100% 1 17% 100%
TOTALS 8,233 918 918 9 to 1 87% 424 50% 52%
NONRESIDENT ANTLERED MULE DEER MUZZLELOADER HUNT 1371011 - 013 17 2 2 9 to 1 100% 1 50% 0%
014 30 2 2 15 to 1 100% 2 100% 100%
015 15 2 2 8 to 1 -- --
021 25 2 2 13 to 1 50% 1 100% 0%
022 19 2 2 10 to 1 100% 2 100% 100%
031 3 2 2 2 to 1 100% 1 50% 100%
032 8 2 2 4 to 1 100% 1 50% 100%
033 12 2 2 6 to 1 100% 2 100% 50%
034 7 2 2 4 to 1 100% 1 50% 100%
035 6 2 2 3 to 1 100% 1 50% 0%
041, 042 4 2 2 2 to 1 -- --
043 - 046 4 2 2 2 to 1 100% 1 50% 100%
051 11 5 5 3 to 1 100% 2 40% 100%
Updated 3/10/14 A-13 hunt returns thru 2/28/14
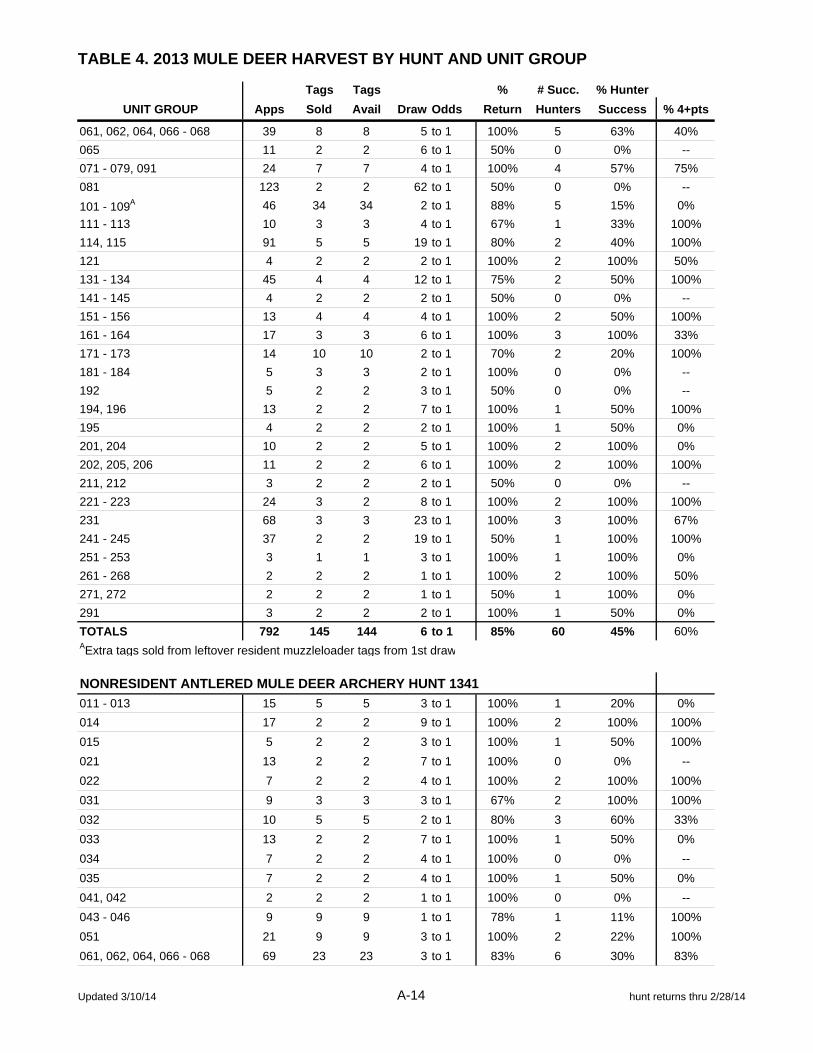
TABLE 4. 2013 MULE DEER HARVEST BY HUNT AND UNIT GROUP
Tags Tags % # Succ. % Hunter
UNIT GROUP Apps Sold Avail Draw Odds Return Hunters Success % 4+pts
061, 062, 064, 066 - 068 39 8 8 5 to 1 100% 5 63% 40%
065 11 2 2 6 to 1 50% 0 0% --
071 - 079, 091 24 7 7 4 to 1 100% 4 57% 75%
081 123 2 2 62 to 1 50% 0 0% --
101 - 109A 46 34 34 2 to 1 88% 5 15% 0%
111 - 113 10 3 3 4 to 1 67% 1 33% 100%
114, 115 91 5 5 19 to 1 80% 2 40% 100%
121 4 2 2 2 to 1 100% 2 100% 50%
131 - 134 45 4 4 12 to 1 75% 2 50% 100%
141 - 145 4 2 2 2 to 1 50% 0 0% --
151 - 156 13 4 4 4 to 1 100% 2 50% 100%
161 - 164 17 3 3 6 to 1 100% 3 100% 33%
171 - 173 14 10 10 2 to 1 70% 2 20% 100%
181 - 184 5 3 3 2 to 1 100% 0 0% --
192 5 2 2 3 to 1 50% 0 0% --
194, 196 13 2 2 7 to 1 100% 1 50% 100%
195 4 2 2 2 to 1 100% 1 50% 0%
201, 204 10 2 2 5 to 1 100% 2 100% 0%
202, 205, 206 11 2 2 6 to 1 100% 2 100% 100%
211, 212 3 2 2 2 to 1 50% 0 0% --
221 - 223 24 3 2 8 to 1 100% 2 100% 100%
231 68 3 3 23 to 1 100% 3 100% 67%
241 - 245 37 2 2 19 to 1 50% 1 100% 100%
251 - 253 3 1 1 3 to 1 100% 1 100% 0%
261 - 268 2 2 2 1 to 1 100% 2 100% 50%
271, 272 2 2 2 1 to 1 50% 1 100% 0%
291 3 2 2 2 to 1 100% 1 50% 0%
TOTALS 792 145 144 6 to 1 85% 60 45% 60%AExtra tags sold from leftover resident muzzleloader tags from 1st draw
NONRESIDENT ANTLERED MULE DEER ARCHERY HUNT 1341
011 - 013 15 5 5 3 to 1 100% 1 20% 0%
014 17 2 2 9 to 1 100% 2 100% 100%
015 5 2 2 3 to 1 100% 1 50% 100%
021 13 2 2 7 to 1 100% 0 0% --
022 7 2 2 4 to 1 100% 2 100% 100%
031 9 3 3 3 to 1 67% 2 100% 100%
032 10 5 5 2 to 1 80% 3 60% 33%
033 13 2 2 7 to 1 100% 1 50% 0%
034 7 2 2 4 to 1 100% 0 0% --
035 7 2 2 4 to 1 100% 1 50% 0%
041, 042 2 2 2 1 to 1 100% 0 0% --
043 - 046 9 9 9 1 to 1 78% 1 11% 100%
051 21 9 9 3 to 1 100% 2 22% 100%
061, 062, 064, 066 - 068 69 23 23 3 to 1 83% 6 30% 83%
Updated 3/10/14 A-14 hunt returns thru 2/28/14

TABLE 4. 2013 MULE DEER HARVEST BY HUNT AND UNIT GROUP
Tags Tags % # Succ. % Hunter
UNIT GROUP Apps Sold Avail Draw Odds Return Hunters Success % 4+pts
065 6 2 2 3 to 1 100% 0 0% --
071 - 079, 091 EarlyA 73 32 32 3 to 1 97% 7 22% 71%
071 - 079. 091 Late 49 3 3 17 to 1 33% 0 0% --
081 11 2 2 6 to 1 50% 0 0% --
101 - 109 EarlyA 163 201 201 3 to 1 82% 31 17% 32%
101 - 109 Late 71 30 30 3 to 1 73% 4 17% 0%
111 - 113 17 6 6 3 to 1 67% 1 17% 0%
114, 115A 14 9 9 2 to 1 44% 1 22% 0%
121 Early 7 4 4 2 to 1 75% 1 25% 100%
121 Late 8 2 2 4 to 1 100% 2 100% 50%
131 - 134 25 4 4 7 to 1 75% 3 100% 67%
141 - 145A 17 22 22 2 to 1 91% 1 5% 100%
151 - 156A 12 9 9 2 to 1 100% 5 56% 20%
161 - 164 30 19 19 2 to 1 89% 5 26% 20%
171 - 173A 27 34 34 2 to 1 94% 2 6% 50%
181 - 184 3 3 3 1 to 1 100% 1 33% 0%
192 Early 4 2 2 2 to 1 100% 1 50% 0%
192 Late 5 2 2 3 to 1 100% 0 0% --
194, 196 Early 7 2 2 4 to 1 100% 1 50% 100%
194, 196 Late 96 2 2 48 to 1 50% 1 100% 0%
195 2 2 2 1 to 1 100% 0 0% --
201, 202, 204 - 206 Early 2 2 2 1 to 1 100% 0 0% --
201, 204 Late 2 2 2 1 to 1 100% 0 0% --
202, 205, 206* Late 7 2 2 4 to 1 50% 0 0% --
203 Early 4 4 4 1 to 1 100% 0 0% --
203 Late 2 2 2 1 to 1 50% 0 0% --
211, 212 2 2 2 1 to 1 50% 1 100% 0%
221 - 223 35 14 14 3 to 1 71% 2 14% 100%
231 142 3 3 48 to 1 100% 1 33% 100%
241 - 245 30 2 2 15 to 1 0% 0 0% --
251 - 253 5 2 2 3 to 1 0% 0 --
261 - 268 2 2 2 1 to 1 50% 1 100% 100%
271, 272 1 1 1 1 to 1 100% 0 0% --
291 3 2 2 2 to 1 100% 1 50% 100%
TOTALS 1,088 502 502 4 to 1 83% 95 21% 45%AExtra tags sold from leftover resident archery tags from 1st draw
Apps - # of unsuccessful 1st choice applicants plus successful 1st - 5th choice applicants for given unit group
Tags Avail - Available tags at season opener - accounts for tags returned for any reason and alternate tags issued
Draw Odds - # of "Apps" divided by Total Quota for the 1st draw
% Return - Percent of hunter return cards received compared to total tags sold
% Hunter Success - based on # of successful hunters divided by total tags sold (includes did not hunts; a portion of nonreturns are assumed to be successful based on past trends of hunt records not yet returned)
Tags Sold - accounts for tags available after 1st draw that may be sold to either residents or nonresidents and for tags returned for medical, military, or death reasons that are not reissued.
Updated 3/10/14 A-15 hunt returns thru 2/28/14
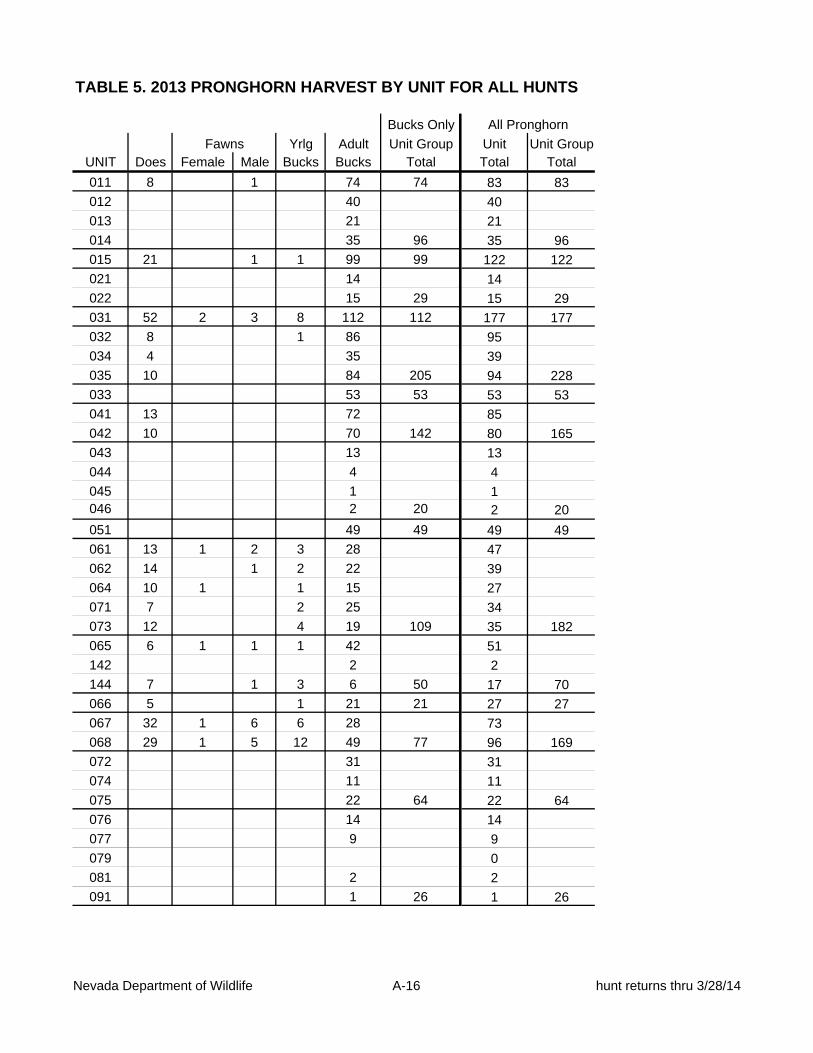
TABLE 5. 2013 PRONGHORN HARVEST BY UNIT FOR ALL HUNTS
Bucks Only
Yrlg Adult Unit Group Unit Unit GroupUNIT Does Female Male Bucks Bucks Total Total Total
011 8 1 74 74 83 83
012 40 40
013 21 21
014 35 96 35 96
015 21 1 1 99 99 122 122
021 14 14
022 15 29 15 29
031 52 2 3 8 112 112 177 177
032 8 1 86 95
034 4 35 39
035 10 84 205 94 228
033 53 53 53 53
041 13 72 85
042 10 70 142 80 165
043 13 13
044 4 4
045 1 1046 2 20 2 20
051 49 49 49 49
061 13 1 2 3 28 47
062 14 1 2 22 39
064 10 1 1 15 27
071 7 2 25 34
073 12 4 19 109 35 182
065 6 1 1 1 42 51
142 2 2
144 7 1 3 6 50 17 70
066 5 1 21 21 27 27
067 32 1 6 6 28 73
068 29 1 5 12 49 77 96 169
072 31 31
074 11 11
075 22 64 22 64
076 14 14
077 9 9
079 0
081 2 2
091 1 26 1 26
All Pronghorn
Fawns
Nevada Department of Wildlife A-16 hunt returns thru 3/28/14

TABLE 5. 2013 PRONGHORN HARVEST BY UNIT FOR ALL HUNTS
Bucks Only
Yrlg Adult Unit Group Unit Unit GroupUNIT Does Female Male Bucks Bucks Total Total Total
All Pronghorn
Fawns
078 2 2
105 1 1
106 8 8
107 0
121 10 2 40 51 52 63
101 3 1 4
102 1 2 3
103 2 1 2 5
104 1 17 18
108 10 10
109 1 1
144 1 5 38 6 47
111 11 2 3 32 48
112 8 8
113 7 7
114 7 1 5 16 63 29 92
115 1 8 9
231 13 13
242 21 0 22
131 35 35
145 7 7
163 8 8
164 7 57 7 57
132 16 16
133 6 6
134 5 5
245 10 37 10 37
141 31 1 5 2 38 77
143 6 4 15 25
151 13 1 1 3 21 39
152 16 1 1 2 13 33
153 10 2 5 16 33
154 6 1 8 15
155 10 1 1 13 25
156 19 1 1 4 28 152 53 300
161 14 14
162 7 21 7 21
171 11 11
172 13 13
173 11 35 11 35
Nevada Department of Wildlife A-17 hunt returns thru 3/28/14
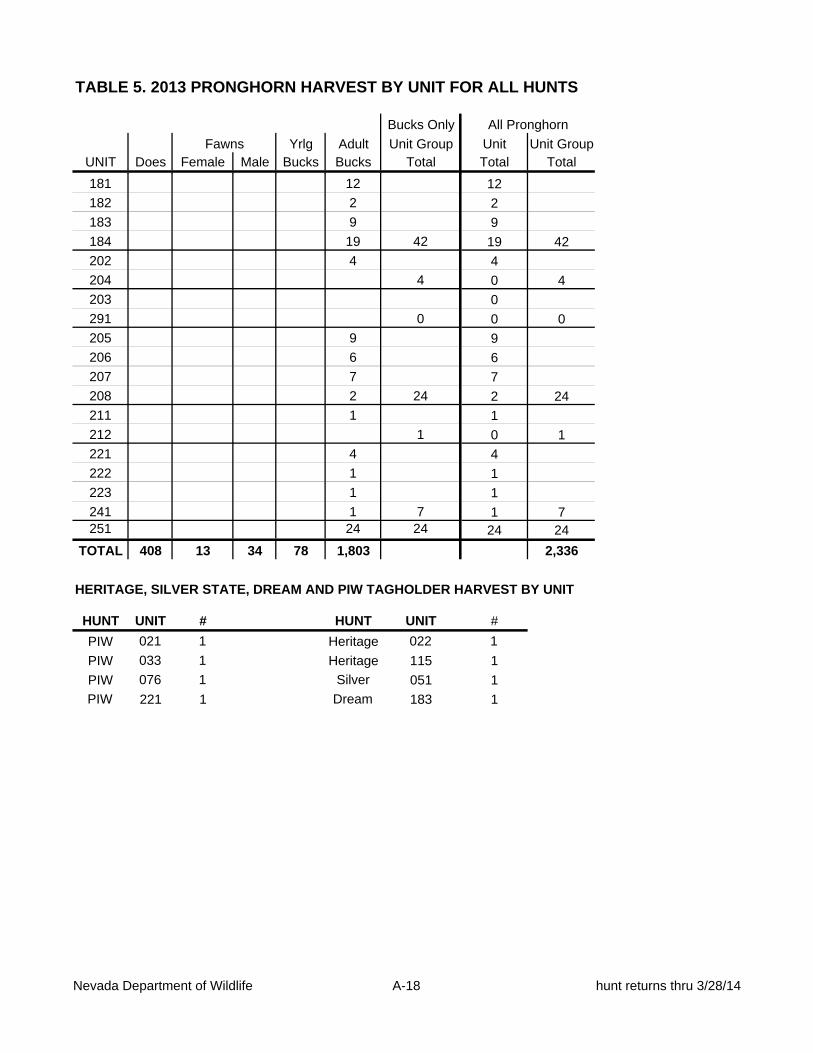
TABLE 5. 2013 PRONGHORN HARVEST BY UNIT FOR ALL HUNTS
Bucks Only
Yrlg Adult Unit Group Unit Unit GroupUNIT Does Female Male Bucks Bucks Total Total Total
All Pronghorn
Fawns
181 12 12
182 2 2
183 9 9
184 19 42 19 42
202 4 4
204 4 0 4
203 0
291 0 0 0
205 9 9
206 6 6
207 7 7
208 2 24 2 24
211 1 1
212 1 0 1
221 4 4
222 1 1
223 1 1
241 1 7 1 7251 24 24 24 24
TOTAL 408 13 34 78 1,803 2,336
HERITAGE, SILVER STATE, DREAM AND PIW TAGHOLDER HARVEST BY UNIT
HUNT UNIT # HUNT UNIT #
PIW 021 1 Heritage 022 1
PIW 033 1 Heritage 115 1
PIW 076 1 Silver 051 1
PIW 221 1 Dream 183 1
Nevada Department of Wildlife A-18 hunt returns thru 3/28/14
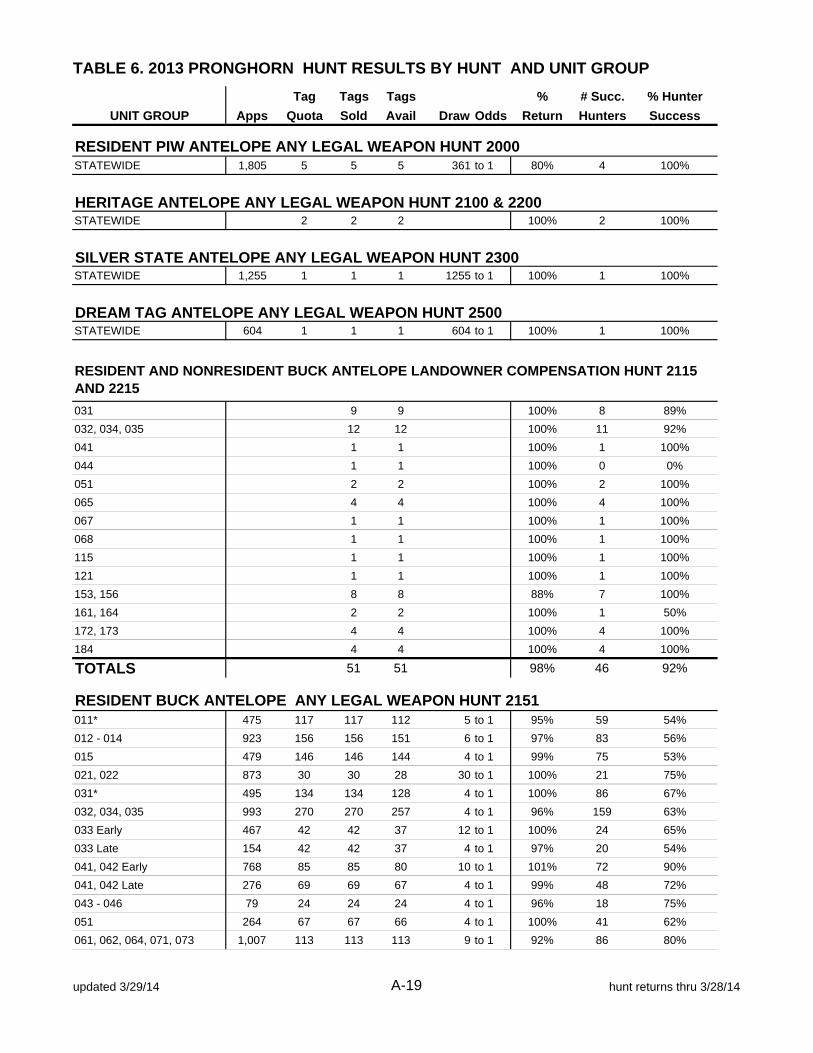
TABLE 6. 2013 PRONGHORN HUNT RESULTS BY HUNT AND UNIT GROUP
Tag Tags Tags % # Succ. % Hunter
UNIT GROUP Apps Quota Sold Avail Draw Odds Return Hunters Success
RESIDENT PIW ANTELOPE ANY LEGAL WEAPON HUNT 2000STATEWIDE 1,805 5 5 5 361 to 1 80% 4 100%
HERITAGE ANTELOPE ANY LEGAL WEAPON HUNT 2100 & 2200STATEWIDE 2 2 2 100% 2 100%
SILVER STATE ANTELOPE ANY LEGAL WEAPON HUNT 2300STATEWIDE 1,255 1 1 1 1255 to 1 100% 1 100%
DREAM TAG ANTELOPE ANY LEGAL WEAPON HUNT 2500STATEWIDE 604 1 1 1 604 to 1 100% 1 100%
031 9 9 100% 8 89%
032, 034, 035 12 12 100% 11 92%
041 1 1 100% 1 100%
044 1 1 100% 0 0%
051 2 2 100% 2 100%
065 4 4 100% 4 100%
067 1 1 100% 1 100%
068 1 1 100% 1 100%
115 1 1 100% 1 100%
121 1 1 100% 1 100%
153, 156 8 8 88% 7 100%
161, 164 2 2 100% 1 50%
172, 173 4 4 100% 4 100%
184 4 4 100% 4 100%
TOTALS 51 51 98% 46 92%
RESIDENT BUCK ANTELOPE ANY LEGAL WEAPON HUNT 2151011* 475 117 117 112 5 to 1 95% 59 54%
012 - 014 923 156 156 151 6 to 1 97% 83 56%
015 479 146 146 144 4 to 1 99% 75 53%
021, 022 873 30 30 28 30 to 1 100% 21 75%
031* 495 134 134 128 4 to 1 100% 86 67%
032, 034, 035 993 270 270 257 4 to 1 96% 159 63%
033 Early 467 42 42 37 12 to 1 100% 24 65%
033 Late 154 42 42 37 4 to 1 97% 20 54%
041, 042 Early 768 85 85 80 10 to 1 101% 72 90%
041, 042 Late 276 69 69 67 4 to 1 99% 48 72%
043 - 046 79 24 24 24 4 to 1 96% 18 75%
051 264 67 67 66 4 to 1 100% 41 62%
061, 062, 064, 071, 073 1,007 113 113 113 9 to 1 92% 86 80%
RESIDENT AND NONRESIDENT BUCK ANTELOPE LANDOWNER COMPENSATION HUNT 2115 AND 2215
updated 3/29/14 A-19 hunt returns thru 3/28/14
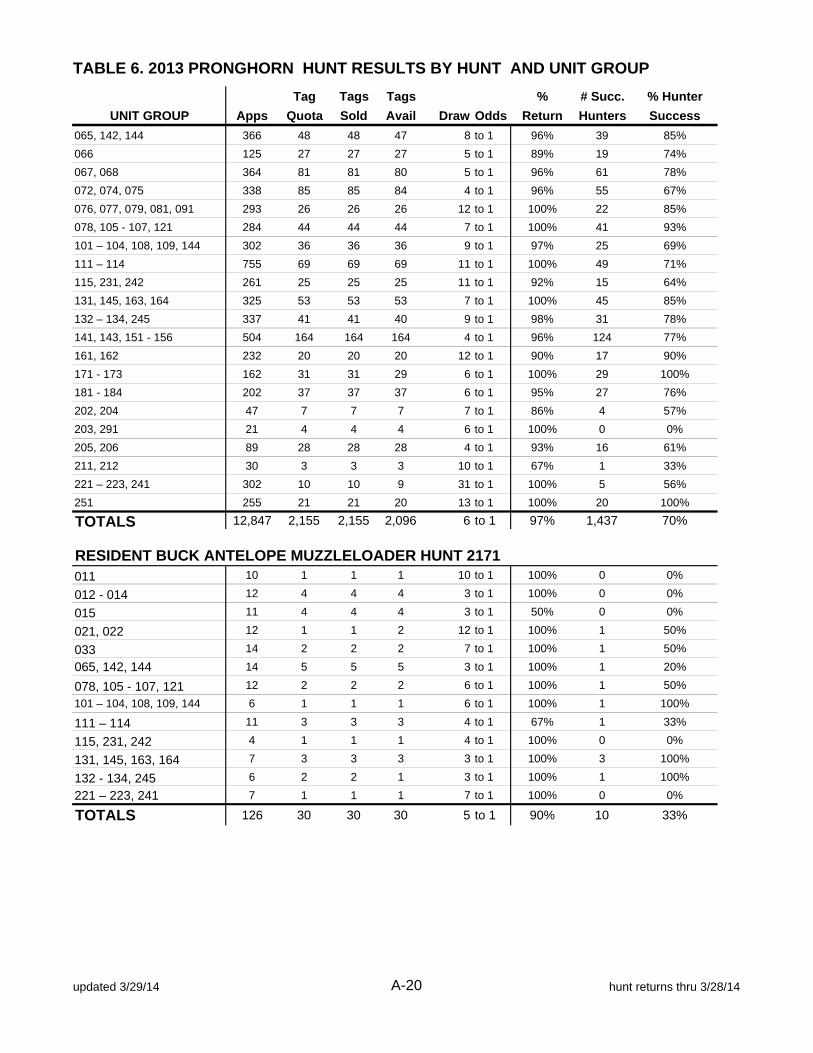
TABLE 6. 2013 PRONGHORN HUNT RESULTS BY HUNT AND UNIT GROUP
Tag Tags Tags % # Succ. % Hunter
UNIT GROUP Apps Quota Sold Avail Draw Odds Return Hunters Success
065, 142, 144 366 48 48 47 8 to 1 96% 39 85%
066 125 27 27 27 5 to 1 89% 19 74%
067, 068 364 81 81 80 5 to 1 96% 61 78%
072, 074, 075 338 85 85 84 4 to 1 96% 55 67%
076, 077, 079, 081, 091 293 26 26 26 12 to 1 100% 22 85%
078, 105 - 107, 121 284 44 44 44 7 to 1 100% 41 93%
101 – 104, 108, 109, 144 302 36 36 36 9 to 1 97% 25 69%
111 – 114 755 69 69 69 11 to 1 100% 49 71%
115, 231, 242 261 25 25 25 11 to 1 92% 15 64%
131, 145, 163, 164 325 53 53 53 7 to 1 100% 45 85%
132 – 134, 245 337 41 41 40 9 to 1 98% 31 78%
141, 143, 151 - 156 504 164 164 164 4 to 1 96% 124 77%
161, 162 232 20 20 20 12 to 1 90% 17 90%
171 - 173 162 31 31 29 6 to 1 100% 29 100%
181 - 184 202 37 37 37 6 to 1 95% 27 76%
202, 204 47 7 7 7 7 to 1 86% 4 57%
203, 291 21 4 4 4 6 to 1 100% 0 0%
205, 206 89 28 28 28 4 to 1 93% 16 61%
211, 212 30 3 3 3 10 to 1 67% 1 33%
221 – 223, 241 302 10 10 9 31 to 1 100% 5 56%
251 255 21 21 20 13 to 1 100% 20 100%
TOTALS 12,847 2,155 2,155 2,096 6 to 1 97% 1,437 70%
RESIDENT BUCK ANTELOPE MUZZLELOADER HUNT 2171011 10 1 1 1 10 to 1 100% 0 0%
012 - 014 12 4 4 4 3 to 1 100% 0 0%
015 11 4 4 4 3 to 1 50% 0 0%
021, 022 12 1 1 2 12 to 1 100% 1 50%
033 14 2 2 2 7 to 1 100% 1 50%
065, 142, 144 14 5 5 5 3 to 1 100% 1 20%
078, 105 - 107, 121 12 2 2 2 6 to 1 100% 1 50%
101 – 104, 108, 109, 144 6 1 1 1 6 to 1 100% 1 100%
111 – 114 11 3 3 3 4 to 1 67% 1 33%
115, 231, 242 4 1 1 1 4 to 1 100% 0 0%
131, 145, 163, 164 7 3 3 3 3 to 1 100% 3 100%
132 - 134, 245 6 2 2 1 3 to 1 100% 1 100%
221 – 223, 241 7 1 1 1 7 to 1 100% 0 0%
TOTALS 126 30 30 30 5 to 1 90% 10 33%
updated 3/29/14 A-20 hunt returns thru 3/28/14
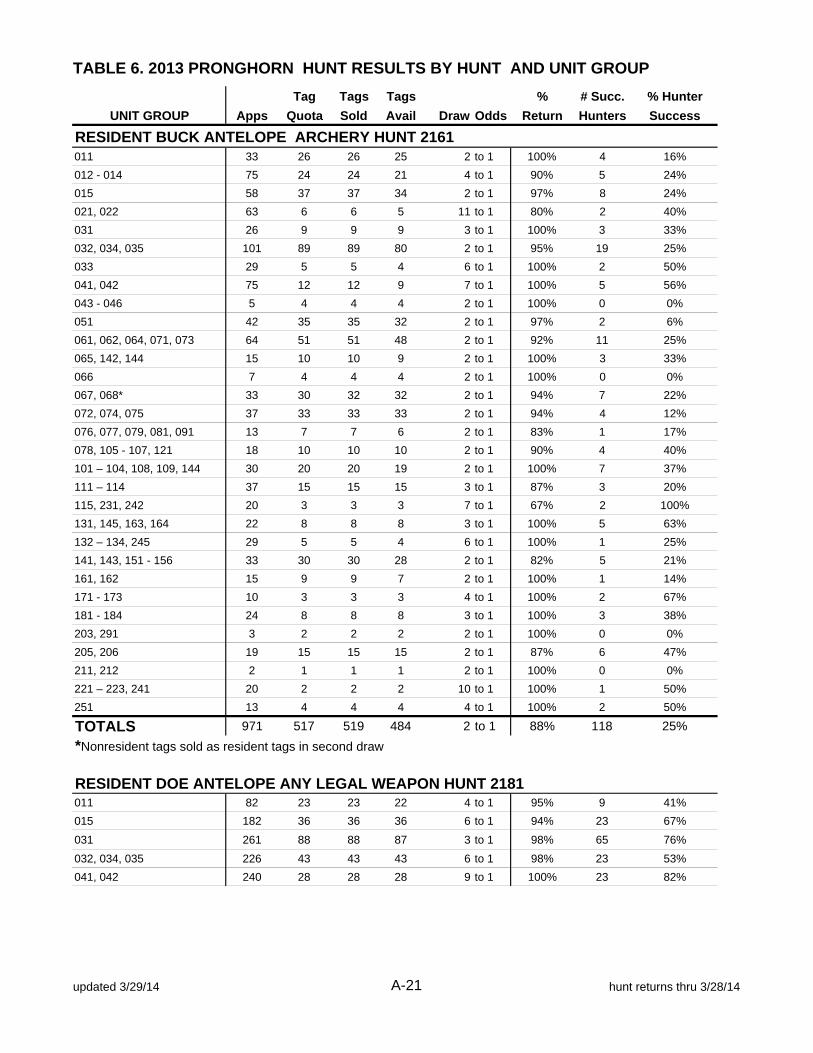
TABLE 6. 2013 PRONGHORN HUNT RESULTS BY HUNT AND UNIT GROUP
Tag Tags Tags % # Succ. % Hunter
UNIT GROUP Apps Quota Sold Avail Draw Odds Return Hunters Success
RESIDENT BUCK ANTELOPE ARCHERY HUNT 2161011 33 26 26 25 2 to 1 100% 4 16%
012 - 014 75 24 24 21 4 to 1 90% 5 24%
015 58 37 37 34 2 to 1 97% 8 24%
021, 022 63 6 6 5 11 to 1 80% 2 40%
031 26 9 9 9 3 to 1 100% 3 33%
032, 034, 035 101 89 89 80 2 to 1 95% 19 25%
033 29 5 5 4 6 to 1 100% 2 50%
041, 042 75 12 12 9 7 to 1 100% 5 56%
043 - 046 5 4 4 4 2 to 1 100% 0 0%
051 42 35 35 32 2 to 1 97% 2 6%
061, 062, 064, 071, 073 64 51 51 48 2 to 1 92% 11 25%
065, 142, 144 15 10 10 9 2 to 1 100% 3 33%
066 7 4 4 4 2 to 1 100% 0 0%
067, 068* 33 30 32 32 2 to 1 94% 7 22%
072, 074, 075 37 33 33 33 2 to 1 94% 4 12%
076, 077, 079, 081, 091 13 7 7 6 2 to 1 83% 1 17%
078, 105 - 107, 121 18 10 10 10 2 to 1 90% 4 40%
101 – 104, 108, 109, 144 30 20 20 19 2 to 1 100% 7 37%
111 – 114 37 15 15 15 3 to 1 87% 3 20%
115, 231, 242 20 3 3 3 7 to 1 67% 2 100%
131, 145, 163, 164 22 8 8 8 3 to 1 100% 5 63%
132 – 134, 245 29 5 5 4 6 to 1 100% 1 25%
141, 143, 151 - 156 33 30 30 28 2 to 1 82% 5 21%
161, 162 15 9 9 7 2 to 1 100% 1 14%
171 - 173 10 3 3 3 4 to 1 100% 2 67%
181 - 184 24 8 8 8 3 to 1 100% 3 38%
203, 291 3 2 2 2 2 to 1 100% 0 0%
205, 206 19 15 15 15 2 to 1 87% 6 47%
211, 212 2 1 1 1 2 to 1 100% 0 0%
221 – 223, 241 20 2 2 2 10 to 1 100% 1 50%
251 13 4 4 4 4 to 1 100% 2 50%
TOTALS 971 517 519 484 2 to 1 88% 118 25%
*Nonresident tags sold as resident tags in second draw
RESIDENT DOE ANTELOPE ANY LEGAL WEAPON HUNT 2181011 82 23 23 22 4 to 1 95% 9 41%
015 182 36 36 36 6 to 1 94% 23 67%
031 261 88 88 87 3 to 1 98% 65 76%
032, 034, 035 226 43 43 43 6 to 1 98% 23 53%
041, 042 240 28 28 28 9 to 1 100% 23 82%
updated 3/29/14 A-21 hunt returns thru 3/28/14

TABLE 6. 2013 PRONGHORN HUNT RESULTS BY HUNT AND UNIT GROUP
Tag Tags Tags % # Succ. % Hunter
UNIT GROUP Apps Quota Sold Avail Draw Odds Return Hunters Success
061 - 064, 071, 073 357 98 98 98 4 to 1 97% 73 76%
065, 142 43 12 12 12 4 to 1 100% 9 75%
066 20 11 11 11 2 to 1 82% 6 64%
067, 068 212 129 129 128 2 to 1 93% 92 75%
101 – 104, 108, 109, 144 78 12 12 11 7 to 1 100% 9 82%
111 - 114 210 26 26 26 9 to 1 96% 20 77%
114, 115A Baker Ranch 39 15 15 15 3 to 1 100% 10 67%
121 70 16 16 16 5 to 1 100% 12 75%
141, 143, 151 - 156 259 202 202 202 2 to 1 99% 148 74%
144 29 23 23 23 2 to 1 100% 11 48%
TOTALS 2,044 762 762 758 3 to 1 90% 533 72%
NONRESIDENT BUCK ANTELOPE ANY LEGAL WEAPON HUNT 2251011 156 13 13 11 12 to 1 100% 10 91%
012 – 014 175 17 17 14 11 to 1 100% 8 57%
015 164 16 16 14 11 to 1 100% 12 86%
021, 022 194 3 3 3 65 to 1 100% 2 67%
031 112 15 15 15 8 to 1 100% 15 100%
032, 034, 035 191 32 32 29 6 to 1 97% 13 45%
033 Early 1,135 3 3 3 379 to 1 100% 2 67%
033 Late 85 3 3 3 29 to 1 100% 2 67%
041, 042 Early 200 9 9 9 23 to 1 100% 8 89%
041, 042 Late 79 8 8 8 10 to 1 100% 7 88%
043 - 046 14 3 3 2 5 to 1 100% 2 100%
051 34 7 7 7 5 to 1 100% 2 29%
061 - 064, 071, 073 93 13 13 13 8 to 1 100% 10 77%
065, 142, 144 43 5 5 4 9 to 1 100% 4 100%
066 35 3 3 3 12 to 1 100% 2 67%
067, 068 28 9 9 9 4 to 1 100% 7 78%
072, 074, 075 55 9 9 8 7 to 1 75% 4 63%
076, 077, 079, 081, 091 93 3 3 3 31 to 1 100% 2 67%
078, 105 - 107, 121 23 5 5 5 5 to 1 100% 4 80%
101 – 104, 108, 109, 144 36 4 4 4 9 to 1 100% 4 100%
111 – 114 52 8 8 8 7 to 1 100% 8 100%
115, 231, 242 50 3 3 3 17 to 1 100% 2 67%
131, 145, 163, 164 32 6 6 6 6 to 1 100% 3 50%
132 - 134, 245 18 5 5 5 4 to 1 100% 4 80%
141, 143, 151 - 156 64 18 18 16 4 to 1 100% 14 88%
161, 162 33 2 2 2 17 to 2 100% 2 100%
171 - 173 11 3 3 2 4 to 2 100% 1 50%
181 - 184 9 4 4 4 3 to 1 100% 4 100%
205, 206 19 3 3 3 7 to 1 100% 2 67%
221 – 223, 241 24 1 1 1 24 to 1 100% 0%
251 57 2 2 2 29 to 1 100% 2 100%
TOTALS 3,314 235 235 219 15 to 1 99% 162 74%
updated 3/29/14 A-22 hunt returns thru 3/28/14
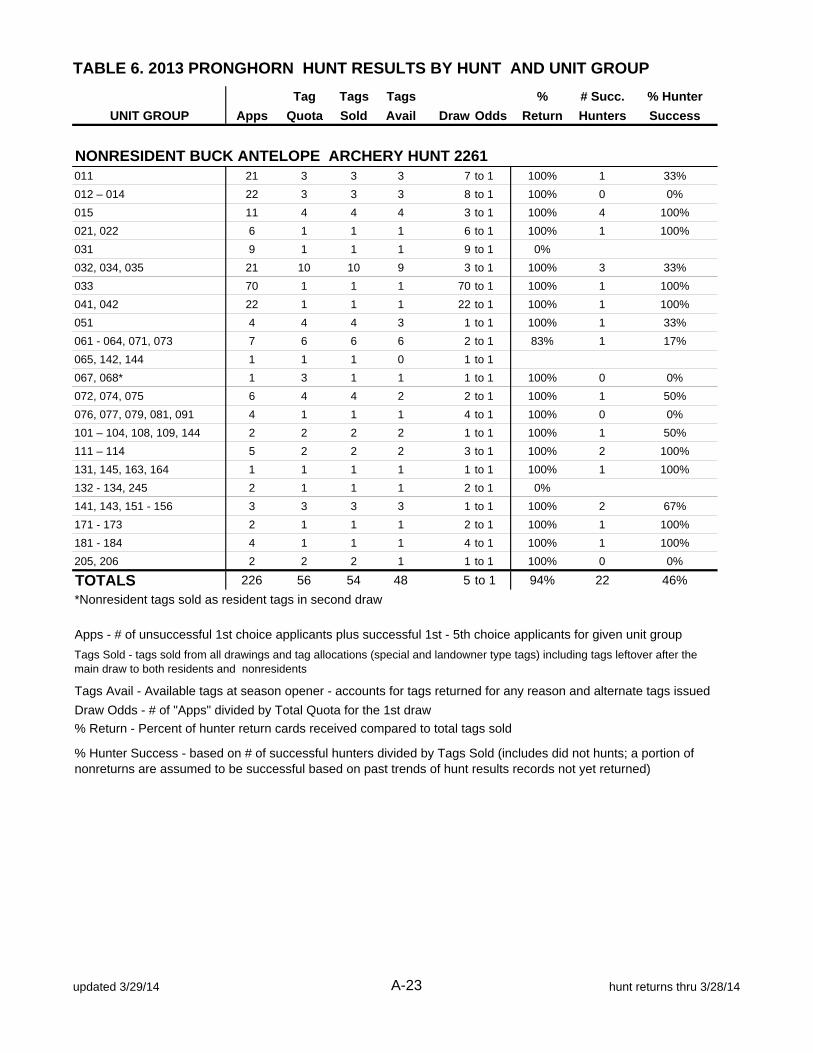
TABLE 6. 2013 PRONGHORN HUNT RESULTS BY HUNT AND UNIT GROUP
Tag Tags Tags % # Succ. % Hunter
UNIT GROUP Apps Quota Sold Avail Draw Odds Return Hunters Success
NONRESIDENT BUCK ANTELOPE ARCHERY HUNT 2261011 21 3 3 3 7 to 1 100% 1 33%
012 – 014 22 3 3 3 8 to 1 100% 0 0%
015 11 4 4 4 3 to 1 100% 4 100%
021, 022 6 1 1 1 6 to 1 100% 1 100%
031 9 1 1 1 9 to 1 0%
032, 034, 035 21 10 10 9 3 to 1 100% 3 33%
033 70 1 1 1 70 to 1 100% 1 100%
041, 042 22 1 1 1 22 to 1 100% 1 100%
051 4 4 4 3 1 to 1 100% 1 33%
061 - 064, 071, 073 7 6 6 6 2 to 1 83% 1 17%
065, 142, 144 1 1 1 0 1 to 1
067, 068* 1 3 1 1 1 to 1 100% 0 0%
072, 074, 075 6 4 4 2 2 to 1 100% 1 50%
076, 077, 079, 081, 091 4 1 1 1 4 to 1 100% 0 0%
101 – 104, 108, 109, 144 2 2 2 2 1 to 1 100% 1 50%
111 – 114 5 2 2 2 3 to 1 100% 2 100%
131, 145, 163, 164 1 1 1 1 1 to 1 100% 1 100%
132 - 134, 245 2 1 1 1 2 to 1 0%
141, 143, 151 - 156 3 3 3 3 1 to 1 100% 2 67%
171 - 173 2 1 1 1 2 to 1 100% 1 100%
181 - 184 4 1 1 1 4 to 1 100% 1 100%
205, 206 2 2 2 1 1 to 1 100% 0 0%
TOTALS 226 56 54 48 5 to 1 94% 22 46%
*Nonresident tags sold as resident tags in second draw
Apps - # of unsuccessful 1st choice applicants plus successful 1st - 5th choice applicants for given unit group
Tags Avail - Available tags at season opener - accounts for tags returned for any reason and alternate tags issued
Draw Odds - # of "Apps" divided by Total Quota for the 1st draw
% Return - Percent of hunter return cards received compared to total tags sold
% Hunter Success - based on # of successful hunters divided by Tags Sold (includes did not hunts; a portion of nonreturns are assumed to be successful based on past trends of hunt results records not yet returned)
Tags Sold - tags sold from all drawings and tag allocations (special and landowner type tags) including tags leftover after the main draw to both residents and nonresidents
updated 3/29/14 A-23 hunt returns thru 3/28/14

TABLE 7. 2013 PRONGHORN BUCK HORN LENGTH BY UNIT AND UNIT GROUP
Unit <6 6 7 8 9 10 11 12 13 14 15 16 17+
011 5 6 7 21 18 13 2 1 73 22%
012 1 2 3 2 5 11 10 4 1 1
013 1 2 1 2 6 5 4
014 1 1 1 1 1 2 1 4 6 9 3 4 1 96 15%
015 1 5 7 8 20 19 28 6 2 2 98 10%
021 1 2 8 2 1
022* 1 7 2 4 28 32%
031* 1 1 2 5 3 4 18 23 25 14 5 2 103 20%
032* 1 2 1 3 6 6 12 15 16 11 6 1
034 1 1 2 1 3 5 9 10 3
035* 1 1 1 2 2 18 23 16 10 2 191 23%
033 1 1 2 11 10 18 5 5 53 19%
041 2 1 2 5 9 14 17 12 7 2
042 1 5 9 11 20 16 6 1 140 31%
043 2 4 6 1
044 1 1 1 1
045 1
046 1 1 20 10%
051* 3 3 9 10 10 4 7 46 24%
061 1 1 1 3 11 5 4 1
062 1 1 1 1 3 5 6 3 1
064 2 3 7 2 1
071 1 1 3 2 5 7 5 1
BUCK HORN LENGTH IN INCHES Unit Group Totals
% 15+ inches
073 1 3 5 3 5 2 108 23%
065* 1 1 4 4 11 10 5
142 1 1
144 1 1 3 1 44 39%
066 1 1 3 6 7 3 21 48%
067 1 1 1 3 3 8 4 2 3 1
068 2 2 4 7 11 10 8 2 2 75 24%
072 1 2 3 1 2 5 9 5 2 1
074 4 5 2
075 1 1 1 1 3 7 5 2 1 64 28%
076 1 2 3 4 4
077 1 3 1 3 1
079
081 1 1
091 1 26 50%
078 1 1
105 1
106 2 2 2 2
107
A-24 hunt returns thru 3/28/14

TABLE 7. 2013 PRONGHORN BUCK HORN LENGTH BY UNIT AND UNIT GROUP
Unit <6 6 7 8 9 10 11 12 13 14 15 16 17+
BUCK HORN LENGTH IN INCHES Unit Group Totals
% 15+ inches
121 1 3 5 10 18 2 50 8%
101 1
102 1 1
103 1 1
104 1 4 6 1 3 2
108 1 2 2 5
109 1
144 1 1 1 1 1 38 26%
111 1 1 2 4 5 5 6 5 1 2
112 1 1 2 3 1
113 1 3 2 1
114 4 4 3 5 63 14%
115* 1 3 1 1 1
231 1 1 2 3 5 1
242 20 20%
131 1 1 1 2 2 8 10 9
145 3 2 1 1
163 2 2 2 2
164 1 1 2 1 1 1 56 34%
132 2 3 4 4 3
133 1 1 1 3
134 1 2 2
245 1 3 2 2 2 37 38%
141 3 3 2 8 2 9 7 3 1
143 1 2 5 3 3 1
151 1 3 1 6 8 1 1
152 1 1 1 2 5 2 1
153* 2 4 5 2
154 1 3 2 1 1
155* 1 3 2 2 3 1
156* 1 7 7 5 1 3 144 28%
161* 1 1 2 3 2 2 2
162 1 1 2 2 1 20 35%
171 1 1 1 5 2 1
172* 1 1 1 3 3 1 1
173 1 3 1 1 4 1 33 27%
181 1 1 2 5 3
182 1 1
183 1 1 4 3
184* 3 3 2 2 3 36 19%
202 1 1 2
204 4 0%
A-25 hunt returns thru 3/28/14
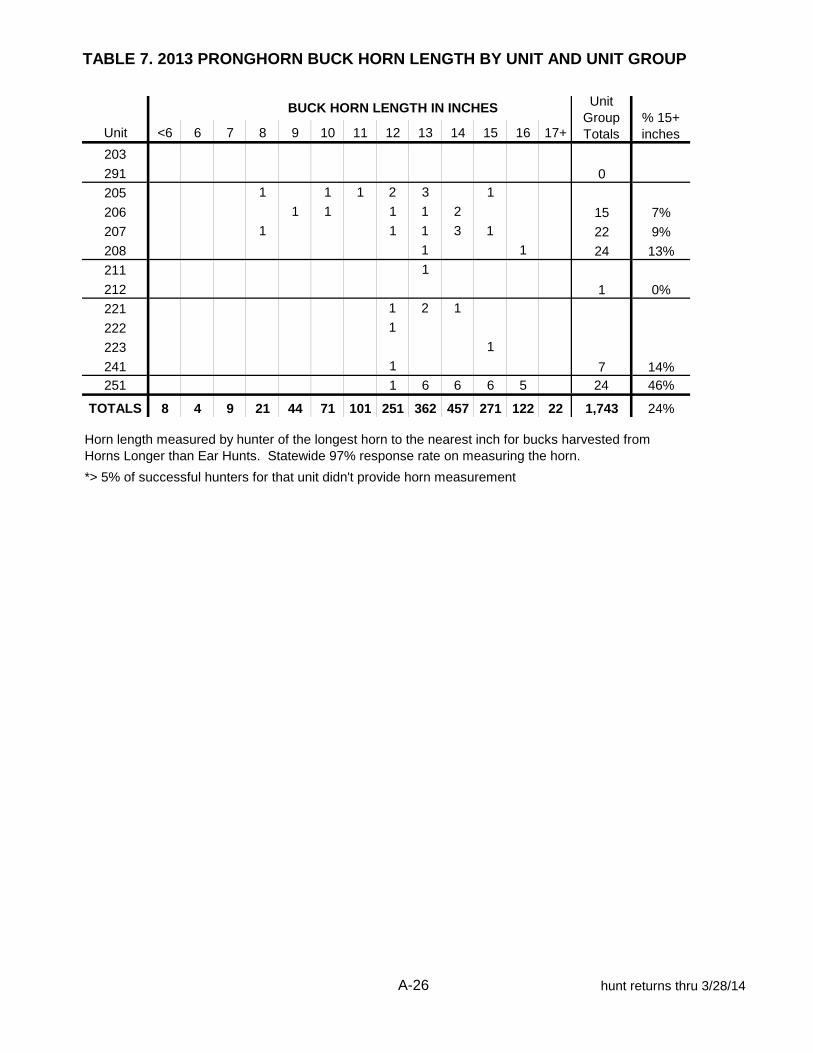
TABLE 7. 2013 PRONGHORN BUCK HORN LENGTH BY UNIT AND UNIT GROUP
Unit <6 6 7 8 9 10 11 12 13 14 15 16 17+
BUCK HORN LENGTH IN INCHES Unit Group Totals
% 15+ inches
203
291 0
205 1 1 1 2 3 1
206 1 1 1 1 2 15 7%
207 1 1 1 3 1 22 9%
208 1 1 24 13%
211 1
212 1 0%
221 1 2 1
222 1
223 1
241 1 7 14%251 1 6 6 6 5 24 46%
TOTALS 8 4 9 21 44 71 101 251 362 457 271 122 22 1,743 24%
*> 5% of successful hunters for that unit didn't provide horn measurement
Horn length measured by hunter of the longest horn to the nearest inch for bucks harvested from Horns Longer than Ear Hunts. Statewide 97% response rate on measuring the horn.
A-26 hunt returns thru 3/28/14
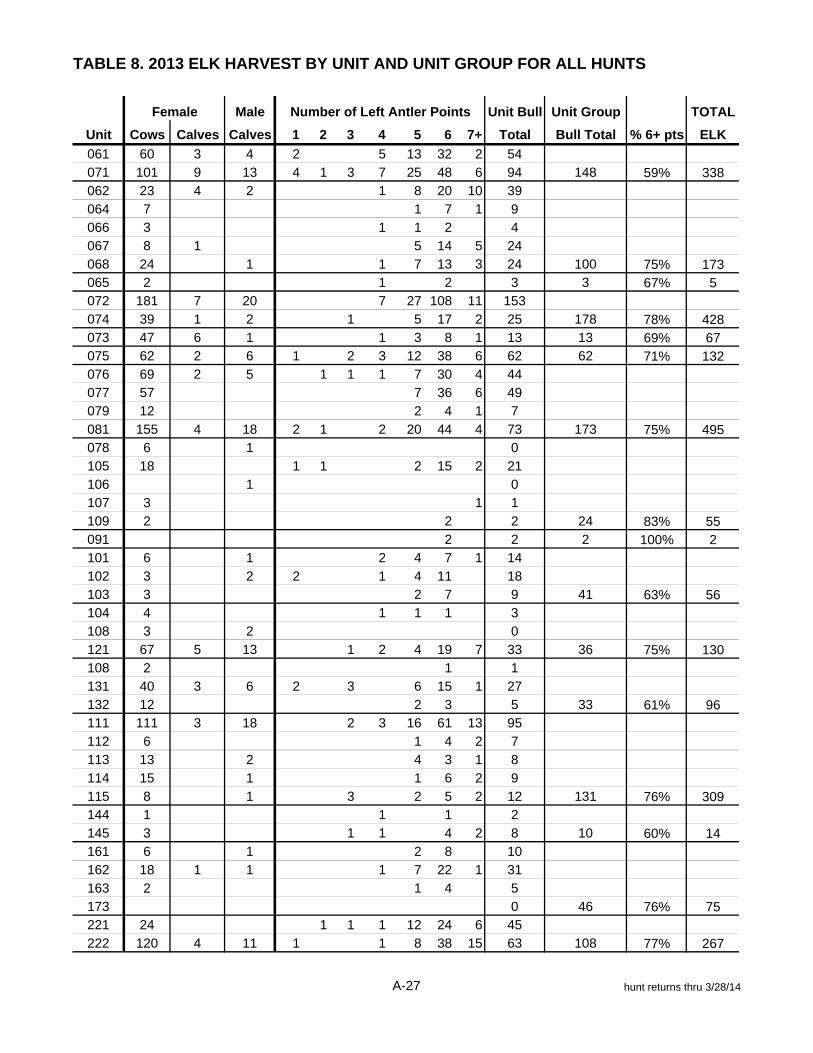
TABLE 8. 2013 ELK HARVEST BY UNIT AND UNIT GROUP FOR ALL HUNTS
Male Unit Bull Unit Group TOTAL
Unit Cows Calves Calves 1 2 3 4 5 6 7+ Total Bull Total % 6+ pts ELK
061 60 3 4 2 5 13 32 2 54071 101 9 13 4 1 3 7 25 48 6 94 148 59% 338062 23 4 2 1 8 20 10 39064 7 1 7 1 9066 3 1 1 2 4067 8 1 5 14 5 24068 24 1 1 7 13 3 24 100 75% 173065 2 1 2 3 3 67% 5072 181 7 20 7 27 108 11 153074 39 1 2 1 5 17 2 25 178 78% 428073 47 6 1 1 3 8 1 13 13 69% 67075 62 2 6 1 2 3 12 38 6 62 62 71% 132076 69 2 5 1 1 1 7 30 4 44077 57 7 36 6 49079 12 2 4 1 7081 155 4 18 2 1 2 20 44 4 73 173 75% 495078 6 1 0105 18 1 1 2 15 2 21106 1 0107 3 1 1109 2 2 2 24 83% 55091 2 2 2 100% 2101 6 1 2 4 7 1 14102 3 2 2 1 4 11 18103 3 2 7 9 41 63% 56104 4 1 1 1 3108 3 2 0121 67 5 13 1 2 4 19 7 33 36 75% 130108 2 1 1131 40 3 6 2 3 6 15 1 27132 12 2 3 5 33 61% 96111 111 3 18 2 3 16 61 13 95112 6 1 4 2 7113 13 2 4 3 1 8114 15 1 1 6 2 9115 8 1 3 2 5 2 12 131 76% 309144 1 1 1 2145 3 1 1 4 2 8 10 60% 14161 6 1 2 8 10162 18 1 1 1 7 22 1 31163 2 1 4 5173 0 46 76% 75221 24 1 1 1 12 24 6 45222 120 4 11 1 1 8 38 15 63 108 77% 267
Female Number of Left Antler Points
A-27 hunt returns thru 3/28/14
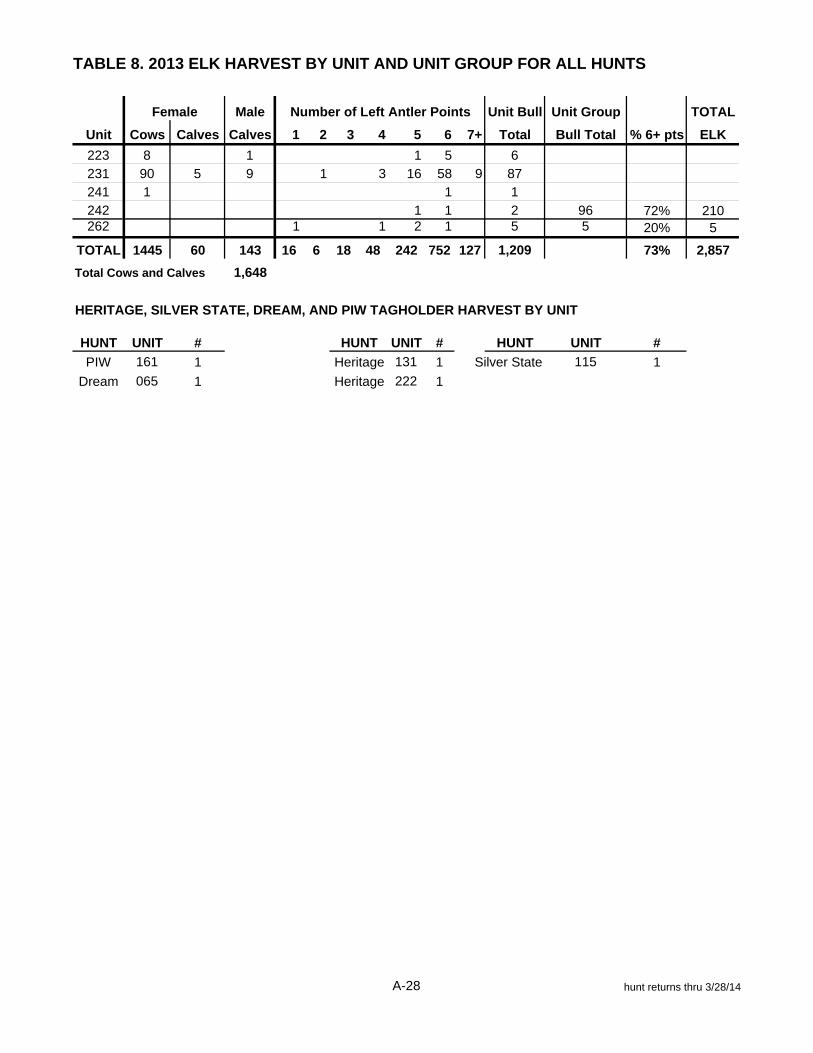
TABLE 8. 2013 ELK HARVEST BY UNIT AND UNIT GROUP FOR ALL HUNTS
Male Unit Bull Unit Group TOTAL
Unit Cows Calves Calves 1 2 3 4 5 6 7+ Total Bull Total % 6+ pts ELK
Female Number of Left Antler Points
223 8 1 1 5 6231 90 5 9 1 3 16 58 9 87241 1 1 1242 1 1 2 96 72% 210262 1 1 2 1 5 5 20% 5
TOTAL 1445 60 143 16 6 18 48 242 752 127 1,209 73% 2,857
Total Cows and Calves 1,648
HERITAGE, SILVER STATE, DREAM, AND PIW TAGHOLDER HARVEST BY UNIT
HUNT UNIT # UNIT # HUNT UNIT #
PIW 161 1 131 1 Silver State 115 1
Dream 065 1 222 1
HUNT
Heritage
Heritage
A-28 hunt returns thru 3/28/14
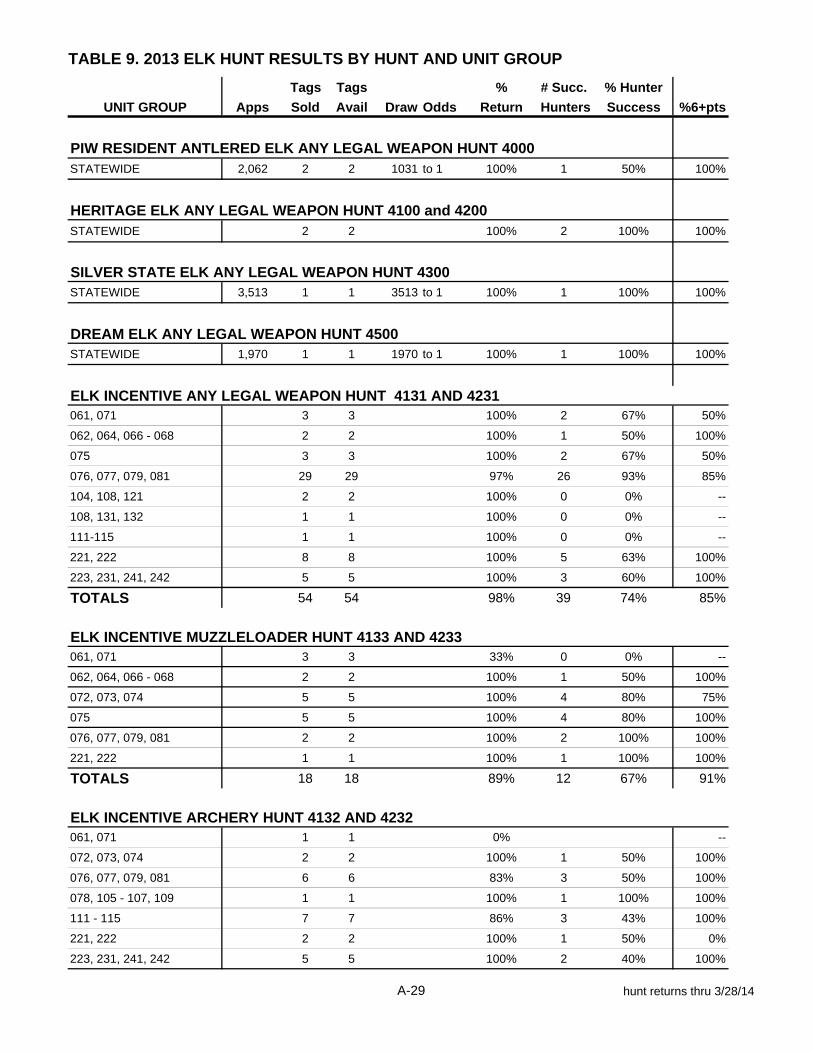
TABLE 9. 2013 ELK HUNT RESULTS BY HUNT AND UNIT GROUP
Tags Tags % # Succ. % Hunter
UNIT GROUP Apps Sold Avail Draw Odds Return Hunters Success %6+pts
PIW RESIDENT ANTLERED ELK ANY LEGAL WEAPON HUNT 4000STATEWIDE 2,062 2 2 1031 to 1 100% 1 50% 100%
HERITAGE ELK ANY LEGAL WEAPON HUNT 4100 and 4200STATEWIDE 2 2 100% 2 100% 100%
SILVER STATE ELK ANY LEGAL WEAPON HUNT 4300STATEWIDE 3,513 1 1 3513 to 1 100% 1 100% 100%
DREAM ELK ANY LEGAL WEAPON HUNT 4500STATEWIDE 1,970 1 1 1970 to 1 100% 1 100% 100%
ELK INCENTIVE ANY LEGAL WEAPON HUNT 4131 AND 4231061, 071 3 3 100% 2 67% 50%
062, 064, 066 - 068 2 2 100% 1 50% 100%
075 3 3 100% 2 67% 50%
076, 077, 079, 081 29 29 97% 26 93% 85%
104, 108, 121 2 2 100% 0 0% --
108, 131, 132 1 1 100% 0 0% --
111-115 1 1 100% 0 0% --
221, 222 8 8 100% 5 63% 100%
223, 231, 241, 242 5 5 100% 3 60% 100%
TOTALS 54 54 98% 39 74% 85%
ELK INCENTIVE MUZZLELOADER HUNT 4133 AND 4233061, 071 3 3 33% 0 0% --
062, 064, 066 - 068 2 2 100% 1 50% 100%
072, 073, 074 5 5 100% 4 80% 75%
075 5 5 100% 4 80% 100%
076, 077, 079, 081 2 2 100% 2 100% 100%
221, 222 1 1 100% 1 100% 100%
TOTALS 18 18 89% 12 67% 91%
ELK INCENTIVE ARCHERY HUNT 4132 AND 4232061, 071 1 1 0% --
072, 073, 074 2 2 100% 1 50% 100%
076, 077, 079, 081 6 6 83% 3 50% 100%
078, 105 - 107, 109 1 1 100% 1 100% 100%
111 - 115 7 7 86% 3 43% 100%
221, 222 2 2 100% 1 50% 0%
223, 231, 241, 242 5 5 100% 2 40% 100%
A-29 hunt returns thru 3/28/14

TABLE 9. 2013 ELK HUNT RESULTS BY HUNT AND UNIT GROUP
Tags Tags % # Succ. % Hunter
UNIT GROUP Apps Sold Avail Draw Odds Return Hunters Success %6+pts
TOTALS 24 24 88% 11 46% 91%
RESIDENT ANTLERED ELK ANY LEGAL WEAPON DEPREDATION HUNT 4102101 - 103 Early 500 75 72 7 to 1 97% 31 43% 68%
101 - 103 Late 147 50 48 3 to 1 100% 10 21% 50%
144, 145 337 20 20 17 to 1 100% 10 50% 70%
TOTALS 984 145 140 7 to 1 99% 51 36% 65%
RESIDENT ANTLERED ELK ANY LEGAL WEAPON HUNT 4151061, 071 Early 563 102 99 6 to 1 97% 58 60% 50%
061, 071 Late 339 103 99 4 to 1 97% 42 43% 55%
062, 064, 066 - 068 Early 504 58 52 9 to 1 98% 33 63% 76%
062, 064, 066 - 068 Late 271 55 55 5 to 1 100% 38 69% 66%
065 210 2 2 105 to 1 100% 2 100% 50%
072, 073, 074 Early 680 125 118 6 to 1 98% 66 57% 73%
072, 073, 074 Late 413 126 113 4 to 1 98% 58 52% 74%
075* Early 103 39 37 3 to 1 92% 20 57% 70%
075* Late 58 37 31 2 to 1 100% 18 58% 61%
076, 077, 079, 081 Early 734 83 79 9 to 1 97% 59 76% 75%
076, 077, 079, 081 Late 368 86 84 5 to 1 95% 54 67% 63%
078, 105 - 107, 109 114 21 21 6 to 1 95% 14 67% 86%
091 200 3 2 67 to 1 100% 2 100% 100%
104, 108, 121 241 39 37 7 to 1 92% 23 65% 65%
108, 131, 132 247 43 39 6 to 1 95% 25 67% 48%
111 - 115 Early 1,306 99 94 14 to 1 99% 59 63% 71%
111 - 115 Late 442 68 64 7 to 1 98% 32 50% 69%
161 - 164, 171 - 173 Early 549 28 27 20 to 1 93% 15 59% 73%
161 - 164, 171 - 173 Late 186 31 31 6 to 1 100% 13 42% 62%
221, 222 Early 672 69 68 10 to 1 100% 49 72% 76%
221, 222 Late 332 63 63 6 to 1 86% 24 41% 71%
223, 231, 241, 242 Early 867 54 53 17 to 1 96% 35 68% 69%
223, 231, 241, 242 Late 325 50 49 7 to 1 98% 34 69% 76%
262 208 6 5 35 to 1 80% 3 60% 0%
TOTALS 9,932 1,390 1,322 8 to 1 97% 776 60% 68%
RESIDENT ANTLERED ELK MUZZLELOADER HUNT 4156061, 071 111 39 38 3 to 1 97% 20 53% 90%
062, 064, 066-068 133 16 16 9 to 1 94% 10 63% 90%
072, 073, 074 175 39 36 5 to 1 97% 26 72% 77%
075 22 13 11 2 to 1 91% 6 55% 83%
076, 077, 079, 081 32 4 4 8 to 1 100% 3 75% 33%
078, 105 - 107, 109 17 6 6 3 to 1 100% 3 50% 67%
A-30 hunt returns thru 3/28/14

TABLE 9. 2013 ELK HUNT RESULTS BY HUNT AND UNIT GROUP
Tags Tags % # Succ. % Hunter
UNIT GROUP Apps Sold Avail Draw Odds Return Hunters Success %6+pts
104, 108, 121 30 6 6 5 to 1 100% 6 100% 83%
108, 131, 132 16 5 5 4 to 1 100% 3 60% 100%
111 – 115 90 13 12 7 to 1 100% 12 100% 75%
161 - 164, 171 - 173 182 8 8 23 to 1 100% 7 88% 100%
221, 222 57 11 11 6 to 1 100% 7 64% 57%
223, 231, 241, 242 77 8 7 10 to 1 100% 6 86% 50%
262 15 1 1 15 to 1 100% 1 100% 0%
TOTALS 957 169 161 6 to 1 98% 110 68% 78%
RESIDENT ANTLERED ELK ARCHERY HUNT 4161061, 071 112 44 41 3 to 1 100% 8 20% 63%
062, 064, 066 - 068 64 14 13 5 to 1 92% 5 38% 80%
072, 073, 074 120 39 35 4 to 1 97% 10 29% 80%
075 20 13 11 2 to 1 91% 6 55% 67%
076, 077, 079, 081 81 23 21 4 to 1 100% 12 57% 83%
078, 104, 105 - 107, 109 41 11 8 4 to 1 100% 5 63% 86%
104, 108, 121 46 11 11 5 to 1 100% 4 36% 100%
108, 131, 132 42 8 8 6 to 1 100% 2 25% 100%
111 – 115 188 21 21 9 to 1 100% 10 48% 90%
161 - 164, 171 - 173 52 8 8 7 to 1 50% 3 38% 100%
221, 222 188 14 14 14 to 1 163% 7 50% 71%
223, 231, 241, 242 166 17 17 10 to 1 100% 7 41% 100%
262 23 1 1 23 to 1 100% 1 100% 100%
TOTALS 1,143 224 209 6 to 1 98% 80 38% 83%
EMERGENCY DEPREDATION ANTLERLESS ELK ANY LEGAL WEAPON HUNT 4104121 19 19 0 to 1 100% 8 42%
RESIDENT ANTLERLESS ELK ANY LEGAL WEAPON HUNT 4181061, 071 Early 590 337 332 2 to 1 96% 100 31%
061, 071 Late 300 259 254 2 to 1 93% 47 19%
062, 064, 066 - 068 Early 262 124 123 3 to 1 96% 31 26%
062, 064, 066 - 068 Mid 118 96 95 2 to 1 93% 18 20%
062, 064, 068 Late 153 69 69 3 to 1 88% 8 13%
065 30 11 10 3 to 1 90% 2 20%
066, 067 Late 59 49 49 2 to 1 82% 1 2%
072 Early 356 321 313 2 to 1 96% 84 27%
072 Mid 279 310 306 1 to 1 92% 61 21%
073 Early 46 34 34 2 to 1 106% 8 24%
073 Mid 47 45 43 2 to 1 100% 8 19%
074 Early 56 50 50 2 to 1 100% 11 22%
074 Mid 46 46 46 1 to 1 96% 9 20%
A-31 hunt returns thru 3/28/14
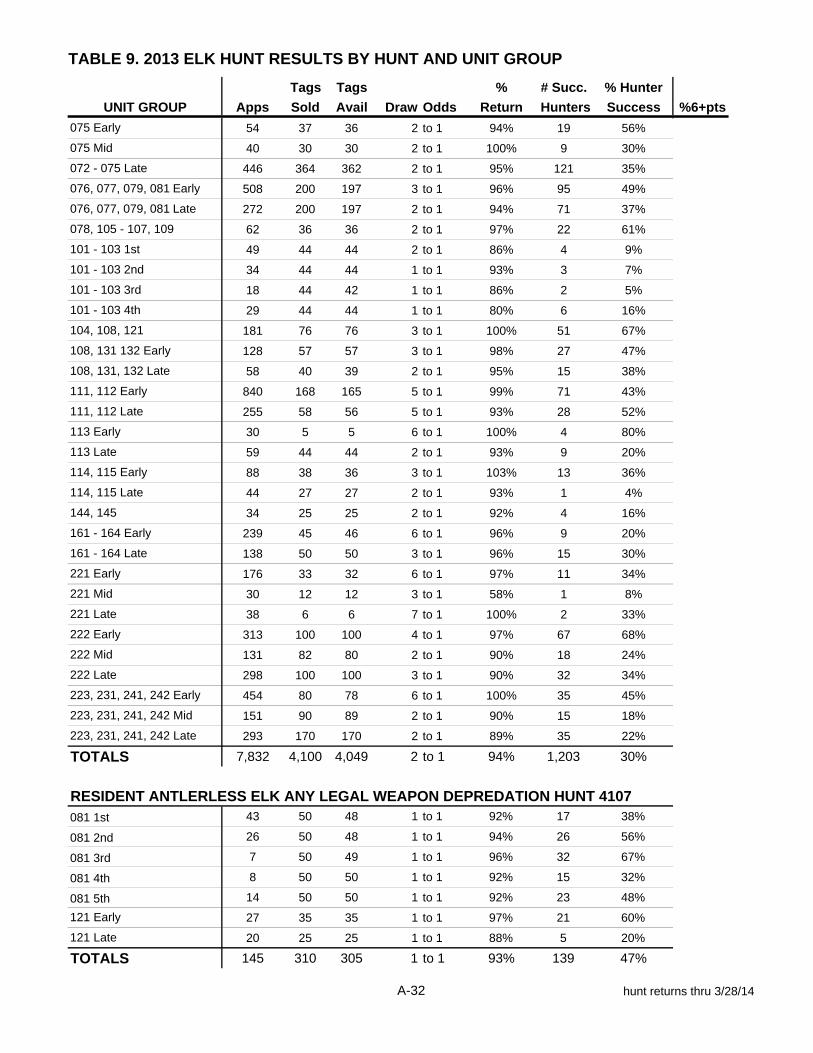
TABLE 9. 2013 ELK HUNT RESULTS BY HUNT AND UNIT GROUP
Tags Tags % # Succ. % Hunter
UNIT GROUP Apps Sold Avail Draw Odds Return Hunters Success %6+pts
075 Early 54 37 36 2 to 1 94% 19 56%
075 Mid 40 30 30 2 to 1 100% 9 30%
072 - 075 Late 446 364 362 2 to 1 95% 121 35%
076, 077, 079, 081 Early 508 200 197 3 to 1 96% 95 49%
076, 077, 079, 081 Late 272 200 197 2 to 1 94% 71 37%
078, 105 - 107, 109 62 36 36 2 to 1 97% 22 61%
101 - 103 1st 49 44 44 2 to 1 86% 4 9%
101 - 103 2nd 34 44 44 1 to 1 93% 3 7%
101 - 103 3rd 18 44 42 1 to 1 86% 2 5%
101 - 103 4th 29 44 44 1 to 1 80% 6 16%
104, 108, 121 181 76 76 3 to 1 100% 51 67%
108, 131 132 Early 128 57 57 3 to 1 98% 27 47%
108, 131, 132 Late 58 40 39 2 to 1 95% 15 38%
111, 112 Early 840 168 165 5 to 1 99% 71 43%
111, 112 Late 255 58 56 5 to 1 93% 28 52%
113 Early 30 5 5 6 to 1 100% 4 80%
113 Late 59 44 44 2 to 1 93% 9 20%
114, 115 Early 88 38 36 3 to 1 103% 13 36%
114, 115 Late 44 27 27 2 to 1 93% 1 4%
144, 145 34 25 25 2 to 1 92% 4 16%
161 - 164 Early 239 45 46 6 to 1 96% 9 20%
161 - 164 Late 138 50 50 3 to 1 96% 15 30%
221 Early 176 33 32 6 to 1 97% 11 34%
221 Mid 30 12 12 3 to 1 58% 1 8%
221 Late 38 6 6 7 to 1 100% 2 33%
222 Early 313 100 100 4 to 1 97% 67 68%
222 Mid 131 82 80 2 to 1 90% 18 24%
222 Late 298 100 100 3 to 1 90% 32 34%
223, 231, 241, 242 Early 454 80 78 6 to 1 100% 35 45%
223, 231, 241, 242 Mid 151 90 89 2 to 1 90% 15 18%
223, 231, 241, 242 Late 293 170 170 2 to 1 89% 35 22%
TOTALS 7,832 4,100 4,049 2 to 1 94% 1,203 30%
RESIDENT ANTLERLESS ELK ANY LEGAL WEAPON DEPREDATION HUNT 4107081 1st 43 50 48 1 to 1 92% 17 38%
081 2nd 26 50 48 1 to 1 94% 26 56%
081 3rd 7 50 49 1 to 1 96% 32 67%
081 4th 8 50 50 1 to 1 92% 15 32%
081 5th 14 50 50 1 to 1 92% 23 48%
121 Early 27 35 35 1 to 1 97% 21 60%
121 Late 20 25 25 1 to 1 88% 5 20%
TOTALS 145 310 305 1 to 1 93% 139 47%
A-32 hunt returns thru 3/28/14
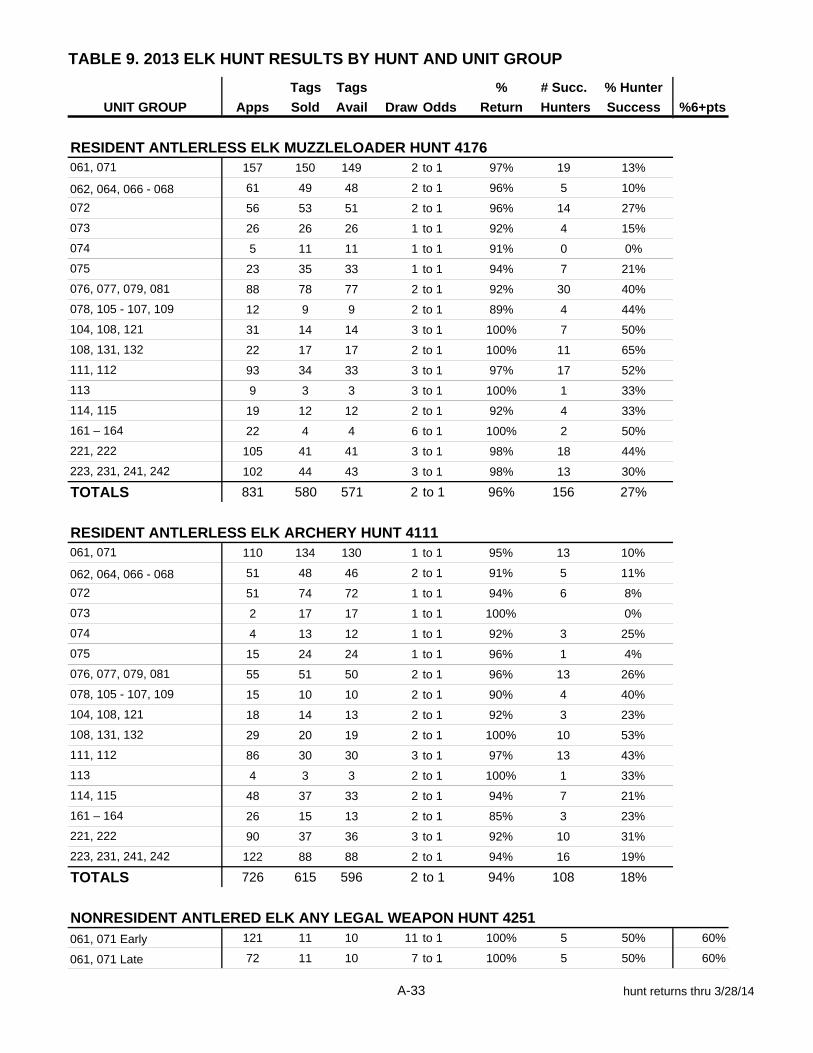
TABLE 9. 2013 ELK HUNT RESULTS BY HUNT AND UNIT GROUP
Tags Tags % # Succ. % Hunter
UNIT GROUP Apps Sold Avail Draw Odds Return Hunters Success %6+pts
RESIDENT ANTLERLESS ELK MUZZLELOADER HUNT 4176061, 071 157 150 149 2 to 1 97% 19 13%
062, 064, 066 - 068 61 49 48 2 to 1 96% 5 10%
072 56 53 51 2 to 1 96% 14 27%
073 26 26 26 1 to 1 92% 4 15%
074 5 11 11 1 to 1 91% 0 0%
075 23 35 33 1 to 1 94% 7 21%
076, 077, 079, 081 88 78 77 2 to 1 92% 30 40%
078, 105 - 107, 109 12 9 9 2 to 1 89% 4 44%
104, 108, 121 31 14 14 3 to 1 100% 7 50%
108, 131, 132 22 17 17 2 to 1 100% 11 65%
111, 112 93 34 33 3 to 1 97% 17 52%
113 9 3 3 3 to 1 100% 1 33%
114, 115 19 12 12 2 to 1 92% 4 33%
161 – 164 22 4 4 6 to 1 100% 2 50%
221, 222 105 41 41 3 to 1 98% 18 44%
223, 231, 241, 242 102 44 43 3 to 1 98% 13 30%
TOTALS 831 580 571 2 to 1 96% 156 27%
RESIDENT ANTLERLESS ELK ARCHERY HUNT 4111061, 071 110 134 130 1 to 1 95% 13 10%
062, 064, 066 - 068 51 48 46 2 to 1 91% 5 11%
072 51 74 72 1 to 1 94% 6 8%
073 2 17 17 1 to 1 100% 0%
074 4 13 12 1 to 1 92% 3 25%
075 15 24 24 1 to 1 96% 1 4%
076, 077, 079, 081 55 51 50 2 to 1 96% 13 26%
078, 105 - 107, 109 15 10 10 2 to 1 90% 4 40%
104, 108, 121 18 14 13 2 to 1 92% 3 23%
108, 131, 132 29 20 19 2 to 1 100% 10 53%
111, 112 86 30 30 3 to 1 97% 13 43%
113 4 3 3 2 to 1 100% 1 33%
114, 115 48 37 33 2 to 1 94% 7 21%
161 – 164 26 15 13 2 to 1 85% 3 23%
221, 222 90 37 36 3 to 1 92% 10 31%
223, 231, 241, 242 122 88 88 2 to 1 94% 16 19%
TOTALS 726 615 596 2 to 1 94% 108 18%
NONRESIDENT ANTLERED ELK ANY LEGAL WEAPON HUNT 4251061, 071 Early 121 11 10 11 to 1 100% 5 50% 60%
061, 071 Late 72 11 10 7 to 1 100% 5 50% 60%
A-33 hunt returns thru 3/28/14
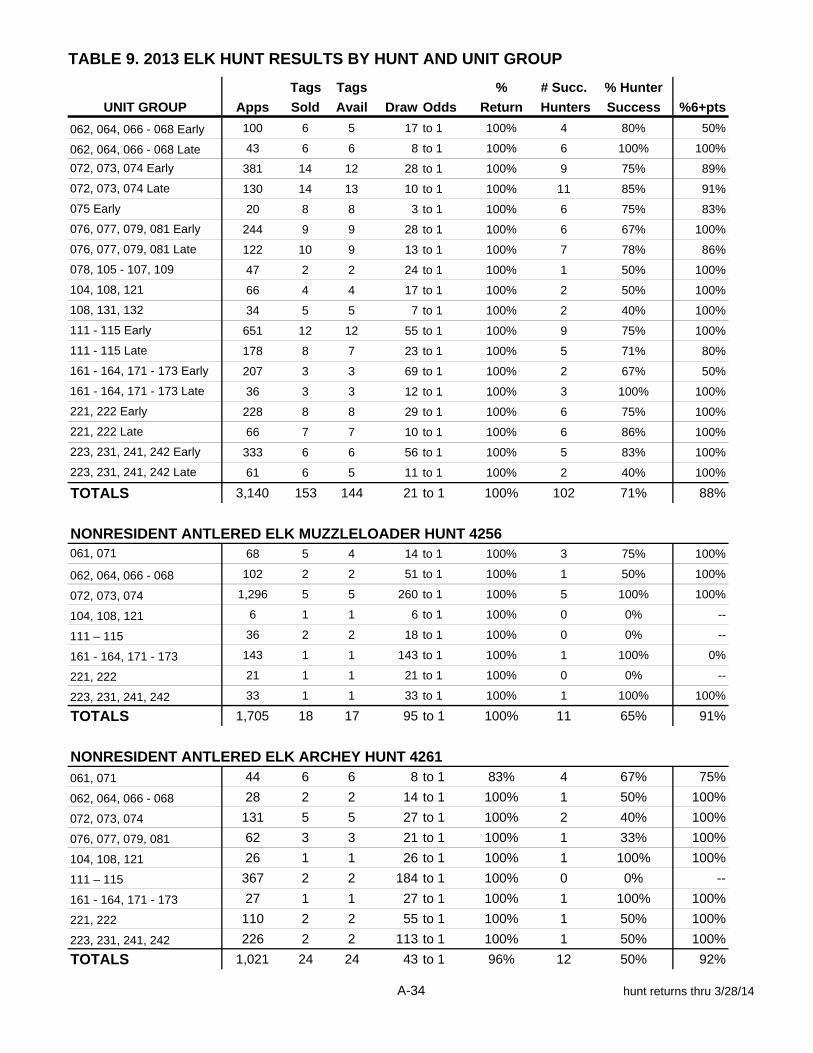
TABLE 9. 2013 ELK HUNT RESULTS BY HUNT AND UNIT GROUP
Tags Tags % # Succ. % Hunter
UNIT GROUP Apps Sold Avail Draw Odds Return Hunters Success %6+pts
062, 064, 066 - 068 Early 100 6 5 17 to 1 100% 4 80% 50%
062, 064, 066 - 068 Late 43 6 6 8 to 1 100% 6 100% 100%
072, 073, 074 Early 381 14 12 28 to 1 100% 9 75% 89%
072, 073, 074 Late 130 14 13 10 to 1 100% 11 85% 91%
075 Early 20 8 8 3 to 1 100% 6 75% 83%
076, 077, 079, 081 Early 244 9 9 28 to 1 100% 6 67% 100%
076, 077, 079, 081 Late 122 10 9 13 to 1 100% 7 78% 86%
078, 105 - 107, 109 47 2 2 24 to 1 100% 1 50% 100%
104, 108, 121 66 4 4 17 to 1 100% 2 50% 100%
108, 131, 132 34 5 5 7 to 1 100% 2 40% 100%
111 - 115 Early 651 12 12 55 to 1 100% 9 75% 100%
111 - 115 Late 178 8 7 23 to 1 100% 5 71% 80%
161 - 164, 171 - 173 Early 207 3 3 69 to 1 100% 2 67% 50%
161 - 164, 171 - 173 Late 36 3 3 12 to 1 100% 3 100% 100%
221, 222 Early 228 8 8 29 to 1 100% 6 75% 100%
221, 222 Late 66 7 7 10 to 1 100% 6 86% 100%
223, 231, 241, 242 Early 333 6 6 56 to 1 100% 5 83% 100%
223, 231, 241, 242 Late 61 6 5 11 to 1 100% 2 40% 100%
TOTALS 3,140 153 144 21 to 1 100% 102 71% 88%
NONRESIDENT ANTLERED ELK MUZZLELOADER HUNT 4256061, 071 68 5 4 14 to 1 100% 3 75% 100%
062, 064, 066 - 068 102 2 2 51 to 1 100% 1 50% 100%
072, 073, 074 1,296 5 5 260 to 1 100% 5 100% 100%
104, 108, 121 6 1 1 6 to 1 100% 0 0% --
111 – 115 36 2 2 18 to 1 100% 0 0% --
161 - 164, 171 - 173 143 1 1 143 to 1 100% 1 100% 0%
221, 222 21 1 1 21 to 1 100% 0 0% --
223, 231, 241, 242 33 1 1 33 to 1 100% 1 100% 100%
TOTALS 1,705 18 17 95 to 1 100% 11 65% 91%
NONRESIDENT ANTLERED ELK ARCHEY HUNT 4261
061, 071 44 6 6 8 to 1 83% 4 67% 75%
062, 064, 066 - 068 28 2 2 14 to 1 100% 1 50% 100%
072, 073, 074 131 5 5 27 to 1 100% 2 40% 100%
076, 077, 079, 081 62 3 3 21 to 1 100% 1 33% 100%
104, 108, 121 26 1 1 26 to 1 100% 1 100% 100%
111 – 115 367 2 2 184 to 1 100% 0 0% --
161 - 164, 171 - 173 27 1 1 27 to 1 100% 1 100% 100%
221, 222 110 2 2 55 to 1 100% 1 50% 100%
223, 231, 241, 242 226 2 2 113 to 1 100% 1 50% 100%
TOTALS 1,021 24 24 43 to 1 96% 12 50% 92%
A-34 hunt returns thru 3/28/14
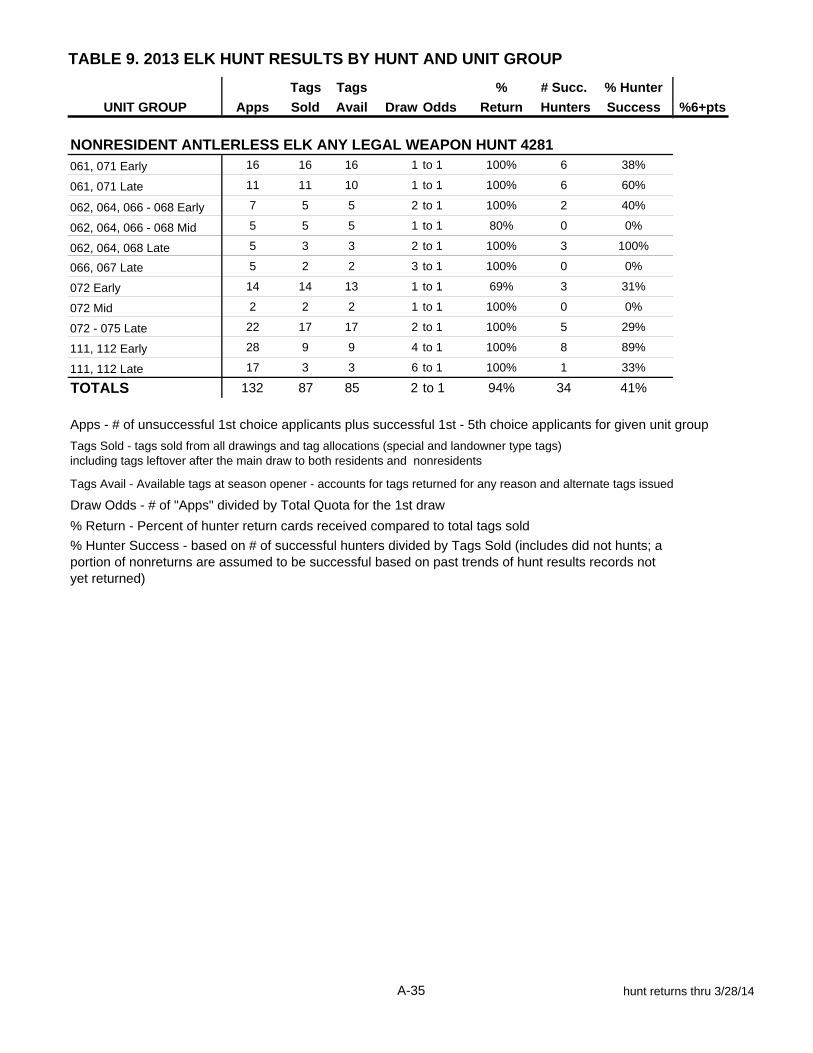
TABLE 9. 2013 ELK HUNT RESULTS BY HUNT AND UNIT GROUP
Tags Tags % # Succ. % Hunter
UNIT GROUP Apps Sold Avail Draw Odds Return Hunters Success %6+pts
NONRESIDENT ANTLERLESS ELK ANY LEGAL WEAPON HUNT 4281
061, 071 Early 16 16 16 1 to 1 100% 6 38%
061, 071 Late 11 11 10 1 to 1 100% 6 60%
062, 064, 066 - 068 Early 7 5 5 2 to 1 100% 2 40%
062, 064, 066 - 068 Mid 5 5 5 1 to 1 80% 0 0%
062, 064, 068 Late 5 3 3 2 to 1 100% 3 100%
066, 067 Late 5 2 2 3 to 1 100% 0 0%
072 Early 14 14 13 1 to 1 69% 3 31%
072 Mid 2 2 2 1 to 1 100% 0 0%
072 - 075 Late 22 17 17 2 to 1 100% 5 29%
111, 112 Early 28 9 9 4 to 1 100% 8 89%
111, 112 Late 17 3 3 6 to 1 100% 1 33%
TOTALS 132 87 85 2 to 1 94% 34 41%
Apps - # of unsuccessful 1st choice applicants plus successful 1st - 5th choice applicants for given unit group
Tags Avail - Available tags at season opener - accounts for tags returned for any reason and alternate tags issued
Draw Odds - # of "Apps" divided by Total Quota for the 1st draw
% Return - Percent of hunter return cards received compared to total tags sold
% Hunter Success - based on # of successful hunters divided by Tags Sold (includes did not hunts; a portion of nonreturns are assumed to be successful based on past trends of hunt results records not yet returned)
Tags Sold - tags sold from all drawings and tag allocations (special and landowner type tags) including tags leftover after the main draw to both residents and nonresidents
A-35 hunt returns thru 3/28/14
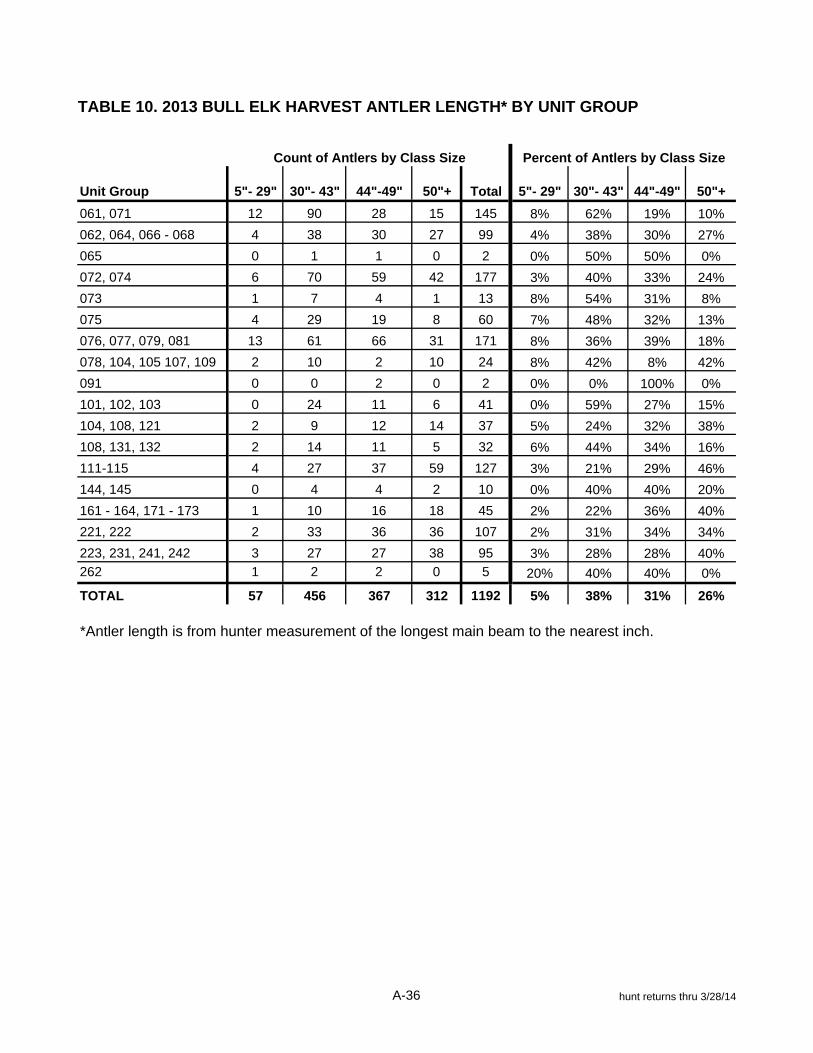
TABLE 10. 2013 BULL ELK HARVEST ANTLER LENGTH* BY UNIT GROUP
Unit Group 5"- 29" 30"- 43" 44"-49" 50"+ Total 5"- 29" 30"- 43" 44"-49" 50"+
061, 071 12 90 28 15 145 8% 62% 19% 10%
062, 064, 066 - 068 4 38 30 27 99 4% 38% 30% 27%
065 0 1 1 0 2 0% 50% 50% 0%
072, 074 6 70 59 42 177 3% 40% 33% 24%
073 1 7 4 1 13 8% 54% 31% 8%
075 4 29 19 8 60 7% 48% 32% 13%
076, 077, 079, 081 13 61 66 31 171 8% 36% 39% 18%
078, 104, 105 107, 109 2 10 2 10 24 8% 42% 8% 42%
091 0 0 2 0 2 0% 0% 100% 0%
101, 102, 103 0 24 11 6 41 0% 59% 27% 15%
104, 108, 121 2 9 12 14 37 5% 24% 32% 38%
108, 131, 132 2 14 11 5 32 6% 44% 34% 16%
111-115 4 27 37 59 127 3% 21% 29% 46%
144, 145 0 4 4 2 10 0% 40% 40% 20%
161 - 164, 171 - 173 1 10 16 18 45 2% 22% 36% 40%
221, 222 2 33 36 36 107 2% 31% 34% 34%
223, 231, 241, 242 3 27 27 38 95 3% 28% 28% 40%262 1 2 2 0 5 20% 40% 40% 0%
TOTAL 57 456 367 312 1192 5% 38% 31% 26%
*Antler length is from hunter measurement of the longest main beam to the nearest inch.
Count of Antlers by Class Size Percent of Antlers by Class Size
A-36 hunt returns thru 3/28/14
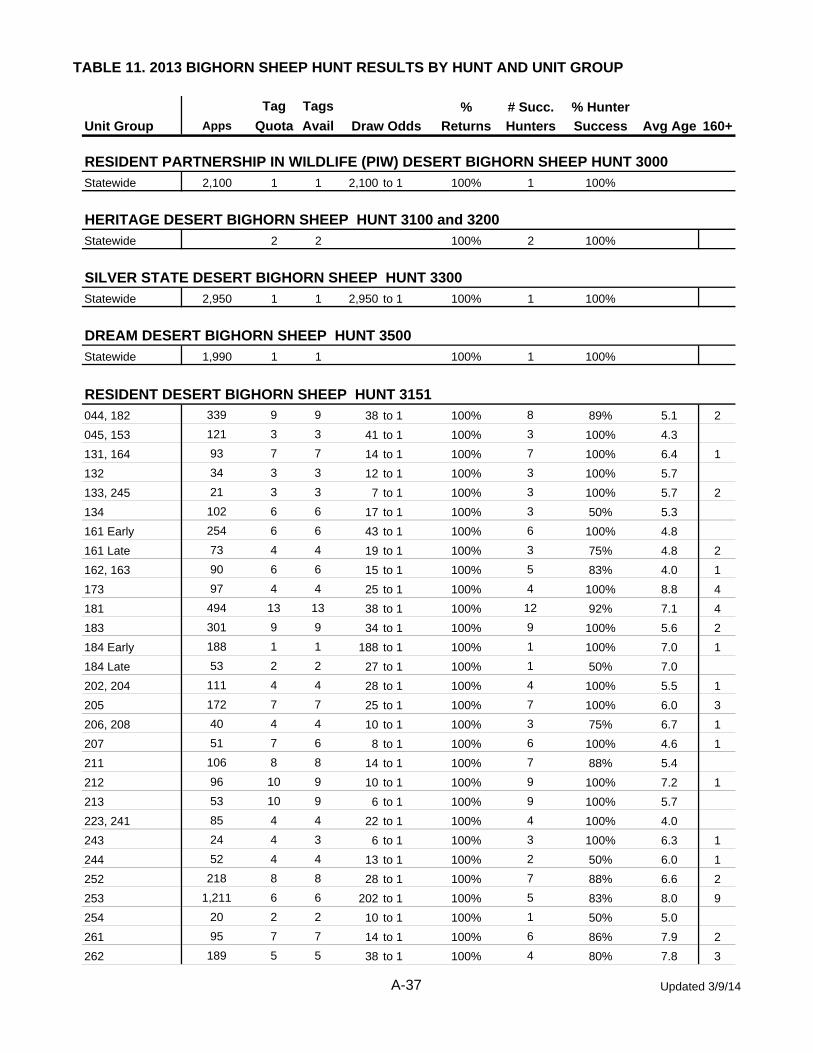
TABLE 11. 2013 BIGHORN SHEEP HUNT RESULTS BY HUNT AND UNIT GROUP
Tag Tags % # Succ. % Hunter
Unit Group Apps Quota Avail Returns Hunters Success Avg Age 160+
RESIDENT PARTNERSHIP IN WILDLIFE (PIW) DESERT BIGHORN SHEEP HUNT 3000
Statewide 2,100 1 1 2,100 to 1 100% 1 100%
HERITAGE DESERT BIGHORN SHEEP HUNT 3100 and 3200
Statewide 2 2 100% 2 100%
SILVER STATE DESERT BIGHORN SHEEP HUNT 3300
Statewide 2,950 1 1 2,950 to 1 100% 1 100%
DREAM DESERT BIGHORN SHEEP HUNT 3500
Statewide 1,990 1 1 100% 1 100%
RESIDENT DESERT BIGHORN SHEEP HUNT 3151
044, 182 339 9 9 38 to 1 100% 8 89% 5.1 2
045, 153 121 3 3 41 to 1 100% 3 100% 4.3
131, 164 93 7 7 14 to 1 100% 7 100% 6.4 1
132 34 3 3 12 to 1 100% 3 100% 5.7
133, 245 21 3 3 7 to 1 100% 3 100% 5.7 2
134 102 6 6 17 to 1 100% 3 50% 5.3
161 Early 254 6 6 43 to 1 100% 6 100% 4.8
161 Late 73 4 4 19 to 1 100% 3 75% 4.8 2
162, 163 90 6 6 15 to 1 100% 5 83% 4.0 1
173 97 4 4 25 to 1 100% 4 100% 8.8 4
181 494 13 13 38 to 1 100% 12 92% 7.1 4
183 301 9 9 34 to 1 100% 9 100% 5.6 2
184 Early 188 1 1 188 to 1 100% 1 100% 7.0 1
184 Late 53 2 2 27 to 1 100% 1 50% 7.0
202, 204 111 4 4 28 to 1 100% 4 100% 5.5 1
205 172 7 7 25 to 1 100% 7 100% 6.0 3
206, 208 40 4 4 10 to 1 100% 3 75% 6.7 1
207 51 7 6 8 to 1 100% 6 100% 4.6 1
211 106 8 8 14 to 1 100% 7 88% 5.4
212 96 10 9 10 to 1 100% 9 100% 7.2 1
213 53 10 9 6 to 1 100% 9 100% 5.7
223, 241 85 4 4 22 to 1 100% 4 100% 4.0
243 24 4 3 6 to 1 100% 3 100% 6.3 1
244 52 4 4 13 to 1 100% 2 50% 6.0 1
252 218 8 8 28 to 1 100% 7 88% 6.6 2
253 1,211 6 6 202 to 1 100% 5 83% 8.0 9
254 20 2 2 10 to 1 100% 1 50% 5.0
261 95 7 7 14 to 1 100% 6 86% 7.9 2
262 189 5 5 38 to 1 100% 4 80% 7.8 3
Draw Odds
A-37 Updated 3/9/14
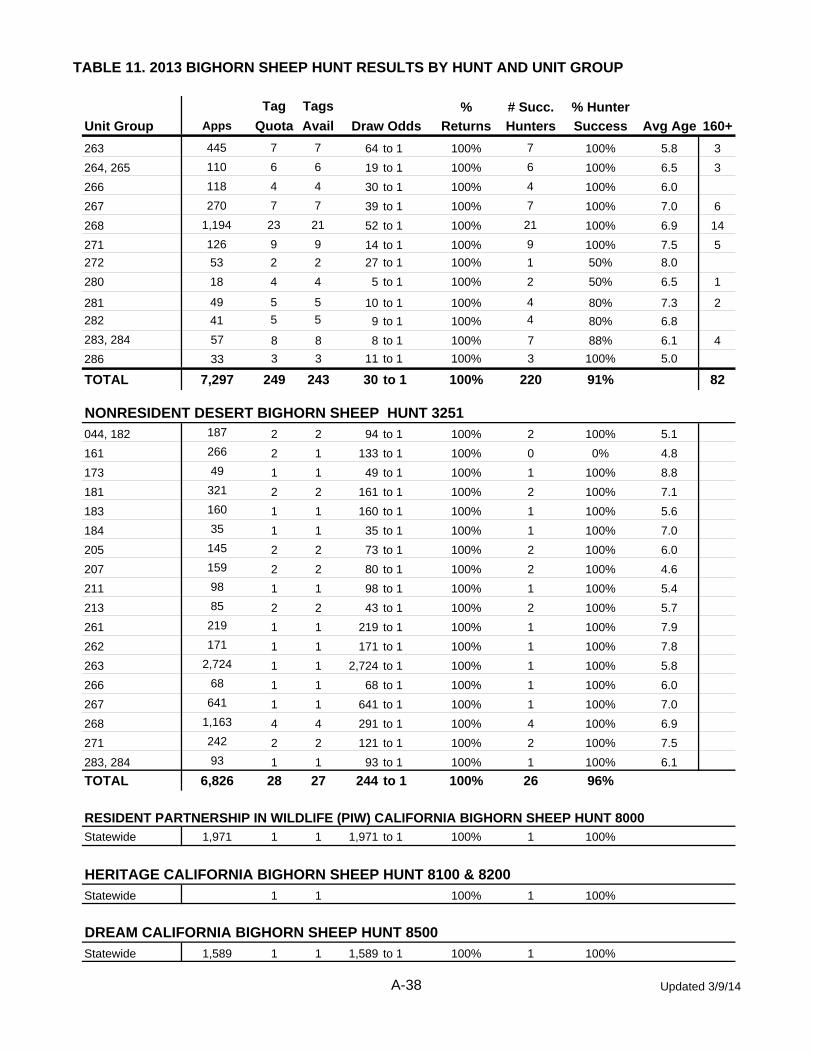
TABLE 11. 2013 BIGHORN SHEEP HUNT RESULTS BY HUNT AND UNIT GROUP
Tag Tags % # Succ. % Hunter
Unit Group Apps Quota Avail Returns Hunters Success Avg Age 160+Draw Odds
263 445 7 7 64 to 1 100% 7 100% 5.8 3
264, 265 110 6 6 19 to 1 100% 6 100% 6.5 3
266 118 4 4 30 to 1 100% 4 100% 6.0
267 270 7 7 39 to 1 100% 7 100% 7.0 6
268 1,194 23 21 52 to 1 100% 21 100% 6.9 14
271 126 9 9 14 to 1 100% 9 100% 7.5 5
272 53 2 2 27 to 1 100% 1 50% 8.0
280 18 4 4 5 to 1 100% 2 50% 6.5 1
281 49 5 5 10 to 1 100% 4 80% 7.3 2
282 41 5 5 9 to 1 100% 4 80% 6.8
283, 284 57 8 8 8 to 1 100% 7 88% 6.1 4
286 33 3 3 11 to 1 100% 3 100% 5.0
TOTAL 7,297 249 243 30 to 1 100% 220 91% 82
NONRESIDENT DESERT BIGHORN SHEEP HUNT 3251
044, 182 187 2 2 94 to 1 100% 2 100% 5.1
161 266 2 1 133 to 1 100% 0 0% 4.8
173 49 1 1 49 to 1 100% 1 100% 8.8
181 321 2 2 161 to 1 100% 2 100% 7.1
183 160 1 1 160 to 1 100% 1 100% 5.6
184 35 1 1 35 to 1 100% 1 100% 7.0
205 145 2 2 73 to 1 100% 2 100% 6.0
207 159 2 2 80 to 1 100% 2 100% 4.6
211 98 1 1 98 to 1 100% 1 100% 5.4
213 85 2 2 43 to 1 100% 2 100% 5.7
261 219 1 1 219 to 1 100% 1 100% 7.9
262 171 1 1 171 to 1 100% 1 100% 7.8
263 2,724 1 1 2,724 to 1 100% 1 100% 5.8
266 68 1 1 68 to 1 100% 1 100% 6.0
267 641 1 1 641 to 1 100% 1 100% 7.0
268 1,163 4 4 291 to 1 100% 4 100% 6.9
271 242 2 2 121 to 1 100% 2 100% 7.5
283, 284 93 1 1 93 to 1 100% 1 100% 6.1
TOTAL 6,826 28 27 244 to 1 100% 26 96%
RESIDENT PARTNERSHIP IN WILDLIFE (PIW) CALIFORNIA BIGHORN SHEEP HUNT 8000Statewide 1,971 1 1 1,971 to 1 100% 1 100%
HERITAGE CALIFORNIA BIGHORN SHEEP HUNT 8100 & 8200
Statewide 1 1 100% 1 100%
DREAM CALIFORNIA BIGHORN SHEEP HUNT 8500
Statewide 1,589 1 1 1,589 to 1 100% 1 100%
A-38 Updated 3/9/14
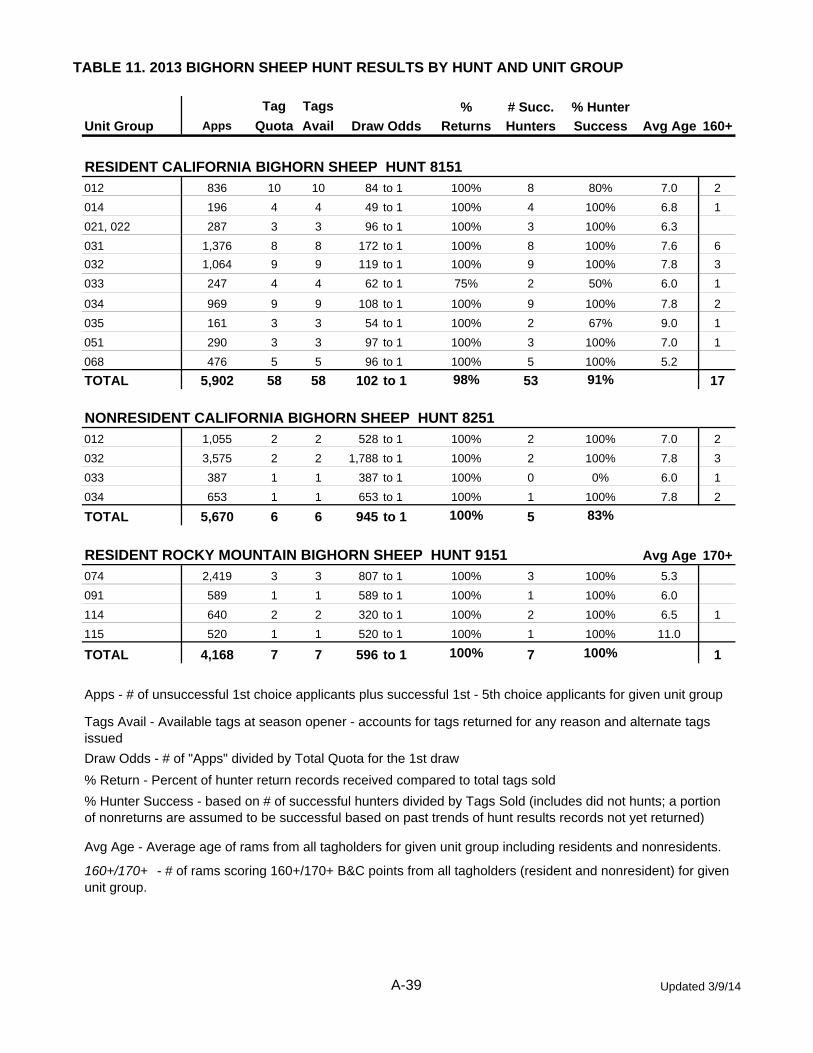
TABLE 11. 2013 BIGHORN SHEEP HUNT RESULTS BY HUNT AND UNIT GROUP
Tag Tags % # Succ. % Hunter
Unit Group Apps Quota Avail Returns Hunters Success Avg Age 160+Draw Odds
RESIDENT CALIFORNIA BIGHORN SHEEP HUNT 8151
012 836 10 10 84 to 1 100% 8 80% 7.0 2
014 196 4 4 49 to 1 100% 4 100% 6.8 1
021, 022 287 3 3 96 to 1 100% 3 100% 6.3
031 1,376 8 8 172 to 1 100% 8 100% 7.6 6
032 1,064 9 9 119 to 1 100% 9 100% 7.8 3
033 247 4 4 62 to 1 75% 2 50% 6.0 1
034 969 9 9 108 to 1 100% 9 100% 7.8 2
035 161 3 3 54 to 1 100% 2 67% 9.0 1
051 290 3 3 97 to 1 100% 3 100% 7.0 1
068 476 5 5 96 to 1 100% 5 100% 5.2
TOTAL 5,902 58 58 102 to 1 98% 53 91% 17
NONRESIDENT CALIFORNIA BIGHORN SHEEP HUNT 8251
012 1,055 2 2 528 to 1 100% 2 100% 7.0 2
032 3,575 2 2 1,788 to 1 100% 2 100% 7.8 3
033 387 1 1 387 to 1 100% 0 0% 6.0 1
034 653 1 1 653 to 1 100% 1 100% 7.8 2
TOTAL 5,670 6 6 945 to 1 100% 5 83%
RESIDENT ROCKY MOUNTAIN BIGHORN SHEEP HUNT 9151 Avg Age 170+
074 2,419 3 3 807 to 1 100% 3 100% 5.3
091 589 1 1 589 to 1 100% 1 100% 6.0
114 640 2 2 320 to 1 100% 2 100% 6.5 1
115 520 1 1 520 to 1 100% 1 100% 11.0
TOTAL 4,168 7 7 596 to 1 100% 7 100% 1
Draw Odds - # of "Apps" divided by Total Quota for the 1st draw
% Return - Percent of hunter return records received compared to total tags sold
160+/170+ - # of rams scoring 160+/170+ B&C points from all tagholders (resident and nonresident) for given unit group.
Avg Age - Average age of rams from all tagholders for given unit group including residents and nonresidents.
% Hunter Success - based on # of successful hunters divided by Tags Sold (includes did not hunts; a portion of nonreturns are assumed to be successful based on past trends of hunt results records not yet returned)
Apps - # of unsuccessful 1st choice applicants plus successful 1st - 5th choice applicants for given unit group
Tags Avail - Available tags at season opener - accounts for tags returned for any reason and alternate tags issued
A-39 Updated 3/9/14
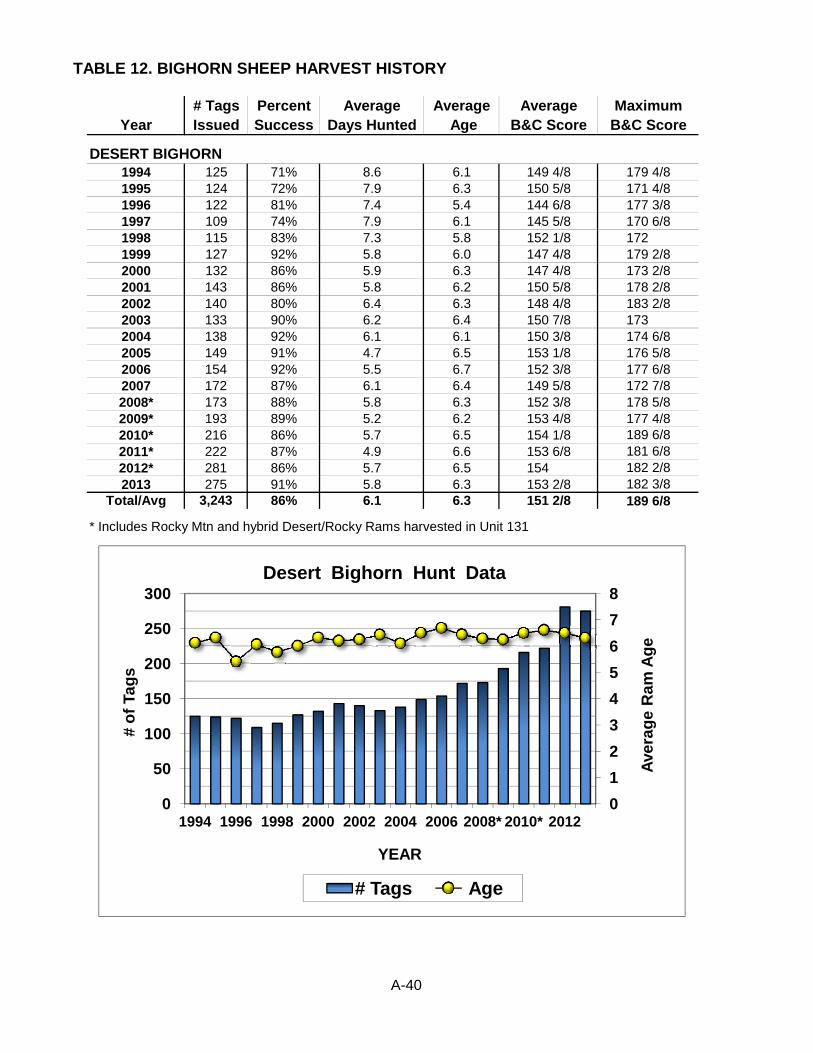
TABLE 12. BIGHORN SHEEP HARVEST HISTORY
# Tags Percent Average Average Average MaximumYear Issued Success Days Hunted Age B&C Score B&C Score
DESERT BIGHORN1994 125 71% 8.6 6.1 149 4/8 179 4/81995 124 72% 7.9 6.3 150 5/8 171 4/81996 122 81% 7.4 5.4 144 6/8 177 3/81997 109 74% 7.9 6.1 145 5/8 170 6/81998 115 83% 7.3 5.8 152 1/8 1721999 127 92% 5.8 6.0 147 4/8 179 2/82000 132 86% 5.9 6.3 147 4/8 173 2/82001 143 86% 5.8 6.2 150 5/8 178 2/82002 140 80% 6.4 6.3 148 4/8 183 2/82003 133 90% 6.2 6.4 150 7/8 1732004 138 92% 6.1 6.1 150 3/8 174 6/82005 149 91% 4.7 6.5 153 1/8 176 5/82006 154 92% 5.5 6.7 152 3/8 177 6/82007 172 87% 6.1 6.4 149 5/8 172 7/82008* 173 88% 5.8 6.3 152 3/8 178 5/82009* 193 89% 5.2 6.2 153 4/8 177 4/82010* 216 86% 5.7 6.5 154 1/8 189 6/82011* 222 87% 4.9 6.6 153 6/8 181 6/82012* 281 86% 5.7 6.5 154 182 2/82013 275 91% 5.8 6.3 153 2/8 182 3/8
Total/Avg 3,243 86% 6.1 6.3 151 2/8 189 6/8
* Includes Rocky Mtn and hybrid Desert/Rocky Rams harvested in Unit 131
8300Desert Bighorn Hunt Data
0
1
2
3
4
5
6
7
8
0
50
100
150
200
250
300
1994 1996 1998 2000 2002 2004 2006 2008* 2010* 2012
Ave
rag
e R
am
Ag
e
# o
f Ta
gs
YEAR
# Tags Age
A-40
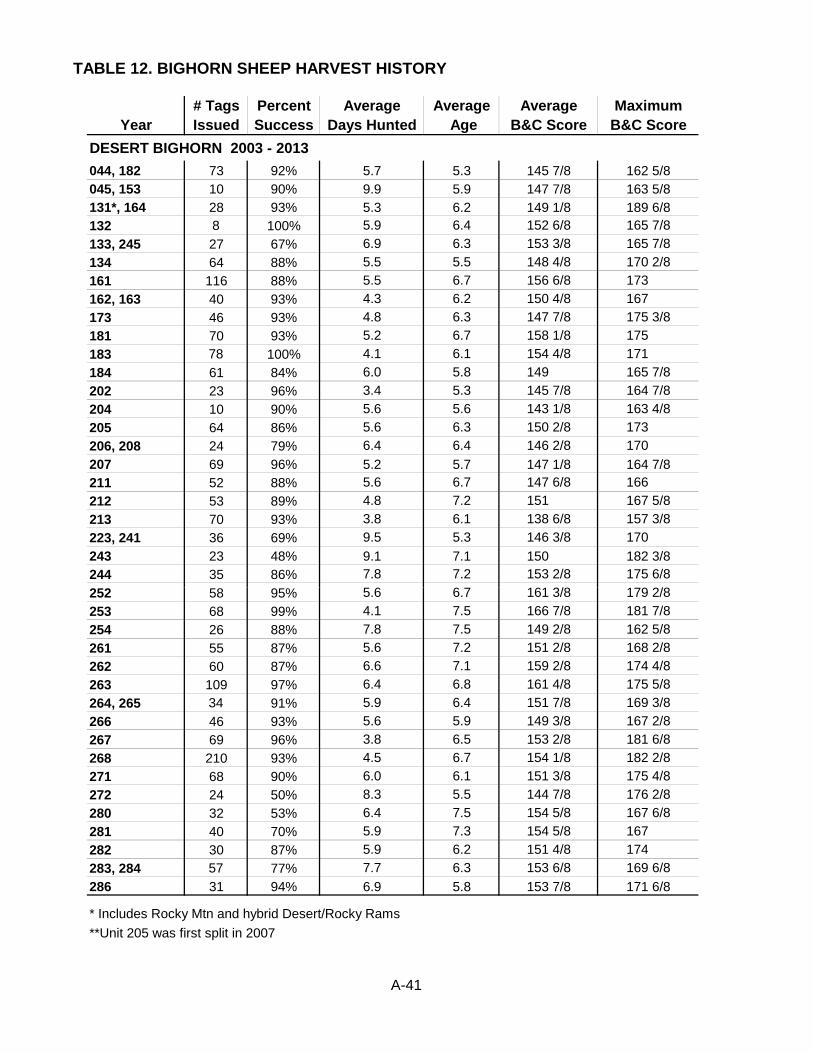
TABLE 12. BIGHORN SHEEP HARVEST HISTORY
# Tags Percent Average Average Average MaximumYear Issued Success Days Hunted Age B&C Score B&C Score
DESERT BIGHORN 2003 - 2013
044, 182 73 92% 5.7 5.3 145 7/8 162 5/8045, 153 10 90% 9.9 5.9 147 7/8 163 5/8131*, 164 28 93% 5.3 6.2 149 1/8 189 6/8132 8 100% 5.9 6.4 152 6/8 165 7/8
133, 245 27 67% 6.9 6.3 153 3/8 165 7/8
134 64 88% 5.5 5.5 148 4/8 170 2/8
161 116 88% 5.5 6.7 156 6/8 173
162, 163 40 93% 4.3 6.2 150 4/8 167
173 46 93% 4.8 6.3 147 7/8 175 3/8
181 70 93% 5.2 6.7 158 1/8 175
183 78 100% 4.1 6.1 154 4/8 171
184 61 84% 6.0 5.8 149 165 7/8
202 23 96% 3.4 5.3 145 7/8 164 7/8
204 10 90% 5.6 5.6 143 1/8 163 4/8
205 64 86% 5.6 6.3 150 2/8 173
206, 208 24 79% 6.4 6.4 146 2/8 170
207 69 96% 5.2 5.7 147 1/8 164 7/8211 52 88% 5.6 6.7 147 6/8 166
212 53 89% 4.8 7.2 151 167 5/8
213 70 93% 3.8 6.1 138 6/8 157 3/8
223, 241 36 69% 9.5 5.3 146 3/8 170
243 23 48% 9.1 7.1 150 182 3/8244 35 86% 7.8 7.2 153 2/8 175 6/8
5 6 6 7 161 3/8 179 2/8252 58 95% 5.6 6.7 161 3/8 179 2/8
253 68 99% 4.1 7.5 166 7/8 181 7/8
254 26 88% 7.8 7.5 149 2/8 162 5/8
261 55 87% 5.6 7.2 151 2/8 168 2/8
262 60 87% 6.6 7.1 159 2/8 174 4/8
263 109 97% 6.4 6.8 161 4/8 175 5/8
264, 265 34 91% 5.9 6.4 151 7/8 169 3/8
266 46 93% 5.6 5.9 149 3/8 167 2/8
267 69 96% 3.8 6.5 153 2/8 181 6/8
268 210 93% 4.5 6.7 154 1/8 182 2/8
271 68 90% 6.0 6.1 151 3/8 175 4/8
272 24 50% 8.3 5.5 144 7/8 176 2/8
280 32 53% 6.4 7.5 154 5/8 167 6/8
281 40 70% 5.9 7.3 154 5/8 167
282 30 87% 5.9 6.2 151 4/8 174
283, 284 57 77% 7.7 6.3 153 6/8 169 6/8
286 31 94% 6.9 5.8 153 7/8 171 6/8
* Includes Rocky Mtn and hybrid Desert/Rocky Rams
**Unit 205 was first split in 2007
A-41
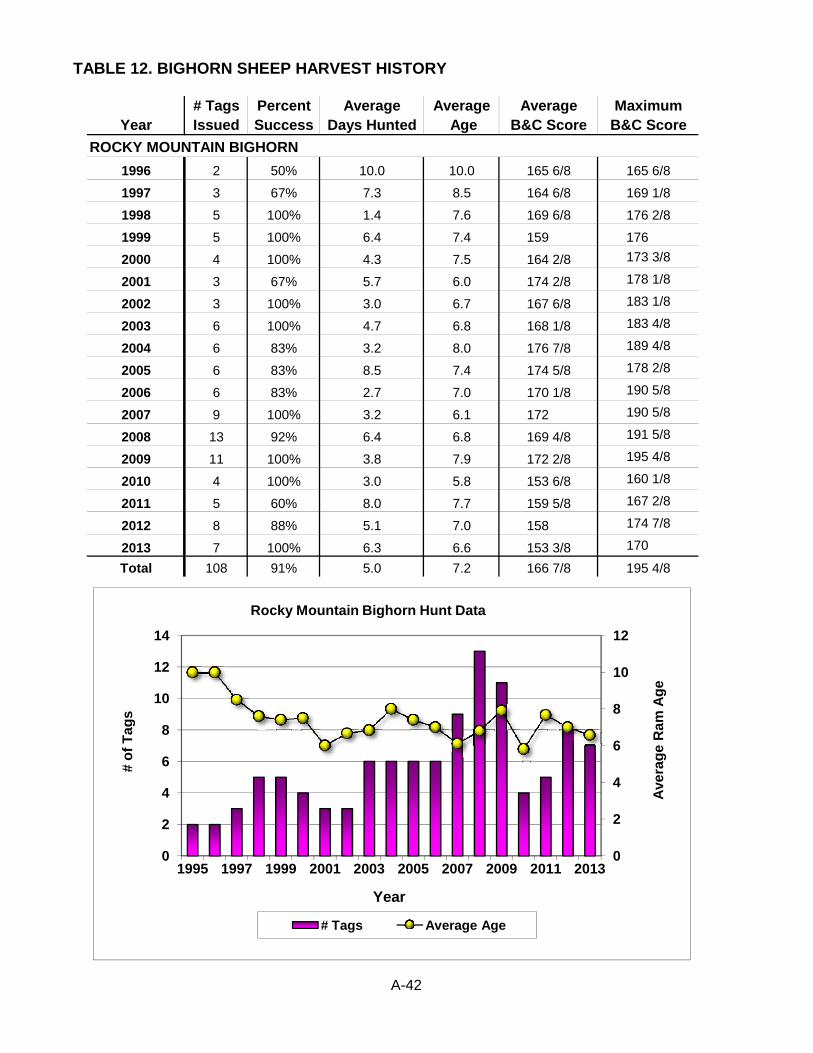
TABLE 12. BIGHORN SHEEP HARVEST HISTORY
# Tags Percent Average Average Average MaximumYear Issued Success Days Hunted Age B&C Score B&C Score
ROCKY MOUNTAIN BIGHORN
1996 2 50% 10.0 10.0 165 6/8 165 6/8
1997 3 67% 7.3 8.5 164 6/8 169 1/8
1998 5 100% 1.4 7.6 169 6/8 176 2/8
1999 5 100% 6.4 7.4 159 176
2000 4 100% 4.3 7.5 164 2/8 173 3/8
2001 3 67% 5.7 6.0 174 2/8 178 1/8
2002 3 100% 3.0 6.7 167 6/8 183 1/8
2003 6 100% 4.7 6.8 168 1/8 183 4/8
2004 6 83% 3.2 8.0 176 7/8 189 4/8
2005 6 83% 8.5 7.4 174 5/8 178 2/8
2006 6 83% 2.7 7.0 170 1/8 190 5/8
2007 9 100% 3.2 6.1 172 190 5/8
2008 13 92% 6.4 6.8 169 4/8 191 5/8
2009 11 100% 3.8 7.9 172 2/8 195 4/8
2010 4 100% 3.0 5.8 153 6/8 160 1/8
2011 5 60% 8.0 7.7 159 5/8 167 2/8
2012 8 88% 5.1 7.0 158 174 7/8
2013 7 100% 6.3 6.6 153 3/8 170
Total 108 91% 5.0 7.2 166 7/8 195 4/8
0
2
4
6
8
10
12
0
2
4
6
8
10
12
14
1995 1997 1999 2001 2003 2005 2007 2009 2011 2013
Ave
rag
e R
am A
ge
# o
f T
ags
Year
Rocky Mountain Bighorn Hunt Data
# Tags Average Age
A-42
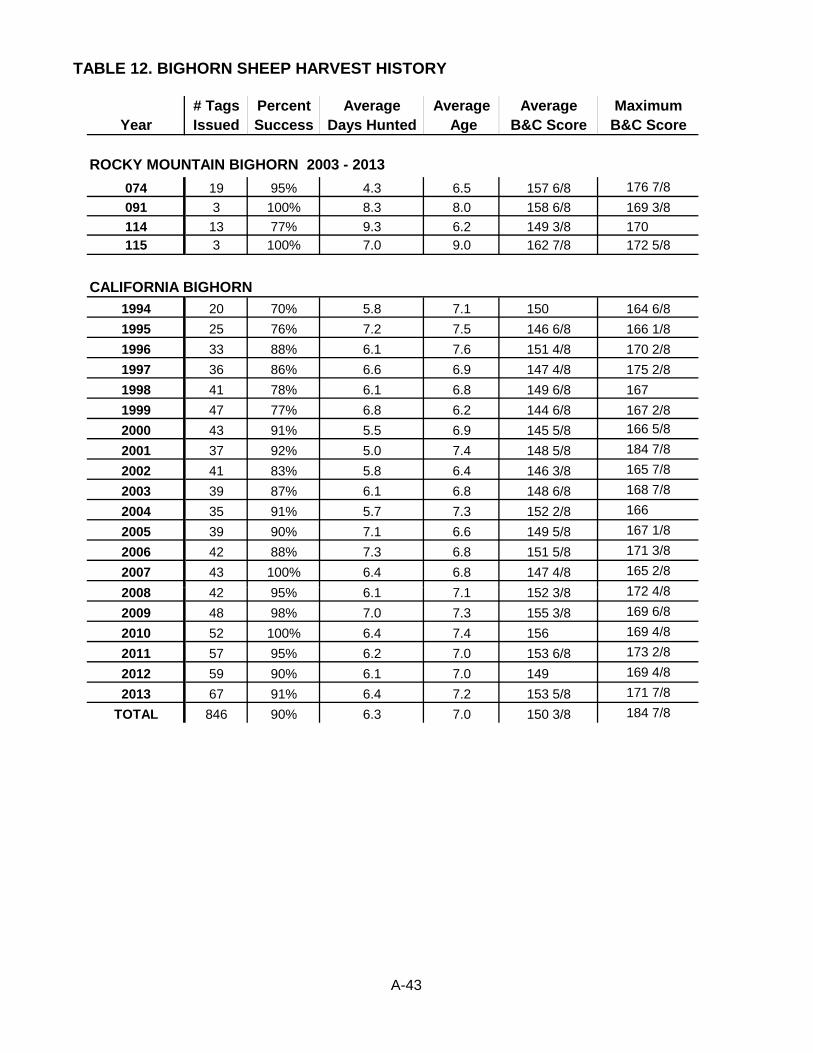
TABLE 12. BIGHORN SHEEP HARVEST HISTORY
# Tags Percent Average Average Average MaximumYear Issued Success Days Hunted Age B&C Score B&C Score
ROCKY MOUNTAIN BIGHORN 2003 - 2013
074 19 95% 4.3 6.5 157 6/8 176 7/8
091 3 100% 8.3 8.0 158 6/8 169 3/8
114 13 77% 9.3 6.2 149 3/8 170115 3 100% 7.0 9.0 162 7/8 172 5/8
1994 20 70% 5.8 7.1 150 164 6/8
1995 25 76% 7.2 7.5 146 6/8 166 1/8
1996 33 88% 6.1 7.6 151 4/8 170 2/8
1997 36 86% 6.6 6.9 147 4/8 175 2/8
1998 41 78% 6.1 6.8 149 6/8 167
1999 47 77% 6.8 6.2 144 6/8 167 2/8
2000 43 91% 5.5 6.9 145 5/8 166 5/8
2001 37 92% 5.0 7.4 148 5/8 184 7/8
2002 41 83% 5.8 6.4 146 3/8 165 7/8
2003 39 87% 6.1 6.8 148 6/8 168 7/8
2004 35 91% 5.7 7.3 152 2/8 166
2005 39 90% 7.1 6.6 149 5/8 167 1/8
2006 42 88% 7.3 6.8 151 5/8 171 3/8
2007 43 100% 6.4 6.8 147 4/8 165 2/8
2008 42 9 % 6 1 1 1 2 3/8 172 4/8
CALIFORNIA BIGHORN
2008 42 95% 6.1 7.1 152 3/8 172 4/8
2009 48 98% 7.0 7.3 155 3/8 169 6/8
2010 52 100% 6.4 7.4 156 169 4/8
2011 57 95% 6.2 7.0 153 6/8 173 2/8
2012 59 90% 6.1 7.0 149 169 4/8
2013 67 91% 6.4 7.2 153 5/8 171 7/8
TOTAL 846 90% 6.3 7.0 150 3/8 184 7/8
A-43
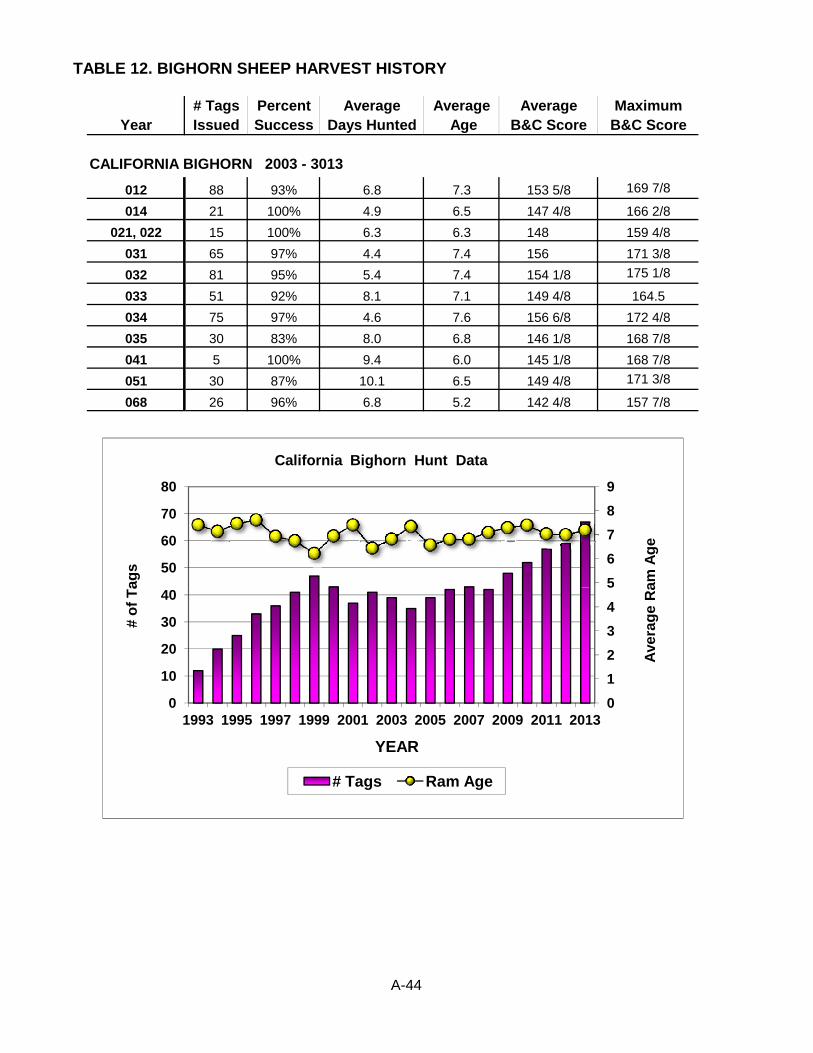
TABLE 12. BIGHORN SHEEP HARVEST HISTORY
# Tags Percent Average Average Average MaximumYear Issued Success Days Hunted Age B&C Score B&C Score
012 88 93% 6.8 7.3 153 5/8 169 7/8
014 21 100% 4.9 6.5 147 4/8 166 2/8
021, 022 15 100% 6.3 6.3 148 159 4/8
031 65 97% 4.4 7.4 156 171 3/8
032 81 95% 5.4 7.4 154 1/8 175 1/8
033 51 92% 8.1 7.1 149 4/8 164.5
034 75 97% 4.6 7.6 156 6/8 172 4/8
035 30 83% 8.0 6.8 146 1/8 168 7/8
041 5 100% 9.4 6.0 145 1/8 168 7/8
051 30 87% 10.1 6.5 149 4/8 171 3/8
068 26 96% 6.8 5.2 142 4/8 157 7/8
CALIFORNIA BIGHORN 2003 - 3013
5
6
7
8
9
50
60
70
80
am A
ge
ags
California Bighorn Hunt Data
0
1
2
3
4
5
0
10
20
30
40
1993 1995 1997 1999 2001 2003 2005 2007 2009 2011 2013
Ave
rag
e R
a
# o
f T
a
YEAR
# Tags Ram Age
A-44

TABLE 13. 2013 MOUNTAIN GOAT HUNT RESULTS BY HUNT AND UNIT GROUP
# % # Succ. % Hunter
UNIT GROUP Apps Tags Returns Returns Hunters Success
RESIDENT MOUNTAIN GOAT HUNT 7151
101 1,523 2 762 to 1 2 100% 1 50%
102 1,920 4 480 to 1 4 100% 4 100%
103 562 1 562 to 1 1 100% 1 100%
TOTAL 4,005 7 573 to 1 7 100% 6 86%
Draw Odds - # of "Apps" divided by Total Quota for the 1st draw
% Return - Percent of hunter return records received compared to total tags sold
Draw Odds
% Hunter Success - based on # of successful hunters divided by Tags Sold (includes did not hunts; a portion of nonreturns are assumed to be successful based on past trends of hunt results records not yet returned)
Apps - # of unsuccessful 1st choice applicants plus successful 1st - 5th choice applicants for given unit group
A-45 Updated 3/4/14
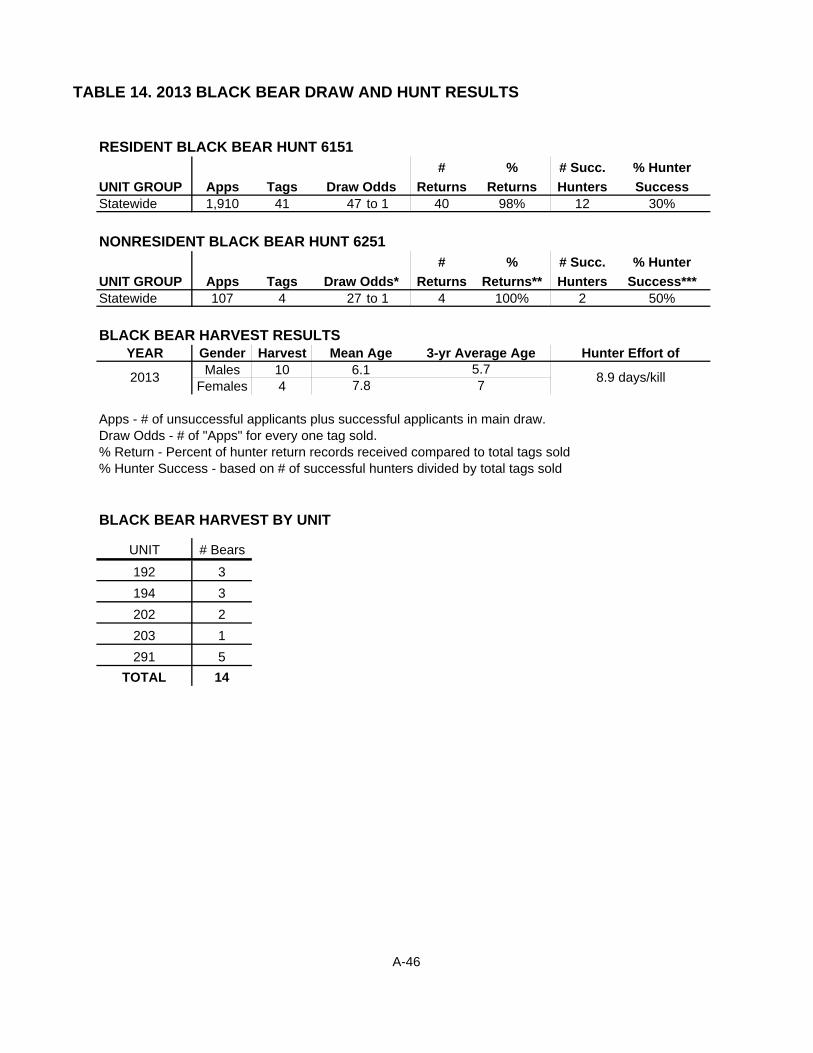
TABLE 14. 2013 BLACK BEAR DRAW AND HUNT RESULTS
RESIDENT BLACK BEAR HUNT 6151
# % # Succ. % Hunter
UNIT GROUP Apps Tags Returns Returns Hunters SuccessStatewide 1,910 41 47 to 1 40 98% 12 30%
NONRESIDENT BLACK BEAR HUNT 6251
# % # Succ. % Hunter
UNIT GROUP Apps Tags Returns Returns** Hunters Success***Statewide 107 4 27 to 1 4 100% 2 50%
BLACK BEAR HARVEST RESULTSYEAR Gender Harvest
Males 10Females 4
Apps - # of unsuccessful applicants plus successful applicants in main draw.Draw Odds - # of "Apps" for every one tag sold.% Return - Percent of hunter return records received compared to total tags sold
BLACK BEAR HARVEST BY UNIT
UNIT # Bears
192 3
194 3
202 2
203 1
291 5
TOTAL 14
Draw Odds
% Hunter Success - based on # of successful hunters divided by total tags sold
2013
Hunter Effort of
8.9 days/kill
Mean Age6.17.8
3-yr Average Age
Draw Odds*
5.77
A-46
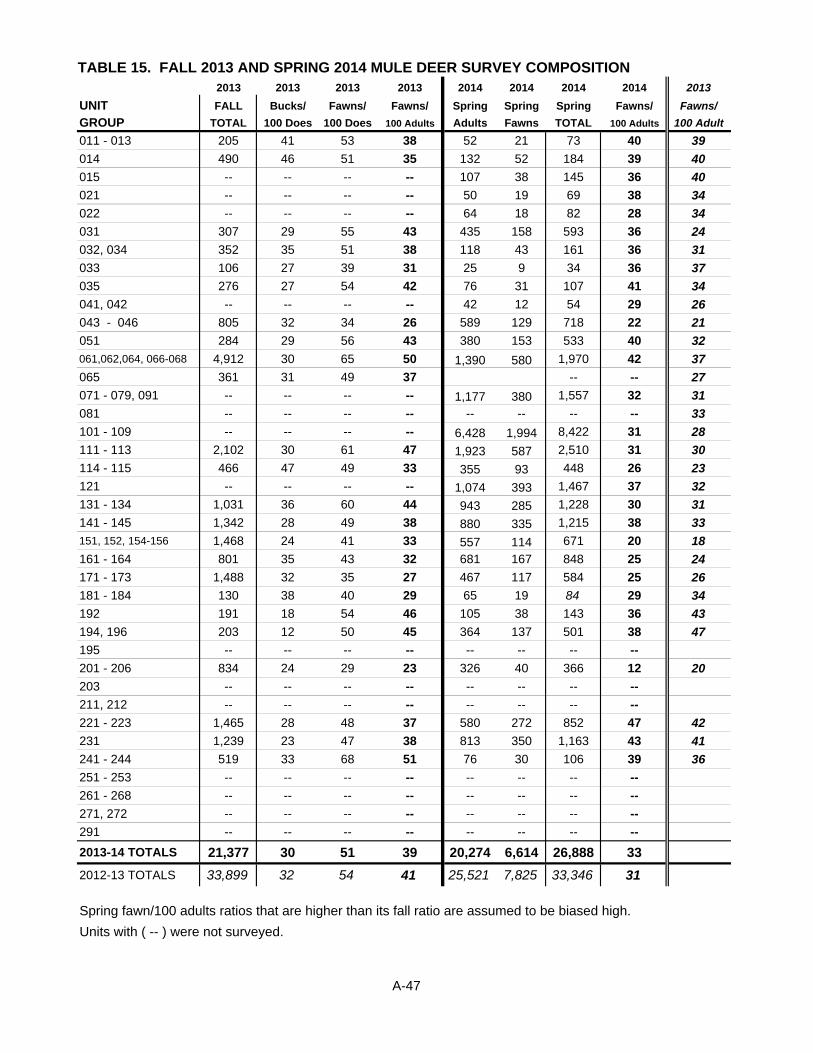
TABLE 15. FALL 2013 AND SPRING 2014 MULE DEER SURVEY COMPOSITION2013 2013 2013 2013 2014 2014 2014 2014 2013
UNIT FALL Bucks/ Fawns/ Fawns/ Spring Spring Spring Fawns/ Fawns/
GROUP TOTAL 100 Does 100 Does 100 Adults Adults Fawns TOTAL 100 Adults 100 Adult
011 - 013 205 41 53 38 52 21 73 40 39
014 490 46 51 35 132 52 184 39 40
015 -- -- -- -- 107 38 145 36 40
021 -- -- -- -- 50 19 69 38 34
022 -- -- -- -- 64 18 82 28 34
031 307 29 55 43 435 158 593 36 24
032, 034 352 35 51 38 118 43 161 36 31
033 106 27 39 31 25 9 34 36 37
035 276 27 54 42 76 31 107 41 34
041, 042 -- -- -- -- 42 12 54 29 26
043 - 046 805 32 34 26 589 129 718 22 21
051 284 29 56 43 380 153 533 40 32
061,062,064, 066-068 4,912 30 65 50 1,390 580 1,970 42 37
065 361 31 49 37 -- -- 27
071 - 079, 091 -- -- -- -- 1,177 380 1,557 32 31
081 -- -- -- -- -- -- -- -- 33
101 - 109 -- -- -- -- 6,428 1,994 8,422 31 28
111 - 113 2,102 30 61 47 1,923 587 2,510 31 30
114 - 115 466 47 49 33 355 93 448 26 23
121 -- -- -- -- 1,074 393 1,467 37 32
131 - 134 1,031 36 60 44 943 285 1,228 30 31
141 - 145 1,342 28 49 38 880 335 1,215 38 33
151, 152, 154-156 1,468 24 41 33 557 114 671 20 18
161 - 164 801 35 43 32 681 167 848 25 24
171 - 173 1,488 32 35 27 467 117 584 25 26
181 - 184 130 38 40 29 65 19 84 29 34
192 191 18 54 46 105 38 143 36 43
194, 196 203 12 50 45 364 137 501 38 47
195 -- -- -- -- -- -- -- --
201 - 206 834 24 29 23 326 40 366 12 20
203 -- -- -- -- -- -- -- --
211, 212 -- -- -- -- -- -- -- --
221 - 223 1,465 28 48 37 580 272 852 47 42
231 1,239 23 47 38 813 350 1,163 43 41
241 - 244 519 33 68 51 76 30 106 39 36
251 - 253 -- -- -- -- -- -- -- --
261 - 268 -- -- -- -- -- -- -- --
271, 272 -- -- -- -- -- -- -- --
291 -- -- -- -- -- -- -- --
2013-14 TOTALS 21,377 30 51 39 20,274 6,614 26,888 33
2012-13 TOTALS 33,899 32 54 41 25,521 7,825 33,346 31
Spring fawn/100 adults ratios that are higher than its fall ratio are assumed to be biased high.
Units with ( -- ) were not surveyed.
A-47
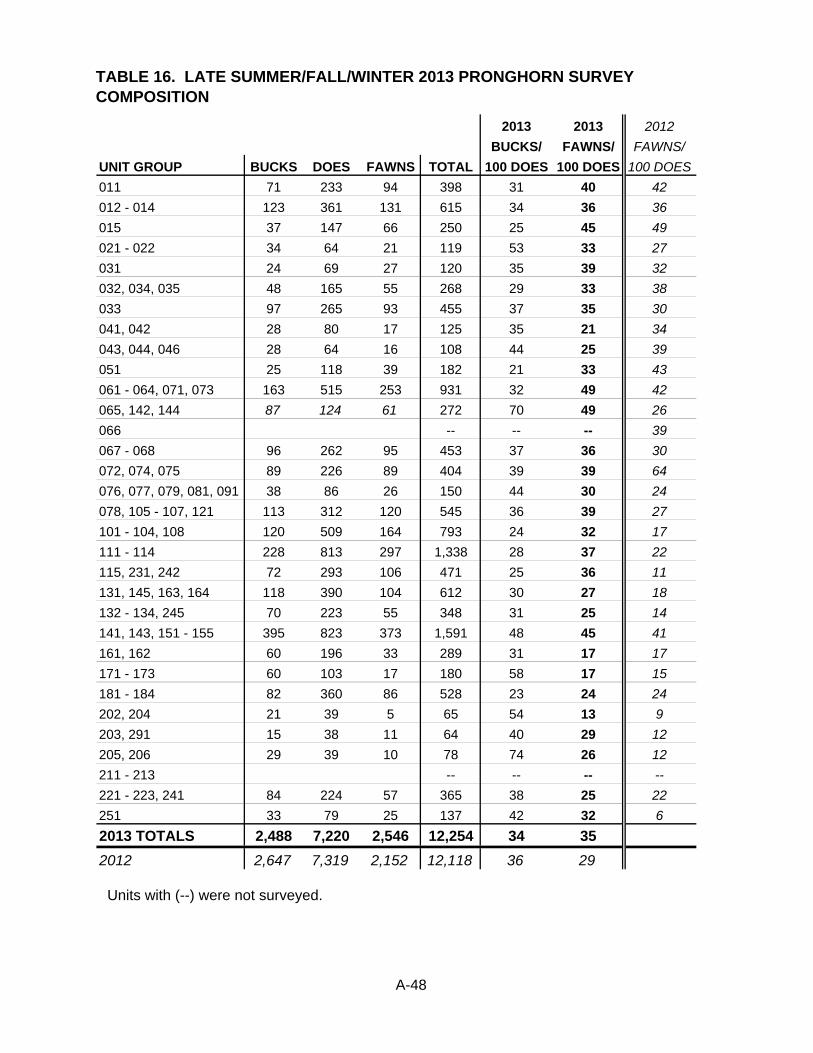
TABLE 16. LATE SUMMER/FALL/WINTER 2013 PRONGHORN SURVEY COMPOSITION
2013 2013 2012
BUCKS/ FAWNS/ FAWNS/
UNIT GROUP BUCKS DOES FAWNS TOTAL 100 DOES 100 DOES 100 DOES
011 71 233 94 398 31 40 42
012 - 014 123 361 131 615 34 36 36
015 37 147 66 250 25 45 49
021 - 022 34 64 21 119 53 33 27
031 24 69 27 120 35 39 32
032, 034, 035 48 165 55 268 29 33 38
033 97 265 93 455 37 35 30
041, 042 28 80 17 125 35 21 34
043, 044, 046 28 64 16 108 44 25 39
051 25 118 39 182 21 33 43
061 - 064, 071, 073 163 515 253 931 32 49 42
065, 142, 144 87 124 61 272 70 49 26
066 -- -- -- 39
067 - 068 96 262 95 453 37 36 30
072, 074, 075 89 226 89 404 39 39 64
076, 077, 079, 081, 091 38 86 26 150 44 30 24
078, 105 - 107, 121 113 312 120 545 36 39 27
101 - 104, 108 120 509 164 793 24 32 17
111 - 114 228 813 297 1,338 28 37 22
115, 231, 242 72 293 106 471 25 36 11
131, 145, 163, 164 118 390 104 612 30 27 18
132 - 134, 245 70 223 55 348 31 25 14
141, 143, 151 - 155 395 823 373 1,591 48 45 41
161, 162 60 196 33 289 31 17 17
171 - 173 60 103 17 180 58 17 15
181 - 184 82 360 86 528 23 24 24
202, 204 21 39 5 65 54 13 9
203, 291 15 38 11 64 40 29 12
205, 206 29 39 10 78 74 26 12
211 - 213 -- -- -- --
221 - 223, 241 84 224 57 365 38 25 22
251 33 79 25 137 42 32 6
2013 TOTALS 2,488 7,220 2,546 12,254 34 35
2012 2,647 7,319 2,152 12,118 36 29
Units with (--) were not surveyed.
A-48
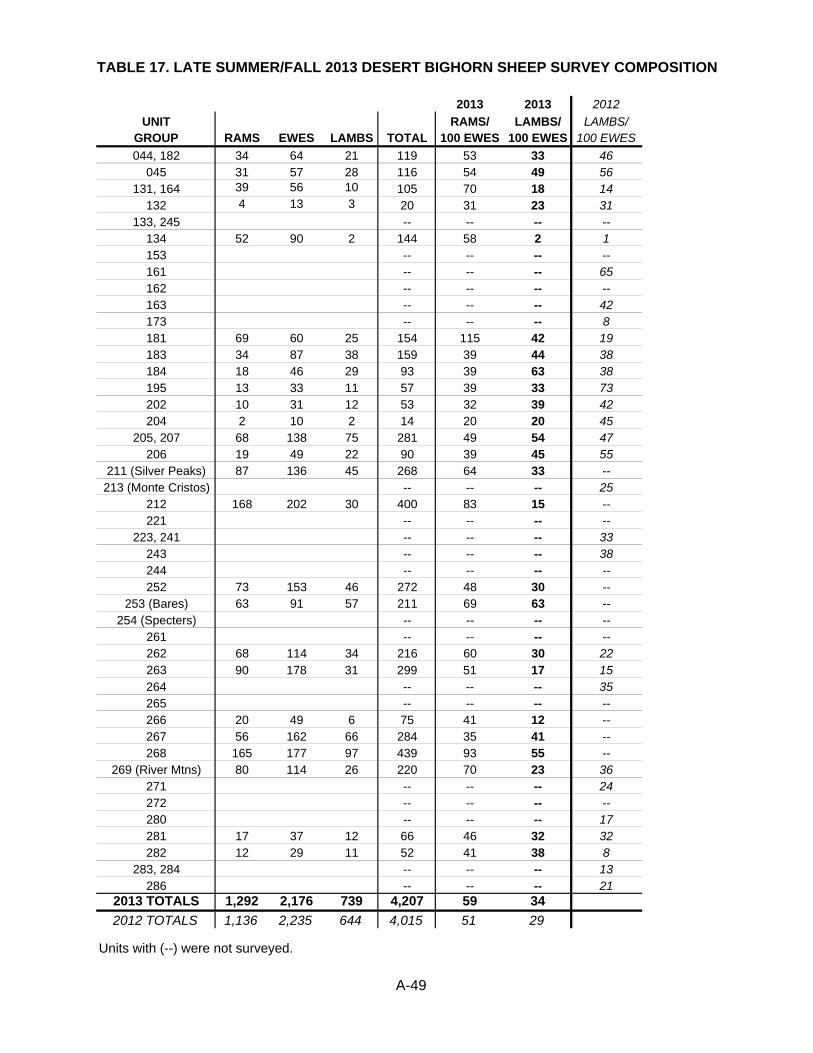
TABLE 17. LATE SUMMER/FALL 2013 DESERT BIGHORN SHEEP SURVEY COMPOSITION
2013 2013 2012
UNIT RAMS/ LAMBS/ LAMBS/GROUP RAMS EWES LAMBS TOTAL 100 EWES 100 EWES 100 EWES
044, 182 34 64 21 119 53 33 46045 31 57 28 116 54 49 56
131, 164 39 56 10 105 70 18 14132 4 13 3 20 31 23 31
133, 245 -- -- -- --134 52 90 2 144 58 2 1153 -- -- -- --161 -- -- -- 65162 -- -- -- --163 -- -- -- 42173 -- -- -- 8181 69 60 25 154 115 42 19183 34 87 38 159 39 44 38184 18 46 29 93 39 63 38195 13 33 11 57 39 33 73202 10 31 12 53 32 39 42204 2 10 2 14 20 20 45
205, 207 68 138 75 281 49 54 47206 19 49 22 90 39 45 55
211 (Silver Peaks) 87 136 45 268 64 33 --213 (Monte Cristos) -- -- -- 25
212 168 202 30 400 83 15 --221 -- -- -- --
223, 241 -- -- -- 33243 -- -- -- 38244 -- -- -- --252 73 153 46 272 48 30 --
253 (Bares) 63 91 57 211 69 63 --254 (Specters) -- -- -- --
261 -- -- -- --262 68 114 34 216 60 30 22263 90 178 31 299 51 17 15264 -- -- -- 35265 -- -- -- --266 20 49 6 75 41 12 --267 56 162 66 284 35 41 --268 165 177 97 439 93 55 --
269 (River Mtns) 80 114 26 220 70 23 36271 -- -- -- 24272 -- -- -- --280 -- -- -- 17281 17 37 12 66 46 32 32282 12 29 11 52 41 38 8
283, 284 -- -- -- 13286 -- -- -- 21
2013 TOTALS 1,292 2,176 739 4,207 59 34
2012 TOTALS 1,136 2,235 644 4,015 51 29
Units with (--) were not surveyed.
A-49

2013 2013 2012
RAMS/ LAMBS/ LAMBS/
UNIT GROUP RAMS EWES LAMBS TOTAL 100 EWES 100 EWES 100 EWES
011, 013 11 20 6 37 55 30 59
012 14 72 19 105 19 26 30
014 4 27 11 42 15 41 42
021, 022 10 40 17 67 25 43 51
031 16 75 27 118 21 36 41
032 48 97 37 182 50 38 47
033 9 18 7 34 50 39 17
034 27 63 31 121 43 49 38
035 6 53 23 82 11 43 62
041 9 6 3 18 150 50 73
051 24 69 39 132 35 57 59
066 -- -- -- -- -- -- --
068 15 40 7 62 38 18 27
2013 TOTALS 193 580 227 1000 33 39
2012 TOTALS 252 542 229 1,023 46 42
2013-14 2013-14 2012-13
RAMS/ LAMBS/ LAMBS/
UNIT GROUP RAMS EWES LAMBS TOTAL 100 EWES 100 EWES 100 EWES
074 8 19 11 38 42 58 50
091 10 27 2 39 37 7 4
101 -- -- -- -- -- -- --
102 -- -- -- -- -- -- --
114 13 24 9 46 54 38 23
115 8 14 5 27 57 36 46
2013-14 TOTALS 39 84 27 150 46 322012-13 TOTALS 40 68 16 124 59 24
Units with (--) were not surveyed.
TABLE 19. SUMMER/WINTER/EARLY SPRING 2013 - 2014 ROCKY MOUNTAIN BIGHORN SHEEP SURVEY COMPOSITION
TABLE 18. LATE SUMMER/FALL 2013 CALIFORNIA BIGHORN SHEEP SURVEY COMPOSITION
A-50
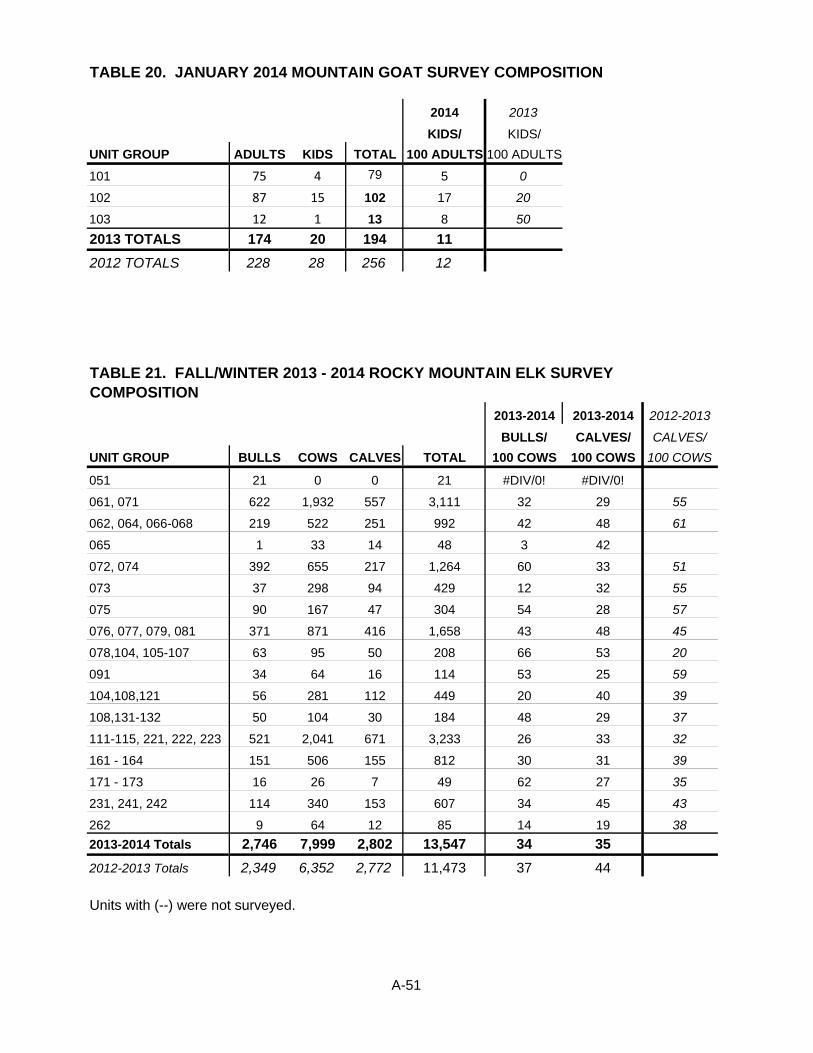
TABLE 20. JANUARY 2014 MOUNTAIN GOAT SURVEY COMPOSITION
2014 2013
KIDS/ KIDS/
UNIT GROUP ADULTS KIDS TOTAL 100 ADULTS 100 ADULTS
101 75 4 79 5 0
102 87 15 102 17 20
103 12 1 13 8 50
2013 TOTALS 174 20 194 11
2012 TOTALS 228 28 256 12
2013-2014 2013-2014 2012-2013
BULLS/ CALVES/ CALVES/
UNIT GROUP BULLS COWS CALVES TOTAL 100 COWS 100 COWS 100 COWS
051 21 0 0 21 #DIV/0! #DIV/0!
061, 071 622 1,932 557 3,111 32 29 55
062, 064, 066-068 219 522 251 992 42 48 61
065 1 33 14 48 3 42
072, 074 392 655 217 1,264 60 33 51
073 37 298 94 429 12 32 55
075 90 167 47 304 54 28 57
076, 077, 079, 081 371 871 416 1,658 43 48 45
078,104, 105-107 63 95 50 208 66 53 20
091 34 64 16 114 53 25 59
104,108,121 56 281 112 449 20 40 39
108,131-132 50 104 30 184 48 29 37
111-115, 221, 222, 223 521 2,041 671 3,233 26 33 32
161 - 164 151 506 155 812 30 31 39
171 - 173 16 26 7 49 62 27 35
231, 241, 242 114 340 153 607 34 45 43
262 9 64 12 85 14 19 38
2013-2014 Totals 2,746 7,999 2,802 13,547 34 35
2012-2013 Totals 2,349 6,352 2,772 11,473 37 44
Units with (--) were not surveyed.
TABLE 21. FALL/WINTER 2013 - 2014 ROCKY MOUNTAIN ELK SURVEY COMPOSITION
A-51

TABLE 22. 2014 MULE DEER POPULATION ESTIMATES
2014 2013UNIT GROUP ESTIMATE* ESTIMATE*
011 - 013 2,000 2,100
014 1,600 1,500
015** 290 280
021** 410 360
022 730 660
031 1,800 1,800
032*** 1,100 1,200
033 950 950
034*** 300 300
035 840 850
041, 042*** 750 800
043 - 046 2,700 3,200
051 2,800 3,000
061,062,064, 066 - 068 9,800 9,900
065 750 700
071 - 079, 091 13,000 13,000
081 900 900
101 - 108 24,000 23,000
111 - 113 4,600 4,400
114 - 115 1,600 1,600
121 2,500 2,500
131 - 134 3,900 3,500
141 - 145 3,900 4,200
151, 152 ,154, 155 3,200 3,900
161 - 164 4,200 3,900
171 - 173 4,100 4,400
181 - 184 1,500 1,500
192** 390 370
194, 196** 950 850
195 500 500
201, 204 ** 750 900
202, 205 - 208 ** 600 700
203 600 650
211, 213 400 400
221 - 223 4,100 4,300
231 3,300 3,300
241 - 245 860 800
251 - 254 400 400
A-52

TABLE 22. 2014 MULE DEER POPULATION ESTIMATES
261 - 268 400 400
271, 272 240 240
291 600 500
TOTAL 108,000 109,000
Percent Change -1%
**Estimate based on apportionment of an interstate herd***Estimate includes deer that primarily inhabit agricultural fields
TABLE 23. 2014 ROCKY MOUNTAIN ELK POPULATION ESTIMATES
2014 2013UNIT GROUP ESTIMATE* ESTIMATE*
061, 071 3,500 3,100
062, 064, 066 - 068 1,200 850
065 90 120
072, 073, 074 2,100 2,400
075 350 300
076, 077, 079, 081 2,100 1,800
078, 105 - 107, 109 370 390
091 300 320
104, 108, 121 700 700
108, 131, 132 390 450
111 - 115, 221, 222, 223 4,500 4,500
145 50 40
161 - 164 950 800
171 - 173 110 100
231, 241, 242** 670 650
262 150 160TOTAL 17,500 16,500
Percent Change 6%
*Estimates - Values generated from computer models that reconstruct age and sex classes based on sampled herd composition, harvest data, and population demographic variables. The confidence limits around these estimates may be as high as + or - 20%.
*Estimates - Values generated from computer models that reconstruct age and sex classes based on sampled herd composition, harvest data, and population demographic variables. The confidence limits around these estimates may be as high as + or - 20%.
A-53
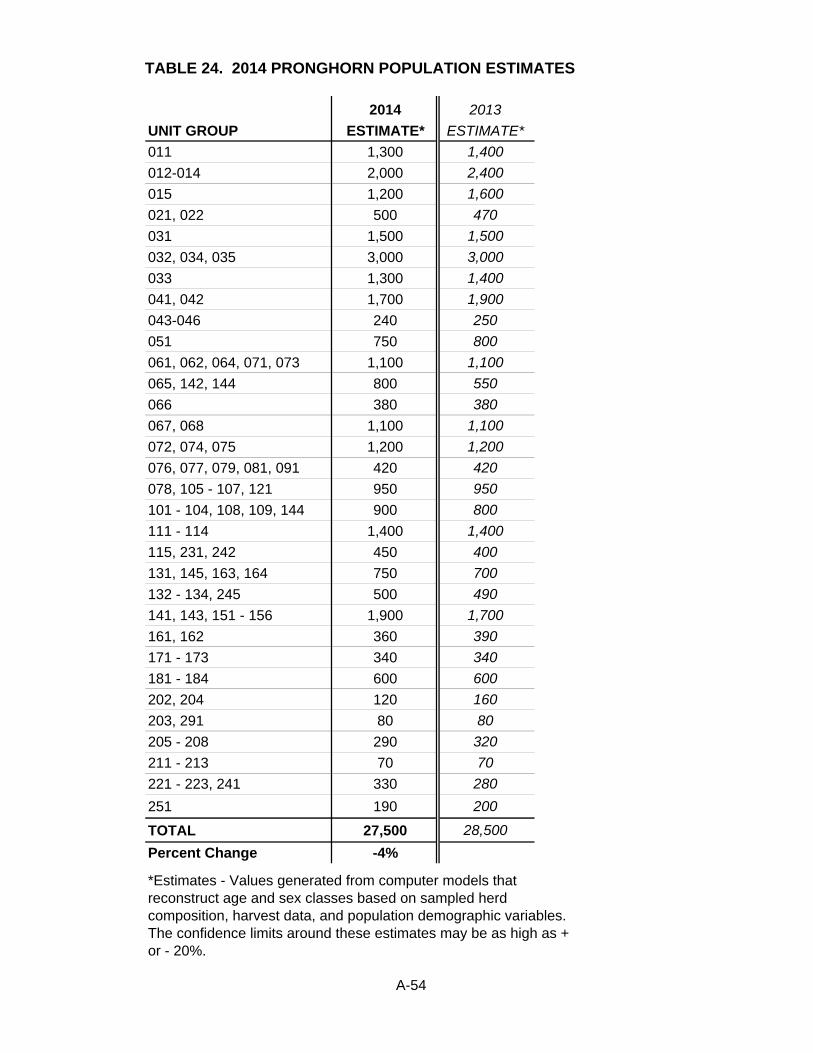
TABLE 24. 2014 PRONGHORN POPULATION ESTIMATES
2014 2013
UNIT GROUP ESTIMATE* ESTIMATE*
011 1,300 1,400
012-014 2,000 2,400
015 1,200 1,600
021, 022 500 470
031 1,500 1,500
032, 034, 035 3,000 3,000
033 1,300 1,400
041, 042 1,700 1,900
043-046 240 250
051 750 800
061, 062, 064, 071, 073 1,100 1,100
065, 142, 144 800 550
066 380 380
067, 068 1,100 1,100
072, 074, 075 1,200 1,200
076, 077, 079, 081, 091 420 420
078, 105 - 107, 121 950 950
101 - 104, 108, 109, 144 900 800
111 - 114 1,400 1,400
115, 231, 242 450 400
131, 145, 163, 164 750 700
132 - 134, 245 500 490
141, 143, 151 - 156 1,900 1,700
161, 162 360 390
171 - 173 340 340
181 - 184 600 600
202, 204 120 160
203, 291 80 80
205 - 208 290 320
211 - 213 70 70
221 - 223, 241 330 280
251 190 200
TOTAL 27,500 28,500
Percent Change -4%
*Estimates - Values generated from computer models that reconstruct age and sex classes based on sampled herd composition, harvest data, and population demographic variables. The confidence limits around these estimates may be as high as + or - 20%.
A-54
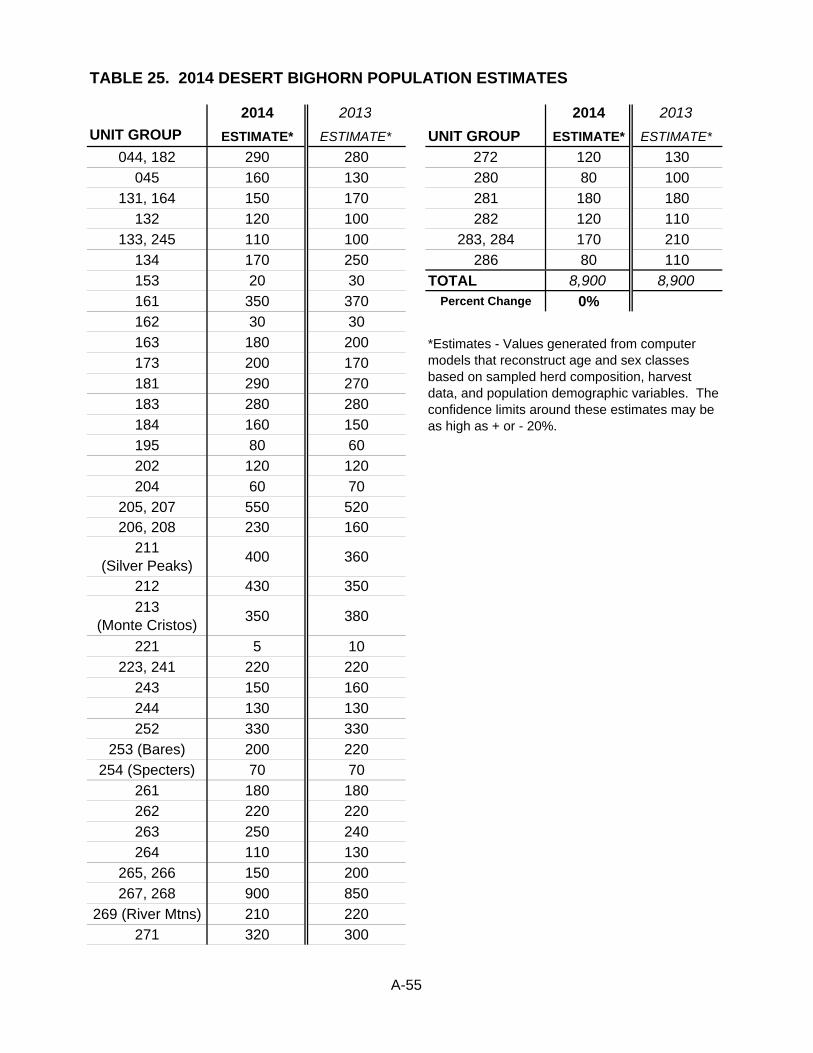
2014 2013 2014 2013
UNIT GROUP ESTIMATE* ESTIMATE* UNIT GROUP ESTIMATE* ESTIMATE*
044, 182 290 280 272 120 130
045 160 130 280 80 100
131, 164 150 170 281 180 180
132 120 100 282 120 110
133, 245 110 100 283, 284 170 210
134 170 250 286 80 110
153 20 30 TOTAL 8,900 8,900
161 350 370 Percent Change 0%162 30 30
163 180 200
173 200 170
181 290 270
183 280 280
184 160 150
195 80 60
202 120 120
204 60 70
205, 207 550 520206, 208 230 160
211 (Silver Peaks)
400 360
212 430 350
213 (Monte Cristos)
350 380
221 5 10
223, 241 220 220
243 150 160
244 130 130
252 330 330
253 (Bares) 200 220
254 (Specters) 70 70
261 180 180
262 220 220
263 250 240
264 110 130
265, 266 150 200
267, 268 900 850
269 (River Mtns) 210 220
271 320 300
TABLE 25. 2014 DESERT BIGHORN POPULATION ESTIMATES
*Estimates - Values generated from computer models that reconstruct age and sex classes based on sampled herd composition, harvest data, and population demographic variables. The confidence limits around these estimates may be as high as + or - 20%.
A-55
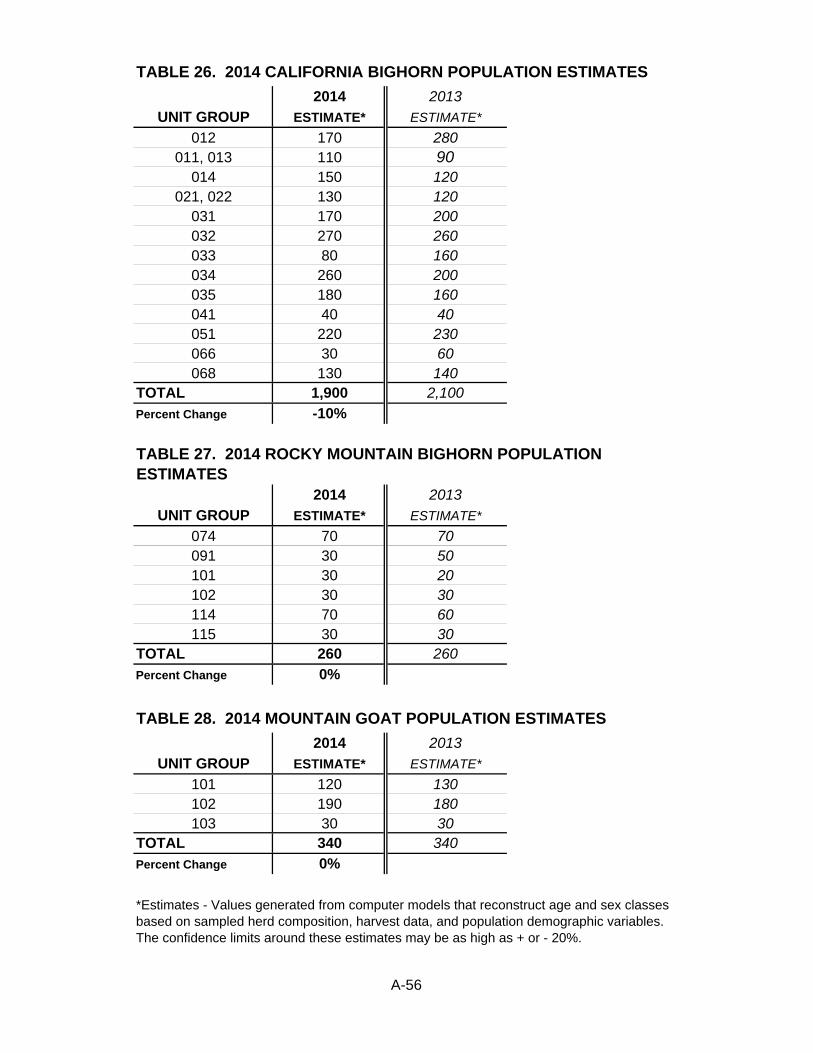
2014 2013
UNIT GROUP ESTIMATE* ESTIMATE*
012 170 280011, 013 110 90
014 150 120021, 022 130 120
031 170 200032 270 260033 80 160034 260 200035 180 160041 40 40051 220 230066 30 60068 130 140
TOTAL 1,900 2,100
Percent Change -10%
2014 2013
UNIT GROUP ESTIMATE* ESTIMATE*
074 70 70091 30 50101 30 20102 30 30114 70 60115 30 30
TOTAL 260 260
Percent Change 0%
2014 2013
UNIT GROUP ESTIMATE* ESTIMATE*
101 120 130102 190 180103 30 30
TOTAL 340 340
Percent Change 0%
*Estimates - Values generated from computer models that reconstruct age and sex classes based on sampled herd composition, harvest data, and population demographic variables. The confidence limits around these estimates may be as high as + or - 20%.
TABLE 26. 2014 CALIFORNIA BIGHORN POPULATION ESTIMATES
TABLE 27. 2014 ROCKY MOUNTAIN BIGHORN POPULATION ESTIMATES
TABLE 28. 2014 MOUNTAIN GOAT POPULATION ESTIMATES
A-56
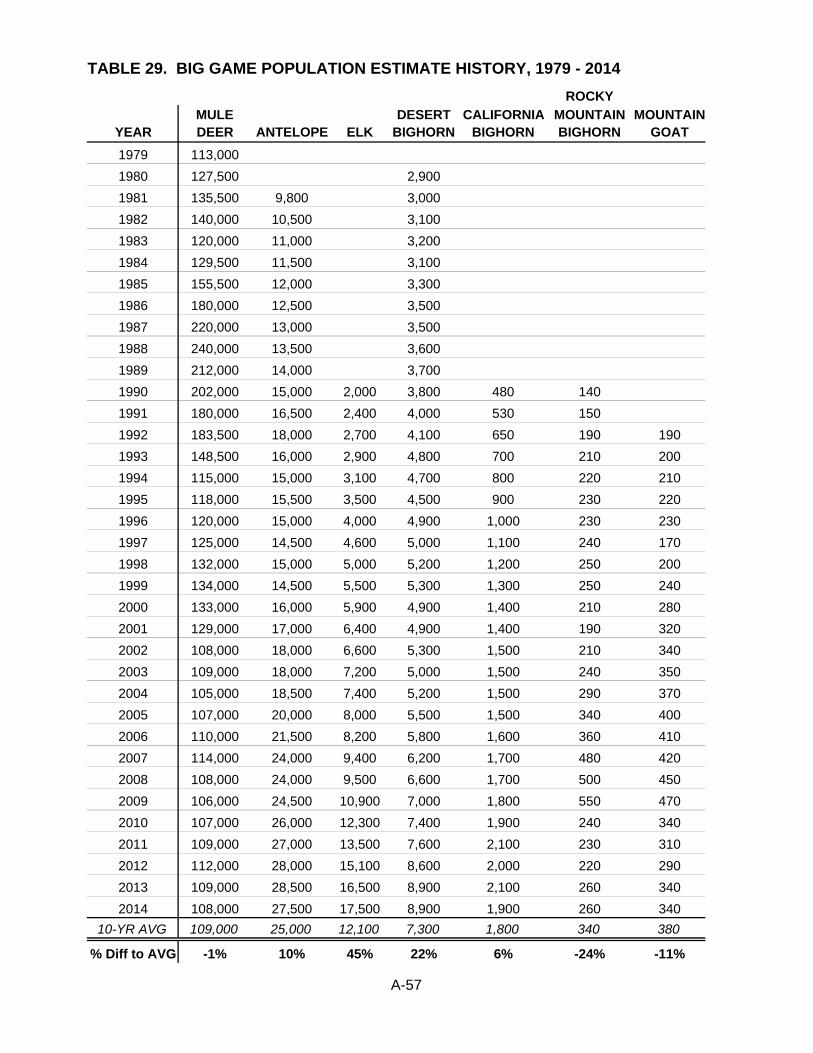
TABLE 29. BIG GAME POPULATION ESTIMATE HISTORY, 1979 - 2014
ROCKY
MULE DESERT CALIFORNIA MOUNTAIN MOUNTAINYEAR DEER ANTELOPE ELK BIGHORN BIGHORN BIGHORN GOAT
1979 113,000
1980 127,500 2,900
1981 135,500 9,800 3,000
1982 140,000 10,500 3,100
1983 120,000 11,000 3,200
1984 129,500 11,500 3,100
1985 155,500 12,000 3,300
1986 180,000 12,500 3,500
1987 220,000 13,000 3,500
1988 240,000 13,500 3,600
1989 212,000 14,000 3,700
1990 202,000 15,000 2,000 3,800 480 140
1991 180,000 16,500 2,400 4,000 530 150
1992 183,500 18,000 2,700 4,100 650 190 190
1993 148,500 16,000 2,900 4,800 700 210 200
1994 115,000 15,000 3,100 4,700 800 220 210
1995 118,000 15,500 3,500 4,500 900 230 220
1996 120,000 15,000 4,000 4,900 1,000 230 230
1997 125,000 14,500 4,600 5,000 1,100 240 170
1998 132,000 15,000 5,000 5,200 1,200 250 200
1999 134,000 14,500 5,500 5,300 1,300 250 240
2000 133,000 16,000 5,900 4,900 1,400 210 280
2001 129,000 17,000 6,400 4,900 1,400 190 320
2002 108,000 18,000 6,600 5,300 1,500 210 340
2003 109,000 18,000 7,200 5,000 1,500 240 350
2004 105,000 18,500 7,400 5,200 1,500 290 370
2005 107,000 20,000 8,000 5,500 1,500 340 400
2006 110,000 21,500 8,200 5,800 1,600 360 410
2007 114,000 24,000 9,400 6,200 1,700 480 420
2008 108,000 24,000 9,500 6,600 1,700 500 450
2009 106,000 24,500 10,900 7,000 1,800 550 470
2010 107,000 26,000 12,300 7,400 1,900 240 340
2011 109,000 27,000 13,500 7,600 2,100 230 310
2012 112,000 28,000 15,100 8,600 2,000 220 290
2013 109,000 28,500 16,500 8,900 2,100 260 340
2014 108,000 27,500 17,500 8,900 1,900 260 340
10-YR AVG 109,000 25,000 12,100 7,300 1,800 340 380
% Diff to AVG -1% 10% 45% 22% 6% -24% -11%
A-57
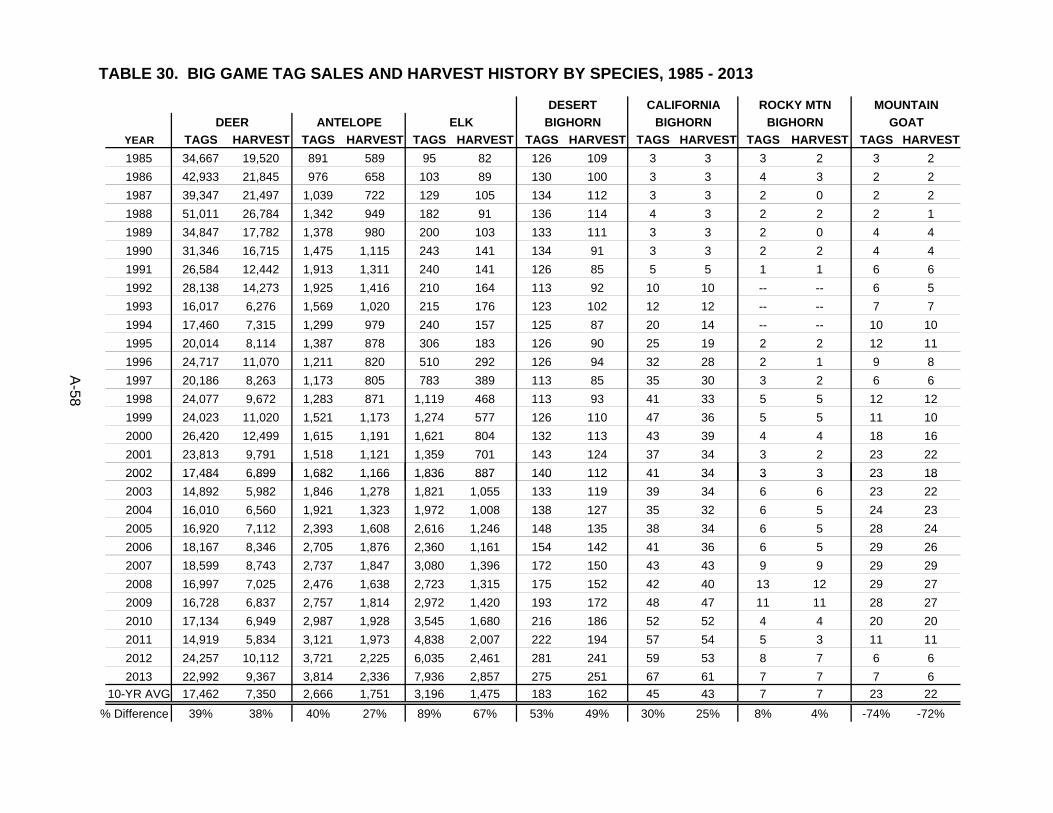
TABLE 30. BIG GAME TAG SALES AND HARVEST HISTORY BY SPECIES, 1985 - 2013
DEER ANTELOPE ELK
YEAR TAGS HARVEST TAGS HARVEST TAGS HARVEST TAGS HARVEST TAGS HARVEST TAGS HARVEST TAGS HARVEST
1985 34,667 19,520 891 589 95 82 126 109 3 3 3 2 3 2
1986 42,933 21,845 976 658 103 89 130 100 3 3 4 3 2 2
1987 39,347 21,497 1,039 722 129 105 134 112 3 3 2 0 2 2
1988 51,011 26,784 1,342 949 182 91 136 114 4 3 2 2 2 1
1989 34,847 17,782 1,378 980 200 103 133 111 3 3 2 0 4 4
1990 31,346 16,715 1,475 1,115 243 141 134 91 3 3 2 2 4 4
1991 26,584 12,442 1,913 1,311 240 141 126 85 5 5 1 1 6 6
1992 28,138 14,273 1,925 1,416 210 164 113 92 10 10 -- -- 6 5
1993 16,017 6,276 1,569 1,020 215 176 123 102 12 12 -- -- 7 7
1994 17,460 7,315 1,299 979 240 157 125 87 20 14 -- -- 10 10
1995 20,014 8,114 1,387 878 306 183 126 90 25 19 2 2 12 11
1996 24,717 11,070 1,211 820 510 292 126 94 32 28 2 1 9 8
1997 20,186 8,263 1,173 805 783 389 113 85 35 30 3 2 6 6
1998 24,077 9,672 1,283 871 1,119 468 113 93 41 33 5 5 12 12
1999 24,023 11,020 1,521 1,173 1,274 577 126 110 47 36 5 5 11 10
2000 26,420 12,499 1,615 1,191 1,621 804 132 113 43 39 4 4 18 16
2001 23,813 9,791 1,518 1,121 1,359 701 143 124 37 34 3 2 23 22
2002 17,484 6,899 1,682 1,166 1,836 887 140 112 41 34 3 3 23 18
BIGHORN
DESERT
BIGHORN GOAT
MOUNTAINCALIFORNIA ROCKY MTN
BIGHORN
A-58
2002 17,484 6,899 1,682 1,166 1,836 887 140 112 41 34 3 3 23 18
2003 14,892 5,982 1,846 1,278 1,821 1,055 133 119 39 34 6 6 23 22
2004 16,010 6,560 1,921 1,323 1,972 1,008 138 127 35 32 6 5 24 23
2005 16,920 7,112 2,393 1,608 2,616 1,246 148 135 38 34 6 5 28 24
2006 18,167 8,346 2,705 1,876 2,360 1,161 154 142 41 36 6 5 29 26
2007 18,599 8,743 2,737 1,847 3,080 1,396 172 150 43 43 9 9 29 29
2008 16,997 7,025 2,476 1,638 2,723 1,315 175 152 42 40 13 12 29 27
2009 16,728 6,837 2,757 1,814 2,972 1,420 193 172 48 47 11 11 28 27
2010 17,134 6,949 2,987 1,928 3,545 1,680 216 186 52 52 4 4 20 20
2011 14,919 5,834 3,121 1,973 4,838 2,007 222 194 57 54 5 3 11 11
2012 24,257 10,112 3,721 2,225 6,035 2,461 281 241 59 53 8 7 6 6
2013 22,992 9,367 3,814 2,336 7,936 2,857 275 251 67 61 7 7 7 6
10-YR AVG 17,462 7,350 2,666 1,751 3,196 1,475 183 162 45 43 7 7 23 22
% Difference 39% 38% 40% 27% 89% 67% 53% 49% 30% 25% 8% 4% -74% -72%
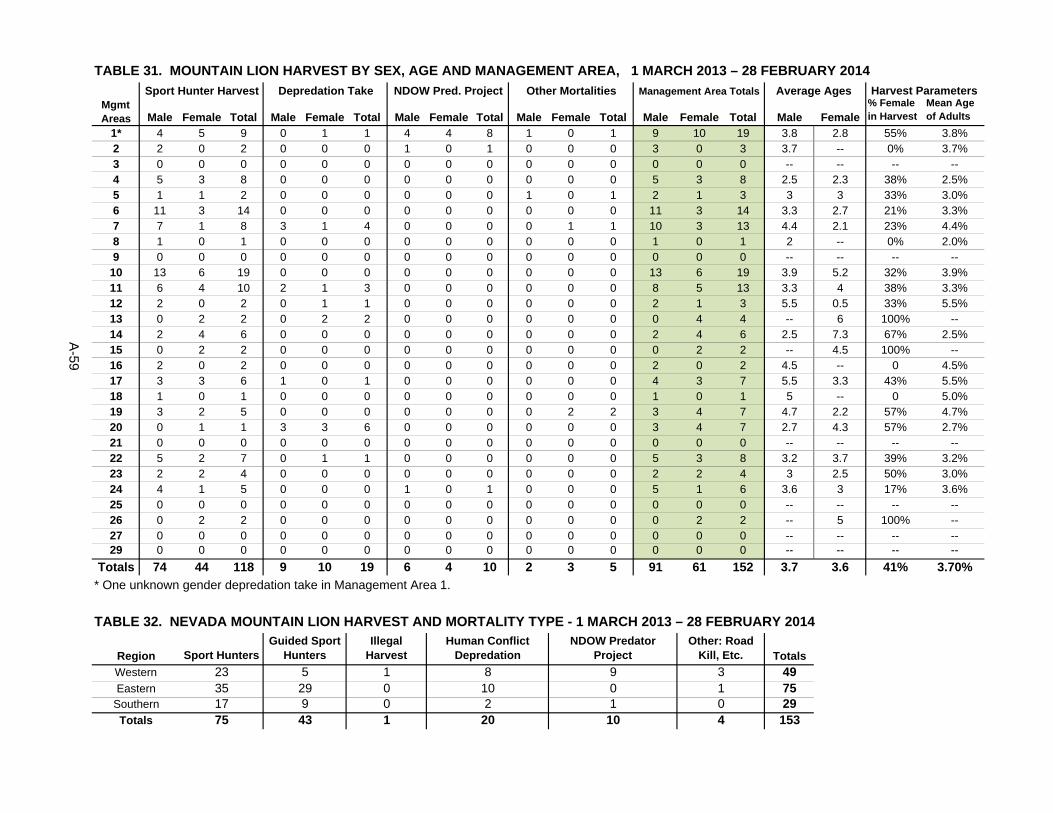
TABLE 31. MOUNTAIN LION HARVEST BY SEX, AGE AND MANAGEMENT AREA, 1 MARCH 2013 – 28 FEBRUARY 2014
Average Ages Harvest Parameters
Male Female Total Male Female Total Male Female Total Male Female Total Male Female Total Male Female% Female in Harvest
Mean Age of Adults
1* 4 5 9 0 1 1 4 4 8 1 0 1 9 10 19 3.8 2.8 55% 3.8%2 2 0 2 0 0 0 1 0 1 0 0 0 3 0 3 3.7 -- 0% 3.7%3 0 0 0 0 0 0 0 0 0 0 0 0 0 0 0 -- -- -- --4 5 3 8 0 0 0 0 0 0 0 0 0 5 3 8 2.5 2.3 38% 2.5%5 1 1 2 0 0 0 0 0 0 1 0 1 2 1 3 3 3 33% 3.0%6 11 3 14 0 0 0 0 0 0 0 0 0 11 3 14 3.3 2.7 21% 3.3%7 7 1 8 3 1 4 0 0 0 0 1 1 10 3 13 4.4 2.1 23% 4.4%8 1 0 1 0 0 0 0 0 0 0 0 0 1 0 1 2 -- 0% 2.0%9 0 0 0 0 0 0 0 0 0 0 0 0 0 0 0 -- -- -- --
10 13 6 19 0 0 0 0 0 0 0 0 0 13 6 19 3.9 5.2 32% 3.9%11 6 4 10 2 1 3 0 0 0 0 0 0 8 5 13 3.3 4 38% 3.3%12 2 0 2 0 1 1 0 0 0 0 0 0 2 1 3 5.5 0.5 33% 5.5%13 0 2 2 0 2 2 0 0 0 0 0 0 0 4 4 -- 6 100% --14 2 4 6 0 0 0 0 0 0 0 0 0 2 4 6 2.5 7.3 67% 2.5%15 0 2 2 0 0 0 0 0 0 0 0 0 0 2 2 -- 4.5 100% --16 2 0 2 0 0 0 0 0 0 0 0 0 2 0 2 4.5 -- 0 4.5%17 3 3 6 1 0 1 0 0 0 0 0 0 4 3 7 5.5 3.3 43% 5.5%18 1 0 1 0 0 0 0 0 0 0 0 0 1 0 1 5 -- 0 5.0%19 3 2 5 0 0 0 0 0 0 0 2 2 3 4 7 4.7 2.2 57% 4.7%20 0 1 1 3 3 6 0 0 0 0 0 0 3 4 7 2.7 4.3 57% 2.7%21 0 0 0 0 0 0 0 0 0 0 0 0 0 0 0 -- -- -- --22 5 2 7 0 1 1 0 0 0 0 0 0 5 3 8 3.2 3.7 39% 3.2%23 2 2 4 0 0 0 0 0 0 0 0 0 2 2 4 3 2.5 50% 3.0%24 4 1 5 0 0 0 1 0 1 0 0 0 5 1 6 3.6 3 17% 3.6%25 0 0 0 0 0 0 0 0 0 0 0 0 0 0 0 -- -- -- --26 0 2 2 0 0 0 0 0 0 0 0 0 0 2 2 -- 5 100% --27 0 0 0 0 0 0 0 0 0 0 0 0 0 0 0 -- -- -- --29 0 0 0 0 0 0 0 0 0 0 0 0 0 0 0 -- -- -- --
Totals 74 44 118 9 10 19 6 4 10 2 3 5 91 61 152 3.7 3.6 41% 3.70%
* One unknown gender depredation take in Management Area 1.
TABLE 32. NEVADA MOUNTAIN LION HARVEST AND MORTALITY TYPE - 1 MARCH 2013 – 28 FEBRUARY 2014
497529153
Sport Hunter Harvest Depredation Take NDOW Pred. Project Other Mortalities Management Area Totals
443 19
0
20
NDOW Predator Project
901
Illegal Harvest
75
Region
Western
EasternSouthern
Totals
Sport Hunters
233517
A-59
1
10
Totals
Mgmt Areas
0
Human Conflict Depredation
8102
Other: Road Kill, Etc.
310
Guided Sport Hunters
529
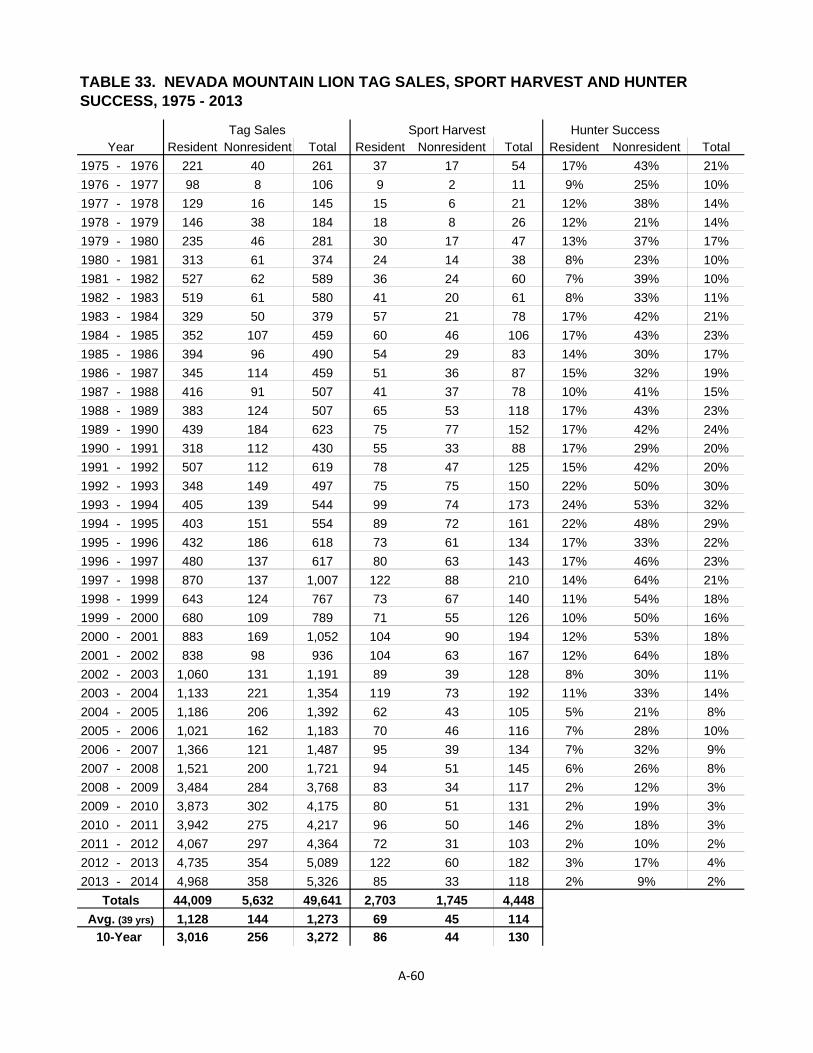
Resident Nonresident Total Resident Nonresident Total Resident Nonresident Total
1975 - 1976 221 40 261 37 17 54 17% 43% 21%
1976 - 1977 98 8 106 9 2 11 9% 25% 10%
1977 - 1978 129 16 145 15 6 21 12% 38% 14%
1978 - 1979 146 38 184 18 8 26 12% 21% 14%
1979 - 1980 235 46 281 30 17 47 13% 37% 17%
1980 - 1981 313 61 374 24 14 38 8% 23% 10%
1981 - 1982 527 62 589 36 24 60 7% 39% 10%
1982 - 1983 519 61 580 41 20 61 8% 33% 11%
1983 - 1984 329 50 379 57 21 78 17% 42% 21%
1984 - 1985 352 107 459 60 46 106 17% 43% 23%
1985 - 1986 394 96 490 54 29 83 14% 30% 17%
1986 - 1987 345 114 459 51 36 87 15% 32% 19%
1987 - 1988 416 91 507 41 37 78 10% 41% 15%
1988 - 1989 383 124 507 65 53 118 17% 43% 23%
1989 - 1990 439 184 623 75 77 152 17% 42% 24%
1990 - 1991 318 112 430 55 33 88 17% 29% 20%
1991 - 1992 507 112 619 78 47 125 15% 42% 20%
1992 - 1993 348 149 497 75 75 150 22% 50% 30%
1993 - 1994 405 139 544 99 74 173 24% 53% 32%
1994 - 1995 403 151 554 89 72 161 22% 48% 29%
1995 - 1996 432 186 618 73 61 134 17% 33% 22%
1996 - 1997 480 137 617 80 63 143 17% 46% 23%
1997 - 1998 870 137 1,007 122 88 210 14% 64% 21%
1998 - 1999 643 124 767 73 67 140 11% 54% 18%
1999 - 2000 680 109 789 71 55 126 10% 50% 16%
2000 - 2001 883 169 1,052 104 90 194 12% 53% 18%
2001 - 2002 838 98 936 104 63 167 12% 64% 18%
2002 - 2003 1,060 131 1,191 89 39 128 8% 30% 11%
2003 - 2004 1,133 221 1,354 119 73 192 11% 33% 14%
2004 - 2005 1,186 206 1,392 62 43 105 5% 21% 8%
2005 - 2006 1,021 162 1,183 70 46 116 7% 28% 10%
2006 - 2007 1,366 121 1,487 95 39 134 7% 32% 9%
2007 - 2008 1,521 200 1,721 94 51 145 6% 26% 8%
2008 - 2009 3,484 284 3,768 83 34 117 2% 12% 3%
2009 - 2010 3,873 302 4,175 80 51 131 2% 19% 3%
2010 - 2011 3,942 275 4,217 96 50 146 2% 18% 3%
2011 - 2012 4,067 297 4,364 72 31 103 2% 10% 2%
2012 - 2013 4,735 354 5,089 122 60 182 3% 17% 4%
2013 - 2014 4,968 358 5,326 85 33 118 2% 9% 2%
44,009 5,632 49,641 2,703 1,745 4,448
1,128 144 1,273 69 45 114
3,016 256 3,272 86 44 130
Sport Harvest Hunter Success
TABLE 33. NEVADA MOUNTAIN LION TAG SALES, SPORT HARVEST AND HUNTER SUCCESS, 1975 - 2013
10-Year
Totals
Avg. (39 yrs)
YearTag Sales
A‐60

TABLE 34. NEVADA MOUNTAIN LION DEPREDATION HARVEST (Conducted by APHIS and Private Citizens)
Males Females Unknown Total1972 - 1973 4 7 0 111973 - 1974 8 4 0 121974 - 1975 10 10 0 201975 - 1976 14 5 0 191976 - 1977 10 7 1 181977 - 1978 17 7 0 241978 - 1979 16 8 0 241979 - 1980 12 11 0 231980 - 1981 19 3 0 221981 - 1982 20 17 0 371982 - 1983 11 10 0 211983 - 1984 13 12 0 251984 - 1985 12 16 0 281985 - 1986 16 9 0 251986 - 1987 22 15 0 371987 - 1988 21 20 0 411988 - 1989 26 23 0 491989 - 1990 23 24 0 471990 - 1991 37 20 0 571991 - 1992 27 22 0 491992 - 1993 32 17 0 491993 - 1994 21 15 0 361994 - 1995 16 8 0 241995 - 1996 13 10 0 231996 - 1997 11 9 0 201997 - 1998 12 10 0 221998 - 1999 8 3 0 111999 - 2000 8 8 0 162000 - 2001 5 10 0 152001 - 2002 8 11 0 192002* - 2003 7 6 0 132003* - 2004 16 12 0 282004* - 2005 9 7 0 162005* - 2006 15 4 0 192006* - 2007 10 9 0 192007* - 2008 18 19 0 372008* - 2009 10 16 0 262009* - 2010 16 15 0 312010 - 2011 13 17 2 322011 - 2012 12 17 1 302012 - 2013 8 12 1 212013 - 2014 9 10 1 20
615 495 6 111615 12 0 27
Year
*includes lions taken for NDOW predator management projects
TotalAverage
A-61
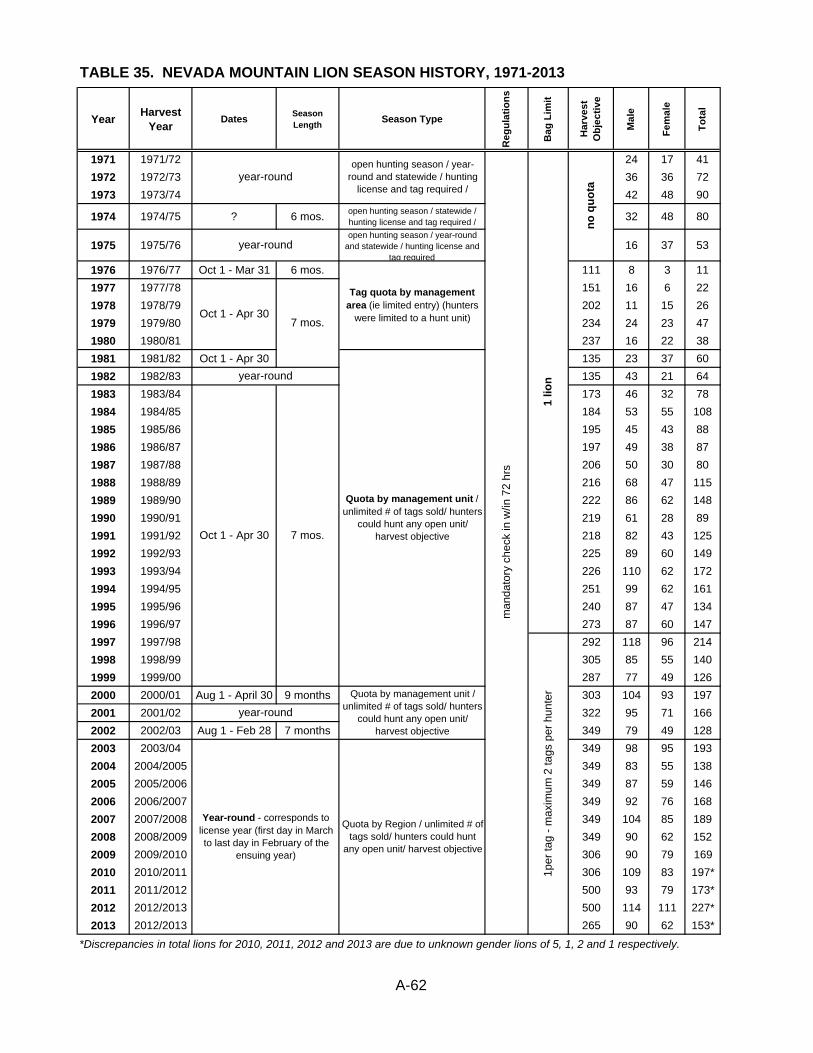
YearHarvest
YearDates
Season Length
Season Type
Re
gu
lati
on
s
Ba
g L
imit
Ha
rve
st
Ob
jec
tiv
e
Ma
le
Fe
ma
le
To
tal
1971 1971/72 24 17 41
1972 1972/73 36 36 72
1973 1973/74 42 48 90
1974 1974/75 ? 6 mos.open hunting season / statewide / hunting license and tag required / 32 48 80
1975 1975/76open hunting season / year-round
and statewide / hunting license and tag required
16 37 53
1976 1976/77 Oct 1 - Mar 31 6 mos. 111 8 3 11
1977 1977/78 151 16 6 22
1978 1978/79 202 11 15 26
1979 1979/80 234 24 23 47
1980 1980/81 237 16 22 38
1981 1981/82 Oct 1 - Apr 30 135 23 37 60
1982 1982/83 135 43 21 64
1983 1983/84 173 46 32 78
1984 1984/85 184 53 55 108
1985 1985/86 195 45 43 88
1986 1986/87 197 49 38 87
1987 1987/88 206 50 30 80
1988 1988/89 216 68 47 115
1989 1989/90 222 86 62 148
1990 1990/91 219 61 28 89
1991 1991/92 218 82 43 125
1992 1992/93 225 89 60 149
1993 1993/94 226 110 62 172
1994 1994/95 251 99 62 161
1995 1995/96 240 87 47 134
1996 1996/97 273 87 60 147
1997 1997/98 292 118 96 214
1998 1998/99 305 85 55 140
1999 1999/00 287 77 49 126
2000 2000/01 Aug 1 - April 30 9 months 303 104 93 197
2001 2001/02 322 95 71 166
2002 2002/03 Aug 1 - Feb 28 7 months 349 79 49 128
2003 2003/04 349 98 95 193
2004 2004/2005 349 83 55 138
2005 2005/2006 349 87 59 146
2006 2006/2007 349 92 76 168
2007 2007/2008 349 104 85 189
2008 2008/2009 349 90 62 152
2009 2009/2010 306 90 79 169
2010 2010/2011 306 109 83 197*
2011 2011/2012 500 93 79 173*
2012 2012/2013 500 114 111 227*
2013 2012/2013 265 90 62 153*
*Discrepancies in total lions for 2010, 2011, 2012 and 2013 are due to unknown gender lions of 5, 1, 2 and 1 respectively.
TABLE 35. NEVADA MOUNTAIN LION SEASON HISTORY, 1971-2013
1 lio
n
no
qu
ota
year-roundopen hunting season / year-
round and statewide / hunting license and tag required /
year-round
Tag quota by management area (ie limited entry) (hunters
were limited to a hunt unit)Oct 1 - Apr 307 mos.
Quota by management unit / unlimited # of tags sold/ hunters
could hunt any open unit/ harvest objective
year-round
Oct 1 - Apr 30 7 mos.1p
er ta
g -
max
imum
2 ta
gs p
er h
unte
rQuota by management unit / unlimited # of tags sold/ hunters
could hunt any open unit/ harvest objective
year-round
Year-round - corresponds to license year (first day in March to last day in February of the
ensuing year)
Quota by Region / unlimited # of tags sold/ hunters could hunt
any open unit/ harvest objective
man
dato
ry c
heck
in w
/in 7
2 hr
s
A-62
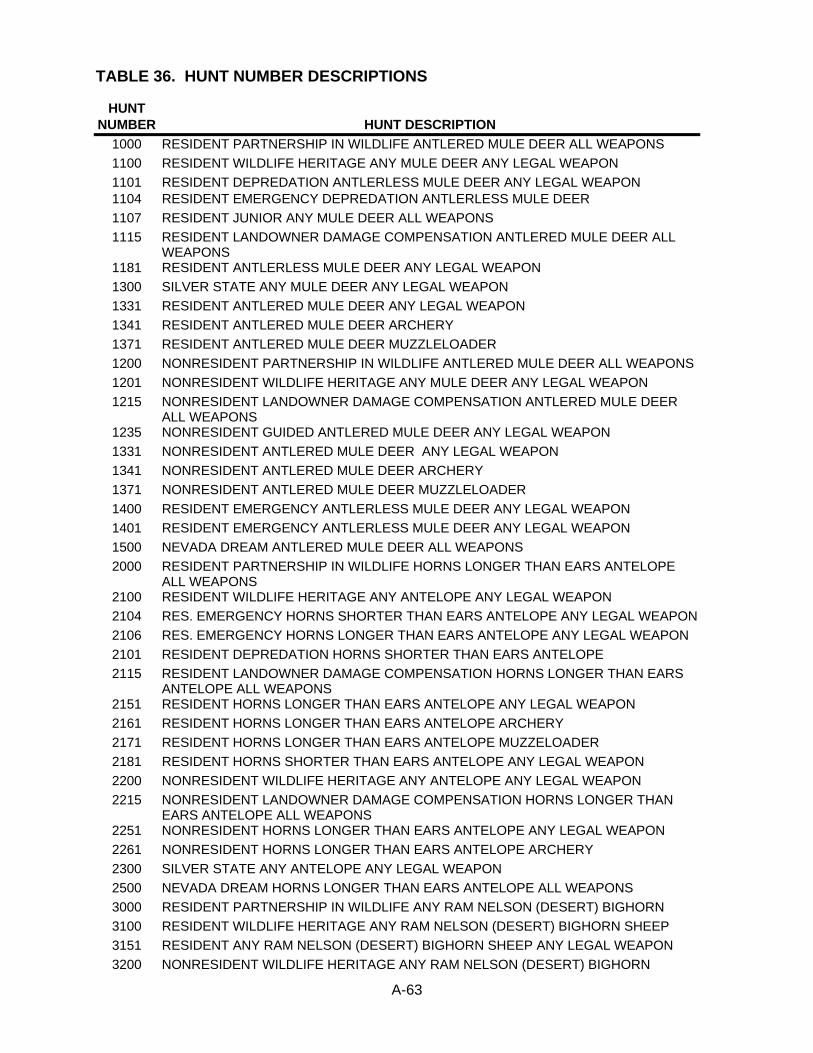
TABLE 36. HUNT NUMBER DESCRIPTIONS
A-63
HUNT NUMBER HUNT DESCRIPTION
1000 RESIDENT PARTNERSHIP IN WILDLIFE ANTLERED MULE DEER ALL WEAPONS
1100 RESIDENT WILDLIFE HERITAGE ANY MULE DEER ANY LEGAL WEAPON
1101 RESIDENT DEPREDATION ANTLERLESS MULE DEER ANY LEGAL WEAPON 1104 RESIDENT EMERGENCY DEPREDATION ANTLERLESS MULE DEER
1107 RESIDENT JUNIOR ANY MULE DEER ALL WEAPONS
1115 RESIDENT LANDOWNER DAMAGE COMPENSATION ANTLERED MULE DEER ALL WEAPONS
1181 RESIDENT ANTLERLESS MULE DEER ANY LEGAL WEAPON
1300 SILVER STATE ANY MULE DEER ANY LEGAL WEAPON
1331 RESIDENT ANTLERED MULE DEER ANY LEGAL WEAPON
1341 RESIDENT ANTLERED MULE DEER ARCHERY
1371 RESIDENT ANTLERED MULE DEER MUZZLELOADER
1200 NONRESIDENT PARTNERSHIP IN WILDLIFE ANTLERED MULE DEER ALL WEAPONS
1201 NONRESIDENT WILDLIFE HERITAGE ANY MULE DEER ANY LEGAL WEAPON
1215 NONRESIDENT LANDOWNER DAMAGE COMPENSATION ANTLERED MULE DEER ALL WEAPONS
1235 NONRESIDENT GUIDED ANTLERED MULE DEER ANY LEGAL WEAPON
1331 NONRESIDENT ANTLERED MULE DEER ANY LEGAL WEAPON
1341 NONRESIDENT ANTLERED MULE DEER ARCHERY
1371 NONRESIDENT ANTLERED MULE DEER MUZZLELOADER
1400 RESIDENT EMERGENCY ANTLERLESS MULE DEER ANY LEGAL WEAPON
1401 RESIDENT EMERGENCY ANTLERLESS MULE DEER ANY LEGAL WEAPON
1500 NEVADA DREAM ANTLERED MULE DEER ALL WEAPONS
2000 RESIDENT PARTNERSHIP IN WILDLIFE HORNS LONGER THAN EARS ANTELOPE ALL WEAPONS
2100 RESIDENT WILDLIFE HERITAGE ANY ANTELOPE ANY LEGAL WEAPON
2104 RES. EMERGENCY HORNS SHORTER THAN EARS ANTELOPE ANY LEGAL WEAPON
2106 RES. EMERGENCY HORNS LONGER THAN EARS ANTELOPE ANY LEGAL WEAPON
2101 RESIDENT DEPREDATION HORNS SHORTER THAN EARS ANTELOPE
2115 RESIDENT LANDOWNER DAMAGE COMPENSATION HORNS LONGER THAN EARS ANTELOPE ALL WEAPONS
2151 RESIDENT HORNS LONGER THAN EARS ANTELOPE ANY LEGAL WEAPON
2161 RESIDENT HORNS LONGER THAN EARS ANTELOPE ARCHERY
2171 RESIDENT HORNS LONGER THAN EARS ANTELOPE MUZZELOADER
2181 RESIDENT HORNS SHORTER THAN EARS ANTELOPE ANY LEGAL WEAPON
2200 NONRESIDENT WILDLIFE HERITAGE ANY ANTELOPE ANY LEGAL WEAPON
2215 NONRESIDENT LANDOWNER DAMAGE COMPENSATION HORNS LONGER THAN EARS ANTELOPE ALL WEAPONS
2251 NONRESIDENT HORNS LONGER THAN EARS ANTELOPE ANY LEGAL WEAPON
2261 NONRESIDENT HORNS LONGER THAN EARS ANTELOPE ARCHERY
2300 SILVER STATE ANY ANTELOPE ANY LEGAL WEAPON
2500 NEVADA DREAM HORNS LONGER THAN EARS ANTELOPE ALL WEAPONS
3000 RESIDENT PARTNERSHIP IN WILDLIFE ANY RAM NELSON (DESERT) BIGHORN
3100 RESIDENT WILDLIFE HERITAGE ANY RAM NELSON (DESERT) BIGHORN SHEEP
3151 RESIDENT ANY RAM NELSON (DESERT) BIGHORN SHEEP ANY LEGAL WEAPON
3200 NONRESIDENT WILDLIFE HERITAGE ANY RAM NELSON (DESERT) BIGHORN
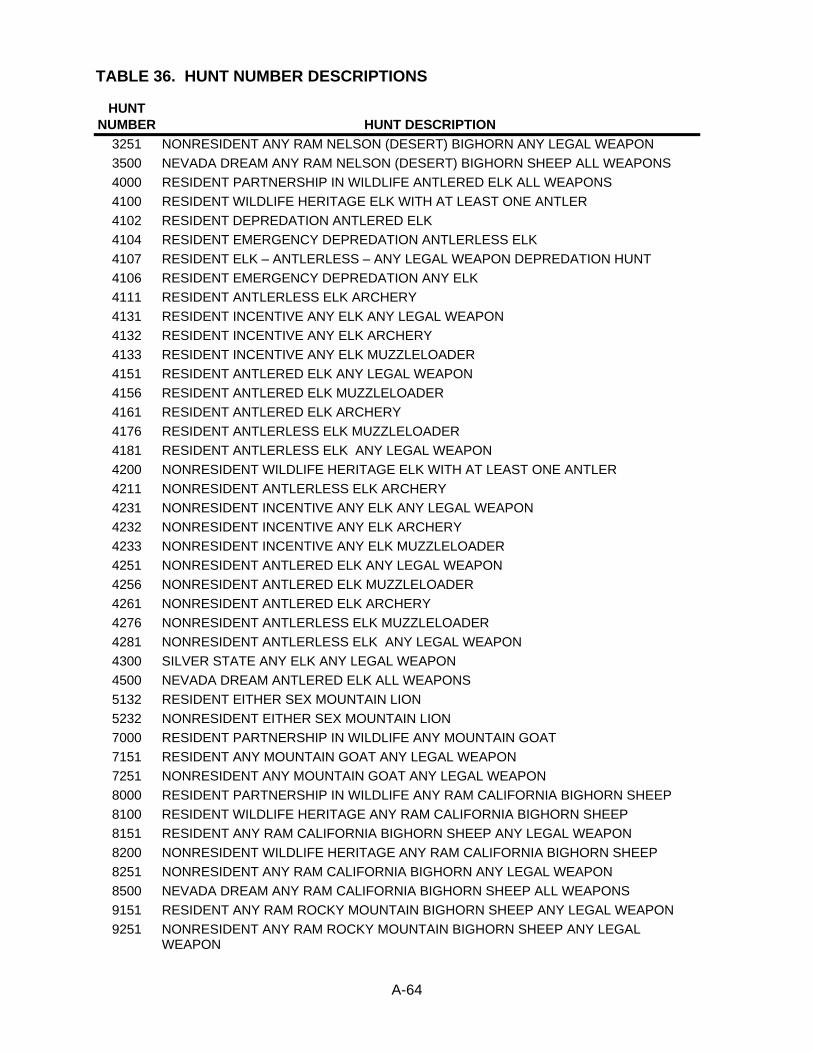
TABLE 36. HUNT NUMBER DESCRIPTIONS
A-64
HUNT NUMBER HUNT DESCRIPTION
3251 NONRESIDENT ANY RAM NELSON (DESERT) BIGHORN ANY LEGAL WEAPON
3500 NEVADA DREAM ANY RAM NELSON (DESERT) BIGHORN SHEEP ALL WEAPONS
4000 RESIDENT PARTNERSHIP IN WILDLIFE ANTLERED ELK ALL WEAPONS
4100 RESIDENT WILDLIFE HERITAGE ELK WITH AT LEAST ONE ANTLER
4102 RESIDENT DEPREDATION ANTLERED ELK
4104 RESIDENT EMERGENCY DEPREDATION ANTLERLESS ELK
4107 RESIDENT ELK – ANTLERLESS – ANY LEGAL WEAPON DEPREDATION HUNT
4106 RESIDENT EMERGENCY DEPREDATION ANY ELK
4111 RESIDENT ANTLERLESS ELK ARCHERY
4131 RESIDENT INCENTIVE ANY ELK ANY LEGAL WEAPON
4132 RESIDENT INCENTIVE ANY ELK ARCHERY
4133 RESIDENT INCENTIVE ANY ELK MUZZLELOADER
4151 RESIDENT ANTLERED ELK ANY LEGAL WEAPON
4156 RESIDENT ANTLERED ELK MUZZLELOADER
4161 RESIDENT ANTLERED ELK ARCHERY
4176 RESIDENT ANTLERLESS ELK MUZZLELOADER
4181 RESIDENT ANTLERLESS ELK ANY LEGAL WEAPON
4200 NONRESIDENT WILDLIFE HERITAGE ELK WITH AT LEAST ONE ANTLER
4211 NONRESIDENT ANTLERLESS ELK ARCHERY
4231 NONRESIDENT INCENTIVE ANY ELK ANY LEGAL WEAPON
4232 NONRESIDENT INCENTIVE ANY ELK ARCHERY
4233 NONRESIDENT INCENTIVE ANY ELK MUZZLELOADER
4251 NONRESIDENT ANTLERED ELK ANY LEGAL WEAPON
4256 NONRESIDENT ANTLERED ELK MUZZLELOADER
4261 NONRESIDENT ANTLERED ELK ARCHERY
4276 NONRESIDENT ANTLERLESS ELK MUZZLELOADER
4281 NONRESIDENT ANTLERLESS ELK ANY LEGAL WEAPON
4300 SILVER STATE ANY ELK ANY LEGAL WEAPON
4500 NEVADA DREAM ANTLERED ELK ALL WEAPONS
5132 RESIDENT EITHER SEX MOUNTAIN LION
5232 NONRESIDENT EITHER SEX MOUNTAIN LION
7000 RESIDENT PARTNERSHIP IN WILDLIFE ANY MOUNTAIN GOAT
7151 RESIDENT ANY MOUNTAIN GOAT ANY LEGAL WEAPON
7251 NONRESIDENT ANY MOUNTAIN GOAT ANY LEGAL WEAPON
8000 RESIDENT PARTNERSHIP IN WILDLIFE ANY RAM CALIFORNIA BIGHORN SHEEP
8100 RESIDENT WILDLIFE HERITAGE ANY RAM CALIFORNIA BIGHORN SHEEP
8151 RESIDENT ANY RAM CALIFORNIA BIGHORN SHEEP ANY LEGAL WEAPON
8200 NONRESIDENT WILDLIFE HERITAGE ANY RAM CALIFORNIA BIGHORN SHEEP
8251 NONRESIDENT ANY RAM CALIFORNIA BIGHORN ANY LEGAL WEAPON
8500 NEVADA DREAM ANY RAM CALIFORNIA BIGHORN SHEEP ALL WEAPONS
9151 RESIDENT ANY RAM ROCKY MOUNTAIN BIGHORN SHEEP ANY LEGAL WEAPON
9251 NONRESIDENT ANY RAM ROCKY MOUNTAIN BIGHORN SHEEP ANY LEGAL WEAPON
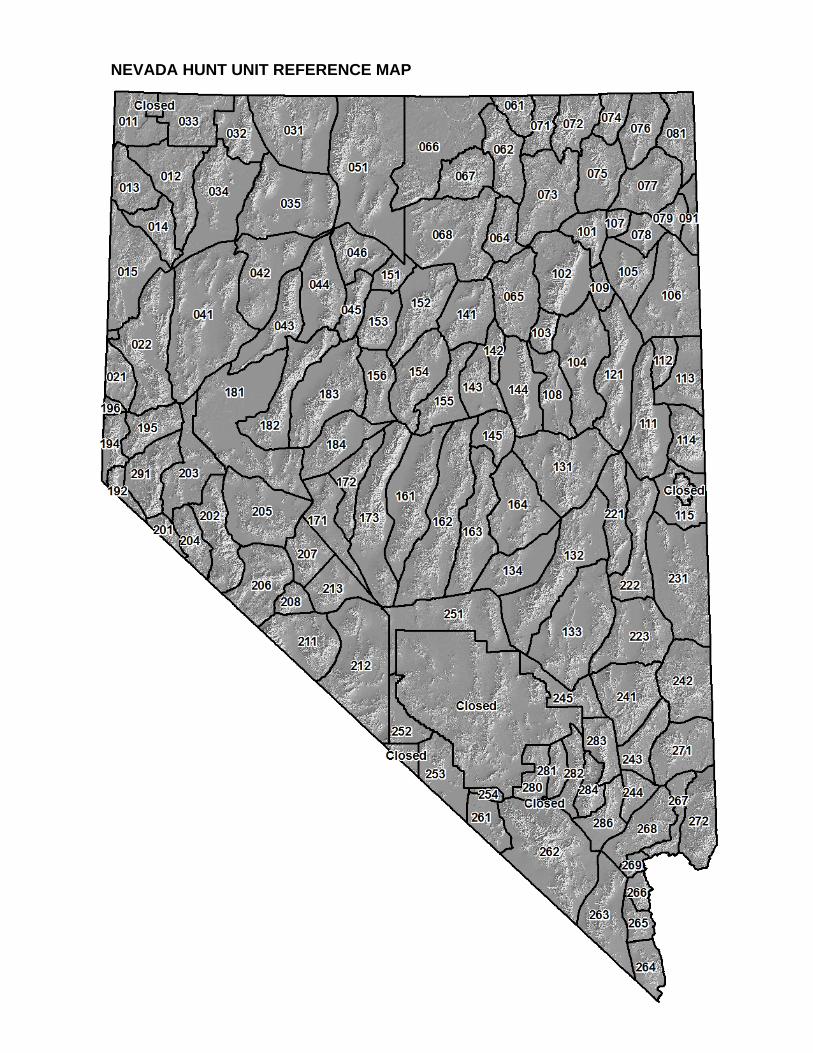
NEVADA HUNT UNIT REFERENCE MAP