Embed Size (px)
Citation preview
1
NMR-Spectroscopy in Drug Analysis Quantitative NMR Spectroscopy
U. Holzgrabe, R. Deubner, C. Schollmayer,
Institute of Pharmacy, University of Würzburg, Germany

2
Part I: NMR Spectroscopy in Drug Analysis - Principles U. Holzgrabe, R. Deubner Institute of Pharmacy, University of Würzburg, Germany Content: a) Basic principles b) NMR spectroscopy as a primary method of measurement c) Optimization of the experimental parameters d) Processing the spectra
a. Basic principles of quantitative NMR spectroscopy The intensity of a NMR-signal is given by the area under the specific signal. This area is di-rectly calculated by modern spectrometer software. For this purpose all intensities (in arbi-trary units) for each data point over the whole signal are added. The intensity IA of a signal is directly proportional to the number of nuclei N evoking the signal. Due to this relation the intensities of NMR signals can be used for quantitative purposes.
The relation between the signal intensity I and the number of observed nuclei is given by:
Equation 1 NcI S ⋅=
The proportionality constant cS results from parameters of the spectrometer and the sample. It is called “spectrometer constant“. So there is a linear relation between the intensity of a NMR signal and the number of nuclei evoking it.
This relation could also be derived from the description of a signal S(ω) as pure Lorentzian line resonating at fre-quency ω (the lineshape of NMR signals drawn as pure absorption mode signals, cf. Fig. 1 (taken from [1], [2]) by integration from -∞ until +∞. Except of the number of the nuclei which contribute to that signal all parameters of the NMR system are constant.
A disadvantage of NMR spectroscopy as a quantitative method of measurement is the low sensitivity. Since NMR signals are based on the small difference of the spin popu-lations in either α- or β-state only this little amount of nu-clei is taken in concern in NMR experiments. While in UV spectroscopy a limit of detection in the µM range can be achieved, in NMR spectroscopy concentration of 0.1 to 1 mM are required. In addition, quantification is only possi-ble if the signals being integrated are well separated from others. In contrast to chromatographic methods there is only little possibility to influence this separation because the chemical shift is directly related to the molecular structure. By changing the solvent or by adding auxiliary reagents, the so called “shift reagents” the separation of the signals can be changed. In addition, problems concerning the line shape may occur and the integration of the signals will get worse.
Figure 1: Lorentzian line of an NMR-Signal; the width at half height (∆ν1/2) is marked (from [1]).
3
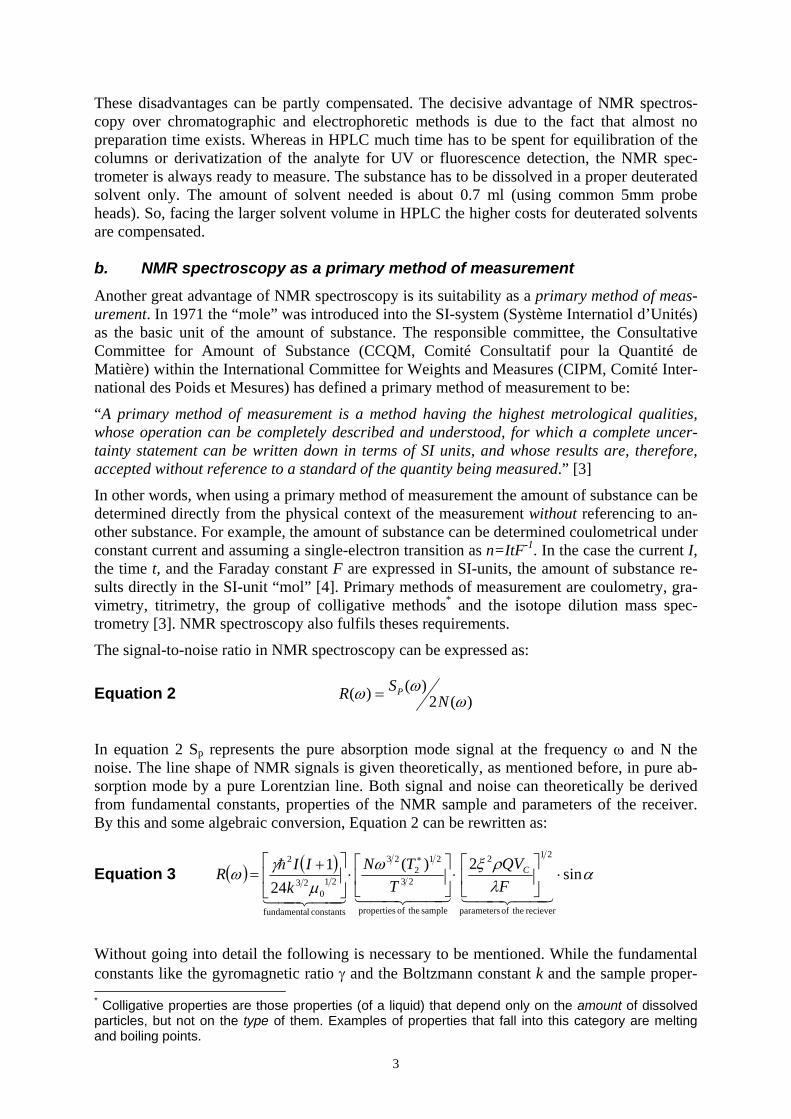
These disadvantages can be partly compensated. The decisive advantage of NMR spectros-copy over chromatographic and electrophoretic methods is due to the fact that almost no preparation time exists. Whereas in HPLC much time has to be spent for equilibration of the columns or derivatization of the analyte for UV or fluorescence detection, the NMR spec-trometer is always ready to measure. The substance has to be dissolved in a proper deuterated solvent only. The amount of solvent needed is about 0.7 ml (using common 5mm probe heads). So, facing the larger solvent volume in HPLC the higher costs for deuterated solvents are compensated. b. NMR spectroscopy as a primary method of measurement Another great advantage of NMR spectroscopy is its suitability as a primary method of meas-urement. In 1971 the “mole” was introduced into the SI-system (Système Internatiol d’Unités) as the basic unit of the amount of substance. The responsible committee, the Consultative Committee for Amount of Substance (CCQM, Comité Consultatif pour la Quantité de Matière) within the International Committee for Weights and Measures (CIPM, Comité Inter-national des Poids et Mesures) has defined a primary method of measurement to be:
“A primary method of measurement is a method having the highest metrological qualities, whose operation can be completely described and understood, for which a complete uncer-tainty statement can be written down in terms of SI units, and whose results are, therefore, accepted without reference to a standard of the quantity being measured.” [3]
In other words, when using a primary method of measurement the amount of substance can be determined directly from the physical context of the measurement without referencing to an-other substance. For example, the amount of substance can be determined coulometrical under constant current and assuming a single-electron transition as n=ItF-1. In the case the current I, the time t, and the Faraday constant F are expressed in SI-units, the amount of substance re-sults directly in the SI-unit “mol” [4]. Primary methods of measurement are coulometry, gra-vimetry, titrimetry, the group of colligative methods* and the isotope dilution mass spec-trometry [3]. NMR spectroscopy also fulfils theses requirements.
The signal-to-noise ratio in NMR spectroscopy can be expressed as:
Equation 2 )(2)()( ω
ωω NSR P=
In equation 2 Sp represents the pure absorption mode signal at the frequency ω and N the noise. The line shape of NMR signals is given theoretically, as mentioned before, in pure ab-sorption mode by a pure Lorentzian line. Both signal and noise can theoretically be derived from fundamental constants, properties of the NMR sample and parameters of the receiver. By this and some algebraic conversion, Equation 2 can be rewritten as:
Equation 3 ( ) ( ) αλρξω
µγω sin2)(24
1
reciever theof parameters
212
sample theof properties
23
212
23
constants lfundamenta
210
23
2
⋅⎥⎦
⎤⎢⎣
⎡⋅⎥⎦
⎤⎢⎣
⎡⋅⎥⎦
⎤⎢⎣
⎡ +=
∗
44 344 2144 344 214434421
h
FQV
TTN
kIIR C
Without going into detail the following is necessary to be mentioned. While the fundamental constants like the gyromagnetic ratio γ and the Boltzmann constant k and the sample proper- * Colligative properties are those properties (of a liquid) that depend only on the amount of dissolved particles, but not on the type of them. Examples of properties that fall into this category are melting and boiling points.

4
ties such as the Larmor frequency ω or the temperature T are known or can easily be deter-mined this is not the case for the most parameters of the receiver, e. g. the ratio of effective inductance to total inductance of the coil ρ, the filling factor of the receiver coil ξ or the qual-ity factor of the receiver coil Q; only the volume enclosed by the receiver coil Vc can be easily determined.
Due to this expression on fundamental constants, sample properties and receiver parameters NMR spectroscopy can be used as a primary method of measurement when the conditions, explained in the forthcoming parts, are considered [4].
Concerning the vector model of NMR spectroscopy, only the part of the macroscopic mag-netization being along the y-axis of the rotating frame of reference can be detected. Its inten-sity is determined first by the total intensity of macroscopic magnetization along the z-axis of the un-excitated sample (i.e. the small difference of nuclei in the α- and β-state) and second by the part of it which is placed in the xy-plane (i.e. by the tip angle).
When NMR spectroscopy is used as quantitative method, there are higher requirements in comparison to a qualitative method. The main aim is to have the detectable part of magnetiza-tion along the y-axis of the rotating frame as large as possible. Therefore some parameters of the experiment have to be optimized.
c. Optimization of the experimental parameters
Transmitter frequency and spectral width
The excitation pulse is symmetrical to the transmitter frequency ν and its width is propor-tional to τ-1 (τ is the duration of the pulse). The power is strongest at the center frequency ν and decreases to the edges. Thus, the excitation pulse is not an exact rectangular pulse.
If the FID is sampled with only one detector, it is impossible to discriminate whether the sig-nal resonates at higher or lower frequency with respect to the transmitter frequency. The transmitter frequency has to be placed at the edge of the spectrum. This means, that half of the transmitter power is unused and the part with the same high transmitter power becomes even smaller. Therefore, in current spectrometers two phase sensitive detectors are used in order to record the Mx- and the My-component of the magnetization vector at the same time. This “quadrature detection” avoids the aforementioned disadvantages. Since the pulse is not an ideal rectangular pulse, the transmitter frequency has to be as near as possible, ideally in equal distance to the signals of interest.
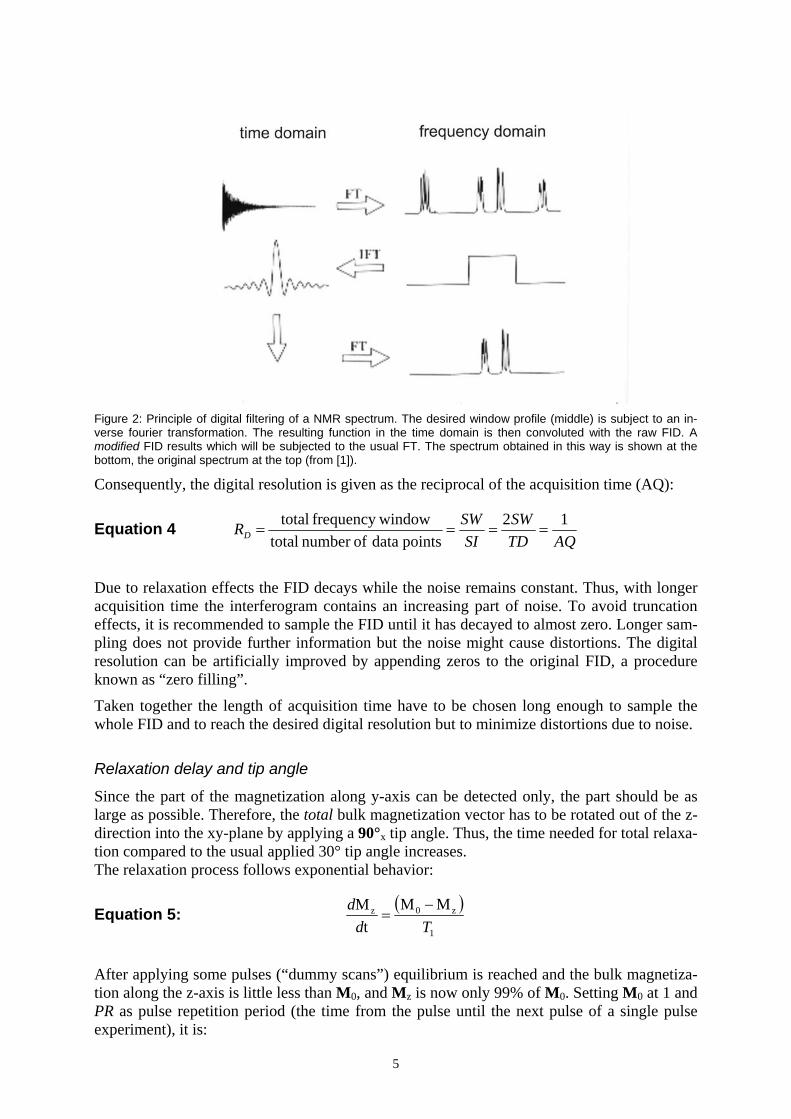
The spectral width must be chosen large enough to record the whole area of interest. If the width is too small, signals of the spectrum outside this window will be aliased (or “folded”) and will appear at a wrong frequency. This usually is not the case in modern spectrometers working with digital filters. The principle is named “oversampling” and means the FID is sampled at faster rate than required. The signals outside the window will be mathematically eliminated (cf. Fig. 2). An additional effect of this method is the minimization of noise de-pending on the digitization [5]. The use of digital filters enables to observe only a part of the whole spectrum without aliasing any signals.
The Fourier transformation generates two data sets, the “real” and “imaginary” spectrum. Thus, the “real” spectrum which is usually displayed contains only half the number of data points than the original FID (in absence of any manipulation like zero filling, see below) re-sulting in half the number of data points (TD) of the FID.
5
Figure 2: Principle of digital filtering of a NMR spectrum. The desired window profile (middle) is subject to an in-verse fourier transformation. The resulting function in the time domain is then convoluted with the raw FID. A modified FID results which will be subjected to the usual FT. The spectrum obtained in this way is shown at the bottom, the original spectrum at the top (from [1]).
Consequently, the digital resolution is given as the reciprocal of the acquisition time (AQ):
Equation 4 AQTD
SWSI
SWRD12
points data ofnumber totalwindowfrequency total
====
Due to relaxation effects the FID decays while the noise remains constant. Thus, with longer acquisition time the interferogram contains an increasing part of noise. To avoid truncation effects, it is recommended to sample the FID until it has decayed to almost zero. Longer sam-pling does not provide further information but the noise might cause distortions. The digital resolution can be artificially improved by appending zeros to the original FID, a procedure known as “zero filling”.
Taken together the length of acquisition time have to be chosen long enough to sample the whole FID and to reach the desired digital resolution but to minimize distortions due to noise.
Relaxation delay and tip angle
Since the part of the magnetization along y-axis can be detected only, the part should be as large as possible. Therefore, the total bulk magnetization vector has to be rotated out of the z-direction into the xy-plane by applying a 90°x tip angle. Thus, the time needed for total relaxa-tion compared to the usual applied 30° tip angle increases. The relaxation process follows exponential behavior:
Equation 5: ( )1
z0z MMt
MTd
d −=
After applying some pulses (“dummy scans”) equilibrium is reached and the bulk magnetiza-tion along the z-axis is little less than M0, and Mz is now only 99% of M0. Setting M0 at 1 and PR as pulse repetition period (the time from the pulse until the next pulse of a single pulse experiment), it is:
6
Equation 6 ∫ ∫=−
99,0
01
Z 11
ZM
PR
Z
dtT
dM
M
The signal-to-noise ratio is directly proportional to the amount of magnetization in the xy-plane. Furthermore, the signal-to-noise ratio after n repetitions is equal to the signal-to-noise ratio after one experiment multiplied with square root of the number of repetitions. The num-ber of repetitions multiplied with the pulse repetition period results in the total experimental time ttot. Thus, the signal-to-noise ratio is:
Equation 7 [ ]α
α
cos99,0100lnsin99,0
)/(1 −⋅
⋅⋅=
Ttk
NS totn
To optimize the signal-to-noise ratio this equation can be differentiated with respect to α (holding T1 and ttot constant). The derivative equation is then set equal to zero and solved nu-merically. The optimum of the tip angle yielded is 82.865 degrees [6]. In order to reach the desired 99% bulk magnetization in z-direction before the next pulse, a pulse repetition period has to be of the 4.5fold the size of the longest T1 relaxation time [6].
Furthermore a relation between the signal-to-noise ratio and the pulse angle on the one hand and the integral accuracy on the other hand can be established: at the expense of integral accu-racy an improvement of signal-to-noise ratio can be obtained. Using a smaller tip angle and a smaller pulse repetition period, the S/N improves [7].
For quantitative analysis purposes the integral values of the signals must be as correct as pos-sible. Thus, qNMR experiments should be performed using a 90° tip angle which provokes a maximum of detectable magnetization in the xy-plane. Using this tip angle it is also required to apply a pulse repetition period of at least five times the T1 relaxation time constant.
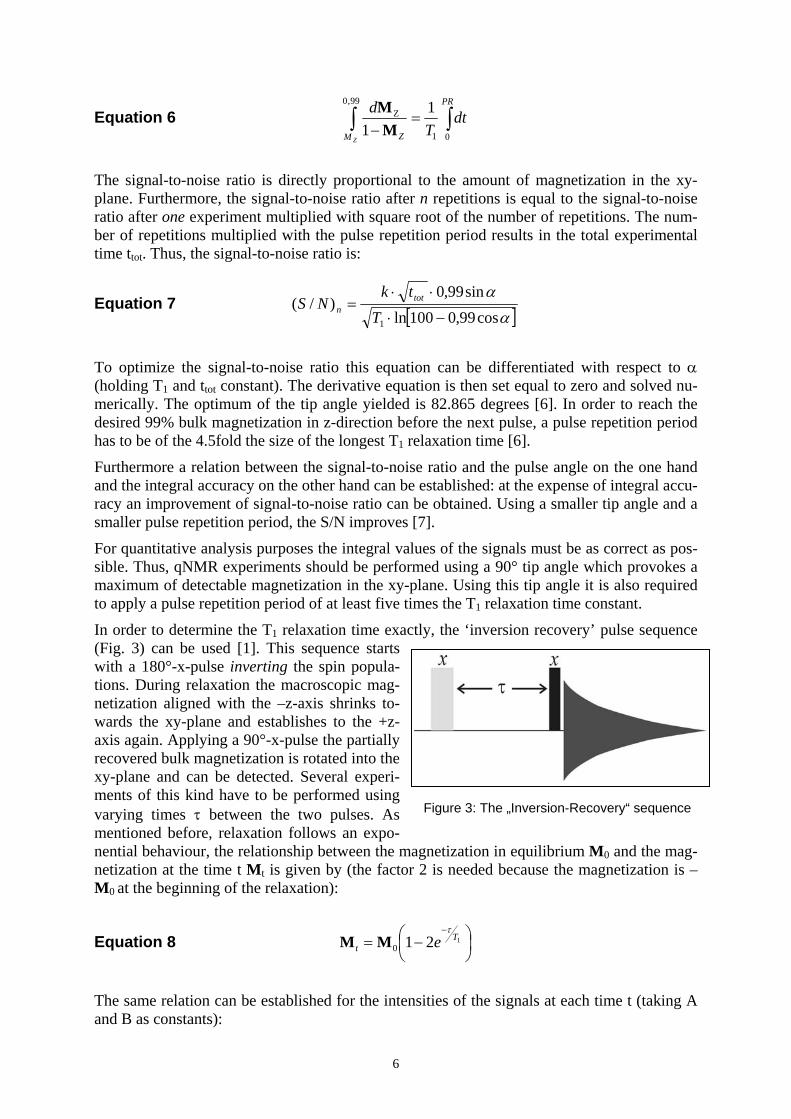
In order to determine the T1 relaxation time exactly, the ‘inversion recovery’ pulse sequence (Fig. 3) can be used [1]. This sequence starts with a 180°-x-pulse inverting the spin popula-tions. During relaxation the macroscopic mag-netization aligned with the –z-axis shrinks to-wards the xy-plane and establishes to the +z-axis again. Applying a 90°-x-pulse the partially recovered bulk magnetization is rotated into the xy-plane and can be detected. Several experi-ments of this kind have to be performed using varying times τ between the two pulses. As mentioned before, relaxation follows an expo-nential behaviour, the relationship between the magnetization in equilibrium M0 and the mag-netization at the time t Mt is given by (the factor 2 is needed because the magnetization is –M0 at the beginning of the relaxation):
Equation 8 ⎟⎠⎞
⎜⎝⎛ −=
−1210
Tt e
τMM
The same relation can be established for the intensities of the signals at each time t (taking A and B as constants):
Figure 3: The „Inversion-Recovery“ sequence
7
Equation 9 1
01 2
.
0T
constIT
ot BeAeIIIττ −=−
+=−=
Thus, there is a linear correlation between the natural logarithm of signal intensity and the time between the two pulses. The slope is 1/T1. The calculation can usually be done using software packages.
Transversal relaxation describes the decay of magnetization in the xy-plane. It influences the width of signals. In order to describe the width of NMR signals the width at half height, b1/2 is used. While ideal NMR signals can be described by the Lorentzian lineshape, b1/2 can also be written:
Equation 10 *
22/1
1T
b⋅
=π
In equation 10 T2* represents the observed transversal relaxation time which is composed of
the real relaxation time T2 and is influenced by field inhomogenities.
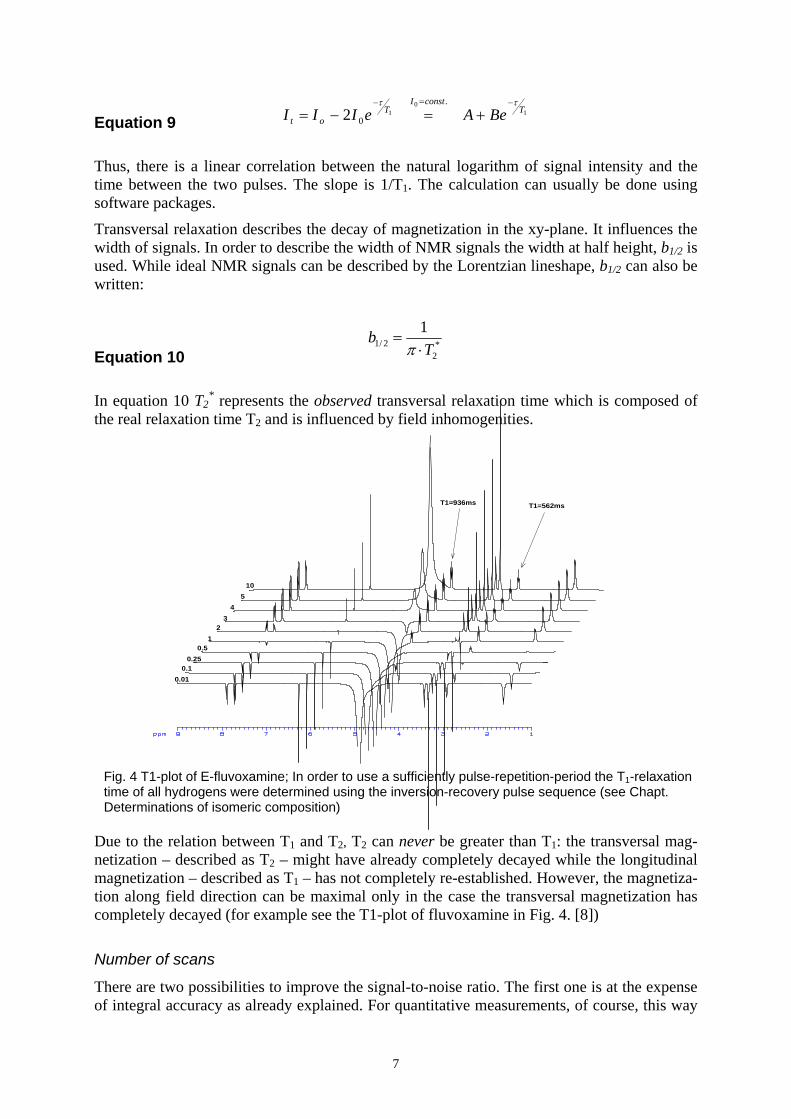
Due to the relation between T1 and T2, T2 can never be greater than T1: the transversal mag-netization – described as T2 – might have already completely decayed while the longitudinal magnetization – described as T1 – has not completely re-established. However, the magnetiza-tion along field direction can be maximal only in the case the transversal magnetization has completely decayed (for example see the T1-plot of fluvoxamine in Fig. 4. [8])
Number of scans
There are two possibilities to improve the signal-to-noise ratio. The first one is at the expense of integral accuracy as already explained. For quantitative measurements, of course, this way
Fig. 4 T1-plot of E-fluvoxamine; In order to use a sufficiently pulse-repetition-period the T1-relaxation time of all hydrogens were determined using the inversion-recovery pulse sequence (see Chapt. Determinations of isomeric composition)
105
43
21
0.50.25
0.10.01
T1=936ms T1=562ms

8
is not recommended. The other possibility for improving (S/N) is using a higher number of scans (n):
Equation 11 ( ) )/(/ NSnNS n ⋅=
It has to be taken into account that the (S/N) only improves with the square root of the number of scans. Applying 64 instead of 16 scans doubles (S/N) while applying 112 instead of 64 improves with the factor 1.32 only. In both cases the same number of scans (48) was added and, thus, in both cases the total experimental time was extended in the same way (assuming a pulse repetition period of 5 seconds, there would be an extension of 3 minutes).
Usually the concentration of the analyte should be adopted in a way (in an order of 10-3 M, depending on the specific problem) that 128 to 256 scans provide an adequate signal-to-noise ratio.
d. Processing the spectra Different methods can be applied in order to improve the spectra in the frequency domain upon transforming the spectra into the time domain (which is the FID) by Fourier Transfor-mation (FT).
The simplest one is applying a window function on the FID prior to FT. After the FID has decayed almost to zero, noise can be detected only. Applying an exponential window function the natural decay of the FID is imitated and forces the detected FID finally to zero. Spectra manipulated in this way show an improved sensitivity because the influence of the noise at the end of the FID is minimized [1]. Unfortunately, enhancing the sensitivity as described wors-ens the resolution. In NMR software packages the parameter which has to be set is not the exponent of the desired function, it is the line broadening factor.
An enhancement of the resolution can be achieved by applying a Lorentz-Gauss transforma-tion [9]. The transformation of the natural line shape (Lorentzian) into a gaussian line shape narrows the signals. Signals located close together will be better separated. The parameters of this function are usually set as a fraction of the total acquisition time.
Integration of signals
As described earlier, the principle of quantitative analysis of NMR spectra is based on the fact that the intensity of a signal corresponds to the number of nuclei evoking the signal. The natu-ral line shape – the Lorentzian line – of NMR signal requires an integration of the area of at least the 20fold the width at half the height of the signal in order to cover at least 99% of the whole intensity [10].
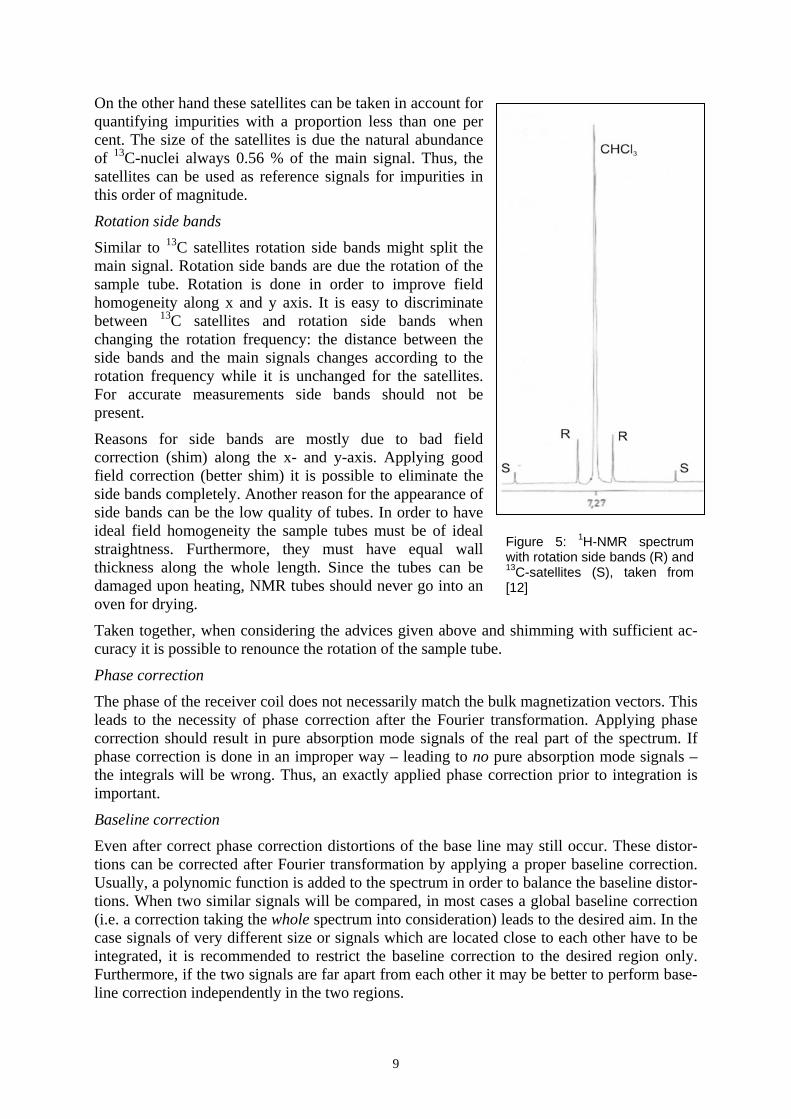
13C-satellites
In 1H-NMR spectra problems due to couplings of 1H with 13C may occur. Due to the natural abundance of carbon-13 (98.9% 12C and 1.1% 13C) the coupling occurs only at 1.1% of the molecules in the sample. The two additional signals at each side are named “satellites”. The height of each is 0.56% of the height of the main signal and the distance of them to the main signal is due the 1J(H,C)-coupling constant of 209 Hz (equal to 0.5 ppm in a 400 MHz spec-trum, Fig. 4). For the quantitative evaluation it is important to integrate the satellites together with the main signal either for all signals which should be compared or for none of them.
9
Figure 5: 1H-NMR spectrum with rotation side bands (R) and 13C-satellites (S), taken from [12]
On the other hand these satellites can be taken in account for quantifying impurities with a proportion less than one per cent. The size of the satellites is due the natural abundance of 13C-nuclei always 0.56 % of the main signal. Thus, the satellites can be used as reference signals for impurities in this order of magnitude.
Rotation side bands
Similar to 13C satellites rotation side bands might split the main signal. Rotation side bands are due the rotation of the sample tube. Rotation is done in order to improve field homogeneity along x and y axis. It is easy to discriminate between 13C satellites and rotation side bands when changing the rotation frequency: the distance between the side bands and the main signals changes according to the rotation frequency while it is unchanged for the satellites. For accurate measurements side bands should not be present.
Reasons for side bands are mostly due to bad field correction (shim) along the x- and y-axis. Applying good field correction (better shim) it is possible to eliminate the side bands completely. Another reason for the appearance of side bands can be the low quality of tubes. In order to have ideal field homogeneity the sample tubes must be of ideal straightness. Furthermore, they must have equal wall thickness along the whole length. Since the tubes can be damaged upon heating, NMR tubes should never go into an oven for drying.
Taken together, when considering the advices given above and shimming with sufficient ac-curacy it is possible to renounce the rotation of the sample tube.
Phase correction
The phase of the receiver coil does not necessarily match the bulk magnetization vectors. This leads to the necessity of phase correction after the Fourier transformation. Applying phase correction should result in pure absorption mode signals of the real part of the spectrum. If phase correction is done in an improper way – leading to no pure absorption mode signals – the integrals will be wrong. Thus, an exactly applied phase correction prior to integration is important.
Baseline correction
Even after correct phase correction distortions of the base line may still occur. These distor-tions can be corrected after Fourier transformation by applying a proper baseline correction. Usually, a polynomic function is added to the spectrum in order to balance the baseline distor-tions. When two similar signals will be compared, in most cases a global baseline correction (i.e. a correction taking the whole spectrum into consideration) leads to the desired aim. In the case signals of very different size or signals which are located close to each other have to be integrated, it is recommended to restrict the baseline correction to the desired region only. Furthermore, if the two signals are far apart from each other it may be better to perform base-line correction independently in the two regions.
10
Correction of the integrals
Finally, even a correction of the integrals themselves could be applied. This can be done in order to correct distortions (like fluctuations or noise) in the baseline and at the edge of the integrals (like convoluted signals). Such errors show integration lines which do not run out straightly. There are different correction functions available for balance. The software pack-age XWIN-NMR (Bruker Biospin) provides the two functions “SLOPE” and “BIAS”. The BIAS-function adds a constant function to the spectrum resulting in an influence on the base-line in vertical direction. The SLOPE-function adds a linear function to the spectrum resulting in an influence on the slope of the spectrum [11].
Poorly separated signals can be better separated applying a procedure known as “deconvolu-tion”. This mathematical operation improves the separation by dividing the overlapping sig-nals into its components. The experimentally derived signals are adapted to either the optimal theoretical line shape of a Lorentzian line or the smaller Gaussian line or a mixture of both [11]. Thus, small signals aside to larger ones can be better integrated.
However, when applying such corrections it might happen that those integral values are more influenced by the desired result than by the experimental data. Furthermore, such corrections must be often performed manually resulting in even greater influence of the operator.
Special problems concerning 13C-spectra In chapter c the dependence of the intensity of a signal on the relaxation of the specific nuclei was discussed. When measuring hydrogens (with a T1-relaxation time of about one second) a pulse repetition period of ca. 5 to 7 seconds is usually enough to make sure that all hydrogens of the maximal intensity can be detected.
However, carbon-13 shows longer T1-relaxation times, usually in the order of 10 to 30 sec-onds. Quaternary carbons may even have T1-times longer than 300 seconds. In order to have a total relaxation before the next pulse, pulse repetition periods of up to 2.5 minutes and more may be necessary. Taking at least 512 to 1024 scans into consideration (because of the low natural abundance and small gyro magnetic ratio), this gives a total experimental time of more than 20 to 40 hours. If the time between two pulses is only a few seconds (in routine spectra 1 to 2 seconds are usually applied) the nuclei are only partly relaxed prior to the next pulse. The detected intensities are therefore for nuclei with longer T1-times relatively smaller in compari-son to those with smaller T1-times. Such spectra cannot be used for quantitative purposes.
Another problem arises from the nuclear Overhauser effect (NOE). Excitation of a nucleus influences the relaxation behavior of the nuclei in the neighborhood [12]. In order to simplify spectra the 13C-spectra are usually measured under “decoupling” conditions, i.e. the couplings between 1H and 13C are eliminated and, thus, the 13Cs appear as singlets. Under this condi-tions a heteronuclear NOE enhances the 13C-signal intensities for signals which belong to C atoms carrying one or more hydrogens. If 13C-spectra will be evaluated quantitatively the NOEs must be suppressed (e.g. by adding paramagnetic ions or applying special pulse se-quences). In decoupled spectra only similar carbons of enantiomers can be compared with sufficient accuracy.
11
Part II: NMR Spectroscopy in Drug Analysis - Applications U. Holzgrabe, R. Deubner, C. Schollmayer, B. Waibel Institute of Pharmacy, University of Würzburg, Germany Content: a) Introductory remarks b) NMR spectroscopy in International Pharmacopoeias c) Evaluation of impurities resulting from the synthesis pathways d) Evaluation of impurities from decomposition e) Hyphenation of HPLC and NMR f) Chemometrics in drug analysis g) Conclusion h) References a) Introductory Remarks 1H and 13C NMR spectroscopy is famous for the elucidation of structures of newly synthe-sized compounds, natural products and semi-synthesized compounds. Utilizing COSY, HMBC, HSQC, TOCSY, NOESY, and ROESY experiments the constitution, configuration and conformation of small molecules as well as polymers, such as peptides, sugars, and nu-cleotides, can be elucidated. 19F, 15N, and 31P were additionally employed in structure deter-mination.
However, NMR spectroscopy can also be used
to identify a drug to evaluate the level of impurities and to elucidate their structure to observe the course of decomposition to evaluate the content of residual solvents to determine the isomeric composition:
→ the ratio of diastereomers → the enantiomeric excess (ee) by means of chiral additive
For some years the term quantitative NMR spectroscopy and the abbreviation qNMR has been frequently used indicating the growing importance of NMR spectroscopy in the field of quan-titative analysis. b. NMR Spectroscopy in International Pharmacopoeias As a consequence of the aforementioned remarks International Pharmacopoeias make increas-ingly use of NMR spectroscopy for identification purposes and quantitative NMR spectros-copy (qNMR) for evaluation of composition of polymers and impurities in drugs.
The European Pharmacopoeia (PhEur 4th edition) describes the method of NMR spectroscopy only in principle using continuous wave (no longer in use nowadays) and pulsed spectrome-try. Applying this monograph allows a qualitative analysis only. Hence, most of the applica-tions are found in the identity section (see Table 1). In contrast, beside the description of the physical background of NMR spectroscopy, the apparatus, the general method and the inter-pretation of a spectrum the United States Pharmacopoeia 26 (2003) gives detailed information about procedures to be applied for qualitative and quantitative purposes. In the section for qualitative analysis the correlation between chemical shifts and coupling constants on the one hand and the structure of a molecule on the other hand is stressed. For quantitative applica-tions an absolute method, utilizing an internal standard, and a relative method is given.
12
1.01.52.02.53.03.54.04.55.05.56.06.57.07.58.08.5 ppm
Consequently, the NMR spectroscopy is used in the USP for identification of the drugs and their impurities and for quantification purposes.
Table 1: Examples of NMR applications in various pharmacopoeiae
Identity
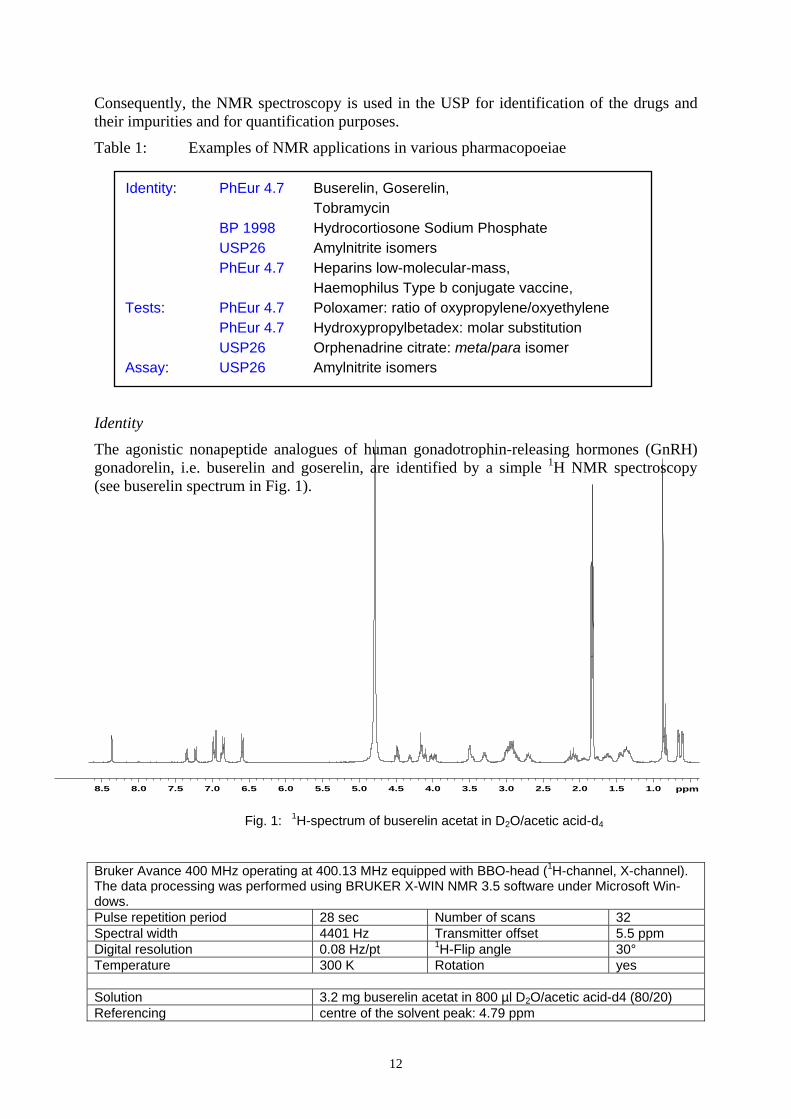
The agonistic nonapeptide analogues of human gonadotrophin-releasing hormones (GnRH) gonadorelin, i.e. buserelin and goserelin, are identified by a simple 1H NMR spectroscopy (see buserelin spectrum in Fig. 1).
Bruker Avance 400 MHz operating at 400.13 MHz equipped with BBO-head (1H-channel, X-channel). The data processing was performed using BRUKER X-WIN NMR 3.5 software under Microsoft Win-dows. Pulse repetition period 28 sec Number of scans 32 Spectral width 4401 Hz Transmitter offset 5.5 ppm Digital resolution 0.08 Hz/pt 1H-Flip angle 30° Temperature 300 K Rotation yes Solution 3.2 mg buserelin acetat in 800 µl D2O/acetic acid-d4 (80/20) Referencing centre of the solvent peak: 4.79 ppm
Identity: PhEur 4.7 Buserelin, Goserelin, Tobramycin
BP 1998 Hydrocortiosone Sodium Phosphate USP26 Amylnitrite isomers
PhEur 4.7 Heparins low-molecular-mass, Haemophilus Type b conjugate vaccine,
Tests: PhEur 4.7 Poloxamer: ratio of oxypropylene/oxyethylene PhEur 4.7 Hydroxypropylbetadex: molar substitution
USP26 Orphenadrine citrate: meta/para isomer Assay: USP26 Amylnitrite isomers
Fig. 1: 1H-spectrum of buserelin acetat in D2O/acetic acid-d4

13
Due to heavy signal overlapping, the spectra of tobramycin and hydrocortisonesodium phos-phate are very complicated (cf. tobramycin spectrum Fig. 2) [16] and could be assigned only by means of 2D experiments. Applying homo- and heteronuclear shift correlations the 1H and 13C NMR spectra of tobramycin at varying pH values could be fully assigned [13]. However, the 1H NMR spectrum demanded by the PhEur 4.5 for identification is used in the same man-ner as IR spectra. Hence a sort of pattern recognition is applied.
1.01.52.02.53.03.54.04.55.0 ppm
Bruker Avance 400 MHz operating at 400.13 MHz equipped with BBI-head (inverse broadband ob-server for heteronucleus, inner coil tuned to1H). The data processing was performed using BRUKER X-WIN NMR 3.5 software under Microsoft Windows XP. Pulse repetition period 7 sec Number of scans 16 Spectral width 2395 Hz Transmitter offset 3 ppm Digital resolution 0.17 Hz 1H-Flip angle 30° Temperature 300 K Rotation no Solution 10 mg tobramycin in 700µl D2O Referencing centre of the solvent peak: 4.70 ppm The USP XXVI identifies amyl nitrite being a mixture of mainly isoamyl nitrite ((CH3)2CH-CH2-CH2-O-N=O) beside other isomers by means of a 1H NMR spectrum. Among other peaks the NMR spectrum is characterized by a doublet at ~ 1 ppm and a multiplet centered at ~ 4.8 ppm representing the methyl and methylene hydrogens in α-position to the nitrite group. In the assay the absolute method using benzyl benzoate as an internal standard was applied. The quantity of amyl nitrite is calculated from the signal area of the α-methylene group of the drug (at 4.8 ppm) and the signal area of the methylene hydrogens of benzyl benzoate at 5.3 ppm.
Fig. 2: Structural formula and 1H NMR spectrum (400 MHz, D2O) of tobramycin
NH2
OH
NH2 OH
NH2
OHNH2
OH
NH2
O
O
O
O
OH
14
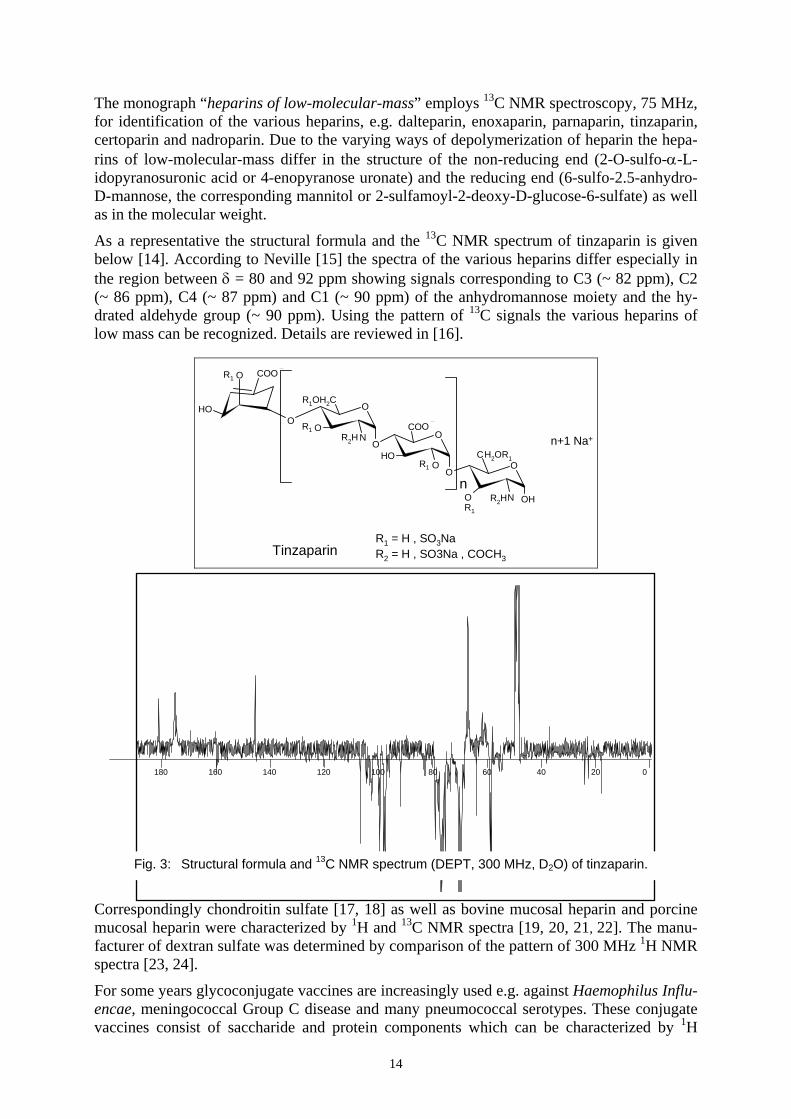
The monograph “heparins of low-molecular-mass” employs 13C NMR spectroscopy, 75 MHz, for identification of the various heparins, e.g. dalteparin, enoxaparin, parnaparin, tinzaparin, certoparin and nadroparin. Due to the varying ways of depolymerization of heparin the hepa-rins of low-molecular-mass differ in the structure of the non-reducing end (2-O-sulfo-α-L-idopyranosuronic acid or 4-enopyranose uronate) and the reducing end (6-sulfo-2.5-anhydro-D-mannose, the corresponding mannitol or 2-sulfamoyl-2-deoxy-D-glucose-6-sulfate) as well as in the molecular weight.
As a representative the structural formula and the 13C NMR spectrum of tinzaparin is given below [14]. According to Neville [15] the spectra of the various heparins differ especially in the region between δ = 80 and 92 ppm showing signals corresponding to C3 (~ 82 ppm), C2 (~ 86 ppm), C4 (~ 87 ppm) and C1 (~ 90 ppm) of the anhydromannose moiety and the hy-drated aldehyde group (~ 90 ppm). Using the pattern of 13C signals the various heparins of low mass can be recognized. Details are reviewed in [16].
H2OR1
R2H
CO
OOH
O
C
O
O
OH
O
CO
OHO
OO
R1OH2C
O
O
N
NR2H
n
O
O
TinzaparinR1 = H , SO3NaR2 = H , SO3Na , COCH3
R1
R1
R1
R1
n+1 Na+
Correspondingly chondroitin sulfate [17, 18] as well as bovine mucosal heparin and porcine mucosal heparin were characterized by 1H and 13C NMR spectra [19, 20, 21, 22]. The manu-facturer of dextran sulfate was determined by comparison of the pattern of 300 MHz 1H NMR spectra [23, 24].
For some years glycoconjugate vaccines are increasingly used e.g. against Haemophilus Influ-encae, meningococcal Group C disease and many pneumococcal serotypes. These conjugate vaccines consist of saccharide and protein components which can be characterized by 1H
180 160 140 120 100 80 60 40 20 0
Fig. 3: Structural formula and 13C NMR spectrum (DEPT, 300 MHz, D2O) of tinzaparin.

15
NMR spectroscopy. Identity tests were validated to control the identity and content of acetyl groups of capsular polysaccharides of Neisseria meningitis in vaccine manufacture [25,26], of Haemophilus influencae Type b in bulk ware [27], and of Salmonella typhi Vi [28]. In addi-tion it is possible to determine the size of the capsular oligosaccharide by means of NMR spectroscopy [29]. Jones and Lemercinier were also able to validate NMR identity tests (500 MHz) with regard to specificity between structurally related polysaccharides, reproducibility between batches from the same manufacturer and identical material from different manufac-turer, and robustness to variations in experimental conditions [30]. Moreover, Ravenscroft was able to track the preparation of semi-synthetic glycoconjugate vaccines by means of NMR spectroscopy [31]. Consequently the monograph of Haemophilus type b conjugate vac-cine employs 1H NMR spectroscopy for identification purposes as an alternative to immuno-chemical methods.
Tests
Most of the impurities are originated form the synthesis pathways, i.e. starting products, in-termediates and synthesis by-products, and products of decomposition of the drug. Both are evaluated as related substances mostly by means of high performance liquid chromatography (HPLC). In addition, reagents used during the course of the synthesis pathway, heavy metals and residual solvents can occur as impurities. NMR spectroscopy can be employed for quanti-fication of related substances and residual solvents.
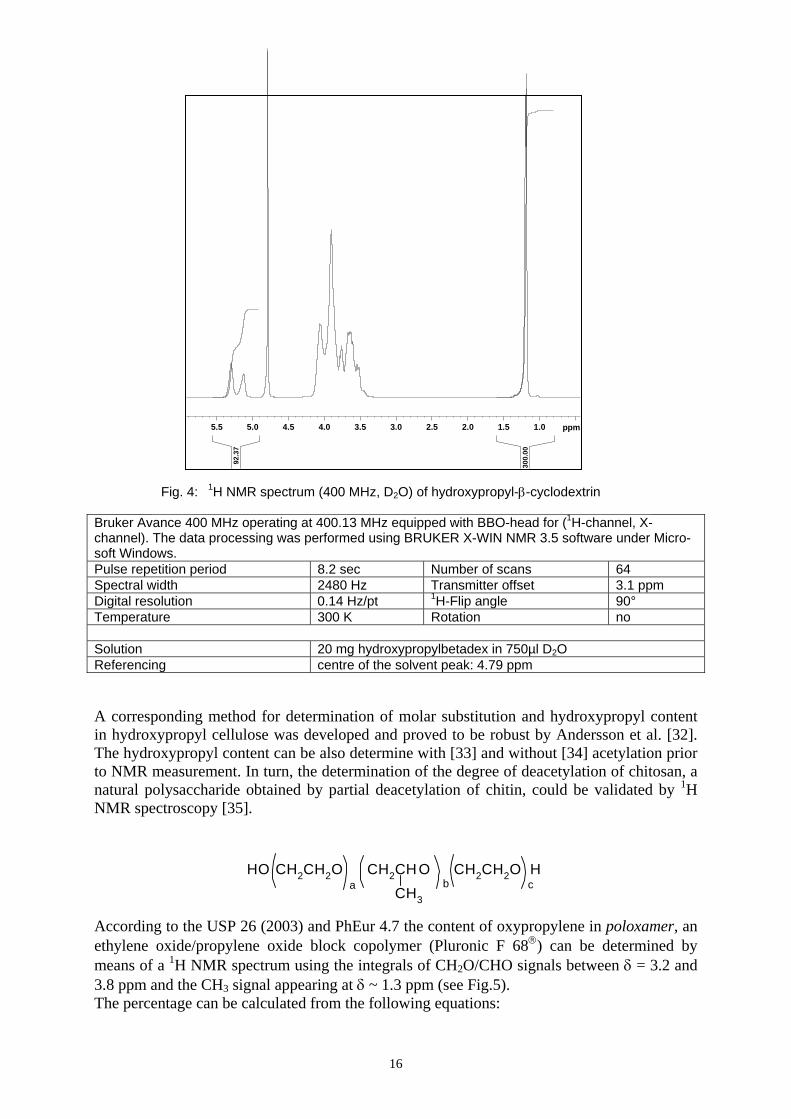
The molar substitution of hydroxypropylbetadex, known as hydroxypropyl-β-cyclodextrin, being a poly(hydroxypropyl)ether of β-cyclodextrin of random substitution in 2, 3 and 6 posi-tion is characterized by 1H NMR spectroscopy. Since no quantification procedure is described in PhEur 4.7, details of recording and processing the spectrum are given in the monograph. The spectrum shown below is produced considering the monograph. Frequency, gain, digital resolution, sample rotation, probe tuning, receiver gain etc are given in the parameter box. The molar substitution MS can be obtained by calculating the ratio of the area of the methyl groups of the signal of the hydroxypropyl group at δ = 1.2 ppm and three times the area of the signal of the glycosidic hydrogen at δ = 5.4 ppm. The MS has to be in the range of 0.40 and 1.50 and within 10% of the value stated on the label.
OH
OH
O O
OH
OHO
O
OH
OHO
OOH
OH
O
O
OH
OH
O
O
OH
OH
O
O
OHOH
O
O
OR
OR
OR
RO
RO RO
RO
* CH2 CH
O
CH3
Hn R= n=0,1,2...
The sample of hydroxypropylbetadex, evaluated here, is in agreement with the requirements of the PhEur.
7.7MS7 on substituti of Degreeppm) 5.4-(5 protons glycosidic the todue signals theof area A
ppm) (1.2 groups pylhydroxypro theofpart arech whi groups, methyl theof protons 3 the todue signal theof area A
10.191.103300
3
2
1
2
1
=⋅==
=
=⋅
=⋅
=A
AMS
Structural fomula of hydroxypropyl-β-cyclodextrin
16
OCHCH3
CH2b
HO CH2CH2Oc
CH2CH2Oa
H
Bruker Avance 400 MHz operating at 400.13 MHz equipped with BBO-head for (1H-channel, X-channel). The data processing was performed using BRUKER X-WIN NMR 3.5 software under Micro-soft Windows. Pulse repetition period 8.2 sec Number of scans 64 Spectral width 2480 Hz Transmitter offset 3.1 ppm Digital resolution 0.14 Hz/pt 1H-Flip angle 90° Temperature 300 K Rotation no Solution 20 mg hydroxypropylbetadex in 750µl D2O Referencing centre of the solvent peak: 4.79 ppm A corresponding method for determination of molar substitution and hydroxypropyl content in hydroxypropyl cellulose was developed and proved to be robust by Andersson et al. [32]. The hydroxypropyl content can be also determine with [33] and without [34] acetylation prior to NMR measurement. In turn, the determination of the degree of deacetylation of chitosan, a natural polysaccharide obtained by partial deacetylation of chitin, could be validated by 1H NMR spectroscopy [35].
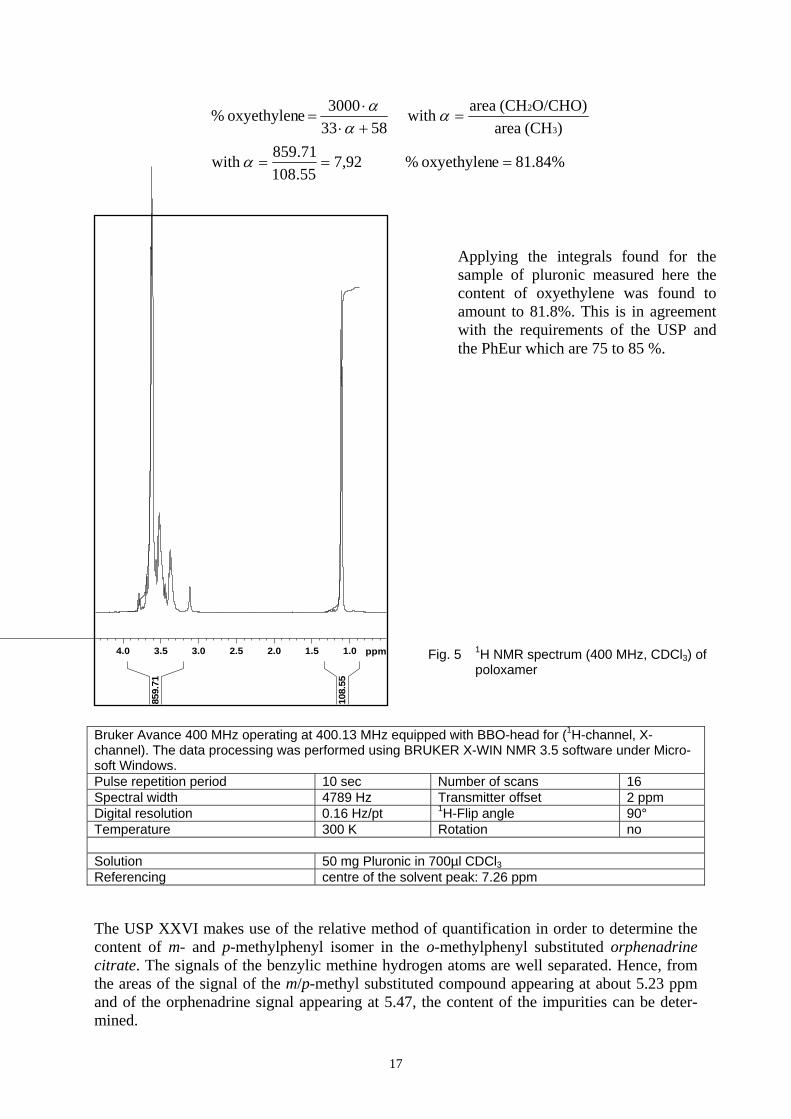
According to the USP 26 (2003) and PhEur 4.7 the content of oxypropylene in poloxamer, an ethylene oxide/propylene oxide block copolymer (Pluronic F 68®) can be determined by means of a 1H NMR spectrum using the integrals of CH2O/CHO signals between δ = 3.2 and 3.8 ppm and the CH3 signal appearing at δ ~ 1.3 ppm (see Fig.5). The percentage can be calculated from the following equations:
Fig. 4: 1H NMR spectrum (400 MHz, D2O) of hydroxypropyl-β-cyclodextrin
1.01.52.02.53.03.54.04.55.05.5 ppm
300.
00
92.3
7
17
Bruker Avance 400 MHz operating at 400.13 MHz equipped with BBO-head for (1H-channel, X-channel). The data processing was performed using BRUKER X-WIN NMR 3.5 software under Micro-soft Windows. Pulse repetition period 10 sec Number of scans 16 Spectral width 4789 Hz Transmitter offset 2 ppm Digital resolution 0.16 Hz/pt 1H-Flip angle 90° Temperature 300 K Rotation no Solution 50 mg Pluronic in 700µl CDCl3 Referencing centre of the solvent peak: 7.26 ppm The USP XXVI makes use of the relative method of quantification in order to determine the content of m- and p-methylphenyl isomer in the o-methylphenyl substituted orphenadrine citrate. The signals of the benzylic methine hydrogen atoms are well separated. Hence, from the areas of the signal of the m/p-methyl substituted compound appearing at about 5.23 ppm and of the orphenadrine signal appearing at 5.47, the content of the impurities can be deter-mined.
Fig. 5 1H NMR spectrum (400 MHz, CDCl3) of poloxamer
1.01.52.02.53.03.54.0 ppm
108.
55
859.
71
Applying the integrals found for the sample of pluronic measured here the content of oxyethylene was found to amount to 81.8%. This is in agreement with the requirements of the USP and the PhEur which are 75 to 85 %.
81.84%eoxyethylen % 92,755.10871.859with
)(CH areaO/CHO)(CH area with
58333000 eoxyethylen %
3
2
===
=+⋅⋅
=
α
αα
α
18
Beside the drug substances the chemical reference substances (CRS) have to be characterized with regard to identity and purity. Beside high performance liquid chromatography NMR spectroscopy is often used, e.g. in the case of the malathion impurity B which can be evalu-ated by means of 31P NMR spectroscopy. Assay Beside the assay of amyl nitrite no assay utilizing NMR spectroscopy is described in the In-ternational Pharmacopoeias yet. Perspective The aforementioned examples clearly demonstrate the suitability of NMR spectroscopy for drug analysis purposes. Thus, further applications can be expected in the Ph. Eur. and national European pharmacopoeias as well as the JP and the USP in the near future. The high potential of NMR spectroscopy in terms of identification and quantification of drugs and evaluation of their impurities resulting from synthesis pathways or degradation will be demonstrated in the following sections. c. Evaluation of impurities resulting from the synthesis pathways Most of the related substances are originated from the synthesis pathways. Normally the syn-thesis pathway is known and logically, the impurities are known and can be easily evaluated by means of HPLC. In the case different or new synthesis pathways are used for production of a drug, new related substances can occur which cannot be properly quantified by the HPLC method described in the international pharmacopoeias. In this context NMR spectroscopy can help to find, identify and often quantify the “new” impurities. Moreover, NMR spectroscopy is a powerful tool for impurity profiling and tracking the production ways from manufacturer to different brokers and finally to the drug manufacturer (cf. gentamicin, Chapt. III and [36, 37]). Drugs are licensed by competent authorities with regard to a defined synthesis pathway. Thus, drugs produced on a different way has to be considered as counterfeit drugs [38, 39]. Due to a increasing number of counterfeit drugs NMR spectroscopy is of growing importance in the field of drug analysis and fake.
In the following paragraph representative examples of quantitative NMR spectroscopy will be given where the NMR methods have not yet found the way into the international pharmacopoe-
ias where NMR spectroscopy has helped to identify unknown impurities of known drugs pro-
duced by a known pathway. where NMR spectroscopy is a good orthogonal method to HPLC.
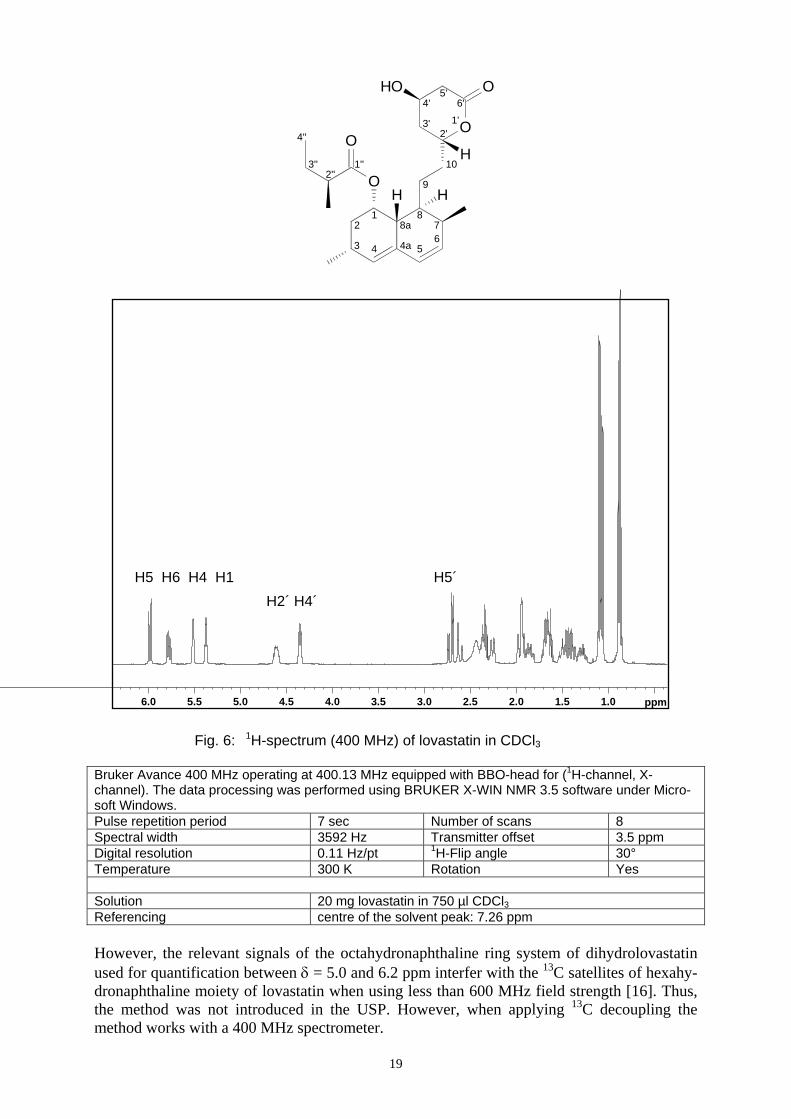
Lankhorst et al. [40] were able to evaluate 0.1 % dihydrolovastatin in lovastatin by means of a 600 MHz 1H NMR spectrum. A 400 MHz spectrum is shown below (Fig. 6)
No batch could be collected from the market which contains the m- or p-methyl substituted isomer. Thus, no spectra can be shown to dem-onstrate the method. Orphenadrine spectra can be found in [16].
ON
CH3
CH3
CH3
19
1.01.52.02.53.03.54.04.55.05.56.0 ppm
Bruker Avance 400 MHz operating at 400.13 MHz equipped with BBO-head for (1H-channel, X-channel). The data processing was performed using BRUKER X-WIN NMR 3.5 software under Micro-soft Windows. Pulse repetition period 7 sec Number of scans 8 Spectral width 3592 Hz Transmitter offset 3.5 ppm Digital resolution 0.11 Hz/pt 1H-Flip angle 30° Temperature 300 K Rotation Yes Solution 20 mg lovastatin in 750 µl CDCl3 Referencing centre of the solvent peak: 7.26 ppm However, the relevant signals of the octahydronaphthaline ring system of dihydrolovastatin used for quantification between δ = 5.0 and 6.2 ppm interfer with the 13C satellites of hexahy-dronaphthaline moiety of lovastatin when using less than 600 MHz field strength [16]. Thus, the method was not introduced in the USP. However, when applying 13C decoupling the method works with a 400 MHz spectrometer.
O
O
O
OH
H
HO
H
4'
3'2'
1'
5'6'
1''2''
3''
4''
12
3 4 4a 567
88a
9
10
Fig. 6: 1H-spectrum (400 MHz) of lovastatin in CDCl3
H5 H6 H4 H1H2´ H4´
H5´
20
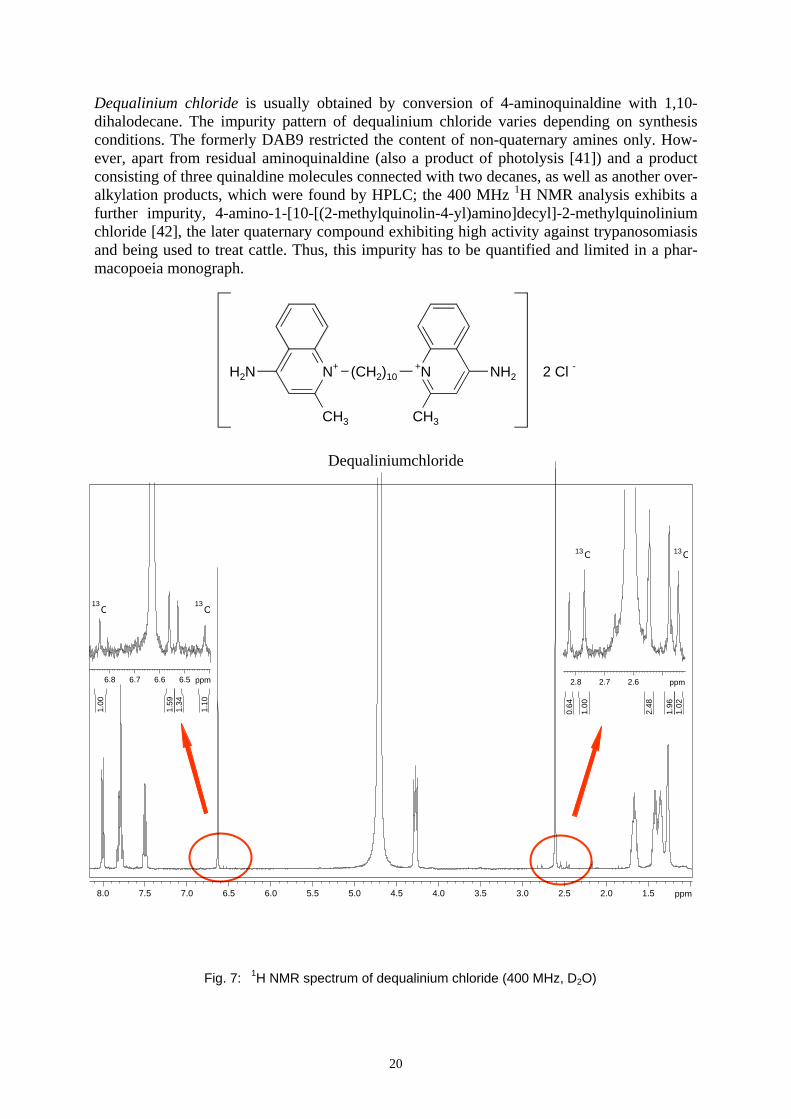
Dequalinium chloride is usually obtained by conversion of 4-aminoquinaldine with 1,10-dihalodecane. The impurity pattern of dequalinium chloride varies depending on synthesis conditions. The formerly DAB9 restricted the content of non-quaternary amines only. How-ever, apart from residual aminoquinaldine (also a product of photolysis [41]) and a product consisting of three quinaldine molecules connected with two decanes, as well as another over-alkylation products, which were found by HPLC; the 400 MHz 1H NMR analysis exhibits a further impurity, 4-amino-1-[10-[(2-methylquinolin-4-yl)amino]decyl]-2-methylquinolinium chloride [42], the later quaternary compound exhibiting high activity against trypanosomiasis and being used to treat cattle. Thus, this impurity has to be quantified and limited in a phar-macopoeia monograph.
H2N N+
CH3
(CH2)10+N
CH3
NH2 2 Cl -
Dequaliniumchloride
Fig. 7: 1H NMR spectrum of dequalinium chloride (400 MHz, D2O)
1.52.02.53.03.54.04.55.05.56.06.57.07.58.0 ppm
2.62.72.8 ppm1.
021.
96
2.48
1.00
0.64
6.56.66.76.8 ppm
1.10
1.34
1.59
1.00
13C
13
13
C
13 CC

21
Bruker Avance 400 MHz operating at 400.13 MHz equipped with BBI-head (inverse broadband ob-server for heteronucleus, inner coil tuned to1H). The data processing was performed using BRUKER X-WIN NMR 3.5 software under Microsoft Windows XP. Pulse repetition period 20 sec Number of scans 128 Spectral width 3592 Hz Transmitter offset 4.5 ppm Digital resolution 0.13 Hz/pt 1H-Flip angle 90° Temperature 300 K Rotation No Solution Dequalinium chloride saturated (<1mg) in 700µl D2O Referencing centre of the solvent peak: 4.70 ppm Inspection of the 1H NMR of the methyl region (2.6 to 2.9 ppm, Fig: 7 right insert)) revealed distinct signals for at least one of the methyl groups of each aforementioned compound. Inte-gration of these methyl signals allows the determination of the (molar or weight) composition of the samples. Some commercially available samples were found to consist of 75.7 % de-qualinium chloride, 18.2 % overalkylation impurity, 5.8 % of the new impurity and 0.3 % 4-aminoquinaldine [42,43]. These results prompted the revision of the pharmacopoeia mono-graph on the one hand in order to additionally limit the quaternary impurities and the im-provement of the synthesis on the other hand. Nowadays batches provided by Ravensberg GmbH consist of some 96 % of dequalinium chloride, less than 2 % of the overalkylation product (a), some 1.5 % of 4-amino-1-[10-[(2-methylquinolin-4-yl)amino]decyl]-2-methylquinolinium chloride (b) and less than 0.5 % of aminoquinaldine (c) and, thus, fulfil the requirements of the PhEur 4 (see Fig. 8 upper expansions).
The 13C NMR satellites having a natural abundance of the 13C-isotope of 0.56% intensity of the main signal are labelled (see Fig. 8); they can be utilized to estimate the percentage of the three impurities.
Fig. 8 Expansions of the 1H NMR spectra of two different lots of dequalinium chloride
13C 13C
ab
c
2.62.72.8 ppm
1.02
1.96
2.48
1.00
0.64
1313 CC
13C 13C
a
b
c
6.56.66.76.8 ppm
1.10
1.34
1.59
1.00
13C
13C
22
Vitamin E, +-α-tocopherol as free phenol, acetate or succinate ester, always consists of small amounts of β-, γ-, and/or δ-tocopherol. Owing to partially poor resolution and the requirement of authentic reference standard, HPLC and gas chromatography analysis turned out to be not satisfactory. Baker and Myers [44] could prove that both 1H and 13C NMR are suitable to quantify the composition of vitamin E by integration of corresponding signals.
Lacroix et al. [45] was able to determine more impurities of fenofibrate by means of a 400 MHz spectrometer than were observed with HPLC. Fenofibrate raw materials were found to contain a huge number (> 20) of impurities. With HPLC using a RP 18 symmetry ODS col-umn, a mobile phase consisting of acetonitrile/H2O/CF3COOH (700:300:1) and a UV detector set at 280 nm, about 11 known and unknown impurities could by quantified at a trace level of 0.05 to 0.1%. With the NMR method 12 known and several unknown impurities could be detected. Additionally, upon increasing the number of scans the sensitivity of the NMR method could be enhanced to detect some impurities which were not detectable by HPLC.
Interestingly two different manufacturers of sulfasalazine supplied two impurities of different structure which co-elute in the HPL chromatogram [46]. Since the mass and NMR spectra of these impurities were identical the structure was likely to be the same. The structure could be elucidated by means of 1H and 13C NMR spectra in addition of homonuclear and heteronu-clear two-dimensional experiments, i.e. COSY and HMBC to be the same.
Innumerable examples of NMR spectroscopy being involved in the elucidation of the struc-ture of impurities are reported in the literature, e.g. the isomers of lisinopril and enalapril and their diketopiperazine degradation products [47, 48], bromination side products of the bro-mocryptine production by fermentation of claviceps purpurea [48], and cimitidine oxidation products [48]. d) Evaluation of impurities from decomposition Due to the existence of ester, amide or lactams many drugs tend to undergo hydrolysis. NMR spectroscopy is not only able to identify and quantify the amount of decomposition products, but it is also appropriate to observe the pathway of the reaction, to detect intermediates and to follow the kinetics. Since a couple of water suppression methods are available in the software packages of each spectrometer, e.g WATR (= water Attenuation by T2 Relaxation) or WA-TERGATE (water suppression by gradient-tailored excitation), the hydrolysis of drugs can be observed in aqueous (physiological) media. Applying the WATR suppression method Waigh and coworker were able to determine the rate constants of the ester hydrolysis of atropine, acetylcholine, carbachol and procaine at temperatures in a range of 45 to 90 oC and at various pH values applying the Arrhenius equation [49]. The obtained results were in good agreement with data reported in the literature.
The ester propantheline, a (2-hydroxyethyl)diisopropylmethylammoniumbromide of xanthene carboxylate, tends to hydrolyze in commercial tablets when they are not stored in tightly sealed containers below 30 oC and protected from moisture. Hanna and Lau-Cam were able to determine 0.1 to 0.9 per cent free xanthanoic acid in presence 97.1 to 99.8 per cent of the drug by 1H NMR spectroscopy. In addition, they observed the course of hydrolysis at pH 2.0, 7.0 and 11.0 in aqueous solution after extraction with CDCl3 [50].
Benzodiazepine compounds consist of groups, i.e. the ester function and the imide group, which can be hydrolyzed. In physiological media the imide hydrolyzes to give the ring-opened benzophenone whose amide function decomposes to glycine and an anthranil acid derivative. Dawson and coworkers studied the reaction of flurazepam by applying 1H, 13C and 19F NMR spectroscopy in different media and at various temperatures [51, 52].
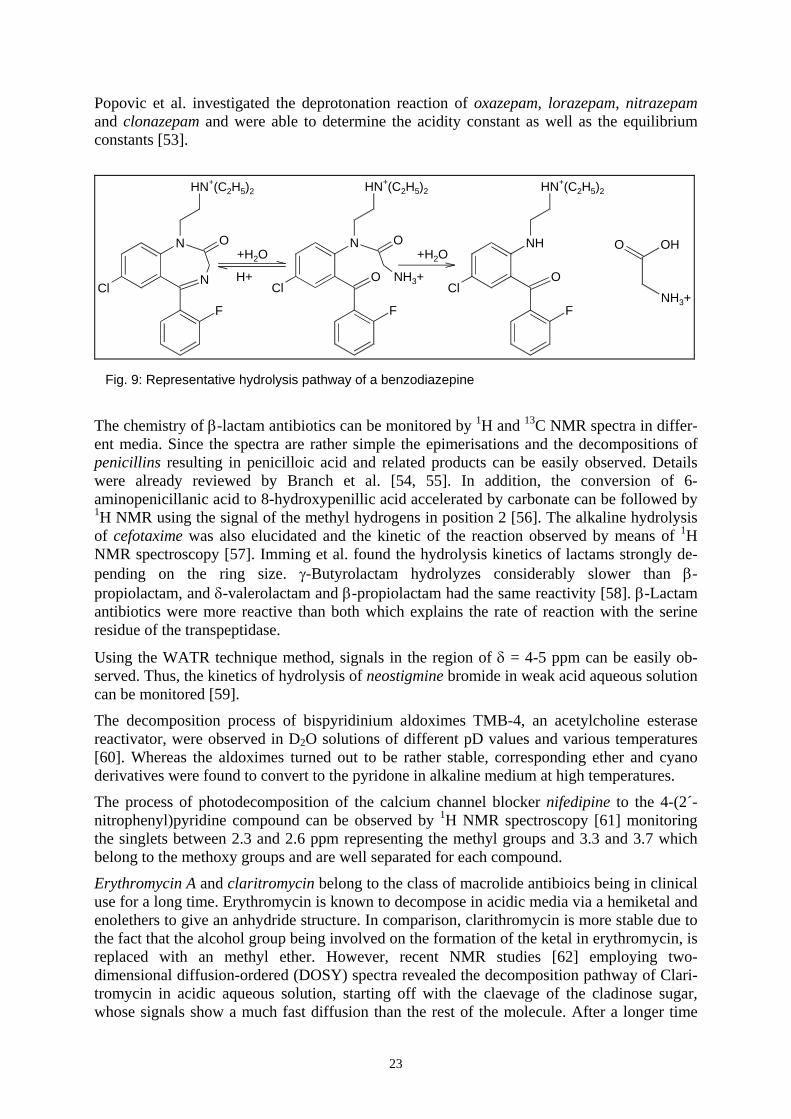
23
Popovic et al. investigated the deprotonation reaction of oxazepam, lorazepam, nitrazepam and clonazepam and were able to determine the acidity constant as well as the equilibrium constants [53].
N
Cl
F
HN+(C2H5)2
N
O N
Cl
F
HN+(C2H5)2
O+H2O
NH
Cl
F
HN+(C2H5)2
+H2O
O NH3+ OH+
OH
NH3+
O
The chemistry of β-lactam antibiotics can be monitored by 1H and 13C NMR spectra in differ-ent media. Since the spectra are rather simple the epimerisations and the decompositions of penicillins resulting in penicilloic acid and related products can be easily observed. Details were already reviewed by Branch et al. [54, 55]. In addition, the conversion of 6-aminopenicillanic acid to 8-hydroxypenillic acid accelerated by carbonate can be followed by 1H NMR using the signal of the methyl hydrogens in position 2 [56]. The alkaline hydrolysis of cefotaxime was also elucidated and the kinetic of the reaction observed by means of 1H NMR spectroscopy [57]. Imming et al. found the hydrolysis kinetics of lactams strongly de-pending on the ring size. γ-Butyrolactam hydrolyzes considerably slower than β-propiolactam, and δ-valerolactam and β-propiolactam had the same reactivity [58]. β-Lactam antibiotics were more reactive than both which explains the rate of reaction with the serine residue of the transpeptidase.
Using the WATR technique method, signals in the region of δ = 4-5 ppm can be easily ob-served. Thus, the kinetics of hydrolysis of neostigmine bromide in weak acid aqueous solution can be monitored [59].
The decomposition process of bispyridinium aldoximes TMB-4, an acetylcholine esterase reactivator, were observed in D2O solutions of different pD values and various temperatures [60]. Whereas the aldoximes turned out to be rather stable, corresponding ether and cyano derivatives were found to convert to the pyridone in alkaline medium at high temperatures.
The process of photodecomposition of the calcium channel blocker nifedipine to the 4-(2´-nitrophenyl)pyridine compound can be observed by 1H NMR spectroscopy [61] monitoring the singlets between 2.3 and 2.6 ppm representing the methyl groups and 3.3 and 3.7 which belong to the methoxy groups and are well separated for each compound.
Erythromycin A and claritromycin belong to the class of macrolide antibioics being in clinical use for a long time. Erythromycin is known to decompose in acidic media via a hemiketal and enolethers to give an anhydride structure. In comparison, clarithromycin is more stable due to the fact that the alcohol group being involved on the formation of the ketal in erythromycin, is replaced with an methyl ether. However, recent NMR studies [62] employing two-dimensional diffusion-ordered (DOSY) spectra revealed the decomposition pathway of Clari-tromycin in acidic aqueous solution, starting off with the claevage of the cladinose sugar, whose signals show a much fast diffusion than the rest of the molecule. After a longer time
Fig. 9: Representative hydrolysis pathway of a benzodiazepine
24
the remaining macrolide skeleton tend to form an enolether whose double bond shows isomer-ism. Erthromycin B, a natural component of erythromcyin, showed a similar decomposition.
The cancerostatic oxazaphosphorine drugs, such as ifosfamide, are known to be unstable. A 1H, 13C, and 31P NMR spectroscopy study [63] shed some light into the complex degradation pathways. In the first acidic hydrolysis the endocyclic P-N bond is cleaved. In the second stage of hydrolysis the remaining former exocyclic P-N bond is broken and subsequently a 2-hydroxyoxazaphosphorine ring formed which releases chloroethylamine. The final step leads to a phosphoric acid monoester.
Fluorouracil which is administered in high doses via infusion pumps and injections tend to hydrolyze in this media. Since the degradation products, i.e. fluoracetaldehyde, fluoromalonic acid semialdehyde and fluoroacetate, involve the risk of cardiotoxicity, is important to know the degree of degradation of a given injection solution. 19F NMR spectroscopy has been proved to be a suitable method [64, 65].
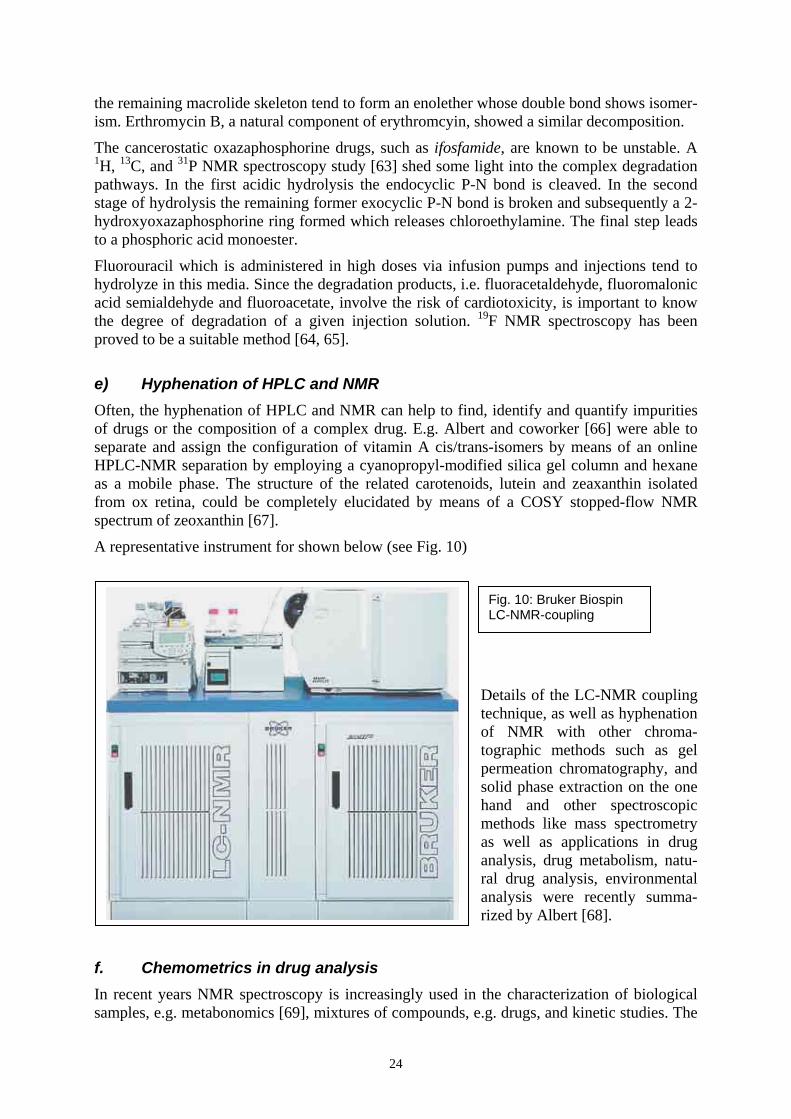
e) Hyphenation of HPLC and NMR Often, the hyphenation of HPLC and NMR can help to find, identify and quantify impurities of drugs or the composition of a complex drug. E.g. Albert and coworker [66] were able to separate and assign the configuration of vitamin A cis/trans-isomers by means of an online HPLC-NMR separation by employing a cyanopropyl-modified silica gel column and hexane as a mobile phase. The structure of the related carotenoids, lutein and zeaxanthin isolated from ox retina, could be completely elucidated by means of a COSY stopped-flow NMR spectrum of zeoxanthin [67].
A representative instrument for shown below (see Fig. 10)
Details of the LC-NMR coupling technique, as well as hyphenation of NMR with other chroma-tographic methods such as gel permeation chromatography, and solid phase extraction on the one hand and other spectroscopic methods like mass spectrometry as well as applications in drug analysis, drug metabolism, natu-ral drug analysis, environmental analysis were recently summa-rized by Albert [68].
f. Chemometrics in drug analysis In recent years NMR spectroscopy is increasingly used in the characterization of biological samples, e.g. metabonomics [69], mixtures of compounds, e.g. drugs, and kinetic studies. The
Fig. 10: Bruker Biospin LC-NMR-coupling
25
large multispectra datasets obtained from automatic sample preparation and NMR acquisition need an automated data analysis.
First, stable operating conditions, regarding the field homogeneity (i.e. shim), sample tem-perature, pH values and composition of the background matrix of the sample, have to be en-sured because these parameters influence the chemical shift sensitively. In addition, suppres-sion techniques have often to be applied to get rid of water signals or signals of other solvents, e.g. water and ethanol in beverages such as beer, which might interfere with signals of interest [70].
Second, a principle component analysis (PCA) can help to solve the problems related with phase, frequency shifts, area and linewidth [71, 72, 73, 74], which has to be done prior to pat-tern recognition and classification techniques. However, the peak alignment necessary for the automated comparison of spectra is still in the focus of chemometric research. Beside the un-favorable bucketing resulting in a loss of resolution and information genetic algorithms are also applied for peak alignment [75, 76].
Finally, the complex spectra obtained may lead to difficulties sorting out the important sig-nals. Thus, multivariate analysis methods, e.g. PCA, partial least squares (PLS) or nonlinear techniques such as neural networks, can be applied for interpretation of the samples.
Forshed et al. tried to determine the content of the impurity aminophenol in paracetamol (acetaminophen) although the signals of interest of both components were overlapping [77]. All NMR parameters including the different methods of preprocessing the NMR data were carefully examined. Zero-filling and multiplication by a negative exponential function (line broadening) of the free induced decay were applied prior to the Fourier transformation. These data were automatically phased and shifts adjusted by means of a genetic algorithm. The base-line correction was performed by multiplicative scatter correction and the spectra were com-pressed using a wavelets and sequential zeroing of weights variable selection. Neural net-works were employed for variable selection and building of the calibration model. Using the model 15 ppm of aminophenol could be evaluated.
Artificial neural networks were used to classify and quantify binary mixtures of alditol com-pounds [78]. Multivariate analysis using the PLS discriminant analysis or PCA can be em-ployed to classify components of e.g. a saponin extract of Quillaja saponaria into structurally related groups [79], to differentiate between bottom- and top-fermented beers and between fruit juices of different geographical origin and to detect additives or supplements based on other fruit types [70]; the latter examples were studied using the AMIX software of Bruker Biospin. PCA maps can be used to visualize clustering patterns of urine associated with meta-bolic response e.g. to the nephrotoxin bromoethanamine [80]. Furthermore, Nicholson and his group perform NMR-based metabonomic toxicity classification by means of PCA of metabo-lite profiles found in urine [81, 82, 83, 84].
d) Conclusion The advantages of quantitative NMR spectroscopy over HPLC techniques can be summarized as follows:
• Integration of signals is more precise and accurate than HPLC analysis,
• often, no isolation of the impurity necessary,
• no expensive chemical reference substances necessary,
• additional structural information of impurities, isomers etc.,
26
• NMR can be quicker (no equilibration time), easy to perform and more specific ⇒ high reproducibility.
However, a quantification of components is only possible in the case the signals of the com-pounds are separated and due to less sensitivity the sample size and the concentrations needed are often higher in comparison to liquid chromatography hyphenated with UV spectroscopy or mass spectrometry. Nevertheless, there are some possibilities to overcome the sensitivity problem:
• Using spectrometer of high field strength (> 400 MHz).
• Gradient shimming techniques increases the quality of spectra.
• Inverse and cryo probes increase the signal-to-noise ratio by > 5.
• Maximizing the concentration of a sample and minimizing the solvent/analyte ratio (mi-crocoil technology, e.g. Varian nano.nmr probe or Bruker MicroCryoProbes, 10-12).
• The higher the number of scan (accumulation) the higher the S/N ratio.
Since sensitivity is not only needed for quantitative purposes but also for protein NMR, in drug discovery and many other areas, the development of cryo and nano probes has made great progress in the last years, the problem of sensitivity is more and more disappearing. Limits of detection and quantification in the nanomolar range are often easy to reach.
27
References [1] T. D. W. Claridge, High-Resolution NMR techniques in organic chemistry, Pergamon
Amsterdam, 1999. [2] R. Freeman, A Handbook of nuclear magnetic resonance, Longman Scientific, Harlow,
1988. [3] T. J. Quinn, Metrologia, 34, 61-65 (1997). [4] H. Jancke, Nachr. Chem. Tech. Lab. 46, 720-722 (1998). [5] M. A. Delsuc, J. Y. Lallemand, J. Magn. Reson. 69, 504-507 (1986). [6] D. D. Traficante, Concepts Magn. Reson. 4, 153-160 (1992). [7] D. D. Traficante, L. R. Steward, Concepts Magn. Reson. 6, 131-135 (1994). [8] R. Deubner, U. Holzgrabe, Magn. Res. Chem. 40, 762-766 (2002) [9] A. G. Ferrige, J. C. Lindon, J. Magn. Reson. 31, 337-340 (1978). [10] A. E. Derome, Modern NMR techniques for chemistry research, Pergamon, Oxford, 1987 [11] NMRGuide 3.5, XWINNMR-Manual Part 1: General features and data processing, Bru-
ker Biospin GmbH, Rheinstetten. [12] M. Hesse, H. Meier, B. Zeeh, Spektroskopische Methoden in der organischen Chemie,
Thieme Stuttgart, 1995, 5. Auflage. [13] L. Szilagyi, Carbohydrate Res. 170, 1-17 (1987). [14] U. Holzgrabe, B. Diehl, I. Wawer, J. Pharm. Biomed. Anal., 17, 557 - 616 (1998). [15] G.A. Neville, T.J. Racey, P. Rochon, R.N. Rej, A.S. Perlin, J. Pharm. Sci. 79, 425-427
(1990). [16] U. Holzgrabe, I. Wawer, B.W.K. Diehl NMR spectroscopy in Drug Development and
Analysis, Wiley-VCH, Weinheim, 1999. [17] G.A. Neville, F. Mori, T.J. Racey, P. Rochon, K.R. Holme, A.S. Perlin, J. Pharm. Sci.
79, 339-343 (1990). [18] G.A. Neville, F. Mori, K.R. Holme, A.S. Perlin, J. Pharm. Sci. 78, 101-104 (1989). [19] S. Tachibana, S. Nishiura, S. Ishida, K. Kakehi, S. Honda, Chem. Pharm. Bull. 38, 2503-
2506 (1990). [20] B. Casu, M. Guerrini, A. Naggi, G. Torri, L. De-Ambrosi, G. Boveri, S. Gonella, A. Ce-
dro, L. Ferro, E. Lanzarotti, M. Paterno, M. Attolini, M.G. Valle, Arzneim.-Forsch./Drug. Res. 46, 472-477(1996).
[21] F. Nachtmann, G. Atzl, W.D. Roth, Anal. Profiles Drug Subst. 12, 215-276 (1983). [22] U.R. Desai, R.J. Linhardt, J. Pharm. Sci. 84, 212-215 (1995). [23] K.G. Ludwig-Baxter, R.N. Rej, A.S. Perlin, G.A. Neville, J. Pharm. Sci. 80, 655-660
(1992). [24] G.A. Neville, P. Rochon, R.N. Rej, A.S. Perlin, J. Pharm. Sci. 80, 239-244 (1991). [25] C. Jones, X. Lemercinier, J. Pharm. Biomed. Anal. 30, 1233-1247 (2002). [26] X. Lemercinier, C. Jones, Carbohydr. Res. 296, 83-96 (1996). [27] X. Lemercinier, C. Jones, Biologicals 28, 175-183 (2000). [28] X. Lemercinier, I. Martinez-Cabrera, C. Jones, Biologicals 28, 17-24 (2000). [29] N. Ravenscroft, G. Averani, A. Bartoloni, S. Berti, M. Bigio, V. Carinci, P. Costantino,
S. Dásceni, A. Giannozzi, F. Norelli, C. Pennatini, D. Proietti, C. Ceccarini, P. Cescut-ti, Vaccine 17, 2802-2816 1999).
[30] C. Jones, X. Lemercinier, Pharmeuropa Special Issue, Proceedings Biologicals beyond 2000, 119-129 (2000).
[31] N. Ravenscroft, Pharmeuropa Special Issue, Proceedings Biologicals beyond 2000, 131 (2000).
[32] T. Andersson, S. Richardson, M. Erickson, Pharmeuropa 15, 271-273 (2003). [33] Y. Tezuka, K. Imai, M. Oshimam T. Ciba, Carbohydr. Res. 196, 1-10 (1990).
28
[34] F.F.-L. Ho, R.R. Kohler, G.A. Ward, Anal. Chem. 44, 178-181 (1972). [35] M. Lavertu, Z. Xia, A.N. Serreqi, M. Berrada, A. Rodrigues, D. Wang, M.D. Busch-
mann, A. Gupta, J. Pharm. Biomed. Anal. 32, 1149-1158 (2003). [36] F. Wienen, R. Deubner, U. Holzgrabe, Pharmeuropa 15, 273-279 (2003). [37] R. Deubner, U. Holzgrabe, J. Pharm. Biomed. Anal., in press [38] U. Holzgrabe, R. Deubner, N. Novatchev, F. Wienen, Dtsch. Apotheker-Zeitung, 143,
3221-3228 (2003). [39] B. Hileman, C & EN 29.10.2001, 19-21. [40] P.P. Lankhorst, M.M. Poot, M.P.A. de Lange, Pharmacopeial Forum, 22, Nr. 3, 2414-
2422 (1996). [41] A.K. Parkash, J.K. Sugden, Z. Yucan, W. Mingxin, Int. J. Pharmaceutics 92, 151-155
(1993). [42] C. Boschetti, G. Fronza, C. Fuganti, P. Grasselli, A.G.Magnone, A. Mele, C. Pellegatta,
Arzneim.-Forsch./Drug Res. 45, 1217-1221 (1995). [43] G. Grübler, W. Voelter, H. Henke, H. Mayer, Pharm. Ind. 52, 794-800 (1990). [44] J.K. Baker, C.W. Myers, Pharm. Res. 8, 763-770 (1991). [45] P.M. Lacroix, D.D. Dawson, R.W. Sears, D.B. Black, T.D. Cyr, J.-C. Ethier, J. Pharm.
Biomed. Anal. 18, 383-402 (1998). [46] U. Rose, Pharmeuropa 11, 277-281 (1999). [47] A. Demeter, T. Fodor, J. Fischer, J. Mol. Struct. 471, 161-174 (1998). [48] C. Szantay, D. Demeter in: Identificationand determination of Impurities in Drugs (Ed. S.
Görög), Elsevier, Amsterdam, 2000, Chapt.2.4, pp 10.9. [49] A.J. Ferdous, N.A. Dickinson, R.D. Waigh, J. Pharm. Pharmacol. 43, 860-82 (1991) [50] G.M. Hanna, C.A. Lau-Cam, Pharmazie 56, 700-703 (2001). [51] B.A. Dawson, D.B. Black, G.A. Neville, J. Pharm. Biomed. Anal. 13, 395-407 (1995). [52] G.A. Neville, H.D. Beckstead, D.B. Black, B.A. Dawson, H.F. Shurvell, J. Pharm. Sci.
83, 1274-1279 (1994). [53] G.V. Popovic, D.M. Sladic, V.M. Stefanovic, L.B. Pfendt, J. Pharm. Biomed. Anal. 31,
693-699 (2003). [54] S.K. Branch, A.F. Casy, E.M.A. Ominde, J. Pharm. Biomed. Anal. 5, 73-103 (1987) [55] S.K. Branch, A.F. Casy, A. Lipczynski, E.M.A. Ominde, Magn. Res. Chem. 24, 465-479
(1986) [56] A.F. Casy, A. Lipczynski, J. Pharm. Pharmacol. 46, 533-534 (1994). [57] B. Vilanova, F. Munoz, J. Donoso, J. Frau, F.G. Blanco, J. Pharm. Sci. 83, 322-327
(1994). [58] P. Imming, B. Klar, D. Dix, J. Med. Chem. 43, 4328-4331 (2000). [59] A.J. Ferdous, N.A. Dickinson, R.D.Waigh, J. Pharm. Pharmacol. 45, 559-562 (1993). [60] E. Inkmann, U. Holzgrabe, K.F. Hesse, Pharmazie, 52, 764-774 (1997). [61] G.S. Sadane, A.B. Ghogare, J. Pharm. Sci. 80, 895-898 (1991). [62] M.N. Mordi, M.D. Pelta, V. Boote, G.A. Morris, J. Barber, J. Med. Chem. 43, 467-474
(2000). [63] V. Gilard, R. Martino, M. Malet-Martino, U. Niemeyer, J. Pohl, J. Med. Chem. 42, 2542-
2560 (1999). [64] A. Fournat, V. Gilard, M. Malet-Martino. R. Martino, P. Canal, M. De Forni, Cancer
Chemother. Pharmacol. 46, 501-506 (2000). [65] L. Lemaire, M.C. Malet-Martino, R. Martino, M. De Forni, B. Lasserre, Onc. Reports 1,
173-174 (1994). [66] K. Albert, G. Schlotterbeck, U. Braumann, H. Händel, M. Spraul, G. Krack, Angew.
Chem. Int. Ed. Engl. 34, 1014-1016 (1995). [67] M. Dachtler, K. Kohler, K. Albert, J. Chromatogr. B, 720, 211-216 (1998).

29
[68] K. Albert, On-line LC-NMR and Related techniques, Wiley, New York, 2003. [69] J.C. Lindon, E. Hulmes J.K. Nicholson, Prog. Nucl. Magn. Res. 39, 1-40 (2001) [70] M. Spraul, E. Humpfer, S. Keller, H. Schäfer, Spin-Report Bruker, 154/155, 26-30 (2004). [71] R. Stoyanova, A.C. Kuesel, T.R. Brown, J. Magn. Res. A 115, 265-269 (1995). [72] T.R. Brown, R. Stoyanova, J. Magn. Res. B 112, 32-43 (1996). [73] T.R. Brown, R. Stoyanova, J. Magn. Res. 154, 63-175 (2002). [74] R. Stoyanova, T.R. Brown, NMR in Biomed. 14, 271-277 (2001). [75] J. Forshed, I. Schuppe-Koistinen, S.P. Jacobsson, Anal. Chim. Acta 487, 189-199 (2003) [76] R. J.O. Torgrip, M. Åberg, B. Karlberg, S.P. Jacobson, J. Chemometrics 17, 573-582
(2003). [77] J. Forshed, F.O. Andersson, S.P. Jacobsson, J. Pharm. Biomed. Anal. 29, 495-505
(2002). [78] S.R. Amendolia, A. Dopplu, M.L. Ganadu, G. Lubinu, Anal. Chem. 70, 1249-1254
(1998). [79] L.I. Nord, L. Kenne, S. P. Jacobsson, Anal. Chim. Acta 446, 199-209 (2001). [80] B.C.M. Potts, A.J. Deese, G.J. Stevens, M.D. Reily, D.G. Robertson, J. Theiss, J. Pharm.
Biomed. Anal. 26, 463-476 (2001). [81] E. Holmes, A.W. Nicholls, J.C- Lindon, S.C. Connor, J.C. Connelly, J.N. Haselden,
S.J.P. Damment, M. Spraul, P. Neidig, JK. Nicholson, Chem. Res. Toxicol. 13, 471-478 (2000).
[82] T. Ebbels, H. Keun, O. Beckonert, H. Antti, M. Bollard, E. Holmes, J. Lindon, J.K. Nicholson, Anal. Chim. Acta 490, 109-122 (2003).
[83] H.C. Keun, T.M.D. Ebbels, H. Antti, M.E. Bollard, O. Beckonert, E. Holmes, J.C. Lin-don, J.K. Nicholson, Anal. Chim. Acta 490, 265-276 (2003).
[84] O. Beckonert, M.E. Bollard, T.M.D. Ebbels, H.C. Keun, H. Antti, E. Holmes, J.C. Lin-don, J.K. Nicholson, Anal. Chim. Acta 490, 3-15 (2003).