Embed Size (px)
Citation preview

ER
DC
/CH
L T
R-0
2-22
Coastal Inlets Research Program
NMLONG: Numerical Model for Simulating Longshore Current
Report 2 Wave-Current Interaction, Roller Modeling, and Validation of Model Enhancements Magnus Larson and Nicholas C. Kraus September 2002
Co
as
tal
an
d H
yd
rau
lic
s L
ab
ora
tory
Approved for public release; distribution is unlimited.

Report Documentation Page
Report Date 01SEP2002
Report Type N/A
Dates Covered (from... to) -
Title and Subtitle NMLONG: Numerical Model for Simulating LongshoreCurrent; Report 2, Wave-Current Interaction, RollerModeling, and Validation of Model Enhancements
Contract Number
Grant Number
Program Element Number
Author(s) Project Number
Task Number
Work Unit Number
Performing Organization Name(s) and Address(es) Department of Water Resources Engineering, LundUniversity, Box 118, Lund, Sweden S-22100; U.S. ArmyEngineer Research and Development Center, Coastal andHydraulics Laboratory, 3909 Halls Ferry Road, Vicksburg,MS 39180-6199
Performing Organization Report Number
Sponsoring/Monitoring Agency Name(s) and Address(es) U.S. Army Corps of Engineers Washington, DC 20314-1000
Sponsor/Monitor’s Acronym(s)
Sponsor/Monitor’s Report Number(s)
Distribution/Availability Statement Approved for public release, distribution unlimited
Supplementary Notes The original document contains color images.
Abstract
Subject Terms
Report Classification unclassified
Classification of this page unclassified
Classification of Abstract unclassified
Limitation of Abstract UU
Number of Pages 88

PRINTED ON RECYCLED PAPER
The contents of this report are not to be used for advertising, pub-lication, or promotional purposes. Citation of trade names does not constitute an official endorsement or approval of the use of such commercial products. The findings of this report are not to be construed as an official Department of the Army position, unless so designated by other authorized documents.


iii
Contents
Preface.............................................................................................................viii 1―Introduction..................................................................................................1 Problem Statement and Objectives.............................................................1 Overview of Procedure ...............................................................................1 Report Content ............................................................................................3 2―Review of Selected Literature .....................................................................4 Wave-Current Interaction and Its Modeling ..............................................4 Modeling Momentum Transport in Breaking Waves ................................5 Laboratory and Field Data on Nearshore Currents ....................................6 3―Wave Model...............................................................................................10 Introduction ...............................................................................................10 Wave Action Flux Conservation Equation...............................................11 Wave Kinematics ......................................................................................11 Wave Orthogonals and Wave Rays ..........................................................14 Wave Refraction .......................................................................................15 Wave Breaking and Energy Dissipation ..................................................15 Wave Blocking..........................................................................................17 Cross-Shore Momentum Equation ...........................................................20 Modeling the Roller ..................................................................................21 Numerical Implementation .......................................................................22 4―Verification of Wave Model .....................................................................25 Introduction ...............................................................................................25 CHL-I Data................................................................................................25 Chawla and Kirby (C&K Data) ................................................................27 Effects of Including Roller .......................................................................35 Example Calculation of Wave Transformation at Tidal Inlet..................38 Concluding Remarks.................................................................................38 5―Longshore Current Model .........................................................................41 Introduction ...............................................................................................41 Longshore Momentum Equation ..............................................................41 Bottom Friction .........................................................................................42 Numerical Solution ...................................................................................43 Modification of Roller Model...................................................................43

iv
6―Verification of Longshore Current Model ............................................... 44 Visser Data ............................................................................................... 44 CHL-L Data.............................................................................................. 54 Kraus-Sasaki (K&S Data) ........................................................................ 59 Kuriyama-Ozaki (K&O) Data.................................................................. 63 Delilah Data.............................................................................................. 65 Effects of Large-Scale (Tidal) Current on Wave-Generated Current ..................................................................................................... 66 Concluding Remarks................................................................................ 69 7―Summary and Conclusions ....................................................................... 71 References ....................................................................................................... 73
List of Figures
Figure 1. Definition sketch for waves propagating on current .................... 12
Figure 2. Examples of solutions to dispersion equation with current present............................................................................... 14
Figure 3. Nondimensional blocking speed as function of relative water depth d/Lo ...................................................................................................................19
Figure 4. Calculated and measured significant wave height for Smith et al. (1998) Run 5.............................................................. 28
Figure 5. Calculated and measured significant wave height for Smith et al. (1998) Run 7.............................................................. 28
Figure 6. Calculated and measured significant wave height for Smith et al. (1998) Run 9.............................................................. 29
Figure 7. Calculated and measured significant wave height for Smith et al. (1998) Run 11............................................................ 29
Figure 8. Calculated and measured wave height for Chawla and Kirby (1999) Test M3.............................................................................. 32
Figure 9. Calculated and measured wave height for Chawla and Kirby (1999) Test M4.............................................................................. 32
Figure 10. Calculated and measured wave height for Chawla and Kirby (1999) Test M11............................................................................ 33
Figure 11. Calculated and measured wave height for Chawla and Kirby (1999) Test M18............................................................................ 33
Figure 12. Calculated and measured wave height for Chawla and Kirby (1999) Test M18............................................................................ 34

v
Figure 13. Calculated and measured wave height for Chawla and Kirby (1999) Test R2 .............................................................................. 36
Figure 14. Calculated and measured wave height for Chawla and Kirby (1999) Test R4 .............................................................................. 36
Figure 15. Calculated and measured wave height for Chawla and Kirby (1999) Test R15 ............................................................................ 37
Figure 16. Calculated and measured wave height for Chawla and Kirby (1999) Test R19 ............................................................................ 37
Figure 17. Calculated wave transformation on flood and ebb currents for conditions representative of Shinnecock Inlet, Long Island ....... 39
Figure 18. Wave breaking and blocking by ebb current at Shinnecock Inlet, Long Island.......................................................................... 39
Figure 19. Calculated and measured longshore current for Visser (1982), Case 1 ............................................................................... 46
Figure 20. Calculated and measured mean water level for Visser (1982), Case 1 ............................................................................... 46
Figure 21. Calculated and measured wave height for Visser (1982), Case 1............................................................................................ 47
Figure 22. Calculated and measured longshore current for Visser (1982), Case 3 ............................................................................... 47
Figure 23. Calculated and measured mean water level for Visser (1982), Case 3 ............................................................................... 48
Figure 24. Calculated and measured wave height for Visser (1982), Case 3............................................................................................ 48
Figure 25. Calculated and measured longshore current for Visser (1982), Case 4 ............................................................................... 49
Figure 26. Calculated and measured mean water level for Visser (1982), Case 4 ............................................................................... 49
Figure 27. Calculated and measured wave height for Visser (1982), Case 4............................................................................................ 50
Figure 28. Calculated and measured longshore current for Visser (1982), Case 7 ............................................................................... 50
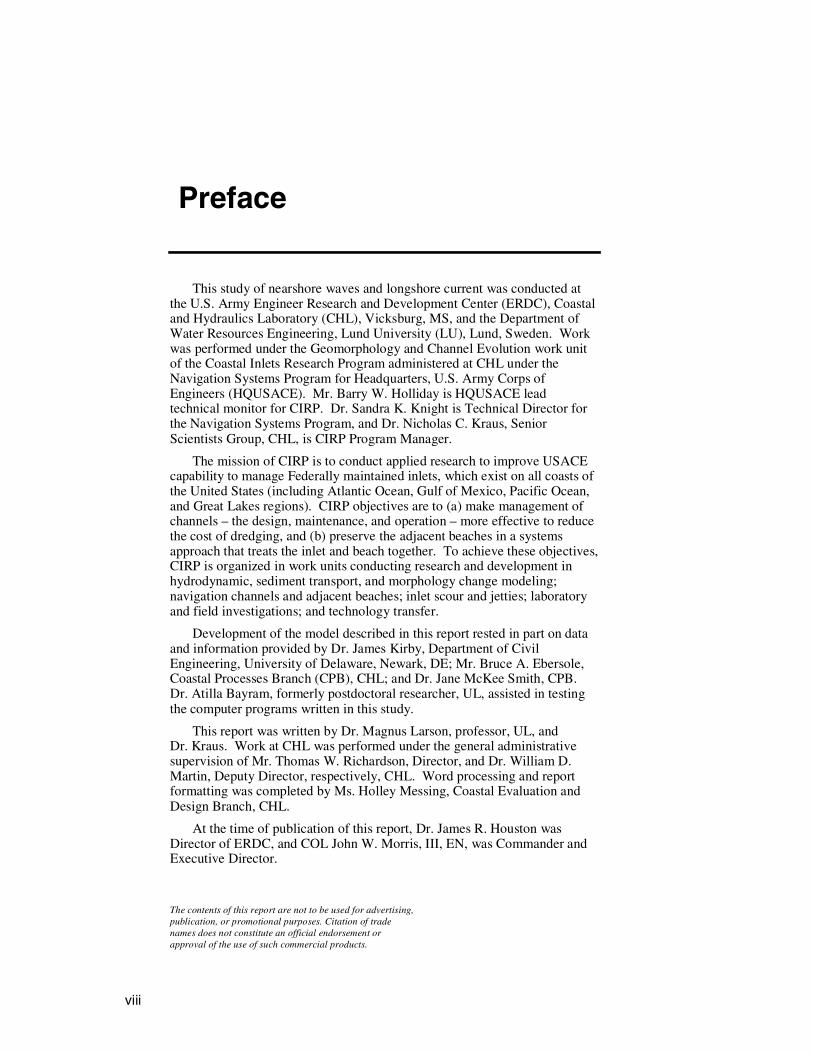
Figure 29. Calculated and measured wave height for Visser (1982), Case 7............................................................................................ 51
Figure 30. Calculated and measured longshore current for Visser (1982), Case 1 ............................................................................... 53
Figure 31. Calculated and measured mean water elevation for Visser (1982), Case 1 ............................................................................... 53
Figure 32. Calculated and measured wave height for Visser (1982), Case 1...........................................................................................54
Figure 33. Calculated and measured longshore current for Hamilton and Ebersole (2001), Test 6N......................................................55
Figure 34. Calculated and measured mean water elevation for Hamilton and Ebersole (2001), Test 6N......................................................56

vi
Figure 35. Calculated and measured wave height for Hamilton and Ebersole (2001), Test 6N............................................................ 56
Figure 36. Calculated and measured longshore current for Hamilton and Ebersole (2001), Test 8E...................................................... 57
Figure 37. Calculated and measured mean water elevation for Hamilton and Ebersole (2001), Test 8E...................................................... 58
Figure 38. Calculated and measured wave height for Hamilton and Ebersole (2001), Test 8E ............................................................ 58
Figure 39. Calculated (with and without) and measured longshore current for Kraus and Sasaki (1979) field experiment............... 60
Figure 40. Calculated (two different dissipation coefficient) and measured longshore current for Kraus and Sasaki (1979)
field experiment .......................................................................... 60
Figure 41. Calculated (two different mixing formulations) and measured longshore current for Kraus and Sasaki (1979) field
experiment................................................................................... 62
Figure 42. Calculated and measured longshore current for Kuriyama and Ozaki (1993) field experiment............................................. 64
Figure 43. Calculated and measured significant wave height for Kuriyama and Ozaki (1993) field experiment............................ 64
Figure 44. Calculated and measured longshore current for Kuriyama and Ozaki (1993)......................................................................... 65
Figure 45. Calculated and measured longshore current for Delilah field experiment, Case 100 ......................................................... 67
Figure 46. Calculated and measured rms wave height for Delilah field experiment, Case 100 ......................................................... 67
Figure 47. Calculated and measured longshore current for Delilah (1993) field experiment, Case 1000 ....................................................... 68
Figure 48. Calculated and measured rms wave height for Delilah field experiment, Case 1000 ....................................................... 68
Figure 49. Results of simulating large-scale current on wave-generated nearshore current........................................................ 69

vii
List of Tables
Table 1. Target Wave Conditions for Selected Runs from Smith et al. (1998) Experiments Used in NMLong-CW Simulations ................26
Table 2. Wave Conditions for Selected Monochromatic Tests from Chawla and Kirby (1999) Experiment Used in NMLong-CW
Simulations .......................................................................................30
Table 3. Wave Conditions for Selected Random Tests from Chawla and Kirby (1999) Experiment Used in NMLong-CW Simulations .......30
Table 4. Wave Conditions in Horizontal Portion of Basin for Selected Cases from the Visser (1982) Experiments Used in NMLong-CW Simulations ...............................................................45
Table 5. Wave Conditions in Horizontal Portion of Basin for Two Tests from Hamilton and Ebersole (2001) Experiment Used in NMLong-CW Simulations .......................................................................................54
viii
Preface
This study of nearshore waves and longshore current was conducted at the U.S. Army Engineer Research and Development Center (ERDC), Coastal and Hydraulics Laboratory (CHL), Vicksburg, MS, and the Department of Water Resources Engineering, Lund University (LU), Lund, Sweden. Work was performed under the Geomorphology and Channel Evolution work unit of the Coastal Inlets Research Program administered at CHL under the Navigation Systems Program for Headquarters, U.S. Army Corps of Engineers (HQUSACE). Mr. Barry W. Holliday is HQUSACE lead technical monitor for CIRP. Dr. Sandra K. Knight is Technical Director for the Navigation Systems Program, and Dr. Nicholas C. Kraus, Senior Scientists Group, CHL, is CIRP Program Manager.
The mission of CIRP is to conduct applied research to improve USACE capability to manage Federally maintained inlets, which exist on all coasts of the United States (including Atlantic Ocean, Gulf of Mexico, Pacific Ocean, and Great Lakes regions). CIRP objectives are to (a) make management of channels – the design, maintenance, and operation – more effective to reduce the cost of dredging, and (b) preserve the adjacent beaches in a systems approach that treats the inlet and beach together. To achieve these objectives, CIRP is organized in work units conducting research and development in hydrodynamic, sediment transport, and morphology change modeling; navigation channels and adjacent beaches; inlet scour and jetties; laboratory and field investigations; and technology transfer.
Development of the model described in this report rested in part on data and information provided by Dr. James Kirby, Department of Civil Engineering, University of Delaware, Newark, DE; Mr. Bruce A. Ebersole, Coastal Processes Branch (CPB), CHL; and Dr. Jane McKee Smith, CPB. Dr. Atilla Bayram, formerly postdoctoral researcher, UL, assisted in testing the computer programs written in this study.
This report was written by Dr. Magnus Larson, professor, UL, and Dr. Kraus. Work at CHL was performed under the general administrative supervision of Mr. Thomas W. Richardson, Director, and Dr. William D. Martin, Deputy Director, respectively, CHL. Word processing and report formatting was completed by Ms. Holley Messing, Coastal Evaluation and Design Branch, CHL.
At the time of publication of this report, Dr. James R. Houston was Director of ERDC, and COL John W. Morris, III, EN, was Commander and Executive Director.
The contents of this report are not to be used for advertising, publication, or promotional purposes. Citation of trade names does not constitute an official endorsement or approval of the use of such commercial products.

Chapter 1 Introduction 1
1 Introduction
Problem Statement and Objectives The Numerical Model of the Longshore current (NMLong) (Kraus and Larson 1991; Larson and Kraus 1991) was developed under the U.S. Army Corps of Engineers’ Dredging Research Program. The original model calculates nearshore wave transformation, water level change, and wave-induced longshore current across a single beach profile, under the assumption of longshore uniformity in both the profile and hydrodynamic processes. The original NMLong solves the wave energy flux conservation equation, including shoaling, refraction, breaking, and reforming, employing a Monte-Carlo simulation technique to describe random waves. Wave energy dissipation accompanying depth-limited breaking is described in accordance with the model of Dally, Dean, and Dalrymple (1985). The cross-shore momentum equation is solved numerically to obtain the water level change, and the alongshore momentum equation yields the distribution of the longshore current velocity across the shore. Wind-induced setup and setdown are included, as well as longshore currents generated by local winds. Nonlinear bottom friction is computed from a rapidly solved approximation, and lateral mixing is modeled with an eddy viscosity that depends on the local orbital velocity and wave height.
In considering the nearshore more generally, both tidal and wind-generated currents can be comparable to or exceed the strength of the wave-generated longshore current. Also, currents produced independently by waves and by wind and tide may be in opposite directions, producing complex distributions of the current across the shore. The capability of representing the action of currents in NMLong and the interaction between the current and waves resulted in a new model with the modified name NMLong-CW, where CW stands for interaction between currents and waves. Furthermore, this new model included an algorithm to simulate the contribution of wave rollers generated by breaking waves.
This report documents the theoretical developments associated with the enhancement of NMLong that have extended it to NMLong-CW. The new model is validated by sensitivity tests and through comparison of calculations to measurements.
Overview of Procedure The theoretical as well as the numerical formulations employed in NMLong (Kraus and Larson 1991) served as the starting point for the development of NMLong-CW. However, wave transformation in NMLong-CW is computed through the equation for conservation of wave action flux,

2 Chapter 1 Introduction
as opposed to conservation of wave energy flux as underlying NMLong, so that the interaction between the current and waves can be represented. Alongshore uniformity in hydrodynamic and beach characteristics is still a requirement, but an arbitrary angle between the current and wave directions is permitted, so that the wave-current interaction from a cross-shore current might be simulated. This capability allows NMLNG-CW to calculate wave transformation, for example, in a narrow inlet for waves arriving with crests normally incident to the inlet entrance. The dispersion relationship was modified to include a current, which in turn modifies wave refraction computed through Snell’s law. Wave energy dissipation associated with depth-limited breaking is described in accordance with the model of Dally, Dean, and Dalrymple (1985), who postulated that the energy dissipation is proportional to the wave energy flux over a stable flux given by the water depth. For waves breaking on a current, a similar formulation is employed, where the stable flux is obtained based on the limiting wave derived from a Miche-type criterion. Thus, both depth- and steepness-limited breaking are included in NMLong-CW, as well as wave decay through energy dissipation. Wave blocking by an opposing current is also represented in NMLong-CW.
As in NMLong, the longshore current and mean water level are calculated by the longshore and cross-shore momentum equations, respectively. The wave properties expressed in a relative frame of reference (moving with the current) serve as input to compute wave-related quantities in the momentum equations. In the longshore momentum equation, wind-generated and external currents are incorporated besides the wave-driven currents. Thus, NMLong-CW allows for specification of an external current, for example, large-scale tidal currents or the ebb jet from a tidal entrance. The user of the model must provide this external current, and it can be based either on observations or on simulation results from other models, thus being an input quantity. Integrating such a predefined current into the longshore and cross-shore momentum equations necessarily requires certain simplifications, as discussed in the following chapters. Nonlinear friction and lateral mixing are included in the same manner as for NMLong.
To model the shift in the peak of the longshore current and maximum set-down observed in laboratory as well as in field data, the roller model developed by Dally and Brown (1995) was implemented in NMLong-CW. Thus, a wave energy balance equation for the roller was added in the model that yields the growth and decay of the roller through the surf zone. The cross-shore variation in roller mass flux is calculated through this equation, from which the momentum fluxes in the cross-shore and longshore direction are obtained. These momentum fluxes are included in the cross-shore and longshore momentum equations, with the result that the forcing for the longshore current and mean water level is translated shoreward.
The numerical formulation follows the approach taken in NMLong and will not be discussed in detail in this report (see Kraus and Larson 1991). A wave-by-wave description is employed to simulate the random wave field assuming narrow-bandedness in wave period and direction. Thus, a single wave period and incident wave angle are sufficient to characterize the wave field for the time scale of the simulations, and the randomness only enters through the wave height assumed to be Rayleigh distributed. The driving forces for the wave-generated current and mean water level change are expressed in terms of averages based on the calculations carried out for the ensemble of waves selected. In solving the governing equations, NMLong-CW employs iterations at several different levels to allow for full interaction

Chapter 1 Introduction 3
between currents and waves. For example, iterations are required to solve the dispersion relationship including a current simultaneously with Snell’s law for refraction, as well as to determine the wave field in the presence of a current (these two quantities are coupled through the governing equations). NMLong-CW is thus computationally more demanding than NMLong.
NMLong-CW was evaluated by applying it to simulate several hypothetical situations as well as laboratory and field data. The validation of the NMLong-CW focused on the two major enhancements made in the model, namely wave-current interaction and roller modeling. Data sets that featured these two aspects were selected for comparison with the model. Laboratory data from Smith et al. (1998) and Chawla and Kirby (1998, 1999) were employed to investigate the wave transformation on an opposing current, regarding both wave blocking and energy dissipation for waves breaking on a current. These data sets included both monochromatic and random waves. The laboratory data on the longshore current from Visser (1982) was revisited to investigate the consequences of taking into account full wave-current interaction as well as of including roller modeling. Additionally, a more recently available data set of a similar kind to that of Visser (1982) but of larger scale (monochromatic and random waves) was employed (Hamilton and Ebersole 2001).
Three field data sets were included in the comparison, namely, Kraus and Sasaki (1979), Kuriyama and Ozaki (1993), and Smith, Larson, and Kraus (1993). These data sets involve more complicated profile shapes; in particular, longshore bars were present across the profile in the two latter data sets. Several sample calculations are also included to demonstrate the capabilities of NMLong-CW to simulate the interaction between currents and waves.
Report Content

4 Chapter 2 Brief Literature Review
2 Review of Selected Literature
This selective literature review aims at presenting previous work pertinent to the enhancements made in NMLong. Thus, key papers regarding the interaction between currents and waves and the modeling of the roller in the surf zone are of central interest. Also, a summary is given of studies that involved laboratory and field data collection on nearshore currents.
Kraus and Larson (1991) and Larson and Kraus (1991) provide a detailed theoretical background to NMLong, including a comprehensive verification of the model. The literature to 1991 was comprehensively reviewed. The references in those publications may be consulted for a more general discussion of the basic equations employed in the modeling of the cross-shore distribution of waves, mean water level, and longshore current.
Wave-Current Interaction and Its Modeling Bretherton and Garrett (1969) showed that, for waves propagating on a current, it is the wave action, defined as the wave energy divided by the intrinsic (relative) frequency, that is conserved and not wave energy. The wave action equation that they derived is the starting point for modeling wave transformation in the presence of a current. Jonsson, Skovgaard, and Wang (1970) studied waves propagating on a steady current and derived the linear dispersion relation for waves on a current. Conditions for wave blocking, that is, when an opposing current prevents the waves from traveling further, were established. Jonsson (1978) further discussed the wave action equation, and Jonsson and Skovgaard (1978) included energy dissipation (e.g., due to breaking or friction in the bottom boundary layer) in this equation. Furthermore, Jonsson and Skovgaard (1978) studied wave refraction across a shearing current, and Jonsson and Christoffersen (1984) expanded this study to encompass varying depth. Jonsson (1990) made a comprehensive review of the interaction between waves and a current. In the next chapter, the theoretical foundation for NMLong-CW is discussed, and a significant amount of the material was adapted from or inspired by the Jonsson (1990) review.
A few engineering numerical models that employ the wave action equation to simulate wave transformation in the presence of a current have previously been presented. Southgate (1987, 1989) developed a one-dimensional computational model to simulate waves, wave-induced currents, and tidal currents in coastal regions. The wave action equation was solved to obtain the cross-shore distribution of wave heights, including energy dissipa-tion due to wave breaking and bottom friction. The method proposed by

Chapter 2 Brief Literature Review 5
Battjes and Janssen (1978) to compute the energy dissipation due to breaking of random waves was utilized. The longshore current was obtained by solving the longshore momentum equation with linearized friction and including driving terms from waves and tides. Wijnberg and Van Rijn (1995) and Van Rijn and Wijnberg (1996) also computed with the wave action equation to simulate wave transformation and wave-generated longshore current across a profile. In these modeling efforts, verification of the model simulations was done mainly for cases where the interaction between the waves and consideration of the properties of the longshore current was relatively minor. For example, no simulations were made for waves propagating on opposing currents where appreciable shoaling, breaking, and blocking occurred because of the presence of the current.
In recent years, capabilities have advanced for numerical simulation of wave-current interaction. For example, there have been a number of studies on two-dimensional (2-D), spectrally based modeling. It is not the aim here to cover that development; however, selected studies will be mentioned in the following because of relevance to the present work. The verification of such models through comparison to laboratory and field data is still fairly limited. Holthuijsen, Booij, and Herbers (1989) developed a steady-state numerical model for hindcasting of waves in shallow water employing an Eulerian formulation of the spectral action equation. This model has been employed to simulate some field cases, including a tidal inlet in the Netherlands (Booij, Holthuijsen, and De Lange 1992) and wave propagation in the Columbia River entrance (Verhagen, Holthuijsen, and Won 1992), although the available data sets for verification were limited. Holthuijsen, Booij, and Ris (1993) extended the work by Holthuijsen, Booij, and Herbers (1989) by allowing for time variations and more general properties of the spectrum. This new, 2-D model, known as SWAN, was employed to calculate the wave height transformation on an opposing current including blocking (Ris and Holthuijsen 1996), and comparisons were made with laboratory data from Lai, Long, and Huang (1989). Smith and Smith (2001) describe application of the STeady-state spectral WAVE model (STWAVE) (Resio 1987, 1988a, 1988b; Smith, Sherlock, and Resio 2001) to model waves influenced by the tidal current at the entrance to Ponce de Leon Inlet, FL. STWAVE simulates the wave-current interaction on a 2-D grid. Reasonable agreement was found between calculations and measurements on the ebb shoal.
Modeling Momentum Transport in Breaking Waves Several investigations have shown that that the peak of the longshore current (Visser 1982; Smith, Larson, and Kraus 1993) and the location of maximum setdown (Bowen, Inman, and Simmons 1968; Van Dorn 1976) are located more shoreward than what numerical models have tended to predict. An early hypothesis for this shoreward shift was that the wave energy dissipation commences at the plunge point rather than at the break point (Visser 1984). The rationale was that waves in the transition region (Svendsen, Madsen, and Hansen 1978; Svendsen 1984) between the break point and the plunge point, where the wave overturns as an organized body or roller (Sawaragi and Iwata 1974), undergo a steep decrease in height but not a correspondingly great increase in wave energy dissipation. Roelvink and Stive (1989) thereafter distinguished between production of turbulence from organized wave energy through the energy balance equation and the

6 Chapter 2 Brief Literature Review
dissipation of mean turbulent kinetic energy (TKE) calculated in a one-equation TKE transport model in which the production term for the TKE is taken from the wave energy balance equation. Nairn, Roelvink, and Southgate (1990) and Deigaard, Justesen, and Fredsoe (1991) also applied a one-equation TKE transport model with the governing hydrodynamic equations to obtain an improved description of the mean water-surface elevation and undertow.
Smith, Larson, and Kraus (1993) numerically modeled the longshore current by adding a transport equation for the TKE to the wave energy balance equation and the cross-shore and longshore momentum equations. The momentum transport associated with the turbulence was estimated from the computed distribution of the TKE through parameterization, which required assumptions concerning the ratios between the turbulent fluctuations in the different coordinate directions (i.e., degree of isotropy). By including the turbulent transport in the alongshore momentum equation, a shift in the driving force was obtained that produced the desired shoreward translation of the peak in the current distribution. However, because measurements of the turbulence in breaking waves are rare (probably due to operational difficulties in the surf zone with suspended sediment), some empirical coefficients had to be introduced in connection with the parameterization. The values on these coefficients were essentially determined through calibration.
Dally and Brown (1995) developed a mathematical model to describe the formation and evolution of the roller that appears as waves break and pass through the surf zone. They argued that the transition region is not created by the lag between turbulence by breaking and dissipation in the wake, but by a lag due to the time required to create the roller itself. An energy balance equation was introduced, including the energy flux from the organized wave motion and the roller, as well as the energy dissipation in the roller. Employing this equation, the cross-shore variation in the roller mass flux could be calculated, from which the momentum transport in the longshore and cross-shore direction could be obtained (Dally and Osiecki 1994). Based on the observations of Duncan (1981) of the instantaneous structure of a breaking wave, the energy dissipation in the roller was parameterized in terms of the shear between the roller and the underlying fluid. The roller model of Dally and Brown (1995) involves two empirical parameters, one related to the energy dissipation (βD) and another to the roller propagation speed. The latter is normally assigned the value of unity; that is, the roller travels with the speed of the wave. The quantity βD has been shown to have a value of about 0.1 by comparison with laboratory data.
Laboratory and Field Data on Nearshore Currents High-quality data sets on nearshore currents suitable for testing a numerical model such as NMLong-CW are scarce, although in recent years some laboratory experiments have been carried out with the specific objective to study waves propagating and breaking on a current (e.g., Smith et al. 1998; Chawla and Kirby 1999). A few classical data sets (e.g., Kraus and Sasaki 1979; Visser 1982) on the longshore current are available for NMLong-CW validation with respect to introducing the roller model and to investigate wave-current interaction for wave-generated currents, although

Chapter 2 Brief Literature Review 7
this interaction often is not that significant. In the following, a short discussion is provided on previous investigations on nearshore currents in the laboratory and field pertinent to the present study. Several of the data sets mentioned here enter in validation of NMLong-CW and will be discussed in detail in other sections of this report. The data sets included are of two types, waves propagating on an opposing current, and wave-generated longshore current.
Sakai and Saeki (1984) investigated the transformation and breaking of waves modified in encountering an opposing current on a sloping bottom in the laboratory. They studied monochromatic waves and observed that the wave height decay, after appropriate normalization, depended solely on the bottom slope. Sakai, Hiyamizu, and Saeki (1986) continued the studies of Sakai and Saeki (1984) employing random waves. Lai, Long, and Huang (1989) conducted laboratory experiments to study the kinematics of waves on an opposing current including wave blocking. Monochromatic waves of different frequency were generated against the current, which flowed over a false bottom in the flume to generate spatially varying conditions. Measurements showed that the kinematic effect of the current on the waves could be treated as a simple Doppler shift. Also, the blockage of the waves by the current followed linear deepwater wave theory. Raichlen (1993) investigated waves propagating on a 3-D jet in the laboratory that represented the ebb-tide flow from a tidal inlet. Results of an exploratory nature regarding wave-current interaction for this specific situation were presented.
Briggs and Liu (1993) carried out experiments in a basin to study the interaction between monochromatic waves and an ebb current, and good comparisons were found between the measurements and a model based on the mild-slope equation including a current field (wave breaking was not included). Briggs, Demirbilek, and Green (1996) conducted experiments in a flume for monochromatic and random waves propagating on ebb (opposing) and flood (following) currents. Only cases involving random waves and ebb

8 Chapter 2 Brief Literature Review
Although longshore currents generated by breaking waves is a classical topic that has been studied for several decades, relatively few detailed, high-quality measurements exist from either the laboratory or the field. The experiments by Visser (1982) were a pioneering effort in the laboratory to measure the cross-shore variation in the wave-generated longshore current. Considerable effort was made to eliminate the influence of the basin and obtain a current representative of the conditions at an infinite, straight beach. Monochromatic waves were generated for a range of heights, periods, and incident wave angles, and two different bottom roughnesses were used. Recently, similar high-quality laboratory experiments were carried out by Hamilton and Ebersole (2001), but at a larger scale. In these experiments, both monochromatic and random waves were run.
Kraus and Sasaki (1979) performed the first field measurement of the cross-shore distribution of the longshore current. They recorded the current profile along seven transects on a sandy beach facing the Japan Sea, where the beach profile had a step-type shape. The current was measured by timing the movement of almost neutrally buoyant floats at middepth. Kuriyama and Ozaki (1993) performed similar measurements at the Hazaki Oceanographical Research Facility (HORF) on the Japan Pacific coast. The beach profile at the HORF typically has several bars, which were also present during the time of the measurements. A marked peak in the measured current distribution was observed in the trough. In a later field campaign (Kuriyama and Nakatsukasa 1999) the longshore current speed was measured using electromagnetic current meters at three cross-shore locations. Kuriyama and Nakatsukasa (1999) also developed a numerical model to simulate the cross-shore distribution of the longshore current using the conservation of wave energy flux and describing the energy dissipation due to breaking waves by a bore model. An energy equation that included the surface roller was added to the governing set of equations.
A few detailed field experiments have also been carried out along the United States Coast. Thornton and Guza (1986) (see also Seymour 1989) collected data on the longshore current during an experiment conducted at Leadbetter Beach, Santa Barbara, CA. At this site the bottom contours are relatively straight and parallel with no appreciable bars and troughs. The measurements by Thornton and Guza differ somewhat from other data sets in that the peak in the cross-shore longshore current distribution is located seaward of the maximum energy dissipation (i.e., mean break point). Typically, the peak in the longshore current lies shoreward of the break point, attributable to the action of momentum transport in the breaking wave or roller, as previously discussed.
Several dedicated field campaigns on nearshore currents have been carried out at the U.S. Army Engineer Field Research Facility of the U.S. Army Engineer Research, and Development Center, located in Duck, NC. A field data-collection project called DELILAH was conducted in October 1990 with the objectives of measuring the wave- and wind-forced 3-D nearshore dynamics and to monitor the bathymetric response to the operating hydro-dynamic processes (Smith, Larson, and Kraus 1993). Pressure gauges and current meters were placed at nine cross-shore locations and measurements were performed during a period of almost 20 days. Smith, Larson, and Kraus (1993) numerically simulated the cross-shore distributions of waves and longshore current for eight measurement cases from 14 October. A marked longshore bar was present during the measurements and the peak in the current distribution was located in the trough, shoreward of where the

Chapter 2 Brief Literature Review 9
maximum forcing occurred. Smith, Larson, and Kraus (1993) simulated this shift by introducing a transport equation for the turbulent kinetic energy, from which the momentum transport generated by turbulence could be obtained (see discussion in previous paragraphs).


Chapter 3 Wave Model 11
Wave Action Flux Conservation Equation For waves propagating on a current, it is the wave action flux that is conserved rather than the wave energy flux. Wave action, defined as the wave energy divided by the relative angular frequency, was originally introduced by Bretherton and Garrett (1969). Jonsson, Skovgaard, and Wang (1970) employed a similar concept for water waves. The conservation equation for steady conditions derived by Jonsson and Christoffersen (1984), including energy dissipation produced by wave breaking and bottom friction, is employed here. Thus, to calculate the wave transformation across the profile, the following conservation equation is solved:
cos
ω ωga D f
r r
EC P Pd
dx
β + =
(1)
where
E = wave energy (linear wave theory employed here)
Cga = absolute wave group speed
β = wave ray direction
ωr = relative wave frequency (= 2π/Tr, where Tr = relative wave period)
PD and Pf = wave energy dissipation due to wave breaking and bottom friction, respectively
x = cross-shore coordinate pointing offshore
The energy dissipation due to bottom friction is typically small compared to the dissipation associated with wave breaking, so Pf is neglected in the following.
As discussed in the following paragraphs, wave action (and energy) is conserved along the wave rays, typically differing from the wave orthogonals that describe the direction in which the wave fronts move.
Wave Kinematics Consider waves propagating on a steady current having a magnitude U and direction δ (see Figure 1 for a definition sketch of the current and wave angles used here; overbar denotes a vector). The waves propagate at an angle α yielding the following absolute phase speed (Ca) for the waves,
cos(δ )a rC C U= + −α (2) where Cr = relative phase speed. The current is taken positive if it is in the direction of the wave propagation (following current) and negative if it is against the wave propagation (opposing current). This definition is intuitive and conventional, even though it means that a positive current will flow in the opposite direction to the x-axis according to Figure 1. Also, in the

12 Chapter 3 Wave Model
Figure 1. Definition sketch for waves propagating on current
definition of positive and negative currents U is the magnitude (no sign associated with it) implying that δ can vary from –180 to 180 deg. The waves are assumed to always propagate towards the beach, which means that –90 <α <90 deg and that opposing currents are directed offshore and following currents onshore.
Whether in a relative or absolute frame of reference, the wavelength L should be the same. Thus, the relative wave period Tr and absolute period Ta are given by:
r
r C
LT = (3)
a
a C
LT = (4)
Also, it may be noted that in a moving frame of reference, the relative phase speed may be derived directly from the selected wave theory without a current, yielding the following expression if linear wave theory is employed,
1/ 2
tanhr
gC kd
k =
(5)
Longshore Distance y
x
β
δ
α
Cross-Shore Distance
U
Cgr
Cga
W
ϕ

Chapter 3 Wave Model 13
where
k = wave number (2π/L)
d = water depth (d = h+η, where h is the still-water depth
η = wave setup/setdown)
g = acceleration of gravity Determination of the kinematic wave properties in the presence of a current involves solving Equations 2-5 simultaneously to obtain L, Ca, C

14 Chapter 3 Wave Model
following current produces an increase in L, and an opposing current a decrease in L in comparison to the case of no current (all other factors held constant).
No current
Opposing current
Following current
Blocking current
A
B
0.0 0.1 0.2 0.3 0.4 0.5
Relative Water Depth, d/L
-0.75
-0.25
0.25
0.75F
unct
ion
Val
ue
C
E
D
Figure 2. Examples of solutions to dispersion equation with current present
(after Jonsson 1990)
Wave Orthogonals and Wave Rays In the presence of a current, the wave energy will not be conserved along the wave orthogonals, instead the energy is conserved along the wave rays that have the absolute group speed Cga as a tangent at all locations. The wave ray direction β depends of the relative wave group speed and the current magnitude and direction. Thus, Cga and β may be obtained from geometric considerations (Jonsson 1990; also, see Figure 1) to yield:
( )1/ 22 2 2 cos(δ α)ga gr grC C U C U= + + − (8)
sin(δ α)β α arctan
cos(δ α) gr
U
U C
−= + − +
(9)
where Cgr is the relative group speed and α the direction of the wave orthogonal. The relative group speed is determined from linear wave theory according to:
1 2
12 sinh 2gr r
kdC C
kd = +
(10)
From Equation 9, it may be concluded that if U cos(δ-α) = -Cgr, the denominator is zero, and the wave rays form a 90-deg angle with respect to

Chapter 3 Wave Model 15
the wave orthogonals. This condition, in fact, corresponds to wave blocking, discussed in the following paragraphs.
Wave Refraction As can be seen from Equation 6, the wave angle α must be known before the wave properties can be calculated. Here, Snell’s law is employed to determine wave refraction and how α varies across the profile. Taken between two locations with different depth and current characteristics, denoted with index 1 and 2, Snell’s law may be expressed as (Jonsson and Skovgaard 1978):
1 2
1 2
sinα sinαL L
= (11)
In calculating the wave properties at location 2, assuming all quantities are known at location 1, Equations 6 and 11 are solved simultaneously because both α and L are unknown at the new location.
Wave Breaking and Energy Dissipation In Equation 1, the wave energy dissipation must be estimated before the wave transformation can be calculated. As previously stated, only the dissipation due to breaking PD is considered here, because in the surf zone it is normally much larger than the dissipation due to friction in the bottom boundary layer Pf. Wave breaking occurs because the wave form is not stable for the existing hydrodynamic and topographic conditions. In shallow water, the topography typically induces the breaking (called depth-limited breaking). However, in the presence of a current, the hydrodynamic conditions may cause the waves to break because the wave steepness exceeds a critical limit (steepness-limited breaking). Typically, for depth-limited breaking a criterion on the maximum wave height to water depth is employed (e.g., H/d = 0.78, where H is the wave height), whereas for steepness-limited breaking the maximum wave steepness is used (e.g., H/L = 1/7).
The Miche criterion (Miche 1951), as modified by Battjes and Janssen (1978), provides a reliable estimate of the maximum wave height before breaking, including both hydrodynamic and topographic controls on the waves (i.e., includes both steepness- and depth-limited breaking). This maximum wave height is given by,
0.88/ tanh(γ / 0.88)b bH k kd= (12) where γb is the maximum ratio between wave height and water depth in shallow water (depth-limited breaking), typically taken to be 0.78 (done here also). Thus, the asymptotes of Equation 12 for shallow and deep water are Hb/d = γb and Hb/L = 0.14, respectively. The breaker index γb is known to depend on wave steepness (e.g., Kaminsky and Kraus 1994), but introduction of such a dependence would require yet another iteration between waves and currents. Kaminsky and Kraus (1994) found an average value of γb of 0.78 for a database comprising more than 400 measurements from a variety of

16 Chapter 3 Wave Model
sources for waves shoaling on laboratory sloping beaches in the absence of an imposed external current.
Several different models are available to calculate the energy dissipation produced by wave breaking for time-averaged conditions without a current present (e.g., Goda 1975; Battjes and Janssen 1978; Dally 1980; Mizuguchi 1980; Thornton and Guza 1983; Svendsen 1984). For waves breaking on a current, less work has been done to quantify the modification by the current on the energy dissipation, although several laboratory studies have been conducted recently on the topic (Smith et. al 1998; Chawla and Kirby 1998, 2000). Chawla and Kirby (1998, 1999) showed that the Battjes and Janssen (1978) model as well as the Thornton and Guza (1983) model successfully reproduce wave height decay due to breaking on an opposing current in deep to intermediate water depths, although some adjustment of the original coefficient values was required.
Here, the model proposed by Dally (1980) and further developed by Dally, Dean, and Dalrymple (1985) and Dally (1990, 1992) is extended to describe energy dissipation by breaking waves in arbitrary water depth including the presence of a current. The advantages of the Dally-type model may be summarized as:
a. Relative constancy of optimum values for the two empirical parameters included in the model, independent of wave and beach conditions (implying that application without calibration to a specific site will yield reliable results).
b. Possibility of describing wave reformation in a straightforward and physically based manner.
c. Capability of generalization for describing random waves without a priori assumptions regarding the probability distribution of waves in the surf zone.
d. Reliability demonstrated in numerous independent applications to a wide range of hydrodynamic and beach conditions for both small-scale and large-scale laboratory data and field data, covering both monochromatic and random waves.
Generalizing to arbitrary water depth and situation of the presence of a current, the wave energy dissipation produced by breaking according to Dally (1980) may be expressed as:
κ
( )D s grD
P E E Cd
= − (13)
where κ = empirical coefficient (found to be 0.15 for typical conditions)
E = wave energy
Es = stable wave energy below which breaking ceases and wave reforming occurs
dD = characteristic length scale for the energy dissipation (= d in the original formulation by Dally 1980)
In the presence of a current, it is the relative group speed that determines the magnitude of the energy dissipation.

Chapter 3 Wave Model 17
Dally (1980) expressed Es in terms of a stable wave height, which is a function of the water depth, based on laboratory experiments made by Horikawa and Kuo (1966) for waves breaking on a step-type profile. This formulation is sufficient for the case of depth-limited wave breaking. However, if the waves break because of a limiting wave steepness (for example, by waves shoaling and breaking on an opposing current in deep water), the original expression for Es proposed by Dally (1980) is not appropriate. Thus, Es was expressed as a function of Hb determined from Equation 12.
Dally (1980) used the following relationships for determining Es for depth-limited wave breaking (linear wave theory),
21ρ8s sE gH= (14)
dH s Γ= (15)
where
Hs = stable wave height
ρ = water density
Γ = an empirical coefficient (found to be 0.4 for typical conditions)
In a traditional criterion for depth-limited incipient wave breaking, the stable and incipient breaking wave heights at a certain water depth are related through:
Γγs b
b
H H= (16)
This relationship gives Hs = 0.5Hb, if the commonly applied values Γ = 0.4 and γb = 0.78 are inserted. Thus, by calculating with Equation 14 together with Equation 16, a model is obtained that is applicable for both depth- and steepness-limited wave breaking, where Equation 12 yields the wave height at incipient breaking at the location of interest. (Note that in a surf zone, this wave height is different from the limiting wave height where breaking was initiated.) For shallow water, Equations 16 and 12 reduce to Equation 15, in accordance with the original formulation by Dally (1980). However, it remains to validate the proposed generalization, which is the subject of the next chapter. It is noted that the extension of the energy dissipation model to waves breaking on a current did not require the introduction of new model parameters or modifications of existing parameter values. The characteristic length scale of the energy dissipation dD is set to Hb/γb, which makes dD = d in shallow water in accordance with Dally (1980).
Wave Blocking Waves propagating on a current may experience blocking if the current is sufficiently strong and has a component opposing the waves. The criterion for blocking can be obtained by studying the solution to the dispersion relationship (Equation 6) for an opposing current and for which only one

18 Chapter 3 Wave Model
solution exists (for a following current, blocking cannot occur). Inspecting Equation 6, the right side is a linear function of the wave number (k = 2π/L), whereas the left side is a more complicated function of k. There is only one solution if the linear function constitutes the tangent to the function on the left-hand side in the point of solution (Jonsson 1990), which is equivalent to the two functions having the same gradient in k. To clarify the derivation of the blocking condition, Equation 6 is rewritten in terms of k to yield:
2π
tanh cos(δ α)a
gk kd kUT
= − − (17)
Differentiating with respect to k gives,
( )tanh cos(δ α)s
dgk kd U
dk= − − (18)
where Us denotes the current speed at blocking. The left side of Equation 18 corresponds to the relative group speed, giving the following criterion for wave blocking:
cos(δ α) 0gr sC U+ − = (19)
This criterion implies that wave blocking occurs if the current projected on the wave orthogonals has an opposing speed corresponding to the relative group speed, producing an angle between the resulting direction for Cga and the wave orthogonals of 90 deg.
At the point of blocking, the wavelength attains a minimum value, which may be estimated by substituting Equation 19 into Equation 6 to yield,
1
tanh1 o
d dkd
L n L=
− (20)
where
1 2
12 sinh 2
kdn
kd = +
(21)
The required blocking speed associated with Equation 20 may be obtained from Equation 19, once the wavelength L at blocking has been determined for a specific Lo and d. This criterion may be written in nondimensional form as:
cos(δ α)
tanh2π
s
a o
U n L dkd
gT h L
−= − (22)
Thus, for a specific ratio d/Lo, the required blocking speed can be determined from Equations 20 and 22. Figure 3 displays the nondimensional blocking speed as a function of d/Lo.

Chapter 3 Wave Model 19
gTa
U
10-7 10-6 10-5 10-4 10-3 10-2 10-1 100
Relative Water Depth, d/L o
10-4
10-3
10-2
10-1
Blo
ckin
g S
peed
,
cos
( δ
- α
) /
Shallow water asymptote for blocking
Deep water asymptote for blocking
Figure 3. Nondimensional blocking speed as function of relative water depth
d/Lo
Asymptotic solutions to the conditions for blocking may readily be obtained for shallow and deep water. In deep water, that is, kd → ∞, Equation 20 yields:
oLL4
1= (23)
and Equation 22 results in:
1
cos(δ α)4s oU C− = − (24)
In shallow water, kd becomes small, and various terms in Equations 20 and 22 have to be expanded with respect to this quantity. Omitting terms of order (kd)2 and higher to obtain an explicit solution, the following approximation is obtained for the wavelength at blocking (shallow water):
1/ 6
5
9
32π o
d d
L L
=
(25)
The corresponding current speed at blocking is given by:
1/ 2
cos(δ α) 1
2πs
a o
U d
gT L
−=
(26)
This relationship is in fact identical to Uscos(d-a) = (gd)1/2. The asymptotes for deep and shallow water are indicated in Figure 3.

20 Chapter 3 Wave Model
Another phenomenon that could occur, if a current opposing the waves is present, is that energy is transported offshore although the waves propagate onshore. The limit for this situation to occur is given by:
cosαcosδgr
U
C= − (27)
This condition corresponds to the solution of the dispersion relation for the higher wave number (see Figure 2). Although it is not likely that such conditions would occur in model applications for the nearshore, a check is still included in NMLong-CW because the user is free to specify an arbitrary external current.
Cross-Shore Momentum Equation In NMLong-CW, the cross-shore momentum equation is employed to determine changes in the mean water level (setup/setdown) induced by wave and wind. The model includes the possibility of specifying an external (large-scale) current and determining the effect of this current on the wave transformation, as well as the interaction with currents calculated by NMLong-CW (e.g., currents generated by waves and wind). In the wave action equation (Equation 1), the inclusion of the current is straightforward and independent of the mechanisms that are generating the current. However, for the momentum equations, it less obvious as to how to account for the external current, especially for the cross-shore momentum equation.
For example, one type of external flow that might be of interest to incorporate in applying NMLong-CW is the ebb jet from a tidal inlet. Effectively, this type of flow is generated by a momentum source (the inlet) generating a jet that is discharged offshore under the influence of turbulent mixing, inertia, and bottom friction. Measurements of the jet flow or simple models employing jet theory might be accessed to estimate the velocity field, which, in turn, could be the input for the external current to NMLong-CW. However, in applying the cross-shore momentum equation to determine the waves, questions arise as to how to treat the external current in such calculations. In this context, it should be pointed out that NMLong-CW is based upon alongshore uniformity, which could be in contradiction to the complex and often highly 2-D flow field at an inlet. However, applied with care, there are many situations at an inlet where applications of the model are theoretically justified, and satisfactory results will be obtained. Because of the alongshore uniformity assumption, considerations should always be made with regard to the possible variation in quantities alongshore, including the current. Such considerations involve the relationship between the spatial scale of the current and wave motion.
In NMLong and NMLong-CW, the mean water level η is determined using the following cross-shore momentum equation,
ηρ ρ cosxx
D a
dSdgd C W W
dx dx= − − ϕ (28)
in which Sxx =radiation stress transported onshore and directed onshore, CD = wind drag coefficient, ρa = density of air, W = wind speed (magnitude), and

Chapter 3 Wave Model 21
ϕ = incident angle of the wind (see Figure 1 for a definition of this angle). The drag coefficient is given by the expression proposed by the WAMDI Group (1988):
3
3
1.2875 10 7.5 m/sec
(0.8 0.065 ) 10 7.5 m/sec
D
D
C W
C W W
−
−
= <
= + ≥ (29)
In this formulation the depth-averaged steady cross-shore current (Uc = U cos δ) is assumed to be zero, implying that the nonlinear advective terms and the lateral mixing term are zero as well (Kraus and Larson 1991). For the situation of wind and waves generating a current on a beach that is uniform alongshore (assumed here), a circulation pattern is established through the water column so that Uc becomes zero. Also, typically the bottom friction contribution is small compared to the other terms and may be neglected.
The simplest approach for including an external current (e.g., ebb jet) in the cross-shore momentum equation is to assume that there is no interaction between the mechanism that generates the large-scale current and the modification of the waves and wind on the mean water level in the nearshore. Thus, Equation 28 can still be employed to determine η, if the wave properties in a relative frame of reference are used, implying that Sxx is given by:
2 21 1ρ (cos α 1)8 2
grxx
r
CS gH
C
= + −
(30)
Any other formulation of the cross-shore momentum equation to include the external current would necessarily involve describing the generation of this current by adding terms in the momentum equation (e.g., driving forces, inertia and bottom friction terms). Although this might be desirable in some situations, in the present version of NMLong-CW it was considered outside the scope of the modeling effort to develop such a general flow model, and the simplified approach outlined here was taken. For the longshore momentum equation, a somewhat different approach was taken to include the external current, as described in Chapter 5.
Modeling the Roller Observations from the laboratory and field have indicated that the peaks in the distributions of the setup/setdown and longshore current are typically translated shoreward compared to what numerical models such as NMLong predict (e.g., Visser 1982, 1984; Smith, Larson, and Kraus 1993). Several theories have been proposed to explain this behavior, most of them hypothesizing that the momentum lost through wave breaking is not immediately available for driving the longshore current (or for changing the mean water level), but there is an intermediate step where a roller, or breaker-induced turbulence, generates a momentum flux before the energy dissipation eventually occurs. Dally and Brown (1995) developed a model to describe the mass and momentum flux in the roller. Thus, by combining this model with NMLong-CW, the aforementioned translation in the peaks is better simulated.

22 Chapter 3 Wave Model
Dally and Osiecki (1994) generalized the wave energy balance equation for the roller introduced by Dally and Brown (1995) to obliquely incident waves,
2 21 ρ cos α ρ β2D R R D
d A AP C g
dx T T + =
(31)
where
PD = loss in organized wave energy flux through wave breaking (obtained from Equation 13)
ρR = density of the roller
C = roller speed (taken to be proportional to the wave speed, that is, C = βRCr, where βR is a coefficient)
α = wave angle
A roller cross-sectional area,
T = wave period
βD = dissipation coefficient (about 0.1)
By defining the period-averaged mass flux (mR = ρrA/T), Equation 31 can be solved conveniently for this quantity yielding:
2 21cos α β
2D R r D R
dP m C g m
dx + =
(32)
where βR = 1.0 was assumed, and T = Tr is employed in the definition of mR. The momentum flux in the roller is then obtained as MR = mRCr in the direction of wave propagation. The additional terms in the longshore and cross-shore momentum equations due to the roller are MRl = mRCr sin (α) cos (α) and MRc = mRCr cos2(α), respectively, bearing in mind that these are tensor quantities as are the radiation stresses.
Here it is assumed that Equation 32 can describe the transfer of energy from the organized wave motion to the roller and the eventual dissipation also for a situation where a current is present. However, the equation should be solved by inserting the relative wave properties. It is not obvious that the dissipation coefficient would be the same if a current is present, but this assumption will be made here. The roller model proposed by Dally and Brown (1995) was implemented in NMLong-CW, and test simulations were carried out to assess the functioning of the roller model on the computed mean water level and longshore current.
Numerical Implementation The numerical implementation to calculate the cross-shore wave height distribution in NMLong-CW follows that of Kraus and Larson (1991), who employed an explicit finite-difference solution scheme for a staggered grid. The discretization of the wave action flux conservation equation followed the approach in NMLong of discretizing the wave energy flux conservation equation. Calculations start from the most seaward grid point, where the

Chapter 3 Wave Model 23
input wave conditions must be known, and proceeds onshore until dry land is encountered (taking into account wave setup). A major difference from NMLong is the additional iteration procedures that are required to solve the governing equations. In comparison to NMLong, NMLong-CW requires the following iterative steps:
a. Iteration between the wave transformation and longshore current calculations. The waves are computed first, implying that the total longshore current is not known (which could be a current resulting from waves, wind, and an external current). Thus, after the longshore current has been calculated by means of the longshore momentum equation, the wave calculations have to be redone, followed by a new current calculation. This iteration between the waves and current continues until convergence is achieved at predefined level of accuracy.
b. Iteration to solve the dispersion relation with a current present. Equation 6 is solved via a Newton-Raphson technique, as opposed to in NMLong where the dispersion relation (without a current) is solved explicitly employing a Padé approximation.
c. Iteration to solve Snell’s law. In solving Snell’s law for refraction (Equation 11), proceeding from one grid point to next, both the wave angle and wavelength are unknown at the new grid point. These quantities are coupled through Equation 6 (in NMLong the dispersion relation can be solved independently of Snell’s law, and vice versa).
Overall, these iterative requirements might make NMLong-CW considerably more time demanding to run than NMLong, depending on the computer capabilities.
In calculating for random waves, Monte-Carlo simulation is employed by simulating a large number of individual waves belonging to a certain probability density function (pdf), typically taken to be a Rayleigh distribution in deep water. Computations are performed with the governing equations for each individual wave, and the statistical wave properties are derived from the series of waves obtained at respective cross-shore locations. The number of waves selected should be large enough to yield statistically stable values on the mean wave properties when averaging for all the waves. The advantage of a Monte-Carlo simulation technique is that no inference for the shape of the pdf in the nearshore is necessary; the shape is obtained in the simulations. The disadvantage of the method is that possible wave-wave interaction and associated energy transfer are neglected. For random waves, the wave forcing terms (radiation stresses and roller momentum fluxes) are determined as averages for the selected number of waves in the Monte-Carlo simulation before they are used in the momentum equations.
The wave energy balance equation employed to calculate the roller properties across-shore (Equation 32) is discretized according to,
2
, , 1 1 , 1 , 1, 2
,
2 ∆ cosα β ∆cosα β ∆
D i R i i r i D R iR i
i r i D
P x m C g m xm
C g x+ + + ++ −
=+
(33)
where
i = an index to denote the grid point number
∆x = grid cell length

24 Chapter 3 Wave Model
In Equation 33, the wave and roller properties are taken at the cell boundaries, except for the wave energy dissipation PD,i due to breaking, which is taken in the middle of the cell. After solving the wave action flux conservation equation, all wave quantities are known at all grid points and the roller mass flux mR is the only unknown. Thus, starting from the most offshore grid point where wave breaking should be absent (mR = 0), mR can be determined at all shoreward grid points.
The cross-shore momentum equation is also solved through an explicit finite-difference approach following Kraus and Larson (1991). Thus, no iteration is performed between the wave and setup/setdown calculations, implying that the water depth for the water-level calculations are displaced half of a grid cell from the true value. Setup/setdown calculations are typically well behaved, so this shift has negligible influence on accuracy, although on a steep foreshore some loss of accuracy can result.


26 Chapter 4 Verification of Wave Model
constituted permutations of the following target parameter values: Hmo = 3.7 and 5.5 cm, Tp = 0.7 and 1.4 s, wave direction perpendicular to the jetties, and Uc = 0, 12, and 24 cm/s. Wave height and current were measured at several gauges placed around the inlet with the main objective of studying wave breaking and to determine the wave height decay.
Here, four runs were simulated to investigate the model performance, especially regarding the capability of (a) the wave action equation (Equation 1) to reproduce the wave transformation in the presence of a current using linear wave theory, (b) the criterion for incipient breaking (Equation 12) to describe waves propagating on a current and in limited water depth, and (c) the generalization of Dally’s model (Equations 13-16) to predict the energy dissipation due to wave breaking on a current.
Table 1 summarizes the runs selected for simulation representing both long- and short-period wave cases, as well as, weaker and stronger currents. The values given in the table are the target values, whereas for the model simulations the actual measured wave heights and periods in the horizontal portion of the basin (just off the wave maker) were employed (see Appendix A in Smith et al. 1998). The conditions of the CHL-I experiments were such that blocking should not occur according to the criterion based on linear theory (Equation 19) with the peak spectral wave period characterizing the waves. The measured wave heights in the experiments indicate that this was indeed the case.
Table 1 Target Wave Conditions for Selected Runs from Smith et al. (1998) Experiments Used in NMLong-CW Simulations
Run Significant Wave Height (m)
Peak Spectral Wave Period (s) Mean Current (m/s)
5 0.055 1.4 0.14
7 0.055 1.4 0.24
9 0.055 0.7 0.14
11 0.055 0.7 0.24
Standard values were employed for the coefficients in the wave transformation model without any calibration, that is, γb = 0.78, κ = 0.15, and Γ = 0.4. Waves were represented by a Monte-Carlo simulation by assuming a Rayleigh pdf in the offshore (i.e., in the horizontal portion of the basin where wave breaking and the current were negligible). NMLong-CW normally provides the root-mean-square (rms) wave height as output since this quantity may be calculated in a straightforward manner without having to save all intermediate calculation results from individual waves in the ensemble representing the offshore pdf. However, Smith et al. (1998) only reported the energy-based significant wave height Hmo, so the entire simulated series of waves at each location were run in the present cases to compute the significant wave height by taking the mean of the one-third largest waves (assumed to be equal to the spectrally determined zero-moment wave height Hmo reported for the experiments).
The measured current at six locations defined the input cross-shore current distribution. Linear interpolation was employed between the measurement points to obtain values at the different model grid points. However, because no measurements of the current were made at some distance seaward of the inlet mouth (except close to the wave maker where

Chapter 4 Verification of Wave Model 27
the current was zero), an extrapolation had to be performed to derive realistic current values in this region. After an ebb jet passes through an inlet gap, it experiences a reduction in mean velocity because of lateral spreading (entrainment of ambient fluid) and the increase in water depth. The effects of these two mechanisms were estimated separately and in a simple manner. By applying the continuity equation, the decrease in the velocity was obtained from the increase in water depth. Furthermore, through an analogy with a plane jet the lateral spread of the ebb jet and associated decrease in velocity were estimated (Fischer et al. 1979). The net effect was obtained by multiplying the reduction from each of these two mechanisms. The sensitivity of the calculated cross-shore wave height distribution to the estimated decrease in current velocity with distance offshore was not strong. In the region where marked energy dissipation due to wave breaking was observed, there was almost no influencce from the extrapolated current distribution. However, the calculated waves in the region of shoaling (prior to breaking) displayed some sensitivity to the selected current distribution at the seaward end of the grid.
Figures 4, 5, 6, and 7 display the calculated significant wave height for Runs 5, 7, 9, and 11, respectively, together with the measured wave height (note that the x-axis originates at the first measurement point and is defined as positive going offshore). The calculation result for the situation of neglecting the current are also included for each of the runs (dashed line; the only difference in these calculations was that the cross-shore current was set to zero). Overall, the agreement is satisfactory, with much improved results if the wave-current interaction is taken into account, although Figure 4 showing the run with the longest period in combination with the weakest current displays little improvement with the current taken into account. For the runs with the stronger current (Runs 9 and 11), neglect of the current on the waves produces simulation results that significantly deviate from the measurements. Use of linear wave theory yielded good results, in agreement with many other studies on wave transformation in the surf zone, where the interaction between currents and waves was not taken into account. The generalization of the Dally (1980) model to arbitrary water depths appears to work well also in combination with a criterion for incipient breaking that includes wave steepness at greater water depths.
Chawla and Kirby (C&K) Data Chawla and Kirby (C&K; 1998, 1999 and 2002) also carried out experiments on wave transformation on an opposing current, but employed conditions corresponding to intermediate and deep water (emphasis was on the deeper water to avoid complicating influences from the bottom profile). The main objective of their study was to investigate the energy dissipation due to wave breaking on the opposing current. Wave and current conditions were initially selected so that blocking would occur in some of the tests. However, in comparing their measurements with predictions of the blocking conditions based on linear theory, in several tests blocking did not occur although Equation 19 indicated that this should be case. A larger current speed was needed to block a specific wave, which was attributed to nonlinearities where the amplitude dispersion became a significant factor controlling the wave propagation speed.

28 Chapter 4 Verification of Wave Model
0.04
0.05
0.06
0.07
0.08
Sig
nific
ant W
ave
Hei
ght,
m
0 4 8 12
Distance Across Shore, m
Calc. with current
Measured
Calc. without current
Figure 4. Calculated and measured significant wave height for Smith et al.
(1998) Run 5
0.03
0.04
0.05
0.06
0.07
Sig
nific
ant W
ave
Hei
ght,
m
0 4 8 12
Distance Across Shore, m
Measured
Calc. without current
Calc. with current
Figure 5. Calculated and measured significant wave height for Smith et al.
(1998) Run 7

Chapter 4 Verification of Wave Model 29
0.04
0.05
0.06
0.07
0.08
Sig
nific
ant W
ave
Hei
ght,
m
0 4 8 12
Distance Across Shore, m
Calc. with current
Calc. without current
Measured
Figure 6. Calculated and measured significant wave height for Smith et al.
(1998) Run 9
0.03
0.04
0.05
0.06
0.07
Sig
nific
ant W
ave
Hei
ght,
m
0 4 8 12
Distance Across Shore, m
Measured
Calc. without current
Calc. with current
Figure 7. Calculated and measured significant wave height for Smith et al.
(1998) Run 11

30 Chapter 4 Verification of Wave Model
The C&K experiments were conducted in a 30-m-long flume with a constant water depth of 0.5 m. Waves were generated at one end of the flume, and a current flowing against the waves was introduced at the other end. A varying cross-shore current was obtained by placing a false wall in the flume that linearly reduced the cross-sectional area and the experiments were designed to produce blocking in the narrowest section. The mean current varied from 0.53 m/s in the narrowest part of the flume to 0.32 m/s in the widest section. The wave periods (constant and peak spectral) employed were in the range 1.2-1.6 s, and both monochromatic and random waves were used. The wave height was measured along the flume with 29 gauges for the monochromatic tests and 36 gauges for the random wave tests (Chawla and Kirby 1999).
Eighteen tests were carried out using monochromatic waves and 20 tests using random waves. For evaluating the performance of NMLong-CW, four monochromatic and four random tests were selected, representing different aspects of the experiments (e.g., blocking of the waves before breaking, breaking followed by blocking, and breaking without any blocking). Tables 2 and 3 summarize the experimental conditions for the monochromatic and random tests, respectively, in the evaluation of NMLong-CW. The notation “M” (monochromatic) and “R” (random) was introduced to separate between the two types of tests (the numbering follows C&K).
Table 2 Wave Conditions for Selected Monochromatic Tests from Chawla and Kirby (1999) Experiments Used in NMLong-CW Simulations Test Wave Height (m) Wave Period (s)
M3 0.033 1.2
M4 0.066 1.2
M11 0.104 1.3
M18 0.141 1.4
Table 3 Wave Conditions for Selected Random Tests from Chawla and Kirby (1999) Experiments Used in NMLong CW Simulation
Test Root-Mean-Square Wave Height (m)
Peak Spectral Wave Period (s)
R2 0.033 1.1
R14 0.045 1.2
R15 0.058 1.3
R19 0.052 1.4
In the model simulations, no additional calibration was performed, and the same coefficient values were maintained as for the CHL-I simulations (standard values). One notable aspect involved in reproducing the C&K measurements was to explore the limits of applicability for NMLong-CW and investigate how the model would perform under such circumstances in terms of stability, robustness, and agreement with measurements. The C&K experiments were carried out mainly in deep water, whereas NMLong-CW would typically not be employed for these conditions. Also, as previously

Chapter 4 Verification of Wave Model 31
mentioned, Chawla and Kirby (1998, 2002) observed that a nonlinear dispersion relation was needed to describe blocking on the current, implying that the linear dispersion relation in NMLong-CW would not be sufficient for simulating with complete accuracy the measured wave transformation.
Figures 8, 9, 10, and 11 show comparisons of the calculations with the measurements for Tests M3, M4, M11, and M18, respectively. The x-axis was defined in the opposite direction compared to C&K in order to make the waves propagate towards the x-axis, in accordance with the definition in NMLong-CW. Test M3 represents a case where the waves shoal on the current and are blocked before breaking occurs (Figure 8). The calculation agrees well with the measurements during the initial part of the shoaling, but blocking is predicted to occur more seaward (i.e., at larger x-values) than what was measured. Chawla and Kirby (1998) attributed this to amplitude dispersion, where the wave height caused an increase in the phase speed, implying that a larger current is needed to block a specific wave. It should be noted that the wave height at blocking is well predicted, although the point of blocking is displaced somewhat seaward.
Test M4 and M11 illustrate situations where the waves shoal and break on the current (Figures 9 and 10, respectively). Blocking occurs after some distance of breaking in Test M4, but not in Test M11, for which the waves penetrated the area of maximum current even after the reduction in wave height because of breaking. NMLong-CW satisfactorily predicts the shoaling phase seaward of breaking, but because of the linear dispersion relation the point of incipient breaking occurs seaward of the measurements. The wave height at incipient breaking is also somewhat overestimated, which might be remedied by modifying the criterion given by Equation 12. The calculations yield blocking shortly after breaking for both tests, contrary to the experimental results. After breaking, the predicted wave height decay is large but seems to be in agreement with the observed gradient, indicating that the algorithm for determining the wave energy dissipation due to breaking produces reasonable estimates.
Test M18 involved shoaling and breaking on a current and without blocking taking place, which was also obtained theoretically employing linear dispersion. Thus, NMLong-CW did not predict blocking, and the waves were calculated to propagate through the current everywhere. Figure 11 shows the comparison between calculations and measurements for Test M18. The shoaling phase is well described, but incipient breaking occurs too far seaward, similar to the other simulated monochromatic tests. Wave height decay is steep, but the gradient is in agreement with the measurements, at least during the initial phase of breaking. During the later phase of breaking, the measured wave height decay is more gradual, indicating the approach towards a stable wave height. The stable wave height predicted by the model is too low and underestimates the actual stable wave height with about 30 percent. Thus, in this case the generalization of Equation 15 to larger water depths yields considerable deviations with respect to the measurements. In fact, looking at other cases from the C&K data, it appears that the measured stable wave height is more related to the incipient breaking wave height than to Hb determined by the local conditions at any given point. No effort was made here to develop an expression for Hs that would fit the measurements better than Equation 16.

32 Chapter 4 Verification of Wave Model
-8 -4 0 4 8
Distance Across Shore, m
0.00
0.02
0.04
0.06
0.08
0.10
Wav
e H
eigh
t, m
Measured
Calculated
Figure 8. Calculated and measured wave height for Chawla and Kirby (1999)
Test M3
-8 -4 0 4 8
Distance Across Shore, m
0.00
0.04
0.08
0.12
0.16
Wav
e H
eigh
t, m
Measured
Calculated
Figure 9. Calculated and measured wave height for Chawla and Kirby (1999)
Test M4

Chapter 4 Verification of Wave Model 33
-8 -4 0 4 8
Distance Across Shore, m
0.04
0.08
0.12
0.16
0.20
Wav
e H
eigh
t, m
Measured
Calculated
Figure 10. Calculated and measured wave height for Chawla and Kirby
(1999) Test M11
-8 -4 0 4 8
Distance Across Shore, m
0.04
0.08
0.12
0.16
0.20
0.24
Wav
e H
eigh
t, m
Calculated
Measured
Figure 11. Calculated and measured wave height for Chawla and Kirby
(1999) Test M18

34 Chapter 4 Verification of Wave Model
To investigate the consequence of changing the coefficient Γ in the expression describing the stable wave height, and to determine if this would yield better agreement with the data, simulations were performed for a range of Γ-values. As an example, Figure 12 displays the result of increasing Γ, which produces a larger stable wave height and better agreement with the measurements. The smoother evolution of the wave height just after breaking for Γ = 0.6 is a result of the balance between shoaling due to the increase in current speed and wave energy dissipation due to breaking. Thus, the point of incipient breaking is the same for the two simulations shown in Figure 12. However, the shoaling overpowers the dissipation initially, producing a wave height increase instead of decrease even after breaking starts. By modifying the value of Γ acceptable agreement is obtained for the stable wave height, but the wave height decay in the more shoreward portion of the breaking wave zone is overestimated.
Representative tests similar to those selected from the monochromatic wave experiments were simulated for the random wave tests (see Table 3 for the wave conditions). A Monte-Carlo simulation was employed, assuming a Rayleigh pdf for the wave height at the input point of the waves and the period was held constant and equal to the peak spectral period. This description oversimplified the statistical properties of the incident wave field, especially in realizing that wave period is a decisive parameter for estimating blocking. Chawla and Kirby (2002) pointed out that, in their experiments, some waves were blocked coming off the wave paddle because of their short period.
-8 -4 0 4 8
Distance Across Shore, m
0.04
0.08
0.12
0.16
0.20
0.24
Wav
e H
eigh
t, m
Calc. with 0.6
Measured
Calc. with 0.4
Figure 12. Calculated and measured wave height for Chawla and Kirby
(1999), Test M18

Chapter 4 Verification of Wave Model 35
Figure 13 shows the calculation results for Test R2, which encompassed blocking of a majority of the waves before incipient breaking. (However, because random waves were employed, breaking would occur for some waves.) The shoaling phase is well described and in agreement with trends obtained for the monochromatic waves. Also, it seems like the recorded typical blocking point is shoreward of the simulated one. The maximum rms wave height is overestimated by about 20 percent, which was the case for some monochromatic tests as well (compare Figure 9). The simulation results for Test R4 display similar characteristics as the results for Test R2 (see Figure 14).
Test R15 shows some breaking before blocking is calculated to occur, but otherwise displays the same tendencies as Tests R2 and R4 (Figure 15). However, the conditions for Test R19 were such that wave blocking was not predicted to occur (linear dispersion theory). Figure 16 shows the results of the simulations together with the measurements. Again, the maximum rms wave height is overestimated, and the discrepancy in the shoreward portion of the profile is marked. The poor description in the shoreward area owes to the fact that a majority of the waves is not calculated to break on the current, implying that they propagate to the area of maximum current without losing energy. Some waves break, but dissipate their energy down to the stable wave height fairly quickly, giving a constant wave height in the shoreward part of the profile. The Monte-Carlo simulation technique with constant wave period is one reason for the discrepancy between calculations and measurements. In shallow water (e.g., the CHL-I data), the influence of wave period is not as pronounced as in deep water, making it more reasonable to only employ one period in the simulations for the CHL-I data.
Effects of Including Roller To represent the dependence of the momentum transport of the roller on the cross-shore wave height distribution, the wave energy balance equation (Equation 31) was included in NMLong-CW. Thus, Equation 32 was solved after the wave action equation to yield the momentum fluxes associated with the roller in the cross-shore and longshore directions. Relative wave quantities were employed in the roller equation to account for the wave-current interaction. However, before applying the enhanced model to the CHL-I and C&K data sets, sensitivity tests were carried out, including both monochromatic and random waves. Monochromatic waves occasionally caused numerical instability, because the break point represents a discontinuity in the forcing. This problem and how it was circumvented is discussed in the chapter dealing with modeling the longshore current. For random waves, the forcing constitutes a smooth function across the profile, and no difficulties were encountered in such simulations.
In the CHL-I and C&K experiments, the waves propagated across the profile (i.e., perpendicular to the shoreline), and the only manifestation of including the roller would be on the mean water level. In test simulations for these two data sets, the mean water level was only marginally changed by including the roller momentum, which in turn did not noticeably change the wave height distribution across the profile. In comparing, calculated mean water level from NMLong-CW simulations with and without roller, the simulations with the roller displayed the expected shoreward shift in the water level shape.

36 Chapter 4 Verification of Wave Model
-8 -4 0 4 8
Distance Across Shore, m
0.00
0.02
0.04
0.06
0.08
RM
S W
ave
Hei
ght,
m
Measured
Calculated
Figure 13. Calculated and measured wave height for Chawla and Kirby
(1999) Test R2
0.02
0.04
0.06
0.08
0.10
RM
S W
ave
Hei
ght,
m
-8 -4 0 4 8
Distance Across Shore, m
Calculated
Measured
Figure 14. Calculated and measured wave height for Chawla and Kirby
(1999) Test R4

Chapter 4 Verification of Wave Model 37
0.04
0.06
0.08
0.10
0.12
Rm
s W
ave
Hei
ght,
m
-8 -4 0 4 8
Distance Across Shore, m
Measured
Calculated
Figure 15. Calculated and measured wave height for Chawla and Kirby
(1999) Test R15
0.04
0.06
0.08
0.10
0.12
Rm
s W
ave
Hei
ght,
m
-8 -4 0 4 8
Distance Across Shore, m
Calculated
Measured
Figure 16. Calculated and measured wave height for Chawla and Kirby
(1999) Test R19

38 Chapter 4 Verification of Wave Model
Example Calculation of Wave Transformation at Tidal Inlet Field data are lacking for tidal inlets that would allow for detailed testing of NMLong-CW. Thus, a hypothetical case was simulated by specifying conditions representative for the flow through an inlet during ebb and flood tide. The example discussed here involves inlet currents and waves representative of hydrodynamic conditions as observed at Shinnecock Inlet, Long Island, NY. An inlet channel was simulated with a water depth of 4 m at the throat and linearly sloping offshore to a depth of 12 m (assumed boundary for this inlet). Waves are assumed to travel along the channel (zero incident wave angle), and the tidal current (flood or ebb) decreases linearly from the throat to the offshore end of the channel, where it was set to zero (at the 12-m water depth). The deepwater rms wave height was set to 1.0 m, and the mean wave period 8 s (typical for Shinnecock Inlet). Standard parameter values were employed in the NMLong-CW simulations, and the roller model was not included (negligible effect on the wave transformation in this case).
Figure 17 displays the results of the simulations for two different current speeds at the inlet throat for the flood and ebb current, together with a calculation with no current. In the no-current case, a small increase in wave height is observed because of shoaling associated with the decrease in water depth. For the flood current, the waves experience a reduction in height as they approach the inlet because of the following current. The opposite trend occurs if the waves encounter an ebb flow, and a pronounced wave height increase might take place. For example, for the situation of an ebb current of 3.0 m/s at the inlet throat, wave breaking occurs and causes a reduction in wave height, as seen in Figure 17. Also, for the stronger ebb current, wave blocking takes place before the waves reach the inlet throat. Figure 18 is a photograph taken from the west jetty at Shinnecock Inlet and shows wave breaking and blocking on an ebb current. Note that the waves cannot penetrate against the current, with turbulent water to the left (south) and calm water to the north, inside the inlet.
By this example, it can be seen that the wave climate in a long, straight inlet channel can be investigated with NMLong-CW under the assumption of longshore uniformity. For example, for a given ebb current and offshore wave height and period, the increase in wave height and wave steepness, defined as H/L, owing to the presence of the tidal current can be calculated. Steep waves make navigation difficult if the wavelength approaches that of the vessel transiting the inlet.
Concluding Remarks The enhanced wave model based on the wave action equation was evaluated by comparison with two data sets from laboratory experiments involving the shoaling and breaking on an opposing current. One of the experiments (Smith et al. 1998) was conducted in shallow water, implying that wave transformation over the bottom was marked, whereas the other experiment (Chawla and Kirby 1999) was carried out essentially for deep-water conditions (negligible influence of the sea bottom). The former experiment characterizes situations for which NMLong-CW would typically

Chapter 4 Verification of Wave Model 39
0 100 200 300
Distance Offshore, m
0.4
0.9
1.4
1.9
2.4
Rm
s W
ave
Hei
ght,
m
-3
-1
0
3
1
Current Speed, m/s
Figure 17. Calculated wave transformation on flood and ebb currents for
conditions representative of Shinnecock Inlet, Long Island
Ebb current
Limit of wave penetration(Waves blocked) Calm water
Wave direction
Figure 18. Wave breaking and blocking by ebb current at Shinnecock Inlet,
Long Island, NY

40 Chapter 4 Verification of Wave Model
be applied, whereas the latter experiment would be at the limit of application for the model. However, because the C&K data encompassed several tests with wave blocking, it provided an opportunity to investigate how well the routine in NMLong-CW would predict this mechanism (and the efficiency of the model in describing the situation). Also, because the C&K data were representative of deep water, the model could be evaluated for such conditions with emphasis on energy dissipation produced by breaking at greater water depths (i.e., breaking due to limitations in the wave steepness) and how to model this.
The enhanced version of NMLong-CW reproduced the CHL-I data well, validating the generalized formulation of the Dally (1980) model for wave breaking on a current. No modifications of the empirical coefficient values were needed, with standard values employed. In the simulations of the C&K data, the same standard values, NMLong-CW produced robust and acceptable results for most of the tests, at least regarding the blocking location and maximum wave height. A new, improved description of the stable wave height after breaking would increase the agreement between calculations and measurements, but it was considered outside the scope of the present study to develop such a relationship. Also, as observed by Chawla and Kirby (1998, 2002), the current speed needed for blocking predicted by linear theory was lower than what was measured. Thus, the model would be on the conservative side regarding the prediction of blocking and the associated maximum wave height.
In summary, NMLong-CW was found to be suitable for calculating wave shoaling, breaking, and blocking on an opposing current at limited water depths, producing robust and reliable results with no calibration. In applications for deep water, the model still displayed robust behavior and yielded acceptable results for blocking location and maximum wave height, but larger uncertainties should be expected regarding details of the variation in wave height after breaking.

Chapter 5 Longshore Current Model 41
5 Longshore Current Model
Introduction The longshore current is determined by solving the longshore momentum equation under the assumption of alongshore uniformity. Kraus and Larson (1991) discuss the governing equation employed in NMLong together with underlying assumptions and limitations. In NMLong-CW, the same differential equation as in the original model is solved to calculate the cross-shore distribution of the longshore current, with the difference that wave properties are described in a relative frame of reference. Another difference compared to NMLong is the possibility of specifying an arbitrary current in NMLong-CW that might be generated, for example, by tidal motion. In the following, the governing equation is reviewed with emphasis on the changes made. Reference is made to Kraus and Larson (1991) for more complete discussion.
Longshore Momentum Equation In NMLong-CW, after the wave transformation calculations described in Chapter 3 have been performed, the longshore current is computed from the alongshore momentum equation including lateral mixing, bottom friction, and external forcing. The equation is,
1ερ
xyby w lc
dSd dVh f R R
dx dx dx − = − −
(34)
where
V = longshore current velocity (total current originating from waves, tide, and external current)
fby = bottom friction stress
ε = lateral mixing coefficient
Sxy = radiation stress transported onshore and directed alongshore
Rw and Rlc = forcing associated with wind and an external current (e.g., tide), respectively.
The lateral mixing coefficient is parameterized as (Kraus and Larson 1991), ε Λ mHu= (35)

42 Chapter 5 Longshore Current Model
where
Λ = nondimensional coefficient
H = wave height
um = bottom wave orbital velocity
The velocity V constitutes the alongshore component of U, that is, U = (V2+Uc
2)1/2, where Uc is the mean cross-shore velocity. Lateral mixing as described here for a depth-averaged model is an approximation to the more complex process of vertical and horizontal transfer of momentum as derived by Putrevu and Svendsen (1992).
The forcing associated with a local wind is given by:
ϕρρ
sinWWCR aDw = (36)
where
CD = drag coefficient (given by the expression developed by the WAMDI group; see Equation 29)
ρa = density of air
W = wind speed
ϕ = wind direction (W and ϕ defined in the same way as for the current; see Figure 1)
It is possible to specify an external current, assumed to be associated with some large-scale circulation not resolved by NMLong-CW. To represent this current in the model, a forcing is derived from, lclcflc UUcR = (37)
where cf = bottom friction coefficient, and Ulc = a specified longshore component of the external current (Ucs is the cross-shore component of this current taken to be equal to total cross-shore current Uc, that is, the cross-shore current is specified and not calculated in NMLong-CW). If no waves and wind are present, Equation 34 will produce the specified external current distribution (compare Equations 34 and 37). To represent the roller, an extra term should be added on the right side of Equation 34 according to d(MR,l/ρ)/dx, where MR,l = mRCrsin(α) cos(α), as before.
Bottom Friction The quadratic bottom friction is calculated by means of a rapidly evaluated square-wave approximation (Nishimura 1988; Kraus and Larson 1991),
2sin αby f
wf c Z V
Z = +
(38)
where

Chapter 5 Longshore Current Model 43
2 2 1/ 2
2 2 1/ 2
( 2 sinα)1
2 ( 2 sinα)
V w wVZ
V w wV
+ + += + −
(39)
2
π mw u= (40)
To be consistent with previous assumptions, if a cross-shore current is specified, Uc is not included in fby. Finally, the radiation stress Sxy is calculated from:
21 ρ sin 2α16
grxy
r
CS gH
C= (41)
Numerical Solution The numerical solution of Equation 34 follows Kraus and Larson (1991). A staggered grid is employed where most wave-related quantities are evaluated at the boundaries of the calculation cells, and the longshore current is evaluated in the middle of cells. A tridiagonal system of equations is obtained that is efficiently solved through a double-sweep algorithm, which is also highly stable with little numerical dispersion. The boundary conditions are accommodated in the same way as for NMLong, with the exception that the external current is included in the solution. Also, as discussed in Chapter 3, iterations are performed between the wave and current calculations to represent the wave-current interaction.
Modification of Roller Model It was observed during implementation of the roller model that application of Equation 32 directly for monochromatic waves could cause some unphysical behavior. Just after the wave started breaking, the roller would grow too quickly, inducing a gradient in the momentum fluxes (cross-shore and alongshore) that could overpower the radiation stress gradients. Thus, the gradient in the roller momentum fluxes would not simply balance the gradient in the radiation stresses to yield the desired shoreward translation in the total forcing. Rather, because the gradient arising from the roller was larger, a longshore current would be generated that was going opposite to the longshore component of the waves. For random waves where the radiation stresses are ensemble-averages over many waves, the growth of the roller will be more gradual, and this problem does not occur.
To remedy this situation, an algorithm was implemented that limits the growth of the roller so that the gradient in the roller momentum flux does not exceed the gradient in the radiation stress (with consideration of the signs). This algorithm is only activated during the phase where the roller is growing; after the roller reaches maximum size, the gradient in the roller momentum flux will change sign, and this term will be the main driving force for the longshore current and mean water level. If the gradient in the roller momentum flux exceeds the radiation stress gradient during the roller growth phase at any given location and time-step, the roller size is determined from the condition that the two gradients are equal, instead of from Equation 32.

44 Chapter 6 Verification of Longshore Current Model
6 Verification of Longshore Current Model
Predictions of the longshore current by NMLong-CW were compared with several data sets from the laboratory and the field. Comparisons with the measured wave height and water level variation across the profile were also included, if such measurements were available. The objectives of the comparisons were to:
a. Assure that the model functioned properly and displayed robust behavior, especially with regard to the various routines that were added to describe the current and wave interactions.
b. Determine typical values of the bottom friction and lateral mixing coefficients for the extended model (in case these values are different from those employed in NMLong).
c. Assess sensitivity of the current, mean water level, and wave height by including complete interaction between currents and waves.
d. Assess sensitivity of the calculated current, mean water level, and wave height by including momentum transport due to the roller.
e. Evaluate model performance with imposition of an external current.
To accomplish these objectives, calculations were compared to five data sets on the longshore current originating both from the laboratory and the field. Kraus and Larson (1991) analyzed two of these data sets to test and calibrate NMLong, those of Visser (1982) and Kraus and Sasaki (1979; “K&S”). Additional data sets from Kuriyama and Ozaki (1993; K&O), Smith, Larson, and Kraus (1993; “Delilah”), and Hamilton and Ebersole (2001; “CHL-L”) were also employed in the present study. In the following, summaries are of the respective data set and the results of the NMLong-CW simulations are given with reference to the objectives previously listed. The laboratory data sets are introduced first (Visser and CHL-L) followed by the field data sets (K&S, K&O, and Delilah). Calculations were also performed for hypothetical situations involving an external current that represented a longshore current that might be associated with the tide.
Visser Data Visser (1982) carried out precise measurements of the longshore current generated by breaking waves on a plane beach in a large laboratory wave basin. The cross-shore distribution of the longshore current was measured at several transects, together with the wave height and mean water level. Seven cases involving monochromatic waves were undertaken of which four were

Chapter 6 Verification of Longshore Current Model 45
selected here representing a wide range of wave and beach conditions (Cases 1, 3, 4, and 7). Kraus and Larson (1991) summarized the experimental arrangement and conditions, measured wave height, mean water level, and longshore current used in the comparisons. For reference, the wave conditions in the horizontal portion of the basin during the experimental cases studied are listed in Table 4. In summary, Case 1 encompassed large incident wave angles and smooth bottom; Case 3, large wave heights and smooth bottom; Case 4, an average wave condition and smooth bottom; and Case 7, an average wave condition and rough bottom.
Table 4 Wave Conditions in the Horizontal Portion of Basin for Selected Cases from Visser (1982) Experiments Represented by NMLong-CW Simulations Case Wave Height (m) Wave Period (s) Wave Angle (deg) Beach Slope (-)
1 0.072 2.01 31.1 0.101
3 0.089 1.00 15.4 0.101
4 0.078 1.02 15.4 0.050
7 0.078 1.02 15.4 0.050
Because Visser’s experiments were run with monochromatic waves, not involving the additional complexity of random waves breaking at different locations across the profile, it is an excellent data set to evaluate model performance with respect to features such as the wave-current interaction and the roller model. Kraus and Larson (1991) investigated both a linear and nonlinear friction formulation in the longshore momentum equation, but in this study only the nonlinear model is employed (Equation 38). The coefficients in the wave transformation model were fixed to standard values (κ = 0.15, and Γ = 0.4), whereas γb was set to the value measured by Visser (1982) to eliminate an additional model parameter (compare Larson and Kraus 1991). Thus, the two main parameters entering the calibration were cf (Equation 38) and Λ (Equation 35). These two parameters were also optimized by Kraus and Larson (1991), who found the following range of values for the Visser data for nonlinear friction: cf = 0.005-0.014 and Λ = 0.15-0.50.
First, calculations were performed with NMLong-CW with and without the roller model to assess inclusion of the momentum transport associated with the roller on the longshore current and mean water level. In previous attempts to simulate the Visser data, as well as other data sets of similar type, it has been noted that there can be a pronounced shoreward shift in the peak of the current and wave setdown in the measurements as compared to calculations. This shift might be eliminated or reduced by including the roller model. In the simulations discussed here, unless otherwise stated, standard roller parameter values as recommended by Dally and Brown (1995) were employed, that is, βR = 1.0 and βD = 0.1.
Figures 19-29 summarize the results from NMLong-CW simulations by showing comparisons between measurements and calculations for longshore current, mean water level, and wave height for each of the four cases. The emphasis in the comparisons is on the current and water level, and the wave height is shown for completeness, although the calculations results are

46 Chapter 6 Verification of Longshore Current Model
0 1 2 3 4 5
Distance Across Shore, m
0.0
0.2
0.4
0.6
0.8
Long
shor
e C
urre
nt, m
/s
Calc. with roller
Calc. without roller
Measured
Figure 19. Calculated (with and without roller model) and measured
longshore current for Visser (1982), Case 1
0 1 2 3 4 5
Distance Across Shore, m
-0.02
0.00
0.02
0.04
0.06
Wav
e S
etup
, m
Calc. with roller
Calc. without roller
Measured
Figure 20. Calculated (with and without roller model) and measured mean
water level for Visser (1982), Case 1

Chapter 6 Verification of Longshore Current Model 47
0 1 2 3 4 5
Distance Across Shore, m
0.00
0.04
0.08
0.12
Wav
e H
eigh
t, m
Calculated
Measured
Figure 21. Calculated and measured wave height for Visser (1982), Case 1
0.0
0.1
0.2
0.3
0.4
0.5
Long
shor
e C
urre
nt, m
/s
-1 0 1 2 3 4 5
Distance Across Shore, m
Calc. with roller
Calc. without roller
Measured
Figure 22. Calculated (with and without roller model) and measured
longshore current for Visser (1982), Case 3

48 Chapter 6 Verification of Longshore Current Model
-1 0 1 2 3 4 5
Distance Across Shore, m
-0.02
0.00
0.02
0.04
0.06
Wav
e S
etup
, m
Calc. with roller
Calc. without roller
Measured
Figure 23. Calculated (with and without roller model) and measured mean
water level for Visser (1982), Case 3
-1 0 1 2 3 4 5
Distance Across Shore, m
0.00
0.02
0.04
0.06
0.08
0.10
Wav
e H
eigh
t, m
Calculated
Measured
Figure 24. Calculated and measured wave height for Visser (1982), Case 3

Chapter 6 Verification of Longshore Current Model 49
-2 0 2 4 6 8 10
Distance Across Shore, m
0.0
0.1
0.2
0.3
0.4
0.5
Long
shor
e C
urre
nt, m
/s
Calc. with roller
Calc. without roller
Measured
Figure 25. Calculated (with and without roller model) and measured
longshore current for Visser (1982), Case 4
-2 0 2 4 6 8 10
Distance Across Shore, m
-0.005
0.000
0.005
0.010
0.015
0.020
Wav
e S
etup
, m
Calc. without roller
Measured
Calc. with roller
Figure 26. Calculated (with and without roller model) and measured mean
water level for Visser (1982), Case 4

50 Chapter 6 Verification of Longshore Current Model
-2 0 2 4 6 8 10
Distance Across Shore, m
0.00
0.02
0.04
0.06
0.08
0.10
Wav
e H
eigh
t, m
Calculated
Measured
Figure 27. Calculated and measured wave height for Visser (1982), Case 4
0.0
0.1
0.2
0.3
Long
shor
e C
urre
nt, m
/s
-2 0 2 4 6 8 10
Distance Across Shore, m
Calc. with roller
Measured
Calc. without roller
Figure 28. Calculated (with and without roller model) and measured
longshore current for Visser (1982), Case 7
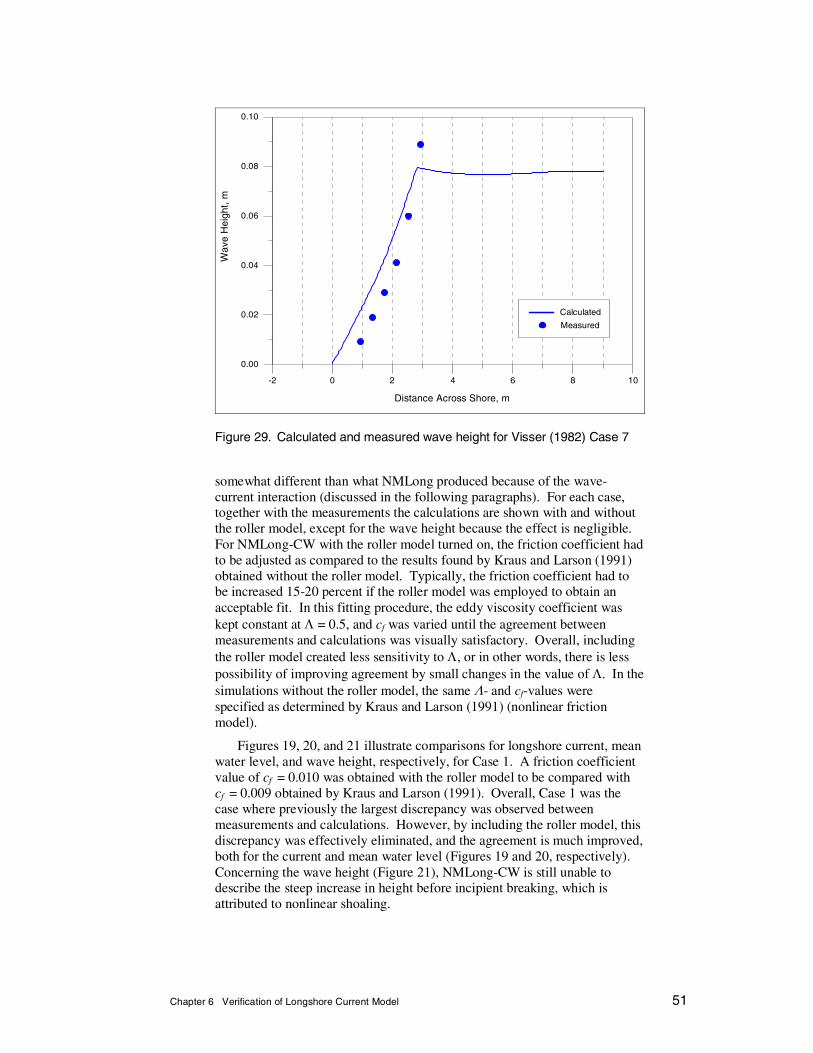
Chapter 6 Verification of Longshore Current Model 51
-2 0 2 4 6 8 10
Distance Across Shore, m
0.00
0.02
0.04
0.06
0.08
0.10
Wav
e H
eigh
t, m
Measured
Calculated
Figure 29. Calculated and measured wave height for Visser (1982) Case 7 somewhat different than what NMLong produced because of the wave-current interaction (discussed in the following paragraphs). For each case, together with the measurements the calculations are shown with and without the roller model, except for the wave height because the effect is negligible. For NMLong-CW with the roller model turned on, the friction coefficient had to be adjusted as compared to the results found by Kraus and Larson (1991) obtained without the roller model. Typically, the friction coefficient had to be increased 15-20 percent if the roller model was employed to obtain an acceptable fit. In this fitting procedure, the eddy viscosity coefficient was kept constant at Λ = 0.5, and cf was varied until the agreement between measurements and calculations was visually satisfactory. Overall, including the roller model created less sensitivity to Λ, or in other words, there is less possibility of improving agreement by small changes in the value of Λ. In the simulations without the roller model, the same Λ- and cf-values were specified as determined by Kraus and Larson (1991) (nonlinear friction model).
Figures 19, 20, and 21 illustrate comparisons for longshore current, mean water level, and wave height, respectively, for Case 1. A friction coefficient value of cf = 0.010 was obtained with the roller model to be compared with cf = 0.009 obtained by Kraus and Larson (1991). Overall, Case 1 was the case where previously the largest discrepancy was observed between measurements and calculations. However, by including the roller model, this discrepancy was effectively eliminated, and the agreement is much improved, both for the current and mean water level (Figures 19 and 20, respectively). Concerning the wave height (Figure 21), NMLong-CW is still unable to describe the steep increase in height before incipient breaking, which is attributed to nonlinear shoaling.

52 Chapter 6 Verification of Longshore Current Model
The calculation results for Case 3 are displayed in Figures 22, 23, and 24, where cf = 0.009 was found with the roller model included, and cf = 0.007 without the roller model. Again, the shift in the peak of the longshore current is well captured, and overall the agreement improves by including the roller model. However, the width of the measured current distribution is somewhat underestimated, which might be remedied with an improved formulation for the lateral mixing. The present formulation for the mixing is related to the local wave height and bottom orbital velocity. This typically yields a satisfactory description of the mixing outside the surf zone, but inside the surf zone the mixing could be underestimated because both the wave height and bottom orbital velocity decrease. In reality, the mixing should increase because of the breaking and associated strong turbulence. Some alternative formulations of the lateral mixing are discussed in the following paragraphs.
Figure 23 displays the calculated and measured mean water elevation, and it is clearly seen that including the roller model yields significantly improved results, although the setup seems to be overestimated close to shore in very shallow water. The wave height is also well predicted as shown in Figure 24.
The results for Case 4 (see Figures 25, 26, and 27) exhibit the same basic characteristics as the calculations for Cases 1 and 3. The peak in the longshore current distribution agrees well with the measurements if the roller model is employed, but the width of the current distribution is somewhat underestimated (Figure 25). A friction coefficient value of cf = 0.006 was obtained with the roller model, and cf = 0.005 without. Figure 26 shows that the setup is well predicted in shallow water, although the area around the maximum setdown is not as pronounced in the measurements as in the calculations. Cases 1, 3, and 4 had the same roughness properties in the experiments (smooth bottom), whereas Case 7 had a higher roughness (rough bottom). However, the optimal cf-value consistently decreases for the three cases (both with and without roller model), probably indicating some kind of Reynolds number dependence for the friction coefficient.
Figures 28 and 29 compare measurements and calculations for the longshore current and wave height, respectively, for Case 7 (no mean water level measurements were available for Case 7). The greater bottom roughness caused the magnitude of the longshore current to be significantly smaller than in the other cases studied here. Thus, the optimal values for the friction were cf = 0.016 and 0.014, including or not including the roller model, respectively.
Simulations were performed to assess the functioning of the wave-current interaction, that is, iterating between the wave and current computations in the manner previously described until convergence was achieved. As an example, Figures 30, 31, and 32 compare measurements and calculations for the longshore current, mean water level, and wave height, respectively, for Visser Case 1, where the interaction between the waves and the current was either taken into account or neglected. The difference between full interaction and no wave-current interaction is not that pronounced (and even less in the other Visser cases that had lower current speeds), but taking into account the interaction tends to increase the current peak and decrease the mean water level and wave height.

Chapter 6 Verification of Longshore Current Model 53
0 1 2 3 4 5
Distance Across Shore, m
0.0
0.2
0.4
0.6
0.8
Long
shor
e C
urre
nt, m
/s
Measured
Calc. without c-w interaction
Calc. with c-w interaction
Figure 30. Calculated (with and without interaction between current and
waves) and measured longshore current for Visser (1982), Case 1
0 1 2 3 4 5
Distance Across Shore, m
-0.02
0.00
0.02
0.04
0.06
Wav
e S
etup
, m
Calc. with c-w interaction
Calc. without c-w interaction
Measured
Figure 31. Calculated (with and without interaction between current and
waves) and measured mean water elevation for Visser (1982), Case 1

54 Chapter 6 Verification of Longshore Current Model
0 1 2 3 4 5
Distance Across Shore, m
0.00
0.04
0.08
0.12
Wav
e H
eigh
t, m
Calc. without c-w interaction
Calc. with c-w interaction
Measured
Figure 32. Calculated (with and without interaction between current and
waves) and measured wave height for Visser (1982), Case 1
CHL-L Data Hamilton and Ebersole (2001) investigated methods for establishing a uniform mean longshore current distribution, as driven by obliquely incident waves, along the shore in a large laboratory basing recently installed at the U.S. Army Engineer Research and Development Center (ERDC), Coastal and Hydraulics Laboratory (CHL), (this data set is referred to as the CHL-L data here). Two comprehensive test series were conducted on a plane concrete beach with straight and parallel contours (1:30 slope down to horizontal bottom) encompassing monochromatic and random waves. Wave height, mean water level, and longshore current velocity were measured along several profile transects. For evaluating NMLong-CW, one monochromatic and one random test were available from the experiments.
Table 5 summarizes the wave conditions for the two tests (Tests 6N and 8E). Hamilton and Ebersole (2001) tabulated the measured data in an appendix, and the average values over several transects were considered for model validation in the present study. The water depth in the horizontal portion of the basin was 0.667 m, and for Test 8E it is the energy-based significant wave height and peak spectral period that are given in the table.
Table 5 Wave Conditions in the Horizontal Portion of Basin for Two Tests from Hamilton and Ebersole (2001) Experiments Used in NMLong-CW Simulations Test Wave Height (m) Wave Period (s) Wave Angle (deg) Comment
6N 0.182 2.5 10 Monochromatic
8E 0.225 2.5 10 Random waves
Chapter 6 Verification of Longshore Current Model 55
Figures 33, 34, and 35 illustrate the calculation results with NMLong-CW for the longshore current, mean water level, and wave height, respectively, for Test 6N. Calculations were performed with and without the roller model, and standard values were assigned to all model parameters except cf (Λ = 0.5). The friction coefficient with and without the roller was set to cf = 0.005 and 0.004, respectively. Again, inclusion of the roller model causes a shoreward shift of the longshore current distribution that significantly improves the agreement with the measurements, although the measured peak in the distribution is still located somewhat inshore of the computed peak. The shoreward translation of the forcing produced by the roller model causes a narrowing of the surf zone (i.e., the total forcing acts over a shorter distance), which in turn implies that cf must be increased somewhat to achieve optimal agreement with the data.
Agreement with the measured mean water level is also improved by including the roller model (see Figure 34), but the shoreward shift induced by the roller is not sufficient, and the measured water level distribution still lies shoreward of the predicted one. Another discrepancy is the maximum setdown, which is larger in the measurements than calculated. The smaller calculated value might be related to nonlinear shoaling, which is not taken into account in NMLong-CW, causing an increase in the wave height prior to incipient breaking. The comparison between the calculated and measured wave height supports this assumption, because the wave height is underestimated during the final portion of the shoaling directly before incipient breaking (Figure 35). Modifying the ratio γb might improve agreement for the wave height, also modifying the current and mean water level distributions. However, the primary objective here was to validate the model with standard values assigned to the different model parameters and allow only cf to vary in comparing calculations and measurements.
-0.1
0.0
0.1
0.2
0.3
0.4
0.5
Long
shor
e C
urre
nt, m
/s
0 5 10 15 20 25
Distance Across Shore, m
Measured
Calc. without roller
Calc. with roller
Figure 33. Calculated (with and without roller model) and measured
longshore current for Hamilton and Ebersole (2001), Test 6N

56 Chapter 6 Verification of Longshore Current Model
0 5 10 15 20 25
Distance Across Shore, m
-0.025
0.000
0.025
0.050
Wav
e S
etup
, mCalc. without roller
Measured
Calc. with roller
Figure 34. Calculated (with and without roller model) and measured mean
water elevation for Hamilton and Ebersole (2001), Test 6N
0 5 10 15 20 25
Distance Across Shore, m
0.0
0.1
0.2
0.3
Wav
e H
eigh
t, m
Measured
Calculated
Figure 35. Calculated and measured wave height for Hamilton and Ebersole
(2001), Test 6N

Chapter 6 Verification of Longshore Current Model 57
Figures 36, 37, and 38 show the calculated and measured distributions of the longshore current, mean water level, and wave height, respectively, for Test 8E, which involved random waves. The same friction coefficient values were applied as for Test 6N, and a Rayleigh pdf was assumed to describe the random properties of the wave height in the horizontal portion of the basin (wave period and incident wave angle were held fixed during the Monte-Carlo simulations). The agreement between the measured and calculated current distribution improved somewhat compared to the monochromatic test, and functioning of the roller model is necessary for obtaining satisfactory simulation results. At the seaward end, the calculated current tails off with a smaller slope than what the measurements seem to indicate. Thus, the mixing formulation appears to somewhat overestimate the lateral momentum exchange in deeper water, which is also indicated in the simulations of Test 6N (Figure 33).
Similar to the calculations for the monochromatic test, the computed mean water level distribution is located more seaward than the measured distribution, and the maximum setdown is underestimated (Figure 37). Again, the underestimation might be related to nonlinear wave shoaling, not represented in NMLong-CW, although it is not as easily seen in the wave height distribution as for Test 6N because the statistical wave height computed tends to smooth the action of individual waves. Figure 38 shows the agreement between the calculated and measured (significant) wave heights, and some discrepancy is observed. The discrepancy is attributed primarily to differences arising from the calculated and reported wave heights: the calculated wave height is the significant value determined from the mean of the one-third highest waves, whereas the measured wave height is the energy-based significant height derived from the spectrum. The measured height includes the long-periodic motion in shallow water, which is often filtered before the wave height is computed.
0.0
0.1
0.2
0.3
0.4
Long
shor
e C
urre
nt, m
/s
0 5 10 15 20 25
Distance Across Shore, m
Calc. with roller
Measured
Calc. without roller
Figure 36. Calculated (with and without roller model) and measured
longshore current for Hamilton and Ebersole (2001), Test 8E

58 Chapter 6 Verification of Longshore Current Model
0 5 10 15 20 25
Distance Across Shore, m
-0.020
0.000
0.020
0.040
Wav
e S
etup
, m
Calc. with roller
Calc. without roller
Measured
Figure 37. Calculated (with and without roller model) and measured mean
water elevation for Hamilton and Ebersole (2001), Test 8E
0 5 10 15 20 25
Distance Across Shore, m
0.0
0.1
0.2
0.3
Sig
nific
ant W
ave
Hei
ght,
m
Measured
Calculated
Figure 38. Calculated and measured wave height for Hamilton and Ebersole
(2001), Test 8E

Chapter 6 Verification of Longshore Current Model 59
Although the shift in the current distribution obtained by the roller model is satisfactory, the distribution appears to be somewhat narrow, implying that the lateral mixing is not sufficient. The present formulation of the mixing coefficient (Equation 35), where ε depends on H and um, has a tendency to generate insufficient mixing in the surf zone. In this zone, breaking prevails, and strong turbulence is generated in the water column enhancing both vertical and lateral mixing. The next section includes some trial simulations where mixing produced by the roller is parameterized and incorporated.
Kraus-Sasaki (K&S) Data Kraus and Sasaki (1979) measured the longshore current distribution along seven transects on a sandy beach facing the Japan Sea, from which an average velocity distribution was obtained. The incident waves during the measurements were clean swell with a significant wave height of 1 m, a mean wave period of 4.1 s, and a mean wave angle of 9 deg at the point of incipient breaking. The water depth was measured by rod and transit, and the beach profile had a step-type shape. No measurements were made of the wave height variation. Kraus and Larson (1991) discussed the data and the basic conditions for the numerical simulations more extensively.
Figure 39 compares calculations and measurements (the beach profile is also shown). The peak in the measured current is fairly well predicted, whereas the mixing is more pronounced for the measurements in the inner part of the surf zone where the beach slope is small and the profile has a shelf-type shape. Also, the offshore tail in the current distribution was calculated to decay with a smaller gradient than what was observed. The computations were carried out by Monte-Carlo simulation assuming a Rayleigh distribution in the offshore. There was no tuning of the parameter values, but the friction coefficient was changed until the results visually fit the measurements and the mixing coefficient was held constant (Λ = 0.50). A friction coefficient value of cf = 0.0035 was obtained if the roller model was employed and cf = 0.0030 if the roller model was switched off.
As seen from Figure 39, the roller model shifts the peak in the current toward the shore, improving agreement between calculation and measurements. However, even after introduction of the roller model, there are larger disagreements between model and data than for the previous laboratory simulations, both with respect to the measured offshore tail and the flat distribution in the surf zone. To improve the agreement and evaluate the sensitivity of the model to some of the parameters, simulations were made with different values on βD than were recommended by Dally and Brown (1995), as well as for alternative mixing formulations.
Figure 40 illustrates the result of changing βD on the longshore current distribution. A smaller value on βD implies a lower dissipation rate in the roller, which in turn means that the roller keeps its mass and momentum for a longer distance, thereby shifting the forcing more shoreward. Thus, the peak in the current will be translated shoreward if βD is decreased, as seen in Figure 40. Somewhat better agreement between the calculations and the

60 Chapter 6 Verification of Longshore Current Model
Beach Profile
0 20 40 60 80
Distance Across Shore, m
-1.0
-0.5
0.0
0.5
1.0
Long
shor
e C
urre
nt, m
/s
-2
-1
0
1
2
Pro
file
Ele
vatio
n, m
Calc. with roller
Calc. without roller
Measured
Figure 39. Calculated (with and without roller model) and measured
longshore current for Kraus and Sasaki (1979) field experiment (beach profile also shown for calculation domain)
Beach Profile
0 20 40 60 80
Distance Across Shore, m
-1.0
-0.5
0.0
0.5
1.0
Long
shor
e C
urre
nt, m
/s
-2
-1
0
1
2
Pro
file
Ele
vatio
n, m
Roller diss. 0.1
Roller diss. 0.05
Measured
Figure 40. Calculated (two different dissipation coefficients) and measured
longshore current for Kraus and Sasaki (1979) field experiment (beach profile also shown for calculation domain)

Chapter 6 Verification of Longshore Current Model 61
measurements is obtained with a smaller value for βD than that recommended by Dally and Brown (1995), both regarding the shape of the offshore tail and the distribution in the surf zone. There is still a problem in reproducing the flat current distribution in the surf zone.
Next, a different formulation for the lateral mixing was investigated to see if the flat current distribution in the surf zone could be simulated better. The expression for the lateral mixing developed by Kraus and Larson (1991), where ε is related to the local wave height and bottom orbital velocity, fairly well describes the lateral exchange of momentum, especially outside the surf zone where wave breaking is limited. However, in the surf zone, the mixing might be underestimated because ε has a weak dependence on the breaking wave properties. Thus, an alternative expression for the mixing was explored where ε depends on the roller characteristics.
In turbulence modeling, the diffusion of momentum is typically estimated from the turbulent kinetic energy k according to,
t c klµν = (42)
where νt = kinematic eddy viscosity
cµ = empirical coefficient
l = length scale of the turbulent eddies
The energy dissipation D is typically parameterized as:
3/ 2
ρ D
kD c
l= (43)
where cD = an empirical coefficient. Assuming that the production of turbulence may be derived from the energy loss by the roller, estimated as gβDmR from Dally and Brown (1995), and that locally the production and dissipation of turbulence balance each other, the following expression is obtained,
3/ 2β ρD R
D
g m kc
d l= (44)
where the turbulence produced by the roller was evenly distributed over the water depth. The largest eddies (containing the most energy) should be on the order of the water depth, making it reasonable to set l ≈ d. Combining Equations 42 and 44 yields:
1/ 3
1/ 3
βρD R
tD
c g md
cµ
ν =
(45)

62 Chapter 6 Verification of Longshore Current Model
The mixing coefficient given by Equation 45 is in principle the same as that derived by Battjes (1975), if gβDmR is identified as the mean rate of wave energy dissipation per unit area. The empirical coefficients in front of the bracket on the right side of Equation 45 yield a value of about unity by applying values from typical turbulent flows (Rodi 1980). In NMLong-CW, to take into account the enhanced mixing from wave breaking, test simulations were carried out with the following equation:
1/3
1 2
βε Λ ΛρD R
m
g mHu d
= +
(46)
where Λ1 and Λ2 are nondimensional coefficients. The two coefficients were given the same value in the test simulations, namely Λ1 = Λ2 = 0.5. Figure 41 displays the result of introducing the additional mixing, where a general decrease in the current speed occurred compared to the standard mixing. A slight increase in velocity close to shore is noted, as well as a tailing off in deeper water with a smaller gradient. However, the result does not show marked improvement over the standard mixing formulation. Calibration of the values for Λ1 and Λ2 will yield better agreement in the surf zone, and the current distribution could be made close to flat here in agreement with the data. Simultaneously, the offshore tail in the current distribution will decrease less steeply, implying worse agreement in this region. Thus, in summary, it is difficult to reproduce the measured current distribution through enhanced mixing, at least if the preceding expressions are employed.
Beach Profile
0 20 40 60 80
Distance Across Shore, m
-1.0
-0.5
0.0
0.5
1.0
Long
shor
e C
urre
nt, m
/s
-2
-1
0
1
2
Pro
file
Ele
vatio
n, m
Standard mixing
Enhanced mixing
Measured
Figure 41. Calculated (two different mixing formulations) and measured
longshore current for Kraus and Sasaki (1979) field experiment (beach profile also shown for calculation domain)

Chapter 6 Verification of Longshore Current Model 63
Kuriyama-Ozaki (K&O) Data Kuriyama and Ozaki (1993; “K&O”) carried out field measurements of the longshore current at Hazaki Oceanographical Research Facility (HORF) located on the Japan Pacific coast. The HORF research pier is 427 m long, and the current measurements were made from the HORF pier by using a float (compare Kraus and Sasaki 1979). The float measurements were calibrated by comparing them with those from an electromagnetic current meter. The beach at HORF, having a mean slope of 1/60, often includes several longshore bars, leading to complex wave transformation with shoaling, breaking, and reforming taking place.
Measurements were carried out for 4 years starting on 5 January 1987. If bars where present, the measurements showed that 85 percent of the time the peak in the longshore current distribution was on the shoreward side of the bar crest. Kuriyama and Ozaki (1993) presented three cases of the longshore current measurements in detail, taken during March and April 1989. The significant wave height was also given at a few cross-shore locations based on measurements with ultrasonic wave gages. Here, one case recorded on 28 March 1989 will be employed to test the capability of NMLong-CW to simulate the current over a complex beach profile. Wave measurements carried out in the offshore at a water depth of 23.4 m served as input to NMLong-CW, and the significant wave height was Hs = 2.6 m and significant wave period Ts = 8.86 s. The wave angle at breaking was observed along the pier, and for input to the model an angle was selected in the offshore (α = 27 deg in the water depth 23.4 m) that produced the measured value at the point of observation. A representative beach profile was obtained by taking the average of five profile surveys along lines located around the pier (lines spaced 10 m apart over a total distance of 50 m). This averaging produced a more smoothed beach profile shape than, for example, the individual profile surveyed along the line that spanned the pier (appeared to be somewhat modified by scour).
Figure 42 shows the calculated (with and without the roller model) and measured distribution of the longshore current together with the representative beach profile. Two longshore bars are identified with a marked trough in between. Breaking on the seaward side of the bar yields two peaks in the longshore current distribution, in agreement with the measurements. The seaward-most peak has the correct magnitude, but is located somewhat seaward of the measured peak, whereas the shoreward-most peak is a bit higher than the observed one, although in the correct location. Addition of the roller model significantly improves agreement with the measurements. The friction coefficient was cf = 0.008 and the mixing parameter was set to Λ = 1.0.
Figure 43 compares calculated and measured significant wave height. The significant wave height was computed in the same manner as for the CHL-I data. The entire series of waves from the Monte-Carlo simulation was saved at each cross-shore location, and the significant wave height was determined as an average for the one-third highest waves. At the two most seaward measurement locations, the calculations markedly overestimate the recorded heights. This is probably because the energy dissipation for the waves propagating from the offshore to the profile in the nearshore being modeled is underestimated (for example, friction in the bottom boundary

64 Chapter 6 Verification of Longshore Current Model
Beach Profile
-1.0
-0.5
0.0
0.5
1.0
Long
shor
e C
urre
nt, m
/s
0 100 200 300 400
Distance Across Shore, m
-8
-4
0
4
8
Pro
file
Ele
vatio
n, m
Calc. with roller
Calc. without roller
Measured
Figure 42. Calculated (with and without roller model) and measured
longshore current for Kuriyama and Ozaki (1993) field experiment (beach profile also shown for calculation domain)
Beach Profile
0 100 200 300 400
Distance Across Shore, m
-3
-2
-1
0
1
2
3
Sig
nific
ant W
ave
Hei
ght,
m
-10
-5
0
5
10
Pro
file
Ele
vatio
n, m
Measured
Calculated
Figure 43. Calculated and measured significant wave height for the Kuriyama
and Ozaki (1993) field experiment (beach profile also shown for calculation domain)

Chapter 6 Verification of Longshore Current Model 65
layer was not included). Kuriyama and Ozaki (1993; see also Kuriyama and Nakatsukasa 1999) developed a model of the longshore current and employed it to simulate the K&O data. Their calculations involved more elaborate methods to derive the input wave conditions, and they obtained better agreement for the cross-shore distribution of the wave height.
Trial calculations were also performed by varying values on the roller dissipation coefficient βD. Figure 44 illustrates the result for βD = 0.05 and 0.1. As for the simulations with the K&S data, reducing the value on βD somewhat improves the agreement between calculations and measurements. However, any reasonable lowering of βD does not reproduce the large value on the current recorded in the middle of the trough. To obtain such strong currents in the trough, a further shoreward translation of the current distribution is necessary. This translation is difficult to accomplish, either through manipulation of the roller parameters or by introducing additional lateral mixing associated with wave breaking.
Beach Profile
-1.0
-0.5
0.0
0.5
1.0
Long
shor
e C
urre
nt, m
/s
0 100 200 300 400
Distance Across Shore, m
-8
-4
0
4
8
Pro
file
Ele
vatio
n, m

66 Chapter 6 Verification of Longshore Current Model
profile included a pronounced longshore bar and the maximum current was typically located in the trough, whereas most of the breaking occurred on the seaward side of the bar (compare Kuriyama and Ozaki 1993). Figure 45 compares the calculated (with and without roller) and measured longshore current distribution together with the beach profile for Case 100 from Smith, Larson, and Kraus (1993). As for the K&O data, the peak in the current distribution more or less occurred in the trough, and the model could not describe this shift entirely, even with the roller model included. Also, the translation in the forcing induced by the roller model creates a large peak at the shoreline, which is similar to what the model by Smith, Larson, and Kraus (1993) produced. Because no measurements were made in this region, it is difficult to assess how realistic this peak is. Most likely, the friction coefficient is larger here because coarser material is moving in the swash. A coarser bed implies a reduced current velocity compared to using the same cf-value as for the remainder of the profile (as done in the present calculations). The wave conditions during Case 100 were Hrms = 0.94 m, Tp = 9.7 s, and α = 32 deg in 8-m water depth, and the measurements were taken during rising tide (+0.2 m above mean sea level). Figure 46 compares calculations and measurements for the rms wave height.
Case 1000 from Smith, Larson, and Kraus (1993) was also simulated to investigate the result for a situation when the tide was falling (water level was 0.40 m below mean sea level). The wave conditions for this case were Hrms = 0.71 m, Tp = 9.7 s, and α = 34 deg (8-m water depth). Figure 47 compares calculated (with and without roller model) and measured longshore current for the Delilah field experiment Case 1000, and Figure 48 gives the corresponding rms wave heights. Because a larger portion of the waves break on the bar for Case 1000 as compared to Case 100, the forcing for the current is stronger on the shoreward side of the bar, and the peak in this region is more pronounced for Case 1000. Thus, because the measured peak is still approximately located in the trough, the deviation between the calculations and measurements is larger for Case 1000 than for Case 100. Even though the roller model translates the calculated current peak shoreward, the shift is not large enough to produce satisfactory agreement for the cases where large portions of the waves break on the bar. Simulations with smaller values of βD and for alternative mixing formulations only marginally improved the results. The calculated rms wave height is in good agreement with the measurements, indicating that the predictions of the input forcing from the waves is estimated with a high degree of accuracy.
Effects of Large-Scale (Tidal) Current on Wave-Generated Current To illustrate the capability of NMLong-CW to simulate the action of a large-scale current on the wave-generated longshore current in the nearshore, a hypothetical example is discussed. An equilibrium profile shape in accordance with Dean (1977) was assumed with a shape parameter of A = 0.1 m1/3, corresponding to a median grain size of about 0.2 mm. An rms wave height in deep water of Hrmso = 2.0 m with a mean period of T = 8.0 s and a mean incident angle αo = 30 deg were specified (waves Rayleigh

Chapter 6 Verification of Longshore Current Model 67
Beach Profile
-2
-1
0
1
2
Long
shor
e C
urre
nt, m
/s
100 200 300 400
Distance Across Shore, m
-6
-4
-2
0
2
4
6
Pro
file
Ele
vatio
n, m
Calc. without roller
Calc. with roller
Measured
Figure 45. Calculated (with and without roller model) and measured
longshore current for Delilah field experiment, Case 100 (beach profile also shown for calculation domain)
Beach Profile
100 200 300 400
Distance Across Shore, m
-6
-4
-2
0
2
4
6
Pro
file
Ele
vatio
n, m
-2
-1
0
1
2
RM
S W
ave
Hei
ght,
m
Measured
Calculated
Figure 46. Calculated and measured rms wave height for Delilah field
experiment, Case 100 (beach profile also shown for calculation domain)

68 Chapter 6 Verification of Longshore Current Model
Beach Profile
-6
-4
-2
0
2
4
Pro
file
Ele
vatio
n, m
6
100 200 300 400
Distance Across Shore, m
-1.0
-0.5
0.0
0.5
1.0
Long
shor
e C
urre
nt, m
/s
Calc. with roller
Calc. without roller
Measured
Figure 47. Calculated (with and without roller model) and measured
longshore current for Delilah (1993) field experiment, Case 1000 (beach profile also shown for calculation domain)
Beach Profile
100 200 300 400
Distance Across Shore, m
-6
-3
0
3
6
Pro
file
Ele
vatio
n, m
-1.0
-0.5
0.0
0.5
1.0
RM
S W
ave
Hei
ght,
m
Measured
Calculated
Figure 48. Calculated and measured rms wave height for Delilah field
experiment, Case 1000 (beach profile also shown for calculation domain)


70 Chapter 6 Verification of Longshore Current Model
yielded a peak in the longshore current (and the mean water level) that was located more seaward than in the measurements. For cases with more complex profile shapes (e.g., longshore bars), the peak in the longshore current was in several cases located in the trough seaward of the bar, whereas NMLong-CW predicted a peak that was located more seaward, also after including the roller model. However, the magnitude of the peak was typically well reproduced.
Accounting for the full interaction between the current and the waves only modified the current and mean water level distribution across shore marginally for the cases investigated here. Also, a more sophisticated formulation for the lateral mixing did not improve agreement significantly over the formulation originally included in NMLong. In most cases, employing standard values on the coefficients in the wave model together with a mixing coefficient of L = 0.5 produced satisfactory agreement, leaving cf as the only parameter to be assigned based on the bottom roughness. The cf-values obtained in the experimental cases studied indicated higher values in the laboratory as compared to the field.
In summary, applying NMLong-CW to predict the cross-shore distribution of the longshore current will yield reliable estimates if the friction coefficient is assigned a realistic value. For a beach with longshore bars, calculations might yield peaks in the current distribution that are located too far seaward. It is not likely that alternative formulations for the friction or mixing coefficient are going to remedy this discrepancy. Also modifications of the roller parameters will not produce a sufficiently large horizontal shift, as shown in trial simulations. The presence of the peak of the longshore current in the trough is most likely a function of a strong interaction between the forcing and the topography in the longshore dimension, where the current develops similarly to a river flow taking its course in the trough as guided by the profile geometry.

Chapter 7 Summary and Conclusions 71
7 Summary and Conclusions
This study enhanced the capability of NMLong to simulate the cross-shore distribution of the wave height, mean water level, and longshore current in the nearshore by taking into account the interactions between currents and waves. Also, a model of the momentum transport in the roller generated by the wave breaking was included to simulate the shoreward translation in the forcing commonly observed in measurements as a shift in the location of the longshore current and mean water level peaks. The new model is denoted NMLong-CW, where CW stands for interaction between currents and waves.
The wave action flux conservation equation was implemented to account for the interaction between currents and waves. The dispersion relation and Snell’s law were formulated to include a current of arbitrary magnitude and direction. A critical element in the wave transformation calculations is estimation of the energy dissipation produced by wave breaking, and an algorithm was implemented that is applicable to any water depth and describing both depth- and steepness-limited wave breaking. Wave blocking may occur in a situation with an opposing current, and a routine was added in NMLong-CW to check for this. The roller model by Dally and Brown (1995) was also implemented in NMLong-CW to represent the transport of momentum by wave rollers in the surf zone.
NMLong-CW was evaluated with several high-quality data sets involving measurements of wave height, mean water level, and longshore current for both monochromatic and random waves. The wave module was verified, in particular, for situations where waves propagated against a current experiencing breaking, dissipation, and blocking on a current. Agreement with measurements was good in shallow water, where NMLong-CW is expected to be applied, whereas some discrepancy was observed for deep water concerning the energy dissipation. However, even in the comparisons with measurements for deep water, the model displayed a robust behavior and predicted the shoaling phase and maximum wave height well and the location of wave blocking to an acceptable degree.
Chawla and Kirby (1998, 2002) observed in their laboratory experiments that blocking occurred at greater wave celerity than predicted by linear wave theory. To improve the agreement between model calculations and measurements, they applied the dispersion relation from third-order Stokes theory instead of from linear wave theory. In the present study, this option was explored, but the decision was made not to employ a higher-order wave theory for the dispersion relation for the following reasons:
a. To develop a theoretically consistent model, other wave quantities besides the wave speed and wavelength should be described by higher-order wave theory, which substantially complicates the model

72 Chapter 7 Summary and Conclusions
and opens up new research areas. This possibility is left for a new study.
b. NMLong-CW is expected to be applied primarily to describe shallow-water conditions, where limited water depth will typically exert more control on wave transformation than amplitude dispersion. Comparison between calculations and measurements for the CHL-I data indicated good agreement for the wave decay on an opposing current calculated with linear wave theory, although blocking did not occur in the CHL-I cases (they were designed using linear wave theory so that blocking would not take place).
c. The dispersion relation given by third-order Stokes theory is not valid in the nearshore (shallow water, where Ursell numbers exceed 25; see Isobe and Kraus (1983)) where NMLong-CW is targeted. A dedicated effort will be required to determine a suitable dispersion relation validated with high-quality data for shallow-water wave conditions.
The data sets employed to verify the longshore current simulations showed that adding the roller model significantly improved agreement between calculations and measurements. Overall, this agreement was good except for some field data sets with complicated profile shapes involving longshore bars. For these situations, the roller model failed to produce a shoreward shift in the forcing that sufficiently large to make the calculated current peak agree with the measurements
The model NMLong-CW has substantially increased capability to represent waves and nearshore circulation, or wave transformation in a long and narrow inlet, where the interactions between current and waves is expected to be significant.
.

References 73
References
Battjes, J. A. (1975). “Modeling of turbulence in the surf zone,” Symposium on Modeling Techniques, American Society of Civil Engineers (ASCE), 1,050-1,061.
Battjes, J., and Janssen, J. P. F. M. (1978). “Energy loss and setup due to breaking of random waves,” Proceedings 16th Coastal Engineering Conference, ASCE, 569-587.
Booij, N., Holthuijsen, L. H., and De Lange, P. H. M. (1992). “The penetration of short-crested waves through a gap,” Proceedings 23rd Coastal Engineering Conference, ASCE, 1,044-1,052.
Bowen, A. J., Inman, D. L., and Simmons, V. P. (1968). “Wave set-down and setup,” Journal of Geophysical Research 73(8), 2,569-2,577.
Bretherton, F. P., and Garrett, C. J. R. (1969). “Wavetrains in inhomogeneous moving media,” Proceedings Royal Society of London, A, 302, 529-554.
Briggs, M. J., and Liu, P. L.-F. (1993). “Experimental study of monochromatic wave-ebb current interaction,” Proceedings Waves ’93, ASCE, 474-488.
Briggs, M. J., Demirbilek, Z., and Green, D. R. (1996). “Wave-current interaction in inlets,” Proceedings 25th Coastal Engineering Conference, ASCE, 1,219-1,232.
Chawla, A., and Kirby, J. T. (1998). “Experimental study of wave breaking and blocking on opposing current,” Proceedings 26th Coastal Engineering Conference, ASCE, 759-772.
Chawla, A., and Kirby, J. T. (1999). “Waves on opposing currents: Data report,” Research Report No. CACR-99-03, Center for Applied Coastal Research, University of Delaware, Newark, Delaware.
Chawla, A., and Kirby, J. T. (2002). “Monochromatic and random wave breaking at blocking points,” Journal of Geophysical Research 107.
Dally, W. R. (1980). “A numerical model for beach profile evolution,” M.S. thesis, University of Delaware, Newark, DE.
Dally, W. R. (1990). “Random breaking waves: A closed-form solution for planar beaches,” Coastal Engineering 14, 233-263.
Dally, W. R. (1992). “Random breaking waves: Field verification of a wave-by-wave algorithm for engineering application,” Coastal Engineering 16, 369-397.

74 References
Dally, W. R., and Osiecki, D. A. (1994). “The role of rollers in surf zone currents,” Proceedings 24th Coastal Engineering Conference, ASCE, 1,895-1,905.
Dally, W. R., and Brown, C. A. (1995). “A modeling investigation of the breaking wave roller with application to cross-shore currents,” Journal of Geophysical Research 100(C12), 24,873-24,883.
Dally, W. R., Dean, R. G., and Dalrymple, R. A. (1985). “Wave height variation across beaches of arbitrary profile,” Journal of Geophysical Research 90(C6), 11,917-11,927.
Dean, R. G. (1977). “Equilibrium beach profiles: U.S. Atlantic and Gulf Coasts,” Department of Civil Engineering, Ocean Engineering Report No. 12, University of Delaware, Newark, DE.
Deigaard, R., Justesen, P., and Fredsoe, F. (1991). “Modeling of undertow by a one-equation turbulence model,” Coastal Engineering 15, 431-458.
Duncan, J. H. (1981). “An experimental investigation of breaking waves produced by a towed hydrofoil,” Proceedings Royal Society of London, A, 377, 331-348.
Fischer, H. B., List, E. J., Koh, R. C. Y., Imberger, J., and Brooks, N. H. (1979). “Mixing in inland and coastal waters.” Academic Press, New York, NY.
Goda, Y. (1975). “Irregular wave deformation in the surf zone,” Coastal Engineering in Japan 18, 13-26.
Hamilton, D. G., and Ebersole, B. A. (2001). “Establishing uniform longshore currents in a large-scale sediment transport facility,” Coastal Engineering 42(3) 199-218.
Holthuijsen, L. H., Booij, N., and Herbers, T. H. C. (1989). “A prediction model for stationary, short-crested waves in shallow water with ambient currents,” Coastal Engineering 13(1), 23-54.
Holthuijsen, L. H., Booij, N., and Ris, R. C. (1993). “A spectral wave model for the coastal zone,” Proceedings Ocean Wave Measurement and Analysis, ASCE, 630-641.
Horikawa, K., and Kuo, C. (1966). “A study on wave transformation inside the surf zone,” Proceedings of the 10thCoastal Engineering Conference, ASCE, 217-233.
Isobe, M., and Kraus, N. C. (1983). “Derivation of a third-order Stokes wave theory,” Hydraulics Laboratory Technical Report No. 83-1, Department of Civil Engineering, Yokohama National University, Japan, 37 pp.
Jonsson, I. G. (1978). “Energy flux and wave action in gravity waves propagating on a current,” Journal of Hydraulic Research 16(3), 223-234.
Jonsson, I. G. (1990). “Wave-current interactions,” Chapter 7, The Sea. B. Le Méhauté and D. Hanes (ed.), John Wiley and Sons, New York, 65-120.
Jonsson, I. G., Skovgaard, C., and Wang, J. D. (1970). “Interaction between waves and currents,” Proceedings 12th International Coastal Engineering Conference, ASCE, 489-507.

References 75
Jonsson, I. G., and Skovgaard, C. (1978). “Wave refraction across a shearing current,” Proceedings 16th International Coastal Engineering Conference, ASCE, 722-741.
Jonsson, I. G., and Christoffersen, J. B. (1984). “Current depth refraction of regular waves,” Proceedings 19th International Coastal Engineering Conference, ASCE, 1,103-1,117.
Kaminsky, G., and Kraus, N.C. (1994). “Evaluation of depth-limited breaking wave criteria,” Proceedings Ocean Wave Measurement and Analysis, ASCE, 180-193.
Kraus, N. C., and Larson, M. (1991). “NMLONG – Numerical model for simulating the longshore current. Report 1: Model development and tests,” Technical Report DRP-91-1, U.S. Army Engineer Waterways Experiment Station, Vicksburg, MS.
Kraus, N. C., and Sasaki, T. O. (1979). “Influence of wave angle and lateral mixing on the longshore current,” Marine Science Communications 5(2), 91-126.
Kuriyama, Y., and Ozaki, Y. (1993). “Longshore current distribution on a bar-trough beach, Field measurements at HORF and numerical model,” Report of Port and Harbour Research Institute 32(3), Ministry of Transport, Japan, 3-37.
Kuriyama, Y., and Nakatsukasa, T. (1999). “Undertow and longshore current on a bar-trough beach; Field measurements at HORS and modeling,” Report of Port and Harbour Research Institute 38(1), Ministry of Transport, Japan, 3-28.
Larson, M., and Kraus, N. C. (1991). “Numerical model of longshore current for bar and trough beaches,” Journal of Waterways, Port, Coastal, and Ocean Engineering 11(4), 326-347.
Lai, R. J., Long, S. R., and Huang, N. E. (1989). “Laboratory studies of wave-current interaction: Kinematics of the strong interaction,” Journal of Geophysical Research 94(C11), 16,201-16,214.
Miche, R. (1951). “Le pouvoir reflechissant des ouvrages maritime exposes a l’action de la houle,” Annales Ponts et Chaussees 121 285-319.
Mizuguchi, M. (1980). “An heuristic model of wave height distribution in surf zone,” Proceedings 17th Coastal Engineering Conference, ASCE, 278-289.
Nairn, R. B., Roelvink, J. A., and Southgate, H. N. (1990). “Transition zone width and implications for modeling surfzone hydrodynamics,” Proceedings 22nd Coastal Engineering Conference, ASCE, 68-81.
Nishimura, H. (1988). “Computation of nearshore current,” Nearshore dynamics and coastal processes. K. Horikawa, ed., University of Tokyo Press, Tokyo, Japan, 271-291.
Putrevu, U. and Svendsen, I. A. (1992). “A mixing mechanism in the nearshore region,” Proceedings 23rd International Coastal Engineering Conference, American Society of Civil Engineers, 2758-2771.
Raichlen, F. (1993). “Waves propagating on an adverse jet,” Proceedings Waves ’93, ASCE, 657-670.
Resio, D. T. (1987). “Shallow-water waves. I. Theory,” Journal of Waterway, Port, Coastal, and Ocean Engineering 113(3), 264-281.

76 References
_________. (1988a). “Shallow-water waves. II: Data comparisons,” Journal of Waterways, Port, Coastal, and Ocean Engineering 114(1), 50-65.
_________. (1988b). “A steady-state wave model for coastal applications,” Proceedings 21st Coastal Engineering Conference, ASCE, 929-940.
Ris, R. C., and Holthuijsen, L. H. (1996). “Spectral modelling of current induced wave blocking,” Proceedings 25th Coastal Engineering Conference, ASCE, 1,247-1,254.
Rodi, W. (1980). “Turbulence models and their application in hydraulics: A state of the art review,” Sonderforschungsbereich 80, Institute for Hydromechanics, University of Karlsruhe, Karlsruhe, Germany.
Roelvink, J. A., and Stive, M. J. F. (1989). “Bar-generating cross-shore flow mechanisms on a beach,” Journal of Geophysical Research 94(C4), 4,785-4,800.
Sakai, S., Hiyamizu, K., and Saeki, H. (1986). ”Irregular wave transformation affected by opposing currents,” Proceedings 20th Coastal Engineering Conference, American Society of Civil Engineers, 697-710.
Sawaragi, T., and Iwata, K. (1974). “On the wave generation after breaking,” Proceedings 14th Coastal Engineering Conference, ASCE, 481-497.
Seymour, R. J. (1989). “Nearshore sediment transport,” Plenum Press, New York, NY.
Smith, J. M., Larson, M., and Kraus, N. C. (1993). “Longshore current on a barred beach: Field measurements and calculation,” Journal of Geophysical Research 98(C12), 22,717-22,731.
Smith, J. M., Resio, D. T., and Vincent, C. L. (1997). “Current-induced breaking at an inlet,” Proceedings Coastal Dynamics ’97, ASCE, 93-102.
Smith, J. M., Seabergh, W. C., Harkins, G. S., and Briggs, M. J. (1998). “Wave breaking on a current at an idealized inlet; Coastal Inlets Research Program, Inlet Laboratory Investigations,” Technical Report CHL-98-31, U.S. Army Engineer Waterways Experiment Station, Vicksburg, MS.
Smith, J. M., Sherlock, A. R., and Resio, D. T. (2001). “STWAVE: Steady-state spectral wave model, users manual for STWAVE, Version 3.0,” ERDC/CHL SR-01-1, Coastal and Hydraulics Laboratory, U.S. Army Engineer Research and Development Center, Vicksburg, MS.
Smith, S. J., and Smith, J. M. (2001). “Numerical modeling of waves at Ponce de Leon Inlet, Florida, “ Journal of Waterway, Port, Coastal, and Ocean Engineering 127(3), 176-184.
Southgate, H. N. (1987). “A one-dimensional model of wave-current interaction,” Proceedings Coastal Hydrodynamics ’87, American Society of Civil Engineers, 79-92.
Southgate, H. N. (1989). “A nearshore profile model of wave and tidal current interaction,” Coastal Engineering 13, 219-245.
Svendsen, I. A. (1984). “Wave heights and set-up in the surf zone,” Coastal Engineering 8, 303-329.


15. SUBJECT TERMS
Breaking waves Longshore current Numerical model Tidal inlets Wave blocking Wave-current interaction Wave roller Wave setup Wind-generated currents