Embed Size (px)
Citation preview
BRAZILIAN JOURNAL OF OCEANOGRAPHY, 55(2):109-120, 2007
WAVE REFRACTION AND LONGSHORE TRANSPORT PATTERNS ALONG THE SOUTHERN SANTA CATARINA COAST
Eduardo Siegle1 & Nils Edvin Asp2
1Instituto Oceanográfico da Universidade de São Paulo (Praça do Oceanográfico, 191, 05508-120 São Paulo, SP, Brasil)
e-mail: [email protected]
2Universidade Federal do Pará Campus Universitário de Bragança
(Alameda Leandro Ribeiro s/n, 68600-000 Bragança, PA, Brasil) e-mail: [email protected]
A B S T R A C T Based on the wave climate for the southern Brazilian coast, wave refraction has been modelled in order to obtain the refracted wave heights and directions along the southern Santa Catarina coast, providing the needed information for potential longshore drift estimates. According to its coastline orientation, different sectors of the coast present varying longshore drift patterns. Estimates have been made for the yearly-averaged wave climate as well as for each season, showing thereby the longshore drift patterns along the year. Based on the results of the potential longshore drift intensities and directions and on the shoreline outline in plan, it has been possible to identify a strongly drift-dominated coast in the south turning to a mixed drift and swash dominated coast towards the north of the studied area. Contrasting patterns of longshore drift between the southern and northern portion of the coastline indicate a sediment surplus in the central portion, making sediment available for cross-shore transport processes, either on- or offshore. Considering long-term aspects, the longshore drift patterns are in agreement with the coastal infilling process which has mainly been driven by persistent surplus from littoral sediment drift.
R E S U M O Com base no clima de ondas para o sul da costa brasileira, a refração de ondas foi modelada para a obtenção de alturas e direção das ondas ao longo da costa sul de Santa Catarina. Essas informações permitem a estimativa da deriva litorânea potencial para a região. De acordo com a orientação da linha de costa, diferentes setores do litoral apresentam variados padrões de deriva. As estimativas foram realizadas com base nos dados médios anuais e para cada estação do ano, demonstrando assim a variabilidade dos padrões ao longo do ano. A configuração da linha de costa e os resultados das estimativas de intensidade e direção da deriva indicam o predomínio da deriva litorânea na porção sul da área e um equilíbrio entre processos de espraiamento e de deriva na porção norte. Padrões contrastantes de deriva entre a porção sul e norte da linha de costa indicam um balanço positivo de sedimentos na porção central, disponibilizando sedimentos para os processos de transporte através da costa. Considerando escalas temporais maiores, os padrões de deriva concordam com o processo de preenchimento costeiro que é controlado principalmente pelo aporte de sedimentos pela deriva litorânea. Descriptors: Wave refraction, Longshore drift, Southern Santa Catarina coast. Descritores: Refração de ondas, Deriva litorânea, Litoral sul de Santa Catarina.
INTRODUCTION The available sediment at a beach is subjected to various processes that result in the shaping of its morphology. Waves approaching the __________ Contr. no. 871 do Inst. oceanogr. da Usp.
coast and breaking on a sloping beach generate a variety of currents in the nearshore giving direction to the movement of beach sediments (Komar, 1998). One of the most effective means of moving sediments alongshore are the longshore currents. Longshore currents are generated by waves approaching the coast at an angle, reaching its highest values when this angle is around 45 degrees. The resultant longshore drift of
material is most efficient when these waves reach a straight or gently curved coastline, unbroken by headlands or inlets, and where the nearshore sea-floor profile is smooth. It increases with wave energy and is aided by small tide range, which results in more continuous and concentrated wave action (Bird, 2000). The prevailing wave regime and the generated longshore drift define what should be the equilibrium shoreline at a given coastal region (Davies, 1958). Shorelines have a tendency to be either swash-aligned or drift-aligned (Davies, 1980). Swash-aligned beaches are built parallel to incoming wave crests, and they tend to be curved with little longshore transport. Drift-aligned beaches are those on which waves break at a sharp angle, being usually longer and straighter and characterized by longshore transport (Woodroffe, 2002). Few beaches are entirely swash- or drift-dominated, they usually present both swash and drift processes, with alternating and balanced longshore drift at swash-dominant beaches, and cross-shore sequences occurring on largely drift-dominated beaches (Bird, 2000). Only a few studies to date have focused on the wave dynamics along the Santa Catarina coast (e.g. Alves, 1996; Alves & Melo, 2001), being concentrated at the northern portion of the state. Araújo et al. (2003) made a statistical description of the wave conditions of the southern Brazilian coast, being so far the most complete wave climate study for the region. These authors used a one-year waverider time series gathered in front of the Santa Catarina Island (at 80 m depth) to identify the seasonal variability of the wave regime. Therefore, the motivation of this paper is to provide background information on the wave dynamics and consequent potential longshore drift estimates for the study of sediment transport patterns along the continuous southern Santa Catarina coast. The objective of this study is to understand the wave refraction patterns along the southern Santa Catarina coast and to estimate the generated potential longshore drift. Preliminary attempts are also made to link the wave regime and its implications on the coastal Quaternary evolution of the region.
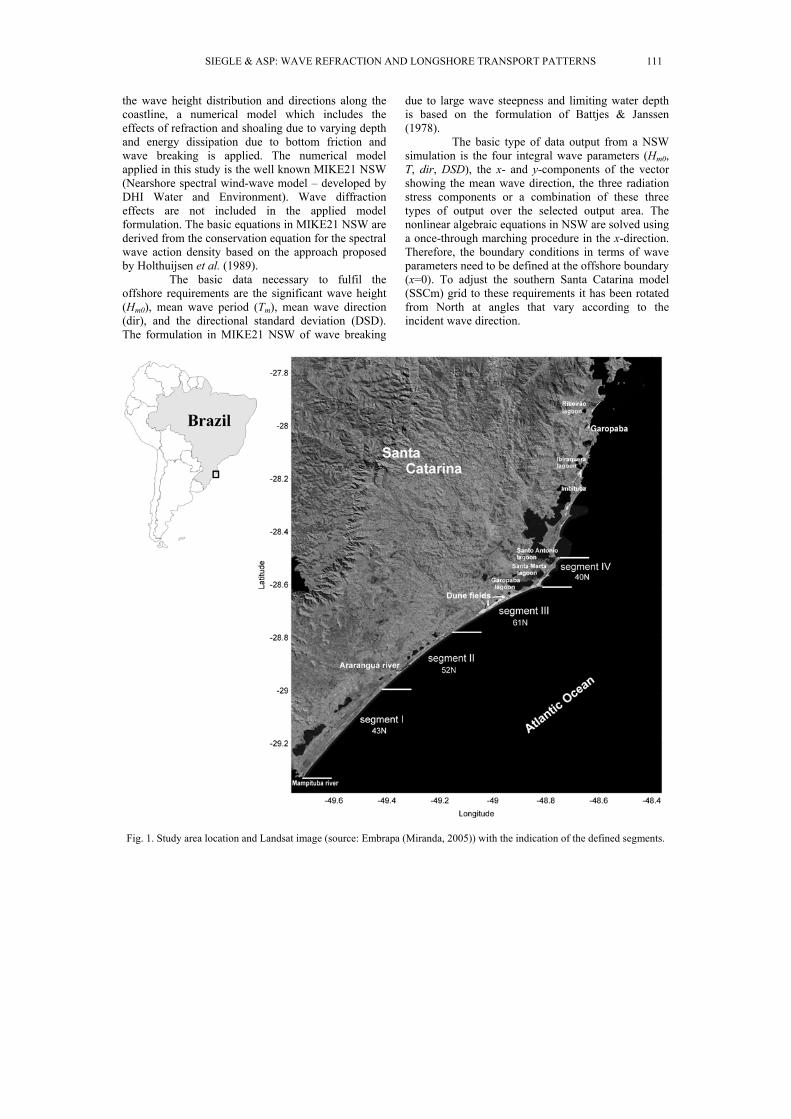
STUDY AREA The southern Santa Catarina coast presents a curved shape with orientation to the north varying between 40 to 60 degrees. The region is fronted by a continuous sandy beach limited by the jettied Mampituba River to the south and by the presence of a rocky headland to the north. The only interruptions along this 140 km long beach are the Araranguá River inlet and two other small inlets to the north (Fig. 1). The climate in the study area presents sub-tropical characteristics, being controlled by the South Atlantic Anti-cyclonic high pressure centre (Nobre et
al., 1986; Nimer, 1989). Periodically, this system is disturbed by the passage of cold fronts, originated by the migratory Polar Anticyclones, which cross the region from southwest to northeast (DHN, 1994). These frontal systems are the major atmospheric perturbations that define the southern Brazilian climate and its occurrence varies along the year, with an average of six cold fronts per month reaching South America between 35º and 25ºS (Nobre et al., 1986). Wave characteristics reflect the wind regime over the South Atlantic, with the passage of frontal systems producing winds and waves from the east and southern quadrants (Araújo et al., 2003). The wave climate for the study area is further described below based on wave data presented in Araújo et al. (2003). The astronomical tides along the southern Santa Catarina coast are mixed semi-diurnal with spring tidal range of about 0.6 m.
METHODS
Wave Data The wave climate information used as boundary conditions for the numerical model runs in this study is given in Araújo et al. (2003) from the analysis of wave rider measurements over a one-year period. These authors present a series of statistical analysis which best define the wave climate for the region. In this study we use the results from their analysis for single peaked seas, which provide the overall wave characteristics of their measurements made at 35 km off the Santa Catarina Island, at depths of about 80 m. Based on the wave data for each season given in Araújo et al. (2003), Table 1 presents a summary of the wave regime in percentage of occurrence along one year while Figure 2 shows the seasonal percentage of wave height occurrence for each offshore incidence direction. The potential longshore drift estimates were made using the wave data for each separate season and for the whole year. Thereby, it is possible to differentiate the longshore drift as a consequence of the distinct wave regime for each season and its yearly average. For the wave refraction modelling experiments, the dominant wave period for each offshore incidence direction has also been defined from data presented in Araújo et al. (2003).
Numerical Modelling Since the wave heights and directions of incidence can be modified by several factors before reaching the shoreline (Komar, 1998), the direct use of the offshore measured wave conditions would imply in an additional limitation in the estimation of the potential longshore drift. Therefore, in order to obtain
110 BRAZILIAN JOURNAL OF OCEANOGRAPHY, 55(2), 2007
the wave height distribution and directions along the coastline, a numerical model which includes the effects of refraction and shoaling due to varying depth and energy dissipation due to bottom friction and wave breaking is applied. The numerical model applied in this study is the well known MIKE21 NSW (Nearshore spectral wind-wave model – developed by DHI Water and Environment). Wave diffraction effects are not included in the applied model formulation. The basic equations in MIKE21 NSW are derived from the conservation equation for the spectral wave action density based on the approach proposed by Holthuijsen et al. (1989).
The basic data necessary to fulfil the offshore requirements are the significant wave height (Hm0), mean wave period (Tm), mean wave direction (dir), and the directional standard deviation (DSD). The formulation in MIKE21 NSW of wave breaking
due to large wave steepness and limiting water depth is based on the formulation of Battjes & Janssen (1978). The basic type of data output from a NSW simulation is the four integral wave parameters (Hm0, T, dir, DSD), the x- and y-components of the vector showing the mean wave direction, the three radiation stress components or a combination of these three types of output over the selected output area. The nonlinear algebraic equations in NSW are solved using a once-through marching procedure in the x-direction. Therefore, the boundary conditions in terms of wave parameters need to be defined at the offshore boundary (x=0). To adjust the southern Santa Catarina model (SSCm) grid to these requirements it has been rotated from North at angles that vary according to the incident wave direction.
Fig. 1. Study area location and Landsat image (source: Embrapa (Miranda, 2005)) with the indication of the defined segments.
SIEGLE & ASP: WAVE REFRACTION AND LONGSHORE TRANSPORT PATTERNS 111
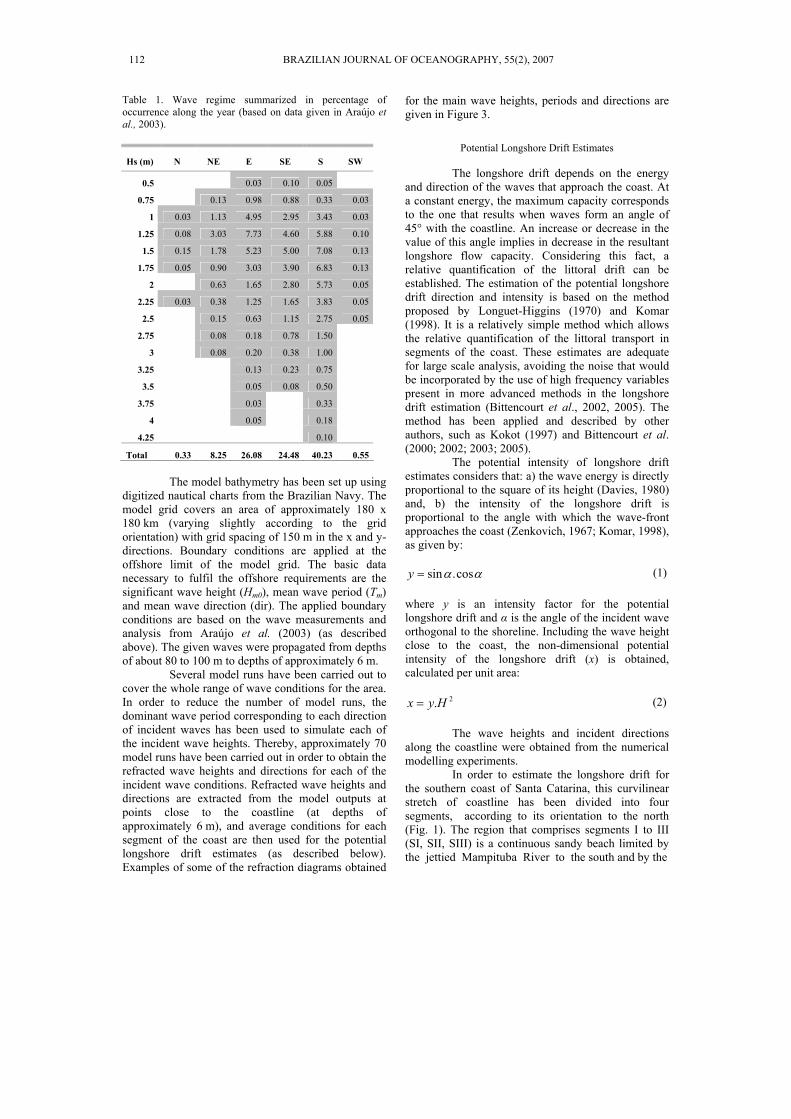
Table 1. Wave regime summarized in percentage of occurrence along the year (based on data given in Araújo et al., 2003).
Hs (m) N NE E SE S SW
0.5 0.03 0.10 0.05
0.75 0.13 0.98 0.88 0.33 0.03
1 0.03 1.13 4.95 2.95 3.43 0.03
1.25 0.08 3.03 7.73 4.60 5.88 0.10
1.5 0.15 1.78 5.23 5.00 7.08 0.13
1.75 0.05 0.90 3.03 3.90 6.83 0.13
2 0.63 1.65 2.80 5.73 0.05
2.25 0.03 0.38 1.25 1.65 3.83 0.05
2.5 0.15 0.63 1.15 2.75 0.05
2.75 0.08 0.18 0.78 1.50
3 0.08 0.20 0.38 1.00
3.25 0.13 0.23 0.75
3.5 0.05 0.08 0.50
3.75 0.03 0.33
4 0.05 0.18
4.25 0.10
Total 0.33 8.25 26.08 24.48 40.23 0.55 The model bathymetry has been set up using
digitized nautical charts from the Brazilian Navy. The model grid covers an area of approximately 180 x 180 km (varying slightly according to the grid orientation) with grid spacing of 150 m in the x and y-directions. Boundary conditions are applied at the offshore limit of the model grid. The basic data necessary to fulfil the offshore requirements are the significant wave height (Hm0), mean wave period (Tm) and mean wave direction (dir). The applied boundary conditions are based on the wave measurements and analysis from Araújo et al. (2003) (as described above). The given waves were propagated from depths of about 80 to 100 m to depths of approximately 6 m. Several model runs have been carried out to cover the whole range of wave conditions for the area. In order to reduce the number of model runs, the dominant wave period corresponding to each direction of incident waves has been used to simulate each of the incident wave heights. Thereby, approximately 70 model runs have been carried out in order to obtain the refracted wave heights and directions for each of the incident wave conditions. Refracted wave heights and directions are extracted from the model outputs at points close to the coastline (at depths of approximately 6 m), and average conditions for each segment of the coast are then used for the potential longshore drift estimates (as described below). Examples of some of the refraction diagrams obtained
for the main wave heights, periods and directions are given in Figure 3.
Potential Longshore Drift Estimates
The longshore drift depends on the energy and direction of the waves that approach the coast. At a constant energy, the maximum capacity corresponds to the one that results when waves form an angle of 45° with the coastline. An increase or decrease in the value of this angle implies in decrease in the resultant longshore flow capacity. Considering this fact, a relative quantification of the littoral drift can be established. The estimation of the potential longshore drift direction and intensity is based on the method proposed by Longuet-Higgins (1970) and Komar (1998). It is a relatively simple method which allows the relative quantification of the littoral transport in segments of the coast. These estimates are adequate for large scale analysis, avoiding the noise that would be incorporated by the use of high frequency variables present in more advanced methods in the longshore drift estimation (Bittencourt et al., 2002, 2005). The method has been applied and described by other authors, such as Kokot (1997) and Bittencourt et al. (2000; 2002; 2003; 2005). The potential intensity of longshore drift estimates considers that: a) the wave energy is directly proportional to the square of its height (Davies, 1980) and, b) the intensity of the longshore drift is proportional to the angle with which the wave-front approaches the coast (Zenkovich, 1967; Komar, 1998), as given by:
αα cos.sin=y (1) where y is an intensity factor for the potential longshore drift and α is the angle of the incident wave orthogonal to the shoreline. Including the wave height close to the coast, the non-dimensional potential intensity of the longshore drift (x) is obtained, calculated per unit area:
2.Hyx = (2) The wave heights and incident directions along the coastline were obtained from the numerical modelling experiments. In order to estimate the longshore drift for the southern coast of Santa Catarina, this curvilinear stretch of coastline has been divided into four segments, according to its orientation to the north (Fig. 1). The region that comprises segments I to III (SI, SII, SIII) is a continuous sandy beach limited by the jettied Mampituba River to the south and by the
112 BRAZILIAN JOURNAL OF OCEANOGRAPHY, 55(2), 2007
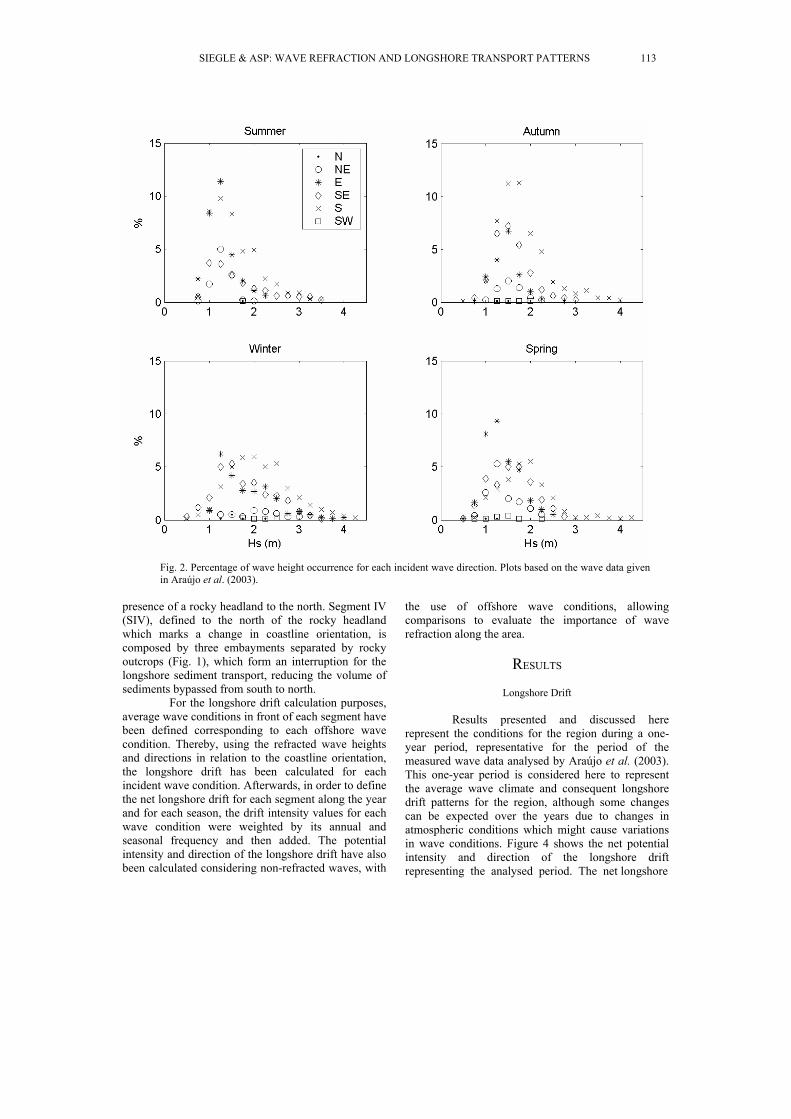
Fig. 2. Percentage of wave height occurrence for each incident wave direction. Plots based on the wave data given in Araújo et al. (2003).
presence of a rocky headland to the north. Segment IV (SIV), defined to the north of the rocky headland which marks a change in coastline orientation, is composed by three embayments separated by rocky outcrops (Fig. 1), which form an interruption for the longshore sediment transport, reducing the volume of sediments bypassed from south to north. For the longshore drift calculation purposes, average wave conditions in front of each segment have been defined corresponding to each offshore wave condition. Thereby, using the refracted wave heights and directions in relation to the coastline orientation, the longshore drift has been calculated for each incident wave condition. Afterwards, in order to define the net longshore drift for each segment along the year and for each season, the drift intensity values for each wave condition were weighted by its annual and seasonal frequency and then added. The potential intensity and direction of the longshore drift have also been calculated considering non-refracted waves, with
the use of offshore wave conditions, allowing comparisons to evaluate the importance of wave refraction along the area.
RESULTS
Longshore Drift
Results presented and discussed here represent the conditions for the region during a one-year period, representative for the period of the measured wave data analysed by Araújo et al. (2003). This one-year period is considered here to represent the average wave climate and consequent longshore drift patterns for the region, although some changes can be expected over the years due to changes in atmospheric conditions which might cause variations in wave conditions. Figure 4 shows the net potential intensity and direction of the longshore drift representing the analysed period. The net longshore
SIEGLE & ASP: WAVE REFRACTION AND LONGSHORE TRANSPORT PATTERNS 113
a. b.
c. d.
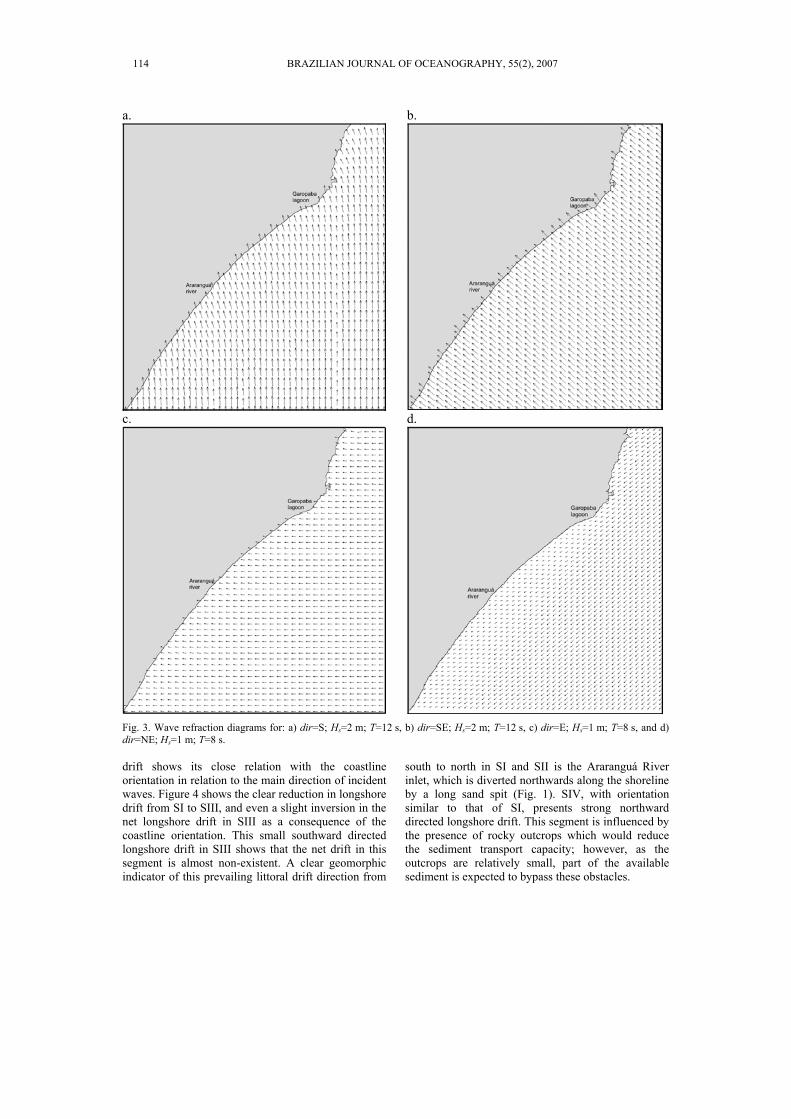
Fig. 3. Wave refraction diagrams for: a) dir=S; Hs=2 m; T=12 s, b) dir=SE; Hs=2 m; T=12 s, c) dir=E; Hs=1 m; T=8 s, and d) dir=NE; Hs=1 m; T=8 s. drift shows its close relation with the coastline orientation in relation to the main direction of incident waves. Figure 4 shows the clear reduction in longshore drift from SI to SIII, and even a slight inversion in the net longshore drift in SIII as a consequence of the coastline orientation. This small southward directed longshore drift in SIII shows that the net drift in this segment is almost non-existent. A clear geomorphic indicator of this prevailing littoral drift direction from
south to north in SI and SII is the Araranguá River inlet, which is diverted northwards along the shoreline by a long sand spit (Fig. 1). SIV, with orientation similar to that of SI, presents strong northward directed longshore drift. This segment is influenced by the presence of rocky outcrops which would reduce the sediment transport capacity; however, as the outcrops are relatively small, part of the available sediment is expected to bypass these obstacles.
114 BRAZILIAN JOURNAL OF OCEANOGRAPHY, 55(2), 2007
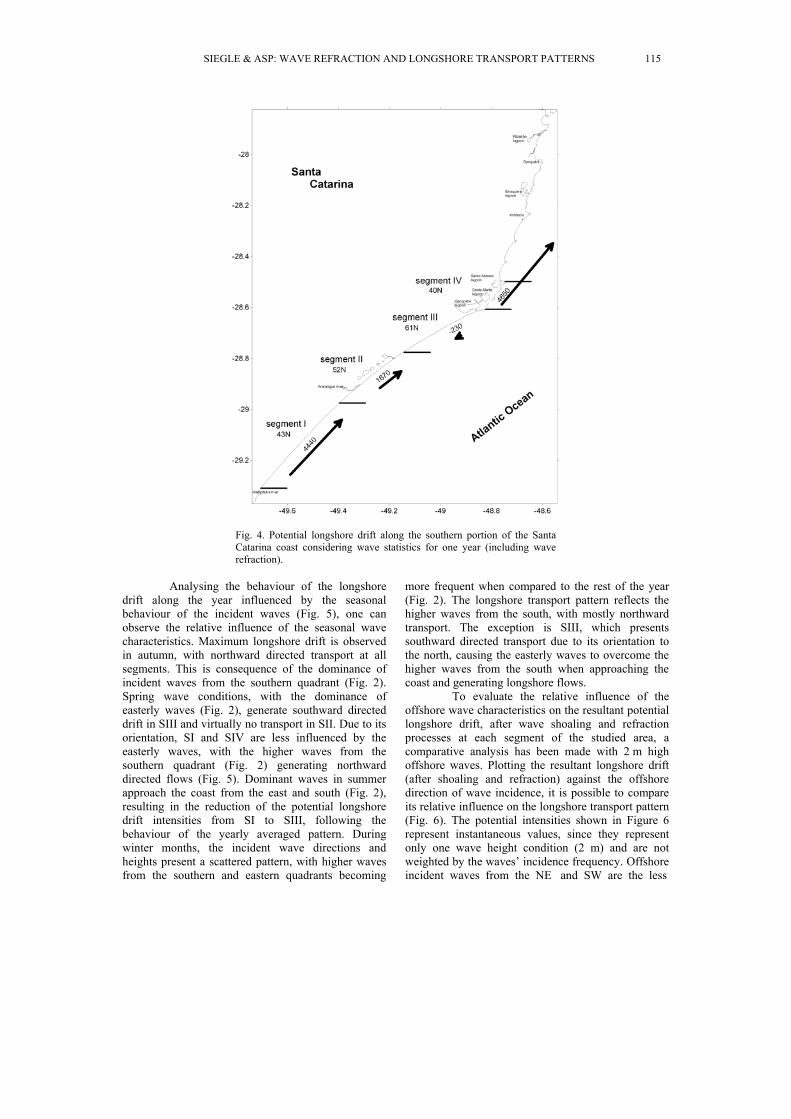
Fig. 4. Potential longshore drift along the southern portion of the Santa Catarina coast considering wave statistics for one year (including wave refraction).
Analysing the behaviour of the longshore
drift along the year influenced by the seasonal behaviour of the incident waves (Fig. 5), one can observe the relative influence of the seasonal wave characteristics. Maximum longshore drift is observed in autumn, with northward directed transport at all segments. This is consequence of the dominance of incident waves from the southern quadrant (Fig. 2). Spring wave conditions, with the dominance of easterly waves (Fig. 2), generate southward directed drift in SIII and virtually no transport in SII. Due to its orientation, SI and SIV are less influenced by the easterly waves, with the higher waves from the southern quadrant (Fig. 2) generating northward directed flows (Fig. 5). Dominant waves in summer approach the coast from the east and south (Fig. 2), resulting in the reduction of the potential longshore drift intensities from SI to SIII, following the behaviour of the yearly averaged pattern. During winter months, the incident wave directions and heights present a scattered pattern, with higher waves from the southern and eastern quadrants becoming
more frequent when compared to the rest of the year (Fig. 2). The longshore transport pattern reflects the higher waves from the south, with mostly northward transport. The exception is SIII, which presents southward directed transport due to its orientation to the north, causing the easterly waves to overcome the higher waves from the south when approaching the coast and generating longshore flows.
To evaluate the relative influence of the offshore wave characteristics on the resultant potential longshore drift, after wave shoaling and refraction processes at each segment of the studied area, a comparative analysis has been made with 2 m high offshore waves. Plotting the resultant longshore drift (after shoaling and refraction) against the offshore direction of wave incidence, it is possible to compare its relative influence on the longshore transport pattern (Fig. 6). The potential intensities shown in Figure 6 represent instantaneous values, since they represent only one wave height condition (2 m) and are not weighted by the waves’ incidence frequency. Offshore incident waves from the NE and SW are the less
SIEGLE & ASP: WAVE REFRACTION AND LONGSHORE TRANSPORT PATTERNS 115
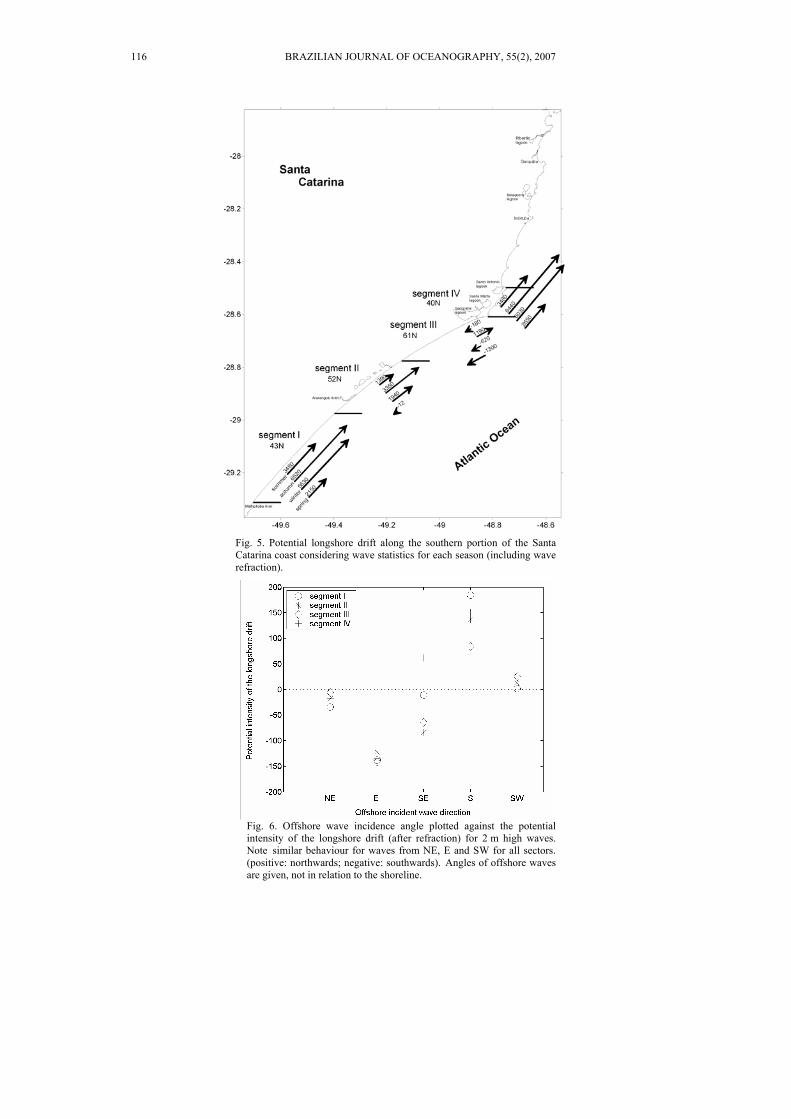
Fig. 5. Potential longshore drift along the southern portion of the Santa Catarina coast considering wave statistics for each season (including wave refraction).
Fig. 6. Offshore wave incidence angle plotted against the potential intensity of the longshore drift (after refraction) for 2 m high waves. Note similar behaviour for waves from NE, E and SW for all sectors. (positive: northwards; negative: southwards). Angles of offshore waves are given, not in relation to the shoreline.
116 BRAZILIAN JOURNAL OF OCEANOGRAPHY, 55(2), 2007
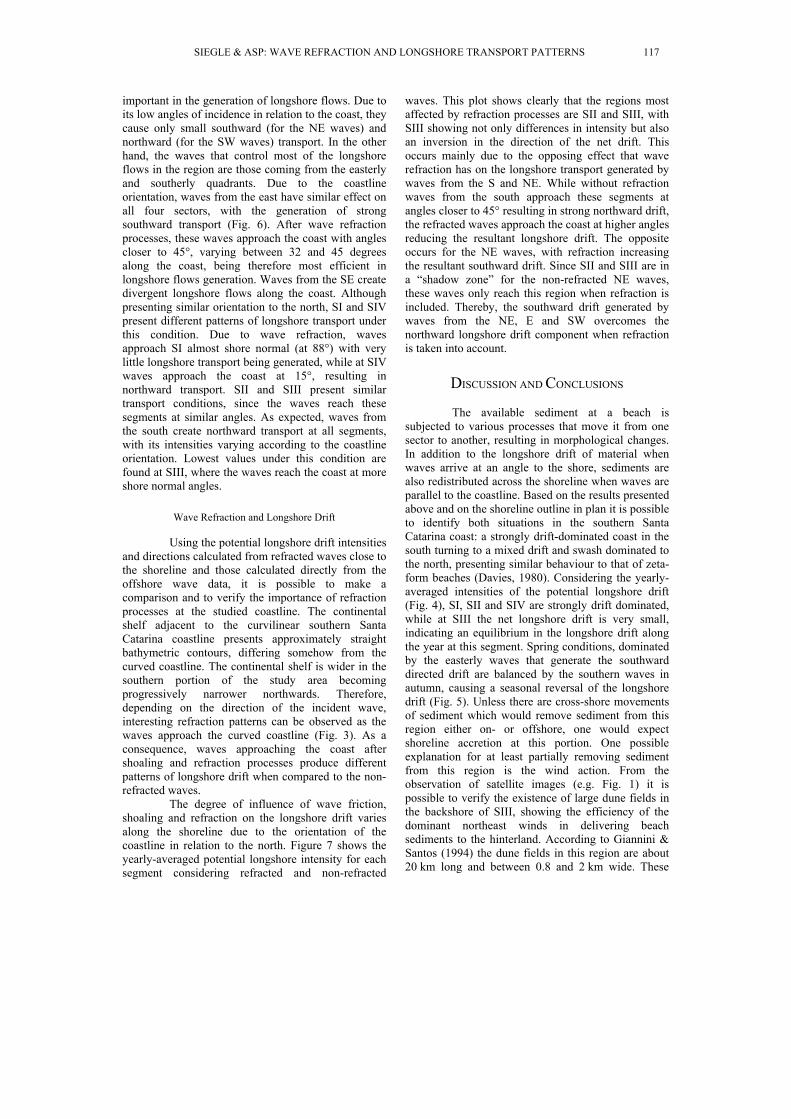
important in the generation of longshore flows. Due to its low angles of incidence in relation to the coast, they cause only small southward (for the NE waves) and northward (for the SW waves) transport. In the other hand, the waves that control most of the longshore flows in the region are those coming from the easterly and southerly quadrants. Due to the coastline orientation, waves from the east have similar effect on all four sectors, with the generation of strong southward transport (Fig. 6). After wave refraction processes, these waves approach the coast with angles closer to 45°, varying between 32 and 45 degrees along the coast, being therefore most efficient in longshore flows generation. Waves from the SE create divergent longshore flows along the coast. Although presenting similar orientation to the north, SI and SIV present different patterns of longshore transport under this condition. Due to wave refraction, waves approach SI almost shore normal (at 88°) with very little longshore transport being generated, while at SIV waves approach the coast at 15°, resulting in northward transport. SII and SIII present similar transport conditions, since the waves reach these segments at similar angles. As expected, waves from the south create northward transport at all segments, with its intensities varying according to the coastline orientation. Lowest values under this condition are found at SIII, where the waves reach the coast at more shore normal angles.
Wave Refraction and Longshore Drift
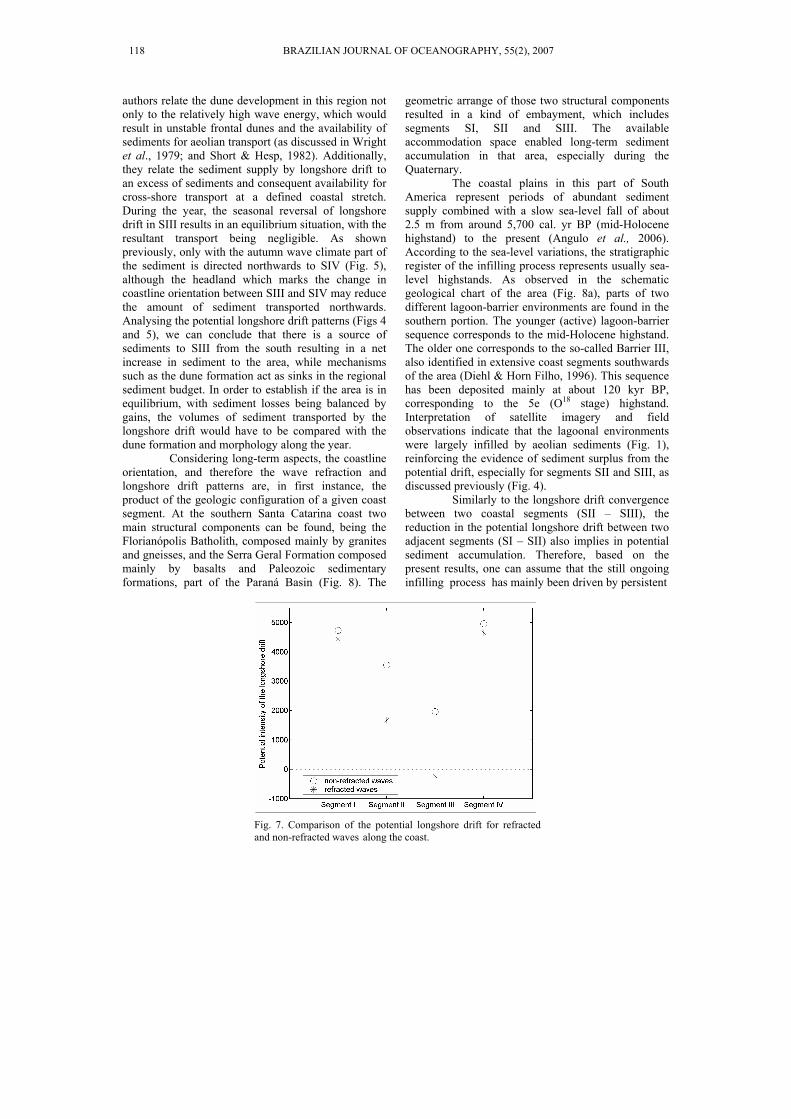
Using the potential longshore drift intensities and directions calculated from refracted waves close to the shoreline and those calculated directly from the offshore wave data, it is possible to make a comparison and to verify the importance of refraction processes at the studied coastline. The continental shelf adjacent to the curvilinear southern Santa Catarina coastline presents approximately straight bathymetric contours, differing somehow from the curved coastline. The continental shelf is wider in the southern portion of the study area becoming progressively narrower northwards. Therefore, depending on the direction of the incident wave, interesting refraction patterns can be observed as the waves approach the curved coastline (Fig. 3). As a consequence, waves approaching the coast after shoaling and refraction processes produce different patterns of longshore drift when compared to the non-refracted waves. The degree of influence of wave friction, shoaling and refraction on the longshore drift varies along the shoreline due to the orientation of the coastline in relation to the north. Figure 7 shows the yearly-averaged potential longshore intensity for each segment considering refracted and non-refracted
waves. This plot shows clearly that the regions most affected by refraction processes are SII and SIII, with SIII showing not only differences in intensity but also an inversion in the direction of the net drift. This occurs mainly due to the opposing effect that wave refraction has on the longshore transport generated by waves from the S and NE. While without refraction waves from the south approach these segments at angles closer to 45° resulting in strong northward drift, the refracted waves approach the coast at higher angles reducing the resultant longshore drift. The opposite occurs for the NE waves, with refraction increasing the resultant southward drift. Since SII and SIII are in a “shadow zone” for the non-refracted NE waves, these waves only reach this region when refraction is included. Thereby, the southward drift generated by waves from the NE, E and SW overcomes the northward longshore drift component when refraction is taken into account.
DISCUSSION AND CONCLUSIONS
The available sediment at a beach is subjected to various processes that move it from one sector to another, resulting in morphological changes. In addition to the longshore drift of material when waves arrive at an angle to the shore, sediments are also redistributed across the shoreline when waves are parallel to the coastline. Based on the results presented above and on the shoreline outline in plan it is possible to identify both situations in the southern Santa Catarina coast: a strongly drift-dominated coast in the south turning to a mixed drift and swash dominated to the north, presenting similar behaviour to that of zeta-form beaches (Davies, 1980). Considering the yearly-averaged intensities of the potential longshore drift (Fig. 4), SI, SII and SIV are strongly drift dominated, while at SIII the net longshore drift is very small, indicating an equilibrium in the longshore drift along the year at this segment. Spring conditions, dominated by the easterly waves that generate the southward directed drift are balanced by the southern waves in autumn, causing a seasonal reversal of the longshore drift (Fig. 5). Unless there are cross-shore movements of sediment which would remove sediment from this region either on- or offshore, one would expect shoreline accretion at this portion. One possible explanation for at least partially removing sediment from this region is the wind action. From the observation of satellite images (e.g. Fig. 1) it is possible to verify the existence of large dune fields in the backshore of SIII, showing the efficiency of the dominant northeast winds in delivering beach sediments to the hinterland. According to Giannini & Santos (1994) the dune fields in this region are about 20 km long and between 0.8 and 2 km wide. These
SIEGLE & ASP: WAVE REFRACTION AND LONGSHORE TRANSPORT PATTERNS 117
authors relate the dune development in this region not only to the relatively high wave energy, which would result in unstable frontal dunes and the availability of sediments for aeolian transport (as discussed in Wright et al., 1979; and Short & Hesp, 1982). Additionally, they relate the sediment supply by longshore drift to an excess of sediments and consequent availability for cross-shore transport at a defined coastal stretch. During the year, the seasonal reversal of longshore drift in SIII results in an equilibrium situation, with the resultant transport being negligible. As shown previously, only with the autumn wave climate part of the sediment is directed northwards to SIV (Fig. 5), although the headland which marks the change in coastline orientation between SIII and SIV may reduce the amount of sediment transported northwards. Analysing the potential longshore drift patterns (Figs 4 and 5), we can conclude that there is a source of sediments to SIII from the south resulting in a net increase in sediment to the area, while mechanisms such as the dune formation act as sinks in the regional sediment budget. In order to establish if the area is in equilibrium, with sediment losses being balanced by gains, the volumes of sediment transported by the longshore drift would have to be compared with the dune formation and morphology along the year.
Considering long-term aspects, the coastline orientation, and therefore the wave refraction and longshore drift patterns are, in first instance, the product of the geologic configuration of a given coast segment. At the southern Santa Catarina coast two main structural components can be found, being the Florianópolis Batholith, composed mainly by granites and gneisses, and the Serra Geral Formation composed mainly by basalts and Paleozoic sedimentary formations, part of the Paraná Basin (Fig. 8). The
geometric arrange of those two structural components resulted in a kind of embayment, which includes segments SI, SII and SIII. The available accommodation space enabled long-term sediment accumulation in that area, especially during the Quaternary. The coastal plains in this part of South America represent periods of abundant sediment supply combined with a slow sea-level fall of about 2.5 m from around 5,700 cal. yr BP (mid-Holocene highstand) to the present (Angulo et al., 2006). According to the sea-level variations, the stratigraphic register of the infilling process represents usually sea-level highstands. As observed in the schematic geological chart of the area (Fig. 8a), parts of two different lagoon-barrier environments are found in the southern portion. The younger (active) lagoon-barrier sequence corresponds to the mid-Holocene highstand. The older one corresponds to the so-called Barrier III, also identified in extensive coast segments southwards of the area (Diehl & Horn Filho, 1996). This sequence has been deposited mainly at about 120 kyr BP, corresponding to the 5e (O18 stage) highstand. Interpretation of satellite imagery and field observations indicate that the lagoonal environments were largely infilled by aeolian sediments (Fig. 1), reinforcing the evidence of sediment surplus from the potential drift, especially for segments SII and SIII, as discussed previously (Fig. 4).
Similarly to the longshore drift convergence between two coastal segments (SII – SIII), the reduction in the potential longshore drift between two adjacent segments (SI – SII) also implies in potential sediment accumulation. Therefore, based on the present results, one can assume that the still ongoing infilling process has mainly been driven by persistent
Fig. 7. Comparison of the potential longshore drift for refracted and non-refracted waves along the coast.
118 BRAZILIAN JOURNAL OF OCEANOGRAPHY, 55(2), 2007
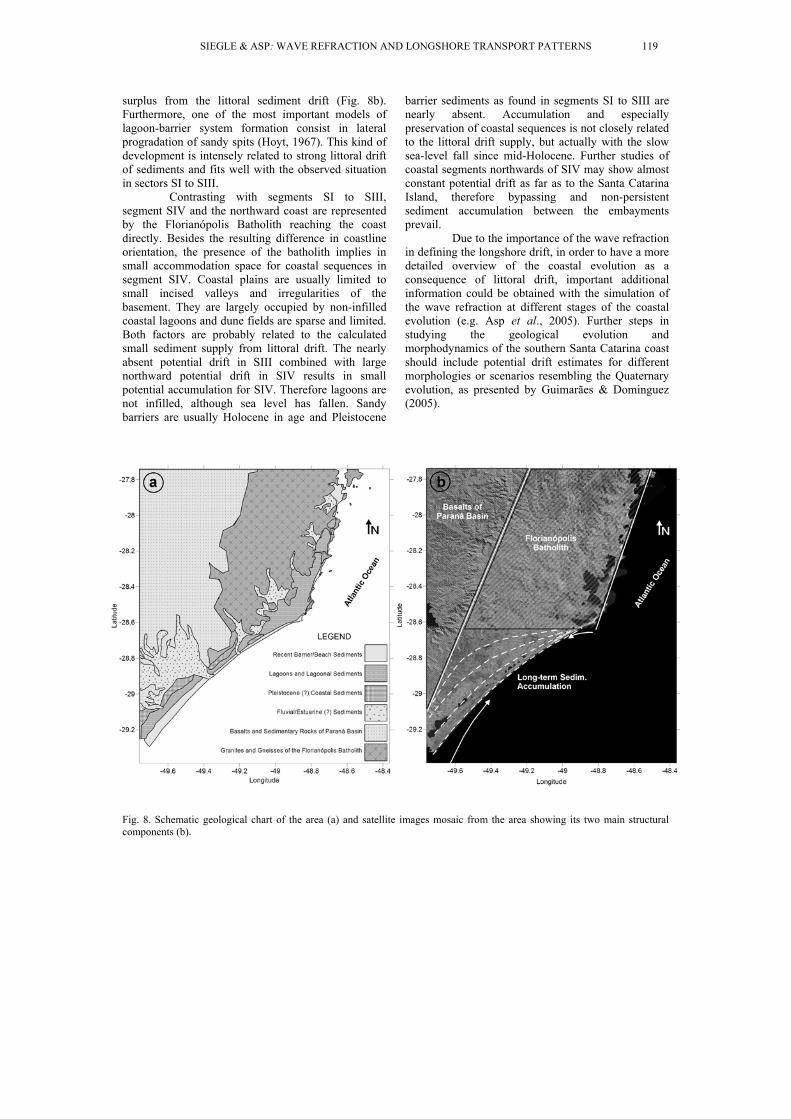
surplus from the littoral sediment drift (Fig. 8b). Furthermore, one of the most important models of lagoon-barrier system formation consist in lateral progradation of sandy spits (Hoyt, 1967). This kind of development is intensely related to strong littoral drift of sediments and fits well with the observed situation in sectors SI to SIII.
Contrasting with segments SI to SIII, segment SIV and the northward coast are represented by the Florianópolis Batholith reaching the coast directly. Besides the resulting difference in coastline orientation, the presence of the batholith implies in small accommodation space for coastal sequences in segment SIV. Coastal plains are usually limited to small incised valleys and irregularities of the basement. They are largely occupied by non-infilled coastal lagoons and dune fields are sparse and limited. Both factors are probably related to the calculated small sediment supply from littoral drift. The nearly absent potential drift in SIII combined with large northward potential drift in SIV results in small potential accumulation for SIV. Therefore lagoons are not infilled, although sea level has fallen. Sandy barriers are usually Holocene in age and Pleistocene
barrier sediments as found in segments SI to SIII are nearly absent. Accumulation and especially preservation of coastal sequences is not closely related to the littoral drift supply, but actually with the slow sea-level fall since mid-Holocene. Further studies of coastal segments northwards of SIV may show almost constant potential drift as far as to the Santa Catarina Island, therefore bypassing and non-persistent sediment accumulation between the embayments prevail. Due to the importance of the wave refraction in defining the longshore drift, in order to have a more detailed overview of the coastal evolution as a consequence of littoral drift, important additional information could be obtained with the simulation of the wave refraction at different stages of the coastal evolution (e.g. Asp et al., 2005). Further steps in studying the geological evolution and morphodynamics of the southern Santa Catarina coast should include potential drift estimates for different morphologies or scenarios resembling the Quaternary evolution, as presented by Guimarães & Dominguez (2005).
Fig. 8. Schematic geological chart of the area (a) and satellite images mosaic from the area showing its two main structural components (b).
SIEGLE & ASP: WAVE REFRACTION AND LONGSHORE TRANSPORT PATTERNS 119
ACKNOWLEDGEMENTS The authors would like to thank the Brazilian Ministry of Environment (Ministério do Meio Ambiente) and its National Coastal Zone Management Program (GERCO) for providing the licence for the use of the applied numerical model (MIKE21 NSW). E. S. is sponsored by a CNPq fellowship (308303/2006-7).
REFERENCES Alves, J. H. G. M. & Melo, E. 2001. Wind waves at the
northern coast of Santa Catarina. Revta Bras. Oceanogr., 49(1/2):13-28.
Angulo, R. J.; Lessa, G. C. & Souza, M. C. 2006. A Critical review of Mid- to Late Holocene sea-level fluctuations on the eastern Brazilian coastline. Quat. Sci. Revs, 25:486-506.
Araújo, C. E. S.; Franco, D.; Melo, E. & Pimenta, F. 2003. Wave regime characteristics of the southern Brazilian coast. International Conference on Coastal and Port Engineering in Developing Countries, COPEDEC VI, Colombo, Sri Lanka. Proceedings. Paper 97. CD-ROM.
Asp, N. E.; Buynevich, I. V.; Siegle, E.; FitzGerald, D.; Klein, A. H. F.; Cleary, W. & Angulo, RJ. 2005. Coastal geomorphology of the Tijucas Plain – Brazil: a preliminary evolutionary model. Anais do X Congresso da ABEQUA, X. Guarapari/ES – Brasil. Anais. Paper 89, 6 p. CD-ROM.
Battjes, J. A. & Janssen, J. P. F. M. 1978. Energy loss and set-up due to breaking of random waves. International Conference on Coastal Engineering, 16. Hamburg, Germany. Proceedings. p. 569-587.
Bird, E. 2000. Coastal Geomorphology: an introduction. New York: Wiley. 322 p.
Bittencourt, A. C. S. P.; Dominguez, J. M. L.; Martin, L. & Silva, I. R. 2000. Patterns of sediment dispersion coastwise of the State of Bahia – Brazil. An. Acad. Bras. Cienc. 72:271-287.
Bittencourt, A. C. S. P.; Martin, L.; Dominguez, J. M. L.; Silva, I. R.; & Sousa, D. L. 2002. A significant longshore transport divergence zone at the northeastern brazilian coast: implications on coastal quaternary evolution. An. Acad. Bras. Cienc. 74:505-518.
Bittencourt, A. C. S. P.; Dominguez, J. M. L.; Martin, L. & Silva, I. R. 2003. Uma aproximação de primeira ordem entre o clima de ondas e a localização, de longa duração, de regiões de acumulação flúvio-marinha e de erosão na costa norte do Brasil. Rev. Bras. Geocienc., 33:159-166.
Bittencourt, A. C. S. P.; Dominguez, J. M. L.; Martin, L. & Silva, I. R. 2005. Longshore transport on the northeastern Brazilian coast and implications to the location of large scale accumulative and erosive zones: an overview. Mar. Geol., 219:219-234.
Davies, J. L. 1958. Wave refraction and the evolution of shoreline curves. Geogr. Stud., 5:1-14.
Davies, J. L. 1980. Geographical variation in coastal development. 2. ed. London: Longman, 212 p.
DHN – Diretoria de Hidrografia e Navegação 1994. Roteiro Costa Sul: do Cabo Frio ao Arroio Chuí, Lagoas. 12 ed. Rio de Janeiro. 282 p.
Diehl, F. L. & Horn Filho, N. O. 1996. Compartimentação Geológico-Geomorfológica da zona litorânea e planície costeira do Estado de Santa Catarina. Notas Técn., 9:39-50.
Giannini, P. C. F. & Santos, E. R. 1994. Padrões de variação espacial e temporal na morfologia de dunas da orla costeira no centro-sul catarinense. Bolm paran. Geocienc., 42:73-95.
Guimarães, J. K. & Dominguez, J. M. L. 2005. Relação morfodinâmica entre orientação da linha de costa e deriva litorânea na evolução do delta do rio São Francisco. Anais do X Congresso da ABEQUA, X. Guarapari/ES. Anais. Paper 169. 6 p. CD-ROM,
Holthuijsen, L. H.; Booij, N. & Herbers, T. H. C. 1989. A prediction model for stationary, short-crested waves in shallow water with ambient current. Coast. Eng., 13:23-54.
Hoyt, J. H. 1967. Barrier Island Formation. Geol. Soc. Am. Bull., 78: 1125-1136.
Kokot, R. R. 1997. Littoral drift, evolution and management in Punta Médanos, Argentina. J. Coast. Res., 13:92-197.
Komar, P. D. 1998. Beach processes and sedimentation. 2. ed..Upper Saddle River, N.J.: Prentice Hall. 544 p.
Longuet-Higgins, M. S. 1970. Longshore currents generated by obliquely incident sea waves. J. Geophys. Res., 75(33):6778-6789.
Miranda, E. E. de, coord. Brasil em Relevo. Campinas: Embrapa Monitoramento por Satélite, 2005. Available at: http://www.relevobr.cnpm.embrapa.br. Access: Jan. 27, 2006.
Nimer, E. 1989. Climatologia do Brasil. Recursos naturais e meio ambiente 4. Rio de Janeiro: I.B.G.E. 421 p.
Nobre, C. A.; Cavalcanti, M. A. G.; Nobre, P.; Kayano, M. T.; Rao, V. B.; Bonatti, J. P.; Satyamurti, P.; Uvo, C. B. & Cohen, J. C. 1986. Aspectos da climatologia dinâmica do Brasil. Climanálise. Num. Esp., 124 p.
Short, A. D. & Hesp, P. A. 1982. Wave, beach and dune interactions in South-eastern Austrália. Mar. Geol. 48(4):259-284.
Woodroffe, C. D. 2002. Coasts: form, process and evolution. Cambridge: Cambridge University Press. 623 p.
Wright, L. D.; Chappel, J.; Thom, B.; Bradshaw, M. & Cowell, P. 1979. Morphodynamics of reflective and dissipative beach and inshore systems: South Austrália. Mar. Geol., 32(1):105-140.
Zenkovich, V. P. 1967. Processes of coastal development. Edinburgh: Oliver & Boyd, 738p.
Sources of Unpublhished Material
Alves, J. H. G. M. 1996. Refração do espectro de ondas
oceânicas em águas rasas: aplicações à região costeira de São Francisco do Sul, SC. Dissertação de Mestrado. Curso de pós-graduação em Engenharia Ambiental. Universidade Federal de Santa Catarina. 89 p.
(Manuscript received 25 May 2006; revised 04 January 2007; accepted 23 February 2007)
120 BRAZILIAN JOURNAL OF OCEANOGRAPHY, 55(2), 2007