Embed Size (px)
Citation preview

The Department of Ecology is an equal opportunity agency and does not discriminate on the basis of race, creed, color, disability,age, religion, national origin, sex, marital status, disabled veteran's status, Vietnam Era veteran's status, or sexual orientation.
If you have special accommodation needs or require this document in an alternative format, please call Donna Lynch at (360) 407-7529. The TDD number is (306) 407-6006. E-mail may be sent to [email protected]
Nitrogen Use by Crops and the Fate of Nitrogen inthe Soil and Vadose Zone
A Literature Search
Authors in alphabetic order:
Ronald Hermanson
William Pan
Cathy Perillo
Robert Stevens
Claudio Stockle
Washington State University
The authors appreciate the contributions of Jennifer Brunty, Kim Labno, and JoseMaría Peralta
Washington State University and Washington Department of Ecology
Interagency Agreement No. C9600177Publication No. 00-10-015

Table of ContentExecutive Summary ES-1
1. Objectives and methodology 1-1
2. Introduction 2-1
2.1. Soil water balance 2-42.1.1. Precipitation 2-42.1.2. Irrigation 2-42.1.3. Evapotranspiration 2-42.1.4. Runoff 2-52.1.5. Leaching or deep percolation 2-5
2.2. Soil N balance and the N cycle 2-5
3. Nitrogen uptake by crops 3-1
3.1. Crop Uptake3.1.1. Overview of the relationships among N uptake efficiencies 3-1
and crop N requirements3.1.2. Fertilizer Guide Development and Usage 3-6
3.2. Crop N accumulation 3-93.2.1. Grain crops3.2.2. Legume crops 3-353.2.3. Specialty crops 3-473.2.4. Turfgrass and forage crops 3-623.2.5. Cover crops 3-77
4. Land application methods and criteria for organic waste and 4-1processed water recommended to prevent leaching
4.1. Organic waste and processed water treatment 4-24.2. Land application systems 4-4
4.2.1. Municipal wastewater effluent 4-74.2.2. Food processing waste 4-8
4.3. Criteria for determining land application rates 4-12
5. Fate of N when applied at recommended agronomic rates or when 5-1applied during the non-growing season

5.1. N losses during the growing season 5-45.1.1. Gaseous emissions 5-45.1.2. Leaching losses 5-12
5.2. N losses during the non-growing season 5-175.2.1. Gaseous emissions 5-185.2.2. Leaching losses 5-18
5.3. The role of mineralization on N leaching 5-235.4. The role of cropping systems and tillage methods on N leaching 5-245.5. Optimum crop yield and N leaching 5-26
6. Fate of N when applied at rates larger than recommended agronomic 6-1rates or when applied during the non-growing season
6.1. N losses during the growing season 6-36.1.1. Gaseous emissions 6-36.1.2. Leaching losses 6-3
6.2. N losses during the non-growing season 6-86.2.1. Gaseous emissions 6-86.2.2. Leaching losses 6-9
6.3. The role of soil nitrate accumulation and soil storage capacity 6-10on N leaching
7. Potential to affect groundwater when N is applied at recommended 7-1agronomic rates
8. Potential to affect groundwater when N is applied at rates larger than 8-1recommended agronomic rates
8.1. The role of denitrification 8-3
9. Research recommended to customize current knowledge on nitrogen 9-1fate to conditions in the state of Washington
List of references

ES-1
Executive Summary
The Washington State Department of Ecology (DOE) and Washington State University(WSU) signed an agreement to generate a report describing the results of a literature review onthe fate of residual nitrogen (N) in the soil and vadose zone. The main purpose of this reviewwas to provide background information regarding nitrogen use by crops as well as theinteractions between the soil water and nitrogen balances and crop water and N use. Thisinformation is to be applied primarily to management systems involving land application ofprocessed water (municipal, food processing plants, livestock liquid manure), although theinformation should also be relevant to other issues of nitrogen management and nitrate leaching.
The focus of the report was to identify principles and not to provide quantitative guidelinesfor regulating land treatment systems (LTS) in the state. A large body of literature from outsideof Washington State is relevant given the diversity of conditions in the state. However, directapplication of this information to a specific LTS site, soil, weather, and crop for regulatorypurposes is not possible nor is the purpose of this report to provide such specific information.Nevertheless, the general principles presented in this report plus a judicious and technicallysound analysis for conditions in the state should allow regulators and managers to establish areasonable first approach to the problem. Careful monitoring of crop nitrogen removal, soilnitrate accumulation, and leaching for several years should lead to an excellent database to refinethe approach. Targeted field research focusing on management questions, complemented withcomputer simulations, would provide the specific information required for further progress.
Soil N content is the result of dynamic processes including several components.Fertilization and land application of organic wastes should provide N to supply crop demandwhile properly accounting for existing residual (inorganic) soil N, mineralization of organic N inthe soil, as well as other possible sources such as N present in irrigation water. Crop Nrequirements and their temporal and spatial variation are reviewed in this report. Matchingfertilization and/or organic waste application to these requirements is not easy. Year-to-yearvariation in climatic conditions influence crop N demand as well as the retention of inorganic Nin the soil. In addition, there is uncertainty regarding the magnitude of N supplied bymineralization of soil stable organic matter, crop residues, and organic N applied with the waste.The N uptake efficiency of a crop also varies with management and environmental conditions.
The current state of knowledge shows that there is a good understanding of the processesand principles affecting the fate of nitrogen in the soil. However, there is little data fromWashington that is suitable for this report. Partly this is due to the lack of research including all

ES-2
aspects of the complex and multifaceted N cycle. In many cases, researchers (or fundingagencies) are interested in only specific aspects of the N cycle. For example, many studiesemphasized determination of how much N was needed to increase yield, but did not measurecrop N uptake, leaching, mineralization, etc. Many other studies measured N leaching, but didnot measure yield or crop N uptake. As a result, there are very few comprehensive data sets.
The majority of the existing knowledge comes from studies conducted outside the region.Specifically, there have been many studies conducted in the midwestern, eastern, and moresoutherly regions of the U.S. A large number of the studies were conducted in a corn or corn-soybean cropping system. However, it is difficult to apply their results to Washington State dueto differences in cropping systems and regional climates. The diversity of microclimates withinthe State promotes a large variety of crops and cropping systems. In addition, the overallregional climate is one of primarily winter rainfall (as opposed to growing season rainfall) withrelatively cool nighttime temperatures. This affects the rate of the various processes of the Ncycle. For situations in Washington State that have not been researched, we need to realize thatmodels based on data from other locations are only approximate, but can serve as a good firstapproach in constructing best management recommendations.
We suggest that this report provides a basis for understanding the fate of nitrogen under alarge number of crops and cropping systems. As far as we know it is one of the mostcomprehensive literature surveys conducted in this area. However, based on the issues discussedabove, we caution that it will take a concerted effort to distill, apply, and verify the informationsummarized in the report to specific management situations in Washington.
General principles and recommendations based on the literature review are howevergiven in this report. A comprehensive summary of these principles and recommendations ispresented in the following paragraphs.
General Principles and Recommendations
• The agronomic rate as used in this document refers to the recommended rate of nitrogenaddition to the soil that is needed to produce an expected yield, while minimizing adverseenvironmental effects. The estimation of agronomic rate must factor in nitrogen available tothe crop throughout the growing season from all sources such as mineralization of organicresidues and soil organic matter, residual inorganic nitrogen in the rooting zone and nitrogen

ES-3
from irrigation water. Agronomic rate and expected yield must consider all management, soiland climatic factors that will affect the crop's ability to meet the yield level.
• Under management conditions such as process water sprayfields the agronomic rate and theapplication rate of nitrogen may be different. Sprayfields may be managed to encourageremoval of nitrogen from the system at levels above required crop uptake. This isaccomplished through processes such as denitrification and excess nitrogen uptake by thecrop. This may allow increased application of nitrogen above that normally considered as anagronomic rate to adequately supply the crop. However, whenever the application rateexceeds that agronomic rate, close attention must be given to the environmentalconsequences of this practice.
• All nitrogen applied to the soil (including ammonium and organic forms) will eventually besubject to transformation to nitrate (except for volatilization losses). The total transformationof organic to inorganic nitrogen may take a few weeks to a few years, depending on thenature of the organic waste.
• Nitrate moves readily with water in the soil profile and can reach groundwater if not taken upby crops or denitrified/volatilized. Other forms of nitrogen are less mobile.
• Organic or inorganic nitrogen applications that, on the average, exceed crop nitrogen uptakeplus gaseous emissions (denitrification and volatilization) will accumulate inorganic N in thesoil, which will be susceptible to leaching in nitrate form.
• Soil N that moves below the root zone will not be taken up by plants and will eventuallyleach to groundwater as nitrate. Denitrification may help to reduce nitrate loading togroundwater under some conditions. Steps should be taken to minimize movement of Nbelow the root zone during the growing- or non-growing season.� Depth of the rooting zone varies depending on the crop and time in the season.� Management systems should be designed to minimize the levels of residual soil nitrate in
any part of the soil profile during the non-growing season.
• Agronomic rates of N applied in accordance with the timing and amount of crop N demandwill minimize the buildup of inorganic N.� Applying wastes so that inorganic N content is maximized at the times of maximum crop
demand will result in the greatest amount of N removal. Waste applied substantiallybefore or after maximum crop demand may result in buildup of inorganic soil N that willsubsequently be susceptible to nitrate leaching.
• The use of winter cover crops can minimize movement of N deeper into the soil profile bytaking up N from the rooting zone, storing it in the plant tissue, and eventually returning it tothe soil surface after death of the cover crop. This will help to minimize N movement belowthe rooting zone of the subsequent crop during this traditional fallow period.

ES-4
� The use of winter crops does not imply that N can be applied above agronomic rateswithout increasing the amount of N leaching. The only nitrogen removed from the systemcorresponds to that contained in crop biomass removed from the field plus gaseousemissions. Cover crops temporarily store N from the root zone. This N is then availablefor plant uptake, leaching, or other transformations after the death of the cover crop if notharvested. If excess N is applied in one growing season, it must be offset by decreased Napplication in the following season to avoid residual N build up and subsequent nitrateleaching.
• The rate of organic N mineralization is affected by organic N source (i.e., kind of waste), soiland climatic conditions. While mineralization coefficients have been well established formanure-N, less is known about the mineralization coefficients of food processing ormunicipal processed water.� Application of N-containing wastes should be managed to minimize mineralization
during periods when plants are not actively taking up N.
• Crops vary in their capacity to recover N, as influenced by their rooting depths, biomassproduction and capacity to store N per unit of biomass.� While statewide research data is not available on all crops covered in this review,
national and international data provide baseline information on accumulation capacity, Nuptake efficiencies, rooting depths and N harvest indices. As a starting place, weencourage monitoring of plant nitrogen removal at harvest (i.e., in grain or otherharvested plant parts) and measurement of residual soil nitrogen - including deep soilnitrogen (below 1m). This will provide Washington-specific baseline data on thelikelihood of nitrogen leaching under various waste disposal systems.
• Poor irrigation management and/or scheduling will prevent efficient N management andrecovery. Components of the soil water balance that can be controlled must be managed tominimize leaching and runoff (e.g. deficit irrigation, frequent light irrigation).
• The N composition of the processed water should be determined before application becauseit will affect the timing of N availability and the susceptibility to N leaching. Inorganicammonia or ammonium are immediately available for any of several paths including plantuptake, volatilization or conversion to nitrate. Organic N must be mineralized before it isavailable for these reactions.� Mineralization rates will likely vary between organic N sources (for example, manure
compared to food processing waste), however once the mineralization characteristics areknown, the same principles apply. Therefore, use of existing methods for predicting Nloading from manure or biosolids should be adaptable to other types of wastes, once theN composition and mineralization characteristics are known.
• Maximizing nitrogen removal by crops will generally increase the risk of nitrateaccumulation in the soil.
• An alternative method of nitrogen removal from the soil-plant system would be to encouragenitrogen pathways other than leaching and plant uptake. Volatile N losses as ammonia can

ES-5
be encouraged for ammonia/ammonium-rich wastes through surface applications withoutincorporation. However this approach may conflict with offsite odor and air qualityconcerns. Denitrification can be induced through irrigation management leading to temporaryanaerobic conditions.
• Organic wastes applied during the non-growing season will partially or totally mineralize andnitrify before the next growing season. The fraction mineralized will depend on the type ofwaste and on the soil temperature and moisture conditions prevailing during this period. Thiswill contribute to increasing nitrate-N in the surface soil. This nitrate will then be availableto be transported down the soil profile. The depth that nitrates will travel in the soil beforethe next growing season will depend on the soil hydraulic properties and the volume anddistribution of precipitation and water added to the soil by the land application method.Nitrates transported beyond the reach of roots of the crop to be grown during the followingseason will not be removed and will be available for transport to groundwater.
• Precipitation amounts and soil temperature fluctuate annually and are spatially variable. Soilcharacteristics are also variable throughout the state. Thus, applying organic wastes duringthe non-growing season has an inherent risk and requires close soil monitoring to establishthe success of the operation in terms of avoiding N leaching. The use of winter cover cropshelps to mitigate the problem but does not guarantee a solution. The use of storage facilitiesto minimize waste applications during the non-growing season is a safe alternative. Thedefinition of how much risk is tolerable, the implementation of monitoring requirements, andthe quantification of expected outcomes for non-growing season application of organicwastes for the array of soils, weather conditions and waste types involved is beyond thescope of this report.

1-1
1. OBJECTIVES AND METHODOLOGY
The Washington State Department of Ecology (DOE) and Washington State University
(WSU) signed an agreement with the purpose of generating a report describing the results of a
literature search on the fate of residual nitrogen in the soil and vadose zone. They agreed in the
following statement of work: a) WSU will conduct a literature search on the fate of residual
nitrogen in the soil and vadose zone, b) WSU will write a report describing conclusions and
findings based on the literature search, including a list of references and recommendations for a
possible future computer modeling and field studies based on the report.
More specifically, the purpose of this report is to provide background information
regarding nitrogen use by crops and the interactions between the soil water and nitrogen balances
and crop water and nitrogen use. This information is to be applied primarily to management
systems involving land application of processed water (municipal, food processing plants,
livestock liquid manure), although the information should also be relevant to other issues of
nitrogen management and nitrate leaching.
The literature search was conducted using standard procedures including computer search of
specialized databases, abstract indices, journals and book references at WSU and other libraries,
and indirect search based on references already at hand. Bibliography available nationally and
worldwide was included. Published and/or suitable information pertaining specifically to the
State of Washington was rather scarce. Raw monitoring records or other similar data without
formal interpretation could not be used within the context of this report. Fortunately, the basic
processes affecting the fate of nitrogen in the soil and associated groundwater pollution problems
are the same regardless of location. The wide range of weather and soil conditions across the
state allowed us to utilize research from many national and international locations.
The literature search yielded a massive amount of information. This material was classified,
read, filtered, re-read, and selected for inclusion in the report. The selected references are all
included in the reference list. Based on the selected information, sections 2 to 8 of the report
were prepared. Section 9 includes a brief description of field and computer simulation research

1-2
that is required to "customize" the information found to the specific soils, weather, and typical
organic waste characteristics and agricultural management practices prevailing in the state of
Washington. Details required to conduct any of the research activities outlined in this section are
beyond the scope of this report, but they can be provided to DOE upon specific request.

2-1
2. INTRODUCTION
There is a large body of information documenting nitrogen content of groundwater and
surface waters in Washington State and the nation. The agriculture sector is often identified as
an important contributor of nitrogen to groundwater. For example, studies in Nebraska, Illinois,
Georgia, Texas, Florida, and Long Island have shown that groundwater under irrigated farming
areas is generally higher in nitrate than from non-cropped or non-fertilized areas (Meisinger;
1976; Keeney, 1986).
A detailed study by Hubbard et al. (1984) in Georgia showed that nitrate-N
concentrations under a center pivot area ranged from <1mg/L to about 133 mg/L, with a mean of
20 mg/L. In contrast, samples from adjacent forest sites had nitrate-N concentrations ranging
from < 0.1 mg/L to just over 1 mg/L. Mean nitrate-N concentrations under the center pivot area
were found to vary seasonally according to cropping and hydrologic patterns such that the mean
values for March - May, June - August, September - November, and December - February were
7, 21, 27, and 21 mg/L respectively. The lower value for March - May indicated that winter
rains leached most of the root zone nitrate-N beneath the wells by March, and that there was a 2
to 3 month lag between spring - applied N and its appearance in shallow groundwater.
In Washington State, high levels of nitrates have been found in the Pasco area. Water
quality changes due to agricultural activities have been reported for the Yakima River since the
70's. Data for the period of 1971 to 1975 have shown that nitrate concentrations have increased
from 0.45 mg/L in the upper Yakima basin to 0.71 mg/L at the middle and 1.86 to 2.53 mg/L at
the lower Yakima basin (Peralta, 1997). This increase have been attributed to both point and
non-point discharges (including agricultural return flows). The same trend is reported by US
Geological Survey (1992), with the highest values found at the Sunnyside subbasin where a large
number of dairies might be contributing to the enrichment.
In terms of groundwater pollution, Ryker and Jones (1995) has reported that, in the
Central Columbia Plateau of Washington State, nitrate concentrations for 19% of 573 wells
monitored exceeded the US EPA maximum contaminant level (MCL = 10 mg nitrate-N / liter)

2-2
for drinking water. A significant concentration of the problem is located in the Quincy-Pasco
area, where 29% of the wells monitored exceeded the EPA MCL.
The Washington State Department of Health reported that 3% of 6,500 well-dependent
water systems tested exceeded the MCL at least once since 1985 (Stewart et al., 1994). The
following counties had the highest percentage of wells exceeding the MCL: Benton (13.3%),
Douglas (20.8%), Franklin (32.5%), Lincoln (17.6%), Walla Walla (23.9%), and Whitman
(10%).
Not all agricultural activities have the same potential to contribute to N pollution.
Irrigated and intensively managed cash crops hold a significant share. This is particularly true
for crops with relatively shallow roots growing in light-textured soils (sandy to sandy loam).
Large concentrations of animals in feedlots and dairy farms also create conditions for significant
excess N in the soil system. These operations require special management to minimize nitrate
pollution. This includes proper management of feedlots to minimize nitrification and leaching
and application of the wastes to cropland at rates based on agronomic principles, including N
needs of the crop. In managing nitrogen in agriculture is important to understand that nitrate
leaching may be unavoidable under many agronomic conditions. Nevertheless, water and
nitrogen must be carefully managed to minimize the groundwater pollution impact (Keeney,
1986).
Almost all variables involved in soil and crop management can influence N cycling and
the accounting of N in the ecosystem. Consequently, understanding the effects of agriculture
upon nitrate accumulation in groundwater must address all aspects of the nitrogen and the
hydrological cycles. Dominant in any accounting is the total nitrogen required by the crop.
Decision-making regarding N application to land must consider adjustments to crop
requirements based on efficiency of N uptake (particularly in the case of production agriculture)
and other aspects such as soil, climate, and management practices. Credits must be given for the
amount of N derived from mineralization of soil organic N, manure, green manure, crop
residues, or various types of wastes, plus that added through precipitation, foliar absorption of
ammonia, biological N fixation, or nitrates in irrigation water.

2-3
The difference between the crop N requirement and the available soil N from the various
sources described above is normally corrected by fertilization. However, a major problem exists
in determining what constitutes sufficient fertilizer N. One must consider the crop, weather, soil
properties, fertilization practices (carriers, time of application, rate, and placement), and N
source (i.e., organic and inorganic). Also, many management practices can influence crop N
uptake efficiency: tillage and crop residue placement, cropping systems, irrigation practices,
weed control, and others. Consequently, this efficiency varies greatly.
The fact that N uptake efficiency is part of the decision-making process to quantify N
application to crops is an indication that losses are an unavoidable element of the fate of N in
agricultural systems, although some of this efficiency also accounts for N incorporated into soil
organic matter. Quantitative effects of any given practice are often site-specific, but can be
estimated through process-based computer simulation models. In practice, the best approach is
to apply N according to field-calibrated soil tests. Although this is an empirical approach, when
restricted to the area from which the field calibration was derived, it can provide reasonable
estimates of minimum N requirements. Experience has shown that N applications based on such
recommendations reduce nitrate leaching while maintaining yields. With continued research,
well-calibrated soil test recommendations for N usage can provide the accounting needed to
minimize nitrate leaching into groundwater (Power and Broadbent, 1989).
To understand the potential for N pollution from agricultural systems, it is important to
develop a framework of analysis for evaluating the fate of N in the soil. For this purpose, it is
important to understand the components of the N cycling, N balance, soil water balance, and the
interactions among these components. The nitrogen and water balances interact to determine N
transport in the soil and the magnitude of eventual N leaching below the profile explored by crop
roots. The components of these balances are discussed in following sections.

2-4
2.1. Soil Water Balance
The water balance can be expressed as:
where:
P Precipitation
I Irrigation
ET = Evapotranspiration
L Leaching or deep percolation
R = Runoff
Soil water content change for a given time interval
(P I) ET L RWC
WC
=+ =− + + =
=
=
=
=
( ) ∆
∆
2.1.1. Precipitation
Precipitation is the principal source of water to the surface of the earth, and it is the basis
for water supply to agricultural systems (Raudkivi, 1979). Precipitation can be either solid or
liquid. Liquid precipitation comprises rainfall and drizzle while solid precipitation is mainly
snow (Ward et al, 1990).
2.1.2. Irrigation
Irrigation is the artificial replenishment of the soil water when no or insufficient
precipitation has occurred. This practice is oriented to sustain high-productive agriculture where
natural precipitation is unable to do it. Irrigation water is supplied to agricultural lands usually
from rivers, dams and reservoirs (from runoff) and groundwater.
2.1.3. Evapotranspiration
Evapotranspiration is a concept that involves evaporation of water from the soil surface,
plants and residues and transpiration of water from plants. Evaporation is the process by which
water is transformed from liquid to water vapor. It requires a source of liquid water and energy.
The source of liquid water can be the soil water when the soil surface is wet and/or water
intercepted by the crop canopy and residues. Interception is the amount of either precipitation or
irrigation that does not reach the soil surface (Ward et al, 1990). It is retained by plant canopy
and post harvest residues and is later evaporated away from those surfaces. It represents an

2-5
addition to the evaporative losses. Transpiration is a form of evaporation where vapor escapes
from within plants (Ward et al, 1990).
2.1.4. Runoff
Runoff is the portion of water from precipitation and irrigation that reaches the soil
surface but does not infiltrate because the infiltration capacity has been reached. At first, small
depressions and hollows collect this water. When this storage capacity is exceeded, the excess
water starts to move down the slope. The amount of runoff depends on the slope of the surface,
soil type, vegetative cover and water holding capacity of the soil.
2.1.5. Leaching or Deep Percolation
Precipitation and irrigation water that does not evaporate becomes either runoff or
infiltrates into the ground or both. From the water that infiltrates, a part is used to replenish the
soil moisture and any excess is lost as drainage water or deep percolation at the bottom of the
soil. In a simple approach, soil moisture is temporarily held at water potential below -10 to -33
J/kg (roughly equal to centibars). This is called field capacity of the soil. When field capacity of
the soil is exceeded, water passes through the soil becoming drainage water or deep percolation.
2.2. Soil N Balance and the N Cycle
Applying the law of mass conservation to N in the soil, the following general expression
is obtained:
N N Nin out− = +∆
In this equation, Nin is N input to the system while Nout is N output or losses. ∆N is the change in
storage and represents the variation of the N content within the soil for a given time interval.
N inputs may include the following: N applied (inorganic and organic sources); symbiotic
and nonsymbiotic N2 fixation; N mineralization; N in irrigation water and precipitation; N in
crop residue and crop seed N input. N outputs or losses may include the following: harvested
crop N, ammonia losses from organic and inorganic fertilizers, denitrification, N in water
(runoff) and sediments leaving the field, gaseous losses from senescent canopies, and N leaching
losses.

2-6
In the next paragraphs, a brief description of the N cycle, N forms and processes related
to the N fate in the soil are presented. Since a detailed description of this subject may be found in
the literature (e.g., Tisdale et al, 1985), only a revision of the most important aspects related to
this study is given here.
The N transformations in soils are part of nature but they can be significantly affected by
agricultural and industrial activities. These activities usually lead to gains in soil N by
fertilization and waste application. Forms of N added to the soil and N already present transform
from one form to another depending on environmental conditions. A simple scheme of the N
cycle and its simplified relationships is given in Figure 2.1.
There are three major forms of N commonly found in mineral soils: organic, ammonium
and nitrate. Most of the soil N is part of organic compounds and not readily available for
transport. This N form is important as a source of slow-release N. Due to the property of most of
the soils to have negatively charged particles, ammonium (NH4+) is attracted to the soil particles,
being partially immobilized. Therefore, this ion does not move readily in the soil. This process is
more noticeable in clay soils, depending on the nature and amount of clay in the soil. Nitrate is
the preferred form of N ion for plant uptake. Nitrate is an anion, negative charged. It is normally
repelled by the soil particles leaving it free to be transported by the water in the soil. This form of
N is of special environmental concern and it is generally the form found in groundwater.
Transformation of N among the different forms introduced above plus other gaseous
forms is an important aspect of N fate in the soil. Nitrification is a process driven by nitrifying
bacteria, and it corresponds to the oxidation of ammonium to nitrate. In the oxidation step, N is
first oxidized to nitrite by Nitrosomonas, followed by the oxidation of nitrite to nitrate by
Nitrobacter. The two steps require oxygen. The process can be represented by the following
simplified expression:
NH NO NONitrosomonas Nitrobacter
4 2 3+ − −

2-7
The chemical requisites for these processes are adequate temperature (25°C to 35°C), neutral to
slightly basic pH (7 to 9), and adequate soil aeration.
Figure 2.1. The nitrogen cycle
Denitrification is a process involving the microbial reduction of nitrate to elemental N
gas (N2), which is mainly lost to the atmosphere. During the process, nitrous oxide (N2O) may
also be lost. The N2O/N2 ratio is minimum when carbon supply is abundant and not limiting.
Denitrification does not require oxygen and is common in poorly drained soils. It also requires
carbon as a source of energy. The following steps can represent the process:
Biological Wastes, Precipitation, FertilizersN2 Organic N NH4(+)-N NO3(-)-NFixation
NH4(+)
N2
NO2(-)SoilOrganic N NH4(+)
Residues Plant
Exch.NH4(+)
NO3(-)
N2O, N2
FixedNH4(+)
Runoff Harvest Runoff Groundwater Atmosphere

2-8
Atmospheric losses
↑ ↑− −NO NO NO N O N3 2 2 2
Heterotrophic bacteria and anaerobic conditions drive this process and it is of little importance in
well-drained soils. Denitrification is of environmental importance because it can release N2O, a
trace gas believed to be involved in the destruction of the ozone layer (Crutzen, 1976; Liu et al,
1976).
Ammonia volatilization corresponds to the losses that occur in the transformation of
ammonium into aqueous ammonia. The simplified pathway is the following:
NH NH NH Haq air4 3 3+ +⇔ +( , )( ) ( )
Volatilization can occur whenever free ammonia is present near the surface of the soil. The
ammonia concentrations in the soil solution will increase by applying ammoniacal fertilizers or
decomposable organic materials to neutral or alkaline soils. The amounts of ammonia volatilized
are small when N materials are incorporated into the soil, and ammonia losses are low (≤15% of
applied N) when ammoniacal fertilizers are applied in the surface of acidic or neutral soils. Large
amounts of ammonia may be evolved on addition of nitrogen fertilizers or decomposable waste
materials (sewage sludge, animal manure) to the surface of alkaline soils. This volatilized N can
be a source of N enrichment of surface water (Nelson, 1982).
Net mineralization involves the transformation of organic to inorganic forms of N. It
includes mineralization and immobilization. As other N transformations, it is a
microbiologically mediated process. Microorganisms use part of the mineralized N as a
constituent of their cells, so that a fraction of the N is immobilized in organic form. Net
mineralization is the amount of N that is mineralized less the amount that is immobilized. This
process is important in some soils and agricultural systems as a source of N for plants.

3-1
3. NITROGEN UPTAKE BY CROPS3.1.1 Overview of the relationships among N uptake efficiencies and crop N requirements
In this section we review the regional, national, and international research that hasdocumented crop N uptake (accumulation) and partitioning, in terms of absolute quantities andrelative efficiencies. Nitrogen uptake is influenced by numerous agronomic, environmental andgenetic factors, and as a result, there is no single value that will represent the uptake of N by anyone crop. Nevertheless, a survey of the literature allows us to summarize a range of N uptakevalues that are conditioned by these cropping systems variables. The total N accumulation andthe seasonal pattern of N uptake can be one of many helpful layers of information in determininga fertilizer, biosolids or processed water recommendation for land application, but it should beemphasized that N accumulation data cannot be used as the sole determinant of a sound Nmanagement program (e.g., Lang et al., 1997). In this report, we summarize N uptake by variousWashington crops, including N in harvested plant part (e.g., grain, tuber, seed, etc.) as well asnon-harvested plant parts where available.
Processed water and manure application to land is conducted to recycle excess nutrientsfrom a production facility and fertilize crops for production purposes. Both goals can beachieved simultaneously with the application of principles of crop response to N applications.By far, the majority of scientific literature addresses N responses in relation to crop production.Much less information has been published about N uptake in systems designed for wastedisposal. As a result, the data cited in this chapter reflects this bias in the literature.Nevertheless, the principles of crop response to N application can be applied to the latter goal,keeping in mind that disposal systems will be designed to maximize N removal rather than cropproduction, which may or may not result in similar application recommendations. However, itshould be noted that in many documented cases, soil N buildup occurs in the range of Napplication rates exceeding that required to achieve maximum economic yield, so the agronomicliterature provides a good starting point for defining reasonable N loading rates in crop-soilsystems.
In general, the amount of N accumulated by a crop is affected by i) the amount of Nsupplied by the soil or added as fertilizer; ii) the genetic potential of the species or cultivar toabsorb N, which is influenced by genetic factors such as tolerance to biotic and abiotic stresses,rooting pattern and physiological N uptake efficiency; iii) the growth or yield potential under aset of environmental conditions and soil properties; and iv) the ability to retain N in the rootingzone during the period of crop N uptake.

3-2
It is common to hear the statement, " the N use efficiency of our cropping systems shouldbe improved to minimize nitrate leaching into groundwater supplies". This is a fair statement ofa desirable goal and path toward that goal, but what exactly does this mean? Also, what arereasonable expectations for improving N use efficiency? Unfortunately, even crop and soilscientists are not in agreement when it comes to the terminology such as “ N use” and “Nuptake”. Often the two are used synonymously in the literature, adding to the confusion. Beforewe can discuss this topic, we need to agree upon some terminology. For the purpose of clarity,we will apply the definitions outlined by Huggins and Pan (1993) and Bock and Hergert (1991),explained here and summarized in glossary format in Table 3-1.
Nitrogen use efficiency (Gw/Ns) is defined as the amount of harvested crop (Gw; e.g.grain, fruit, tubers, cones) that is produced per unit of N supplied (Ns) during the growingseason. Thus, to improve N use efficiency means that we would be producing more harvestablebiomass per unit of N supplied. This is a useful term because it’s inverse, Ns/Gw or the requiredN supply to produce a unit of harvestable biomass, is the unit N requirement (UNR, Fiez et al.,1994; Bock and Hergert, 1991) which is often used to help predict fertilizer N requirements.
Nitrogen use efficiency is related to 1) the unit of crop N uptake (Nt) per unit yield (Gw)which is referred to as the unit N uptake (Nt/Gw; UNU) and 2) the proportion of the N suppliedthat is accumulated by the plant (Nt/Ns; N uptake efficiency) by the following relationship:
Gw/Ns = (Nt/Ns)/(Nt/Gw)Conversely, the UNR can be calculated by dividing the unit N uptake by the N uptake efficiency:
Ns/Gw = (Nt/Gw)/(Nt/Ns)From these relationships, it is easy to see that to improve N use efficiency and lower the
unit N requirement, one must either increase N uptake efficiency or decrease the unit N uptake ofa crop. However, the potential for changing these components has limitations. It should berecognized that biological efficiencies are always less than 100%. Typical N uptake efficienciesof major agronomic crops range from 30 to 70%, due to several factors. First, it is not possiblefor a plant to deplete all of the inorganic N from the soil solution. As the nitrate and ammoniumconcentrations decrease in solution, the rate of N uptake also decreases, in a relationship similarto substrate-enzyme reactions (Jackson et al., 1986). Minimal N concentrations in the soil arerequired to drive the N influx into crop roots. In addition, some N losses (volatilization orleaching) from the root profile are inevitable during the season. As a result, not all of the Nsupplied will be available for plant uptake. Finally, and perhaps most importantly that to achievemaximum or near maximum yields, N must be supplied at high levels. According toMitscherlich’s Law, as N supply increases, there is a decrease in the incremental yield increase

3-3
per unit of N input (Fig. 3-1). As a result, N use efficiency invariably decreases at high levels ofN input that are required to achieve maximum yield. On the other hand, if minimal N is suppliedso that the soil N is depleted to near zero to minimize nitrate leaching potential, there is aninsufficient concentration of soil N to drive maximal rates of N uptake, and crop yield will belimited. For this reason, the presence of residual soil N at the end of a growing season isinevitable in intensively managed cropping systems that are achieving near maximum ormaximum economic yields.
In view of the fact that the absolute N uptake is influenced by overall plant vigor, growthand subsequently yield, N uptake will often be expressed as a function of yield and biomass(where data are available). In addition, seasonal patterns of N uptake by specific crops areincluded in this report where available. The latter information is often useful in identifyingtiming strategies for N fertilization, and for synchronizing N mineralization from organic Namendments with appropriate crops that will absorb the N as it is mineralized. Since N uptakealso depends on root distribution, information on typical rooting depths are also included wherepossible.
Research values for N uptake efficiency will be summarized when available. It should berecognized that this is a difficult parameter to estimate, since accurate estimates of both the totalplant N and the total N supply are not easy to obtain. The accumulation of N by a crop istypically expressed on a per plant or per area (acre or hectare) basis. Experimentally, small areasor numbers of plants are subsampled out of larger plots or fields, and extrapolated to the largerarea basis. Often times, only the above-ground crop mass is sampled because the roots aredifficult to sample and accurately represent. In these cases where the roots are not measured, thetotal plant N (shoots + roots) is typically under-represented by 5-15%. Under-representation iseven greater percentages in root crops.
Crucial to estimates of N uptake efficiency is the accurate estimation of its denominator,total N supply. Estimates of total N supply must include fertilizer inputs, mineral N in the soil(residual N), soil organic matter mineralization, mineralization of organic amendments, and Ninputs from irrigation or precipitation. Some of these processes such as organic mattermineralization are difficult if not impossible to measure directly, and while there are techniquesto estimate such parameters, they have inherent difficulties and assumptions. Nevertheless,given these precautions, estimates of N supply, N uptake and N use efficiencies are useful guidesfor identifying best management practices. For example, a low N uptake efficiency can be an

3-4
indicator that there is an excessive N supply in relation to crop demand, poor timing of the Nsupply, or accentuation of N loss pathways (volatile emissions or N leaching losses).
Since total N supply is difficult to estimate, researchers often report apparent N fertilizerrecovery. It is usually determined as the amount of N per unit of fertilizer N a crop takes up inexcess of that taken up by an unfertilized crop. However, this assumes that the same amount ofnon-fertilizer N is taken up by fertilized and unfertilized plants. Another technique used bynumerous researchers is to apply isotopically labeled N fertilizer (15N enriched or depleted) todistinguish fertilizer contributions to plant N from other soil-derived sources. In these studies,direct estimates of fertilizer N recovery efficiencies can be obtained, and are summarized in thisreport when available.
It is also helpful to know how crops vary in partitioning N between vegetative residues(usually returned to the soil after harvest) and the portion that is harvested and exported from thefield (e.g., grain, tubers, cones, etc.). The ratio of harvested N divided by total plant N (again,most often represented by total above-ground N) is referred to as the N harvest index.Occasionally, a comparison of the quantities of harvested N to the amounts of N inputs over along-term view of several cycles of a crop rotation, is used as an indicator of overall croppingsystem N use efficiency. However, this is not as useful an exercise when applied to singlegrowing season and should not be a criteria for making N recommendations, because it does notaccount for N recycling and turnover between sequential crops in rotation.
The amount of nitrogen uptake can influence the quality of a crop, as well as the quantityproduced. In some cases, crop quality is increased, for example when protein production is oneof the goals. In some circumstances, however, the additional growth encouraged by a relativelyhigh N supply can be detrimental to the quality of the crop for its intended purpose. Forexample, increasing N supply has been shown to increase grain N protein concentrations,however high protein concentrations in soft white wheat is undesirable since it is not conduciveto quality pastry and noodle production. The types of proteins and amino acids can also beaffected by the N supply. Another example is sugarbeets, in which higher N supplies candecrease the sucrose content of the harvested roots, lowering the efficiency of processing. The Nsupply effects on crop quality are further complicated by interactions with other factors suchenvironmental conditions and genetics. The effect of N supply on crop quality is beyond thescope of this report, but is mentioned since N management recommendations need to considerquality factors as well as quantity.

3-5
N Supply
GeneralRelationshipMeasuredYields
Figure 3-1. Example of a yield response curve developed from measured field data over avariety of site-years. The general relationship shown can be used to estimate the amountof fertilizer needed to meet a particular yield goal for this particular situation.
Table 3-1. Glossary of Nitrogen Accumulation Terminology
Apparent Fertilizer N Recovery (AFNR) = the proportion of applied fertilizer N that is taken up by the plant,
when measured by comparing N uptake in fertilized treatment(s) with N uptake in an unfertilized control
treatment in the same experiment. This measurement should theoretically estimate fertilizer N recovery
(FNR) as measured with isotope-labelled fertilizer (see definition of FNR below), however the two
techniques differ in their assumptions. Generally the AFNR approach is considered less accurate the FNR
approach. (see Guillard et al. 1995). AFNR is calculated as:
AFNR = (plant N in fertilized treatment – plant N in unfertilized control) / applied N
Fertilizer N Recovery (FNR) = the proportion of applied fertilizer N that is taken up by the plant. This term is used
specifically in conjunction with 15N studies that measure the amount of recovered 15N in the plant. (defined
by Parr, 1973 as fertilizer N use efficiency.) It is calculated as:15N-labelled fertilizer recovered/15N-labelled fertilizer applied.
Ndfa % (% nitrogen derived from atmosphere) = the proportion of plant N derived from the atmosphere through
N2 fixation.
Ndff % (% nitrogen derived from fertilizer) = the proportion of plant N derived from the applied fertilizer
Nitrogen use efficiency (NUE) = yield (grain, seeds, forage, etc.) produced per unit N supply; e.g., bushels per lb
N, or kg grain per kg N supplied.
NUE = Gw/Ns = units harvested biomass/units N supply
Unit N Requirement (UNR) = the units of nitrogen needed to produce a unit of yield. Unit N requirement is often
useful for predicting fertilizer N requirements. It is equal to the inverse of NUE, and is calculated as:
UNR = Ns/Gw =total N supply / harvested yield

3-6
Nitrogen supply (Ns) = total N in form of NO3 and NH4 in soil over growing season, including: pre-plant residual
inorganic N, net mineralized N, and fertilizer N added.
Nitrogen uptake efficiency (NPE) = the amount of N accumulated in the plant per unit of total N supply. In
practice, only above ground N is generally measured and included, due to the difficulty of collecting
complete root samples. Roots generally comprise about 10-15% of total plant N.
NPE = Nt/Ns = total plant N/N supply
Unit N uptake (UNU) = the amount of N accumulated in the plant per unit of harvested biomass. Unit N Uptake
differs from UNR in that UNU considers the amount of contained in the plant, while UNR considers the
total N supply.
UNU = total plant N / harvested yield
Available nitrogen = N supply minus what is lost by leaching, denitrification, etc.
Nitrogen harvest index (NHI) = ratio of grain N to total N in plant.
NHI = grain N / total plant N
3.1.2 Fertilizer Guide Development and UsageFertilizer Guides (Nutrient Management Guides) published by WSU-Cooperative
Extension form the basis of most fertilizer recommendations made in the State of Washington.
The recommendations contained in these publications are based primarily on field trials and
years of experience. Generally, they are based on the empirical relationship observed from field
soil test calibration and yield response studies for a variety of field situations.
A general procedure in developing a set of recommendations is to evaluate the
relationship between yield and N application rate in situations where no other nutrients or pest
problems limit yield. Soil testing is used to determine the adequacy of plant nutrients and to
determine background levels of N. Once the relationship has been determined for a variety of
situations over a number of years, yield response curves such as that shown in Fig. 3-1 can be
developed. From these curves, the researcher can determine the crop N requirement needed to
produce a yield goal. In the past, recommendations were made for yield goals at or near
maximum yield. More recently, the idea of targeting the economic optimum yield (which is
generally less than the maximum yield) has gained respect. Using the economic maximum yield
approach requires including fertilizer costs when making fertilizer recommendations by
converting the yield response curve to a set of recommendations.

3-7
The Fertilizer Guides generally consist of one or more tables which the grower works
through to find his/her specific situation. Items that are considered can include yield goal,
residual soil N, soil organic matter content, previous crop, rainfall zone, irrigation, etc. Usually
ranges for each item are presented for the grower to choose among. In Washington, many crops
have separate Fertilizer Guides for the West, Central, and Eastern parts of the state due to the
climatic and soil variation. After determining the appropriate ranges for each of the categories
considered (rainfall zone, previous crop, residual soil N, soil organic matter content, etc.), the
user of the Fertilizer Guide finds the N fertilizer application rate recommended for his/her yield
goal and management capabilities. Because the recommendations in the Fertilizer Guide are
designed to meet the needs of a large area with significant variation in production variables and
management abilities, the recommendations are fairly broad. Therefore, individual crop
consultants and producers have refined these recommendations to better fit their management
systems.
During the period when most of the Fertilizer Guides were produced yield and economic
return were the driving factors in selection of N rate and management. As increased emphasis
has been placed on environmental quality and sustainability of agricultural systems crop
consultants and producers have modified N management to increase N utilization. Practices such
as tissue testing and split applications of N have become common place, leading to increased N
utilization while maintaining yield potential. More recently, people have argued that a better
approach than the traditional response curve would be to determine the N uptake efficiency and
use this in conjunction with the UNU to get a better prediction of fertilizer needed. However,
very few measurements of N uptake efficiency exist, due to the difficulty in measuring total N
supply (see previous section).
A list of the Extension publications (primarily Fertilizer Guides) relevant to theproduction of the crops discussed in this report is presented in Table 3-2. Most of WSU’sFertilizer Guides have not been updated since the 1970's and early 1980's due to lack of fundingfor this type of work, however, they continue to be relevant and are used as the primary source ofinformation related to fertilizer recommendations in the State. Support by individual commoditygroups is allowing updating of guides for major crops.

3-8
Table 3-2. Washington State University Cooperative Extension publications related to management of nitrogen inthe crops summarized in this report. A complete listing of WSU’s Extension publications is available in thepublication ‘Cooperative Extension: Educational Materials,’ as well as all of the following publications areavailable at: WSU Cooperative Extension, Bulletin Office, Cooper Publications Building, Washington StateUniversity, PO Box 645912, Pullman, WA 99164-5912; 509-335-2857
Bulletin # Crop Title Year
CO 506 General Cooperative Extension: Educational Materials 1997EB0757 General Critical Nutrient Ranges in Washington Irrigated Crops 1980EB1097 General Agricultural Data: Washington State 1991PNW0283 General Fertilizer Band Location for Cereal Root Access 1986PNW0475 General Agronomic Zones for the Dryland Pacific Northwest 1990WREP0043 General Critical Nutrient Ranges in Northwest Crops 1980EB1716 Groundwater Farming Practices for Groundwater Protection 1992EB1756C Groundwater Documented Groundwater Contamination in Washington 1995EB1756D Groundwater Documented Nitrate Contamination in Washington 1995FG0003 Alfalfa Fertilizer Guide: Irrigated Alfalfa Central Washington 1980FG0016 Alfalfa Fertilizer Guide: Alfalfa-Grass Seedings in Western Washington 1982FG0030 Alfalfa Fertilizer Guide: Alfalfa (Non-Irrigated) 1975EB1260 Barley Fertilizer Use Field Trials: Spring Barley Fertilization in Non-Irrigated
Eastern WA1982
FG0029 Barley Fertilizer Guide: Barley for Eastern Washington 1975FG0005 Bean (field) Fertilizer Guide: Irrigated Field Beans for Central Washington 1980FG0006 Corn Fertilizer Guide: Irrigated Field Corn for Grain or Silage 1970FG0018 Corn Fertilizer Guide: Silage Corn 1977XB0950 Corn-Sweet Nitrogen and Phosphorus Requirements for Sweet Corn in Western WA 1986FG0035 Corn-Sweet Fertilizer Guide: Irrigated Sweet Corn, Central Washington 1977FG0039 Corn-Sweet Fertilizer Guide: Sweet Corn for Western Washington 1980EB1516 Forage Hay Production Guide for Northeastern Washington 1989EB1297 Forage Pasture Management Guide for Northeast Washington 1984EM3346 Forage Range and Pasture Fertilization: Eastern Washington 1970FG0004 Forage Fertilizer Guide: Irrigated Pasture for Central Washington 1979FG0037 Forage Fertilizer Guide: Improved Pasture, Hay, Eastern Washington 1980EB1569 Grain Fertilizer Management for Dryland Cereal Production and Groundwater
Protection1990
FG0011 Hops Fertilizer Guide: Irrigated Hops for Central Washington 1977PNW433 Onion/Leek seed Onion and Leek Seed Production 1993EB1693 Onion Dry Bulb Onion ProductionFG0025 Pea/Lentil Fertilizer Guide: Peas and Lentils for Eastern Washington 1980FG0027 Peas Fertilizer Guide: Peas 1975FG0033 Peas(Green) Fertilizer Guide: Irrigated Peas for Central Washington 1977FG0007 Potato Fertilizer Guide: Irrigated Potatoes 1974FG0046 Ryegrass – perennial Fertilizer Guide: Perennial Ryegrass Seed--Western Washington 1980EB1638 Sludge Recycling Municipal Processed water Sludge in Washington 1992FG0009 Small Grains Fertilizer Guide: Irrigated Small Grains, Central Washington 1977
(continued next page)

3-9
Table 3-2 (cont.). Washington State University Cooperative Extension publications related to management ofnitrogen in the crops summarized in this report. A complete listing of WSU’s Extension publications is availablein the publication ‘Cooperative Extension: Educational Materials,’ as well as all of the following publications areavailable at: WSU Cooperative Extension, Bulletin Office, Cooper Publications Building, Washington StateUniversity, PO Box 645912, Pullman, WA 99164-5912; 509-335-2857
Bulletin # Crop Title Year
EB1258 SOILS Rating Eastern Washington Soils for Potential Nitrogen Losses 1984
EM3076 SOILS Interpretation of Soil Test Nitrogen: Irrigated Crops in Central Washington 1969
FG0036 Sudangrass Fertilizer Guide: Irrigated Sudangrass Pasture or Silage 1970
EB1507 Sudangrass/Sorghum Growing Sudangrass and Sorghum-Sudangrass Crosses in Washington 1988
FG0010 Sugarbeet Fertilizer Guide: Sugar beets for Central Washington 1970
EB0482 Turf Home Lawns 1995
EB0924 Turf Lawn Renovation 1995
EB1153 Turf Establishing a Lawn in Eastern Washington 1982
EM1627 Turf Grasses and Legumes 1974
EM3831 Turf Fertilizers for Play, Athletic Areas: Selection, Purchase, Application 1980
FG0024 Turf Fertilizer Guide: Lawns, Playfields, and Other Turf, East and Central Washington 1982
FG0038 Turf Fertilizer Guide: Grass Seed for Eastern Washington 1975
FG0041 Turf Fertilizer Guide: Home Lawns, Playfields and Other Turf 1982
EM4264 Wheat Nitrogen Fertilizer Use During Drought in Wheat Area of Eastern Washington 1977
EM4504 Wheat Holding Back Nitrification in Dryland Wheat Area of Eastern WA 1979
EB1390 Wheat-winter Fertilizer Guide for Winter Wheat, Eastern Washington Dryland Area 1986
EB1487 Wheat-winter Fertilizer Guide: Winter Wheat (Soft White), Central Washington, Irrigated 1988
FG0017 Winter Wheat/Barley Fertilizer Guide: Winter Wheat and Barley for Western Washington 1975
FG0031 Wheat Fertilizer Guide: Winter Wheat (Irrigated) 1974
FG0034 Wheat Fertilizer Guide: Dryland Wheat Nitrogen Needs for Eastern Washington 1977
FG0048 Wheat/Barley/Oat Fertilizer Guide: Spring Wheat, Barley and Oats for Western Washington 1976
3.2 Crop N accumulationThis literature review was compiled by searching the national and international scientific
literature for recent articles (last 20 years) that include data relevant to crop uptake of nitrogen.The earlier research (before about 1980) has generally been summarized in review articles,including those of Olson and Kurtz (1982) and Broadbent (1984). The crops reviewed in thisreport are considered among the most prominent crops grown in Washington State, and are listedin Table 3-3 along with their scientific names and Washington production information. Forsome crops, such as wheat, a relatively large amount of information has been published relevantto N uptake in Washington specifically. For many of the other crops, including the legumes,there is relatively little published on N uptake from soil and little or no information specific to

3-10
Washington. For these crops, almost all available information comes from regions outside thestate, making it difficult to draw conclusions for patterns within the state.
Table 3-3. Common and scientific names for the major crops reviewed in this report. Also included are the harvestedacreages and dollar values for Washington State in 1995.
Common Name Scientific Name WA Production, 1995
Harvested acres $Cereal Grain Crops
Barley Hordeum vulgare L. 290,000 75,150,000
Corn, grain Zea mays L. 102,000 64,923,000
Corn, silage Zea mays L. 48,000 34,344,000
Oat Avena sativa L. 14,000 1,960,000
Wheat, soft white Triticum aestivum L. 2,321,000 total wheat:733,478,000
Wheat, hard red Triticum aestivum L. 224,000
Legume Crops
Alfalfa, hay Medicago sativa L. 500,000 2,550,000
Alfalfa, seed Medicago sativa L. 15,000 10,005,000
Bean, dry Phaseolis vulgaris L. 41,000 20,024,000
Pea, dry / wrinkled seed Pisum sativum L. 95,000 / not avail. 18,573,000 / 7,700,000
Pea, green processing “ ” “ 57,300 30,248
Specialty Crops
Hops Humulus lupulus L. 30,621 99,290,000
Onion Allium cepa L. 13,500 45,940,000
Potato Solanum tuberosum L. 147,000 553,823,000
Sugarbeet Beta vulagris L. not available not available
Forage Crops
Orchardgrass Dactylis glomerata L. not available not available
Perennial Ryegrass Lolium perenne L. not available not available
Tall Fescue Festuca arundinacea Shreb. not available not available
Cover Crops/Green Manures
Mustard, white Brassica hirtus L. not available not available
Rapeseed, Canola Brassica napus L. not available not available
Sudangrass,sorghum sudangrass
Sorghum bicolor Moench,Sorghum sudanese
not available not available
Wheat, winter Triticum aestivum L. not available not available
Rye, annual Secale cereale L. not available not available

3-11
3.2.1 GRAIN CROPS
Barley (Hordeum vulgare L.)
In 1995, 300,000 ac of barley were planted in Washington for both feed (266,000 ac) and
for malting (34,000 ac), with a total harvested yield of about 21 million bushels and worth almost
$60 million. Most (97%) is grown under dryland (nonirrigated) conditions (Washington
Agricultural Statistics Service, 1996).
Total N accumulation
The unit N uptake range for all treatments in all barley studies surveyed for this report is
0.014 to 0.061 with a mean of 0.025. In addition, total N accumulation averaged 82 kg N/ha,
with an average of 61.5 kg N/ha removed with the harvested grain. The range in N uptake was
considerable between the various studies, with a range in total plant N uptake of 19 to 260 kg
N/ha, and harvested (grain) N uptake of 15-131 kg N/ha (Table 3-4). The nitrogen harvest index
averaged at 0.74 (range of 0.50 to 0.91).
The unit N uptake (UNU) for barley following a variety of legume crops or fertilization
at 100 kg N/ha was 0.024 (Abernathy and Bohl, 1987). A large range of UNU values (0.025 to
0.061) was observed in barley grown in Alaska (Sharratt and Cochran, 1993).
Fertilizer recovery and N use efficiency
Nitrogen use efficiency (NUE) values for malting barley in the Palouse of eastern
Washington ranged from 15.3 to 35.9kg grain dry weight/kg N , depending on the genotype
(Nedel et al., 1997). In general, semidwarf genotypes had somewhat lower NUE values than
their corresponding standard variety as well as lower yields and malting quality (Nedel et al.
1993). Calculation of NUE included measured values for (NO3 + NH4)-N in the surface 90cm of
83 and 22 kg N/ha depending on the year, and estimated mineralized N of 114 and 74 kg N/ha
for those same years. In both years, and for both groups of genotypes, increasing fertilizer N
rates (from 30 up to 120 kg N/ha) generally resulted in lower NUE (28 or 29 down to 22 or 24
kg/kg N depending on the year). Increasing N fertilizer rate also resulted in higher UNU values
(Table 3-4) and increased remobilization of straw N to the grain. In addition, these researchers

3-12
Table 3-4. Summary of N accumulation values reported in the literature for barley.
CulturalPractices
Total N uptake†
Location Soil Mean Range NHI UNU‡ FNR§ Referencekg N/ha kg N/ha kg N/kg %
Riverton, WY Typic Torrifluvent Following legume crops 168 180 to 260 0.63 0.028 - Abernathy and Bohl (1987)
Torrington, WY Pachic Haplustoll Following legume crops 87 60 to 120 0.72 0.020 - Abernathy and Bohl (1987)
Belgium sandy 101 - 0.65 0.040 57 Khanif et al. (1984)
Corvallis, MT Typic Argiboroll 1st yr following legumes 107 - 0.89 0.019 - Westcott et al. (1995)
Kalispell, MT Pachic Haploxeroll 1st yr following legumes 97 - 0.91 0.018 - Westcott et al. (1995)
Egypt sandy loam, pH 4 Avg. 2 yrs; 0 to 167 kg N/ha 41 19 to 73 0.71 0.018 17 (7 to 32) Abd El-Latif et al. (1984)
Ireland sandy loam or loam yrs after pasture, 0-85 kg N/ha 96 61 to 114 0.78 0.020 32 (16 to 47) Gately and McAlesse (1976)
Canada - Alberta Dark BrownChernozemic
Normal weather year 62 33 to 86 0.84 0.027 49 (44 to 54) Kucey (1986)
Canada - Alberta “ ” dry year 39 26 to 48 0.66 0.034 22 (16 to 28) Kucey (1986)
Pullman, WA Ultic Haploxeroll 30 to 120 kg N/ha - - - 0.025 - Nedel et al. (1993, 1997)
Pullman, WA Ultic Haploxeroll 11 genotypes, 2 yrs, 45 or 90 kg N/ha
84 59 to 106 0.81 0.021 - Tillman et al. (1991)
Fairbanks, Alaska Pergelic Cryaquept var. row spacing, fertilizerplacement, all 100 kg N/ha
133 94 to 205 - 0.037 - Sharratt et al. (1991)
Montana Aridic Argiboroll,Typic Argiboroll,
or Aridic Haploboroll
5 site-years (3 locations), 0 to 101 kg N/ha
56 19 to 118 - 0.025 - Jackson et al. (1994)
Canada - Quebec Typic Hapludalf 200 cultivars, 3 yrs, N sourceand rate (0 to 200 kg N/ha)
- - 0.66 - - Bulman and Smith (1994)
Canada - Quebec Typic Hapludalf 3 cultivars, 3 yrs; chemical mgtintensity
0.050g/plant - 0.63 0.037 - Bulman and Smith (1993)
Model Value - - - - - 0.026 - Hermanson et al. (1995)† Total N uptake = total plant N (harvested plant part + other above ground plant parts, not including roots).‡ NHI = Nitrogen Harvest Index (grain N/total N uptake)§ Unit N Uptake = units of N in total plant (except roots) / unit yield. Values shown are the mean of the various treatments of that study.¶ FNR = Fertilizer N Recovery = estimated proportion of applied N taken up by the plant. Estimation is based on either FNR or AFNR approach as described in the glossary given in Table 3-1. Valuesshown for each reference are the mean and range for the various treatments of the study.

3-13
present one of the few published sets of estimates for N uptake efficiency (total plant N uptake /total N supply) - with values ranging from 52 to 79% depending on genotype and N applicationrate.
For the data surveyed in this report, apparent fertilizer N recovery (AFNR) by barleyranges from 7 to 57%, with a mean of 29%. At the highest AFNR (57% of 50 kg fertilizer N/ha),measured in Belgium, the fertilizer contributed 28% of the N contained in the grain, and 26% ofthe straw N (Khanif et al., 1984). About 32% of the fertilizer N remained in the soil afterharvest, and 10% was lost. The loss was attributed to denitrification. Corresponding yields andgrain N uptake values in this study were 2450 and 65 kg/ha (dry matter basis).
Early season studies with 15N eight weeks after germination (Dev and Rennie, 1979)found that barley shoots recovered 26.4 to 36.9% of the applied 75 kg N/ha, depending on soiltype, and 36.2 to 40.7% of the fertilizer N when the application rate was 150kg 150 kg N/ha forthe same two soil types. Ranges for total plant fertilizer recovery were 40.6 to 56.2% and 50.9 to60.7% for the 75 and 150 kg N/ha rates. Apparent N fertilizer recovery from an irrigated sandysoil in Egypt ranged from 7 to 32%, depending on the study year and N rate applied (Abd El-Latif et al., 1984). In general, greater fertilizer recoveries were obtained a N application ratesincreased from 0 to 143 kg N/ha. The highest N rate (167 kg N/ha) resulted in decreased yield aswell as fertilizer recovery compared to the 143 kg N/ha rate. The yield decrease appeared to bephysiological, due to decreased mass of individual grains at the highest rate.
McTaggart and Smith (1995), in studies with spring malting barley in Scotland, foundthat fertilizer 15N uptake increased almost linearly as N rate increased from 0 to the maximumrate applied (120 or 150 kg N/ha, depending on the site). At the same time they found thatuptake of residual soil N was approximately the same across all N Average uptake of non-fertilizer N in their plots was variable, and ranged from 40 to 82 kg N/ha. In a Danish studyusing 15N, Nielsen and Jensen (1986) estimated 100 kg /ha of non-fertilizer N was taken up bythe crop, regardless of the level of N application (30, 90, 120, or 150 kg N/ha).
Seasonal patterns of N accumulationBulman and Smith (1994) determined that averaged over 20 cultivars, about 43-72%
(depending on growing season and management) of grain N at harvest was due to Naccumulation after awn emergence. The corresponding ratio of post-heading N uptake to totalplant N ranged from 0.29 to 0.39, depending on growing season and management. Generallyless N was retranslocated after heading when higher N rates were applied (Bulman and Smith,

3-14
1993, 1994). Working in the Palouse region Eastern Washington, Tillman et al. (1991) foundthat accumulation of N during grain-filling comprised <17% of total above-ground Naccumulation during the entire season. McTaggart and Smith (1995) found that the seasonaldistribution of fertilizer and soil N uptake depended on the location as well as form of Nfertilizer.
A number of researchers note that a portion of plant N is lost from the crop in latergrowth stages. Nielsen and Jensen (1986) observed that about 7% of plant-absorbed fertilizer Nwas lost during the grain-filling period. McTaggart and Smith (1995) observed lossescorresponding to about 25 kg N/ha in the period between anthesis and harvest at one site.Tillman et al. (1991) observed losses in many of the genotypes studied, with N losses in thesegenotypes corresponding to an average 5 to12% (depending on fertilizer application rate) of totalplant N at harvest. The most common explanation for these losses is root exudation or volatilelosses from the leaves.
Root length.Sharratt and Cochran (1993) measured root length densities at several intervals in the
surface meter of a field soil in Faribanks, AK. The majority of roots were found in the upper 0.4m with no roots found below 0.8 m. Root length densities measured in July in the surface 0.4 mranged between 0.22 and 2.64 m/m3, depending on depth, row spacing, and applied fertilizerlocation. Highest root length densities were found in the surface 0.10m for all treatments, with abanded skip-row treatment causing the greatest root length densities. Researchers in Englandmeasured spring barley root length densities ranging between 88 and 112 cm/cm2 ground area ina 10 cm soil depth, with somewhat lower root lengths in a relatively wetter year of 74 to 94cm/cm2 (Hodgson et al., 1989). Rooting depths of barley grown in the Palouse region of easternWashington ranged from 90 to 120 cm depending on varying soil resistance with topography andthe presence of compacted suboils (Pan and Hopkins, 1991).
Webster et al. (1985) conducted a study with winter barley in England evaluating therelative uptake of 15NH4NO3 injected at four different soil depths. They compared the amount ofN uptake from these depths at three times in the growing season (Zadoks stages 23, 31, and 45),and under two different tillage regimes - plowed and direct drilling (no-till). In general, the mostN uptake for a given time occurred from the 7.5 cm depth, indicating greater root activity in thiszone. The one exception was for the plowed treatment at stage 31, which showed slightly greater15N uptake from the 15 cm deep sample. Very little 15N was taken up from the 30 and 50 cmdepths until the last sampling date, suggesting that roots are not prevalent at this depth untilrelatively late in the season.

3-15
Washington State University recommendations.Current recommendations for N fertilization on barley in Washington depend on the
amount of rainfall, previous crop, whether it is fall or spring planted, and whether it is beinggrown for feed or malting, and range between 30 and 90 lb N/ac. There are several fertilizerguides for barley production in Washington State (Table 3-2). These guides are for differentagronomic situations and give situation-specific recommendations. For example, if peas aregrown as the previous crop, then 15 lb N/ac less should be applied. If it is grown under irrigatedconditions, a soil test should be used. The possible range of N fertilizer that might be needed is 0to 180 lb N/ac. University of Idaho N fertilizer recommendations range from 0 to 230 lb N/acdepending on previous crop, preplant soil test N, and yield goal (Tindall et al., 1993). For morespecific information see the appropriate Extension publication.
Corn (Zea mays L.) Corn is grown in Washington for silage feed for livestock, grain feed(field corn) and sweet corn for human consumption. Most of the information available on soil-corn N relationships focuses on field corn. Information on other types of corn will bedistinguished when appropriate.
Total N accumulation and N efficiencies.A summary of 10 recent N fertility experiments on corn revealed a wide range of total N
accumulation across many environments, cultural practices and N fertility management practices(Table 3-5). Interestingly, the average experimental UNU was fairly consistent, ranging from0.015 to 0.028 kg plant N/kg grain yield.
Maximum dry matter yields of silage corn grown in the Northeastern U. S. exceeded 15Mg/ha with 112 kg applied N/ha resulting in over 150 kg N/ha total N accumulation (Guillard etal., 1995). Apparent N recovery ranged from 50% at maximum yield to 20 % at 430 kg N/haapplied in excess of that required for maximum yield. Silage corn grown in southern Idaho underirrigation produced 16 to 20 Mg dry matter/ha that accumulated 240 to 260 kg N/ha (Meek et al.,1994). In western Washington, silage corn following various cover crops yielded 7 to 18 Mg/hawhile accumulating 60 to 180 kg N/ha (Kuo, 1996). In field corn grown in central Washington,Stevens and Prest (1994) observed that the addition of 112 kg N/ha increased grain yields by27%, biomass by 26%, and N uptake by 47% in 1993, and by 104%, 54% and 72%, respectivelyin 1994. Addition of recycled yard debris did not change the fertilizer N requirement. Silage Naccumulation was approximately 179 kg N/ha at maximum yield, or 0.0152 kg N/kg grain.

3-16
Forage corn grown in eastern Quebec accumulated 130 to 215 kg N/ha and 14 to 18 Mg/ha drymatter (Pare et al., 1992).Nitrogen uptake by silage corn grown in British Columbia was affected by N source (Paul andBeauchamp, 1993). Corn N accumulation per unit of N applied was ranked: urea > dairy manureslurry > beef cattle solid manure = composted manure, corresponding to 49, 18 and 5% apparentN recoveries in the first year.
In upper state New York, no-till and conventionally-tilled corn yielding 3.2 to 7.2 Mg/haaccumulated 55 to 152 kg N/ha (Sarrantonio and Scott, 1988). Over this wide range of yield andN uptake, the corn exhibited a narrow UNU range of 0.017 to 0.022 kg N/kg grain. Tillageeffects on N accumulation were directly related to its effects on yield. In Pennsylvania, total Nuptake ranged from 110 to 140 kg N/ha and the UNU averaged 0.017 kg N/kg grain for grainyields ranging from 6.64 to 8.23 Mg/ha (Fox et al., 1986).
The maximum economic optimum rate of N fertilization is dependent on variable yieldresponse over years and locations, and the fertilizer to grain price (F:G) ratio (Cerrato andBlackmer, 1990). The mean predicted economic rates of fertilization over 12 site-years in Iowa,with maximum yields from 8.4 to 13.2 Mg/ha, ranged from 190 kg N ha-1 at an F:G price ratio of2 to 157 kg N ha-1 at an F:G price ratio of 10. At an F:G price ratio of 3.36, the economicoptimum rates of fertilization ranged from 108 to 302 kg N ha-1, with a mean of 184 kg N ha-1
over the 12 site-years.
Crop rotation and tillage can greatly influence N uptake and N fertilizer responses incorn. Residual N availability supplied to two successive corn crops following a previous alfalfacrop was equivalent to about 90-130 kg N ha-1 year-1 in Pennsylvania, thereby supplying a majorportion of the corn N requirement (Levin et al., 1987). In Minnesota, corn following alfalfarequired no additional or reduced amounts of fertilizer N to achieve maximum yield compared tocontinuous corn (Lory et al., 1995). No-till planting increased grain and N uptake of corn in thisrotation in one of two years, supporting the concept that initial fertilization requirements mayincrease with the adoption of no-till systems (Phillips et al., 1980). Nitrogen uptake under no-tillranged from 155 to 192 kg N/ha while conventionally-tilled corn ranged from 138 to 162 kgN/ha, however, the unit nitrogen uptake were similar among N rates and tillage treatments,averaging 0.024 and 0.026 kg N/kg grain in the two years. Similarly, silage corn N uptake atmaximum yield was 172 kg N/ha for 14.4 Mg/ha conventionally-tilled corn and 145 kg N/ha for12.2 Mg/ha no-till corn grown on a Typic Hapludult in Virginia (Menelik et al, 1994). Splittingthe N between preplant and at 6-weeks had no effect on yield or N uptake. Applying similar

3-17
amounts of plant available N as sewage sludge improved plant N recovery by 10%. In easternQuebec, faba bean grown for seed before forage corn resulted in an N-fertilizer equivalent of

3-18
Table 3-5. Summary of N accumulation values for corn reported in selected research reports.
CulturalPractices
Total N uptake†
Location Soil Range Mean NHI‡ UNU§ FNR¶ Referencekg N/ha kg N/ha kg N/kg N kg N/ kg %
Salisbury, MD Typic Hapludult Hairy vetchcover; NT
96 to 189 155 --- 0.018 38@YmaxAFNR
Clark et al., 1995
Rock Springs,PA
Typic Hapludult cont. corn; NT 107 to 142 124 --- 0.017 ---- Fox et al., 1986
Tifton, GA Kandiudult,Quartzipsamment
Irrigated 199 to 285 221 0.59 0.020 ---- Gascho and Hook, 1991
Mead, NE Typic Argiudoll Irrigated 90 to 198 131 0.66 0.020 59@YmaxAFNR
Kessavalou and Walters, 1997
Puyallup, WA Aquic Xerofluvent Previous vetch,AWP
140 to 180 160 --- 0.008(silage yield)
---- Kuo et al., 1996
Quebec, Canada Grey Br. LuvisolHumic Gleysol
Cont. corn 97 to 251 174 0.58 0.020 35 to 57FNR
Liang & MacKenzie, 1994
Lincoln, NE Pachic ArgiustollAbrupticArgiaquoll
Soybean-corn 53 to 114 84 0.79 0.015 46 FNR Maskina et al., 1993
VA Typic Hapludult CT,NT 80 to 180 164 0.64 0.028 ---- Menelik et al., 1994
Guelph, Ontario Gleyed MelanicBrunisol
Manure or urea 60 to 140 116 forNtmax
— 0.020 for Ntmax ---- Paul and Beauchamp, 1993
Aurora, NY Aeric Hapludalf hairy vetch, NT 44 to 152 94 ---- 0.020 49@YmaxAFNR
Sarrantonio and Scott, 1988
† Total N uptake = total plant N (harvested plant part + other above ground plant parts, not including roots).‡ NHI = Nitrogen Harvest Index (grain N/total N uptake)§ Unit N Uptake = units of N in total plant (except roots) / unit yield. Values shown are the mean of the various treatments of that study.¶ FNR = Fertilizer N Recovery = estimated proportion of applied N taken up by the plant. Estimation is based on either FNR or AFNR approach as describedin the glossary given in Table 3-1. Values shown for each reference are the mean and range for the various treatments of the study.

3-19
>150 kg N/ha compared with none following soybean (Pare et al., 1992). In contrast, soybeanresidues in Nebraska increased the uptake of non-fertilizer N in corn, but had minimal effects onfertilizer N recovery (Maskina et al., 1993). Total N accumulation in the corn increased from 53kg N/ha without fertilizer N or soybean residues returned and no use of hairy vetch cover crop, to114 kg N/ha with vetch, 150% of the normal soybean residue return rate and 60 kg N/ha appliedN.
Rainfed and irrigated corn grown in Wisconsin accumulated 213 to 269 kg N/ha at nearmaximum grain yields ranging from 8.4 to 11.0 Mg/ha (Oberle and Keeney, 1990). Thecorresponding apparent fertilizer recoveries in the grain ranged from 30 to 40% for a Plainfieldloamy sand to 15 to 30% on Plano and Fayette silt loam soils, or 50 to 67% and 25 to 50% whentotal above-ground N accumulation was taken into account. Higher apparent fertilizer Nrecoveries were noted in the irrigated loamy sand, despite the higher amounts of applied Nrequired to achieve near maximum yield. This was explained by the lower contributions fromsoil N mineralization and possibly more optimum water availability with irrigation. Applicationof agronomic rates of N to irrigated corn resulted in 50 to 75% apparent fertilizer N recovery,and minimal nitrate percolation below the root zone (Porter, 1995). The amount of residualnitrate to 180 cm was inversely related to the grain yield response to applied N (Olson and Kurtz,1982). The effectiveness of nitrification inhibitors in improving fertilizer N uptake efficiency byslowing the oxidation of ammonium to nitrate is dependent on the leaching potential of thecropping system (Walters and Malzer, 1990).
In North Carolina, two well drained sandy loam soils yielded 8 and 12 Mg grain/hacorresponding to plant N accumulation of 190 and 130 kg N/ha, with a consistent unit N uptakeof 0.016 kg N/kg grain (Overman et al., 1994). In the same year on a poorly drained, high watertable soil, the grain yield was 9.5 Mg/ha and total N was 130 kg N/ha or 0.015 kg N/kg grain.Maximum yields were obtained with approximately 15 kg N/ha. In Alabama, corn grain yieldranged from 5 to 8 Mg/ha over 3 years and a range of N rates and timings (Reeves et al., 1993),while total N accumulation ranged from 100 to 210 kg N/ha.
In eastern Quebec, corn yields ranged from 4.7 to 7.5 Mg/ha and total N accumulationranged from 81 to 155 kg N/ha (Alkanani and MacKenzie, 1996). At maximum yield, the UNUwas 0.020 kg N/kg grain. Silage corn grown over 5 years in eastern Quebec produced 3.3 to 18.2Mg dry matter/ha, while accumulating 48 to 237 kg N/ha (N’Dayegamiye, 1996). Yields werehighest when dairy manure and N, P, K mineral fertilizers were supplied. At maximum yields

3-20
for each year, the UNU for well-fertilized silage corn ranged from 0.012 to 0.015 kg N/kg shootdry matter. A similar range of UNU was exhibited by unfertilized silage corn.
Crop residues and crop rotations greatly influence soil N availability, N responses toapplied N and fertilizer N requirements. While corn residues contribute little additional N to thesucceeding corn crop, soybean residues have contributed 60 kg N/ha or 32% of the total corn Naccumulation in eastern Nebraska (Power et al., 1986), while alfalfa and soybeans increased cornN uptake 84 to 168 kg N/ha in the first year and 56 kg N/ha in the second year in a Fayette soil inWisconsin, 67 kg N/ha from soybean residues in a Plano silt loam compared to continuous corn(Oberle and Keeney, 1990). In contrast, no N was apparently carried over from soybeans in aPlainfield loamy sand, where it was speculated that mineralization and leaching occurred prior tocorn N uptake. Similarly, fertilizer equivalent values for alfalfa preceding corn were 153 and 36kg N/ha and 75 kg N/ha for soybeans before corn (Vanotti and Bundy, 1995). Preceding cornwith a hairy vetch cover crop can improve corn yield and N uptake, particularly when used as asoil water conserving mulch under dry land conditions (Clark et al., 1995).
An 15N experiment demonstrated that corn fertilized at the V3 stage recovered from 40 to62% of the applied N by maturity while accumulating 152 to 204 kg N/ha in the above-groundbiomass (Francis et al., 1993). Evidence for significant volatile loss of ammonia (perhaps asmuch as 80 kg N/ha) from the shoots was provided. This suggests that N balance studies thatdetermine N leaching losses by difference could be significantly overestimating the magnitude ofthis loss. Another 15N experiment conducted in Quebec, Canada demonstrated fertilizer Nrecoveries of 9 to 58%, with the lower values associated with high rates of fertilization in lowyielding environments (Liang and MacKenzie, 1994).
NLEAP, the Evaluation of the Nitrate Leaching and Economic Analysis Package model,uses a default UNU of 0.0214 kg N plant N/kg grain yield (1.2 lbs N/bu), but recognizes that thisvalue is not constant and should be adjusted to fit site specific conditions (Follett et al., 1994).
Seasonal patterns of N accumulation.Nitrogen uptake by corn over time is typically portrayed as a sigmoidal curve, with little
N uptake occurring through stage 2, then rapid acceleration to flowering, followed by slowerrates or no net N gain during grain-filling (Olson and Sander, 1988; Stute and Posner, 1995).

3-21
Figure 3-2. Comparative seasonal N uptake patterns for wheatand corn under Nebraska conditions (Bock and Hergert, 1991)
These patterns will vary by year and N timing. Under favorable growing conditions, Naccumulation rates were relatively constant from 6 weeks after planting to maturity (15 weeks).In other years, the N accumulation rate declined during grain filling, particularly with lower Nrates (Reeves et al., 1993). Senescing leaves become increasingly prone to volatilization ofammonia-N, which may be as significant of a contributor to N losses as nitrate leaching (Franciset al., 1993). In consideration of the time lapsed between planting and significant N uptake, splitN applications are typically recommended, particularly for irrigated sandy soils or humidclimates. For example, Gascho and Hook (1991) recommends 25% of the fertilizer N applied atplanting, and the remaining applied as fertigation by the V6 to V8 stages. The accelerated phaseof corn N uptake occurred after that for winter wheat, but preceded bean (Fig. 3-2; Meek et al.,1994).

3-22
Nitrogen harvest indexNitrogen harvest index ranged from 0.79 to 0.85 at maximum yield in three locations
North Carolina (Overman et al., 1994) with the lower NHI occurring at the location that wasprovided with supplemental irrigation. Olson and Sander (1988) reported 68% of the total N inthe grain in Nebraska, while Kessavalou and Walters (1997) later reported 63% with 0.0197 kgN accumulation/kg grain and 80% was observed in a soybean rotation (Maskina et al., 1993).Nitrogen harvest indices increased with fertilization and varied among soil types in Wisconsin,ranging from 0.47 to 0.64 (Oberle and Keeney, 1990).
Rooting depth.Corn root morphology is affected by numerous cultural, environmental and genetic
factors (Olson and Sander, 1988). Residual soil nitrate has been used by corn to a depth of 180cm (Gass et al., 1971), although effective corn rooting depths in irrigated cropping of centralWashington is thought to be considerably less, perhaps as shallow as 30 to 60 cm (M.Hammond,personal communication). Corn roots were mainly observed in the surface 20 cm A horizon of aNorth Carolina soil, with fewer roots measured in the 30 to 60 cm B horizon (Durieux et al.,1994). Increasing N fertilization increased the proportion of roots found in the A horizon. Highbulk density and soil compaction can increase the proportion of shallow roots (Vepraskas andWagger, 1990; Wolfe et al., 1995). Subsoiling allowed roots of dryland corn to extract waterfrom 2.7 m (Eck and Winter, 1992). Corn roots were detected to depths of 75 cm in southeasternMinnesota (Nickel et al., 1995) and in Indiana (Kuchenbuch and Barber, 1987).
Washington State University guidelinesRecommendations for sweet corn management for Central and Western Washington have
not been updated since the 1970's. In Western Washington, severe N leaching conditions limitsthe utility of preplant soil test N assays for providing a basis for making N recommendations. Incontrast, N recommendations in the arid Columbia Basin have been based on soil test N levelsfor over 20 years. Turner et al. (1976) recommended that 75 to 120 lb N/acre be applied to sweetcorn in Western Washington. An application of 120 lb N/acre (70 at plowdown and 50 atplanting) was recommended when following the incorporation of grass sod, or grain straw orstover; only 90 lb N/acre (40 at plowdown and 50 at planting) was recommended when the strawor stover was removed; 75 lb N/acre (35 at plowdown, 40 at seeding) when following cultivatedcrops. Dow et al. (1970b; 1979a) recommended rates of 0 to 240 lb N/acre for irrigated sweetcorn, silage or grain corn in Central Washington, depending on the spring soil test N level andprevious crop. A 40 lb N/acre credit is given to previous legume crops that were harvested, and

3-23
80 lb N/acre for legume green manure crops. Soil sampling was recommended to the cornrooting depth, which has not been well defined for this region. Kuo (1985) demonstrated thebenefit of sidedressing N in seasons with high leaching potential in Western Washington.
Implications of literature review for N management of corn in Washington.Although there is only limited data on N uptake and N responses to corn in Washington,
the consistent data observed in the literature suggests that a UNU value of 0.020 kg N/kg graincould be initially applied to Washington corn production, and that fertilizer recoveries ofapproximately 50% could be expected. Total N uptake would be expected to be roughly 200 lbN/A for a 200 bu crop. At 50% N uptake efficiency, an N supply of 400 lb N/A is required fromfertilizer, residual soil N, N mineralization, and N in irrigation water, to achieve 200 bu/A grainyield. If N management practices such as split N applications, slow release N fertilizers, andgood water management could improve N uptake efficiency to 60%, this reduces the N supplyrequirement to 333 lb N/A. In view of the relatively consistent N use efficiency values observedin the corn literature, it appears there is good probability that an N budgeting based Nrecommendation procedure could be developed and verified with field experimentation for corngrown in the Columbia Basin, similar to that available for dryland soft white winter wheat. Fieldresearch is needed to define the rooting depths of corn grown in Washington to define theappropriate soil zone of water and N management, and for soil testing purposes to indicate thedepth of soil sampling.
A typical UNU can be developed for silage corn by multiplying the average UNU forgrain corn (0.020) by the average NHI (0.60), yielding a value of roughly 0.013 kg N/kg silage.Silage corn grown in Western Washington will require multiple N applications to optimize Nuptake efficiency due to frequent in-season precipitation. Pre-plant soil testing is less helpful inthis environment due to susceptibility of residual nitrate to early season leaching. Crop selection(e.g. cover crops) before and after corn production should emphasized nitrate removal andrecycling
Oat (Avena sativa L.)Oat production has been declining somewhat over recent years. In 1995, 32,000 acre of
oats were planted, of which 14,000 ac were harvested. This is down from acreages > 60,000only a few years earlier. The 1995 production value was almost $2 million (Table 3-3).

3-24
Adequate N is necessary for crop growth, but an important disadvantage with high Napplications on oat grown for grain is an increase in the amount of plant lodging (due toexcessive vegetative growth), generally decreasing the grain that can be harvested. In somelocations, milling quality has been found to increase with increased N application, thoughprobably not enough to make it a criteria for choice of N rate (Humphreys et al., 1994).
Total N accumulation and N efficiencies.Two studies that reported both yield and N uptake for oats had UNU average of about
0.24 kg N/kg (Table 3-6). Both studies generally show a slight increase in this value at higher Napplication rates, though in one treatment of Jackson et al. (1994) the opposite trend was noticed.The range in unit N uptake/unit yield for both experiments was 0.015 to 0.033.
Numerous researchers document the positive correlations that exist between N fertilizerapplication and oat yield (whether for grain or forage), including Ghosh (1985), Singh and Singh(1979), Chhillar (1980), Stirling et al. (1981), Brinkman and Rho (1984), Marshall et al. (1987),Jackson et al. (1994). However, at the same time, researchers note that an N fertilizer responsewill only occur where residual soil N is relatively low. For example, Stirling et al. (1981) foundthat oat forage yields responded to N fertilizer only if residual soil NO3-N in the surface 20 cmwas less than 13 ppm (about 39 kg/ha). Anderson and McLean (1989) found only limitedresponse to applied N (0-120 kg N/ha), and note that seeding rate and sowing date also affectedyield. Other researchers also note the role of non-fertilizer agronomic factors in determining oat
Table 3-6. Summary of N accumulation values reported in the literature for oat.CulturalPractices
Total N uptake†
Location Soil Mean Range NHI‡ UNU§ FNR¶ Reference
kg N/ha kg N/ha Kg N/kg %
Montana Aridic Argiboroll,Typic Argiboroll,
orAridic Haploboroll
5 site-years (3 locations) 55 13 to 115 - 0.023 - Jackson et al.(1994)
Iowa Typic Haplaquoll mean of 480 genotypes - - 0.63 - - Kairudin and Frey(1988)
India, Varanasi low OM sandy loam var. N timing; 0 to 90 kg N/ha 62 34 to 85 0.59 0.025 - Singh and Singh(1979)
† Total N uptake = total plant N (harvested plant part + other above ground plant parts, not including roots).‡ NHI = Nitrogen Harvest Index (grain N/total N uptake)§ UNU=Unit N Uptake = units of N in total plant (except roots) / unit yield. Values shown are the mean of the treatments of that study.¶ FNR = Fertilizer N Recovery = estimated proportion of applied N taken up by the plant. Estimation is based on either FNR or AFNR approachas described in the glossary given in Table 3-1. Values shown for each reference are the mean and range for the various treatments of the study.

3-25
yield, including seeding rate (Ahmadi et al., 1988), fertilizer timing (Ahmadi et al., 1988; Readand Jones, 1987), extent of lodging - which is often related to increasing fertilizer rates(Brinkman and Rho, 1984), cultivar (Brinkman and Rho, 1984), and planting date (Read andJones, 1987).
Oat response to residual soil NO3-N has been documented for a fertilized-corn /unfertilized-oat rotation measured over several years in Wisconsin (Vanotti and Bundy, 1994).These researchers found that oat yield and N uptake was positively related to the amount ofresidual soil NO3-N in the surface 90 cm of the soil profile. Residual soil N ranged from about25 kg N/ha where no fertilizer was applied to corn, up to 475 kg N/ha where the corn had 224 kgN/ha applied the previous April. The leaching environment during and after corn planting alsoaffected residual soil N. They developed the following quadratic plateau regression equations toexpress the relationship they observed between oat grain yield (kg/ha) and residual soil NO3-N(kg N/ha, 0-90cm) for each of five years:
1987: yield = 611 + 21.6x - 0.0615x2, Ymax = 2513; R2=0.88**1988: NS (severe drought with very low oat yields)1989: yield = 744 + 28.4x - 0.0828x2, Ymax = 3184; R2=0.62*1990: yield = 1009 + 33.6x - 0.1335x2, Ymax = 3127; R2=0.86**1991: yield = 613 + 29.0x - 0.1228x2; Ymax = 2324; R2=0.88**
where yield = oat yield (kg/ha); x = residual soil N (0-90 cm); Ymax = yield plateau (kg/ha).Ymax for these years was reached at residual NO3-N levels in the surface 90 cm of about 115 kgN/ha. While these equations are of course site specific, they illustrate the type and variety ofpatterns observed over several years.
Guillard and Allinson (1985) document the effect of various previous legume crops andcutting history on subsequent yield and total N uptake of an unfertilized oat crop. They foundthat increasing the cutting interval from 30 to 60 days in the legume crop increased oat biomassand N uptake. This increase was due to greater residual soil N.
Nitrogen harvest index.Nitrogen harvest index in oat generally shows a positive correlation with protein content,
i.e., grain with a higher protein content also tends to have a higher proportion of the plant’s totalN contained in the grain (Fawcett and Frey, 1982; Kairudin and Frey, 1988). Increasing rates ofsoil N tend to decrease the NHI, though total plant protein accumulation increases (Fawcett andFrey, 1982;; Kairudin and Frey, 1988). This decrease in NHI is attributed to a increase in

3-26
vegetative N without a corresponding increase in grain N, or to depressed N uptake at latergrowth stages (McNeal et al., 1968). Kairudin and Frey (1988) found that in low Nenvironments, NHI was negatively correlated with total plant protein, indicating that when soil Nis limited, the grain had priority on the N present in the plant. However, in high N environments(112 kg N/ha applied N, with little residual soil N) NHI and total plant protein were independent,indicating that when N is not limiting N remobilization and translocation within the plant areindependent from N uptake. These results were based on the average of 480 oat lines grown in 0and 112 kg N/ha environments with corresponding average NHI’s of 0.68 and 0.60, and averagetotal plant protein yields of 600 and 700 kg/ha respectively. Singh and Singh (1979) alsomeasured a slight decrease in NHI with increasing fertilizer N, evaluating rates of 0, 30, 60, and90 k N/ha. The overall average NHI for the four rates was 0.59 with a range of 0.56 to 0.60.
Singh and Singh (1979) found that N applications increased moisture use by the plant,but also increased the efficiency of that use. They found that about 10 mm additional moisturewas used for each additional 30 kg N applied (between 0 and 90 kg N/ha), while moisture useefficiency increased by at least 4 kg/mm/ha from 0 to 90 kg N/ha applied. Larsson and Gorny(1988) worked with a variety of new and old cultivars and crosses to assess their relative droughttolerance and the effect of moisture stress on yield. Over all the cultivars tested, yield decreased35% under their imposed drought conditions during early summer, and harvest index decreased18%. In the studies summarized, harvest index ranged from 0.25 up to 0.62, indicating a widevariety in the grain to straw ratio depending on the growing environment.
Root length.Oat root length three weeks after flowering extended to 70 cm where there was a water
table at 80 cm depth (Schuurman, 1980). About 50% of total root weight was in the surface 10cm, with 8-12% present in each subsequent 10 cm increment to a depth of 60 cm. When thewater table was increased to 40 cm below the soil surface, rooting depth was only to about 23cm, with 70% in the 0-10 cm depth.
Some research suggests oat cultivars with greater root length will produce greater yields.Much of this has been conducted by breeders in the context of using seedling root length as anindicator of drought tolerance, invoking the assumption that longer seedling root length wouldcorrespond to greater root length in the field (Larsson and Görny, 1994; Barbour and Murphy,1984). Schwarz et al. (1991), on the other hand, detected no relationship between rootingcharacteristics of 18 genotypes and yield, though they did find a positive relationship for barley.

3-27
Wheat (Triticum aestivum L.) - OverviewIn Washington State, both soft white and hard red wheats are grown. These two classes
are discussed separately in this report since N management differs for the two due to differentyield goals and protein production objectives. Both classes can be grown as either winter orspring crops, adding to the complexity of summarizing N uptake patterns.
In 1995, wheat production was the second highest commodity grown in WashingtonState, second only to apples. Total production for that year was approximately 2.6 million acresworth over $733 million (Table 3-3). Soft white wheat dominated the production, comprisingabout 2.3 of the 2.5 million acres. About 2.25 million acres were planted to winter wheatvarieties, and 0.45 million acres were planted to spring wheat.
Wheat, Soft White (Triticum aestivum L.)Relationship between N recommendations and N use efficiency: an historical perspective.
The basic framework for N recommendations for dryland wheat systems in the PacificNorthwest were also established in the 1950's and 1960's (Jackson et al., 1952; Jacquot, 1953;Leggett, 1959; Reisenauer and Leggett, 1957); Leggett and Nelson, 1960), with subsequentminor updates and adjustments resulting in the current regional recommendations (Engle et al.,1975; Halvorson et al., 1986). The conceptual basis for making N recommendations wasfounded on experimental determinations of N use efficiencies, which in turn were affected by Nuptake efficiencies. In eastern Washington, the rule of thumb is that there are approximately1.35 lb N accumulated for every bushel of soft white wheat produced, and that with a 50% Nuptake efficiency, 2.70 lb N must be supplied to grow a bushel of wheat.
Site selection for the early N trials that established these recommendations varied byresearcher. Jacquot (1953) established strip trials transecting typical fields and sampled sitescorresponding to different slope positions; however, the data he reported was averaged over theentire field location. Nevertheless, within-field variations in N responses were integrated intothe overall N recommendations generated from this research. More typically, researchersselected sites of uniform soil and topography, to represent large areas of land in the immediatevicinity (Leggett and Nelson, 1960; F. E. Koehler, personal communication). These early studiesdemonstrated that residual nitrate, in-season N mineralization, and N immobilization due to highC:N straw residues altered wheat responses to N fertilization (Leggett and Nelson, 1960).Calculations for predicting N requirements for winter wheat were based on yield potential, theamount of N supply required per unit yield (UNR; unit N requirement), and the soil N supply.

3-28
It was recognized in these early studies that yield potential was strongly related toavailable soil moisture in eastern Washington. Wheat yields were therefore predicted for regionalrainfall zones between 10 and 22" annual precipitation. For example Jacquot (1953) establisheda basic model for predicting yield based on water and N, providing that other growth factorswere not limiting:
available soil moisture + nitrogen uptake = wheat yield (1 acre-inch) (7 lb) (3.5 bu)
It was also observed that the N supply requirement was in excess of the 2.0 lb plantN/bushel, to account for N efficiencies in the system, resulting in recommendations of 2.7 to 3.2lb fertilizer N/bushel. Jacquot also acknowledged that the N fertilizer requirement was subject tochange, based on residual nitrate and soil N mineralization/immobilization rates.
A few years later, this relationship was refined by Leggett (1959), who suggested that 4inches of available moisture were required to establish the crop, and each additional inch ofmoisture produced 6 bushels of wheat. By plotting the maximum yield vs. soil nitrate + fertilizerN over several site-years throughout eastern Washington, a general UNR of 2.9 lb N/bu wasderived for growing region. Further refinements produced our current recommendations basedon 6 bu/inch available water and 2.7 lb N supply/bu wheat (Engle et al., 1975; Halvorson et al.,1986), in which:
Ns = Gw X Ns/GwN supply requirement = potential yield x UNR
and N supply is calculated as:
N supply = residual inorganic soil N in root profile + mineralizable N + fertilizer N- N immobilization by high C:N crop residues.
The current recommendations continue to be based on regional variations in yieldpotential, soil N availability and average UNR. Site-specific variation in UNR, Nmineralization, and residual nitrate had not been evaluated in these early studies. As a result, Nrecommendations were and continue to be location-specific (Halvorson, 1986; Engle et al.,1975), but not site-specific within single fields.
More recently, field experiments have been conducted to examine the potential benefitsand constraints of variable N management (Mulla et al., 1992; Fiez et al., 1994a). This approach

3-29
has the potential for lowering input costs while maintaining yield and improving grain quality,but the yield response to N fertilizer and the N use efficiency components have been shown towidely vary across landscapes (Fiez et al., 1995; 1994b), resulting in quantitative changes in Nrecommendation factors. The UNR varied by 24 to 70% within four fields in easternWashington, illustrating the difficulties in applying current N fertilizer recommendationguidelines on a site-specific basis. The current guidelines assume the UNR to be 2.7 lb N/bu. Asoil fertility case analysis suggested that site-specific information on yield potential, UNR,residual soil N, and N mineralization are required to accurately predict preplant N fertilizerrequirements for winter wheat (Fiez et al., 1994a,b). Variation in UNR across fields results fromvariation in soil and plant factors affecting N use efficiency (Fiez et al., 1995). Nevertheless infields with past history of uniform N fertilization where a buildup of residual soil N has occurredon low yielding sites, application of current recommendation guidelines on a site-specific basiscan reduce N fertilizer requirements while maintaining grain yield and improving grain quality(Mulla et al., 1992).
Nitrogen accumulation and efficiencies.Recent research studies in eastern Washington have demonstrated tremendous N
accumulation potential of soft white winter wheat. This crop is capable of storing N in the grainas protein, so that N continues to accumulate in the plant as N is supplied above and beyond thatrequired for maximum grain yield production (Fiez et al., 1995; Sowers et al., 1994). Total plantN (above-ground only) ranged from 90 to 250 kg N/ha depending on N fertilizer timing, N rateand landscape position.
The units of plant N accumulation per unit yield varied among landscape position from0.020 to 0.031, with an average of 0.024 (Fiez et al., 1995). The majority of N uptake occursbetween the tillering and boot stages of development, with most of the plant N derived from soilN sources (Fig. 3-3; Sowers et al., 1994). Thus, the accelerated phase of N uptake occurs earlierthan that for spring crops such as corn and bean (Meek et al., 1994). A wheat model developedby Rickman et al. (1996) predicts N accumulation to occur between 500 and 1000 growingdegree days. Labeled fertilizer studies demonstrated that only 25 to 33% of the total plant N maybe derived from fertilizer applied in the current growing season, and that spring N applicationscan improve fertilizer N recovery and grain productivity in the annual cropping zone of easternWashington and northern Idaho (Fig. 3-3; Sowers et al., 1994; Mahler et al., 1994). There islittle additional N accumulation that occurs after anthesis (Sowers et al., 1994), unless N isapplied in suboptimal rates (Koehler, 1960).

3-30
Nitrogen uptake efficiency varies by landscape position in the Palouse, presumablybecause of different magnitudes of N loss that occur across the rolling topography (Fiez et al.,1995). While 2.7 lb N/bu (0.045 kg N supply/kg grain) wheat is a reasonable estimate of Nsupply (UNR) required for winter wheat across the region, within field variations in this figurehave ranged from 1.8 (0.03 kg N/kg grain) to 3.9 (0.065 kg N/kg grain). The UNR can bereduced with split N applications in the annual cropping zone (Sowers et al., 1994). Fertilizerplacement can significantly improve N uptake recovery compared to broadcast applications(Janzen et al., 1991).

3-31
Table 3-7. Summary of N accumulation values reported in selected research reports.
CulturalPractices
Total N uptake†
Location Soil Range Mean NHI‡ UNU§ FNR¶ Referencekg N/ha kg N/ha kg N/kg %
Soft White Winter Wheat
Moscow, ID Xeric Argialboll placement x timingx source
---- ---- ---- ---- (NPE)44 to 60
Mahler et al.,1994
Pullman &Farmington, WA
Ultic Haploxerolls placement x timing 125 to 250 190 0.70 to 0.74 ---- (FNR)18 to 33
Sowers et al.,1994
Pullman &Farmington, WA
Ultic Haploxerolls landscape positions 90 to 240 130 to 250@ Ymax
---- 0.020 to 0.031 (NPE)38 to 70
Fiez et al., 1995
Hard Red Winter Wheat
Perkins, OK Udic Argiustoll pre or in-seasondryland
35 to 98 (all)56 to 86 (Ymax)
71 (avg.)80 (Ymax)
0.74 (avg.) 0.69 (Ymax)
0.030 (avg.)0.032 (Ymax)
(AFNR ) 46 avg49@Ymax
Boman et al.,1995
Lethbridge, Alberta sandy clay loam timing x point inj.(pi), broadcast (bc),
or band (bd)
----- ---- ---- ---- FNR: 40 bd;30 to 35 bc; 20 to
60 (spring pi)
Janzen et al., 1991
Manhattan, KS Typic Argiudoll dryland 87 to 129 110 0.66 (fert. NHI) ---- FNR: 44 to 57
Saxmundham andWoburn, UK
sandy cl loamsandy loam
spring Napplications
23 (no N) to229 (fert N)
NA ---- ---- FNR: 46 to 85
El Reno, OK Udertic Paleustolls conv. vs. no-till 91 to 189 151 0.51 to 0.65 0.036 to 0.048 AFNR: 63 to 111
Rao and Dao,1996
Hard Red Spring Wheat
Davis, CA Typic Xerorthent irrigated 50 to 200 120 avg200@Ymax
----- 0.025@no Nto
0.028@Ymax
---- Cassman andPlant, 1992
Pullman, WA Typic Hapluxeroll dryland, fall orspring N comb.
80 to 105 98 0.77 to 0.84 0.029 to 0.0380.033@opt N
(NPE)54 to 68
Huggins et al.,1989a
Davis, CA Typic Xerorthent irrigated, preplant +anthesis N
140 to 255 210 avg;219@Yma
x
0.66 to 0.790.74 avg
0.024 to 0.0360.031@Ymax
anthesis N: AFNR:37 to 116
FNR: 50 to 80
Wuest andCassman, 1992
Sidney, MT Typic Argiboroll dryland, broadcastor band
56 to 69 66 0.75 to 0.77 0.033 to 0.0380.035 at opt. N
(AFNR) 16 to 29
Jacobsen et al.,1993
† Total N uptake = total plant N (harvested plant part + other above ground plant parts, not including roots).‡ NHI = Nitrogen Harvest Index (grain N/total N uptake)§ UNU=Unit N Uptake = units of N in total plant (except roots) / unit yield. Values shown are the mean of the treatments of that study.¶ FNR = Fertilizer N Recovery = estimated proportion of applied N taken up by the plant. Estimation is based on either FNR or AFNR approach as described in Table 3-1 Values shown for eachreference are the mean and range for the various treatments of the study. NPE = N uptake efficiency, given where available.

3-32
Nitrogen harvest index.The proportion of above-ground N that is partitioned to the grain has been observed to
range from 0.70 to 0.74 in soft white wheat grown in Eastern Washington (Sowers, 1992). Notethat this is a slightly lower proportion compared to the hard red wheats, since the hard wheatsaccumulate more protein in the grain. However, in drier climates of eastern Washington, SWWhas been observed to have higher NHI of 0.77 (Rasmussen and Rhodes, 1991).
Rooting depths.Roots of soft white winter wheat have been detected to a depth of 150 cm in eastern
Washington (Sowers, 1992), and plant depletion of soil water and nitrate over the growingseason confirmed that roots were active to that depth. Soil water depletion at Lind, WAsuggested that soft white winter wheat roots were active to at least 90 cm (Mohammad, 1993).Nitrate removal was noted to a depth of 120 cm under soft white winter wheat (Morton, 1976).
Implications of literature review for N management of soft white wheat in Washington.Since the PNW specializes in growing and marketing soft white winter wheat, most of
the N literature data was generated at WSU. Recent N experiments verified the relevance ofhistorical data and approaches to N budgeting and N management. High yielding soft whitewinter wheat is capable of accumulating in excess of 200 kg N/ha, much of which is derivedfrom soil N sources, allowing N applications of less than 125 kg N/ha. Average values of UNUof 0.20 to 0.025 result in UNR values from 0.040 to 0.050.
Figure 3-3. Increased fertilizer N recovery with split applications of N on soft whitewheat near Pullman, WA (Sowers et al., 1994).

3-33
Washington State University guidelines.The nitrogen budgeting calculation described in section 3.2 provides the basis for N
fertilizer recommendations for both hard red and soft white wheats (FG-34, Engle et al., 1975).The UNR value recommended for soft white wheat is 2.7 lb N/bu and 3.0 for the hard wheats.However, Huggins and Pan (1989) suggested that an UNR of 3.5 lb N/bu is required forproducing hard red spring wheat with 14% protein. Applications can also be based on soil testnitrate levels (EM4264, Halvorson, 1977; Halvorson et al., 1986; EB1487, Stevens et al., 1988).Banding N fertilizer below or to the side of the seed row is essential for maximizing grainproduction in no-till systems (PNW283; Veseth et al., 1986).
Wheat, Hard red (Triticum aestivum L.)Total crop N accumulation.
In general, since the grain protein requirement for hard red spring wheat is higher (>14%protein) compared to the soft white wheats (8 to 10% protein), about 30% more N supply isrequired per bushel to produce good quality grain of hard red spring wheat. Approximately 3.5 lbN supply/bu (0.058 kg N supply/kg grain) should be supplied from soil or fertilizer sources toachieve these protein goals at maximum yield (Huggins, 1991). Due to the lower yield potentialsof hard red spring wheat, total N accumulation is generally lower than soft white winter wheat, inthe range of 125 to 248 kg N/ha of well fertilized, moderate to high yielding hard red springwheat (Huggins, 1991; Koenig, 1993; Cassman and Plant, 1992), and 0.031 to 0.071 kg plantN/kg yield. Most rapid plant N accumulation in HRS occurs before anthesis under drylandconditions, although some N accumulation continues during grain filling (Huggins, 1991).Under irrigated conditions with yields >5500 kg/ha, total plant N ranged from 140 to 255 kgN/ha at 0.024 to 0.035 kg N/kg grain (Wuest and Cassman, 1992a and b). Under low yieldingconditions (<2000 kg/ha yield), HRS accumulated less than 70 kg N/ha (Jacobsen et al., 1993).Hard red winter wheat has been observed to accumulate 100 to 200 kg N/ha, at 0.038 to 0.048 kgplant N/kg grain (Rao and Dao, 1996). Lower values were observed in Oklahoma when Nfertilizer was applied in split applications under dryland conditions: 0.022 to 0.025 (Boman et al.,1995). In the UK, total N accumulation of fertilized HRW ranged from 121 to 229 kg N/ha, andrecovery of spring applied, labeled N ranged from 46 to 87 % of the spring application rate(Powlson et al, 1992). Percentage of N lost was correlated to the amount of rainfall. Similarimprovements in N response to spring N applications were noted in Colorado (Vaughn et al.,1990).

3-34
Late season N accumulation may require good availability of N in the lower root profile,as evidenced by the improved grain protein production when N applications are split between falland spring (Huggins et al., 1989b). Moderate fall fertilization will improve deep N availabilityby allowing for nitrate movement into the lower root depths where late season soil moisture isavailable. In some dryland situations such as in eastern Washington during a winter with mildprecipitation, N uptake efficiencies can be improved with fall applications prior to springplanting, due to better positional availability of that N during the growing season.
Nitrogen uptake efficiencies of HRS have been observed to range between 0.54 to 0.84,with the efficiencies tending toward the lower part of that range at maximum yield (Huggins,1991; Koenig, 1993). Apparent N fertilizer recovery efficiencies ranged from 20 to 34% inirrigated hard red winter wheat in South Carolina (Karlen et al., 1996); however under drylandconditions, it has been demonstrated that hard red winter wheat can serve as an efficient bufferwhen excess N is applied, whereby fertilizer application of 25 kg N/ha in excess of that requiredfor maximum yield is accumulated in the plant tissue, preventing soil N buildup (Raun andJohnson, 1995; Johnson and Raun, 1995). A greater proportion of fertilizer N was recoveredfrom spring vs. fall N applications, and residual soil N contributed a major portion of the total Naccumulated by HRW (Olson et al, 1979).
Nitrogen harvest index.Nitrogen harvest index of hard red spring wheat has ranged from 0.70 to 0.83 in Eastern
Washington (Huggins, 1991; Koenig, 1993), while others report different ranges for differentregions, e.g. 0.82 to 0.85 in Montana (McNeal et al., 1971), 0.38 to 0.78 in North Dakota (Bauer,1980), and 0.32 to 0.65 in Minnesota (Loffler et al., 1985). Under irrigated conditions inCalifornia, NHI ranged from 0.62 to 0.80 with preplant N rate and variety (Wuest and Cassman,1992a). Hard red winter wheat has an NHI of 0.51 to 0.64 in Oklahoma under drylandconditions (Rao and Dao, 1996).
Rooting depth.Roots of hard red spring wheat have been observed to depths of 90 to 120 cm by the boot
stage (Gao, 1995; Pan, unpublished data). In contrast, rooting depth of hard red winter wheat hasbeen observed to 2 m when deep soil profiles are available (Worzella, 1932), or much shallowerwhen roots are restricted by chemical or physical factors (Incerti and Leary, 1990). Rhizotronobservations documented HRW roots to 120 cm (Merrill et al., 1994). Hard red winter wheatgrown in the UK removed mineral N to a depth of at least 1.5 m (Addiscott and Darby, 1991).

3-35
Buildup of residual soil N.Wheat has some capacity to buffer against excessive N application rates relative to that
required for optimum grain yield by accumulating additional N and storing it as protein (Raunand Johnson, 1995). As a result applications of up to 25 kg N/ha in excess of the optimal ratemay not result in additional residual soil N. However, several studies have shown that higher,excessive N application rates will increase residual soil N that is susceptible to nitrate leaching(Alessi et al., 1979; Chaney, 1990).
Implications of literature review for N management of hard red wheat in Washington.Both spring and winter hard red wheats have been shown to have the capacity to
accumulate over 200 kg N/ha in grain and straw. The higher protein accumulation in thesewheats results in greater N removal (NHI can be expected to range from 0.70 to 0.80), therebyrequiring greater N inputs to replenish the cropping system. Unit N uptake values range from0.028 to 0.036 for well fertilized red wheat crops, and N fertilizer recovery efficiencies can beexpected to range from 50% to 70% unless residual soil N is high, which will contribute greatlyto the plant N accumulation, but will reduce fertilizer N recoveries. Higher efficiencies may beachieved with small in-season inputs between tillering to anthesis, provided there is ample soilmoisture and residual N levels are not excessive. N uptake efficiencies can be maintained with25 to 40 kg N/ha applied in excess of that required for maximum yield, due to the capacity forprotein storage in the red wheats. Rooting depths range from 120 to 180 cm, and optimal proteinproduction requires N distribution throughout the root profile in dryland situations. This mayrequire fall N fertilization in low leaching environments of eastern Washington when residual Nis low and deep N is required to sustain grain protein production.
3.2.2 LEGUME CROPSLegumes have the ability to promote the microbial fixation of N2 gas into mineral N
forms that plants can incorporate into organic N compounds. Legumes form symbioticrelationships with members of either Rhizobium or Bradyrhizobium. The symbiosis takes placeinside nodules that are formed in association with the plant roots, and can only take place if thebacteria are present - either naturally or through inoculation. Legumes are also able to usemineral N found in soil in the same manner as other plant species. A number of studies haveshown that the addition of N fertilizers to legume crops can decrease the amount of N2-fixation,causing the plant to take up more N from soil. However, it has also been noted that a certainlevel of N2-fixation continues to occur in the presence of high rates of N fertilization, raising thequestion of how much excess N is available for leaching in legume systems treated withprocessed water and manures.

3-36
Several studies have been conducted to determine whether the addition of N to legumescan aid in establishment of the crop, ultimately leading toward increased yields. Most studiesaddressing the N content of legumes have been oriented toward maximizing the amount of N2
fixation in order to increase yields and/or N content of the harvested beans. This is in contrast tothe purpose of this report - namely to address N uptake in the context of an N disposal problem.As responsible manure disposal receives increasing attention, recent and current studies addressthis issue more directly. However, in general, there are relatively few studies documenting theeffect of N addition on the total N balance in a field situation.
The major legume crops grown in Washington State are alfalfa (Medicago sativa L.);bean (Phaseolus vulgaris L.), especially dry bean; and pea (Pisum sativum L.) as dry, seed, andprocessing pea. Alfalfa is grown primarily as a forage crop (with some acreage planted to harvestalfalfa seed) but is included in this section rather than the forage or seed sections because of itsN2-fixation capability.

3-37
Table 3-8. Summary of N accumulation values reported in the literature for legume crops.CulturalPractices
Total N uptake†
Location Soil Mean Range UNU§ FNR¶ Referencekg N/ha kg N/ha kg N/kg %
ALFALFA
Glasshouse 50/50 mix: silt loam & sand 0N, NH4-N, and NO3-N 9.85 mg/plant 4.4 to 17.2mg/plant 0.056 41 (16 to 62) Barber et al. (1996)
Corvallis, Montana Typic Argiboroll field, no added N, 3cuts 178 - 0.028 none applied Westcott et al. (1995)
Kalispell, Montana Pachic Haploxerol field, no added N, 3cuts 216 - 0.032 none applied Westcott et al. (1995)
Pennsylvania field, no added N 266 179 to 319 0.032 none applied Sollenberger et al. (1984)
Minnesota Typic Hapludoll field, 0 to 840 kg N/ha 682 617 to 746 0.039 - Lamb et al. (1995)
Review article approx - Field 510 - 0.028 - Olson and Kurtz (1982)
Standard value formodel
- - - - 0.031 - Hermanson et al. (1995)
BEAN
Southern Idaho Xerollic Calciorthid field,, 0 to 168 kg N/ha 165 112 to 208 0.058 37 (8 to 53) Westermann et al. (1981)
Hawaii Humoxic Tropohumult field, 9 to 120 kg N/ha 152 142 to 170 - 38 (24 to 51) George and Singleton (1992)
DRY PEA
Australia red clay loams Straw, dryland and irrigated trts. 94 70 to 134 - - Evans et al. (1997)
Pullman, WA - avg. of 3 landscape positions 128 75 to 210 - - LaRue and Patternson (1981)
Denmark perlite Grown in pots - - - - Jensen (1996)
Standard value formodel
- - - - 0.022 - Hermanson et al. (1995)
NE Oregon Typic Haploxeroll field, no added N, irr vs. nonirr. 162 97 to 228 0.17 (dry wt) - Rasmussen and Pumphrey (1977)† Total N uptake = total plant N (harvested plant part + other above ground plant parts, not including roots).§ UNU=Unit N Uptake = units of N in total plant (except roots) / unit yield. Values shown are the mean of the treatments of that study.¶ FNR = Fertilizer N Recovery = estimated proportion of applied N taken up by the plant. Estimation is based on either FNR or AFNR approach as described in the glossary given in Table 3-1. Valuesshown for each reference are the mean and range for the various treatments of the study.

3-38
Alfalfa (Medicago sativa L.)Alfalfa represented 66% of Washington’s hay acreage in 1995, with a corresponding
production value of $326 million. Total hay production was ranked 7th of Washington’sagricultural commodities. Alfalfa seed production is ranked 32 in this list. In 1995, Washingtonwas first in the nation for production of both dry edible peas and wrinkled seed peas, and 8th forproduction of dry edible beans. Corresponding acreages were 95,000 ac (dry edible pea) and41,000 ac (dry edible bean), with production values of $18.5 million and $20 millionrespectively.
Nitrogen accumulation.Total aboveground N accumulations ranged from 178 to 216 kg N/ha were measured in a
conventional three-cut system with annual alfalfa ('Nitro') in western Montana (Westcott et al.,1995). Corresponding dry matter accumulations were 6.4 and 6.8 Mg/ha. Their results foundthat an average of about 0.03 kg N were required to produce 1 kg yield. In their review article,Olson and Kurtz (1982) cite total N uptake (and removal) of 510 kg N/ha under a ‘good yield’,which they present as 18,000 kg/ha. The corresponding UNU for this system is 0.028 kg/kg N.
Average UNU for all studies summarized in this report is 0.034 kg/kg N. Reportedannual N accumulations range from 178 to 510 kg N/ha.
Figure 3-4. Patterns in N concentrations in the variousplant parts of alfalfa following harvest. From Barber et al.(1996).
Change in Alfalfa N concentration
Days after cut (days)0 5 10 15 20 25 30
N c
once
ntra
tion
(mg/
kg)
10
15
20
25
30
35
40
45
50
Shoot
Root
Crown

3-39
Seasonal distribution. Unlike most other crops summarized in this report, alfalfa is a perennial crop that can be
cut and harvested several times during the growing season. Nitrogen uptake and concentrationsin various plant parts depends on stage of development, as well as nitrogen fertility, cultivar, andenvironmental conditions. Barber et al. (1996) evaluated patterns of N accumulation in alfalfafollowing cutting. They found that whether fertilizer N is added or not, the majority of N iscontained in the shoots during regrowth, with much lower concentrations in unharvested parts(roots and crowns). Shoot N concentrations decline while root N concentrations tend to increaseas growth continues, but shoot N concentration always remains higher than that of theunharvested parts. While the patterns over the season for different N application treatments aresomewhat similar, Barber et al. (1996) found that N concentrations were generally higher in allplant parts when N was applied compared to 0 N control plants, and found that NO3-N was morereadily assimilated into plant tissue than NH4-N. Huang et al. (1996) found that substantiallymore N was contained in alfalfa at late season harvest dates, with 99, 138 and 161 kg N/ha atsampling dates in June, August, and October, respectively.
A number of studies have shown that the addition of N fertilizers to legume crops can decreasethe amount of N2-fixation, causing the plant to take up more N from soil. However, it has alsobeen noted that a certain level of N2-fixation continues to occur in the presence of high rates of Nfertilization, raising the question of how much excess N is available for leaching in legumesystems treated with processed water and manures. Of particular concern is the potential for rootturnover and subsequent mineralization after shoot cuttings. These systems should be monitoredto ensure that N leaching is minimized.
Role of N2 fixation.Nitrogen fixation accounts for varying proportions of total N uptake in alfalfa. Heichel et
al. (1981) found that 43% of harvested N in alfalfa came from N2 fixation. This corresponded to148 kg N/ha. In other long-term studies, annual average N2 fixation ranged from 212 to 290 kgN/ha. Several studies have found that N application (300 lb/ac) to this N2-fixing crop oftenincreased yield and nitrogen concentration, especially at the second cutting. Vandecaveye andBond (1936) tabulate yields and N concentrations for a variety of soil types and fertilizertreatments in both eastern and western Washington. They found that yields always increasedwith the addition of inorganic N, while plant N concentration sometimes increased andsometimes decreased. More recently, Teuber et al. (1991) found that applications of N up to 100kg N/ha resulted in higher dry matter yields - an average (over 4 locations and 2 years) of 115%

3-40
higher at the 100 kg N/ha rate compared to no N fertilizer. Plant nitrogen concentration alsoincreased significantly (p<0.05) to 36.7 g/kg from 35.8 g/kg. Cherney and Duxbury (1994),working in growth chambers, found that adding increasing amounts of 15N-labeled inorganic N(NH4NO3) to alfalfa after the first cutting resulted in linear increases in herbage weight and Nconcentration, and consistently lower N2 fixation in all eight alfalfa germplasms evaluated. Itappeared that at the higher N rates, the nodules were non-functional. Using non-nodulatingstrains of alfalfa as non-fixing controls, Lamb et al. (1995) also found significant decreases in N2
fixation as fertilizer N increased. However they did not find similar yield increases due toincreasing fertilizer N, and they observed that some N2 fixation did occur even at very annualhigh N application rates - with 20 to 25% of the plant N coming from fixation at the 840 kg N/harate. Their study was summarized over two years, and they suggest that the yield benefits fromadding N to alfalfa probably do not extend beyond the first or second cutting.
Rooting depthAlfalfa is generally considered a deep rooting crop, and has a tap root. Huang et al.
(1996) found that alfalfa was able to recover 40% of 15N (20 kg N/ha) injected 120 cm below thesoil surface, indicating significant root activity at this depth.
Washington State University guidelinesIn general, N applications to alfalfa are not needed, except when establishing new
seedlings, in which case applying 30 to 40 lb N/ac is suggested under irrigated conditions (Dowet al., 1976). In western Washington, suggested rates for seedling establishment range from 20to 40 lb N/ac, depending on previous crop (Turner et al., 1975). In some cases/regions Nadditions may be needed for established stands. For example, Dow et al. (1976) suggest 60 lbN/ac to increase yields under irrigated conditions. However, additions of N to alfalfa do notnecessarily result in excess N in the profile, since N the amount of N2-fixation will decrease andinorganic N uptake will increase when there is sufficient inorganic N in the profile.
Implications of literature review for N management of alfalfa in WashingtonAlthough alfalfa is a legume that would not require high inputs of N fertilizer for productionpurposes, its deep rooting system and high capacity to accumulate large amounts of N followingthe multiple cuttings over the course of a growing season make it a good crop for recovering Nfrom processed water.
Bean (Phaseolus vulgaris L.)

3-41
Dry edible beans were 27th of the top 40 commodities grown in Washington in 1995, with41,000 acres harvested worth about $20 million in that year. Washington ranks 8th in the nationfor dry edible bean production. Adams, Franklin, and Grant counties account for about 70% ofthe production. The major bean varieties grown in the state are: small red, pinto, small white,pink, garbanzo, great northern, and black turtle soup beans. Snap beans for processing are alsogrown in the state, though statistics for this crop have been included within the category of‘Other Processing Crops’ in recent years.
N accumulationCommon bean relies less on N2-fixation to meet its N requirement compared to other
legumes grown as crops, such as soybean.(e.g., Westermann et al., 1981). Fertilization with < 50kg N/ha in low-N soils ensured early vigorous plant growth, but did not always increase beanyield. Some cultivars showed a yield increase, others no effect, and others a yield decrease whenfertilized. The data suggest that N uptake by fertilized plants was greater than non-fertilized, butno statistical analysis of N uptake was reported. Fertilizer applications of 45 and 134 kg N/hasignificantly reduced the number and mass of nodules, but did not affect nodule activity duringvegetative and early reproductive stages, suggesting the inhibitory effect of N fertilizer is due toa reduction in nodule formation, and not due to interference of the N2-fixation process.
Large cultivar differences exist with respect to N2 fixation. Westermann and Kolar(1978) working in southern Idaho compared N2 fixation rates in cultivars of pinto, great northern,small white, red Mexican, kidney pink, cranberry, black turtle, brown, and garden white beans.They found five- to six-fold differences in daily N2 fixation activity among the cultivars. Thesedifferences were related to the average nodule weight and to total plant dry weight at maturity.Cultivars with similar plant dry weights had two- to three- fold differences in relative N2-fixationrates.
Biological N2 fixation in the bean cultivar 'Great Northern 1140' accounted for 91 kgN/ha, which was between 60 and 90% of the total plant N accumulation (Kucey, 1989a). In asecond study with the same bean cultivar, Kucey (1989b) found that N2 fixation in nonfertilizedplants averaged about 75% of total N in the plant. Relatively low amounts of applied N (30 mgN /kg soil) had a stimulatory affect on dry matter production, and subsequently higher N contentsand accumulated amounts of N2 fixed. They note that this stimulatory effect of low amounts ofstarter N has been observed in other legume crops as well, without inhibiting N2 fixation. Thislow rate of fertilizer application did not significantly decrease N2 fixation compared tounfertilized plants. However higher fertilization rates (60 or 120 mg N/kg), applied before the

3-42
6th week significantly decreased the N2 fixation proportion of harvest plant N content to as littleas 10 percent. Greatest N uptake and concentration in the plant occurred when fertilizer wasapplied at the 6th week after planting - with plant concentrations ranging from 17.3 to 42.1 mgN/kg. They determined that dry matter production of both pods and stover was affected by ratebut not timing of fertilizer N additions.
Rennie and Kemp (1983) observed aboveground N uptake ranged from 100 to 184 kgN/ha (depending on cultivar and rate of fertilization (10 or 40 kg N/ha)). At the lower Napplication rate, an average of 51.8% of plant N was derived from N2 fixation (range 40 to 125kg N/ha). At the higher N application rate, an average of 40.7% was derived from N2 fixation(range 16-112 kg N/ha). In laboratory studies, these researchers found that the 40 kg /ha ratedecreased N2 fixation in most cultivars about 10% compared to conditions with no addedfertilizer. One cultivar showed no decrease in fixed N, while another showed a 60% reduction.They also noted that there appeared to be a difference in the time period of N2 fixation amongcultivars.
Smith and Hume (1985) also found that fertilizer N application increased total N uptakeby 10 to 20% (despite lowered N2 fixation, nodulation and nodule activity), but without acorresponding yield increase. In addition they found that water availability also affected N2
fixation, as N2 fixation, nodulation and nodule activity were increased by irrigation. Rennie andKemp (1984) found that climatic conditions affected the proportion of plant N requirements metby N2-fixation. In the first year, the plants averaged 72% of N form N2 fixation, while in thesecond year (which was cooler) only 54% of plant N uptake came from N2-fixation.
George and Singleton (1992) found that common bean accumulated 142 to 170 kg N/hadepending on elevation and fertilizer rate (9 or 120 kg N/ha). Bean N accumulation wasincreased to about 190 kg n/ha when excessive fertilizer (900 kg N/ha) was applied. Fertilizer Nrecoveries (using 15N) for common bean at maturity ranged from 24 to 29% at a relatively lowelevation on Hawaii (320 m), and a range of 50 to 51% at higher elevations for 9 and 120 kgN/ha rates. The difference in recovery was attributed to temperature differences at the twoelevations. The range of N applications used to generate these efficiencies did not generallyaffect aboveground biomass, indicating that there were differences in the relative amounts of N2
fixation among the fertilizer rates.
Westermann et al. (1981) estimated that the (non-fertilized) common bean cultivars theyevaluated in southern Idaho absorbed 82% of the soil N present (initial inorganic N plus

3-43
mineralized N). In studies of fertilizer uptake at application rates of 56 and 168 kg N ha-1 using15N, these researchers found apparent N fertilizer uptake recoveries was cultivar-dependent, withAFNR of 7.5 to 7.9% for one cultivar (UI-1140), while the second cultivar ('Viva') had AFNRvalues of 28 and 33% for the respective fertilizer rates.
Seasonal distribution.Typical seasonal patterns in dry matter accumulation, N concentration, and N uptake in
field bean can be seen in data from Kucey (1989a, Table 3-9). Vegetative biomass increasesrapidly before the onset of pod development, then growth rates slow or cease as the beans cometo maturity. Total N uptake increases over the season, however N concentration of both strawand pods decreases over the season as carbon accumulates at a faster rate. Calculations based onthe 15N dilution methods indicate that early in the season, N2 fixation is slow and the plants relyon soil N to get established. Later in the season N2 fixation becomes more important. Figure 3-5demonstrates this pattern for Great Northern '1140' in Alberta, Canada. Several authors havefound that supplying N fertilizer during early growth stages decreases the contribution of N2
fixation to total bean N content at maturity (cited by Kucey 1989a). Rennie and Kemp (1984)showed that N2-fixation generally increases over the course of the season, while N from soil andfertilizer generally decreased after the V3 stage. N derived from fertilizer was always muchlower than the other sources of N after V3. Westermann and Kolar (1978) report similarfindings, however once podfilling started, the rate of N2 fixation decreased to zero byphysiologic maturity.

3-44
Table 3-9. Patterns in dry matter production, N concentration, and N accumulation for dryedible bean (cv. Great Northern 1140) over the growing season under field conditions inAlberta, Canada
Weeksafter
emergence
Dry matter (kg/ha) N concentration (%) N accumulation (kg/ha)
Straw Pods Straw Pods Straw Pods
4 121 - 4.09 - 5 -6 492 - 4.01 - 20 -8 1805 20 2.82 4.68 50 1
10 2379 517 2.47 3.48 58 1812 2416 1652 2.14 2.81 52 4614 2421 3422 1.64 2.71 40 13316 2269 3339 1.40 2.64 32 121
Kucey's (1989b) study of N2 fixation patterns found that while N contents continued toincrease throughout the growing period, the rate of accumulation of both fixed and total plant Ndecreased 6-8 weeks after planting. The relative proportion of total N coming from N2 fixationdeclined after 6 weeks. Therefore the most important period for N2 fixation is the first 4-6 weeksafter planting. In work with non-fertilized plants, Westermann et al. (1981) found N uptakeincreased linearly from early pod formation through physiologic maturity.
Figure 3-5. Source of N in GN 1140 beanover the growing season. From Kucey(1989b)
Sources of Bean (GN 1140) N Over Time
Plant Age (weeks)2 4 6 8 10 12 14 16 18
Nitr
ogen
upt
ake
(kg
N/h
a)0
20
40
60
80
100
120
140From soilFrom fertilizerFrom air

3-45
Washington State University guidelinesApplications of N to irrigated field bean is suggested, with recommended rates depending
on the previous crop. Recommended rates range from 40 lb N/ac where the previous crop wascorn or potato, up to 120 lb N/ha on newly tilled land. No N is needed if the previous crop was alegume (Dow and Halvorson, 1980).
Pea (Pisum sativum L.)Washington State produces dry edible and dry wrinkled seed pea, as well as green pea for
processing. According to Washington Agricultural Statistics Service (1996), Washington wasranked firs in the nation for both types of dry pea production, and green peas for processing isthe 26th highest commodity in the state. In 1995, 95,000 ac of dry edible pea were harvested.The combined value of all dry peas in the state was about $26 million in that year. Slightly over57,000 ac of green processing peas were harvested in 1995, with a production value of about $30million.
Nitrogen accumulation and efficienciesTotal plant N uptake for pea in Table 3- 8 ranges from 70 up to over 200 kg N/ha.
Within these values are three dry pea production sites within a few hundred meters of each otherin the Palouse region of Washington, differing primarily in landscape position (Mahler et al.,1979). Much higher N uptake (210 kg N/ha) was found in the bottomland position compared tothe relatively less productive side slope and ridge top (99 and 75 kg N/ha respectively).Processing peas (harvested at an earlier stage compared to dry pea) in northeastern Oregondryland and irrigated production systems were found to take up 97 or 228 kg N/ha at harvest,respectively (Rasmussen and Pumphrey, 1997). Vine residues accounted for about 75% of thisN (average NHI = 0.25). The authors point out that since so much N is returned to the fieldfollowing processing pea harvest, N fertilizer recommendations for subsequent crops need bereduced as suggested in Extension publication FG-34.
In a study of dry bean following wheat with varying levels of wheat straw (Evans et al.,1997), total plant N uptake at one site-year ranged from 63 to 75 kg N/ha, with an NHI of 0.36 to0.48. Using 15N, the authors estimated 45% of total plant N came from N2 fixation. At thesame site two years later N uptake ranged from 69 to 87 kg N/ha with an average NHI of 0.11under non-irrigated conditions, while under irrigated conditions N uptake ranged from 87 to 104kg N/ha with an average NHI of 0.18. Estimates of N2 fixation averaged 83 and 75% of total
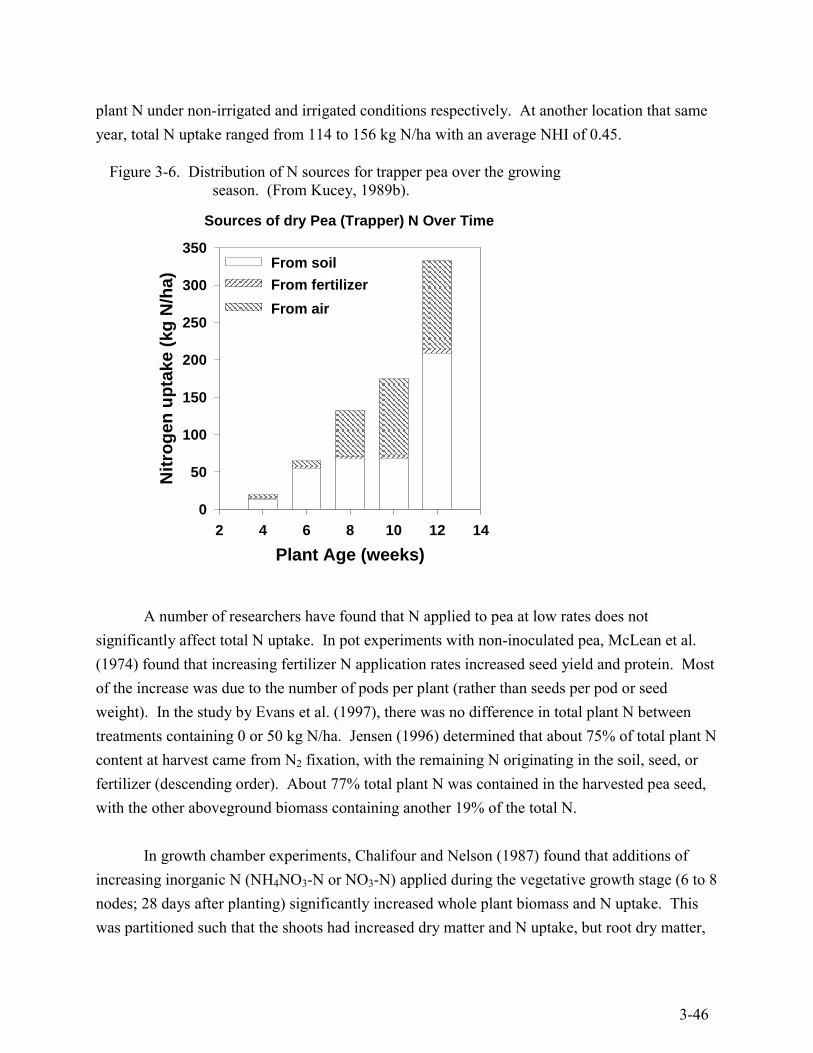
3-46
plant N under non-irrigated and irrigated conditions respectively. At another location that sameyear, total N uptake ranged from 114 to 156 kg N/ha with an average NHI of 0.45.
A number of researchers have found that N applied to pea at low rates does notsignificantly affect total N uptake. In pot experiments with non-inoculated pea, McLean et al.(1974) found that increasing fertilizer N application rates increased seed yield and protein. Mostof the increase was due to the number of pods per plant (rather than seeds per pod or seedweight). In the study by Evans et al. (1997), there was no difference in total plant N betweentreatments containing 0 or 50 kg N/ha. Jensen (1996) determined that about 75% of total plant Ncontent at harvest came from N2 fixation, with the remaining N originating in the soil, seed, orfertilizer (descending order). About 77% total plant N was contained in the harvested pea seed,with the other aboveground biomass containing another 19% of the total N.
In growth chamber experiments, Chalifour and Nelson (1987) found that additions ofincreasing inorganic N (NH4NO3-N or NO3-N) applied during the vegetative growth stage (6 to 8nodes; 28 days after planting) significantly increased whole plant biomass and N uptake. Thiswas partitioned such that the shoots had increased dry matter and N uptake, but root dry matter,
Figure 3-6. Distribution of N sources for trapper pea over the growingseason. (From Kucey, 1989b).
Sources of dry Pea (Trapper) N Over Time
Plant Age (weeks)2 4 6 8 10 12 14
Nitr
ogen
upt
ake
(kg
N/h
a)
0
50
100
150
200
250
300
350From soilFrom fertilizerFrom air

3-47
N uptake, and N concentration were not significantly affected. Biological N2-fixation wasdecreased by the higher rates of NO3-N, with the amount depending on bacterial inoculant. Itappeared that NH4NO3-N additions inhibited N2-fixation in pea more than NO3-N additions.They noted that pea was more affected than faba bean (Vicia faba L.), and that other researchershad found no differences between the N sources. Harper and Gibson (1984), in laboratoryexperiments with a variety of legume species found that nitrogenase activity (a measure of N2-fixation rate) was decreased 69% by the highest NO3-N concentrations (4 mM nitrate insolution). This was despite lack of visible changes in nodules, suggesting to the authors thatinhibited nodulation is due to nitrate uptake or metabolism within the plant. Kucey (1989b)observed relatively low rates of N2-fixation early in the season (Fig. 3-6).
Irrigation greatly increased both plant N uptake and grain N, as well as N concentration,yield, and vine dry matter (Rasmussen and Pumphrey, 1977) in a NE Oregon study. Theseresearchers found that plant N concentrations declined steadily over the growing season, with amore rapid decline under dryland compared to irrigated conditions. In late May, plant Nconcentrations were 3 and 3.5 % for dryland and irrigated conditions respectively, but declinedto about 2 and 2.5% by harvest in late June. The final NHI was 0.25, indicating that 75% of thetotal plant N remained the non-harvested vines. The researchers surmised that if all residueswere left on the field and 50% of the N content was available to plants the following year, theresidues of the dryland and irrigated peas in this study would contribute about 33 and 75 lbN/acre. Jensen (1996), working with pots in the field, found NHI of 0.77. Studies with 15Nshowed that N2 fixation accounted for 75% of the total N acquired by pea.
Washington State University guidelinesNitrogen additions to field pea in Eastern Washington is generally not recommended as it
does not increase profitability. Processing pea production is usually improved with the additionof 20 to 30 lb N/ac in the region (Fanning et al., 1971). Application of N (up to 20 lb N/ac) maybe helpful for establishment of a pea crop in Western Washington (Turner et al., 1975).
3.2.3 SPECIALTY CROPSSeveral crops are grown in Washington that are considered specialty crops due to limited
growing area and or requirements or intensive management requirements. In this section wediscuss hops, onion, potato, and sugarbeet into this category. All of these crops are high valuecrops and generally require careful N management to produce quality products.

3-48
Hops (Humulus lupulus L.)Washington is the number one state in the U.S. for hop production. In 1995, 30,000 acres
were harvested with a production value of over $99 million. Unlike the majority of cropsdiscussed in this report, hops are a perennial crop, so remobilization of N within the plant fromone year to the next is a determinant in growth. Relatively little has been published in thenational literature with respect to nitrogen uptake patterns. The majority of the work done hasbeen conducted by researchers in the Pacific Northwest, and is contained in reports for variousgrants or in the proceedings from professional conferences.
Total N accumulation.Studies conducted in SE Washington over 1992-95 (Stevens, 1992; Stevens et al., 1993,
1994, 1995) found that on average about 51 kg N/ha is removed from the hop yard in harvestedcones. The 51 kg N/ha removal rate is based on the average of several different studiesconducted over the 4 year period; including measurements from grower yards as well asmeasurements from a variety of research experiments consisting of a variety of N applicationrates, timings, forms, as well as different irrigation practices. The range for these studies was 30kg N/ha in a drip irrigation study with added N fertilizer at the rate of 115 kg N/ha, to 75 kg N/haharvested from two grower yard measurements that had added N at the rate of 100 or 150 kgN/ha.
Stevens et al. (1994, 1995) found that yield and plant N content appears to vary betweenyears at a given site. Their range of studies included application rates of 0 lb N/ac to over 200 lbN/ac. Applied N does not appear to be a good indicator of cone N content at harvest, at leastpartially due to relatively high levels of residual N in the soil profile at the start of some of theseasons evaluated (Stevens, 1992).
Nitrogen harvest index.The average N harvest index for the SE Washington studies range of treatments was 0.31,
meaning that about 32% of all the aboveground N was contained in the cones at harvest. Thecones have slightly higher N concentrations than the ‘trash’ (vines plus leaves), as cone drymatter constituted 28% of the total aboveground dry matter.

3-49
Table 3-10. Summary of N accumulation values reported in the literature for hops, onion and sugarbeet
CulturalPractices
Total N uptake†
Location Soil Mean Range NHI‡ UNU§ FNR¶ Reference
kg N/ha kg N/ha kg N/kg %
HOPS
Washington, SE not available grower yards, 0-112 kgN/ha
203 161 to 261 0.26 0.033 - Stevens (1992)
Washington, SE Hezel fineloamy sand
drip irrig; 105 to 151 kgN/ha
212 124 to 162 0.38 0.021 - Stevens et al. (1993)
Washington, SE grower yards, 112 -269 kgN/ha
204 157 to 245 0.32 0.030 - Stevens et al. (1993)
Washington, SE Hezel fineloamy sand
drip irrig., 115 to 200 kgN/ha
88 74 to 96 0.38 0.022 - Stevens et al. (1994)
Washington, SE Hezel fineloamy sand
drip irrig., 122 to 240 kgN/ha
108 97 to 124 0.34 0.023 - Stevens et al. (1995)
Oregon,Willamette V.
NotAvailable
on farm plots, 45 - 196 kgN/ha
139 119 to 170 0.42 0.023 - Christensen et al. (1995)
ONION
Idaho, SW XerollicHaplargid
2 yrs, 3 mgt, 0 to 224 kgN/ha
86 61 to 83 - 0.002 fresh - Brown et al. (1988)
Washington, SE silt loam(eolian)
grower yards, 97-239 kgN/ha
112 62 to 152 0.83 0.018 - Stevens (1988, 1997)
SUGARBEET
Idaho, southern DurixerollicCalciorthid
irrigated, 0 to 392 kg N/ha 278 130 to 419 - - - Carter and Traveller (1981)
Idaho, southern Various 0 N applied 213 82 to 421 - 0.0043fresh
- Stanford et al. (1977)
California, Davis Mollic Xerofluvent
& MollicHaploxeralf
irrigated, 0 to 280 kg N/ha 218 141 to 274 0.52 0.0026fresh
- Hills et al. (1978)
California Various applying ‘optimal’ N rate 201 155 to 240 0.59 0.0027fresh
- Hills & Ullrich(1971)
Sweden TypicHapludalf
field, 0 or 138 kg N/ha 174 126 to 222 0.43 0.015 - Steen and Linden (1987)
England sandy loam field, 0 to 125 kg N/ha 215 99 to 324 0.46 0.013 - Armstrong et al. 1986
not listed - field 285 - 0.49 0.027 - Olson and Kurtz (1982)
† Total N uptake = total plant N (harvested plant part + other above ground plant parts, not including roots).‡ NHI = Nitrogen Harvest Index (grain N/total N uptake)§ UNU = Unit N Uptake = units of N in total plant (except roots) / unit yield. Values shown are the mean of the various treatments of that study.¶ FNR = Fertilizer N Recovery = estimated proportion of applied N taken up by the plant. Estimation is based on either FNR or AFNR approachas described in the glossary given in Table 3-1. Values shown for each reference are the mean and range for the various treatments of the study.
Hops grown in the Willamette Valley of western Oregon had similar ratios of cone drymatter to aboveground dry matter (0.31) but an N harvest index of 0.42 (Christensen et al.,1995). In studies using 15N on three grower yards, 30 to 50% of the plant N was derived fromfertilizer applied in the same year. On average NO3-N was more readily taken up than NH4-N,and more fertilizer N was recovered by plants when N was placed in rings around or bands

3-50
beside the hills compared to broadcast application. Fertilizer N recovery averaged about 27%across the sites, although the actual recovery varied between sites and with N form (NO3 orNH4).
Averaged over all of the seasons and treatments summarized for SE Washington in thisreport (Stevens 1992, Stevens et al., 1993, 1994, 1995), cone N concentrations were 2.8 % (range2.0 - 3.8%) and vine + leaf values were 2.4% (range 1.3 - 3.0%). Hop cone NO3-Nconcentrations haven’t traditionally been used to assess brewing quality, however some brewersare paying attention to this variable out of concern for factors that might increase NO3-Nconcentrations in beer (Christensen et al., 1995).
Seasonal distributionCone 15N measurements made by Christensen et al. (1995) in the second year indicated
10% of cone N was derived from NH4NO3 fertilizer applied the previous year - suggesting tothese researchers that N may be stored in the roots between seasons and then redistributed. Theyalso note that hop root N has not traditionally been measured, and including root N content maysubstantially increase estimates of total N fertilizer recovery by hops. Plant distribution of N wasfound by Christensen et al. (1995) to be as follows: measured N concentrations at maturity arelowest in the vines (<1%), followed by leaves (about 3% N) and cones (2.2 - 3.1%). Often vineand leaf N are composited for N content measurements.
Washington State University guidelines.In SE Washington, leaching is not expected to remove residual N from the soil profile
between growing seasons due to low rainfall in the region. Stevens and associates are activelyworking on developing Best Management Practices (BMPs) for hop N fertilization, including acomponent designed to minimize the amount of residual N left in the soil at the end of theseason, and to have growers account for the residual soil N when planning their N applicationsfor the subsequent season. Current Washington State University N fertilizer recommendationsfor hops production are based on soil test NO3-N measured in the surface 6 ft of soil depth -ranging from 0 to 140 lb N/ac as soil test N decreases from 60-10 ppm (Dow et al., 1970a).
Petiole NO3-N concentrations can be used to monitor crop N status through the growingseason, allowing the grower to determine whether the plant N supply is adequate, deficient, orexcessive (Christensen et al., 1995). In the late spring, petiole N concentrations are relativelyhigh, and decline as the season progresses. Stevens et al. (1995) found that N applications ratesof 140-168 kg N/ha applied uniformly from late May to August 1 was sufficient to produce

3-51
maximum cone yield. In addition, if petiole nitrate-N rates are adequate at the beginning ofAugust only minimal additional N applications (2.2 kg N/ha/week in their study) were needed tomaintain petiole N levels. Higher late-season N applications did not appear to affect cone yield.These researchers emphasize that optimum N management is not possible without optimumwater management. Other than leaf petiole N concentrations, data for seasonal distribution of Nuptake in hops is lacking.
Implications of literature review for N management of hops in WashingtonOrganic matter additions have historically been a key part of production practices for hop
production in central Washington. Use of manure as an organic source led to a large buildup ofmicrobially active organic residues and an accompanying high levels of residual soil nitrate inmany old yards. Apparent fertilizer recovery has therefore been low. As management practicesare changed to reduce the buildup of residual soil nitrate recovery of fertilizer N will increase.Split applications and N placement will also increase fertilizer recovery.
The hop industry is slowing converting from rill to drip irrigation to reduce soil erosion.This change in irrigation practices significantly impacts N management in the hop yard. Ascover crops replace clean tillage in drip yards the vines and leaves are not returned to the yards,placing more reliance on input of fertilizer N. Fertigation with the drip system leads to increasedfertilizer recovery by restricting the volume of soil interacting with the fertilizer N and allowingthe timing of N application to closely follow plant needs. Petiole analysis will become an evenmore important tool as residual nitrate in yards is reduced and growers improve their N recoveryrates.
Onion (Allium cepa L.)A variety of onion crops are grown in Washington State, including spring-planted dry
bulb storage onions, fall-planted Walla Walla sweet onions, and onions grown for seedproduction. According to Washington Agricultural Statistics Service (1996), Washington was thenumber 3 producer of dry onions in the U.S. in 1994 and 1995. Onions were ranked number 21out of Washington’s top forty agricultural commodities. In 1995, 13,500 ac were planted toonions, corresponding to a production value of nearly $50 million.
Many studies have been conducted to evaluate the effect of N application on yield andquality, however relatively few of these measured plant or bulb N uptake. None of the studiessummarized in this report measured fertilizer N recovery. Onion yield is adversely affected iftotal N supply (residual soil N plus fertilizer) is deficient, however several authors note that

3-52
oversupply of N can adversely affect bulb and storage quality in addition to presenting a risk forleaching of nitrates to groundwater (Ells et al, 1993; Batal et al., 1994; Stevens, 1997).
N accumulation and N harvest index.According to Pelter et al. (1992) approximately 224 kg N/ha are needed to produce
acceptable spring (dry) onion yields in the Columbia Basin - including both preplant residual soilN plus fertilizer N. Of this, only 146 kg N/ha are removed by an average crop (yield of 800-cwt).Shallow roots and frequent irrigation are two causes generally cited for the relative inefficiencyof onion N use. Because of onion’s shallow roots, these authors recommend that onions berotated with a deep-rooted crop that can scavenge the N that moved below the onion root zone.
Total N uptake by Walla Walla Sweet onions measured in 1988 in six SE Washingtongrower fields ranged from 121 to 152 kg N/ha (Stevens 1997). Of this, an average of 94% wascontained in the harvested bulbs (range was 101 to 112 kg N/ha). Measurements were made intwo other fields that later showed signs of disease, and had yields that were only 74% as high asthe yields of the fields discussed above, as well as relatively lower bulb N contents. The Nharvest index of these fields was only 0.60. Grower-applied fertilizer rates during the studyperiod ranged from 97 to 239 kg N/ha in 1988, with a three year total of 274 to 697 kg N/ha forthe three years ending in 1988 (Stevens, 1988). Residual soil N found in the surface two feetwas high - about 196-336 kg N/ha for the three highest fields. Other fields containingexperimental plots measured in each of 1986 and 1987, showed no effect of N fertilization rateon marketable yield, despite a range in N application rates from 0 to 224 kg N/ha (Stevens 1997).The lack of yield response in these Walla Walla sweet onion fields was attributed to the plants’ability to take up N from below the 30 cm depth during late spring onion growth. These highresidual N rates were a big impetus for subsequent N management extension and research effortsconducted with onion growers, financially supported by the onion growers’ association.
Onion responses to applied N.Researchers working with sweet onion in northeast Florida found that increasing N rates
from 50 to 151 kg N/ha did not influence growth rates or bulb yields (Hensel and Shumaker,1992). For comparison, their yields averaged 5376 kg/ha. These researchers were mostinterested in yield and earliness and did not measure N uptake.
Many other researchers have found that fertilizing with N increased bulb (or seed, insome cases) yield compared to very low or 0 applied N. Researchers in a semiarid region ofwestern Africa found that there was a definite onion seed yield response to N fertilizer

3-53
(Nwadukwe and Chude, 1995). In their region, seed yield was optimized with N fertilizerapplications of 50-100 kg N/ha. The yield increases were due to both greater numbers of umbelsper plant and seed yield per umbel.
Henriksen (1987) found that increasing N applications up to 120 kg N/ha increased yieldand bulb N concentration of spring-sown sets and decreased the days to maturity. There was nofurther yield or N concentration increase, or days to maturity decrease, at an N application rate of180 kg N/ha. He also saw a trend toward increased yield and bulb N content when starterfertilizer was placed below and adjacent to the seed rather than preplant broadcast andincorporated. Hegde (1986) found that fertilization rate had only a minor affect on patterns of Ndistribution within the plant, though definite bulb biomass increases were achieved at higher Nrates up to 160 (the highest they measured). Slightly more N was partitioned into the bulbs atfertilizer rates of 80 and 160 kg N/ha compared to unfertilized plants. N fertilization alsoincreased other crop growth parameters such as leaf area index, and leaf area duration, cropgrowth rate. A lack of effect of fertilizer on the net assimilation rate suggests that the beneficialyield affects of N fertilizer are not due to increased photosynthetic efficiency but are probablydue to increases in leaf area index instead.
In the studies discussed above, researchers found the highest yields at the highestapplication rate evaluated, suggesting that perhaps they had not actually found the maximumyield or that other management factors were limiting to N response. Maier et al. (1990)evaluated N rates up to 590 kg N/ha for three site-years in the onion growing region of SouthAustralia. They found that rates of 299 to 358 kg N/ha were required to produce yields 95% ofmaximum and that these higher rates produced a greater proportion of larger bulbs, fewer culls(unmarketable bulbs), and fewer days until maturity, while only having slight adverse affects onbulb quality factors such as scale thickness, sugar content, and days-to-sprouting while instorage. Residual soil N levels were not reported, but were likely low since the soil was asiliceous sand and therefore excess N could potentially leach from the soil profile. Theyconcluded that application of rates >400 kg N/ha were wasteful, especially under irrigatedconditions.
N use efficiency might be expected to be low for onions since they are relatively shallow-rooted. Fenn et al. (1991), recognizing this, set out to determine if additions of Ca2+ along withurea fertilizer would increase N uptake by the plants, thereby increasing the apparent fertilizerrecovery. They found that additions of CaCl2 increased N uptake and yield over urea appliedalone, in both greenhouse and field studies. Most of the increase was centered in the additional

3-54
biomass in the bulbs, bulb N concentration and biomass of roots and tops were not affected.Interestingly, their results were found using a calcareous soil (already calcium-rich).
Seasonal patterns of N uptake.Maximum N uptake rates occur during bulb development, although the rate of N
accumulation in the leaves decreases. Seasonal distributions of N accumulation in both theleaves and bulbs are shown in Fig. 3-7 for a three year study in Sweden.
Rooting depth.Generally onions are a relatively shallow-rooted crop with few roots below 45 cm in most
soils (Pelter et al., 1992). Measured root length per kg of soil observed in greenhouse pots 84days after planting (DAP) ranged from 6.1 m/kg for 0 applied N, up to 16.7 and 19.4 m/kg for N
Figure 3-7. Seasonal pattern of N accumulation in onion bulbsand leaves for three different years at an applied N rate of 100kg N/ha. (From Salo, 1996)
N accumulation in onion for three years
Time
N a
ccum
ulat
ion
(kg
N/h
a)
0
20
40
60
80
100
AugustJulyJune
Bulb N (filled in symbols)Leaf N (empty symbols)

3-55
rates of 133 and 266 mg N/kg soil respectively (Abbes et al., 1995b). In another study alsoconducted 84 DAP (Abbes et al., 1995a), the root length corresponding to the N rates that
produced the greatest dry matter ranged between 0.0047 and 0.028 m/cm3 soil (3.6 to 21.5 m/kgsoil), depending on fertilizer and soil type. The corresponding mean root radius ranged between0.23 and 0.29 mm. Assuming an exponential pattern for root growth, they estimated root growthrates during these 84 d of 4x10⁻⁷ to 8.5x10⁻⁷ s-1 at the N application rates, with the rate dependingon N source and soil type.
Washington State University guidelines.Continued monitoring of grower fields demonstrated that management could successfully
limit the buildup of residual soil N levels. Current N fertilizer recommendations in the WallaWalla area emphasize the use of soil testing to determine N fertilization needs. Total N additionsare now generally under 120 lb N/ac, substantially lower than five years ago, and many growersno longer apply preplant N (Stevens, 1997). Other researchers in other irrigated regions havereported residual soil N contents under onion fields that are high enough to make the addition offertilizer unnecessary, for example as much as 1200 to 1800 kg N /ha contained in the surface 2m (Ells et al., 1993).
Implications of literature review for N management of onions in WashingtonThe limited number of studies looking at N uptake and partitioning makes it difficult to
draw conclusions about N relationships in Washington onions. The low apparent recovery offertilizer N is related to the shallow rooting habit of onions. Increases in apparent fertilizer Nrecovery gained by management practices such as placement and split application of N. Majorgains in fertilizer recovery related to improvement in irrigation management which reduces in-season movement of N below the root system. As indicated above the use of cover cropsfollowing onion production will be an important tool in reducing potential leaching lossesfollowing onion production.
Potato (Solanum tuberosum L.)The Columbia Plateau in central Washington is a highly productive agricultural region
where potatoes can be a profitable component in irrigated rotations (Greig and Blakeslee, 1988;Hammond and Neilan, 1992). High fertilizer N and irrigation needs of the potato crop, coupledwith a shallow rooting system and coarse textured soils requires careful management tominimize N losses (Lauer, 1986, Ojala et al., 1990; Westermann et al., 1988).

3-56
Total crop N accumulation.Russet Burbank potatoes grown in southern Idaho under furrow irrigation yielded 33 to 48 Mgtotal fresh tubers/ha while accumulating 139 to 224 kg N/ha (Westermann and Sojka, 1996).Banding N fertilizer beside the seed row promoted more efficient N uptake (216 kg N/ha) than
broadcasting (157 kg N/ha). Unit N uptake values were 4.89 kg N/Mg fresh tubers in the bandedN treatment and 3.81 kg N/Mg fresh tubers for the broadcast treatment. Heavily fertilized RussetBurbank potatoes grown near Plymouth, WA accumulated in excess of 350 kg N/ha (Weinert etal., 1995). Fertilizer N recovery has been observed to be about 50% in Washington (Roberts andCheng, 1984) and Michigan (Joern and Vitosh, 1995). However, with good water management,much of the remaining fertilizer N has been retained in the root zone (Joern and Vitosh, 1995).
Seeding rate and climatic variation influences N accumulation (Ifenkwe and Allen,1982). Total plant N across two cultivars increased from 170 to 280 kg N/ha with an increase inseeding rate from 24,960 to 74880 seed tubers/acre. The N uptake of the high populations wasfar in excess of the 160 kg N/ha applied.
Seasonal N accumulation.The majority of total plant N accumulation occurs between tuber initiation and mid-tuber
development (Rao and Arora, 1979; Pan et al., 1994). Similarly, greenhouse grown seedpotatoes accumulated 74 to 95 % of the final plant N from 30 to 80 days after emergence when65 to 80% of the plant dry matter was in the tubers (Biemond and Vos, 1992). In addition N
Figure 3-8. Seasonal N distribution in potato production after cover cropincorporation. (Weinert et al., 1995)
Potato N Uptake, Inorganic N in and below the Root ZoneAfter Spring-Incorporation of Cover Crops
Days from Planting-40 -20 0 20 40 60 80 100 120 140 160
Plan
t or S
oil N
(lbs
acr
e-1 )
050
100150200250300350400450
Total potato plant N
24-48 inches Inorganic N0-24 inches Inorganic N

3-57
accumulation leveled off by 80 days after emergence in field-grown potatoes in Scotland(Millard and Marshall, 1986). Ideally, N bioavailability can be optimized in the root zone justprior to and during the accelerated phase of N uptake, as achieved with spring incorporated covercrops at Plymouth, WA (Fig. 3-8; Weinert et al., 1995).
Nitrogen harvest index.At adequate N fertilization levels, potato (cv. Sebago) partitioned about 60% of the total
plant N (excluding root N) into the tubers (Huett and Dettmann, 1992). Greenhouse grown seedpotatoes (cv. Bintje) exhibited NHI values of 80-85% (Biemond and Vos, 1992). Increasing theN supply from 0 to 250 kg N/ha increased vine growth, and decreased NHI from 0.69 to 0.57 inScotland (Millard and Marshall, 1986).
Nitrogen management effects on growth and development.Potato is a high nitrogen demanding crop. With good growing conditions, 300 to 350 lb
N supply/acre is required to produce a 30 to 35 ton/acre crop of Russet Burbank potatoes (Langet al., 1997; Roberts and Cheng, 1991; Kleinkopf and Westermann, 1986; Roberts and Cheng,1986; Lauer, 1985; Lauer, 1984). It is recommended that the nitrogen supply be adjusted by +10 lb N/acre for each ton/acre deviation from this yield goal (Lang et al., 1997). Nitrogenmanagement influences dry matter partitioning and tuber yield and quality (Ojala et al., 1990;Lauer, 1986). Excessive N applications can stimulate vine growth at the expense of reducedtuber set and root development (Kleinkopf and Ohms, 1977; Kleinfopf and Dwelle, 1978; Lauer,1984; Lauer, 1985; Ojala et al., 1990; Kleinkopf, 1994). In agroclimatic regions with shortgrowing seasons, a two-week delay of tuberization can result in a 5 ton/acre yield reduction.Split applications are commonly used to supply N during the accelerated N uptake phase duringtuber development to avoid overfertilization and reduce N leaching (Roberts et al., 1991; Ojala etal., 1990).
A preplant application of approximately 1/3 of the total seasonal N requirement (60 to120 lb N/acre) is recommended (Lang et al., 1997). Recent preliminary research has indicatedthat the use of nitrification inhibitors with the preplant N application may help to minimize Nleaching losses (Thornton et al., 1997). A preseason soil test of the upper 30 cm for residualinorganic N and estimate of organic N release should be taken into account in adjusting thispreplant N application (Lang et al., 1997). The remainder of the seasonal requirement should beapplied in correspondence with the accelerated phase of N uptake, which occurs between tuberinitiation and mid-tuber bulking, 40 to 120 days after planting for Russet Burbank (Pan et al.,

3-58
1994; 1997). Petiole nitrate levels are most commonly used to determine in-season N needs(Lang and Stevens, 1997), however, it should be recognized that factors other than soil Navailability may influence petiole nitrate accumulation, and in-season soil testing should also beused to determine N needs (Lang and Stevens, 1997; Westcott et al., 1994).
Rooting depth.Although potato roots have been observed to depths of 1.5 m (Linford and McDole,
1977; Lesczynski and Tanner, 1976), chemical or physical barriers often restrict potato rooting toshallower depths, and a majority of the potato roots are often observed to be in the top 30 cm(Lesczynski and Tanner, 1976). A calcic layer in a Portneuf silt loam restricts rooting to 0.45 m(Westermann and Sojka, 1996). Deep root development can be improved with improved deep N,P availability and organic matter (Bushnell, 1941).
Root elongation of Russet Burbank grown in the Columbia Basin has been observed withrhizotron computerized imaging (Pan et al., 1997). Root elongation is extensive through tuberinitiation and early tuber bulking through 49 DAP, and then declined thereafter. Segmenting therhizotron profiles into 10 zones provided data to interpret the spatial and temporal distribution ofroots. Primary roots extended to 15 to 20 cm under the seed piece prior to shoot emergence, 21days after planting. Lateral roots began to develop shortly thereafter. Potato roots extended todepths of 60 cm by 4 to 6 weeks after planting, and maximum root density in the hill and furrowwas observed by tuber initiation to early tuber bulking. Root development under the furrowmaximized by 40 to 49 DAP. Roots shrunk in diameter or disappeared during late tuber bulking(>60 DAP), suggesting that nutrient recovery efficiency of the root system declined during thisdevelopmental period, possibly due to root-tuber competition for limited carbon availability.These temporal and spatial trends were similar to previous results using destructive sampling(Nelson, 1990; Pan et al., 1990; Pan and Hiller, 1992; Pan et al., 1994).
Late-season N applications are less efficiently absorbed as the plant roots senesce, andcombined with organic matter and plant residue mineralization, results in late-season soil Naccumulation (Weinert et al., 1995; Hammond, 1992; Thornton et al., 1996).
Washington State University recommendations. An extensive review of scientific literature by and subsequent discussions with potato
industry representatives have produced a recent update of recommended nutrient managementfor potato production in Washington (Lang et al., 1997). A companion survey of current potatoindustry fertilization practices indicated that respondents felt it necessary to recommend higher

3-59
than average levels of nitrogen to overcome management and environmental problems such assuboptimal irrigation and nitrogen timing, disease pressures, and periods of excess precipitation(Lang and Stevens, 1997). However, the use of higher nitrogen rates to overcome theseproblems will result in increased potential for nitrate leaching and ground water contamination(Lang et al., 1997). This emphasizes the need for an integrated approach to nutrient, water andpest management to maximize nitrogen use efficiency. We have a thorough understanding ofseasonal patterns of N accumulation and partitioning, and root behaviour of Russet Burbankpotatoes grown in the Columbia Basin. In addition, the role of cover crops in potato rotationshas been emphasized in recent years as an important management tool for improving N cycling.Less is known about other potato cultivars that are gaining in popularity, but some are currentlyunder investigation.
Sugarbeet (Beta vulgaris L.)Sugarbeet yield is evaluated primarily on yield of extractable sucrose. Extractable
sucrose is dependent on the combination of harvested root biomass and root sucrose content.Under-fertilization for N results in poor leaf canopies, premature yellowing and decreased yields(Cattanach et al., 1991). Over fertilization with N often leads to increased impurities in the rootsand subsequent lowered sucrose extraction (Carter and Traveller, 1981; Cattanach et al., 1991).Washington State has not tabulated records on sugarbeet production because it was not producedon much acreage for many years. However, the crop is now being planted on increasing acreseach year. In addition, sugarbeet production was considered to be of interest for this reportbecause of the relatively large amount of processing wastes generated.
Total N accumulation and N uptake efficiency.Nitrogen fertilizer recovery was 47% in a California study when sugarbeet was fertilized
at the optimum N rate for sugar production (112 kg N/ha for this site-year; Hills et al., 1978).These researchers found that the proportion of N derived from fertilizer depended on the Napplication rate. For roots, the observed relationship was:
Root %N from fertilizer = 1.31 + 0.26x - 0.00042x2
where x is the applied N rate (kg/ha). Sugarbeet tops showed a similar increase in fertilizer N %:Tops %N from fertilizer = -0.76 + 0.23x - 0.00030x2.
The relationship for total plant N uptake (kg/ha) as a function of fertilizer application rate was:total plant N uptake (kg/ha) = 158.03 + 0.69x - 0.00098x2.
Relying on only soil N, one study in southern Idaho found that sugarbeet yields rangedfrom 7.8 to24.8 Mg /ha (fresh weight basis) and took up 4.3 kg total plant N uptake per Mg

3-60
harvested root on a fresh weight basis (Stanford et al., 1977). These researchers estimate thatsugarbeets were able to recover 66 and 75% of mineralized and residual NO3-N from the soilprofile in the absence of applied N. Under optimal N fertilization, Cattanach et al. (1991)observed total N accumulation of 4 to 4.5 kg N per Mg (dry weight basis) of harvested root.
Steen and Lindén (1987) found that 75% of fertilizer N was recovered in the harvestedroot - making sugarbeet one of the more efficient N users among the agronomic crops. In thesame experiment, they determined that about 2% of fertilizer remained in the soil - indicatingthat 23% of applied N was unaccounted for.
Total plant N is equally distributed between the sugarbeet tops and harvestable roots. Asurvey of fertilizer response and efficiency experiments conducted in California found that whenabout 130 kg N/ha or less N was needed for maximum sugar yield (that is, in certain soil types),the harvested roots took up as much or more N than was applied. However, for soil types thatneeded N additions > 130 kg N/ha, less N was removed than was applied (Hills et al., 1978 -citing Hills and Ulrich, 1976). Fibrous roots (rarely measured) in the surface 60 cm contained 3kg N/ha regardless of fertilizer treatment, comprising about 2% of the total plant N (Steen andLindén, 1987).
Seasonal pattern of N accumulation.Carter and Traveller (1981) present graphs of seasonal patterns in root and sucrose yield,
sucrose %, root N uptake, tops N uptake, total plant N uptake, total plant DM, root DM/total DMfrom a southern Idaho study. Measured N uptake rates at the start of the season ranged from 2.3to 5.8 kg/ha per day depending on location and year with 125 kg N/ha applied N, and from 1.6 to5.1 kg/ha per day in the absence of applied N (Armstrong et al., 1986). Toward the end of theseason these rates slowed appreciably to a range of 0.6 to 1.0 kg/ha per day. At this time, asignificant amount of remobilization of N from the tops into the root occurs, causing 30-80% ofthe end-of-season N uptake, depending on the year.

3-61
Applying N above that needed for optimum plant growth, or delaying application untilmidseason, caused a greater proportion of photosynthate to be partitioned to the shoots at theexpense of dry matter and sucrose accumulation in the roots (Carter and Traveller, 1981). Lateor excessive N applications increased impurities in the beet root, which decreases sucroseextractability and refined sugar production. The researchers concluded that N applications, basedon reliable soil tests, should be made before planting or during early plant growth stages, inamounts that will produce optimum plant growth and sucrose production. Deckard et al. (1984)provide an example of the effect of N rate on root and sucrose yield (Fig. 3-9). Hills et al.(1978), on the other hand, working in California found no difference in root, top or sugar yield orN uptake due to time of fertilization (fertilizer rate was 135 kg N/ha).
Root length.Sugarbeets have a taproot system that utilizes water and nutrients to a depth of 1.5 to 2.4
m (Cattanach et al., 1991). One study that measured sugarbeet root biomass, found an average(30 experiments) of 29.3 g/m2 in the surface 60 cm. About 20 g/m 2 were in the surface 25 cm(Steen and Linden, 1987).
Figure 3-9. N affects on root and sucrose yield at twotimes in the season. Adapted from Deckard et al. (1984).
Sugarbeet yield and sucrose content
N application rate (kg N/ha)0 50 100 150 200 250 300 350 400
Yiel
d (t/
ha)
0
5
10
15
20
25
30
35
40Root yield
Sucrose yield
May 14
June 15
May 14
June 15

3-62
Washington State University recommendationsRecommendations for sugarbeet production in central Washington are contained in
Fertilizer Guide FG-10 (Dow et al., 1970c), and are based on soil test N in the root zone andprevious crop. The range of recommendations goes from 0 N if there is high residual soil N, orif the previous crop was a legume, up to 200 lb N/ac for low soil test N on new land, or afterpotato, sugarbeet, silage corn, or wheat with straw removed. N management in sugarbeet issensitive because the crop does require a relatively high N supply, but excessive rates of N cansharply reduce sugar production.
3.2.4 TURFGRASS AND FORAGE CROPS3.2.4.1 FORAGEOverview
The major forage grasses grown in Washington are orchardgrass, perennial ryegrass, andtall fescue. These are the three forage species covered in this report. Forage grasses are oftengrown in mixture with other species, including legumes. For this report, we have not includedlegume forages, although including forage legumes in the mix can take the place of applied N formaintaining grass productivity. Even in mixed legume-grass forage mixtures, N additions areoften found to be desirable, especially during the establishment phase to help maintainappropriate species ratios (Kanyama-Phiri et al., 1990).
Washington State University recommendationsSince forages are generally grown as mixed stands WSU Fertilizer Guides do not provide
species-specific recommendations. Instead there are recommendations for irrigated and non-irrigated pasture (or hay) for different regions of the State (Table 3-2) In general, 80 to 150 lbN/ac annually are recommended for non-irrigated improved pasture production in EasternWashington. During establishment, about 20 lb N/ac are recommended. (Fanning et al., 1976;Peterson et al., 1984). Irrigated pasture in central Washington can be extremely high yielding, inwhich case 240 to 300 lb N/ac are recommended for good, long-season stands. If the stand ispoor and the season is relatively short then as little as 20 to 60 lb N/ac would be recommended(Dow et al., 1979b). The critical nutrient range (CNR) for orchardgrass is 3.5 to 4.0% N in thetops when the grass is 12" high. If N concentrations are below this level, there is likely aninadequate N supply (Dow, 1980).

3-63
Orchardgrass (Dactylis glomerata L.)Fertilizer recovery and N use efficiency
Average apparent fertilizer N recoveries by orchardgrass for all of the studiessummarized in this report is 55% (range of 38 to 89%). Researchers in Puyallup, WA recordedapparent N fertilizer recovery rates of 38 to 56% depending on the N rate applied and the year ofthe study (Turner 1979). Geist (1976) measured fertilizer N recoveries of 57-71% for a varietyof N and sulfur fertilization treatments in La Grande, Oregon. Unfortunately this researcher didnot specify how N fertilizer recovery was determined. Kunelius and Suzuki (1977), working inthe Maritime Provinces of Canada, reported a similar range of fertilizer N recovery (46-70%) atthree N application rates between 99 and 297 kg N/ha applied annually. Sollenberger et al.(1984) measured values of 62 to 89% of applied for N rates ranging from 112 to 448 kg N/ha.The highest recovery % occurred at the 224 kg N/ha rate.
Guillard et al. (1995) evaluated the N use efficiency (NUE) and apparent fertilizerrecovery over a range of N application rates for three sets of two-year periods. The only Napplication was at the start of the first year and initial soil N levels were relatively low (<10 mgN/kg soil). They found that both NUE and apparent fertilizer N recovery steadily declined as Napplication rate increased. For first year harvests, NUE values ranged from about 15 kg DM/kgN at 112 kg N/ha down to 9 kg DM/kg N at 448 kg N/ha application rate. The correspondingvalues for apparent fertilizer recovery were 50 and 25%. When calculated for the entire two yearperiod, NUE values were slightly higher and ranged from 20 to 10 kg DM/kg N applied for the112 and 448 kg N/ha fertilizer application rates. Apparent fertilizer N recoveries were about 5 %higher for the two-year period compared to the values given above for the first year only. Notethat these researchers calculated NUE somewhat differently than explained in the introduction tothis section. Rather than making the difficult measurement of total N supply (fertilizer + non-fertilizer N), these researchers used the yield of the zero N control treatment as a surrogateestimate for non-fertilizer sources of N. The resulting NUE calculation was:
NUE = (yield at Nx - yield at N0) / Nx
where Nx is N applied at rate x, and N0 is the zero N control treatment. Sollenberger et al. (1984)used the same calculation over the same range of applied N rates and found somewhat higherNUE estimates in Pennsylvania - ranging from about 19 to 33 kg DM / kg N applied (per habasis) depending on the applied N rate. Corresponding apparent fertilizer N recoveries rangedbetween 62 and 89% in their study.

3-64
Table 3-11 . Summary of N accumulation values reported in the literature for forage grasses.
CulturalPractices
Total N uptake†
Location Soil Mean Range UNU‡ FNR¶ Reference
kg N/ha kg N/ha kg N/kg %
ORCHARDGRASS
Connecticut TypicDystrochrept
0 to 448 kg N/haapplied
128 50 to 170 0.024 41 (25 to 50) Guillard et al., (1995)
ConnecticutTypicDystrochrept
Total for 2 yrs afterapplic.,0 to 448 kg N/ha 1st
year
162 75 to 220 0.020 43 (30 to 55) Guillard et al. (1995)
Puyallup, WA AquandicXerochrept
0 to 560 kgN/ha/year
313 112 to 431 0.027 46 (38 to 56) Turner (1979)
Pennsylvania TypicHapludalf
0 to 448 kgN/ha/year
209 79 to 327 0.025 72 (62 to 89) Sollenberger et al. (1984)
Canada, Pr.Edw. Is.
notavailable
99 ton 495 kgN/ha/year
195 97 to 255 0.030 46-70 Kunelius and Suzuki(1977)
PERENNIAL RYEGRASS
Pennsylvania TypicHapludalf
0 to 448 kgN/ha/year
168 57 to 279 0.026 57 (37 to 70) Sollenberger et al. (1984)
Buckley, WA TypicHumaquept
Irrigated, 0 to 9 tonbiosolids
190 79 to 271 0.021 38 (28 to 71) Cogger et al. (unpublisheddata)
TALL FESCUE
Puyallup, WA VitrandicHaploxeroll
Irrigated, 0 to 9 tbiosolids
289 112 to 421 0.025 38 (28 to 63) Cogger et al. (unpublisheddata)
Kansas MollicAlbaqualf
13 to 168 kgN/ha/year,broadcast or knifed
76 56 to 100 0.017 - Moyer et al. (1995)
Kansas MollicAlbaqualf
0 to 168 kgN/ha/year,broadcast or knifed
63 25 to 122 0.015 - Moyer et al. (1990)
Georgia TypicHapludult
0 to 896 kg N/ha,various P & K rates,2 cultivars
191 15 to 444 0.027 62 (40 to 83) Overman and Wilkinson(1995)
West Virginia Dystrochrepts& Hapludult
0 to 180 kg N/ha 76 21 to 156 0.016 49 (39 to 64) Staley et al. (1991)
† Total N uptake = total plant N (harvested plant part + other above ground plant parts, not including roots).‡ Unit N Uptake = units of N in total plant (except roots) / unit yield. Values shown are the mean of the various treatments ofthat study.¶ FNR = Fertilizer N Recovery = estimated proportion of applied N taken up by the plant. Estimation is based on either FNR orAFNR approach as described in the glossary given in Table 3-1. Values shown for each reference are the mean and range forthe various treatments of the study.

3-65
N accumulationThe average N accumulation by orchardgrass for all the studies summarized in this report
was 244 kg N/ha, with a range of 79 to 439 kg N/ha depending on the study and treatment. Thethree studies contributing to this average were all conducted in the northern U.S., with Napplication rates ranging from 0 to 560 kg N/ha. On average, 0.027 kg N were required toproduce each kg of forage dry matter (range of 0.019 to 0.136 kg N/kg dry matter).
Orchardgrass dry matter production has been shown to respond to N rates of 448 kg N/ha,and in some cases as high as 717 kg N/ha. Typically the yield response is linear over this range(Guillard et al., 1995), rather than reaching a plateau as shown in Fig. 3-2. These researchersmeasured linear yield increases up to their highest N rate (448 kg N/ha) in both the first andsecond growing season after N application. However, N uptake appeared to level off at about155 kg N/ha at rates higher than 224 kg N/ha in the first season, though it increased slightly overthe entire application rate range the second year. When first and second season N uptake aretaken together, total N uptake does not begin to level off until the 448 kg N/ha rate. Sollenbergeret al. (1984) also observed yield and harvested N response under conditions of annual Nfertilization up to application rates of 448 kg N/ha (the highest they measured). Averaged over 3years with 3-4 cuts per year these researchers measured average harvested N to be 279 kg N/haat the 448 kg N/ha rate. Kunelius and Suzuki (1977) measured harvested N uptake of 97 to 255kg N/ha at respective application rates of 98 to 495 kg N/ha.
Research results from Puyallup, WA have found that orchardgrass is capable of taking uplarge quantities of N that are removed from the site at harvest. Turner (1979) found that Nuptake increased as the N application rate increased from 0 lb N/ac up to 560 kg N/ha. At the560 kg/ha N rates, over 448 kg N/ha was removed by the crop. Residual soil N was notmeasured. The increased N uptake at the higher rates was not due to increased forage yield, butwas due to increased percentage of protein in the more heavily fertilized crops. Turner suggeststhat application to orchardgrass for waste disposal purposes may have some merit.
Working at lower N application rates (0, 84, and 168 kg N/ha), in four differentPennsylvania soils with low soil N concentrations (<3 mg/kg), Stout and Jung (1992) measuredgenerally increasing accumulation rates for biomass, fertilizer N, and total N uptake as Napplication rate increased. For example, in the spring growth period on a Berks soil (loamy-skeletal, mixed mesic Typic Dystrochrept) biomass accumulation rates were 51.5, 83.5, and198.5 kg/ha/day for the 0, 84, and 168 kg N/ha application rates. Corresponding values for totalN accumulation during the same period were 0.765, 1.040, and 1.565 kg N/ha/day. The Berks

3-66
soil had generally intermediate values among the 4 soil types studied. Spring biomass and Naccumulation were substantially greater than during the fall growth period.
N concentrationN concentrations over the range of studies summarized in this report average about 2.7%,
with a range of 1.9 to 3.6%. N concentration is positively correlated with N application rate - thatis, N concentrations are higher at higher N application rates. For example, Turner (1979)measured an average N concentration of 2.5% at zero applied N, and 3.3% at 500 lb N/ac.Kunelius and Suzuki (1977) measured N concentration of 2.5 up to 3.6% at respective Napplication rates of 98 and 495 kg N/ha. Glenn et al. (1985) measured N concentrations of 2.3 to2.4 % at 0 applied N, increasing to 3.1 and 3.7% at N application rates of 294 and 882 kg N/ha inKentucky.
ModelingIn their study of N use efficiency, Guillard et al. (1995), these researchers developed
regression equations for yield (dry matter), N uptake, apparent fertilizer recovery, and NUEbased on N application rates ranging from 0 to 448 kg N/ha (in intervals of 112 kg N/ha). Theirequations for the year of N fertilizer application are as follows:
Yield (dry matter, Mg/ha) = 3.4 + 0.008 N (r2 = 0.868)
N uptake (kg N/ha) = 47.9 + 0.664 N -8.492 N 2 (r2 = 0.992)
Apparent N fertilizer recovery (%) = 62.2 - 0.074 N (r2 = 0.929)
Nitrogen use efficiency (kg DM/kg N) = 17.9 -0.023 N (r2 = 0.982)
where N is the applied N rate (kg N/ha). The developed similar equations for the secondgrowing season (no N applied), and for the two year period (not shown here). While theseregression equations are specific to their study conditions in Connecticut, they demonstrate thegeneral trends.
Tall Fescue (Festuca arundinacea Shreb.)N recovery and accumulation
The average N accumulation for all studies summarized in this report is 137 kg N/ha,with a range of 15 to 444 (Table 3-11). Treatments included in these different studies included N

3-67
application rates ranging from 0 to 933 kg N/ha, including both synthetic N fertilizer as well asbiosolids N. In general, 0.0204 kg N were required to produce each kg of forage (range = 0.0113to 0.0385kg N/kg forage). On average for the studies summarized in this report, 54% of appliedN was recovered by harvested forage (range = 28 to 83%). No studies measuring N uptakeefficiency or N use efficiency were found in the literature.
Staley et al. (1991) report fertilizer N recoveries ranging between 23 and 31% of applied(15N technique), depending on fertilizer rate (0, 90, 180 kg N/ha) and soil type. In these plots, 23to 47% of the N in the total plant N uptake was derived from the applied fertilizer. When thedifference technique is employed to estimate the apparent N fertilizer recovery, values for thissame experiment ranged from 39 to 64%, illustrating the effect of measurement technique onresulting values. The resulting difference between these two techniques is attributed to the‘priming effect’ in which added N is thought to stimulate microbial activity so that Nmineralization is greater under the N plots compared to the zero N. The difference betweentechniques was specifically explored by Stout (1995) with respect to forage grasses in thenortheastern U.S.. He found that in tall fescue, this priming effect averaged 7.4 and 24.2% of theapplied N when the N source was ammonium nitrate and ammonium sulfate respectively.Seasonal differences were also observed, with a greater difference in spring compared to fallgrowth. For example using the difference technique to calculate recovery, 50.8 and 17.5 kg N/hawere recovered for spring and fall growth respectively, averaged over N rates of 90 and 180 kgN/ha. Calculated recoveries were about one-half as much when calculated by the 15N technique.
Moyer and Sweeney (1990) measured apparent fertilizer N recoveries (differencetechnique) in SE Kansas ranging between 29 and 54% of applied N, depending on N rate andwhether the fertilizer was broadcast or banded. While these researchers do not present values forthe individual treatments, they state that higher apparent fertilizer recoveries (> 50%) wereobtained when fertilizer was banded 10 cm below the soil surface compared to broadcast orbanding at 5 or 15 cm. They cite Raczkowski (1984) as having similar findings of greaterrecovery with subsurface banding of fertilizer (58% of applied) compared to broadcast (37% ofapplied). Other researchers have presented much higher apparent fertilizer recoveries. Forexample, Overman and Wilkinson (1995) measured an average of 62% fertilizer N recovered(difference technique) in Georgia, with a range from 40 to 83% depending on cultivar andapplication rates of N, P, and K fertilizer.
Raczkowski and Kissel (1989) calculated an N balance resulting from 15N-labeled ureaammonium nitrate (UAN) application to tall fescue in Kansas. A total of 112 kg N/ha were

3-68
applied, of which 57 kg N/ha was labeled urea. (Determining volatile losses of urea was themain impetus for their experiment.) Of the labeled urea, 23 or 35 % was recovered in harvesteddry matter during the year of application, depending on whether it was broadcast or banded 15cm below the soil surface. Of the remaining, about 40% was immobilized (live roots and soilorganic matter), about 2% was left as residual inorganic soil N in the surface 90 cm. Another2.5% was taken up in the second year (which received no additional N fertilizer). All of theapplied 15N was recovered in one of these pools under the banded application treatment. In thebroadcast treatment, slightly over 10% was unaccounted for. The authors attributed the loss tovolatilization.
Lucero et al. (1995) studied the effect of several rates of poultry litter on the yield, Nuptake, and N recovery of a pasture containing a mixture of tall fescue and bluegrass (Poapratensis L.) in the Piedmont region of Virginia. Poultry litter rates ranged from 9.9 to 48.9metric tons over a two-year period, applied in four applications (two each year). The resulting Nadditions ranged between 200 and 1000 kg N/ha over the two year period. Both forage yield andN uptake increased over the entire application range, and were well explained by the followingregression equations (separate equations were developed for each of the two years):
1991: yield (kg DM/ha) = 4728.7 + 43.9N - 0.066N 2 r2 = 0.992N uptake (kg/ha) = 81.8 + 0.7N - 0.00034N 2 r2 = 0.989
1992: yield (kg DM/ha ) = 3261.3 + 108.7N - 0.226N 2 r2 = 0.994N uptake (kg/ha) = 59.9 + 1.21N - 0.00074N 2 r2 = 0.993
where N is the amount of applied N in the poultry litter. Apparent N fertilizer recovery(difference technique) ranged between 55 and 103% depending on the amount of N added andthe year. In general, recoveries decreased as the poultry litter application rate increased, andwere substantially lower in the first year of the study compared to the second. In this study, theunit N requirement (kg N to produce 1 kg yield) ranged from 0.018 and 0.021 under conditionsof zero N application up to the highest measured value of 0.030 at the two highest poultry litterapplication rate the second year (cumulative N additions of 800 and 1000 kg N/ha over 2 years),indicating higher forage N concentrations when the N supply was greater.
Moyer et al. (1995) determined that tall fescue N uptake was affected by N fertilizerplacement as well as N application rate. Increasing the N application rate from 13 to 168 kgN/ha increased yield 69% and N uptake nearly doubled. Applying N in a 10 cm deep band(‘knifing’) at 25 cm spacing increased yield 20% and N uptake 33%. In earlier work, Moyer and

3-69
Sweeney (1990) showed that knifing a urea/NH4NO3 solution at 10 cm generally resulted inhigher yields than banding at 5 or 15 cm deep.
Tester (1989) found that both yield and N uptake were increased when inorganic Nfertilizer was added to soil that was also amended with composted sewage sludge. Cumulativetall fescue clippings were 279% greater when a 45 Mg compost/ha treatment (containing 507kg/ha total N) was also amended with N (200 kg N/ha rate) compared to the same compost ratewith no N added. The effect of N fertilizer decreased somewhat as the compost rate increased,so that at the 135 Mg/ha compost rate, the yield increase due to N application was somewhat lessat 160%. The respective N uptake for the various treatments also increased as a result of Nfertilization (460% at the 45 Mg/ha compost rate, 223% at the 135 Mg/ha compost rate).However, all of the treatments that received fertilizer N had about the same N uptake as eachother, indicating that addition of N fertilizer beyond a certain compost rate does not increase Nuptake.
N concentrationN concentrations over the range of studies summarized in this report average about 2.0
%, with a range of 1.1 to 3.8%. In all studies, forage N concentration increased as N applicationrate increased. For example, Glenn et al. (1985) measured N concentrations of 2.3% at 0 appliedN, increasing to 2.9 and 3.5% at N application rates of 294 and 882 kg N/ha in Kentucky.
Rooting DepthRooting depth in tall fescue increases over the course of the growning season, and generallyextends to at least the 0.5 m depth (Brar and Palazzo, 1995). As seen in Fig. 3-10, soil type alsoplays a role in rooting depth. Irrigation level also influences root development in turf-type tallfescue. Under limited irrigation, tall fescue exploited soil moisture at depths of 31 to 90 cmmore efficiently than Kentucky bluegrass (Ervin and Koski, 1998).

3-70
ModelingOverman and Wilkinson (1995) present and evaluate a model for forage grass dry matter
yields and N uptake as a function of applied N, P, and K fertilizer. Using two tall fescuecultivars (Kentucky 31 and Kenwell) in the southeastern U.S. these researchers determined thatthe model predictions were highly correlated with measured values and reflected patterns foundin previous work. They demonstrate that their data support a hyperbolic relationship betweendry matter yield and plant N uptake. The model is not presented here, but in summary it consistsof triple logistic equations with a total of thirteen parameters and requires inputs that include themaximum annual yield and N uptake, plus indices for applied N, P, and K fertilizer. From theirfield data, they developed maximum annual dry matter yield and N uptake values of 12000 and440 kg/ha respectively.
Figure 3-10. Seasonal pattern in rooting depth oftall fescue in two soil textures. From Brar andPalazzo (1995).
Rooting Depth in Tall Fescue
Days after planting (days)45 50 55 60 65 70 75 80
Roo
t Dep
th (c
m)
10
20
30
40
50
60
70
Sandy soil
Silt loam soil

3-71
3.2.4.2 TURFGRASSOverview
Turfgrass is grown for a great variety of uses, including home lawns, golf courses,athletic fields, corporate lawns, sod farms, orchard and vineyards alleyways, and cemeteries. Inaddition, bluegrass seed production has been an important crop in the state - rankedapproximately 30th out of the top 40 of Washington’s agricultural crops (WashingtonAgricultural Statistics Service, 1996). A number of the above turfgrass uses would lendthemselves well to processed water applications. The species and cultivars grown at a given sitedepend on both use and location. In Washington, some of the major turfgrass species includebluegrass, fine leafed fescue, bentgrass, tall fescue, and perennial ryegrass (W. Johnston,personal communication, 1997). Some studies have been conducted on individual species.However, since most turfgrass is grown as a mixture of species many studies are conducted onmixes. For this reason, we have not separated out the turfgrass section into individual species aswe have done for the other crops.
A relatively recent review article summarizes many of the factors related to Nfertilization of turfgrass (Turner and Hummel, 1992). They describe how N is a vital constituentof turfgrass plants. An adequate N supply is necessary to have good establishment of new turf,and to maintain turf quality despite frequent mowing and high traffic/compaction. N additionsare also beneficial for recovery from drought, herbicide injury, and winter dormancy. Overlyhigh N supplies can have negative impacts on shoot-to-root growth ratio, wear-quality, cold-hardiness, species composition, weed levels, susceptibility to some diseases. Turner andHummel’s review summarize numerous research studies in these areas. N requirements andappropriate timings are influenced by many factors, including species and cultivar, climate, soilphysical properties, organic matter, compaction, and N source.
Washington State University recommendationsFertilizer recommendations for home lawns, play fields, and other established turf in
Eastern and Central Washington are to apply 8-10 lb/1000 ft2 during each growing season (Aprilto September), preferably split in four equal applications (Goss et al., 1982). A more recentpublication specifically geared to the home lawn recommends an average of 4 lb N/1000 ft2
(Stahnke et al., 1997). Establishment of new turf requires about 1 lb N/1000 ft2. N fertilizationof grass cover crops and sods in orchards should be based on the growth of the crop as soil testsfor this situation are not well correlated. In general, 50 to 150 lb N/ac are needed annuallydepending on the specific situation (FG-0028B, 1985).

3-72
For irrigated grass seed production, both bluegrass and orchardgrass respond well to Napplications and annual fertilizations with 120 to 160 lb N/ac are suggested for high yields. Forother species, 100 to 120 lb N/ac is usually adequate (Law et al., 1975). Thirty to 50 lb N/ac isneeded for establishment. In dryland situations, recommended N rates vary with averageprecipitation. In areas receiving <15" rainfall annually, 40 to 60 lb N/ac are recommended.Above 18" the recommended rate is 80 to 120 lb N/ac. Intermediate rainfall requires 60 to 80 lbN/ac. During establishment, 30 to 90 lb N/ac are needed with the low rate suggested for summerfallow areas, and the high rates suggested for seeding into former grass sod (Law et al., 1975).
N accumulationThe average annual N uptake of the turfgrass studies summarized in this report was 212
kg N/ha, with a range from 25 to 494 kg N/ha depending on the study and treatment evaluated(Table 3-12). On average, 0.0243 kg N were required to produce each kg of grass (range of0.0128 to 0.0364 kg N/kg dry matter).
Huang and Petrovic (1994) measured N uptake in weekly clippings of creeping bentgrass(Agrostis stolonifera L.) grown in a greenhouse to be equivalent to anywhere from 60 to 93% ofthe N applied, depending on composition of the soil (sand or zeolite-amended sand) and Napplication rate (98, 196, 293 kg N/ha). Only graphical results are presented. In general, higherfertilizer N recoveries were obtained at the lowest N application rate, and zeolite-amended sandhad higher recoveries than unamended sand. They report another researcher as finding thatabout 60% of applied N is recovered in creeping bentgrass clippings at N application ratesbetween 240 and 287 kg N/ha.

3-73
Table 3-12. Summary of N accumulation values reported in the literature for turfgrass.
CulturalPractices
Total N uptake†
Location Soil Mean Range UNU‡ FNR§ Reference
-- kg N/ha – kg N/kg %
Arizona mortar sandamended withvarious zeolite
%
Creeping bentgrassturf;25 to 50 kgN/ha/month
138 94 to 178 0.032 - Ferguson et al. (1986)
Italy sandy loam2.28% organic
matter
Mixed speciesathletic field; urea oroxamide N fertilizer(292 kg N/ha)
53 25 to 80 0.015 31 (25 to 36) De Nobili et al.(1992)
† Total N uptake = total plant N (harvested plant part + other above ground plant parts, not including roots).‡ Unit N Uptake = units of N in total plant (except roots) / unit yield. Values shown are the mean of the varioustreatments of that study.¶ FNR = Fertilizer N Recovery = estimated proportion of applied N taken up by the plant. Estimation is based oneither FNR or AFNR approach as described in the glossary given in Table 3-1. Values shown for each referenceare the mean and range for the various treatments of the study.
N accumulation is adversely affected by compaction - with several studies reviewed andsummarized by Carrow and Petrovic (1992). They cite studies showing that N use per unit areaand N recovery can have respective decreases of 21 to 39% and 10 to 31% due to compaction.Compaction effects were apparently species-dependent. Applying additional N was able toimproved N uptake in tall fescue, but not in Kentucky bluegrass. Additional analysis of thesestudies indicated that addition N application to an adequately fertilized, but compacted trufgrassstand could cause a marked reduction in rooting, therefor Carrow and Petrovic recommend thatturf managers not try to use additional N applications to improve growth in poor stands resultingfrom compaction.
A study of natural organic fertilizer (‘Restore’) effects on turfgrass growth rate and Nuptake rate was conducted in a North Carolina greenhouse (Peacock and Daniel, 1992). Theycompared growth rates of tall fescue and bermudagrass (Cynodon dactylon L.) in soil that wasamended with the organic fertilizer or with urea at rates of 50 kg N/ha. Because organicfertilizers require microbial activity to eventually release the organic N, they added a secondorganic fertilizer treatment that included a bacteria/fungi inoculumn. Tall fescue growth rateswere substantially higher in the urea treatment compared to either organic fertilizer treatment at19 days after treatment (1336 compared to 795 or 505 mg/m2/day) and at 33 days after treatment(690 compared to 296 or 312 mg/m2/day). The corresponding N uptake rates followed a similarpattern with values of 54.0 (day-19) and 25.8 mg N/m2/day (day-33) for urea compared to 23.4

3-74
and 5.7 mg N/m2/day for the Restore+inoculumn or 11.7 and 8.8 mg N/m2/day for the Restore-no inoculumn treatment. A similar patten of slower growth and N uptake rates with the organicfertilizer was observed in bermudagrass as well. Their results highlight that while organicfertilizers do provide N to turfgrass, the effect is much slower than using synthetic N fertilizers.The addition of a microbial inoculumn increased both rates 19 days after treatment, but the effectdid not continue through day-33.
Sartain (1992) also evaluated suitability of the natural organic fertilizer ‘Restore’ as an Nsource for turfgrass species, including perennial ryegrass, in Florida. He measured ryegrassgrowth and N uptake rates ranging from 1.0 to 2.6 kg/ha/day and 0.023 to 0.084 kg N/ha/dayrespectively over a three-year period. N applications during this period were either 50 or 75 kgN/ha every 90 days. Growth and N uptake rates are averaged over the two N application rates,the range in rates is due to the N source used. These N application rates correspond to annualapplications of 200 or 300 kg N/ha. The N uptake rates correspond to average annual N uptakerates of 8 to 31 kg N/ha. These researchers found that the N application rate and schedule usedwas suitable for maintaining ryegrass quality at their Florida location, and that there wasvariability among the organic fertilizer products evaluated. No measurements of residual soil Nwere made.
Fertilizer recovery and N use efficiencyIn a recent review of the fate of N in turfgrass, Petrovic (1990) summarizes research on N
uptake from eight turfgrass studies, primarily in lawn situations. (Four forage studies were alsoincluded.). Along with the discussion, he presents a large summary table of turfgrass N uptakeexpressed as percent of applied N. The summarized studies found that 5 to 74% of applied N istaken up by the plant. Most studies measured the N in clippings, though a few measured Nuptake in other plant parts (roots, stems, above ground uncut plant parts) as well. N uptakedepended on the N source, N release rate, N application rate, grass species, grass managementand use.
Turner and Hummel (1992) also summarize apparent recovery of applied N measured inseveral studies. They report ranges from 30 to 75%, depending on the study and applied N rate.A portion of applied N (14 to 27%) was retained in the thatch layer through immobilization(Turner and Hummel, 1992). In another study, the thatch of a mixed bluegrass/red fescue(Festuca rubra L.) turf was found to have 280 or 510 kg N/ha, depending whether clippings wereremoved or returned respectively (Starr and DeRoo, 1981). Hummel (1989) reported apparentfertilizer N recoveries (difference method) for a variety of slow-release N sources (and a urea

3-75
control treatment) at Ithaca, N.Y. Apparent fertilizer N recoveries ranged from 5.6 to 26.4% in arelatively cool year, and 26.7 to57.6% in a year with better growing conditions. All treatmentsreceived 196 kg N/ha, and only differed in their slow release characteristics
Starrett et al. (1995) determined the fate of 15N-labeled urea fertilizer (49 kg N/ha) sevendays after application to irrigated columns of undisturbed soil with an established turf ofimproved Kentucky bluegrass. Two irrigation schedules were used, both adding 2.54 cm ofirrigation. The first schedule added the entire 2.54 cm immediately after fertilizer addition, andthe second split the irrigation into four 0.64 cm applications, with the first applicationimmediately after fertilizer addition, and the remaining applications at subsequent 42-h intervals.They were able to account for 74.8 and 77.7% of applied N for the two irrigation schedulesrespectively (Fig. 3-11). In the single irrigation schedule, 6.5% was found in column leachateplus soil below 30 cm depth, 53.2% of applied N was contained in the thatch plus soil in the 0 to30 cm depth, and 14.6% of applied N was contained in the clippings plus verdue (uncut,aboveground plant parts). Only a negligible amount was volatilized. Denitrification was notmeasured, and the authors speculate that this may have been the fate of the missing applied N,since the columns were relatively moist. Clipping plus verdue and volatilization N recoverieswere similar in both irrigation schedules. The main difference between the two irrigationschedules was that in the split-irrigation treatment, only 0.9% of applied N was contained in theleachate plus soil below 30 cm depth. The difference was made up in additional N (60.5% ofapplied) contained in the thatch plus 0-30 cm depth soil.
Figure 3-11. Recovery of applied N in various N poolsunder split irrigation. (From Starrett et al. 1995)
Soil 10-20 cm12%
Soil 20-50 cm7%
Leachate0%
Unaccounted22%
T hatch+Verdue+clippings
32%
Volatilization0.3%
Soil 0-10cm26%
Split Irrigation

3-76
Miltner et al. (1996) determined the fate of N fertilizer in bluegrass turf by sampling atseveral intervals after a single 15N-labeled fertilizer addition of 39.2 kg N/ha (Fig. 3-12).Total labeled N recovery in the shoots + thatch + soil was between 64 and 92% for all samplingdates over the subsequent two year period. They found that about half of the applied N wascontained in the clippings + verdue (uncut green shoots) within 18 days after N application, andthat labeled fertilizer N in this shoot tissue did not change significantly over the time theyevaluated (2 years). Thatch N was also quite high initially (31% of applied labeled N), onlydropping off in the second year. Soil N did not change appreciably over the 2-y period. LeachateN was only detectible at the end of the second year, and even then, were 0.005 kg N/ha or less(not significantly different from zero). Their results indicate that there is substantial cycling of Nbetween the soil, thatch and shoots.
Only a few studies that measured NUE in turfgrass species were found in the literature(Sollenberger et al., 1984; Guillard et al., 1995). For all the treatments from these two studies,average NUE is 18 (range 9 to 33) kg dry matter/kg N supply. The average apparent N fertilizerrecovery for all the studies summarized in Table 3-12 is 50% of applied N, with a range of 25 to103% measured.
Figure 3-12. Recovery of applied N fertilizer in soil andvarious plant parts over time.
Recovery of 15 -N fertilizer
Days after adding N15-fertilizer (39 kg N/h)0 200 400 600 800
0
5
10
15
20
25
30
35
40
0 200 400 600 800
Labe
led
fert
ilize
r N (k
g N
/ha)
0
5
10
15
20
25
30
35
40
SoilThatchVerdueClippings
in Kentucky bluegrass

3-77
N distribution in turf plantsIn a study with perennial ryegrass (Lolium perenne L.) turf over a 48 hour period,
Bowman and Paul (1988) measured N partitioning of 40% in roots and 60% in the shoots, andthis ratio was unaffected by N form. In a later study, measuring N accumulation by perennialryegrass over a 48-h period, Bowman and Paul (1992) found an average of 32, 52, and 16% ofthe N contained in the new leaves, old leaves, and roots respectively. The N taken up during thisperiod represented 35-40% of the N applied. Bowman et al. (1989) estimated N uptake ratesunder conditions of moderate N-deficiency in four turfgrass species (Poa pratensis, Loliumperenne, Festuca arundinaceae and Agrostis palustris) by measuring depletion of applied N15 inthe thatch and soil. The majority of N recovered by the plants (all species) occurred in the first24 hours.
3.2.5 COVER CROPSNitrogen cycling benefits.
Cover crops are non-harvested crops that are inserted into rotations to recycle nutrients,build soil organic matter, protect the soil surface from erosion and provide natural pesticides.When used as green manures, they can serve as trap crops for recovering inorganic N. Aprimary benefit of cover crops is their ability to recycle nitrogen and reduce leaching losses andgroundwater contamination. Fertilizer nitrogen can be conserved through the use of cover cops.For example, cereal rye, annual ryegrass and hairy vetch retained 10 to 45% of the fertilizer Nand were more efficient than native weed species (Shipley et al., 1992). Other benefits includeprevention of nitrate leaching to groundwater, though the presence of cover crop residues mayactually increase N leaching, as a result of biomass decomposition and release of nitrogen,during heavy rainfall events or if overirrigation occurs (Miller et al., 1994). Staver andBrinsfield (1995) determined that overwintering rye cover crops dramatically reduced winternitrate leaching to groundwater. Weinert et al. (1995) also found significant reductions in deepnitrate movement (below 60 cm) in soil below overwintering/spring plowed cover crops,compared to fallow ground and fall incorporated cover crop treatments.
Fertilizer carryover frequently occurs following crop removal resulting in soil Naccumulation below 30 cm (Vanotti and Bundy, 1994). Residual fertilizer nitrogen followingcorn was conserved using winter cover crops in the Midwest (Shipley et al., 1992). Furthermore,soybeans have recovered up to 50% of soil nitrogen when used in corn rotations (Varvel andPeterson, 1992). Winter and spring beans, winter oats, winter rapeseed and spring peas increasedsoil nitrogen and subsequent wheat yields (McEwen et al., 1989). Lentil (Bremer and van

3-78
Kessel, 1992), soybean (Bergersen et al., 1992) and winter wheat cover crops increased soil Navailability to subsequent crops (Hart et al., 1993). Other evidence indicates that crimson cloverand hairy vetch cover crops were followed by increased corn yields (Wagger, 1989; McCrackenet al., 1989 and Sarrantonio and Scott, 1988), while rye cover crops produced inconsistent effectson corn yields (McCracken et al., 1989). Orchardgrass was also used to recover leachablenitrates from dairy manure ingrazing fields (Kanneganti andKlausner, 1994).
Wagger and Mengel (1988)summarized a number of studiesconducted in the eastern U.S.,indicating the extent of nitrogenuptake by wheat, rye or barley covercrops. Wheat or rye cover cropsfollowing corn generally retained 12to 91 kg/ha of soil nitrogen thatwould otherwise be available forleaching. The cover crops alsoreduced moisture below the rootzone, and therefore reduced leaching. Nitrogen uptake by wheat and barley varied depending onmineralization rates and the amount of nitrogen left in the soil following the cropping season.Overall, the experiments summarized by Wagger and Mengel indicate that cover crops may beutilized as nitrogen sinks in the recovery of excess fertilizer applied to corn and sorghum.
Cover crops can increase the amount of soil nitrogen maintained in the rooting zone overthe winter compared to fallow fields in Central Washington. Weinert et al. (1995) foundsignificant reductions in soil nitrogen levels below the potato rooting zone at the time of potatoplanting in fields with overwintering cover crops (Fig. 3-13). Root zone nitrogen is taken up bythe cover crop over the winter, stored in the crop biomass and released again in the spring whencover crops are plowed into the soil or killed by herbicides. Ideally, the cover crop residue willact as a slow-release fertilizer. The residual soil nitrogen is otherwise lost to deep leaching infallow fields.
The ultimate benefits of cover crop adoption include reduced grower cost throughreduced fertilizer requirements and reduced nitrate levels in groundwater as leaching decreases.
Figure 3-13. Reduction of nitrate leaching byoverwintering cover crops compared to barefallow and frost -killed cover crops at Plymouth,WA. (Weinert et al., 1995)
Soil Profile N at Plymouth, WA
NO3 - + NH4+ (lbs N acre-1)0 20 40 60 80 100
Dep
th (i
n)0
12
24
36
48
60
72
Fallow Control
Fall-incorporated mustard, sudangrass
Spring-incorporated rye, wheat, w. mustard

3-79
Growers will require a substantial history of success in maintaining yield quantity and qualitybefore they will be willing to reduce fertilizer use; however, little research has been done todevelop a nitrogen management program for fertilizer reduction following cover crops.Preliminary studies in cover cropped corn production systems used three different covertreatments (hairy vetch or rye plus corn residue or corn residue alone) and three fertilizer rates(0, 85 and 170 kg/ha). The study found that fertilizer use could not be significantly reducedwhile maintaining yield quantity and quality, though grain yield increased when vetch residueswere present (Utomo et al., 1990). McCracken et al. (1989) also found that corn yield and Nuptake were increased more in crops in fields with a history of hairy vetch winter cover crops(28.0 kg N/ha increase) compared to crops in fields with a history of only N fertilization (20.4 kgN/ha increase). Rye cover crops had little or no impact in comparison to no cover crop controlsin increasing N uptake in this experiment.
Cover crop N accumulation, rooting depth, and water use. Non-legume cover crops in the Graminae and Brassicae families serve as excellent cover
crops because they can rapidly germinate and establish an extensive root system, many of thecrops have good winter-hardiness and exhibit vigorous spring regrowth, and accumulate sizeableamounts of dry matter and N. A survey of the literature suggests these crops can accumulate upto 150 kg N/ha in many environments (Wagger and Mengel, 1988; Bowen et al., 1991; Brinsfieldand Staver, 1991; Hoyt and Mikkelsen, 1991; Shennan, 1992; Ditsch et al., 1993; Weinert et al.,1995) and establish effective rooting depths of 80 to 150 cm (Frye et al., 1985; Sarrantonio,1992; Weinert et al, 1995). In addition, actively growing cover crops transpire soil water,reducing the rate of soil water recharge and the potential for nitrate leaching between summergrowing seasons, when precipitation normally precedes evapotranspiration (Wagger and Mengel,1988). The production of 5 Mg of residue typically requires about 6 cm of water (Power et al.,1961; Hanks, 1983; Meisinger et al., 1991), which constitutes a major portion of the winterprecipitation in the Columbia Basin.
Recently, Weinert et al. (1995) observed white mustard, rapeseed, rye and winter wheatcover crops to accumulate between 2.9 and 4.6 Mg/ha dry matter and 112 to 142 kg N/ha whenplanted on August 25 in Plymouth WA. When incorporated as green manures for the succeedingpotato crop, the overwintering wheat, rye and rapeseed residues deplete the inorganic soil N andrecycle a major portion of the accumulated N (Fig. 3-14). However, when planted a month laterin a cooler season at Quincy, WA, the biomass and N accumulation was less than 50% of theprevious year (Weinert et al., 1995). This illustrates that the use of winter cover crops forrecycling N is limited to rotations in which there is a reasonable planting window for

3-80
establishing the covercrops in early fall. Forexample, sorghum-sudangrass is anincreasingly popularcover crop to be seededafter an early harvestedcrop such as fresh-marketpotatoes or sweet corn, sothat it can be planted bythe first week in August.Rapeseed and whitemustard grown at Prosser,WA released over 150 kgN/ha to the succeedingpotato crop (Brunty,unpublished data).
Factors affecting N mineralization from cover crop residues.Ladd and Amato (1986) found that total nitrogen recovery by wheat crops was 84%
greater when legumes provided crop nitrogen, compared to 80% from fertilizer nitrogen. Masonand Rowland (1992) found that wheat yields increased as the C/N ratio of the incorporated covercrop decreased. Findings in Das et al. (1993) support the importance of a critical C/N ratio.Residues with lower C/N ratios resulted in higher mineralization rates during the first 90 days ofdecomposition, though by day 120 there was no correlation between mineralization and C/Nratios. The critical C/N ratios (below which mineralization will occur) for 30, 60 and 90 days forfield capacity conditions were 46, 55 and 70. C/N ratios for 50% field capacity conditions for30, 60 and 90 days, respectively, were 39, 50 and 70. An analysis of eight experiments indicatedthat the critical C/N ratio is 40 and that 75% of differences in N mineralization rates among thesestudies could be explained by differences in C/N ratios (Vigil and Kissel, 1991). The C/N ratiosand residue N concentration were the most significant factors to be considered when predictingmineralization rates of wheat, rye, oat and crimson clover residues (Quemada and Cabrera,1995). Also, due to concentration of nitrogen and protein in plant grain, incorporation of cropresidues following harvest should result in a higher soil C/N ratio, compared to incorporation ofwhole grain-bearing plants.
Figure 3-14. N mineralization from green manured covercrops in synchrony with N demand by the succeeding potatocrop at Plymouth, WA. (Weinert et al., 1995)
Soil Inorganic N in Root ZonePlymouth, WA
Days from Potato Planting-50 0 50 100 150 200
lbs
N a
cre
-1
0
50
100
150
200
250ControlFall-incorporated w. mustard, sudangrassSpring-incorporated w. mustard, rye, wheat

3-81
Rates of residue decomposition are important to growers because nitrogen must beavailable to crops at the proper time (as the crops need them). For example, some crops such aspeas may have residues that make significant contributions to soil N only in over the course ofseveral years (Jensen, 1994). Similarly, soil-incorporated ground Medicago littoralis residuewith a C:N ratio of 11.1:1 contributed very little to soil N or crop N uptake (Ladd et al., 1983).In contrast, wheat residue is most available to the first crop following incorporation; 6.6% of Nfrom the winter wheat cover crop remaining in the soil was taken up in the first wheat cropcompared to 2.2% in the fourth year after plowdown. Sixteen percent of the cover crop-suppliedN was recovered (cumulative), 29% lost to leaching and denitrification and 55% remained in thesoil four years after plowdown (Hart et al., 1993). The large proportion of labeled N remainingin the soil may be a result of high C:N ratios found in wheat stubble (41-68 in this experiment).Another experiment determined that the net mineralizable N content of cover cropped soils didnot consistently increase until commencement of irrigation, 20 days after plowdown (Wyland etal., 1995).
Several studies indicate that residue placement is a primary concern in future Navailability. Post-harvest residue placement effects were most significant in the first 8-10 daysof decomposition, with higher rates of mineralization occurring when residues were incorporated(Aulakh et al. 1991); however, incorporation of non-leguminous post-harvest residues may resultin initial depression of N mineralization (Smith and Sharpley, 1990). Incorporation of residuesalso decreased the net immobilization period of high C/N ratio residues (Schomberg et al., 1994).Wagger (1989) found that older residues (by two weeks) decomposed/mineralized more slowlythan younger residues and decomposition occurs more slowly in drier years.
Temperature is another important factor in residue decomposition rates (Douglas andRickman, 1992). Air temperature, expressed in growing degree days, can be related to residuedecomposition rates. Furthermore, soil type, soil texture, pH and climate influence therelationship between degree days and rates of residue decomposition, though degree days remainan excellent prediction method for decomposition rates. Honeycutt et al. (1991) developed anequation to relate nitrate production to environmental factors affecting residue decomposition:
NO3-
= 784.558 - 1.271(MAP) - 93.057(pH) + 0.005(DD*pH) + 0.061(DD*H20)
Where:
NO3- = nitrate-N concentration (mg/kg)
MAP = mean annual precipitation (cm)pH = soil pH

3-82
DD = degree days (o
C)
H20 = soil water content (MPa)
Whitmore (1995) developed a crop growth and nitrogen uptake model in which thermaltime is the most significant uptake factor. The model is designed to predict nitrate leaching,mineralization rates and crop nitrogen accumulation, as well as dry matter and grain production.
Growth and N accumulation of individual cover cropsSorghum and Sorghum-sudangrass
A key factor in effectively using a sorghum-related crop as a cover crop is therequirement for warm temperatures at germination. Although sudangrass has not been well-studied, other sorghum crops have been evaluated for cold tolerance. Six varieties of Sorghumbicolor were evaluated for base temperature requirements for germination and root and shootelongation. Results indicate that minimum temperature requirements range from 3.5-11.4 oC forgermination, 6.8-12.2 oC for root elongation and 8.4-12.1 oC for shoot elongation (Lawlor et al.,1990). Other research indicates that sorghum has a base temperature of 10 oC. Sorghum plantedat temperatures below 10 oC will emerge less quickly and provide less cover (Anda and Pinter,1994).
Sudangrass nitrogen content increased linearly in response to added fertilizer nitrogen(generally applied as ammonium nitrate) at a rate of increase of 8.5 x 10⁻⁴%/kg N/ha. Maximumforage yields of 16.1 t/ha were reached at 350 kg N/ha applied nitrogen. Sudangrass yielded upto 16.1 t/ha (Muldoon, 1985). Nitrate nitrogen content of sudangrass shoots ranges from 360ppm to 5500 ppm, increasing with nitrogen availability. A study of seven hybrid sudangrasscultivars suggests that increases in yield in response to increased soil nitrogen are more dramaticafter the first month of growth (Harms and Tucker, 1973). Total nitrogen concentration in plantmaterial increased as applied nitrogen increased as fertilizer rates increased from 22 to 176 kgN/ha. However, total nitrogen uptake did not necessarily increase because dry matter actuallydecreased at higher application rates. Further studies indicate that soil type affects the nitrogenuptake capacity of sudangrass (Bartz and Jones, 1983).
BrassicasRecent studies indicate that soil water and air temperature have a considerable effect on
the low-yielding Brassica campestris, though less weather effect was observed in Brassica

3-83
juncea and Brassica napus (Hellstrom, 1994). B. napus, or rapeseed, root extension rates vary
with temperature, increasing with temperature between 5 and 23 o
C (Moorby and Nye, 1984).
Shoot and root growth rates are also reduced at when the entire plant is exposed to temperatures
below 10 o
C (Cumbus and Nye, 1985). A possible explanation for the increased growth rate at
higher temperatures is presented in Macduff et al. (1987), wherein nitrate and ammonium ionsare taken up four times faster at 17 oC compared to 3 oC over 14 days.
Comparisons of canola seedling germination and early seedling development indicate thattemperature affects these parameters as well. Poor germination and growth occurred at 2 and 6o
C, 95% germination was attained between 8-12 days at 10o
C and germination occurred most
rapidly at 22o
C (Nykiforuk and Johnson-Flanagan, 1994).
Studies of nitrogen uptake in canola and rapeseed have focused almost entirely onincreases in seed yield and seed nitrogen content as a function of soil nitrogen for plants intendedto grow through the summer, as opposed to winter cover crops. Fertilization requirements forwinter rapeseed crops are described in Mahler and Murray (1989). Ramsey and Callinan (1994)found that increasing fertilizer application on canola crops increased seed nitrogen content in theform of protein; however, canola and rapeseed grown as cover crops will generally not beallowed to grow long enough for seeds to develop. No mention was made of nitrogenaccumulation in shoots, though nitrogen accumulation did appear to increase as soil moistureincreased. Darby and Yeoman (1994) found that nitrogen accumulation in August-sownrapeseed was not affected by increased soil nitrogen, except where straw residue from a previouscrop had been burnt. Straw incorporation generally decreased yield. Plant establishment forSeptember-sown crops depends heavily on winter kill damage as well as planting method.Establishment is greater when seeds are drilled, compared to broadcast seeding. Another studyindicates that increased soil nitrogen may improve rapeseed growth more significantly followingcereal crops compared to rapeseed following pasture (Stoker and Carter, 1984). Seeding ratesand nitrogen uptake appeared to interact in another study, at least in a year of abnormally highprecipitation (Lewis and Knight, 1987). Increased soil nitrogen levels increased the water useefficiency of canola plants (Taylor et al., 1991). Irrigation increased rapeseed dry matteraccumulation response to soil nitrogen compared to rainfed conditions. Higher soil nitrogenlevels increased the leaf area index (Wright et al., 1988). Leaf and stem nitrogen concentrationsincreased as fertilizer applications increased and the timing of applications increased Nconcentrations when higher levels of fertilizer were applied at the time of sowing, compared to

3-84
applications delayed until plants reached the rossette stage of development. Also, Nitrogenrecovery rates ranged from 18% to 96% in the top 25 cm of soil and from 26% to 98% in the top50 cm of soil. Recovery rates depend on fertilizer time, the use of split applications and whetheror not the crop is irrigated. Irrigated conditions where 100 kg N/ha was applied at sowing (asimilar condition to the presence of large amounts of nitrogen from a previous crop at sowing)resulted in the greatest apparent recovery and retention of N (96-98%) in the top half meter ofsoil (Smith et al., 1988).
Research concerning nitrogen uptake by mustard crops has focused almost entirely on theeffect of added fertilizer nitrogen on seed yield. Once again, pre-plant soil nitrogen levels andnitrogen uptake efficiencies are rarely, if ever mentioned. However, an early study on nitrogenrelationships in mustard were conducted by Kahn and Agarwal (1983). The study wasconducted in soil with initial nitrogen contents of 195, 180, 185 and 183 kg N/ha at depths of 0-30, 30-60, 60-90 and 90-120 cm, respectively. Total plant nitrogen concentration at floweringstage increased from 1.42% with no fertilizer addition to 1.75% when 80 kg N/ha was added(adding another 40 kg/ha did not significantly increase nitrogen concentration). Dry mattertotals, rooting depths and nitrogen uptake efficiencies were not reported. No significantdifferences in nitrogen concentration were observed under different soil moisture regimes (Khanand Agarwal, 1983). Narang and Singh (1985) found that nitrogen uptake by Indian mustardcrops increased the most dramatically between 78 and 11 days of growth in the first year of thestudy, with only slow increases in nitrogen content between 40 and 78 days after planting andslow increases or even decreases in N content between 78 and 111 days after planting. However,results from year 2 indicated that the greatest increase in nitrogen content occurred between days40 and 74. The percent nitrogen recovered was greater in the second year compared to year oneand percent recovery was greater at the lowest fertilizer rates in both cases. In year 1, the croprecovered 25.0, 20.1 and 16.1 of added fertilizer nitrogen for application rates of 50, 100 and 150kg N/ha, respectively. Year 2 results, for the same respective fertilizer application rates, hadrecovery percentages of 52.6, 50.6 and 44.2%. The differences in total recovery were attributedto the high rate of nitrogen accumulation in the early vegetative stage in year 2, compared to thelater stages of vegetative growth in year 1, though the underlying reason was not determined.
Wheat, Triticale and RyeRye and triticale have been shown to accumulate dry matter faster than wheat when
grown at temperatures of 10 and 20o
C. The tolerance of rye for lower temperatures may arise
from several factors. First, winter rye cultivars appear to have adaptations in the photosynthetic

3-85
apparatus that increases resistance to freezing (Oquist et al., 1993). Second, leaves of cold-adapted rye varieties endogenously produce an antifreeze protein that inhibits ice formation onleaves (Griffith et al., 1992). Finally, increased daylength (16 vs. 24 hours) and irradiance
positively affect both growth and frost tolerance of cold-grown rye (5/3o
C day/night) (Griffith
and McIntyre, 1993).
Klepper et al. (1982) developed methods to quantify and model developmental stages ofsmall cereal grains, specifically relating leaf and tiller development to environmental conditionsfor model development. Klepper et al. (1984) characterized root and shoot development overtime, as well as root classifications and order of development. Klepper and Rickman (1990)used root development and classification information to model root growth and function.Growth of two wheat cultivars, Sunset and Rosella, increases linearly with temperature (10-
25o
C) while growth of Condor and Cappelle Desprez showed rapid growth increases only
between 10 and 19 o
C. Base temperatures for growth to anthesis of the four varieties ranged
from 2.5-5.5 o
C, with an average of 4 o
C; base and optimum temperatures increased with each
group as growth stage of the plant increased.
One study suggests that root cooling reduces leaf growth by reducing hydraulicconductivity of stems, thereby causing water stress in the plant (Malone, 1993). Inhibition ofwheat growth appears to continue in cold-treated plants even after the cold conditions are
removed. Seedling hydration decreases as plants grow at 2 o
C compared to plants grown at 20o
C and hydration remained lower in 2 o
C plants transferred to 20 o
C as compared to control
plants (Dubert et al., 1994). Comparisons of winter rye, barley, oats and ryegrass were comparedas potential cover crops to follow late potatoes. Rye biomass was 38% greater than barley, 80%greater than oats and 130% greater than ryegrass. In an additional field study, rye root biomasswas twice that of winter rapeseed. Seed mass may account for a considerable portion of thesedifferences (Edwards and Sadler, 1992).
Undersander and Christiansen (1986) found that water availability has a significantimpact on wheat growth and inclusion of water variables in GDD equations provide more
accurate results. In addition, a base temperature of 4o
C provided greater accuracy than a base
temperature of 0o
C. Baker et al. (1986) found that leaf emergence rates were affected by
irrigation and cultivar. Another study indicated that low moisture reduced percent tiller

3-86
formation, though only in the coleoptile tiller, final mainstem leaf appearance (decreased withdecreasing moisture) and increased the number of GDD before tiller appearance (Krenzer et al.,1991).
Planting date has been shown to determine rate of leaf growth. Equations 11 through 16indicate main stem leaf numbers (LN) for wheat as a function of degree days (DD), according tothe corresponding planting date (Cao and Moss, 1991):
22 September: LN = 0.52 + 0.0114*DD13 October: LN = 0.97 + 0.0103*DD3 November: LN = 0.18 + 0.0123*DD24 November: LN = 0.22 + 0.0.122*DD15 December: LN = 0.44 + 0.0137*DD5 January: LN = 0.57 + 0.0142*DD
Planting date may affect phyllochron values for two primary reasons. First, plants transferredfrom low to high temperatures showed accelerated growth while plants transferred from high tolow temperatures showed varied responses, depending on stage of development. Older plants areless affected by a temperature drop. Second, plants transferred from short to long days showedaccelerated growth and emergence while plants transferred from long to short days were againaffected according to stage of development. Older plants were more affected in this case (Caoand Moss, 1994). Finally, a recent evaluation of nine equations developed to estimate wheatphyllochron indicated that none of the equations, including some of those listed above, are validacross a wide variety of cultivar types. Correlation coefficients ranged from 0 to 0.119 forwinter varieties and 0.008 to 0.486 among spring cultivars. Therefore, these equations may notaccurately predict wheat growth rates when used as general estimates for growers (McMasterand Wilhelm, 1995).

4-1
4. LAND APPLICATION METHODS AND CRITERIA FOR ORGANIC WASTEAND PROCESSED WATER RECOMMENDED TO PREVENT N LEACHING
Organic waste is defined here to include animal manure, crop residue, food processing
and other industrial waste, treated municipal wastewater, and biosolids (sludge from treated
wastewater). Organic wastes are potential resources that can serve as fertilizer and as beneficial
soil amendments. Hazardous heavy metals may be present in these organic wastes and must be
dealt with according to State regulations. Manure is a good source of plant nutrients, including
nitrogen, phosphorus and potassium. Furthermore, land application of organic waste improves
the physical and microbiological properties of the soil, which are beneficial for good crop growth
and production. However, it is essential to know the optimum amounts of organic waste to apply
because excessive applications potentially contribute to environmental pollution through
leaching and runoff of the surplus nutrients. Computing organic waste application rates to
balance nutrients with crop needs while protecting the quality of surface water and groundwater
is necessary to meet public environmental concerns.
Processed water applied to a land treatment system, LTS, is usually applied by sprinkle(spray) irrigation. LTS are used frequently in some parts of Washington. Sixty-five facilities inWashington have LTS permits (Carey et al., 1994). Fifteen are allowed to discharge up to3,785,000 liters per day to their LTS. The ultimate concern of the state of Washington(Department of Ecology) is whether the LTS are designed, operated, and maintained so thenitrogen loads to the LTS do not exceed their capacity and contaminate groundwater with nitrate-nitrogen.
Some agricultural activities produce significant amounts of waste containing nitrogen,including manure* and food processing waste. Municipal and industrial processed watereffluents and their biosolids** may also contribute important amounts of nitrogen. Processed
* As excreted, manure is called fresh, or raw, manure consisting of feces and urine. In practice, manure is usually acomposite of feces, urine, spilled feed and drinking water, bedding, and process water (flush cleaning, wash water,etc.).
** Biosolids means municipal sewage sludge that is a primarily organic semisolid product resulting from thewastewater treatment process, that can be beneficially recycled and meets all applicable requirements under Chapter173-308 Washington Administrative Code. All applicable requirements include those of the U.S. EnvironmentalProtection Agency.

4-2
water must be treated before disposal, and manure is stored with variable treatment before landapplication.
4.1. Organic waste and processed water treatmentOrganic wastes have similar characteristics (properties) that influence their biochemical
degradation to their end products. Whether biosolids or wastes/processed waters from food
processing, livestock production, and municipal wastewater treatment, all have common
characteristics but they differ in magnitude. Regardless, the reactions during storage, land
application, and in the soil-plant-water system follow the same physical and biochemical laws.
Municipal and industrial processed water treatment is regulated by a permit from theWashington Department of Ecology that specifies the total maximum daily load (TMDL) thatcan be discharged in the treatment plant effluent. The TMDL includes some or all of thecontaminants biochemical oxygen demand, suspended solids, nitrogen forms, phosphorus, andheavy metals. In brief overview, processed water is commonly treated in a plant by threeprocesses: primary, secondary, and tertiary treatment. Primary treatment settles the solids.Secondary treatment to degrade the waste employs one of several aerobic processes that includedisinfection. Tertiary treatment removes nutrients, nitrogen and phosphorus, and also candisinfect the wastewater so the treated effluent can be discharged to a stream. Primary settlingand secondary settling of bacterial solids from secondary treatment produces sludge commonlystabilized by treatment in an anaerobic digester. When treated sufficiently to meet USEPAcriteria sludge is called biosolids and is suitable for land application (footnote page 4.1). Theyare further treated by various dewatering methods to facilitate handling and storage. Processedwater treatment plant effluent can frequently be applied to crop or forest land. Wastewatertreatment plants are not economically feasible for small towns so they use oxidation ponds(aerobic lagoons) and generally need land disposal of effluent to acceptable crops unlessevaporation is sufficient to remove the stored water.
Treated wastewater, biosolids, manure, and food processing waste are handled similarlyin that they are kept in short-term to long-term storage, which results from detention time of aflow or fill and draw methods. Handling is by gravity, pumps or mechanical means. Section 4.2describes animal manure handling systems. Organic wastes and processed waters are handledsimilarly by collection, transport, storage and/or treatment, transport and application to land.Municipal and industrial processed waters are treated by sophisticated processes to allowdischarge to streams or water bodies. Wastes used on agricultural cropland need little

4-3
stabilization. The organic matter and plant nutrients (N, P, K) have soil and crop productionvalue. The composition varies with the kind of waste/processed water and how it is treated.Nitrogen is the characteristic of concern here. Table 4.1 gives total nitrogen examples forselected waste/processed water relative comparisons.
Table 4.1. Total Nitrogen in Selected Waste and Processed water
Biosolids Dairy Manure Fruit and Potato Municipal Wastewater Solid Lagoon Vegetable Processing Primary Secondary
Processing Influent Effluent % db % wb mg/L mg/L mg/L mg/L mg/L
Total N 3.3 0.44 560 17 130-175 40 27Source: Ardern, 1976; Hermanson, 1996; Adriano and Erickson, 1974; Smith et al., 1976;Liu et al., 1997; Palazzo 1976; USEPA, 1983; MWPS, 1985; Bezdicek, 1977; Smith andMcWhorter, 1976; MWPS, 1985; and Don Nichols, ERO Dept. of Ecology, Spokane, WA.Communication to Diane Dent-White, DOE Headquarter, Lacey, WA. October 29, 1998.
The best waste/processed water handling system will make the best overall use ofavailable land, labor, and capital. The system must avoid pollution and nuisance problems andideally will fully use the waste's fertilizer and soil conditioning characteristics. Mostwaste/processed water management systems ultimately return the organic waste to the land.There must be a storage or detention period between collecting and removing waste from thefacilities and application to cropland. Care must always be taken to prevent any waste orprocessed water from reaching the surface and groundwater of the state and violating the waterquality standards.
Livestock manure is used as the primary example of waste/processed water historicallyapplied to the land as a LTS to treat by the crop-soil-water-nutrient-climate system. The purposegoes beyond producing an economic crop because protecting the quality of surface water andgroundwater is required by state and federal law. More than four decades of research hasproduced coefficients needed for the methodology used to calculate application rates withworksheet methods that were developed first, and with computer software used today. Beforepresenting the methods used in determining manure application rates, it is appropriate to notethat the methods were designed as a framework with procedures that can be adapted for other

4-4
organic waste/processed water. The procedure requires certain coefficients specific to the kindof waste/processed water:1. Default values were designed to be easily changed to waste/processed water specificcoefficients.
a) Application losses of ammonia-nitrogen.b) Mineralization rates.
2. Denitrification and nitrogen uptake are independent of the kind of waste/processed water.3. Nutrient analysis of the specific waste/processed water to be applied.4. Soil test.
4.2 Land application systemsSystems used for applying organic wastes to cropland differ for wastes in solid (semi-
solid usually) or liquid form, however, the functions are similar. Successful application beginswith scientifically based calculations of the application rate for the crop. Timeliness of theapplication with respect to the stage of crop growth, the season, and whether the soil is too wet,frozen, or snow covered to apply waste/processed water to land is imperative. The managementplan must consider these factors to produce crops successfully and to protect the quality ofsurface water and groundwater. The Natural Resource Conservation Service (NRCS), formerlythe Soil Conservation Service (SCS), specifies in a nutrient standard: "Organic nutrient liquidsshall not be applied to frozen, saturated, or snow-covered soils. However, the plan shoulddesignate the best application sites for use in the event of emergency weather conditions orflooding," (Soil Conservation Service, 1993). The standard is designed to protect surface waterfrom contamination, not to protect groundwater. However, applying the amount of manurenitrogen correctly calculated for the crop minimizes the chance of nitrate-nitrogen leaching togroundwater. Irrigation of crops based on crop water requirements determined by a schedulingprogram will minimize percolation and thus leaching of nitrate-nitrogen. All application systemscited will protect groundwater quality provided they are properly managed. Management is thekey to achieving the goals of the producer and the demand of the public for clean water.
Storing and Spreading As a SolidThis system usually has short-term storage between the time of collection and land
spreading. Long-term storage works well in high-rise layer houses. For other livestock manure,a roofed facility may be needed in high-rainfall areas with drains to convey liquid to separatestorage.

4-5
System components:c) Scraper.c) Storage unit.c) Ramp or front-end loader.c) Spreader.
Storing and Spreading As a LiquidSome producers believe that a liquid system is best. Land spreading of liquid waste,
however, is not as simple as many thought. Two major disadvantages are the cost of the systemand the odors associated with agitating and field spreading partially decomposed manure. Inaddition, a greater volume of manure is handled in a liquid system than a solid system because ofdilution water. Advantages are minimal labor cost because the manure is usually flushed fromthe system with recycled water and transported by pumps. Systems can be operated with micro-processor timers and electrically activated valves and pumps, further reducing labor costs.Because a reinforced concrete tank for long-term storage is too costly, most producers use ananaerobic storage lagoon. Manure is scraped or flushed into the lagoon. Alternative injectionequipment places the liquid slurry 10 to 15 cm below the ground surface and covers itimmediately. Tillage offers the same opportunity to incorporate the slurry soon after application.Injection and tillage significantly reduce the ammoniacal-N loss over the loss ifslurry/wastewater were to remain on the land surface. Soil incorporation (injection/tillage) alsoprotects air quality by placing the slurry/wastewater in the soil to prevent release of anaerobicodors. However, quick incorporation of ammonia-N after application reduces N removal byvolatilization and increases the amount of nitrate-N in the soil (via transformation of ammonia tonitrate) potentially available for leaching.
Big gun sprinklers that are moved between sets are common, but are rapidly beingreplaced with traveling sprinklers. Center pivot systems can be used for very dilute manurewater. A tank wagon equipped with a vacuum pump may be used with small lagoons, but aseparate pump for mixing and loading works better. A rear-loading tank wagon can be backeddown a ramp into the lagoon. The use of tank wagons is limited to small lagoons (earth storagebasins), because tank wagon capacity is too low to be practical for large lagoons. The greatestproblems with lagoons are odors and the difficulty in removing solids. The lagoon effluentshould not be spread on a hot, humid day because odors resulting from the spreading operationmay create a nuisance. Correct lagoon design and management can minimize odors. Solidsremoval is aided by mixing with a propeller provided the lagoon is not too large. Due to the

4-6
difficulty of solids removal, the separation of solids is recommended to yield solids and manurewater that is stored in the lagoon. A special sieve (screen) or a concrete solids-settling basin canaccomplish this to improve materials handling. Separated solids can be composted and used asbedding, applied to the land, or sold if a market exists.
System components:c) Scraper.c) Flush system.c) Optional solids separator.c) Anaerobic lagoon.c) Pump or propeller agitator.c) Irrigation or spreader.
Loss of Nitrogen Due to Application MethodNitrogen losses for the common application methods are given in Table 4.2 (Hermanson,
et al., 1995):
Table 4.2. Manure Ammonia Nitrogen Loss Due to Application Method: Percent of TotalKjeldahl Nitrogen
Application Method Loss, %Broadcast Spreader 20Broadcast Spreader, immediate tillage 5Grazing 17Sprinkling 25Sprinkling, very dilute, solids separated 7Sprinkling, immediate tillage 7Tankwagon 20Tankwagon, inject or immediate tillage 5
Nitrogen loss due to ammonia volatilization differs somewhat from manure to biosolidsas shown in Tables 4.2 and 4.3. However, this is not a drawback to the use of Manure NutrientBalancer (MNB) because the user can easily change default values to those appropriate to thewaste/processed water being studied. (Hermanson et al., 1995).

4-7
4.2.1 Municipal wastewater effluentTreated municipal wastewater is applied to cropland in many rural locations in eastern
Washington. Ecology conducted a study reported by Carey (1995) of the Deer Park landapplication site. Wastewater was treated in an aerated lagoon and two storage lagoons. The LTSconsisted of a 64.8-ha alfalfa spray field divided into 9, 6.88-ha fields. Three of the fiveobjectives were to 1) characterize the soil pore-water under the fields before mixing withgroundwater; 2) estimate effluent nitrogen treatment in the unsaturated zone; and 3) evaluateeffectiveness of unsaturated zone monitoring.
Table 4.3 Estimates of Ammonia Plus Ammonium-N Loss Due to Biosolids ApplicationMethod.
Tillage within0-2 days >6 days
Loss, % of appliedLiquid, pH>7 20 40Dewatered, pH>7 40 60Liqiud or Dewatered, pH<7 10 10Lime stabilized 90 90Composed or drying bed andinjection
No loss
Soil sampled to 28.4 cm deep located coarse sand that is typically very permeable. Thinlayers of loam resulted in greater water holding capacity than normal. The discharge permitallowed effluent application April through September. Precipitation plus effluent was limited to3.2 cm/month or 2.3 million liters/day. Treatment of total nitrogen in the unsaturated zone waslow. Ninety-one to 183 cm from the surface the treatment ranged from 26 to 35% from a lowapplication of total nitrogen of 112 kg/ha. Suction and wick lysimeters provided morerepresentative samples than the barrel lysimeters. Mean total nitrogen concentrations in the wickand suction lysimeters were 17 and 6.8 mg/L, respectively. The effluent loading appeared toaffect downgradient monitoring wells because nitrate+nitrite-nitrogen increased during the study.
General recommendations included that future permits for LTS should monitor theunsaturated zone. Such monitoring can help evaluate LTS practices at specific sites and enableprompt adjustments to improve treatment and protect water quality.

4-8
4.2.2 Food processing wasteWaste and processed water from food processing plants in the nation are applied to
agricultural land for treatment and disposal as a preferred practice. Food processing wastesderive from fruit, vegetables, dairy products, seafood, meat, poultry, etc. Agricultural land treatsthe organic constituents by soil microbial decomposition to avoid serious environmentalpollution (Smith, 1986). A well-designed and managed system does not endanger groundwaterquality nor surface water quality. Microbial degradation of the organic constituents in waste andprocessed water releases nutrients to be used by the crops growing as part of the treatmentsystem. Most food processing waste effluents can be applied to agricultural land to supply waterand crop nutrients. Thus, the land treatment system (LTS) provides beneficial use of the wasteresource. There are several land treatment methods that can be used by food processors. Theseare slow rate, rapid infiltration, and overland flow (Ritter, 1987). Slow rate land treatment ismost common and is used by Pacific Northwest food processors. Slow rate treatment includesapplication by spraying (sprinkling), ridge and furrow, or flooding.
Clearly, nitrogen loading must be designed correctly for food processing wastewaterLTS. Organic loading must also be considered. Limiting nitrogen application to the amountcrops can use normally keeps the organic load to the amount that will decompose betweenapplications. Field and laboratory experiments by Jewell (1976) and Jewell and Loehr (1975)showed that soils conditioned to receive processed water carrying organic matter can handle highloading rates under favorable conditions. Two LTS fields received vegetable processing plantprocessed water loads of 9,000 kg chemical oxygen demand per ha-day with >99% removalefficiency. Food processing wastes were considered treatable by LTS and the soil wasdetermined to have great capacity to assimilate these organic wastes. The nitrogen concentrationin organic processed waters is usually low, nevertheless the application rate is not controlled aseasily as for commercial fertilizer. The timing of processed water irrigation and the amount areimportant because the demand of a crop for water is not necessarily at the same time as thedemand for nutrients (Krauss and Page, 1997). Application of processed water when the cropneed for nitrogen is low can cause leaching of nitrate-nitrogen. Both nitrate nitrogen andprocessed water rates must be monitored and controlled to reduce the potential for groundwatercontamination.
4.2.2.1 Potato wasteLarge amounts of nitrogen can be supplied to the land in food processing wastewater
(Smith et al., 1975, 1978). Smith (1976) studied LTS of potato processors in Idaho anddetermined that 160 to 490 cm of processed water was applied annually. Nitrogen supplied to

4-9
the land was 1,080 to 2,200 kg N/ha. Potatoes were processed most of the year, producing largedischarges of processed water ranging from 1.9 to 19 million liters per day. The long processingseason discharged so much processed water that excessive nitrogen was applied to the landtreatment system. Smith et al., (1975) determined nitrogen application rates for five potato-processing wastewater irrigation systems in Idaho. Annual nitrogen applications ranged from800 to 2,200 kg/ha, however, grass grown on the application fields could not use that muchnitrogen. The researchers concluded that soil nitrate-N increased and likely leached togroundwater.
The US Environmental Protection Agency raised concerns in 1994 about the efficacy ofstate issued permits to protect groundwater quality at six potato processing plants in the mid-Columbia Basin, Washington. Reports by the US Geological Survey (Jones et al., 1995)indicated increased nitrate-nitrogen concentrations in groundwater in local areas in the mid-Columbia Basin. Ecology responded with a study reported by Cook (1996) to assess the abilityof each permit to protect groundwater quality and to determine the effect on groundwater qualitynear each plant. The plants studied were one each at Connell, Pasco, Richland, Moses Lake andtwo at Othello, all in Washington.
Methods for conducting adequate hydrogeologic assessments of the effects ongroundwater quality were not used when potato processors in Washington began land applicationof processed water (Cook, 1996). The Department of Ecology (Ecology) developed landapplication guidelines in 1993 that provided consistent evaluations of land application.Statewide groundwater quality standards provide Ecology with regulatory means for establishingpermitting requirements for LTS.
The improvements made at the six plants that were under permit were documented byCook (1996). The resultant changes are abbreviated here:1. Connell - Cropland for land application was increased by 243 ha in 1993. A lined lagoon for
90 days of winter storage was constructed and aerated for odor control. The nitrogenoverload was reduced by treatment in constructed wetlands. Wetland treatment and lagoonstorage was predicted to reduce the nitrogen load 70 percent from the current value. During1993-1994 groundwater nitrate-nitrogen concentrations in three of five downgradientmonitoring wells statistically significantly exceeded background concentrations.Concentrations in three of the monitoring wells exceeded the MCL of 10 mg/L. Movement ofnitrate-contaminated water beyond the facility could not be determined due to lack ofdowngradient wells.
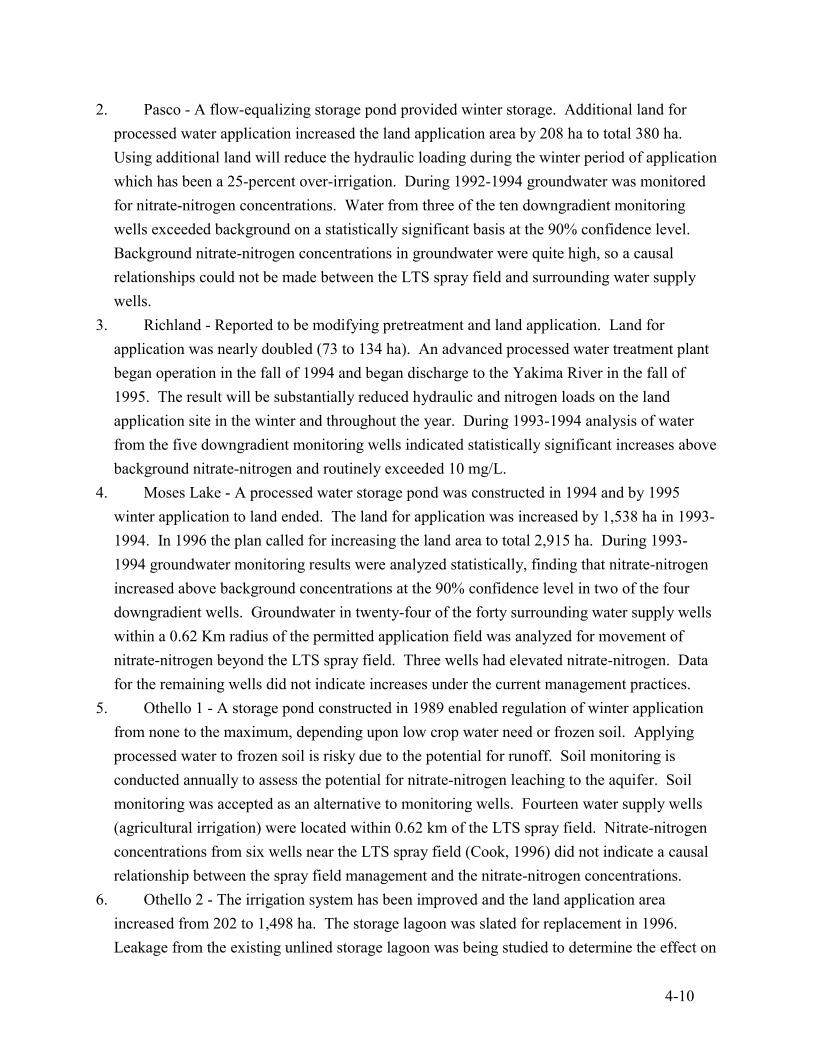
4-10
2. Pasco - A flow-equalizing storage pond provided winter storage. Additional land forprocessed water application increased the land application area by 208 ha to total 380 ha.Using additional land will reduce the hydraulic loading during the winter period of applicationwhich has been a 25-percent over-irrigation. During 1992-1994 groundwater was monitoredfor nitrate-nitrogen concentrations. Water from three of the ten downgradient monitoringwells exceeded background on a statistically significant basis at the 90% confidence level.Background nitrate-nitrogen concentrations in groundwater were quite high, so a causalrelationships could not be made between the LTS spray field and surrounding water supplywells.
3. Richland - Reported to be modifying pretreatment and land application. Land forapplication was nearly doubled (73 to 134 ha). An advanced processed water treatment plantbegan operation in the fall of 1994 and began discharge to the Yakima River in the fall of1995. The result will be substantially reduced hydraulic and nitrogen loads on the landapplication site in the winter and throughout the year. During 1993-1994 analysis of waterfrom the five downgradient monitoring wells indicated statistically significant increases abovebackground nitrate-nitrogen and routinely exceeded 10 mg/L.
4. Moses Lake - A processed water storage pond was constructed in 1994 and by 1995winter application to land ended. The land for application was increased by 1,538 ha in 1993-1994. In 1996 the plan called for increasing the land area to total 2,915 ha. During 1993-1994 groundwater monitoring results were analyzed statistically, finding that nitrate-nitrogenincreased above background concentrations at the 90% confidence level in two of the fourdowngradient wells. Groundwater in twenty-four of the forty surrounding water supply wellswithin a 0.62 Km radius of the permitted application field was analyzed for movement ofnitrate-nitrogen beyond the LTS spray field. Three wells had elevated nitrate-nitrogen. Datafor the remaining wells did not indicate increases under the current management practices.
5. Othello 1 - A storage pond constructed in 1989 enabled regulation of winter applicationfrom none to the maximum, depending upon low crop water need or frozen soil. Applyingprocessed water to frozen soil is risky due to the potential for runoff. Soil monitoring isconducted annually to assess the potential for nitrate-nitrogen leaching to the aquifer. Soilmonitoring was accepted as an alternative to monitoring wells. Fourteen water supply wells(agricultural irrigation) were located within 0.62 km of the LTS spray field. Nitrate-nitrogenconcentrations from six wells near the LTS spray field (Cook, 1996) did not indicate a causalrelationship between the spray field management and the nitrate-nitrogen concentrations.
6. Othello 2 - The irrigation system has been improved and the land application areaincreased from 202 to 1,498 ha. The storage lagoon was slated for replacement in 1996.Leakage from the existing unlined storage lagoon was being studied to determine the effect on

4-11
groundwater quality. Annual soil monitoring was required to determine the leaching potentialof nitrate-nitrogen to groundwater. Groundwater monitoring was not required because oflocal hydrogeology. During 1994 sixteen surrounding irrigation and domestic wells weremonitored for nitrate-nitrogen. Fourteen wells had no evidence of groundwater contaminationdue to the LTS spray field. Two wells had previous nitrate-nitrogen concentrationssignificantly greater than in the surrounding wells. This appeared to be a local effect.
According to Ecology's report (Cook, 1996) from 1990 to present (1996) the potatoprocessing facilities operating within the Columbia Basin have adopted measures to reducegroundwater contamination by nitrate-nitrogen, both currently and in the future. These measuresreduced the nitrogen applied to spray fields on average 48 percent thereby significantlydecreasing the potential contamination of local and regional groundwater. The followingpractices were implemented by one or more of the facilities:• Acquired additional land to apply processed water.• Installed lined impoundment's for winter storage.• Limited processed water application to agronomic rates during the growing season and either
reduced or halted application during winter months.• Employed additional pretreatment to the processed water to reduce the concentration of
nitrogen compounds in applied process processed water.• Installed comprehensive groundwater and soil monitoring networks to assess spray field
(land application) management techniques.Whereas there was local nitrate-nitrogen contamination, Cook (1996) did not find current
evidence that spray field operation, past of present, caused contamination of offsite domesticwells or community water supply wells.4.2.2.2 Fruit waste
The Tree Top LTS near Selah, Washington on the west bank of the Yakima River wasselected by Ecology (Carey et al., 1994) for a study that was conducted June 26-December 7,1992. The objectives were to determine 1) the effectiveness of the LTS in treating processedwater in a typical setting for treating organic wastewater, 2) the effectiveness of lysimeters vs.wells for monitoring LTS, 3) the rate that liquid moves through the unsaturated zone, and 4)recommendations for improving the efficacy of the Tree Top LTS.
Wash water from fruit processing is a major kind of organic waste in central Washington.Such processed water from the Tree Top plant was applied to 146 ha of nearby cattle pasture totreat the processed water and irrigate the pasture. The pasture soil was determined to bealluvium with a shallow water table. Nearly 3,785,000 liters/day of processed water wereapplied during the study period. Processed water was mixed with irrigation water and applied

4-12
with small sprinklers at intervals of 18-20 days. The average annual application was 170 cm.Twenty-seven percent of this was processed water. The total nitrogen application was estimatedto be 10-34 kg/ha-day before sampling in July, August, and October. Total nitrogenconcentrations in the wells often exceeded the barrel lysimeter values. Mean well values werequite stable for the four sampling dates at about 2-2.5 mg/L. Mean barrel lysimeter values wereabout 1-2.5 mg/L.
A general finding of the study was that monitoring the unsaturated zone was a moresensitive measure of nutrient loading to groundwater, based on comparing lysimeters and nearbyshallow wells. Specifically for the Tree Top LTS, the study found that total N was treated in thetop 46 cm of soil. Total nitrogen was treated 95% with a standard deviation of 6.8%. (Thisreviewer assumes 95% treatment is a 95% reduction of total nitrogen.) Nitrogen applicationrates were found to exceed monthly Ecology permit limits by 2-5 times. Managers must beaware that nitrogen can be over-applied if processed water and commercial fertilizer nitrogenrates are not planned jointly. Monitoring the unsaturated zone was recommended for the TreeTop LTS to help predict potential problems before groundwater is affected. These data can beused to assess LTS performance and modify management to improve treatment efficacy.
Most food processing wastes can be used on the land as a source of plant nutrients(especially nitrogen) and irrigation for crops (Smith and Peterson, 1982). The organic materdecomposes in the soil making nitrogen available. Nitrogen is seldom deficient to limitdecomposition.
4.3 Criteria for determining land application ratesTo avoid contaminating groundwater the manager/operator must follow the basic rule:
Apply manure/waste/processed water at the rate calculated to meet the crop need for the grower'syield goal, while minimizing leaching of nitrate-nitrogen to the watertable. The crop productionsystem affects the potential for groundwater contamination. Crop, rainfall, temperature,processed water, soil, and nutrient management are pertinent variables. The nutrientmanagement plan consists of three functions that can be varied: application rate, applicationmethod, and timing of application.
The application rate is crucial to crop and water quality. It depends greatly on cropnutrient requirement (nitrogen here), soil nutrient content, and processed water nitrogenconcentration.
The application method depends upon timing and processed water storage capacity(impoundment). Large scale application is feasible by irrigation equipment: center pivots and

4-13
traveling big gun sprinklers, for example. Tankwagons (with or without injectors) and pumpedinjection with a large tractor pulling the injectors and supply hose are suitable for farm-scaleoperations, as are traveling big gun sprinklers.
Timing of application plays a key role in determining the application method. Timing isa function of waste storage capacity, labor, equipment, cropping schedule, and whether the soil istoo wet, frozen, or snow covered.
The elements of the procedure for calculating the waste application rate to provide the designtotal nitrogen is outlined as follows:1) Test soil and organic waste for N. Testing for P and K also will enable a more complete
waste nutrient recommendation.2) Account for nitrogen transformations and losses after waste is removed from storage and
applied to cropland.
Inorganic nitrogen gaina) Mineralization of organic nitrogen to ammoniacal-N.b) Nitrification of ammoniacal-N.
Inorganic nitrogen lossa) Application loss by volatilization of ammoniacal-N.b) Immobilization due to crop residue.c) Denitrification of nitrate-N.
3) Determine waste application rate by dividing the nitrogen requirement of the crop for thespecified yield goal by the nitrogen recovery efficiency (NRE)1, or use recommendationsbased on fertilizer guides.
Regardless of the kind of organic waste, the procedure for calculating the N requirementand the waste application rate is the same whether the waste is liquid, semi-solid, or solid. Thecalculations can be made using a worksheet method or appropriate software. The procedure anddetail are illustrated by reviewing and discussing software development and detailing a WSUprogram designed for manure that will work for most situations in Washington.
1 The nitrogen recovery efficiency (NRE) estimates the fraction of available nitrogen that is taken up by a crop fora given soil condition (Table 4.2). This is used to compute the nitrogen supply requred for the selected yield goal.NRE is equivalent to plant N uptake efficiency.
4-14
Land application software reviewDuring the 1970's, Oregon State and Washington State Universities organized a working
group to develop a manure nutrient management planning tool for the Pacific NorthwesternStates. Agronomists, Agricultural Engineers and Soil Scientists from both Universities metseveral times to develop a worksheet method for calculating manure application rates. The tablesof coefficients and the calculation procedures were made into a worksheet method and publishedas a cooperative extension bulletin for the Pacific Northwestern States (Hermanson et al., 1983).
In the early 1980's the Soil Conservation Service (SCS) in Washington and the SCSNational Technical Center in Portland, Oregon joined with WSU as a team to develop andprogram a manure nutrient management model to run on Nebraska's AGNET2 system whichoperated in all Washington Cooperative Extension Offices. The program, WASTEAPP, wasquite thorough and state-of-the-art. Extension agents and SCS personnel however, did not adaptquickly to the WASTEAPP and computer technology. Soon Washington State UniversityCooperative Extension (WSU-CE) developed its PC capability linked to the WSU mainframecomputer, AGNET was replaced, and WASTEAPP ended.
Moore and Gamroth (1989) prepared a worksheet following the method and tablespreviously described (Hermanson et al., 1983). The model NCALC (Gamroth, 1991) was basedon the Oregon State University bulletin (Moore and Gamroth, 1989). NCALC was designed forbalancing the use of the manure resource. Many good models have been developed across theUS and in other countries. However, a study of selected models found that significant featureswere not included to varying degrees. Inasmuch as the models did not have the desired utility, ateam was formed at WSU to design and program a versatile, modern model. Manure NutrientBalancer, MNB (Hermanson et al., (1995). Thompson et al., (1997) evaluated computerprograms for calculating manure application rates to cropland. Twenty programs were obtainedin 1995 and twelve were selected for rigorous evaluation. These used a diverse range ofconventional programming languages and commercial developmental languages. The WSUprogram, MNB, compared favorably to the 12 models evaluated. MNB was designed for thePacific Northwest, yet was rated as being widely useful. The evaluation was summarized in fourtables (Tables 4.7 to 4.10) presented at the end of this section as useful model comparisons.
2 AGNET is an agricultural computer network at the University of Nebraska.

4-15
MNB can be used for many organic wastes and processed waters by testing them for N,P, and K, and by soil testing. These values and the volume or weight to be applied to land enableMNB to calculate the application rate for the desired crops. MNB is versatile and is designed sothe user can change tabulated coefficients if necessary. Default values for application loss ofammonia and mineralization rate for the specific waste/processed water must be entered for bestresults. MNB includes nine kinds of livestock and poultry, twelve crops, three soil-climatezones, and ten fields. The user is guided to input relevant farm details such as livestockinformation, manure system components, manure and soil test data, crop yield goals, andprevious three years of field history. From this information and stored tables of data, MNBrecommends manure application rates.
Decisions on the land application of organic amendments such as animal manure, cropresidue, treated municipal wastewater, biosolids, compost, food processing and other industrialwaste as sources of crop nutrients are typically based on i) the crop demand for those nutrients,ii) the efficiency of crop nutrient recovery, iii) the inherent soil supply of the nutrients, iv) thepredicted amount of nutrients supplied by the amendment, and v) the extent of nutrient loss, (Fig.4.2 (Hermanson et al., 1995). Since the primary plant nutrients N, P, and K are often the mostlimiting nutrients in a crop production, the land application rate and timing are usually calculatedto optimize one of these nutrients, however, the accompanying additions of the other nutrientsshould be considered to ensure proper rates of application of all elements contained in theprocessed water. For example, a rate of application based on N may cause excessive applicationof P which could potentially limit crop production or impose an environmental risk. Theapproach used in MNB for calculating nitrogen loading rates onto crop land integrates the fivefactors that were previously mentioned. This model can provide a framework for illustratinghow a fundamental understanding of the N behavior in systems described in this review can beused as a theoretical foundation for making sound N-based recommendations.
MNB as a framework for calculating organic waste application ratesManure Nutrients:
Some producers prefer a method that begins by estimating manure excreted daily and itsproperties. It then calculates collection and storage losses of nutrients to approximate thenutrients in storage available for land application. Three accepted sources of data on manureproduction and the percentage N, P, and K excreted are (ASAE Standards, 1993; Midwest PlanService, 1985; and Soil Conservation Service, 1992). The latter two references also include theirbest estimates of losses from collection and storage; land application losses; and mineralizationand denitrification rates.
4-16
However, it is strongly recommended that the user have a laboratory analysis, or at least afield test, conducted on the manure source to provide data that will allow calculation of nutrientcontent in useable units such as nitrogen in kg/1,000 liter and kg/Mg (or lb/1,000 gal and lb/ton)adapted from (Hermanson, 1996). Manure analysis is a key step in determining more accurateagronomic rates of application. MNB uses laboratory and field analyses of manure. The soilmust also be tested for nutrients and organic matter. Two variables define the amount ofnutrients N, P, and K in storage available for application to cropland. These are analyses of 1)manure nutrients and 2) the amount of stored manure (volume or mass) to be used.
Step 1: Analyze the manure source.Laboratory measurement of N, P, and K in the manure, in combination with estimates of
the amount of stored manure, will provide the best predictions of the quantity of nutrientsavailable for application to fields. Several methods are available, ranging from completelaboratory analysis to quick field measurements. The use of these analytical tools is highlyrecommended over nutrient estimates from manure excreted and losses in storage. Informationon laboratories that conduct manure analyses can be obtained from the local cooperativeextension, conservation district, and NRCS representatives.
Standard manure tests are conducted by commercial or state laboratories fordetermination of nutrient concentrations. Total N, P and K concentrations can be determined, aswell as ammonical-N (NH4-N). Whereas these analyses are the most accurate, more time isrequired to obtain the results because of total turn-around time. The Nitrogenmeter or Agrosmeter (Agri-Waste Technology, Inc.) is a proprietary device that can be easily used onsite tomeasure the readily available ammoniacal-N. Another onsite method developed at NorthCarolina State University (Chescheir and Westerman, 1984) is the slurry meter, which wasdevised by Tunney (1979) and is a calibrated hydrometer that reflects the solids content of liquidmanure. Nutrient concentrations can be predicted because they are related to the solidsconcentration. For this work, predictive equations were developed for dairy cattle manure usinglaboratory data from samples in Stevens and Spokane Counties in northeastern Washington. Thepredictive equations for nutrients in liquid swine manure were developed by Tunney (1979) andverified by Chescheir and Westerman (1984). The slurry meter is used only for liquid dairycattle and swine manure.

4-17
Step 2: Estimate supply of manure nutrients.The volume and weight of manure accumulated during the storage period can be
determined from the dimensions of the storage. The NRCS or the local conservation districtlikely designed the storage/treatment facilities. If so, they can prepare a table or graph that willgive the amount of manure as a function of storage depth. If they were not the designers, they orcooperative extension can develop the information needed. Nitrogen, phosphorus and potassiumare usually reported by laboratories as percent or parts per million (ppm) for liquid manure andas percent for solid manure. Slurry meter results are in pounds/1,000 gallons which can beconverted to kg/1,000 liter. Laboratories can also be asked to report kg/1,000 liter (pounds/1,000gallons) or, for solid manure, kg/Mg (pounds/ton). These units of measure expressconcentration. Nutrient concentrations multiplied by the volume of liquid manure or the weightof solid manure estimate the total nutrients in the storage facility. These amounts of N, P, and Kare available to be removed from storage and applied to fields.
Manure Application Rates:The steps used by MNB to calculate agronomic rates of manure application for crop
production are outlined in Figure 4.1. The MNB model bases recommendations on N, P, or K atthe user's discretion. The approach differs for each nutrient chosen by the user.Nitrogen Basis for Determining Manure Application Rates:
The nitrogen recommendations are computed based upon the crop requirements fornitrogen and the deficit in the soil N supply. Figure 4.1 outlines the different sources of Nsupply that are considered by MNB and the steps involved for computing the manure rates.
Step 3: Estimate crop N requirement.MNB estimates crop N accumulation based on yield goal, the N accumulation per unit of
crop, and nitrogen recovery efficiency (NRE) provided in Table 4.4. Recovery depends on cropand soil characteristics (Bock and Hergert, 1991). While MNB provides default values for Naccumulation per unit of crop, regional data can be substituted if they are available from othersources such as NRCS or Cooperative Extension. Crop species differ in N uptake efficiency, dueto differences in rooting characteristics and N demand. For example, perennial grasses exhibithigh NRE potential while shallow rooted crops such as onions have lower NRE potential. Soilconditions also influence NRE. For example, NRE values are predicted to be low in poorlydrained soils to account for denitrification losses which are higher than in well drained soil.NRE and denitrification are a function of soil aeration which is represented here by drainageclass: well drained, moderately well drained, and poorly drained.

4-18
There are various soil sources of N that should be taken into account in formulating an Nfertilizer recommendation. MNB computes contributions from these sources, based on soil testand cropping history information. Sources include organic matter, residual N, previous cropresidue, and previous manure application. The net difference between the N supply and cropdemand is the estimate of N to be supplied as manure or inorganic fertilizer.Step 4: Estimate soil N sources (CREDITS) and N sinks (DEBITS).
There are several soil sources of N to account for in formulating an N fertilizerrecommendation. MNB computes contributions from these sources, based on soil test andcropping history information.
Nitrogen CREDITS or DEBITS toward the total N supply are based on the following factors.
a) Inorganic N. (NO3-N and NH4-N) in the soil profile to the depth of rooting, which varies bycrop. Consult your soil test laboratory, NRCS or WSU CE representatives for assistance incalculating total inorganic N that is available to the depth of rooting.
b) N mineralized from the soil organic matter. Organic matter mineralization is based on thepercent organic matter of the soil and the soil moisture condition. Since organic matterdecomposition varies considerably under aerobic and anaerobic conditions, MNB usesdifferent mineralization coefficients for the three kinds of soils i.e. well drained, moderatelywell drained, and poorly drained.

4-19
Figure 4.1. Steps for calculating agronomic rate of manure application.
c) Previous legume contribution. The N credits for a previous legume crop in the rotation varywith crop and region. For example, it varies from 20 lb N/ac for peas yielding >2000 lb/ac inEastern Washington to 50 lb N/ac for alfalfa stubble/beans/peas in Central Washington.
Calculate nitrogen debits that decrease total N supply.d) Nitrogen immobilization. Incorporation of previous crop's residue will tie up a fraction of the
inorganic N into organic N forms, due to enhanced microbial activity. The amount of N thatis likely to be tied up in this process varies with the quantity and composition of crop residue.Hence, some of the applied N is held by the previous crop's residue. MNB varies Nimmobilization estimates from 20 lb N/ac for wheat/barley residues in Eastern Washington to60 lb N/ac for corn/small grain residue incorporated in Central Washington.
Table 4.4 Nitrogen Recovery Efficiency3 For Different Groups of Crops and Soil Conditions(Modified from Bock and Hergert 1991).
Nitrogen Recovery Efficiency
Soil HighModerate
% LowAerated/well drained 75 55 45Moderately welldrained
70 50 40
Poorly drained 65 45 35Crop Groups
High Moderate LowOrchard grass Barley AsparagusAlfalfa grass mixture WheatWhite clover grass mixture CanolaRed clover grass mixture PotatoAlfalfa Corn grainCorn silage Hops
3 The nitrogen recovery efficiency (NRE) estimates the fraction of available nitrogen that is taken up by a crop fora given soil condition (Table 4.2). This is used to compute the nitrogen supply requred for the selected yield goal.NRE is equivalent to plant N uptake efficiency.

4-20
Step 5: Estimate N fertilizer recommendation.The net balance of N gains and losses (CREDITS and DEBITS) is subtracted from the
crop N to be supplied as manure or inorganic fertilizer. The program determines manureapplication rates and allocations for each field, then rates of additional nutrients (N, P,K)required as mineral fertilizer and of excess nutrients are given.
Step 6: Estimate N release from manure.Manure-N has two components: the ammoniacal-N (NH4-N) and the organic-N.
Laboratory analyses are recommended for both total Kjeldahl nitrogen (TKN) and ammoniacal-N. Subtract ammoniacal-N from TKN to get organic-N. If ammonical-N is not determined,MNB estimates it. Ammonical-N is readily lost by volatilization, so the loss is accounted for.MNB credits the ammoniacal-N remaining after application losses as plant-available N duringthe cropping year after application. The application losses vary depending upon whether themanure is incorporated. Only a fraction of the organic-N is available to the crop during thecropping year after application. This is predicted using N mineralization coefficients (MidwestPlan Service, 1985; Soil Conservation Service, 1992). During the years following the manureapplication, decreasingly smaller fractions of organic N are available to the crop. These residualcontributions last for about 3 years with heavy rates of manure application. The mineralizationcoefficients vary with livestock species, whether manure is liquid or solid, whether it is soilincorporated, and the season of application (Midwest Plan Service, 1985). Table 4.5 wasdeveloped by the Midwest Plan Service (1985), an organization of 13 Midwestern Land GrantUniversities, as representative organic nitrogen mineralization factors (coefficients). Itsummarizes the dimensionless fraction of organic N mineralized (released) during the firstcropping season after manure application. Applications 1, 2, and 3 years before the current yearof application are mineralized about 50%, 25%, and 12.5%, respectively, of the mineralizationfactor for the first cropping season. The fraction of ammoniacal-N that remains after applicationlosses and the fraction of organic N that mineralizes during the application year constitute thetotal available N from the manure.
Cogger et al., (1987) in a worksheet method of calculating sludge application ratesestimated first-year mineralization fractions as 0.20 for anaerobic digestion, 0.30 for aerobicdigestion, and 0.08 for composting treatments. For all sludges, 1, 2, and 3 years after the year ofapplication, use 0.03. Washington State biosolids guidelines (Sullivan, 1993) estimate 0.08,0.03, and 0.01 of the organic N originally applied mineralizes 1,2 and 3 years after the year ofbiosolids application. The 1993 recommendations reflect additional research since the 1987recommendation by WSU-CE. Dimensionless first-year mineralization factors from the

4-21
Washington State biosolids guidelines are given in Table 4.6. Although the biosolids factors aresimilar to manure factors, the best results will be obtained by changing the MNB defaultmineralization factors.
Organic nitrogen mineralization rates were available for biosolids and manure. These aregiven in Tables 4.5 and 4.6. Values were not found, however, for other waste and processedwater. Although the rates tabulated can be used to approximate rates for other waste/processedwater, accurate application rate predictions require mineralization rates developed by research.If application rates of organic nitrogen are the same year-after-year, the mineralization rateapproaches 1.0 (100%). This continuum eliminates the need to apply mineralization rates foreach previous year. Rather, the factor 1.0 (100%) is appropriate. It means the current year
Table 4.5. Manure Organic Nitrogen Mineralization Factor: Dimensionless First-Year ValuesManure Incorporated Not Incorporated
Livestock Type Fall Spring Fall SpringBeef Liquid 0.30 0.25 0.25 0.20
Solid 0.25 0.20 0.20 0.15Dairy Liquid 0.30 0.25 0.25 0.20
Solid 0.25 0.20 0.20 0.15Fryer/Broiler Litter 0.25 0.20 0.20 0.15Horses Solid 0.20 0.15 0.15 0.10Layers Solid 0.30 0.25 0.25 0.20Sheep Solid 0.25 0.20 0.20 0.15Swine Liquid 0.30 0.25 0.25 0.20
Solid 0.50 0.45 0.45 0.40Veal Liquid 0.30 0.25 0.25 0.20
application of organic nitrogen will all be mineralized on the average. The mineralization factor1.0 for approximately constant annual organic nitrogen application rates over several years (10years) allows use of the factor 1.0 without need to conduct research for the annual factor and thecumulative mineralization of preceding years. With a mineralization factor of 1.0 and anapplication loss based on Tables 4.2 and 4.3, a good prediction of the nitrogen application rate touse can be made with MNB.

4-22
Step 7: Compute the manure application rate.MNB calculates the recommended manure application rate as the N recommendation
divided by the amount of N released per unit of manure applied (Fig. 4.1).
Step 8: Compute excess P or K applications.When manure rates are computed with N as the limiting nutrient element, it is possible to
under- or over-apply P and/or K. MNB computes the imbalance of P and K that results from themanure application. In regions where P pollution of the environment is a problem, manure ratesshould be computed with P as the limiting element. MNB computes P and K fertilizerrecommendations based on soil test results and WSU fertilizer guide recommendations.Recommended P and K fertilizer rates are compared to P and K released from manure which iscalculated from the quantity of manure recommended based on N and multiplied by the P and Kconcentrations in the manure then by the P mineralization coefficient derived from the literature(Midwest Plan Service, 1985; Soil Conservation Service, 1992). K is not mineralized because itis not in the organic form.
Table 4.6 Biosolids Organic Nitrogen Mineralization Factor: Dimensionless First-Year Values.Processing Method Mineralization Factor
Anaerobic digestion 20-40Aerobic digestion 30-45Aerobic/Anaerobic digestion and >6 months lagooning 15-30Anaerobic digestion and dewatering 20-40Drying bed 15-30Heat drying 20-40Composting 0-20
Step 9: Phosphorus or potassium basis for determining manure application rates.MNB requires P and K soil test information to calculate manure application rates based
on these essential nutrients. WSU recommendations of P and K rates for different soil test levelsare summarized in MNB Tables 5-8 (Hermanson et al., 1995). Next determine the P and Kavailable from the manure. MNB calculates the recommended manure application rate as therecommended P or K fertilizer recommendation divided by the amount of P or K released perunit of manure applied. Supplemental N fertilizer may be required when manure applicationrates are based on P as the limiting element. MNB calculates needed N supplements or excessquantities applied by comparing the N released from the manure to the N recommendation.

4-23
Timing and Storage
Timing of application of organic waste/processed water to land:
• Consider organic nitrogen mineralization rates and apply as close as possible to time of
crop nitrogen need. Use crop growth curves.
• Generally, organic nitrogen applied in the fall, especially in early fall, can mineralize and
nitrify so nitrate-nitrogen may be available to leach to the watertable. A cover crop to
scavenge nitrogen in the rootzone is important, especially in western Washington where
mineralization and nitrification are quite complete due to warm soil. Regardless, in
Western Washington any residual nitrate-nitrogen in the soil profile will be flushed by
winter rains to contaminate groundwater.
• Organic wastes shall not be applied to frozen, snow covered, or saturated soil to prevent
runoff and surface water contamination.
• Storage of waste (processed water) is usually necessary during the winter when the soil is
frozen, snow covered, or saturated (Soil Conservation Service, 1993). Wastewater
storage is usually in anaerobic or aerated storage lagoons, but, depending upon the
volume it can be in other structures. Waste in a solid form is stored on a relatively
impervious surface with a roof if needed because of precipitation.
Timing is not the same for all LTS. It is specific to:• Climate• Soil• Crop• Wastewater
The need for storage impoundments (variety of storages) or storage of nitrogen in the soilduring the likely non-application season (fall-winter) can be determined by a mass balanceanalysis of nitrogen and water year-after-year (weekly, or as appropriate) as a predictive tool andfor a permanent record. Monitoring wells are not good indicators because groundwater ismassive and moving making accurate interpretation of data difficult or impossible. Monitoringwells are useful, however, to measure long-term effects on groundwater. The better method is byanalysis of soil to track nitrate-nitrogen in the soil profile, and by collecting soil water inlysimeters in the soil profile.

4-24
Recommendations for Land Application of Organic Wastes
1) Use a science-based method to calculate an N balance that provides for crop requirements
and accounts for N losses and gains before determining the waste application rate. This
N balance minimizes the leaching of nitrate to groundwater. The procedure can be a
worksheet or software such as MNB. Follow Washington State Guidelines that regulate
the use of biosolids (Sullivan et al., 1993).
2) Irrigation must be scheduled scientifically to maintain the correct water balance and
provide only enough deep percolation for leaching salts from the soil profile. Include
irrigation water as a source of N if significant.
3) Timeliness of application with respect to stage of crop growth, season and whether soil is
too wet, frozen, or snow covered to apply waste/processed water to land is a good
practice that reduces and prevents water contamination to benefit society.
4) Keep records of waste and processed water applications (nitrogen and water application
rates), crop harvested, nitrate-nitrogen in soil profile and water analyses. Ideally, the
records would enable a nitrogen balance: inflow = outflow + storage in the soil.
Software can be made to keep all records and calculate results.
5) Design a waste and nutrient management plan. The key to success is following the plan.

Table 4.7. Programs examined that determine dairy manure application rates - authors, source, cost, year of release, and hardware and softwarerequirements
Program Institution ofprimary author/s
Authors Institution selling theprogram -Name andaddress
Institution selling theprogram -Tel. and FAX No's
Cost(US$)
Year ofreleaseofcurrentversion
Hardwarerequirements(IBM compatible PC's)
Software requirements
AMANURE(v2.02)
Purdue Univ.,West Lafeyette,IN, USA
A. Sutton,D. Jones,B. Joern
Farm Bldg Plan Serv,Purdue Univ., 1146Ag.Engr, W. Lafeyette IN47907
Tel: 317-494-1173 15 1994 IBM compatible PCRAM: ≥512Kb
MS-DOS
Cornell nutrientmanagementplanning system
Cornell Univ., NewYork, NY, USA
S. Klausner,T. Tylutki,D. Fox,M. Barry
S. Klausner, Dept Soils,Crops and Atmos Sci,Cornell Univ, Ithica, NY14853
contact S. KlausnerTel:Fax 301-314-9041
notdefined
expectedrelease:Summer1996
Recommend 486DX orPentium; 8 Mb of HD; 8Mb RAM, 4 OK with virt.mem.
Windows 3.1, orWindows 95
Fertrec Plus v2.1 Univ. of Maryland,MD, USA
Steffi Li , PaulShipley, F.Coale,P. Steinhilber,Alen Bandel,
Dept. of Agron,Univ of Maryland, 1103H.J.Patterson Hall, CollegePark MD 20742
Paul Shipley,Tel: 301-405-2563Fax: 301-314-9041
15 1996 286 or greater;HD: 3.5—5.0 Mb;Requires printer withcapacity for landscape
MS-DOS?
ManureApplicationPlanner v3.0;(MAP v3.0)
Univ. ofMiinnesota,St.Paul, MN, USAUSA
M. Schmitt,R. Levins,D.W.Richardson
Ctr for Farm FinancialManagement, Univ ofMiinnesota, 1994 BufordAve, St. Paul, MN 55108
Tel: 612-625-1964,or1-800-234-1111
? 1995 386 or greater;RAM: 2 Mb , preferably 4Mb;HD: 2Mb of space
MS-DOS 3.2 orhigher, preferably 6.0or higher
Manure NutrientBalancer;(MNB)
Coop. Ext., WSUPullman, WA, USA
R. Hermanson,A. Rao, W.Pan,K. Duncan,M. Wright
Bull Office, Coop Ext,Cooper Publ Bldg., WSU,Pullman, WA 99164—5912
Ron Hermanson,Tel: 509-335-2914,FAX: 509-335-2722
25 1995 IBM compatible PC;RAM: =512Kb;HD: 482 Kb
MS-DOS 3.3 or higher
Michigan StateUniversityNutrientManagementv1.1;(MSUNM v1.1)
Michigan StateUniv., East Lansing,MI, USA
B. MacKellar,L. Jacobs,S. Bohm
MSU Bull Office,10-B Ag Hall,Michigan State Univ, EastLansing, MI 48824-1039
FAX: 517-353-7168 75 1995 286 or greater;RAM : =512Kb;HD: 10Mb recommended
MS-DOS 3.3 orhigher,5.0 recommended
OMAF NutrientManagementComputerProgram;(NMANPC)
Ontario Min. of Ag.Food and RuralAffairs, Woodstock,Ontario,Canada
D. Hilborn,C. Brown
Ontario Min of Ag Foodand Rural Affairs, P.O. Box666, Woodstock, OntarioN4S 7Z5, Canada
Don HilbornTel: 519-537-6621 1-800-265-7896FAX: 519-539-5351
30 1995,updatedreleasein 1996
IBM compatible PC MS-DOS
Program Institution ofprimary author/s
Authors Institution selling theprogram -Name andaddress
Institution selling theprogram -Tel. and FAX No's
Cost(US$)
Year ofreleaseofcurrentversion
Hardwarerequirements(IBM compatible PC's)
Software requirements

Penn. StateUniversity —NutrientManagementPlan;(PSU-NMP v1.1)
Pennsylvania StateUniversity,Pennsylvania,USA
D. Beegle,P. Bohn
Dept. of Agron, Penn. StateUniv,116 ASI Bldg,University Park, PA 16802
P. Bohn,Tel: 814-865-3774FAX: 814-863-7043
50 1995 386 or greater;HD: 4 Mb ;RAM: 640 Kb (485 free)
MS-DOS 3.3 or higher
UGFERTEXv1.0
CooperativeExtension,University ofGeorgia,Athens,Georgia 30602,USA
C. O. Plank,S.C. Hodges
Coop Ext,The Univ of Georgia,Ag.Bus Office Conner Hall,Athens, Georgia 30602
Tel.: 706-542-8999FAX : 706-542-2378
$10 1990,updatedWindows versionin '96
IBM compatible PC;RAM: 256Kb
Vermont ManureNutrientManager;(VMNM)
UVM Extension,University ofVermont,Burilington,Vermont, USA
W. Jokela,J. Rankin,S. Hawkins
UVM Ext, Plant and SoilSci Dept, Univ of Vermont,Burlington, VT 05405.
W. Jokela;Tel: 802-656-2630
NoCost
1993 IBM compatible PC
WEES? Silsoe ResearchInstitute, WrestPark, Silsoe,Bedford MK454HS, England,United Kingdom
T. Cumbyin England;US contact:F. Wolak1
F. Wolak. Dept. of Ag. andBiol. Engr, Clemson Univ,Clemson, SC 29634, USA
F. Wolak IBM compatible PC? MS-DOS?
WISPER1 v2.12
Soil & PlantAnalysis Lab.Uni.versity ofWisconsin -Madision,Wisconsin, USA
S. Combs,S. Bullington
WISPLAN, Comp Serv,1575 Obs. Dr,Madison, WI 53705
Tel: 608-262-4552 75 199? IBM compatible PC;RAM: 460Kb;HD: 760 Kb
1Wisconsin Interactive Soils Program for Economic Recommendations

Table 4.8 What the programs do - generalProgram Type of program;
underlyingsoftware
Max. no.of fieldsper farm
Program generatesnutrientrequirements ofcrops?
Program estimates amount ofstored manure available forland application1?
Manure nutrient composition:program estimates, defaultused or user inputs.
Economicanalysis ofmanureapplication
Automatic allocation of a knownquantity of manure to multiplefields. What options for prioritizingfields?
AMANURE menu-driven;Compliledspreadsheet(Lotus 2..01 orsimilar)
1, can bea groupof fields
For N, P2O5 andK2O;P2O5 and K2O aredetermined fromsoil test
From animal no.'s and standardexcretion values and thecollection period
User accepts default values orenters results from laboratoryanalysis.
No economicanalysis done
Not applicable, only considers onefield or one group of fields.
Cornell dialog boxdriven Windows?program;MS FoxProdatabase v2.6
Nodefinedlimit
For N, P, K, Zn, Band limerequirements.
From dimensions, no. of loads,or standard excretion values.The latter considers animal no.'s,collection periods, washwater,run-off and bedding
User enters results fromlaboratory analysis.
No economicanalysis done
Based on N, P or K. Considershydrological sensitivity ratingsentered by user.
Fertrec Plusv2.1
menu-driven;Database(FoxPro)
Nodefinedlimit
For N, P, K, & Mg;can also do lime,Mn, Zn, S and B.
Program does not consider theamount of stored manure
User enters results fromlaboratory analysis.
Determinesreducedfertilizer costachieved byusing manurenutrients
Not applicable, considers multiplefields but does not consider theamount of stored manure.
MAP v3.0 menu-driven;Pascal
50 User encouraged toenter; can estimatenutrients removedby crop
Recommends user determinesfrom dimensions; can determinefrom animal no's and std.excretion values but noprovision for washwater,rainfall, bedding etc.
Recommends user entersresults from lab. analysis; canestimate from std. excretionvalues with storage N lossfactor but no dilutionconsidered.
Considershauling &applicationcosts ofmanure app.c.f. mineralfertilzer costsapplication app
Most economic use of manurenutrients, considers cost of haulingand spreading manure and cost ofpurchase and applying mineralfertilizer
MNB menu-driven;Vermont views,MSCprogramed????
10 For N, P2O5 andK2O;all from soil test
Recommends user determinesfrom dimensions; can estimate"as excreted" amount fromanimal no's and std. excretionvalue.
Recommends user enters fromlab. analysis; can estimate "asexcreted" content from std.excretion values applyingcollection & storage N losses.factor.
No economicanalysis done
User manually prioritizes fields;program allocates manure on basisof selected nutrient. For each fielduser enters % need for selectednutrient to be met by manure.
MSU v1.1 menu-driven;Clipper 5.0
Nodefinedlimit
For N, P2O5 andK2O;P2O5 and K2O aredetermined fromsoil test
From No. of loads in previousyear
User enters results fromlaboratory analysis, or can useaveraged from previous years'manure analyses
Determinesreducedfertilizer costachieved byusing manurenutrients
Allocates manure on N, P or Kbasis, or max. rate/min. area(meeting N, P or K needs), or onmost economical use of manurenutrients re. reduced fertilizer costs.

OMAFNutrientManagementComputerProgram;(NMANPC)
menu-driven;turbo BASIC
10 For N, P2O5 andK2O;all determined fromsoil tests. Defaultvalues for croptypes available
Uses MSTORPC (Table 1c);from dimensions, and fromanimal no's, std. excretionvalues, washwater and rainfall.Determines required size ofstorage.
User enters results fromlaboratory analysis or from aquick test based on electricalconductivity, or selects from400 manure analyses indatabank.
Determinesreducedfertilizer costachieved byusing manurenutrients
User manually prioritizes fields.Program allocates manure to fieldsin selected order until all manure hasbeen applied.
PSU-NMP menu-driven ;MS FoxPro 2.6Database
No limit Yes User can input; or programestimates fromanimal no.'s, std. excretionvalues, washwater, run-off,rainfall, evaporatiion usingcounty climate data.
Accept default or enter lab.results, or program estimatesfrom animal no.'s, std.excretion values, washwater &run-off, using county climatedata.
No economicanalysis done
Automatic - for selected fields,ranked by highest requirement forselected nutrient.Manual - user accepts/rejectssequential suggestions for individualfields.
UGFERTEX menu-driven;Expert systemwritten in Prolog
1, can bea groupof fields
For N, P2O5, K2O,Ca, Mg, Zn, Mn;can for B and S; allbut N and S fromsoil test
Not applicable. The amount ofmanure is not considered.
User can accept default, orenter results from laboratoryanalysis.
No economicanalysis done
Not applicable, does not consideramount of manure nor more thanone field or group of fields
VERMONT spreadsheet;Lotus 2.2
30 User enters cropnutrientrequirements for N,P2O5 and K2O.
Uses Dairy Man. Pr. Estimator(Table 1c); from animal no.'s,std. excretion values, milk prod.levels, confinement period,washwater, run-off, ave. rainfall& evapor.
User can accept default, orenter results from laboratoryanalysis.
Determinesreducedfertilizer costachieved byusing manurenutrients
Does not allocate manure, but doesmonitor the quantity of storedmanure available. The amount isreduced as a rate is determined foreach field.
WISPER menu-driven,text-based ;written inFORTRAN &Microsoft C
15 For N, P2O5, K2O;can also do pH, Ca,Mg, B, Zn, S; all butN from soil test
solid - animal numbers, std.excretion values;liquid - storage volume, %filled, times emptied
User can accept default, orenter results from laboratoryanalysis.
Per field andfarm saving offertilizer costsby usingmanure
Determines rates for multiple fieldson basis of crop N, P or Krequirement, but does not consideramount, and does not prioritizefields.
WEES menu-driven;Crystal expertsytem shell
NO
1 User can replace with own values.

Table 4.9. Input data for determining crop nutrient requirements and describing manure composition; application methods and availability factorsProgram Crop nutrient
requirements -field, cropping and soildata used
Dairy manure typesor storage systems
Manurenutrientcomposition:input datarequired
Manurenutrientcomposition:units
Methods ofmanureapplication
Potentialnutrientavailability(%) in yearof application;
NH3 lossfrom surfaceapplication: noincorporation
NH3 loss from surfaceapplic.: incorporated in < 1 day
AMANURE Crop type, yield goal,soil tests for P and K?
solid (pack),liquid-tank, liquid-lagoon, daily scrape& haul
total N, NH4+-
N,P2O5, K2O,
liquid:lbs/1000gallonssolid: bs/wetton
surface - noinc.;surface - inc.<1 d;injection;sprinklerirrigation
Org. N: 30%;P: 100%K: 100%
of total N:solid - 25%liquid - 20%sprinkler - 40%
of total N:3%3%3%
Cornell Crop type and expectedyield in context of the croprotation;soil type;soil tests for P, K, Zn andB.
Any total N, NH4+-
N,P, K, dry matter
liquid:lbs/1000gallonssolid: lbs/wetton
not defined Org. N: 35%P: 100%depends on soiltest P value;K: 100%
of NH4+-N:
half-life of 3.5days, 75% in 7days.
of NH4+-N:
Spring 35%; Fall &Winter: 100% (other Nlosses)
Fertrec Plusv2.1
Crop type, yield goal,tillage methods, manureapplications in previous 3years, legume in previousyear; soil tests for P, K, Ca,pH, organic matter, texture
liquid,solid
total N, NH4+-
N,P2O5, K2O, Ca,Mg, S, Mn, Zn,Cu, dry matter
% wet weight Surface —user entersno. of days toincorporation;injection.
Org. N: 35%;P: 100%;K: 100%
of NH4+-N:
100%of NH4
+-N:20%
MNB Crop type, yield goal, soildrainage class, previouscrop. Soil tests forinorganic N (pre-plant), soilorganic matter, P and K.Can also do Zn, Mn, Fe andCu from soil test, whichnext version will not.
liquid,solid,liquid and solid aftermechanicalseparation
total N, NH4+-
N,P2O5 or P; K2Oor K;
liquid: ppm, %,lb/1000 gallon;solid: lb/ton,ppm, %(wet/dry)
surface/sprinkler: no inc.;surface/sprinkler immediateinc.; injection;sprinkler:dilute liquid
Org N: 15-30% —solid/liquid,season, incorp.or not;P: 70%; K:70%
of total N:20%
of total N:5%
MSU v1.1 Crop; expected yield;Soil tests: pH, lime index,Bray P, K, Ca, Mg
solid withbedding,solidwithout bedding,liquid (anerobic),liquid (flushed)
total N, NH4+-
N,P2O5, K2O, drymatter;
liquid—lbs/1000gallonssolid—lbs/wetton
surface noinc.;surface inc 0-1, 2-3, 4-7, >7days;injection
Org N 25-35%—solid/liquid,bedding;P: same asfertilizer;K: same asfertilizer
of NH4+-N:
90%of NH4
+-N:30%

Ontario Either (i) crop type andyield and soil tests for N, Pand K; or (ii) crop removaldata based on crop type andyield
liquid,solid,liquid and solid aftermechanicalseparation
total N, NH4+-
N,P, K dry matter;electricalconductivity isoptional asquick test
liquid—lbs/1000gallonssolid—lbs/wetton
surface no inc- Spring orFall; surfaceinc. in 1,2,3,4or 5 days;injection;irrigation(spri.)
Org. N: 5 -30%— solid orliquid, DMP: 40%;K: 90%
of NH4+-N:
40%of NH4
+-N:20%
PSU-NMP Crop; expected yield, soiltest data (optional???);
solid;liquid;irrigation water(sprinkler)
total N, P, andK.
solid: lbs per tonliquid : lbs per100 gallons;irrigation: ppm
customizable;defaultoptions are:surface - noinc. inc in <1,2-4, 5-6 d;irrigation;Fall -diff.
Total Navailabilty:customizablefor applicationmethod;P: 100%; K:100%
Total Navailabiltycustomizable,default total Navailabilty —20%
Total N availabiltycustomizable,default total N availabilty- 40%
UGFERTEX Crop type; expected yield;Soil management group;Soil tests for P and K;
slurry,FYM
total N, NH4+-
N,P2O5, K2O, drymatter
liquid:lbs/1000gallonsFYM: lbs/wetton
surface - noinc.;surface -immediateinc.;surface - inc.<2, <4 days;injection;
Org. N: 50%P: 100%;K: 100%
of NH4+-N:
80%of NH4
+-N:30% within 2 days
VERMONT User enters crop nutrientrequirements.
liquid,solid
total N, NH4+-
N,P2O5, K2O,Mg, dry matter
liquid:lbs/1000gallonssolid: lbs/wetton
Spring:surface - noinc & inc. 1-7days;Autumn:surface - inc.<2, >2 d;injection
Org. N 18-40% - soildrainage &manure DM;P 80%; K100%
of NH4+-N:
100%of NH4
+-N:20%
WEES
WISPER Crop type, expected yield,soil texture; soil series;Soil tests for P, K, pH, soilorg. matter, sample density,SMP buffer pH; can do Ca,Mg, B, Zn, S
liquid,solid
available N,available P2O5,available K2O,available S
liquid:lbs/1000gallonssolid: lbs/wetton
surface - noinc.;surface -immediateinc.;injection
Total N 35%P: 55%K: 75%
of total N:5%
of total N:0

Table 4.10 Additional features - rate of manure estimation, data handling characteristics, options for altering assumed values, provision of amanual and distinguishing features
Program Approaches for determiningmanure application ratea
Limits or warningsfor excessiveapplications ofmanure nutrients
Determinesno. of loadsto individualfields
Enablesexamination ofwhat-if scenariosfor factorsaffecting manureapplic. rates
Provision forsaving inputand outputdata
Can alter factorsused in calculationse.g. N availability
Is a detailedmanualprovided withthe software?
General nature ofprogram anddistinguishing featuresor characteristics
AMANURE Crop requirements for N, P orK,Minimum area (based on N, Por K)max fert. value (based on N, Por K);user can enter rate
Warning when>150 lb N/acre,Dept. Environ.,Indiana
determinesdistancespreader travels
Yes, but requiresre-entering alldata that is inputsubsequently tothe altered data
NO NO 2 pages ofinstructions.Note, is asimpleprogram.
Practical program fordetermining manureapplication rates to asingle field
Cornell Crop requirements for N, P orK
Limits that varywith crop type.
Yes Yes, done rapidly Both input andoutput data canbe saved.
NO, these values arefixed.
Currentlyresourcemanuals only.
Very comprehensive.Based on crop & soilnutrient management,and animal nutrientmanagement.
Fertrec Plusv2.1
Crop requirements for N, P orK
No specific warningsor limitations; max.rate set by whichnutrient selected forcrop requirements
NO Yes, can altervalues and veryquickly run thechanged scenario
All input andoutput data issaved in onedatabase
Enter % of manureorg. N miner/ed incurrent year;can alter %'s ofNH4
+-N volatilizedas NH3.
67 pageindexedmanual.
Comprehensive programfor strict nutrientmanagement in anenvironmentallysensitive area.
MAP v3.0 minimal cost for hauling &spreading manure andpurchase & application offertiliser; or user enters rate
user specifies max.rate P2O5; this limitsmanure applicationrate
NO Yes, can be donerapidly
Yes, separatefiles for eachfarm
Nutrientavailabilities, prices,can add applicationmethods specifyingN losses
88 pagemanual,screen byscreenapproach
Very easy to use,generates manureapplication rates rapidly.Economic analysisincludes applicationcosts. Adaptable to otherregions.

Table 4.10 Additional features - rate of manure estimation, data handling characteristics, options for altering assumed values, provision of a manualand distinguishing features
Program Approaches for determiningmanure application ratea
Limits or warningsfor excessiveapplications ofmanure nutrients
Determinesno. of loadsto individualfields
Enablesexamination ofwhat-if scenariosfor factorsaffecting manureapplic. rates
Provision forsaving inputand outputdata
Can alter factorsused in calculationse.g. N availability
Is a detailedmanualprovided withthe software?
General nature ofprogram anddistinguishing featuresor characteristics
MNB Crop requirements for N, P orK
Calculates rates of N,P and K in excess ofcrop requirements,issues N and Pwarnings restrictionsor;.
NO Yes, can be donerapidly
Input andoutput datasaved in aseparate file foreach farm
N loss followingapplic; storagelosses; mineral-ization of N inapplication year;crop requirements
42 pagemanual,screen byscreenapproach
Easy to use, practicalprogram for determiningcrop nutrientrequirements andmanure application ratesfor a whole farm
MSU v1.1 Crop requirements for N, P orK,Minimum area (based on N, Por K)Max. fert. saving (based on N,P or K)
restrictions based onBray P1 soil testresult (lbs/ac);
Yes, and forprevious manureapp's, user canenter No. ofloads
Yes, may involveworking throughthe tieredstructure of theprogram
Yes, separatefiles for eachfarm
NO 220 pagedetailedmanual,screen byscreenapproach
Comprehensive nutrientmanagement programfor a whole farm. Hasextensive record-keeping facilities.
Ontario Lowest application rate of 75or 100% of crop Nrequirements or crop Prequirements. User can enter.
several levels ofwarning for excessnutrient rates.liquid applications>20,000 gal/acre notpermitted.
NO Yes, can be donerapidly
Saves outputfiles.
User cannot alter.Author will changeon request.
2 pages ofinstructions.40+ HELPscreens,demo.program
Easy to use yetcomprehensive program.Addresses a variety ofinformationrequirements. Canhandle sludges (heavymetals).

Table 4.10 Additional features - rate of manure estimation, data handling characteristics, options for altering assumed values, provision of a manualand distinguishing features
Program Approaches for determiningmanure application ratea
Limits or warningsfor excessiveapplications ofmanure nutrients
Determinesno. of loadsto individualfields
Enablesexamination ofwhat-if scenariosfor factorsaffecting manureapplic. rates
Provision forsaving inputand outputdata
Can alter factorsused in calculationse.g. N availability
Is a detailedmanualprovided withthe software?
General nature ofprogram anddistinguishing featuresor characteristics
PSU-NMP Crop requirements for N, P orK ;considers spreader capabilitiesfor practical application rates.
customizable; defaultexcess rates per acre:25 lbs N, 100 P2O5and 125 lbs K2O.
Yes; canestimatespreadercapacity;considers max.,min. rates ofspreader
Yes, can be donerapidly
Yes, all inputdata and outputcan be saved
N availabilities forapplic. method;allowed excess;add applicationmethods specifyingN availabilities
Manual;extensivecontextsensitiveHELP withinprogram.
Comprehensive nutrientplanner; manycustomizable lookupvalues; adaptable toother regions; manyadditional functions;very versatile
WEES
UGFERTEX Crop requirements for N only None, cannot exceedcrop N requirements.No restrictions on P
NO Yes, can be donerapidly
NO Cannot alterassumed values.However, manydefault andcalculated valuescan be altered.
23 pagemanual
Simple and easy to useprogram for cropnutrientrecommendations andmanure application ratesfor a single field.
VERMONT Crop requirements for N, P orK
Informs of rates ofnutrients in excess ofcrop requirements
Yes Yes, changing aninput in thespreadsheet altersall subsequentvalues
Yes, input andoutput for 30fields saved inworksheet
NO 4 pages ofinstructions;this is arelativelysimpleprogram
Practical program fordetermining manureapplication rates;considers previousmanure and fertiliserapplications in samecropping year.

Table 4.10 Additional features - rate of manure estimation, data handling characteristics, options for altering assumed values, provision of a manualand distinguishing features
Program Approaches for determiningmanure application ratea
Limits or warningsfor excessiveapplications ofmanure nutrients
Determinesno. of loadsto individualfields
Enablesexamination ofwhat-if scenariosfor factorsaffecting manureapplic. rates
Provision forsaving inputand outputdata
Can alter factorsused in calculationse.g. N availability
Is a detailedmanualprovided withthe software?
General nature ofprogram anddistinguishing featuresor characteristics
WISPER Crop requirements for N, P orK
Cannot exceed cropN requirements, orapply >75 lbs P peracre on slopes >9%nserv. tillage
Yes, user caninput manurerate as no. loads.Calibrates solidspreader
Yes, may involvemoving through aseries of screens.
Yes, input datafor each fieldsaved inseparate files.
NO 151 pageindexedmanual,screen byscreenapproach
Comprehensive nutrientmanagement programfor a whole farm overseveral years

5-1
5. FATE OF N WHEN APPLIED AT RECOMMENDED AGRONOMIC RATES
OR WHEN APPLIED DURING THE NON-GROWING SEASON
Summary
The soil N content is the result of a dynamic equilibrium among severalcomponents. Land application of N should not exceed the crop uptake capacity aftersubtracting any unused soil N left by the previous crop (residual soil N) and supply fromother sources such as N mineralized from soil organic matter and crop residues.Management designed to enhance gaseous losses may provide an additional avenue tobalance land application of N.
Matching N applications to crop N requirements is not easy. Management,environmental conditions, and crop uptake limitations may preclude a good match andresult in residual nitrate after crop harvest. Excess infiltration of water will movenitrates down the soil profile, sometimes beyond the reach of roots and in its way togroundwater. Fall or winter N applications, particularly of inorganic forms, may furtheraggravate the problem.
Volatilization and denitrification are possible pathways for applied N.Volatilization occurs rapidly after application. Denitrification is usually small duringmuch of the year with periodic major events occurring when rainfall or irrigation rewetthe soil. Denitrification can be significant when a shallow or a perched water table arepresent. Gaseous losses can be minimized or enhanced depending on managementobjectives.
N mineralization from organic residues, applied waste, or from stable soilorganic matter occurs throughout the year, with peak amounts when temperature andmoisture conditions are suitable for the microbial activity that is responsible for theprocess. Mineralized nitrogen may lead to excess soil N and leaching if not accountedfor when N application decisions are made. Significant mineralization may also occurwhen plants are not actively absorbing nitrogen. Low soil temperatures during thewinter in Central and Eastern Washington will tend to inhibit mineralization during thisperiod.
Water drainage (percolation) takes place when rainfall or irrigation exceedswater loss by evapotranspiration. Since nitrates are soluble in water, the amount ofnitrogen that may be lost with percolating water depends on the nitrate concentration inthe soil profile. The type of soil has an influence on the N leaching potential. Due to theirlower water holding capacity and greater saturated hydraulic conductivity (greatertransport velocity), all other factors constant, N leaching will be apparent first in sandysoils. The type of crop also has an effect. Corn is an annual crop with a limited rootsystem, especially in the early growing season, and is planted in widely spaced rows.Therefore, corn does not intercept all the NO3-N in the soil solution. This effect is morepronounced with a shallow-rooted crop such as potatoes. Alfalfa is a perennial with alonger growing season and has closely spaced plants. The root system for alfalfa is more

5-2
extensive and deeper than that for corn and does not allow as much percolation.Although alfalfa is a legume crop, it utilizes soil N if available. However, caution mustbe taken to consider in the N balance the amount released from alfalfa roots after thecrop is terminated.
Nitrogen losses may occur even when N is applied to crops at recommendedagronomic rates. Reports indicate NO3-N losses from crops amounting to 24 to 55% ofthe N applied at recommended rates. The apparent crop recovery (crop uptake) ofapplied N is in the order of 40 to 80%, depending on the timing of fertilizer applications,crop type, irrigation management, and other factors. Unused nitrogen will accumulate inthe soil, which may lead to subsequent leaching losses if careful management is notapplied.
Literature comparing organic and inorganic sources of nitrogen in typicalproduction agricultural operations often shows a higher risk of nitrate leachingassociated with organic N sources. This is due to greater uncertainties in the quantity oforganic N applied, the amount of ammonia N volatilized, the fraction of applied organicN that will be mineralized in each growing season after the application, and the amountthat will be denitrified. Managing organic wastes to supply crops at recommendedagronomic rates is challenging because organic wastes are a slow-release source of N,often with effects beyond the growing season of the application. These facts indicate theneed for careful budgeting and monitoring in the management of organic wasteapplication to land.
Regardless of the management objective (production agriculture or processedwater recycling), the amount of soil nitrate during the off-season period should beminimized. Rainfall typically exceeds evapotranspiration (greater percolation) and Nleaching losses are typically observed to be more predominant during this period. Covercrops grown during the off-season period may help to immobilize soil nitrate otherwiseavailable for leaching. The build up of nitrate by mineralization during and after thegrowing season, once significant crop uptake has ceased, is a challenge for Nmanagement. Subsequent excess percolation during fall, winter, and early spring willincrease the risk of leaching. The use of cover crops may be a necessary element tominimize this risk.
As shown by the introductory concepts on nitrogen and water balance, the soil N
content at any point in time results from a dynamic equilibrium among several
components. When N is applied at recommended agronomic rates (see the definition
given in the first item of the General Principles and Recommendations section of the
Executive Summary), crop N uptake should be the most significant component balancing
N inputs. N applications should be scheduled to meet crop demand after N supplied by
other sources such as net mineralization and residual soil N (N left in the soil from the
previous season) are accounted for. Although N requirements of most crops are known,

5-3
the management of N applications to match these requirements has often some
constraints.
In addition to the total amount, another consideration is the temporal distribution
of crop N uptake, which should be closely met to maximize uptake efficiency.
Management and/or environmental limitations may preclude a good matching, with the
end result that some nitrate may be left unused in the soil profile. Excess infiltration of
water will move nitrates down the soil profile, sometimes beyond the reach of roots. Fall
or winter N applications, particularly of inorganic sources, may further aggravate the
problem.
When applying organic wastes, it is important to know their N content and
mineralization rate to properly evaluate their impact on the overall mineral N budget of
the soil. In vegetable-processing wastewater, for example, NO3-N concentrations are
generally low (< 3 mg/L). However, the organic material contained in the processed
water from vegetable and fruit processing are mostly water soluble and readily
decomposable (Smith and Peterson, 1982). As these organic materials rapidly
decompose, the organic N is also rapidly converted to ammonium and then to nitrate
(Jewell, 1976).
The mineralization of organic N contained in organic waste, crop residues, and
stable organic matter occurs throughout the growing season, with varying rates according
to temperature and moisture conditions, and not in response to crop requirements.
Depending on climatic conditions, substantial amounts of mineralization may occur after
crop uptake has ceased (or become small) and after harvest. In Central and Eastern
Washington, low soil temperatures during the winter largely inhibit mineralization during
this period. Mineralized N is normally transformed rapidly to nitrate. Excess nitrate not
used by the crop will be available for leaching during the fall and winter.
An important aspect of the fate of nitrogen in agricultural systems is that N
leaching may occur even under well-managed conditions. Notwithstanding, the amount

5-4
of leaching can be minimized if good land N application and irrigation practices are
followed.
5.1. N losses during the growing season
During the growing season, organic and inorganic N applied to the soil may
undergo transformations. As a result, a fraction of the applied N may leave the soil in
gaseous form (volatilization or denitrification). Soil NO3-N, otherwise available for crop
uptake, may also be subject to leaching beyond the root zone, depending on the transport
capacity of irrigation and precipitation water infiltrating the soil during the cropping
season.
5.1.1. Gaseous emissions.
Gaseous emissions reduce the amount of N available for plant uptake, but they
also limit that available for leaching if conditions change to favor the latter. This may be
an important consideration for land application of organic waste where maximization of
N removal is sought. However, denitrification and ammonia volatilization may also
constitute an environmental hazard (Pain et al., 1989). Nitrous oxide is classified as a
“greenhouse gas”, a category of gases that may be involved in global warming.
However, the contribution of this gas to the greenhouse effect appears insignificant
compared to CO2 emissions (Philip Mote, University of Washington, personal
communication). Interest in ammonia emissions from livestock wastes has been
stimulated by the recognition of the importance of this gas in atmospheric chemistry and
its role in acid deposition. In the form of ammonium aerosols, ammonia can be
transported over long distances (Apsimon and Kruse-Plass, 1991).
Ammonia volatilization is a complex process involving chemical and biological
reactions within the soil, and physical transport of N out of the soil. The method of N
application, N source, soil pH, soil cation exchange capacity (CEC), and weather
conditions influence ammonia emissions from applied N. Conditions favoring
volatilization are surface applications, N sources containing urea, soil pH above 7, low
CEC soils, and weather conditions favoring drying. Precise estimates of ammonia
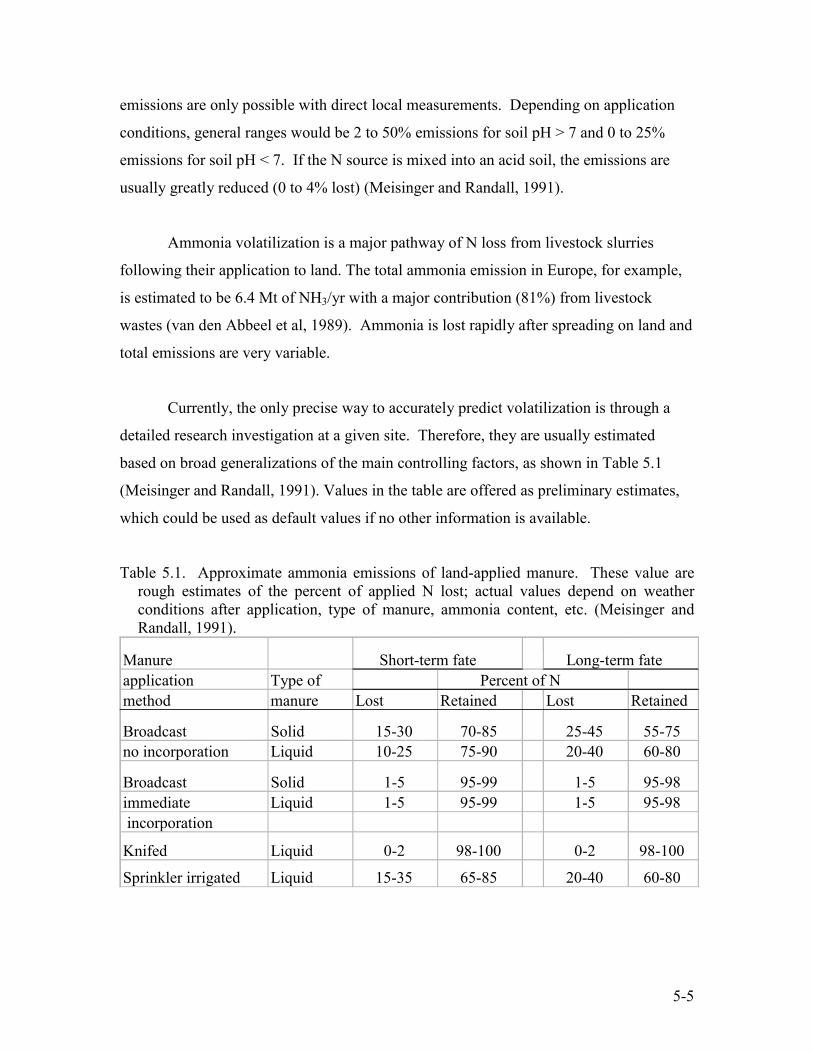
5-5
emissions are only possible with direct local measurements. Depending on application
conditions, general ranges would be 2 to 50% emissions for soil pH > 7 and 0 to 25%
emissions for soil pH < 7. If the N source is mixed into an acid soil, the emissions are
usually greatly reduced (0 to 4% lost) (Meisinger and Randall, 1991).
Ammonia volatilization is a major pathway of N loss from livestock slurries
following their application to land. The total ammonia emission in Europe, for example,
is estimated to be 6.4 Mt of NH3/yr with a major contribution (81%) from livestock
wastes (van den Abbeel et al, 1989). Ammonia is lost rapidly after spreading on land and
total emissions are very variable.
Currently, the only precise way to accurately predict volatilization is through a
detailed research investigation at a given site. Therefore, they are usually estimated
based on broad generalizations of the main controlling factors, as shown in Table 5.1
(Meisinger and Randall, 1991). Values in the table are offered as preliminary estimates,
which could be used as default values if no other information is available.
Table 5.1. Approximate ammonia emissions of land-applied manure. These value arerough estimates of the percent of applied N lost; actual values depend on weatherconditions after application, type of manure, ammonia content, etc. (Meisinger andRandall, 1991).
Manure Short-term fate Long-term fateapplication Type of Percent of Nmethod manure Lost Retained Lost Retained
Broadcast Solid 15-30 70-85 25-45 55-75no incorporation Liquid 10-25 75-90 20-40 60-80
Broadcast Solid 1-5 95-99 1-5 95-98immediate Liquid 1-5 95-99 1-5 95-98 incorporation
Knifed Liquid 0-2 98-100 0-2 98-100
Sprinkler irrigated Liquid 15-35 65-85 20-40 60-80

5-6
From experiments in the UK and the Netherlands, Pain and Thompson (1989)
reached the following conclusions: a) Following application of slurry to land, a large
proportion of the total ammonia emission occurred within a few hours (70% or more of
the total emission occurred within 24 hours of application but emissions continued for
over 15 days), b) Slurry composition, as influenced by dilution or the method of
management prior to land spreading appeared to have a major influence on the total
amount of volatilization while environmental and management factors had a smaller
influence, c) Emissions during spreading were generally less than 1% of those which
occurred following spreading (the fastest rates of loss occurred during the first hour after
spreading), d) Injection or acidification of slurry prior to spreading reduced ammonia
volatilization, e) Reducing volatilization increased loss of N through denitrification.
Attempts to utilize slurry as a fertilizer for grassland and arable crops have been
often characterized by low and variable recoveries of N (crop uptake). In production
agriculture, the injection or incorporation of slurry would be expected to reduce ammonia
loss and increase denitrification. Thompson et al. (1987) conducted two field
experiments in the UK commencing in winter (December) and spring (April) to
determine the fate of nitrogen in cattle slurry following application to grassland. In each
experiment, three methods of application were used: surface application, injection, and
injection plus nitrification inhibitor. Slurry was applied at a rate of 80 t/ha (about 250 kg
N/ha). From slurry applied to the surface, total ammonia volatilization was 77 and 53 kg
N/ha respectively for the winter and spring experiments. Injection reduced the total
volatilization to about 2 kg N/ha. Following surface application, denitrification was 30
and 5 kg N/ha for the two experiments. Larger denitrification emissions were observed
for the injected treatments. In the winter experiment, denitrification from the injected
slurry without nitrification inhibitor was 53 kg N/ha, and 23 kg N/ha with the inhibitor.
Total denitrification for the corresponding injected treatments in the spring experiment
were 18 and 14 kg N/ha. Leaching losses were negligible, reflecting the large and more
immediate gaseous emissions of N and the subsequent utilization of nitrate by the crop.

5-7
Compared to volatilization, denitrification emissions in agricultural systems are
much lower. For these systems, emissions of N2O were found to be lower than 5 to 7 %
of the applied N, even at high application rates of 680 kg N/ha/yr (Ryden and Lund,
1980). Similarly, Mosier et al. (1986) reported that, on well drained clay-loam soil sown
with corn in 1982, 2.5% of the 200 kg N/ha applied as (NH4)2SO4 was lost as N2O or N2.
The following year, only a loss of 1% could be measured from the same soil sown with
barley. Denitrification from land treated with anaerobically digested sewage sludge at
rates of 16.7 t/ha and 83.5 t/ha were slightly higher and could reach 7% and 5%
respectively. Measurements by van den Abbeel (1989) showed that most of the slurry N
volatilizes directly as NH3. Their results showed that up to 60% of the NH4-N added can
be volatilized in the four days immediately following the application. The losses
attributed to denitrification represented only 7% of the amount of NH4-N.
Nitrogen emissions by denitrification have a different meaning for production
agriculture than for land application systems for processed water recycling. The
objective in production agriculture is to maximize crop use of the applied fertilizer. Thus
management of denitrification-related factors in this industry emphasizes minimizing
emissions. The converse is true for land application systems designed to maximize N
removal from organic waste.
Denitrification emissions are usually small during much of the year with periodic
major events occurring when rainfall or irrigation rewet the soil. Some generalized
figures for denitrification are given in the following table, which was developed under the
assumption that low oxygen is the major factor influencing field denitrification and that
oxygen supply is primarily controlled by soil water content (Meisinger and Randall,
1991).

5-8
Table 5.2. Approximate N denitrification estimates for various soils. (Meisinger andRandall, 1991). See footnote for adjustments due to tillage, manure N, irrigation,drainage, and special soil conditions
soil organic Soil drainage classificationmatter Excessively Moderately Somewhat Poorlycontent well-drained Well-drained well-drained poorly drained drained
% % of inorganic N (fert., precip.) denitrified*<2 2-5 3-9 4-14 6-20 10-302-5 3-9 4-16 6-20 10-25 15-45>5 4-12 6-20 10-25 15-35 25-55
*Adjust for tillage, manure, irrigation, and special soils as follows: for no-tillage use one class wetterdrainage; for manure N double all values; for tile-drained soils use one class better drainage; for paddyculture use values under poorly drained; for irrigation or humid climates use value at upper end of range;for arid or semiarid non-irrigated sites use values at lower end of range; for soils with compacted veryslowly permeable layer below plow depth, but above 4-ft deep, use one class wetter drainage.
The factors that determine whether denitrification occurs are the presence of
adequate supply of NO3-N, denitrifying organisms, a suitable carbon substrate for them,
and an anaerobic atmosphere (Altman et al., 1995). One of the main rate-determining
factors is soil temperature. There are indications that denitrification does not occur below
about 6-8 oC, but other data have suggested that it can occur at close to 0 oC and that
denitrifying populations adapt to the local climate. Maximum denitrification rates occur
at 40 oC (Jacobson and Alexander, 1980). In addition to temperature, the other main
determinant of denitrification rate is the amount of carbon substrate available. Goulding
and Webster (1989) investigated if there was any difference on denitrification if the
carbon source was from fresh organic material or stable organic matter, and found the
former to be more effective.
Many studies that measured denitrification potential indicate that denitrification
rates were low or negligible with depth (Ambus and Lowrance, 1991; Lowrance, 1992a).
In row crops there was evidence of denitrification as deep as 0.42 m (Lowrance, 1992b).
Groffman et al. (1992) also observed a large drop in denitrification enzyme activity from
the ground surface (0-0.15m) to the top of the seasonal high water table. Ambus and
Lowrance (1991) determined that 68% of the denitrification potential in loamy sand and
fine loamy sand occurred in the top 0.01 m of the soil. Relatively high rates of

5-9
denitrification may result to a depth of 0.25 to 0.30 m under the right conditions (Ambus
and Lowrance, 1991). In contrast to these studies, Smith et al. (1991) measured the
maximum rate of denitrification at 4.7 m below the water table in a sand and gravel
aquifer. Nitrate can also be reduced with the oxidation of pyrite when there is not an
organic C source (Postma et al., 1991). This may play a role on reducing N content of
groundwater. This is discussed in a later section.
Stimulation of denitrification by the addition of decomposable organic material to
soil has been widely reported (Firestone, 1982; Fillery, 1983). When slurries are applied
to soil, the additional organic material may promote conditions conducive to
denitrification as inferred from higher rates of N2O emission from soils treated with cattle
slurry (Thompson and Pain, 1989). From a study conducted in England, these authors
drew the following conclusions: a) Approximately 30% of the NH4-N from autumn-
winter surface applications of cattle slurry to grassland on a freely drained soil was lost
by denitrification, b) Reducing NH3 volatilization loss by injection or acidification
appreciably increased denitrification from autumn/winter applications of cattle slurry to a
freely drained soil, c) Denitrification was small from surface applications of cattle slurry
in the spring to a freely drained soil, d) denitrification was negligible from autumn and
spring applications of cattle slurry made to a poorly drained soil that remained saturated
throughout the winter (this is probably due to nitrification inhibition), e) denitrification
from autumn/winter applications of cattle slurry to a freely drained soil continued
throughout the winter despite soil temperatures that were generally less than 6 oC. The
length of the period between the initial nitrification of slurry ammonium-N and depletion
of soil nitrates by crop growth in the spring was a major determinant of total
denitrification.
Hill (1986) found that, under good agronomic practices and application of N as
NH4NO3 in potatoes in a sandy loam soil, denitrification was significant. Using
incubations he showed that 8-20% of the initial NO3-N was denitrified over a 14-day
period in surface soil. The potential for denitrification at greater soil depth was very low.

5-10
Olson (1982) indicated that after fall application of 80 kg N/ha in winter wheat,
denitrification of 10 to 18% of the applied N occurred soon after the application
(broadcast application of (NH4) SO4.). Tindall et al. (1995), working under controlled
conditions, found that denitrification ranged between 0.5 to over 10% of the applied N.
Goulding et al. (1993) studied the fate of 222 kg N/ha applied in spring as K15NO3
to winter wheat. They measured maximum rates of denitrification of over 1 kg N/ha/d
following heavy rain. After N application and anthesis, accumulated emissions were in
the range of 5.3% to 3.6% of the applied N. Ryden (1983) found rates of denitrification
around 2 kg N/ha/d, from a loam soil under grassland that had received 500 kg N/ha in
early spring. Such high rate occurred only when heavy rain followed the application of N
and the temperature of the soil was increasing. Colbourn (1984) estimated that, in a wet
spring, >30% of the 100 kg N/ha applied to a winter wheat crop on a clay soil was
denitrified at rates up to 1 kg N/ha/d.
At Derio, Bizkaia, Estavillo et al. (1996) found denitrification figures of 15% to
40% of the total N applied in a poorly drained clay loam soil with surface applied slurry
and high precipitation conditions (1234 and 1686 mm). Jarvis et al. (1987) found
denitrification emissions from surface-spread slurry that were equivalent to 12% and 2%
of the total N added (248 and 262 kg N/ha) for winter and spring applications,
respectively.
In Denmark, four years of application of pig slurry or inorganic fertilizer to a
sandy loam soil cropped with barley showed that there existed a large potential for
denitrification. These emissions occurred during periods in the spring of alternating
frost/thaw or in periods with frequent rainfall. During dry periods, denitrification was
largest from soil treated with large amounts of pig slurry (320 kg N/ha/yr plus 100 kg
organic N/ha/yr) (Maag, 1989).
Under conditions of high carbon availability (No-till systems or manure-amended
soils) denitrification is higher, and it is sustained deeper in the soil profile. Irrigation

5-11
with processed water would also promote deeper penetration of carbon and deeper
denitrification. Research results (Kimble et al., 1972) showed that more nitrate was lost
by leaching when N was applied as NH4NO3 than when applied as dairy manure, both
because there was more nitrate in the profile and because it was less susceptible to
denitrification.
Effects of dairy manure and N fertilizer were studied on plots that had received
two levels of manure (0 and 66 metric tons/ha) applied every spring for 6 years.
Laboratory incubation studies using soil profile samples showed potential denitrification
to be greater in soil from the manure treated plots than in plots receiving either inorganic
N or no N. The amount decreased with depth to 96 cm, below which energy for
anaerobic microbial activity appeared to be limiting (Kimble et al., 1972).
Loro et al (1997) found that denitrification and N2O production were enhanced
following manure application compared with fertilizer application, but not in subsurface
soil. Manure provides mineral N (mostly NH4+) and C substrate for denitrifiers and, if
applied as a slurry (instead as solid manure) limited oxygen supply enhances
denitrification. They also found that denitrification does not occur at 40 cm depth or
deeper into the soil at a rate high enough to consume significant quantities of nitrate.
This will leave nitrates free to be leached to groundwater.
Addiscot and Powlson (1992) analyzed and partitioned the N losses (leaching
losses and gaseous emissions) reported for 13 winter wheat field experiments where
nitrogen was applied in spring. They concluded that denitrification seemed to be the more
important pathway. On average, the total loss was 15.7% of the total applied, of which
denitrification contributed 10% and leaching 5.7%. Rainfall in the first three weeks after
application ranged between 12 and 112 mm.
The presence of shallow water tables or perched water tables due to abrupt soil
textural discontinuities may favor denitrification. Application of organic wastes with
high biological oxygen demand (BOD) will further enhance anaerobic conditions leading

5-12
to denitrification. In a study conducted by Smith (1976) at a potato processing plant in
Idaho, the BOD and the total N and nitrate concentrations in the processed water and in
the soil solution at several depths in a treatment field where the processed water was
applied were studied for a 2-year period. Application rates of 1,635 and 1,080 kg N/ha
were applied in the first and second year, well in excess of the 320-kg N/ha removed by a
grass crop. Leaching losses and crop uptake accounted for only part of the applied N,
while most of the applied N in the season remained unaccounted for. The soil N
accumulation was not directly measured. However, the author hypothesis was that a
sizeable fraction of applied N was denitrified rather than accumulated in the soil.
Plentiful carbon availability, a water table ranging from 90 to 150 cm below the soil
surface in the summer, and excessive irrigation make this interpretation plausible.
Although this may represent an extreme condition, management of denitrification as a
means of N removal from land-applied organic processed water should be further
investigated for conditions at Washington State.
5.1.2. Leaching losses.
Since nitrates are soluble in water and water tends to percolate downward through
soil in response to gravitational forces, nitrate leaching is a natural process that preceded
agriculture. Deep water percolation will take place when rainfall (or irrigation) exceeds
water loss by evapotranspiration. The amount of nitrogen lost with percolating water
depends on the nitrate concentration in the soil profile. This nitrate concentration is
strongly influenced by N land application methods and management.
The production of drainage water will depend not only on climatic factors such as
rainfall (total amount and distribution over the year) and temperature, but also on soil
type, depth of groundwater table, and the characteristics of the local irrigation
management (in irrigated areas). These factors make it difficult to compare research
findings of nitrogen losses by leaching collected under different environmental
conditions. Under West European conditions, for example, water surplus (drainage)
ranges from 0-500 mm/year, mainly in autumn and winter when temperature and crop
growth are low (Kolenbrander, 1981). In Washington State, average annual percolation

5-13
rates fluctuate from 50-125 mm in dryland Eastern Washington, to more than 250 mm in
irrigated Central Washington (Ryker and Jones, 1995), to 50-500 mm and more in
Western Washington (Ronald Hermanson, personal communication).
Perhaps the greatest uncertainty when measuring or predicting deep water
percolation and associated nitrate leaching in soil deals with the heterogeneous pore
distribution in the root zone where microbial N cycling can greatly alter N availability for
leaching. Large pores created by shrinking and swelling of clays, decomposition of roots,
and faunal activity can accelerate water movement (two to five times higher for soils
without obvious macropores, and as much as twenty times for soils with cracks). This
increased water movement will have different effects on nitrate leaching depending on N
concentration of those areas of the soil "bypassed" by infiltrating water, the rate of water
application, the N concentration of infiltrating water, and other factors. The net result,
however, is generally one of increased N amounts being transported beyond the reach of
crop roots. Aschmann et al. (1992) detected flushes of nitrate and other ions and they
attributed them to preferential flow through the profile. Sidle and Kardos (1979) showed
that, owing to macropore flow associated with root channels, NO3-N leaching can occur
more rapidly in soils than hydraulic equations would predict.
The concentration of nitrate does not only depend on the amount of nitrate in the
profile but also on the amount of water. This effect of water content in the soil profile on
leaching is demonstrated in Fig. 5.1 (Kolenbrander, 1981), taken from calculations by
Rijtema (1978). This figure shows that, with the same water surplus, the percentage of
nitrate lost in autumn and winter increases as the saturated water content of the profile
decreases. This means that, under the same climatic conditions, the leaching loss on a
peat soil is lower than on sandy soil due to lower drainage and a lower nitrate
concentration in the soil water.

5-14
-20
0
20
40
60
80
100
120
0 100 200 300 400 500 600
Precipitation surplus ( mm)
200mm300mm400mm500mm600mm
Fig 5.1. Relationship between precipitation surplus and percent nitrogen leached inautumn and winter in a water-saturated soil profile. Curves represent different watercontents of the saturated profile (Kolenbrander, 1981)
N leaching (%)
For comparisons, it is also important that N leaching losses are compared at the
same level of drainage water production. Figure 5.2. shows that there is a clear linear
relationship between N-leaching loss and drainage water production in the same soil.
Randall and Iragavarapu (1995) also showed that the amount of N leaching is
related to the amount of percolating water. They conducted a study on a poorly drained
clay loam in Minnesota with continuous corn and N fertilization rates of 200 kg N/ha for
several years (fertilizer N was applied as one dose in the spring before planting). They
found that annual losses of NO3-N in the tile water ranged from 1.4 to 139 kg/ha. In dry
years, losses generally were equivalent to less than 3% of the fertilizer N applied,
whereas in the wet years, losses ranged from 25 to 70% of that applied. Pang et al
(1997), in an irrigation quantity and uniformity study, concluded that N leaching was
very low when the N application was close to crop N uptake and slightly higher when the
uniformity coefficient of the irrigation was 90%. When N application exceeded N uptake,
N leaching increased dramatically for all uniformity levels.

5-15
0
5
10
15
20
25
30
35
40
45
0 50 100 150 200 250 300 350
drainage (mm)
N leached(kg N/ha)
No
N3
Fig. 5.2. Relationship between drainage water production and N losses byleaching. N0 and N3 refer to two treatments with and without nitrogen(Kolenbrander, 1969).
Given the fact that crop N uptake constitutes a significant fraction of the N
balance in croplands where N applications are managed according to agronomic rates, the
nature of the crop (vegetation) on a given area plays a role in determining N leaching.
Kolenbrander (1981) analyzed data sets from Germany, the Netherlands, and the United
Kingdom, normalizing N losses to a standard drainage level of 300 mm/ha/year. From
this study, the author concluded that, at very low rates of application, the leaching levels
of arable land are significantly higher than on grassland. This is caused by the different
nature of the N-uptake pattern of the crop. On grassland, however, a strong increase in
N-leaching occurs at rates higher than 200 kg N/ha/year. At very high rates (higher than
800 kg N/ha/year), the nature of the crop will no longer play an important role in
determining the rate of leaching.
Bergstrom et al. (1987) conducted an experiment where leaching of nitrate with
drainage water from tile-drained field plots and from three types of lysimeters was

5-16
estimated during a 4-yr period. Treatments included barley with and without N-fertilizer,
a grass, and alfalfa. The maximum amount of nitrate leached was 36 kg N/ha/yr for
barley fertilized with Ca(NO3)2 (120 kg N/ha/yr). For unfertilized barley the
corresponding amount was 5 kg N/ha during the same period. The nitrate fluxes from the
grass and alfalfa were mostly below 5 kg N/ha/yr. However, after the grass was plowed,
considerable leaching occurred, reaching 42 kg N/ha during 20 weeks following plowing.
Weather conditions had a strong influence on the temporal distribution of leaching losses.
Legumes have the ability to fix N and are sometimes used to supply N in a
legume-grass mixture (Owens, 1990). Not only is mineral N fertilizer rarely applied to
legumes, but also legumes can supply a portion of the N for the succeeding year’s crop.
However, few NO3-N concentration data are available for leachate or groundwater under
legumes. In a 3-yr Swedish study (Bergstrom, 1987), 0 to 6 mg/L and 0 to 18 mg/L of
NO3-N were observed in lysimeter leachate and tile plots, respectively, from alfalfa. In
Ohio tile drainage, 1.5 mg/L NO3-N was observed in leachate under alfalfa in a 2-yr
study while 4.9 to 32.8 mg/L (8.9 mg/L weighted average) was measured under soybean
(Logan et al., 1980). Using soil extracts, 3 to 15 mg/L NO3-N was contained in soil
solution under irrigated alfalfa plots in Idaho (Robbins and Carter, 1980).
Owens (1990) observed that NO3-N concentrations in the percolate resulting from
alfalfa-grass mixture were below the 10-mg/L level. Most of the levels were below 5
mg/L, in strong contrast to the normal range of 20 to 40 mg/L NO3-N in the leachate from
corn. The nature of the crops helps to produce such differences. Corn is an annual crop
with a limited root system, especially in the early growing season, and is planted in
widely spaced rows. Therefore, corn intercepts not all the NO3-N in the soil solution.
Alfalfa is a perennial with a longer growing season and has closely spaced plants. The
root system for alfalfa is more extensive and deeper than that for corn and does not allow
as much percolation. Alfalfa utilizes soil N if available, and it is able to intercept and
utilize most available N passing through the soil.

5-17
Also, as shown in Table 5.3, N leaching in heavier soils (clay) is lower than in
light soils, both on arable land and grassland.
Table 5.3. Mean leaching losses for different soils and landuse
Arable land Grassland Mean fertilization level 170 kg N/ha 250 kg N/ha Leached: sandy soil 100 " " 12 " " clay soil 42 " " 9 " "
Gaines and Gaines (1994) indicated that soil texture affects NO3-N leaching. In
coarser soils, NO3-N will leach faster than from finer ones. The addition of peat in sandy
soils helps in reducing the velocity of N leaching. Tindall et al (1995), in a laboratory
analysis, indicated that leaching of NO3-N was significant in both clay and sandy soils.
They concluded that in clay soils leaching occurred less rapidly than in sandy soils.
Nevertheless, after enough time, 60% of the NO3-N was leached from the clay soils.
Due to different water holding capacities and associated transport velocity, all
other factors constant, N leaching will be apparent first in sandy than clay soils. Jansson
et al. (1989) reported that, from a simulation study, it was found that a sandy soil was
generally more sensitive to variation in factors like climate, form and timing of applied
N, and composition of manure than was a clay soil. Nitrogen leaching could often be
described with linear functions of applied N for the sandy soil, where more or less clear
thresholds were seen in the response function for clay soils.
5.2. N losses during the non-growing season
The quantity of nitrate passing from arable land to aquifers is often determined by
the nitrate content of the soil just before winter leaching begins (Powlson et al, 1986).
Nitrate present in arable soils in the fall is available for denitrification or at risk of
leaching during the winter. The presence of N in the soil in the fall is derived mainly
from unused N at the end of the cropping season plus mineralization of organic N derived
from humus, crop residues or organic waste.

5-18
The nitrate fluxes depend on drainage volume and nitrate concentration. The
nitrate concentration of drainage water tends to reach a long-term equilibrium for a
particular crop/land N application management. The yearly variations in off-season
nitrate fluxes mostly reflect varying drainage volumes. There are several investigations
showing a strong dependence between mass emission and drainage volume (Golton et al.,
1970; Letey et al., 1977).
5.2.1. Gaseous emissions.
Conditions for gaseous emissions are usually more favorable during the non-
growing season. Organic waste and ammonium-based inorganic fertilizers are applied in
advance of crop planting to allow time for mineralization and/or nitrification. Wet
conditions during fall and winter contribute to denitrification. Ammonia volatilization
occurs rapidly after application of manure.
Fall application of N for corn is common in the western Corn Belt. Nearly 21% of
the N applied to corn is fall-applied, and nearly 24% of corn receives at least some of its
N during the previous fall (Taylor and Vroomen, 1989).
Animal wastes are often applied in the fall. Injection is often the preferred
application method if reduced volatilization is desired (production agriculture). Liquid
injection of manure may increase denitrification by creating an anaerobic quality,
abundant in inorganic N and oxidizable C (Comfort et al, 1988). The storage of animal
wastes in slurry form and subsequent application to land has the advantage of more
flexibility in application times, lower labor requirements, less potential for runoff and
surface water pollution.
5.2.2. Leaching losses.
There will generally be less percolation from single rainfall events when a crop is
growing than the situation without a crop. The latter is more significant during winter
when soil evaporation is low. Therefore, given equal rainfall, geographical locations that
receive peak rainfall during the cropping season should have less percolation than

5-19
locations that have peak rainfall at times when no crop is growing. Likewise, peak
rainfall timing relative to crop development causes year-to-year differences in percolation
at a given location. Williams and Kissel (1991) illustrated this point using simulation
results for corn production at Caldwell County, Kentucky. They compared the
simulations from two years that had nearly identical rainfall but differed greatly in the
timing of the rains. Although both years had about 1,092 mm of total annual rainfall, one
year received 62% of the rain in the first 6 months of the year, whereas the other year
received only 27% of the total rainfall in the first 6 months. The effect on percolation
was pronounced. The year with early rain had 315 mm of percolation, whereas the year
with later peak rainfall had 218 mm of percolation. Also, since a considerable portion of
the percolation from the early rain simulation was just following N fertilizer application,
but before peak crop use of N, leaching loss of N in percolate was substantial (86 kg/ha).
Loss of N from the late rain was much less at 15 kg/ha. These authors concluded that
rainfall timing with respect to crop growth and time of N application can greatly
influence percolation amounts and N loss by leaching (Williams and Kissel, 1991).
For spring N applications, the water balance will become negative or will show
small excess due to the high rate of evapotranspiration. The chances of losses by
leaching will therefore be small. Organic wastes are often applied during fall and winter
for economic reasons (better spreading of work over the season, smaller storage
capacity). This may result in increased likelihood of nitrate losses due to leaching.
In Delaware, where one of the most concentrated poultry industries is located,
approximately 250 millions of broilers produce > 200,000 t of manure each year. At
currently recommended rates (about 6 to 9 t/ha) poultry manure alone could provide most
of the N required by the 68,000 ha of maize grown annually in Delaware. Due to
different factors, local excess of manure often exists, and manure application often occurs
in winter or early spring, when crop uptake is low (or nonexistent) and precipitation is
highest. These factors enhance the likelihood of NO3-N leaching to groundwater (Sims et
al., 1995).

5-20
In production agriculture, leaching of N after the application of slurry is typically
higher than after application of mineral N fertilizer. This is due to a) a high proportion of
the slurry being spread in autumn and b) the rates of slurry nitrogen applied being usually
higher than the rates of fertilizer N applied per hectare.
Vetter and Steffens (1981) conducted a field experiment where they applied 30
m3/ha of slurry in August, October, December and February/March on humus sands and
clayey silts. These treatments were compared with unmanured plots. The N
concentrations in the shallow groundwater after spreading slurry at different dates
showed clearly that the amount of N leached decreased as the date of application of the
slurry came closer to the date of the start of crop growth. The highest N leaching was
found after spreading the slurry in August and the lowest after spreading in
February/March. When slurry was applied in February/March, the N concentrations in
the shallow groundwater were only slightly higher than in the unmanured treatments.
The yields of cereals grown after the spreading increased as the date of application of the
slurry approached springtime. Soil analyses for nitrate and ammonium also indicated that
the amount of mineral N increased as the date of the application of the slurry approached
springtime.
These same authors (Vetter and Steffens, 1981) carried out field trials for 4 years
where treatments with increased rates of pig slurry were applied in the autumn (rates of 0,
30, 60, 90 m3/ha). After 4 years, there was an almost linear increase in the N content of
shallow groundwater from 30 mg N/L (unmanured plots) to 80 mg N/L (plots with 90
m3/ha). The almost linear increase in the N concentrations indicates that where slurry is
spread in autumn a certain percentage of the added slurry N will be leached
independently of the slurry amount. This means that even relatively low slurry dressings
in autumn can lead to increased leaching of N.
Owens (1990) found experimentally that most of the NO3-N moved during the
winter and spring periods, regardless of crop. This was the combined result of higher N
concentrations and much greater percolate volumes. The seasonal variation of percolate

5-21
volumes resulted from much lower evapotranspiration rates during the dormant periods
than during the growing season.
Precipitation is one of the major factors affecting the patterns of N transport and
its transformations. Hill (1986), working in sandy loam soils with a potato crop with
fertilization rates ranging between 160 to 200 kg N/ha, reported that most of the N
leaching occurred in fall and early spring. This author found peaks of N concentration in
the groundwater during early summer and early winter that suggested that NO3-N
movement to the aquifer occurred during the autumn and early spring periods of
groundwater recharge.
Olson (1982) reported that, after fall application of N fertilization to winter wheat
at agronomic rates (80 kg N/ha nitrogen fertilization), leaching is expected when there is
enough precipitation between the time of application and the period of rapid spring
growth to cause appreciable drainage. In this set of experiments, drainage during late
October and the end of March carried out about 47 kg N/ha.
Jokela and Randall (1989), conducted a study for three years on two non-irrigated
southern Minnesota soils with different nitrogen rates fluctuating between 75 and 300 kg
N/ha in corn. They found residual NO3-N values in the 1.5 m profile ranging from 150 to
400 kg N/ha for most treatments in the fall but was 50 to 70% lower the following spring.
This was attributed in part to leaching beyond the root zone.
Martin et al. (1994), working with lysimeters and irrigation strategies in a sandy
loam soil in Michigan, concluded that most of the nitrate loss occurred between the
harvest date and the subsequent planting date. Jokela (1992) reported changes in soil
nitrate between the fall and spring sampling dates working with several treatments
involving N fertilizer and manure applied in corn. Little or no loss (15 kg N/ha or less)
occurred if <60 kg/ha of NO3-N remained in the profile at the time of the fall sampling.
Profile nitrate with the only manure treatment was similar to the inorganic fertilizer

5-22
treatment suggesting that off-season leaching potential from manure is equal or slightly
less than from agronomically equivalent rates of fertilizer N.
In the early 70’s, Jones et al. (1974), working with different combinations of
pastures and fertilization applied in the autumn, reported that of the total N leached, 94%
was in the fall, 6% in the winter and less than 1% in the spring. They also reported that,
of the applied N, 38 to 50% remained unaccounted for at the end of the study. Part was
probably lost by denitrification during the wet winter, and some probably remained in the
soil, fixed in undecomposed roots and organic matter.
Peralta et al. (1997), using simulation techniques, demonstrated that non-growing
season N leaching was the major contributor to total N leaching of irrigated potato
rotations (potato/wheat/maize) in the Pasco area of the Pacific Northwest. This is an area
with average precipitation of 175 mm, mostly concentrated in the winter and early spring.
Bergstrom et al. (1987) indicated that, under Swedish conditions, leaching of
nitrate from arable lands occurs mainly during the autumn (September-November), which
is characterized by high precipitation and low evapotranspiration (Bergstrom and Brink,
1986). During this period, levels of inorganic N in the soil are often high, and the soils
are commonly bare.
Regardless of the management objective (production agriculture or processed
water recycling), the amount of soil nitrate during the off-season period should be
minimized. Rainfall typically exceeds evapotranspiration (greater percolation) and N
leaching losses are typically observed to be more predominant during this period.
Cover crops may significantly immobilize this supply of soluble N (MacLean,
1977; Andersson et al., 1984), and thereby reduce nitrate leaching. Francis et al. (1994),
in a experiment using rotations with legume and no legume crops and spring crops,
reported that the use of leguminous crops producing large amounts of low N content
residues (e.g., lupins) has advantages in reducing autumn/winter leaching losses through

5-23
intensive net immobilization of soil N in the autumn. The authors also indicated that the
use of winter cover crops after grain legumes, established in the autumn, could take up
much of the mineral N remaining in the soil at harvest or produced through subsequent
net N mineralization. The apparent leaching losses over the winter/spring period were
greater following leguminous (mean 72 kg N/ha) than following non-leguminous (mean
37 kg N/ha) grain crops. This is because leguminous crops (except lupins) supply some
of their N by symbiotic fixation, so less soil N is taken up by the plants.
McCracken et al. (1994), in a study to evaluate different sources of N and cover
crops, concluded that cover cropping with rye can be a powerful tool for reducing over-
winter leaching of nitrate. Losses with no cover crop and cover crop were 37.3 kg N/ha
and 1.5 kg N/ha, respectively.
5.3. The role of mineralization on N leaching
Mineralization of nitrogen from stable organic matter occurs throughout the year,
with peak amounts when temperature and moisture conditions are suitable for the
microbial activity responsible for the process. This mineralized nitrogen may lead to N
leaching if not accounted for when N application decisions are made and when
mineralization is occurring during the period where plants are not actively absorbing
nitrogen.
Mineralization of organic to inorganic N depends on the soil organic matter
content and environmental conditions such as soil moisture and temperature. Macdonald
(1989), working with N-labeled fertilizer, demonstrated that for soil growing winter
wheat and contrasting soil types and fertilization rates, almost all of the nitrate at risk of
leaching over the winter period came from mineralization of organic nitrogen, not from
unused fertilizer applied in spring. Unused fertilizer may also be a significant contributor
if N amounts in excess of demand are applied to the precedent crop.

5-24
Sieling et al (1996), in Germany, indicated that application of slurry in the fall
increases N leaching. A hot and dry summer and a mild winter with rainfall above
normal, lead to intense N mineralization and subsequent N leaching during the winter.
Continuous application of inorganic fertilizers seems to increase long-term N
mineralization rates. Glendining et al (1996) demonstrated that long-term fertilizer
treatments (over 135 years) have increased N mineralization due to the build-up of soil
organic N.
Hart et al (1993), working with labeled-N in winter wheat, indicated that most of
the labeled-N was presumably mineralized during the fall and winter when the losses are
high and crop demand is low. They concluded that leaching of NO3-N from cereals
comes predominantly from mineralization of organic N, not from residual unused N.
Olson (1982), after working in the fate of N applied in the fall using labeled-N and
agronomic rates in winter wheat, found that from all the leaching produced during the
winter time, only about 10% of it came from the fertilizer nitrogen.
This build up of nitrate by mineralization after significant uptake by the crop
during the growing season has ceased is a challenge for N management. Subsequent
excess percolation during fall, winter, and early spring will increase the risk of leaching.
The use of cover crops may be a necessary element to minimize N leaching losses.
5.4. The role of cropping systems and tillage method on N leaching
Cropping systems may be a major factor in regulating nitrate movement below the
root zone and toward the water table. Rooting depth, water requirement, water-use rate,
N-uptake rate, and time of water and N uptake are all factors involved in nitrate leaching
that can be affected by choice of cropping system. For nitrate leaching to occur,
appreciable concentrations of nitrates must be present in the root zone at the time that
water is percolating. If, by changing crops, we can reduce either nitrate concentrations or
quantity of water percolating through the soil, we can reduce the potential for
groundwater contamination (Peterson and Power, 1991).

5-25
Rate and depth of crop rooting are major factors affecting the time, quantity, and
depth from which water and nitrates may be removed from the soil. Also, a crop may be
more effective in controlling nitrate leaching if the rate of water and N uptake is
relatively high at the time of the year when nitrate leaching is likely to occur, or if the
crop roots have greatly depleted stored water and nitrates earlier.
It is known from experiments with mineral N fertilizers that different cropping
systems can influence the rate of leaching of N. Generally, the leaching of N is lower on
grassland than on tillage land and is lower for plants with a longer vegetation period than
those with a shorter vegetation period. At very low rates of application, the leaching
levels of arable land are significantly higher than on grassland. This is caused by the
different nature of the N-uptake pattern of the crop. On grassland, however, a strong
increase in N-leaching occurs at rates higher than 200 kg N/ha/yr (Kolenbrander, 1981).
Because essentially all work has shown that zero-till management results in
greater infiltration, it is often assumed that greater leaching should also occur. However,
this assumption is not always correct. Kanwar et al. (1985), working on a loam soil in
Iowa observed much less leaching of N in no-till (NT) plots than in moldboard plow
plots. Other results showed that plots under no-till maintained significantly higher NO3-N
amounts in the 0- to 30-cm layer, with 40% of the NO3-N initially present still there after
12.7 cm of rain and 33% remaining after the additional 6.35 cm of rain. The
corresponding numbers for the moldboard-plow plots were 19 and 9%. The amount of
NO3-N leached from the 150-cm profile with 12.7 cm of rain was also less (29 kg/ha) for
the no-till compared with moldboard-plowed plots (122 kg/ha) (Kanwar et al., 1985).
Gilliam et al. (1987) contend that different results are explained by the tendency of water
to move in large pores in the NT areas. This allows water that contains fertilizer N to
move deeper in the soils so that deeper N movement is observed. In the Iowa
experiments, much of the nitrate was present in the soil before fertilization. Thus the
water which moved in the large pores bypassed much of the N present in the profile so

5-26
that less nitrate leaching occurred. These results point out the importance of proper
consideration of soil characteristics before any generalizations can be made.
5.5. Optimum crop yield and N leaching
Crop yield is not of direct concern in land application systems designed for
management of organic wastes. However, maximizing N removal is correlated with
maximum biomass production and yields. Therefore, unless these systems are managed
for less than maximum crop removal, most of the discussion that follows is pertinent.
Typical experiments of crop yield response to N indicate rapid yield increase with
increased applied N at the low end of N application rates. However, the rate of increase
decreases with larger N application rates until the yield response to N reaches a plateau
with minor to negligible changes. Normally, a fairly broad range of N rates can be
chosen without affecting yields significantly (Pratt, 1979).
A procedure for calculating N-rate requirements include the following
parameters: a) unit N requirements, i.e. the aboveground N crop uptake per unit of yield,
b) fraction of N applied taken up by aboveground crop (N fertilizer recovery fraction), c)
realistic yield goal, and d) credit for non-fertilizer sources of N (Bock and Hergert, 1991).
Table 5.4 provides general guidelines for estimating N fertilizer recovery fractions when
using N rates for maximum or near maximum yield. Values in this table are not the same
as N uptake efficiency because residual N uptake is not considered. However, both
indices should be closely related. The table emphasizes that timing of N applications and
crop types are significant factors.
Altman et al. (1995) reported NO3-N losses from crops amounting to 24 to 55%
of the N applied at economic optimum rates (typically providing for near maximum crop
yields). In Pennsylvania, the apparent recovery of N fertilizer (ammonium nitrate)
applied at the economic optimum N rate in 42 experiments averaged 55% (Fix and
Piekielek, 1983). Thus, even when using optimum fertilization rates, a potential exists
for fertilizer N to accumulate in the soil with subsequent risk of loss through leaching.

5-27
Overall crop management should be improved to maximize crop uptake of applied N (see
Table 5.4).
Table 5.4. General guidelines for estimating N fertilizer recovery fraction when using Nrates for maximum or near maximum yield1 (Bock and Hergert, 1991).
Relativeefficiency of N-
applicationtiming
Perennialgrasses
Upland cerealgrains
Shallow-rootedcrops
Flooded crops
Low2 0.55 0.45 0.35 0.25Medium3 0.70 0.60 0.50 0.40
High4 0.80 0.70 0.60 0.501 N fertilizer recovery fraction values assume medium-to-high nitrate loss potential as determined by soiltype and moisture regime and no or negligible NH3 volatilization losses2 One N application (without nitrification inhibitor) well in advance of the growing season. When nitrateloss potential is low due to soil type or moisture regime, use nitrogen-use efficiency values for medium tohigh efficiency of N application timing.3 One N application near beginning of growing season.4 Multiple N applications with first application near beginning of growing season; use of nitrificationinhibitor may substitute or partially substitute for splitting N applications.
Schroder et al. (1993) concluded that pollution risks from maize can be reduced
by adding N at rates below economically optimum levels. Improved management
practices such as N placement (Maddux et al., 1991; Sawyer et al., 1991), conditional
post emergence N dressings (Magdoff, 1991) and winter cover crops (Schroder et al.,
1992), seem necessary to ensure that economic and environmental goals can both be
realized.
Using manure to supply N at near optimum economic rates may lead to higher
losses than using inorganic fertilizers as the N source. A substantial quantity of inorganic
N may be produced from mineralization of organic N after the crop has ceased to absorb
N. This manure-derived nitrate may be subject to leaching during the winter and spring
(Schepers and Fox, 1989). Sims (1987) found that at near optimum N rates, even with
poultry manure that has a high proportion of its N available, only 36% of the N was
removed by a maize crop, compared to 56% of inorganic fertilizer N applied. Saint-Fort
et al. (1991), analyzing a number of investigations, also concluded that using manure to
supply N at near economically optimum rates may result in significantly higher leaching
loss of nitrate than when inorganic N fertilizer is applied. This increase is thought to be

5-28
due to late fall or early spring mineralization of manure. The concept that manure N will
not all be available for crop uptake and that mineralization will increase soil nitrate
accumulation applies the same if N rates are intended for maximum or less than
maximum yields.
Jemison et al. (1994) indicated that excessive N application increases the potential
for nitrate leaching, but not much research has evaluated nitrate leaching from corn (Zea
mays L.) receiving economic optimum N rates (EON). Their study assessed a) flow-
weighted average concentration and mass of NO3-N leached from non-manured and
manured corn treated with five fertilizer N levels and at EON, and b) the relationship
between NO3-N mass in the 1.2 m soil profile following harvest and the flow-weighted
average leachate concentrations. Following application of liquid dairy manure each
April, the field was chiseled and disked prior to planting. Ammonium nitrate was
broadcast at planting (0-200 kg N/ha in 50 kg increments and 0-100 kg N/ha in 25 kg
increments) in non-manured and manured corn. Zero-N plots had 3-yr average flow-
weighted leachate concentrations less than 10mg NO3-N/L. At EON, the 3-yr averages
were 18.8 and 19.3 mg NO3-N/L for non-manured and manured corn. The mass of NO3-
N leached was 107kg/ha or 36% of the N applied at EON.
In a typical manured field there are uncertainties about the quantity of manure N
applied, the amount of ammonia N volatilized, the proportion of manure organic N
mineralized in a growing season, and the amount denitrified. Therefore, it is difficult to
use an N balance approach (Schepers and Fox, 1989). Managing organic wastes to supply
crops at recommended agronomic rates is challenging because organic wastes are a slow-
release source of N, often with effects beyond the growing season of the application.
These factors emphasize the need for careful budgeting and monitoring in the
management of organic waste application to land.

6-1
6. FATE OF N WHEN APPLIED AT RATES LARGER THAN RECOMMENDED
AGRONOMIC RATES OR WHEN APPLIED DURING THE NON-GROWING
SEASON
Summary
Nitrogen will accumulate in the soil when additions exceed crop uptake. Thisaccumulation will proceed at a rate dependent on leaching and gaseous N emissions,processes that will tend to deplete soil excess N. The dynamics of soil N accumulationand losses will depend on the N source, soil type, and weather conditions. For a givencropping system and N application rate, a long-term equilibrium soil N content and Nleaching rate will be established, with year-to-year fluctuations in response to weather.
Volatilization and denitrification are possible pathways for excess N.Management can enhance these emissions. Volatilization occurs rapidly afterapplication if measures are not taken to minimize it. Denitrification can be significantwhen a shallow or a perched water table are present. The frequency of waterapplications could be managed to enhance anaerobic conditions leading todenitrification. Processed water containing important amounts of organic matter (highbiochemical oxygen demand) also helps in generating the anaerobic conditions that arerequired for denitrification.
Careful water management can reduce significantly the amount of in-seasonnitrate leaching even under excess N application. The overall annual leaching, however,will still be important in regions with significant winter precipitation. Under variablewinter precipitation regimes, years with low and high N leaching will occur. At thebeginning of the winter, soils usually contain substantial amounts of nitrate if excess Napplication rates were previously used. It is during this period that the greatestquantities of nitrate are leached from arable soils, not in the spring following the mainapplication of N.
Conditions that increase soil organic matter content, as is the case with excessorganic waste application, will lead to greater mineralization of N. Some nitrate will beformed during spring, when crop uptake is at a maximum, and it will be used efficiently.However, some nitrate will also be formed during late summer, autumn or early winterwhen, even in the presence of a crop, uptake is small. This nitrate will be at risk of beingleached during the following winter.
Organic wastes are frequently spread in autumn because storage capacity isinsufficient to allow postponement until the next spring. The long residence time ofautumn-spread organic waste may result in more nitrogen being lost through runoff,volatilization, leaching and denitrification.
The amount of nitrate stored in the soil before winter (residual nitrate) dependson three main factors: the type of crop grown during the previous growing season, the

6-2
date of the harvest, and the amount of N applied to this crop. The importance of residualnitrate has been recognized in other countries. To protect groundwater against nitrateleaching from agricultural soils, changes in management practices have been proposed.The amount of residual soil nitrate in late fall has been considered as a quantity thatreflects the previous management of a field. Since this quantity is also rather easilymeasured, it is regarded as a possible indicator of a land user’s environmentalperformance. The amount of late-fall soil nitrate that should reflect the site-specific riskof leaching losses is variable and must consider soil, weather, and agronomic conditions.
As discussed in previous sections, N will tend to accumulate in the soil when
added in excess to crop requirements. This accumulation will proceed at a rate dependent
on N leaching and gaseous N emissions, which will tend to deplete the soil of excess N.
The dynamics of soil N accumulation and losses will depend on the N source, soil type,
and weather conditions. For a given cropping system and N application rate, a long-term
equilibrium soil N content and N leaching rate will be established, with year-to-year
fluctuations in response to weather.
Excess N application in production agriculture may result from lack of
information of crop N requirements or incomplete or inaccurate accounting of the overall
soil N budget (Power and Broadvent, 1989). Land application of organic wastes, even
when not intended to maximize agricultural output, may also result in applications
exceeding recommended agronomic rates. For example, Smith and Peterson (1982)
reviewed research showing that potato processors applied from 160 to 490 cm of
processed water annually, which supplied from 1,080 to 2,200 kg N/ha. This is
substantially more than the rate of 300 to 350 kg N/ha/year that grass crops grown on
these fields could remove. Potatoes are processed most of the year and large amounts of
processed water are discharged from the processing plants. More recent reports (Cook,
1996) have found a much more improved situation among potato processing facilities
operating within the Columbia Basin. In general, long processing seasons may result in
excessive N applications to the land used for processed water discharge. Vegetables such
as peas, green beans, sweet corn, tomatoes, and brussels-sprouts are processed for a much
shorter season each year than potatoes.

6-3
6.1. N losses during the growing season
Results of long term continuous corn studies on tile drained Webster loam in
southwest Minnesota show that annual N applications up to 70% greater than N removed
in grain are required for maximum yields (and probably maximum N removal by the
crop). In a study by Gast et al. (1974), nitrate and chloride accumulations and
distributions were determined in a Webster loam and Waldorf silty clay loam profiles
after long term N applications for continuous corn. Concentrations in the profiles were
determined at 0.3-m depth intervals and at increasing distances from tile lines. They
found that downward leaching losses were apparently minimal leaving denitrification
and/or incorporation into organic matter as the mechanisms largely responsible for
disappearance of the unused fertilizer-N. Due to the high soil moisture conditions,
denitrification is probably the main factor involved.
For conditions of well-drained soils, experiments applying N in excess of crop
requirements would show nitrate leaching as the most significant component of N loss if
sufficient percolating water is available. Otherwise, most of the excess nitrate will
accumulate temporarily in the soil until percolating water is available for transport below
the root zone of crops.
6.1.1. Gaseous emissions.
Volatilization and denitrification have been discussed previously in the context of
N application rates approaching recommended agronomic rates. While these gaseous
emissions are part of the normal fate of N in agricultural systems, they can be minimized
or enhanced if so desired. When N is applied in excess of recommended rates, a greater
amount is available to be lost as gas through the same mechanisms previously discussed.
If gaseous emissions are minimized through management or due to soil/weather
conditions, nitrates will rapidly accumulate in the soil and will be available for leaching.
6.1.2. Leaching losses.
The same concept discussed for N gaseous emissions applies for N leaching
losses. They will be only augmented by N applications above agronomic rates.

6-4
Therefore, all the literature on nitrate leaching losses presented previously is also valid
for this section. Some additional literature review follows to further emphasize the needs
of closely matching soil N availability to crop requirements.
Jarvis et al (1987) indicated that, in general, there is a linear increase in the N
contents of groundwater with increasing slurry applications on arable land. In application
of slurry equivalents to 540 kg N/ha, it was found that between 20 and 30% of the N
applied in autumn was leached (Vetter and Steffens, 1981).
Over the last 50 years, it is estimated that increased fertilizer N use on intensive
wheat in the UK has resulted in an increase of 36 kg N/ha/yr leachable nitrate (Davies
and Sylvester-Bradley, 1995). Olsen et al. (1970) indicated that annual applications of
more than 168 kg/ha of fertilizer N for 3 or more years on corn in a silt loam soil in
Wisconsin might be considered a potential hazard in the pollution of underground water.
Rates of N fertilizer above amounts required by the crop will lead to large leaching of N.
For example, only 19% of the applied N was recovered by the crop in one experiment.
Walters and Malzer (1990), working with denitrification inhibitors and two N
rates (90 and 180 kg N/ha) of urea for corn growing on a sandy loam soil in Nebraska,
found that the twofold N application rate resulted in an average of 3.4 times more
fertilizer-N leached over three years. They also found that nitrogen leaching losses
increased in each successive year of the experiment and averaged 20, 34.7 and 92.8 kg
N/ha, respectively.
Vinten et al. (1994) studied nitrate leaching on a field scale from a sandy and a
clay loam soil using several N fertilization rates (0 to 210 kg N/ha) in spring barley. This
author found that the effect of the fertilizer rate was small, at both sites, with the
exception of the highest rate (210 kg N/ha) which lost 105 kg N/ha in the last of three
years of experimentation.

6-5
Watts et al. (1991) conducted a 3-yr experiment in West Central Nebraska to
evaluate water and nitrate leaching losses from irrigated orchardgrass (Dactylis
glomerata L.) seeded on a fine sand soil. Three irrigation levels (slight deficit, slight
excess, and excess) and four N amounts (0, 112, 224, and 336 kg ha-1) were applied. All
irrigation treatments had more deep percolation than expected, as the crop water demand
estimated for irrigation scheduling proved to be too large, a problem that may easily
occur under commercial field conditions if careful control is not exerted. The deficit
irrigation treatment served as a “close management” treatment since percolation was
minimal and yield was not reduced by water stress. During the first 2 years of operation,
in-season percolation losses averaged 7, 28, and 47 cm/yr for low, medium, and high
irrigation levels, respectively. Total in-season nitrate-N leaching loss for the same period
ranged from 6 to 228 kg/ha, depending on N and irrigation amount. Winter and early
spring N leaching losses, as estimated by soil sampling, were a significant part of total N
loss. Under reduced in-season drainage and a N rate commensurate with 80 to 85% of
maximum production, a minimum annual N leaching loss of 35 kg/ha can be expected.
Greater losses are probable under average water and N applications and average
management skills. These findings emphasize that careful in-season water and N
management can reduce significantly the amount of nitrate leaching. The overall annual
leaching, however, may still be important.
Leaching losses of nitrate have been well documented for irrigated corn (Zea
mays L.) (Watts, 1977; Watts and Martin, 1981; Hergert, 1986; Timmons and Dylla,
1981). Continuous corn production on sandy soils will inevitably lead to increases in
groundwater nitrate content.
Robbins et al. (1980) evaluated the nitrate contribution to subsurface drainage
water by irrigated alfalfa in crop rotations by measuring the soil water flux and nitrate-N
concentration below the root zone of alfalfa and crops following alfalfa with and without
additional nitrogen fertilization. Under alfalfa grown on a silt loam soil, 44 kg NO3-
N/ha/yr moved below the root zone at concentrations between 3 and 15 ppm. During the
growing season following alfalfa, 85-96 kg NO3-N/ha/yr moved below the root zone

6-6
under nonfertilized bean (Phaseolus vulgaris) crops at concentrations between 1 and 83
ppm. The second growing season after alfalfa, 17-29 kg NO3-N/ha/yr at 3-15 ppm NO3-
N moved below the root zone of nonfertilized bean and wheat (Triticum aestivum L.)
crops. A field planted to corn (Zea mays L.) and fertilized with 200 and 170 kg N/ha the
first and second year after alfalfa lost 153 and 108 kg NO3-N/ha, respectively, from
leaching. Leachate N concentrations varied from 1 to 64 ppm. Unfertilized corn lost 60
to 17 kg NO3-N/ha the first and second year after alfalfa, respectively, at leachate
concentrations of 1-31 ppm.
As discussed previously, nitrate leaching rates are a function of irrigation and
precipitation rate and timing, N application rate and timing (Adriano et al., 1972; James,
1975), and the crops grown (Olsen et al., 1970). Alfalfa removes water and nitrate-N
from deeper in the soil profile than other crops, and is an excellent nitrate scavenger for
reducing the amount of nitrate-N leaching following a high N fertilized crop, or where
alfalfa crops have received excessive N applications. This characteristic has been utilized
in renovating high N processed water.
However, when an alfalfa crop is plowed under, the plant roots are killed and N is
mineralized from the decomposing plant material. A 225-kg/ha ammonium nitrate-N
application produced about the same results on corn (Zea mays L.) yield as did N released
from a 3-year-old alfalfa stand with about 0.1 m of early spring growth, plowed under
just prior to planting the corn crop. The aboveground early spring growth and surface
residue accounted for only half of the N taken up by the corn. The remainder apparently
came from the roots and other N added to the soil during the 3 years of alfalfa growth
(Boawn et al., 1963). However, no data are available for the nitrate-N concentration in
the soil solution moving below the root zone following the termination of an alfalfa crop.
Subsequent crops will often have shallower root profiles than alfalfa - initially and
possibly during the entire growing season. These crops will not extract nitrate throughout
the original alfalfa root profile during the entire growing season, increasing the potential

6-7
for leaching. Therefore, the rate of organic waste application to alfalfa must be as
carefully managed as with any other crop.
The increased production of sewage sludge in the USA has led many
municipalities to consider the application of sludge to agricultural land as a means of
nutrient recycling. A long-term field study was initiated by Lerch et al. (1990) in 1982 in
Adams County, Colorado, with the objective of evaluating the effects of sewage sludge
on gross income, yields, grain protein, and elemental content of dryland hard red winter
wheat compared to commercial NH4NO3 fertilizer. Sludge rates ranged from 0 to 18 dry
ton/acre, and N fertilizer rates ranged from 0 to 120 lb N/ac. Sludge application resulted
in greater soil NH4-N and NO3-N before the end of the crop vegetative period (this is,
before grain filling) compared to the N fertilizer treatments over the last three years.
Because of the potential for nitrate contamination of groundwater due to oversupply of N
(and the potential for metal build-up in the soil) by 12 and 18 ton/acre rates, the lower
sludge rate of 3 ton/ac was recommended for this dryland wheat production system.
An experiment was conducted in Southern Alberta (Chang and Entz, 1996) to
determine the long-term effects of annual applications of cattle manure (long term N
concentration of 1%) on nitrate accumulation and movement, and to assess the
environmental impact of such a practice. Different rates of manure applications were
used (0, 1, 2 and 3 times the maximum recommended rate of 60 t/ha) under a non-
irrigated and an irrigated well-drained clay loam soil. Under non-irrigated conditions, no
leaching loss of nitrate-N was expected because the precipitation was not enough to
produce the wetting front to move beyond the 150-cm depth. Nevertheless, N
accumulation was detected, which may pose a potential groundwater pollution problem
during high precipitation years. The net nitrate-N accumulation in the soil suggests net
mineralization of applied manure and soil organic matter occurred. For irrigated
conditions, after the fifth year, the annual leaching losses of nitrate-N were estimated as
93, 224, and 341 kg N/ha, for the 60, 120, and 180-t/ha rates of manure application,
respectively. Under irrigation, the leaching losses of nitrate-N were high even at the
recommended rate of 60 t/ha. So, over the long term, the maximum recommended rate is

6-8
too high for annual applications. A sustainable annual application must be in agreement
with crop N uptake.
Timm et al. (1976) applied large quantities of tomato processing waste solids to
fields at rates from 448 to 1,792 metric ton/ha. This applied 1,461 to 5,844 kg N/ha, well
in excess of barley requirements, creating a severe accumulation of nitrates in the soil and
potential for leaching. Smith et al. (1975) studied waste disposal at five potato
processing wastewater irrigation systems in Idaho. N applications ranged from 800 to
2,200 kg/ha annually. These values were higher than the grass crops grown on the fields
can be expected to utilize, likely causing an increase of soil nitrate and pollution
groundwater under the fields.
6.2. N losses during the non-growing season
When N application exceeds agronomic rates, N losses during the non-growing
season are likely to be significant. The mechanisms and processes leading to gaseous
emissions and leaching losses of nitrogen are the same previously discussed.
6.2.1. Gaseous emissions.
N application in excess of agronomic rates may lead to augmented volatilization
and denitrification emissions compared to fertilization/organic N application rates in
better agreement with crop needs. The need to minimize or enhance these emissions will
depend on the objectives associated with the application of nitrogen to land.
Despite excessive N application, volatilization can be largely controlled by
application practices and timing. Denitrification will mainly depend on climatic and soil
conditions, but can also be affected by management. If these conditions and/or
management are conducive to an anaerobic environment in the topsoil, denitrification
will be more significant. Denitrification from organic sources and ammonium-based
fertilizers can be somewhat reduced through the use of nitrification inhibitors. In Central
and Eastern Washington, winter low temperatures and frozen soils will reduce
denitrification rates. All mechanisms leading to reduced rates of gaseous emissions,

6-9
either managed or natural, will increase soil N accumulation and the risk of leaching
under excessive N application rates.
6.2.2. Leaching losses.
In arable cropping systems with annual crops receiving N applications in excess
of agronomic rates, leaching of nitrate during winter is difficult to avoid under many
conditions where sizable precipitation is available during the non-growing season. Soils
may contain substantial amounts of nitrate during this period, but crop uptake will be
small and rainfall will exceed evaporation. It is during this period that the greatest
quantities of nitrate are leached from arable soils, not in the spring following the main
application of N. Under Northern Europe conditions, this has been demonstrated by
measurements of nitrate concentration and water flow in field drains (Harris et al., 1984;
Goss et al., 1988) and by monitoring the leachate from lysimeters. It has also been
demonstrated by applying 15N-labelled nitrate to soils either in autumn or spring; losses
of autumn-applied 15N were much greater than of that applied in spring and were
correlated with winter drainage (Powlson et al., 1989).
Cropping systems that increase soil organic matter content, as is the case with
excess organic waste application, generally lead to greater mineralization of N. Some
nitrate will be formed during spring, when crop uptake is at maximum, and will be used
efficiently. However, some will also be formed during late summer, autumn or early
winter when, even in the presence of a crop, uptake is small. This nitrate will be at risk to
leaching during the winter. Large quantities of nitrate can be formed by mineralization in
autumn, more than can be absorbed by an autumn-sown crop over the winter period,
increasing the risk of leaching.
Organic wastes are frequently spread in autumn because storage capacity is
insufficient to allow postponement until the next spring. The long residence time of
autumn-spread of organic wastes may result in more nitrogen being lost through runoff,
volatilization, leaching and denitrification (Schroder et al., 1993).

6-10
6.3. The role of soil nitrate accumulation and soil storage capacity on N leaching
The question may arise if significant amounts of N from organic wastes (or
inorganic fertilizer) can be applied and stored in the soil profile without leaching. Results
from long-term experiments in England (about 140 years) on a silty clay loam at
Rothamsted and a sandy loam at Woburn showed that more than 100 kg N/ha/yr were
lost from soils when large applications of farmyard manure, sewage sludge, and composts
were applied during this long period. Such losses occurred even when the soils were
accumulating organic matter rapidly (Johnston et al., 1989). The soils at Rothamsted are
silty clay loam and winter wheat has been grown since 1843. Three of the most
contrasted treatments are unmanured, annual inorganic fertilizer supplying 144 kg N/ha,
and farmyard manure at 35 t/ha, supplying 225 kg N/ha/yr on average. Yields in both
treatments supplying N have been similar. Figure 6.1 shows the effect of these
treatments on total N content of the soil.
Animal manure and other organic wastes applied to soil can supply large
quantities of N to arable soils but they also increase the amount of nitrate at risk to
leaching. As excess N is applied to crop/soil systems, soil accumulation increases and so
does the mean N leaching rate until reaching a dynamic equilibrium (steady state)
condition where changes are modulated by weather variability and cropping sequence.

6-11
0
1
2
3
4
5
6
7
8
1800 1850 1900 1950 2000Year
totalN insoil(t/ha)
Manure annually
144kg inorganic Nannually since 1844no N fertilizer since 1843
Fig 6.1. Effect of manure, N fertilizer or no fertilizer on the total nitrogen content of soilduring more than 140 years at Broadbalk, Rothamsted (Johnson et al., 1989).
The Rothamsted long-term experiments may represent an extreme case where the
quantity of manure applied is in excess of crop needs and has been applied continuously
for many years. However, the results illustrate some of the principles underlying the
assessment of nitrate leaching risk. The problem is, in part, one of timing: the production
of nitrate from the mineralization of soil organic mater is not necessarily synchronized
with crop uptake so a large amount of nitrate can accumulate in soil and be leached later.
This lack of synchronization is exacerbated if organic manure, or other N-rich organic
materials, is applied to soils in autumn or if much organic matter is mineralized because
past organic inputs have been large. Similar effects on mineralization, and the
consequent leaching risk, have also been observed where organic materials have been
applied for much shorter periods (Powlson et al., 1989).
There is consensus that the amount of nitrates remaining in the soil following
harvest is an important factor that reflects the nitrate leaching potential (Chichester,
1977). Nitrogen applications above crop requirements can result in an accumulation of
soil nitrate (Hahne et al., 1977; Olsen et al., 1970; Nelson and MacGregor, 1973; Jolley
and Pierre, 1977; MacGregor et al., 1974; Herron et al., 1968; Linville and Smith, 1971;
Meisinger et al., 1982). Jokela and Randall (1989), in a study with corn conducted for

6-12
three years on two non-irrigated southern Minnesota soils with different nitrogen rates
fluctuating between 75 and 300 kg N/ha, found residual nitrate values in the 1.5 m profile
ranging from 150 to 400 kg N/ha for most treatments in the fall.
In a study by Roth et al. (1990), total soil nitrate accumulation varied
considerably among sites. Total accumulation averaged over all N treatments ranged
from 36 to 295 kg NO3-N/ha. This variation suggests that field history has a large impact
on soil nitrate accumulation. Changes in the soil nitrate concentrations between fall and
spring were quite variable. In general, the largest decreases in soil nitrate levels were
associated with the highest fall accumulation, although this was not consistent. Bundy
and Malone (1988) also observed greater over-winter changes in soil nitrate where fall
soil nitrate accumulation was high. Results of a study by Roth et al. (1990) confirmed
that nitrate accumulation and the potential for loss increased when N inputs were
increased above the needs of the crop.
Under conditions of soil nitrate accumulation, N leaching could be reduced if the
amount of water percolation was small. This only works to a certain extent, because
large accumulations of N in the soil will lead to a significant increase of leachate N
concentrations. Also, infrequent large precipitation events may produce substantial
leaching. In Washington State, average annual percolation rates are significant,
fluctuating from 50-125 mm in dryland Eastern Washington, to more than 250 mm in
irrigated Central Washington (Ryker and Jones, 1995), to 50-500 mm and more in
Western Washington (Ronald Hermanson, personal communication).
Nitrate leaching beneath the crop root zone may occur if a significant pool of
nitrate accumulates at times when it is likely that water percolation may occur. In most
regions, likelihood for significant water percolation is usually at a minimum during
periods of active crop growth when evapotranspiration requirements are high. Likelihood
for water percolation is usually greatest during non-crop periods or for the first few
weeks after planting a crop. To minimize nitrate leaching, soil and crop management

6-13
practices should be selected so that significant soil nitrate pools are not present during
these periods of the season.
The amount of residual N in the soil before winter depends of three main factors:
the date of the harvest, the crop grown during the previous growing season, and the N
application rates applied to this crop. The more time elapses between harvesting and the
beginning of the winter, the more mineral N is released by mineralization. Crops that are
harvested late leave the soil when the conditions for mineralization are less advantageous,
especially with respect to temperature. Leguminous crops tend to leave a larger amount
of residual N than other crops at harvest.
A common reason for nitrate accumulation is the application of more N than is
required by the crop. This often results from N application recommendations that are not
based on well-calibrated field data on crop response to available N. Results from 50-
location years of data in Nebraska showed that fertilization according to well calibrated
fertilizer recommendations based on the nutrient replacement concept resulted in equal
irrigated maize yields. However, N application recommendations based on calibrated
field tests resulted in 40 kg/ha less applied N. Excess N is left over as residual soil N and
may be subject to leaching (Power and Broadbent, 1989). Numerous California studies
(reviewed by Pratt, 1984) have demonstrated that, in situations where roots have access
to the entire soil solution, little nitrate is leached until excess N is applied or the soils are
over-irrigated.
Liang et al. (1989) worked with corn and two N application rates, high (400 kg
N/ha) and normal (170 kg N/ha). They found that the high application rate significantly
increased soil nitrate during the growing season, and a residual effect of excess N
application in soil nitrate was found in 2 of 3 years during the non-growing season.
Losses of soil nitrate over winter also occurred in 2 of 3 years.
Alcoz et al. (1993), working in Texas with two N rates in wheat, found that nitrate
concentration increased significantly with increasing fertilizer N application in the

6-14
surface 30 cm (75 and 150 kg N/ha). Chaney (1989), using several N application rates
(applied at 0 to 280 kg N/ha) in winter wheat, found that the residual soil nitrate did not
increase in proportion to the amount of N applied. Residual N only increased when the
optimum agronomic N rate was exceeded.
Using six N application levels and three texture-contrasted soils, Isfan et al.
(1995) reported that high amounts of nitrate-N may remain in the soil at harvest and may
be available to losses by leaching and denitrification during subsequent months. Either in
a light soil (sandy) or a heavy clay soil, these authors found a positive correlation
between added N at planting and soil nitrate at harvest. For the sandy soil, when the
application was from 0 to 200 kg N/ha, the residual N fluctuated between 33.7 up to 74.5
kg N/ha. In the heavy clay, these figures were from 37.5 up to 145.5 kg N/ha, denoting
some accumulation of NO3-N in the clayey soil due to slower leaching.
Management practices affecting residual nitrates also include cropping systems
and irrigation practices. Cropping systems regulate to a large extent the quantity of N
applied, and therefore opportunities for residual nitrates to accumulate. Monoculture of
grain crops probably offer the greatest opportunity for accumulation of residual nitrate
because usually N rates are large and mechanisms for utilizing residual nitrates are least
active for such systems. The crop-fallow system (such as wheat-fallow) is a special type
of monoculture. Many publications have documented that nitrates may accumulate to
relatively high concentrations in fallowed soils (Power and Broadbent, 1989).
The type of preceding crop is important in determining the amount of residual N
during fall. Francis et al (1994), in a experiment using rotations with legume and no
legume crops and spring crops, reported that the amount of mineral N remaining in the
soil profile in the autumn after harvest of barley and rapeseed crops was relatively low
(mean of 52 kg N/ha). After leguminous crops, the residual N was generally larger (mean
of 80 kg N/ha).

6-15
Timing and rate of irrigation are additional factors that may affect residual nitrate
accumulation. A viable irrigation system must include provisions for periodic leaching to
prevent an accumulation of salts from occurring. If appreciable amount of nitrate is
present in the soil profile when leaching occurs, these nitrates will move beneath the root
zone. Therefore, one wants to avoid residual nitrates in irrigated soils to the extent
possible to minimize nitrate leaching. Unless poor irrigation practices are used, most of
the leaching occurring in irrigated agriculture occurs either in the seedling stage or during
non-crop periods (Martin et al., 1982).
Johnson and Raun (1995) indicated that the soil-plant system was able to buffer
against soil accumulation of inorganic N after 23 years of N application at different rates
in wheat. They did not find inorganic N accumulation in the soil profile until N rates
exceeded the recommended rates. They mentioned that increased plant protein, plant N
volatilization and denitrification in soil have major buffering mechanisms. These
buffering mechanisms allow applying more N than needed without a risk to groundwater
quality. They indicated removal of inorganic N by increasing protein in wheat to values
of 20% of maximum yield requirements.
Westfall et al. (1996) reviewed the concept of soil-plant N buffering proposed by
Raun and Johnson (1995). In this review, they emphasize that some flexibility in N
application rates may exist without necessarily having an adverse environmental impact
in semi-arid environments. Buffer capacities of about 21 to 50 lb/ac have been reported
under annual dryland cropping conditions. However, it is important to remark that these
plant buffering capacities are mechanisms that help to reduce soil N accumulation, but
they represent only a limited amount of nitrogen. When N application rates plus
mineralization exceed crop N uptake (including excess or "buffer" consumption) and
gaseous emisions, the remainder accumulates in the soil and leaches off the root zone
when percolating waters are available for transport.
The water storage of the soil is also important to determine N accumulation and
leaching, as seen previously. In general, the higher the water storage capacity of the soil

6-16
the lower is the amount of N leached for similar water inputs. Soil N accumulation is
determined to a high degree by the clay content of the soil. Vetter and Steffens (1981)
showed experimentally that N concentrations in shallow groundwater increased to higher
levels on sandy soils than in clay soils after 4 years of application of pig slurry. Spallacci
(1979) also found in lysimeter experiments with slurry than N leaching was higher on
sand than on loamy sand, loamy sand higher than on loam, and loam higher than on clay.
Olsen et al. (1970) showed that, on the Plano soil in Wisconsin, nitrate
accumulated in the profile over a 3-year period when excess N was continually added to
corn. The downward rate of nitrate movement was 30 to 40 cm per year. While it would
require a number of years for most of the unused nitrate added in a given year to reach
the groundwater, this nitrate load would be more or less continuous after a period of time.
The lag time will depend on the travel time of the nitrate front and the depth to
groundwater (Randall, 1985). Nitrate moves slower in clay loam and clay soils.
Determination of plant-available N in the soil prior to N application requires soil
testing for nitrate within the root zone. Ammonium may also be significant at times
during the year. Assuming that a representative soil sample or series of samples is
collected by depth increments to the bottom of the root zone, the amount of residual soil
N can be calculated by multiplying the nitrate-N concentration times the depth increment
of the sample. Estimating residual N within the root zone based only on a surface sample
(15 to 30 cm) is extremely risky and should be avoided. Reasons are that subsoil residual
soil N may represent a significant portion of the plant-available N. For example, the
surface 30 cm of soil from 138 farms over a 4-year period in the Platte River Valley of
Central Nebraska contained only 32% of the plant-available N found in the upper 1.2 m
of soil (Schepers and Mosier, 1991).
The importance of residual nitrate has been recognized in countries such as
Germany. To protect groundwater against nitrate leaching losses from agricultural soils,
changes in management practices have been proposed. To evaluate their environmental
impact, the amount of residual soil nitrate in late fall has been considered as a quantity

6-17
that reflects the previous management of a field. Since this quantity is also rather easily
measured, it is regarded as a possible indicator to evaluate a land user’s environmental
performance. Not clear so far is which amount of late-fall nitrate should reflect the site-
specific risk of seepage and leaching losses (Van Der Ploeg et al., 1995).
Van der Ploeg et al. (1995) pointed out that care should be exercised before
setting limits to recommended levels of soil nitrates in late fall. A given value, chosen
somewhat arbitrarily and applied statewide, regardless of local soil, climate, or aquifer
conditions is not a desirable approach.

7-1
7. POTENTIAL TO AFFECT GROUNDWATER WHEN N IS APPLIED AT
RECOMMENDED AGRONOMIC RATES
Summary
Problems with nitrate in groundwater are found in all countries with high levelsof agricultural production. The implementation of measures controlling the problem ismanaged according as to a) how far drinking water resources are endangered, and b)how far the interests of water management and agriculture can be brought into line.Some studies seem to suggest that it is unrealistic to expect water from intensively usedagricultural areas to meet drinking-water quality standards. However, proper water andnitrogen management should be encouraged to minimize the impact.
Nitrate-N reaching the groundwater may result from point sources such asfeedlots and sewage disposal systems, from non-point sources such as land application ofN or from naturally occurring sources of nitrogen. The amount of nitrate leaching willdepend on the availability of soluble N and the vertical transport of leachate through thesoil profile. The nitrate loading impact on groundwater quality largely depends onwhether the aquifer system is confined or unconfined and if unconfined, at what depth.Confined aquifers often are hydrologically, chemically, and biologically much moreisolated than are unconfined aquifers.
Success in mitigating groundwater quality problems can only be expected in thelong term. One reason is the long duration of groundwater transport in most catchmentareas. The main factors influencing impact to groundwater are: a) The kind of soil use,b) the depth of the groundwater table, c) the groundwater recharge dependent on soiluse, d) land N application rate and soil cultivation, e) soil characteristics which influencethe efficiency of N transformation.
In most catchment areas, models using information on land use, soils, andfertilization and water infiltration regime can estimate the average nitrate concentrationin percolation water. However, other sources of recharge (e.g., canal leakage) withdifferent nitrate concentration may also be significant in some areas. The nitrateconcentration in percolation water would be similar to the concentration reachinggroundwater, if no nitrate decomposition takes place between the boundary of the rootzone and the aquifer.
Problems with nitrate in groundwater are found in all countries that have a high
level of agricultural production. The implementation of measures controlling the
problem is managed more or less intensively according to a) how far drinking water
resources are endangered, and b) how far the interests of water management and
agriculture can be brought into line. Studies in Germany suggest that it is unrealistic to

7-2
expect water from intensively used agricultural areas to meet drinking-water quality
standards (Walther, 1989).
The main factors influencing impact to groundwater are: a) the depth of the
groundwater table, b) the groundwater recharge, c) the kind of soil use, d) N load and soil
cultivation, e) soil characteristics which influence the efficiency of N transformation,
such as the ratio of organic carbon to organic N and pH value.
In most catchment areas, the average nitrate concentration in percolation water can
be estimated by models using information on land use, soils, N application rates, and
water infiltration regime. However, other sources of recharge (e.g. canal leakage) with
different nitrate concentration may also be significant in some areas (e.g. South Columbia
Basin Irrigation District). The nitrate concentration in percolation water would be similar
to the concentration reaching groundwater, if no nitrate decomposition takes place
between the boundary of the root zone and the aquifer (Walther, 1989).
The intermediate vadose zone (IVZ) is the subsurface material bounded by the root
zone and water table. This root zone boundary has physical and chemical significance
because it defines the lower boundary for the processes controlling nitrate and water
entry to the IVZ: water extraction by plant transpiration, N extraction (plant uptake or
denitrification), N addition (N fixation or fertilization), root or root pathway influences
on preferential saturated flow, and released of N and C by plant decomposition. Often,
the IVZ is viewed as a transmission zone where the nitrate concentration may be changed
substantially due to dispersion or dilution enroute, but the nitrate load delivered to the
water table is basically that draining from the soil root zone (Pionke and lowrance, 1991).
The IVZ is recognized as a nitrate storage zone, with the detention time being based
primarily on the water holding capacity, flow, and climatic properties of the system. For
example, a thick fine-textured IVZ in an arid climate, might require decades to centuries
before nitrate-containing percolate from the overlying soil enters the water table, whereas
a thin, coarse-textured or fractured IVZ subject to a humid climate or irrigation might

7-3
transmit on a time scale of hours to months. The same response times for improvement
are required when practices reducing nitrate loading are implemented.
The nitrate loading impact on groundwater quality largely depends on whether the
aquifer system is confined or unconfined and if unconfined, at what depth. Confined
aquifers often are hydrologically, chemically, and biologically much more isolated than
are unconfined aquifers. In contrast, the unconfined aquifer directly contacts the IVZ, is
generally closer to the land surface, and receives recharge directly from the root soil zone
(Freeze and Cherry, 1979). The unconfined shallow aquifers, particularly those that
penetrate the root zone, can be especially active biologically due to an abundance of
microorganisms, organic C, and nutrients compared to deeper unconfined or confined
aquifers. Nitrate-N fate and transport in any aquifer depends on a combination of
geochemical, physical, and biological factors. Nitrate-N entering shallow aquifer
systems, especially those with rapidly fluctuating or controllable water tables, has a good
chance for removal by denitrification (Pionke and lowrance, 1991). Once nitrate reaches
a complex regional aquifer system, the processes that reduce nitrate concentrations can be
difficult to distinguish. Where large spatial scales or travel times on the order of
centuries to millenia separate source and impact areas, the effects of dilution Vs.
denitrification may be difficult to separate, and dilution may well dominate.
Denitrification does occur at this scale, but denitrification rates are extremely slow.
The effect of dilution depend on the relative positioning of the source (field of
concern) and impact zone (groundwater of concern). Dilution affects nitrate
concentration but not loads. Dilution will be minimal when the groundwater sources
represent similar land use and N management. For example, the nitrate contribution from
one potato field in a watershed totally filled with potato fields that are similarly managed
is unlikely to be diluted irrespective of position. Dilution is likely to be minimal when
the groundwater table is shallow, or the field source and groundwater zone of concern are
close together and the field occupies the highest position of the landscape. The deeper
the water table position below the field the more likely that the unsaturated overburden
draining directly to that water table will be a larger volume, possibly including much

7-4
more than the field. For the situation where the groundwater impact zone is at
considerable difference in depth and distance from the field, the dilution of nitrate
draining one field can be totally dominating and mask that field’s contribution (Pionke
and lowrance, 1991)
When water from the vadose zone joins underlying groundwater, it tends to stay
at the top of the (unconfined) aquifer. This vertical "stacking" occurs where the density
of total dissolved salt content of the water in the vadose zone does not exceed that of the
water in the aquifer, as can be expected in humid areas. The deep percolation water from
irrigated land in relatively dry climates tends to have salt contents on the order of 2,000
to 5,000 mg/L. If this water reaches an aquifer with good quality water, it could
"sink"deeper into the aquifer and eventually reach the lower boundary. This would cause
more complex mixing with the original groundwater (Bouwer, H., 1989). A more
complex mixing is more typical of conditions at the Columbia Basin (J. Ebbert, USGS,
personal communication).
Nitrate in groundwater is subjected to a variety of physical, chemical, and
biological processes which lead to changes in concentration or mass of nitrate solution.
Biological and chemical denitrification are important in many aquifers for removing
nitrate. Biological denitrification rates are controlled by redox conditions, available
carbon and denitrifier populations. Denitrification will lead to increases in dissolved
dinitrogen gas or nitrous oxide in groundwater. Dissimilatory nitrate reduction and
immobilization are also of potential importance in reducing the mass of nitrate. Once
nitrate has entered groundwater, heterogeneity within the aquifer can decrease either
concentration or mass. Recharge by water with lower nitrate concentration causes
dilution. Movement into confined aquifers can lead to chemical evolution of the
groundwater towards oxygen depletion and more reduced conditions. Movement into
less permeable areas or carbon-rich portions of the aquifer can promote nitrate reduction
through denitrification. Case studies of regional aquifers systems have demonstrated that
nitrate disappearance occurs in contaminated aquifers although numerous interpretations
of removal mechanisms are possible. Most studies used indirect measurements to

7-5
indicate that biological denitrification does or can reduce nitrate levels in groundwater.
The restoration of nitrate contaminated aquifers may be accomplished under certain
conditions by enhancing biological or chemical denitrification rates. Increased dissolved
organic carbon and other nutrients in a contaminated aquifer would probably increase
denitrification due both to the increased carbon supply and more anaerobic conditions
(Lowrance and Pionke, 1989).
Nitrate unused by crops will accumulate in the soil, leach when percolation water is
available, to reach eventually groundwater. Baker et al. (1975) and Baker and Johnson
(1981) in Iowa measured losses of 41 to 55% of N applications into subsurface drains
1.2m deep. Average concentrations of nitrate from study sites, principally Webster (fin-
loamy, mixed, mesic Typic Haplaquolls) and Nicollet (fine-loamy, mixed, mesic Aquic
Hapludolls) soils, planted to corn (Zea mays L.) were 20 to 40 mg/L, depending on
application rate (56 or 116 kg/ha). An application of 28 kg/ha N to bahiagrass (Papalum
notatum Fluegge) produced a maximum concentration of 35 mg/L of nitrate in leachate
27 d after application. Magette et al. (1990) in Maryland in a study of Sassafras sandy
loam (fine-loamy, siliceous, mesic Typic Hapludults) or Elkton silt loam (clayey, mixed,
mesic Typic Ochraquults) observed nitrate-N (applied to both grains and legumes) in
wells about 8 m deep in concentrations 15 to 18 mg/L. They suggested that NO3
concentrations measured in shallow unconfined groundwater beneath well-drained soil
might be somewhat higher than those measured in groundwater below poorly drained
soil. Kladivko et al. (1991) in Indiana measured NO3-N leaching through Clermont silt
loam (fine-silty, mixed, mesic Typic Ochraquals) planted to corn into drains (5-40 m
spacing) 0.75 m deep. Nitrate-N losses averaged 18 to 70 kg/ha (6-25% of application),
and concentrations, seldom less than 10 mg/L, averaged 20 to 30 mg/L. Drury et al.
(1993), in a tillage study on Brookston clay loam (clayey, mixed, mesic Typic
Haplaquolls) planted to corn in Ontario, observed concentrations of nitrate-N in drains
0.95 m deep that averaged 12 to 17 mg/L. Nitrogen leaching amounted to 8 to 16% of
application (179 kg N/ha) over a 2-yr investigation.

7-6
Saint-Fort et al. (1991) reported that the average total nitrate-N loading in the
vadose zone to a depth of 9.50 m associated with feedlot, native grassland, irrigated corn
fields, and urban lawns was 1403, 183, 1116, and 235 kg/ha, respectively. The data
indicated that the potential for groundwater pollution was great for feedlots and land
under irrigated corn receiving manure and fertilizer N applications.
Stewart et al. (1967) investigated the vertical distribution of nitrate-N from soil
surface to the water table or bedrock for sites of differing land uses. Average values of
cumulative NO3-N to a depth of 6.1 m in transit to the water table varied widely with land
use: alfalfa, 88; native grassland, 101; cultivated dryland, 292; irrigated fields not in
alfalfa, 567; and corrals, 1608 kg/ha. They further acknowledged that care must be
exercised in the interpretation of the results due to extreme variability within land-use
classes. In that regard, they observed that the amount of nitrate-N under feedlots varied
from virtually none to more than 5600 kg/ha in a 6.1 m profile. They ascribed this
difference to low oxygen levels in these soil profiles that probably resulted in higher N
loss by denitrification. Their data also indicated that irrigated lands contributed to more
nitrate-N to groundwater than did feedlots, although a higher concentration of nitrate-N
per unit area was found under feedlots.
Irrigated corn fields in southwestern Nebraska appear to represent a significant
source of nitrate in groundwater. Significantly higher nitrate-N concentrations were
observed below the zone of 1.5 m depth under irrigated corn fields compared to any of
the other various kinds of landuse. Typical N application rates of 90 to 130 kg/ha of
fertilizer N for the area are complemented with an estimate of 15 t/ha/yr of feedlot
manure (Saint-Fort et al., 1991). A number of investigations have indicated that using
manure to supply N at recommended agronomic rates may result in significantly higher
leaching loss of nitrate than when inorganic N fertilizer is applied (Sims, 1987).
Typically, about 30% of the organic matter is mineralized during the first cropping
season. Manure would therefore act as a slow-release fertilizer N and mineralized N
released either in the spring of the fall after harvest (when plants are not actively
growing) would be susceptible to leaching to groundwater.

7-7
Madison and Brunett (1985) showed the northeastern USA as a problematic area
for nitrate contamination of groundwater. In this area, intensive livestock operations
coexist with relatively dense rural populations that limit availability of agricultural land.
Nitrogen availability on many dairy farms exceeds amounts required for corn production.
Manure applications to perennial forages on dairy farms would increase the land area
available for spreading, thereby decreasing the application rate, improving the N balance,
and thus lessening the potential of nitrate leaching. Alfalfa is usually grown in
succession with corn and is the preferred perennial forage legume among dairy farmers in
the northeastern USA. Schuman and Elliott (1978) reported that N removal by alfalfa
was 2.5 to 3 times greater than that by corn. Various researchers have shown that alfalfa
removes water and nitrate from deep in the soil (Mathers et al., 1975; Schertz and Miller,
1972; Olsen et al., 1970; Stewart et al., 1968; Brown et al., 1963). Despite these
qualities, careful management of N rates is important, just like with any other crop.
Excess N applications will unavoidably lead to increased N pollution of groundwater.
Also, N management after alfalfa must be careful due to the N supply from
mineralization of alfalfa residues and roots.

8-1
8. POTENTIAL TO AFFECT GROUNDWATER WHEN N IS APPLIED AT
RATES LARGER THAN RECOMMENDED AGRONOMIC RATES
Summary
Application of N at rates larger than recommended agronomic practice will leadto increased N concentrations of groundwater in most regions. Nitrate-N moves readilythrough soil, and in areas receiving high N application rates, there is ample evidence ofsubstantial groundwater impact.
Research has found that denitrification is potentially important in removingnitrate from the intermediate vadose zone, particularly when shallow water tables arepresent. Despite its beneficial role in removing nitrates from groundwater under someconditions, this mechanism can not compensate for poor management. Denitrificationcan not be regarded as a natural treatment for N loading to groundwater resulting fromexcess application of fertilizer or organic wastes. At best, it may provide somemitigation.
Application of N at rates larger than recommended agronomic practice will lead
to increased N concentrations of groundwater in most regions.
Ronen and Magaritz (1985), studying the water-table region of a 25-m deep
phreatic sandstone aquifer in Israel, lying under fields irrigated with sewage effluents for
up to 22 years, found that the average concentrations of NO3-N were up to 225 mg/L. The
area studied received a very high nitrogen load from fertilization and the use of sewage
effluents for irrigation.
Nitrate-N moves readily through soil, and in areas receiving high N application
rates, it has been collected and analyzed in subsurface water samples collected by a
variety of means. Logan et al. (1980) reported nitrate-N concentrations ranging from 5.0
to 120.0 Mg/L in tile lines under corn (Zea mays L.) in Iowa, Minnesota, and Ohio. In
Iowa tile lines, Baker et al. (1975) and Baker and Johnson (1981) observed nitrate-N
levels of 10 to 70 mg/L under corn rotated with oat (Avena sativa L.) or soybean (Glycin
max L.). Other tile line analyses revealed 3.4 to 51.4 mg/L NO3-N under a multiple
cropping system in New York state (Zwerman et al., 1972); 4.0 to 20.4 mg/L NO3-N
under a mineral soil cropped to corn in Ontario (Miller, 1979); and 13 to 81 mg/L NO3-N
under continuous corn in Minnesota (Gast et al., 1978).

8-2
In the Georgia coastal plain, Hubbard et al. (1984) used wells in intensive
multiple cropping systems with center pivot irrigation. Nitrate-N concentrations in the
wells ranged from <1 to 133 mg/L with a mean of 20 mg/L. In a Nebraska study with
irrigated corn, the average annual flow-weighted nitate-N concentrations in extracted soil
water ranged from 28.3 to 75.2 mg/L (9). Burwell et al. (1976) collected subsurface
discharge from four corn watersheds in Iowa and found monthly average water weighted
concentrations of nitrate-N as high as 40 mg/L. In eastern Ohio, a small corn watershed
received N fertilizer, which was treated with a nitrification inhibitor. Seasonal nitrate-N
concentrations in subsurface discharge from this watershed ranged between 10 and 32
mg/L (Owens, 1987). In percolate from non-weighing lysimeters in Minnesota, which
were planted to corn, seasonal nitrate-N concentrations ranged from 14 to 212 mg/L and
flow weighted annual means were 19 to 118 mg/L (Timmons, 1984; Timmons and Dylla,
1981). When high rates of N fertilizer were applied to corn on weighing lysimeters in
Ohio, seasonal average nitrate-N concentrations in percolate ranged from 15 to 80 mg/L
(Chichester, 1977).
Nitrogen movements in deep loess soil and in subsurface discharge were
measured on watersheds in southwestern Iowa (Schuman et al., 1975; Burwell et al.,
1976). During a 3-year period, the quantity of NO3-N present below the root zone was
substantially higher for the watershed fertilized with 448 kg N/ha/yr than for the one
fertilized with 168 kg/ha/yr.
Long-term research in Minnesota (MacGregor et al., 1974) showed that
considerable nitrate-N accumulated in the upper 8 m soil depth (most below the root
zone) for corn (Zea mays L.) fertilized with a high N rate. Gast et al. (1978) determined
nitrate-N losses in tile outflow after applications of N to continuous corn and found that
average annual losses ranged from 14 to 60 kg/ha, depending on N fertilizer rate. For
irrigated corn on a sandy loam soil, Gerwing et al. (1979) reported that ground-water
nitate-N concentrations were increased about 7 and 10 ppm by early September for on-
time applications of 179 and 269 kg N/ha, respectively.

8-3
Lysimeter studies throughout the United States have shown that N leaching losses
vary widely depending on experimental treatments (Owens, 1960; Pratt et al., 1967;
Endelman et al., 1974; Jones et al., 1974; Kissel et al., 1974; Tyler and Thomas, 1977;
Chichester and Smith, 1978). Results of these studies showed that leaching of applied
fertilizer N can be substantial, and that nitrate-N can move rapidly in light soils under
intensive irrigation.
Weil et al.(1987) conducted a study to determine the vertical and seasonal
patterns of nitrate leaching under irrigated coastal plain soils treated with poultry manure
(Columbia aquifer in Maryland). Four commercially-farmed corn (Zea mays L.) fields
were studied, two receiving only fertilizer N (240 to 360 kg N/ha over a 2-yr period) and
two with a continuing history of poultry manure applications (25-29 t/ha over 2 yr). In
each field, a transect of four monitoring wells was installed 4 to 8 m deep (1 m below the
seasonally low water table). Three additional wells were installed in forestland adjacent
to three of the fields. Under the unmanured field, groundwater nitrate-N concentrations
averaged 15.1 mg/L during August through November 1986, while the corresponding
figure for the manured fields was not significantly different at 18.3 mg/L. Two months
after spreading manure in November and December, as much as 104 mg/L nitrate-N was
measured in the groundwater under the manured fields. From December 1986 through
September 1987 the groundwater under the manured fields had significantly higher NO3-
N concentrations than did that under the unmanured fields (43.7 vs. 18.1 mg/L,
respectively). The forestland groundwater always contained <1mg NO3-N/L, and high Cl
to NO3-N ratios, suggesting that NO3 in the cropland groundwater was lost after entering
the forested areas, and that forests may therefore protect waterways from subsurface N
contamination.
8.1. The role of denitrification
Denitrification is potentially important in removing nitrate from the intermediate
vadose zone (IVZ). Denitrification requires microbiological activity, a C source, and
very low O2 contents or redox potentials. Denitrification losses of the nitrate-N load can

8-4
be significant where the vadose zone is subject to very shallow or fluctuating shallow
water tables (e.g., Englund and Haldorsen, 1986; Jacobs and Gilliam, 1985). The
manager or modeler cannot readily estimate the impact of IVZ on nitrate-N delivery to
groundwater without collecting substantial data or information on IVZ properties. Where
such information is not available, the deep IVZ is best considered as a transmission zone
where denitrification is insignificant. In shallow vadose zones, losses by denitrification
may be major, particularly where high organic C contents, high microbial populations,
high temperatures, and low O2 or redux status exist (Pionke and lowrance, 1991).
Research has concluded that nitrate concentration in shallow groundwater shows a
positive correlation with the mean depth of the groundwater table. Smaller depths,
increased moisture content in the root zone and decreased oxygen content enhance
denitrification, thus reducing nitrate flux into the groundwater (Krajenbrink et al., 1989).
Despite the loss of considerable fertilizer N in drainage waters of agricultural
fields of the North Carolina coastal plain, low concentrations of nitrate are found in the
groundwater beneath the poorly-drained soils of this area. Denitrification has been
proposed as the major loss mechanism (Jacobs and Gilliam, 1985). Numerous studies on
the fate of nitrate below organic waste disposal sites (food processing waste lagoons,
manure lagoons, feed yard, sewage sludge and effluent septic tank drainfields) have
indicated significant denitrification in the vadose zone (Keeney, 1981; Smith and
Peterson, 1982).
Land application of organic wastes, especially concentrated wastes such as
poultry manure, can lead to nitrate accumulation in the profile and groundwater pollution
(Jackson et al., 1977; Smith and Peterson, 1982). Because of the presence of readily
degradable organic matter, denitrification also may occur with high organic waste loading
(Smith and Peterson, 1982).
Gast et al. (1974) studied nitrate-N accumulation and distribution in a fertilized
tile-drained Webster clay loam soil in south central Minnesota and concluded that there

8-5
was relatively little loss of NO3-N from tile drains and that most of the unaccounted for
fertilizer N applied over that removed by the crop was lost by denitrification.
Variations in the natural abundance of stable nitrogen isotopes can semi-
quantitatively differentiate inorganic from waste sources of nitrate in groundwater.
Stable nitrogen isotopes also can be used to validate denitrification in aquifers (Mariotti
et al., 1988; Smith et al., 1991). This natural remediation process is the inferred
dominant cause of nitrate stratification in shallow aquifers (Hallberg, 1989; Gillham,
1991).
Researchers have reported a large variation in denitrification rates in groundwater.
Trudell et al. (1986) measured denitrification rates of 0.0078 - 0.13 g NO3-N/m3/h during
an in situ experiment in a shallow sand aquifer. Vogel et al. (1981) reported a much
slower rate of denitrification in a large flow system in the Kalahari. They estimated that
it took about 14 000 years to denitrify 22 mg/L NO3-N. Smith et al. (1991) used transport
times from the source to the monitoring well to estimate minimum denitrification rates in
a sand and gravel aquifer on Cape Cod. Denitrification of a 15 mg/L NO3-N plume had
to occur within 2 years.
Spalding et al. (1993) conducted an investigation to isotopically characterize
nitrate contamination in the groundwater from a dispersed waste source, namely,
aerobically digested sewage sludge applied to crop-land, to test for the occurrence of
denitrification using stable isotope methodology, and to estimate the persistence of nitrate
in shallow aquifers. They concluded that denitrification in the deeper zones is occurring
in modern groundwater. The rates of denitrification as suggested by the small isotopic
enrichment factor for these samples further support the hypothesis that the process has
occurred in a relatively short period of time (years). This relatively rapid denitrification
rate is in agreement with groundwater flow estimates that indicate that nitrate transport
from the source to its present location is less than 6 years.
8-6
Weil et al.(1987) conducted a study in Maryland to compare nitrate-N in
groundwater and in the soil profile under center-pivot irrigation to that under adjacent
forestland. Since nitrate-N reached high concentrations in the groundwater under the
crop fields, but was very low under the forest, it may be hypothesized that it was lost by
denitrification in the groundwater environment itself. Such denitrification has been
reported in the literature, but under rather different circumstances. For example, work in
Germany has shown that sulfide in groundwater can provide the needed energy source for
certain denitrifiers (Bottercher et al., 1985). However, the sulfide and sulfate levels were
very low in this study. Sulfate-S ranged from 1 to 22 mg/L, but the variation was
unrelated to nitrate-N levels. Other studies (e.g., Lowrance et al., 1984; Gambrell et al.,
1975) have reported substantial denitrification in very shallow groundwater of certain
riparian forests and poorly drained soils.
Recent work by Parkin and Meisinger (1989) supports the concept that
denitrification activity is closely related to organic C supply. Both the numbers of
denitrifying organisms and denitrification enzyme activity were undetectable below the
2-m depth in the vadose zone in their study on a Maryland Coastal Plain soil. However,
they did not measure denitrification below the water table and a small increase in
denitrifiers just above the water table leaves open the possibility of significant
denitrification in the groundwater itself.

9-1
9. RESEARCH RECOMMENDED TO CUSTOMIZE CURRENT KNOWLEDGE
ON NITROGEN FATE TO CONDITIONS IN THE STATE OF WASHINGTON
As explained in this report, the fate of nitrogen in agricultural soils cannot be
understood, regulated or managed without consideration of the interactions among the
components of the soil-plant-atmosphere-water system that affect the soil nitrogen and
water balance. This is the case regardless of the source of the nitrogen applied to the soil.
However, more pathways are involved in the fate of nitrogen supplied by organic
sources. This must be considered when processed water containing organic nutrients is
applied to farmlands primarily as a way of disposal.
Figure 9.1 shows the basic steps for calculating organic waste application rates in
land application systems. This diagram was used to identify research required before
specific recommendations are made to properly manage and mitigate the environmental
impact (particularly N leaching) of land application systems in Washington State. From
the analysis of the steps required for calculating N application rates, the following
questions require answer for customization of this approach to the State of Washington:
1. What is the expected mineralization (inorganic N release) rate derived from the stable
organic fraction of the main agricultural soils in the state?
2. What is the expected mineralization rate over several seasons of common organic
wastes?
3. What is the expected uptake efficiency of the N derived from common organic wastes
in the state?
4. What are the volatilization and denitrification rates typical of these wastes under
various application procedures and conditions?
5. What are the maximum allowable soil nitrate levels before significant leaching rates
are at risk for the main soils, weather conditions, and cropping systems of the state?
6. What is the risk of nitrate leaching from land application systems across the state for
given organic waste application rates, soils, weather, and cropping systems?

9-2
Figure 9.1. Basic steps for calculating organic waste application rates in landapplication systems.
Questions 1 through 4 can be answered using conventional experimental
procedures. Some of them can be partially addressed using estimates or extrapolations
from the literature. However, uncertainty will be introduced by using such approach.
The level of uncertainty in these quantities will be transferred to the decision making
process associated with the disposal of organic wastes. Ultimately these uncertainties
will limit the feasibility of disposing organic wastes while simultaneously a) maximizing
N removal from waste and b) minimizing the risk of nitrate leaching to groundwater.
One of these two objectives will need to be relaxed.
Calculate Crop Nrequirements
Subtract N that will beavailable to the cropduring the growing
season
N-useefficiency
Crop Nuptake
Mineralizationof stable soil
organic matterN stored in thesoil
Mineralizationof organic waste
applied inprevious years
Calculate wasteapplication rate to meet
unsatisfied crop Ndemand
Determine the fractionmineralized during the
first season of the organicwaste N to be applied
Determine N content ofthe organic waste to be
applied
Additional wasteapplication to satisfy N
losses
Denitrificationlosses
Volatilizationlosses
Calculate total organicwaste application rate

9-3
The development of a suitable knowledge data base as called for by questions 1
through 4 will lead to the need of formulating a sound computer program, able to
calculate organic waste application rates for land application systems in the state, which
will allow scheduling disposal procedures with minimized uncertainty.
Questions 5 and 6 cannot be addressed using conventional experimental
procedures. An effort of this nature will pose unfeasible resource demands. To evaluate
all the necessary variable combinations throughout the state is a gigantic task. In
addition, the analysis of risk will require performing these evaluations over a period of 30
or more years in order to adequately capture weather variability and provide sufficient
time for cumulative effects to develop. In fact, questions 5 and 6 can only be addressed
using computer simulation technology.
Members of our team have developed computer-based technologies for this kind
of analyses (Stockle, 1996). These include cropping systems simulators, weather
generators, and interface programs for simulation models and geographic information
systems (GIS). The cropping systems simulator, CropSyst (Stockle et al., 1994; Stockle,
1996; Stockle and Donatelli, 1996; Stockle and Nelson, 1997), is able to simulate the
growth and yield of crops and crop rotations as well as the environmental impact (nitrate
leaching, pesticide leaching, erosion) of cropping systems in response to soil, weather,
and N application rates. A weather generator, ClimGen (Stockle, 1996; Ndlovu, 1994;
Castellvi et al., 1997), is able to develop a comprehensive weather database for the state.
Another program, ArcCS (ArcInfo-CropSyst cooperator) allows users to interface GIS
data bases with CropSyst simulations and develop analyses of regional scope, and display
output results in maps. This suite of programs have been thoroughly tested an applied in
the state (Peralta et al., 1997; Pannkuk et al., 1998) and worldwide (e.g. Ferrer and
Stockle, 1995; Donatelli et al., 1996; Pala et al., 1996; Stockle et al., 1997; Stockle and
Debaeke, 1997; Badini et al., 1997).
Details required to conduct any of the research activities outlined in this section
are beyond the scope of this literature review, but they can be provided to DOE upon

9-4
specific request. As the above models are refined to better simulate field conditions, field
data will need to be taken to verify that we are realistically estimating N movement
within our complex cropping systems. These data may be obtained from both field scale
experiments and whole farm and watershed analyses. The above listed activities will
improve our ability to manage land application systems of organic wastes while
providing critical environmental protection.

R-1
LIST OF REFERENCES
Section 2
Hubbard, R. K., L.E. Asmussen, and H.D. Allison. 1984. Shallow groundwater quality beneathan intensive multiple-cropping system using center pivot irrigation. J. Environ. Qual.13:156-161.
Keeney, D. R. 1986. Nitrate in Ground Water - Agricultural Contribution and Control. pp.329-351. In: Proceedings - Conference on Agricultural Impacts on Ground Water. Omaha,NE. 11-13 Aug. National Water Well Assoc., Dublin, OH.
Keeney, D. R. 1989. Sources of Nitrate to Ground Water. p. 23-34. In: R. F. Follett (ed.)Nitrogen Management and Ground Water Protection. Elsevier Science Publishing Co.Inc., New York, NY.
Meisinger, J.J. 1976. Nitrogen application rates consistent with environmental constraints forpotatoes on Long Island. Search Agric. 6:1-14
Nelson, D.W. 1982. Gaseous losses of nitrogen other than through denitrification. In: F.J.Stevenson (ed.) Nitrogen in agricultural soils. Agronomy 22:327-364.
Peralta, J.M. 1997. Longterm evaluation of nitrogen available for contamination from potatosystems in the Quincy-Pasco area of Central Washington. M.S. Thesis, Department ofBiological Systems Engineering, Washington State University, Pullman, Washington.
Power, J. F. and F. E. Broadbent. 1989. Proper Accounting for N in Cropping Systems. p.159-181. In: R. F. Follett (ed.) Nitrogen Management and Ground Water Protection. ElsevierScience Publishing Co. Inc., New York, NY.
Ryker, S.J. and J.L. Jones. 1995. Nitrate concentrations in ground water of the Central ColumbiaPlateau. U.S. Geological Survey Open-File Report 95-445.
Stewart, S., C. Cogger, C. Smith, and C.F. Feise. 1994. The State of our groundwater: A reporton documented chemical contamination in Washington. Cooperative ExtensionWashington State Univer., Washington Toxics Coalition EB1756A. Pullman, WA.
US Geological Survey. 1992. Surface water quality assessment of the Yakima River Basin,Washington: Analysis of available water quality data through 1985 water year. Open-FileReport 91-453.

R-2
Section 3
Abbes, C., L.E. Parent, A. Karam, and D. Isfan. 1995a. Onion response to ammoniated peat andammonium sulfate in relation to ammonium toxicity. Can. J. Soil Sci. 75:261-272.
Abbes, C., L.E. Parent, A. Karam, and D. Isfan. 1995b. N uptake and recovery by onions frompeat-mineral fertilizers. Can. J. Soil Sci. 75:273-280.
Abd El-Latif, L.I., El-Sarengawy, N.M. and G.G.D. Salamah. 1984. Growth, yield and nitrogenuptake by barley under different levels of nitrogen in sandy soil. Annals of Agric. Sc.,Moshtohor. 20:203-211.
Abernathy, R.H., and W.H. Bohl. 1987. Effects of forage legumes on yield and nitrogen uptakeby a succeeding barley crop. Applied Agricultural Research.
Addiscott, T.M. and R.J. Darby. 1991. Relating the nitrogen fertilizer needs of winter wheatcrops to the soil's mineral nitrogen. Influence of the downward movement of nitrateduring winter and spring. Journal of Agricultural Science. 117: 241-249.
Ahmadi, M., W.J. Wiebold, and J.E. Beuerlein. 1988. Effect of seeding rate and time of Napplication on oat grain yield. J. Prod. Agric. 1:242-246.
Alessi, J., J.F. Power, and L.D. Sibbitt. 1979. Yield, quality and nitrogen fertilizer recovery ofstandard and semi-dwarf spring wheat as affected by sowing date and fertilizer rate. J.Agric. Sci. 93:87-93.
Alkanani, T. and A. F. MacKenzie. 1996. Banding urea and lignosulfate in corn Zea mays L.)production and 15N recovery. Can. J. Soil Sci. 76:365-371.
Anda, A. and L. Pinter. 1994. Sorghum germination and development as influenced by soiltemperature and water content. Agronomy J. 86:621-624
Anderson, W.K., and R. McLean. 1989. Increased responsiveness of short oat cultivars to earlysowing, nitrogen fertilizer and seed rate. Aust. J. Agric. Res. 40:729-744.
Armstrong, M.J., G.F.J. Milford, T.O. Pocock, P.J. Last, and W. Day. 1986. The dynamics ofnitrogen uptake and its remobilization during the growth of sugar beet. J. Agric. Sci.Camb. 107:145-154.
Aulakh, M. S., J. W. Doran, D. T. Walters, A. R. Mosier and D. D. Francis. 1991. Crop residuetype and placement effects on denitrification and mineralization. Soil Sci. Soc. Am. J.55:1020-1025.
Baker, A. S. and W. P. Mortensen. 1974. The interaction of fertilizer band leaching and fertilizersource on growth and NPK uptake by sweet corn. p. 40-50, Proceedings of the 25thAnnual Pacific Northwest Fertilizer Conference, Richland, WA, Northwest Plant FoodAssociation, Portland, OR.

R-3
Baker, J. T., P. J. Pinter, Jr., R. J. Reginato and F. T. Kanemasu. 1986. Effects of temperature onleaf appearance in spring and winter wheat cultivars. Agronomy J. 78(4):605-613.
Barber, L.D., B.C. Joern, J.J. Volence, and S.M. Cunningham. 1996. Supplemental nitrogeneffects on alfalfa regrowth and nitrogen mobilization from roots. Crop Sci. 36:1217-1223.
Barbour, N.W., and C.F. Murphy. 1984. Field evaluation of seedling root length selection inoats. Crop Sci. 24:165-169.
Bartz, J. K., and R. L. Jones. 1983. Availability of nitrogen to sudangrass from ammonium-saturated clinoptilolite. Soil Sci. Soc. Am. J. 47:259-262.
Batal, K.M., K. Bondari, D.M. Granberry, and B.G. Mullinix. 1994. Effects of source, rate, andfrequency of N application on yield, marketable grades and rot incidence of sweet onion(Allium cepa L. cv. Granex-33). J. Hort. Sci. 69:1043-1051.
Bauer, A. 1980. Responses of tall and semidwarf hard red spring wheats to fertilizer nitrogenrates and water supply in North Dakota 1969-1974. North Dakota AgriculturalExperiment Station, North Dakota State University.
Bergersen, F. J., G. L. Turner, R. R. Gault, M. B. Peoples, L. J. Morthorpe, and J. Brockwell.1992. Contributions of nitrogen in soybean crop residues to subsequent crops and to soils.Aust. J. Agric. Res. 43:155-169.
Biemond, H., and J. Vos. 1992. Effects of nitrogen on the development and growth of the potatoplant. 2. The partitioning of dry matter, nitrogen and nitrate. Ann. Bot. 70:37-45.
Bock, B.R., and G.W. Hegbert. 1991. Fertilizer nitrogen management. In R.F. Follett, D.R.Keeney and R.M. Cruse (eds.) Managing nitrogen for groundwater quality and farmprofitability. Soil Sci. Soc. Am., Madison, WI. p.139-164.
Boman, R.K., R.L. Westerman, W.R. Raun, and M.E. Jojola. 1995. Time of nitrogenapplication: effects on winter wheat and residual soil nitrates. Soil Sci. Soc. Am. J.59:1364-1369.
Bowen, J., L. Jordan, and D. Biehle. 1991. Economics of no-till corn planted into winter covercrops. p. 181-182. In W.L. Hargrove (ed.) Cover crops for clean water. Proc. W. Tenn.Exp. Sta. April 9-11, 1991. Jackson, TN. Soil and Water Conservation Society. Ankeny,IA.
Bowman, D.C., and J.L. Paul. 1988. Uptake and assimilation of NO3- and NH4+ by nitrogen-deficient perennial ryegrass turf. Plant Physiol. 88:1303-1309.
Bowman, D.C., and J.L. Paul. 1992. Foliar absorption of urea, ammonium, and nitrate byperennial ryegrass turf. J. Amer. Soc. Hort. Sci. 117:75-79.
Bowman, D.C., J.L. Paul, W.B. Davis, and S.H. Nelson. 1989. Rapid depletion of nitrogenapplied to Kentucky bluegrass turf. J. Amer. Soc. Hort. Sci. 114:229-233.

R-4
Brar, G.S., and A. J. Palazzo. 1995. Shoot and root development of tall and hard fescues in twodifferent soils. J. Environ. Qual. 24:777-781.
Bremer, E. and C. van Kessel. 1992. Plant-available nitrogen from lentil and wheat residuesduring a subsequent growing season. Soil Science Society of Am. J. 56:1155-1160.
Brinkman, M.A., and Y.D. Rho. 1984. Response of three oat culltivars to N fertilizer. Crop Sci.24:973-977.
Brinsfield, R.B. and K.W. Staver. 1991. Use of cereal grain cover crops for reducinggroundwater nitrate contamination in the Chesapeake Bay region. p. 79-82. In W.L.Hargrove (ed.) Cover crops for clean water. Proc. W. Tenn. Exp. Sta. April 9-11, 1991.Jackson, TN. Soil and Water Conservation Society. Ankeny, IA.
Broadbent, F.E. 1984. Plant use of nitrogen. In: Hauck, R.D. (ed.) Nitrogen in crop production.ASA, CSA, and SSSA, Madison, WI.
Brown, B.D., A.J. Hornbacher, and D.V. Naylor. 1988. Sulfur-coated urea as a slow-releasenitrogen source for onions. J. Amer. Soc. Hort. Sci. 113:864-869.
Bulman, P., and D.L. Smith. 1993. Accumulation and redistribution of dry matter and nitrogenby spring barley. Agron. J. 85:1114-1121.
Bulman, P., and D.L. Smith. 1994. Post-heading nitrogen uptake, retranslocation, andpartitioning in spring barley. Crop Sci. 34:977-984.
Bushnell, John. 1941. Exploratory tests of subsoil treatments inducing deeper rooting of potatoeson Wooster silt loam. J. Amer. Soc. Agron. 33:823-828.
Cao, W. and D. N. Moss. 1991. Phyllochron change in winter wheat with planting date andenvironmental changes. Agron. J. 83(2):396-401.
Cao, W. and D. N. Moss. 1994. Sensitivity of winter wheat phyllochron to environmentalchanges. Agron. J. 86(1):63-66.
Carrow, R.N., and A.M. Petrovic. 1992. Effects of traffic on turfgrass.. In: Waddington, D.V.,Carrow, R.N., and Shearman, R.C. (eds) Turgrass - Agron. Monogr. 32. AmericanSociety of Agronomy, Crop Science Society of America, and Soil Science Society ofAmerica. Madison, WI. p. 285-330
Carter, J.N., and D.J. Traveller. 1981. Effect of time and amount of nitrogen uptake on sugarbeetgrowth and yield. Agron. J. 73:665-671.
Cassman, K.G. and R.E. Plant. 1992. A model to predict crop response to applied fertilizernutrients in heterogeneous fields. Fert. Res. 31:151-163.

R-5
Cattanach, A.W., A.G. Dexter, and E.S. Oplinger. 1991. Sugarbeets. p.1-11. In Altenative FieldCrops Manual. University of Minnesota Ctr. for Alternative Plant and Animal Productsand the Minnesota Extension Service.
Cerrato, M.E., and A. M. Blackmer. 1990. Comparison of models for describing corn yieldresponse to nitrogen fertilizer. Agron. J. 82:138-143.
Chalifour, F-P., and L. M. Nelson. 1987. Effects of continuos combined nitrogen supply onsymbiotic dinitrogen fixation of faba bean and pea inoculated with different rhizobialisolates. Can. J. Bot. 65:2542-2548.
Chaney, K. 1990. Effect of nitrogen fertilizer rate on soil nitrate nitrogen content after harvestingwinter wheat. J. Agric. Sci. 114:171-176.
Cherney , J.H. and J.M. Duxbury. 1994. Inorganic nitrogen supply and symbiotic dinitrogenfixation in alfalfa. J. Plant Nutr. 17:2053-2067.
Chhillar, R.K. 1980. Effect of levels of nitrogen and phosphorus on the yield of oat in sodic soils.Indian J. Agron. 25:512-515.
Christensen, N.W., G. Gingrich, and J. Hart. 1995. Fertilizer rate, source and placement ofenhanced nitrogen use by hops to protect groundwater quality. Final research report,ODA Ground Water Research and Development Fund.
Clark, A.J., A.M. Decker, J.J. Meisinger, F.R. Mulford, and M.S. McIntosh. 1995. Hairy vetchkill date effects on soil water and corn production. Agron. J. 87: 579-585.
Cumbus, I.P. and Nye, P.H.. 1985. Root zone temperature effects on growth and phosphateabsorption in rape Brassica napus cv. Emerald. J. Exp. Bot. 36: 219-227.
Darby, R. J., and D. P. Yeoman. 1994. Effects of methods of cereal straw disposal, seedbedpreparation and sowing method on the establishment, yield and oil content of winteroilseed rape (Brassica napus). J. Agric. Sci. 122:393-304.
Das, S. K., G. S. Reddy, K. L. Sharma, K. P. R. Vittal, B. Venkateswarlu, M. N. Reddy and Y.V. R. Reddy. 1993. Prediction of nitrogen availability in soil after crop residueincorporation. Fert. Res. 34:209-215.
De Nobili, M., S. Santi, and C. Mondini. 1992. Fate of nitrogen (15N) from oxamide and ureaapplied to turf grass: a lysimeter study. Fert. Res. 33:71-79.
Deckard, E.L. Tsai, and C.Y. Tucker, T.C. 1984. Effect of nitrogen nutrition on quality ofagronomic crops. In Hauck, R.D. (ed.) Nitrogen in crop production: proceedings,symposium, 25-27. Sheffield, Alabama, May 1982. Am. Soc. Agron., Madison, WI. p.601-615.
Dev, G., and D.A. Rennie. 1979. Isotope studies on the comparative efficiency of nitrogenoussources. Aust. J. Soil Res. 17:155-162.

R-6
Ditsch, D.C. Alley, M.M. Kelley, K.R., and Lei, Y.Z.. 1993. Effectiveness of winter rye foraccumulating residual fertilizer N following corn. J. Soil Water Cons. 48: 125-132.
Douglas, C. L. Jr. and R. W. Rickman. 1992. Estimating crop residue decomposition from airtemperature, initial nitrogen content and residue placement. Soil Sci. Soc. Am. J. 56:272-278.
Dow, A.I. 1980. Critical nutrient ranges in northwest crops. Washington State Univ. IrrigatedAgriculture Research and Extension Center. Ext. Bull. EB-0757.
Dow, A.I., and A.R. Halvorson. 1980. Fertilizer Guide: Irrigated field beans for CentralWashington. Washington State University, Coop. Ext. Public. FG-5.
Dow, A.I., K.J. Morrison, and A.R. Halvorson. 1976. Fertilizer Guide: Alfalfa (irrigated) forCentral Washington. Washington State University, Coop. Ext. Public. FG-3.
Dow, A.I., K.I. Morrison, C.E. Nelson, D.W. James, and A.R. Halvorson. 1979a. Fertilizerguide: Irrigated field corn for grain or silage in Central Washington. Washington StateUniversity, Coop. Ext. Public. FG-6.
Dow, A. I., R. Parker, W. W. Heinemann, D. W. Evans, and A. R. Halvorson. 1979b. Fertilizerguide: Irrigated pasture for Central Washington. Washington State University, Coop. Ext.Public. FG-4.
Dow, A.I., K.I. Morrison, C.E. Nelson, D.W. James, and A.R. Halvorson. 1970a. Fertilizerguide: Irrigated hops for Central Washington. Washington State University, Coop. Ext.Public. FG-11.
Dow, A.I., C. E. Nelson, D.W. James, J.W. Berry, and A.R. Halvorson. 1970b. Fertilizer guide:Irrigated sweet corn for Central Washington. Washington State University, Coop. Ext.Public. FG-35
Dow, A. I., D.W. James, C. E. Nelson, and A. R. Halvorson. 1970c. Fertililizer guide: Sugarbeets for Central Washington. Washington State University, Coop. Ext. Public. FG-10.
Dubert, F., A. Skoczowski and J. Biesaga-Koscielniak. 1994. The long-term effect of cold on themetabolism of winter wheat seedlings. I. Growth and hydration of seedlings at in vitroconditions. J. Therm. Biol. 19(2):103-110.
Durieux, R.P., Eugene J. Kamprath, William A. Jackson, and Robert H. Moll. 1994. Rootdistribution of corn: The effect of nitrogen fertiliation. Agron. J. 86:958-962.
Eck, H.V. and S.R. Winter. 1992. Soil profile modification effects on corn and sugarbeet grownwith limited water. Soil Sci. J. Am. 56:1298-1304.
Edwards, L. M. and J. M. Sadler. 1992. Growth vigor of some crop species and cultivars whenfall-seeded as winter cover in the Atlantic region of Canada. Can. J. Plant Sci. 72:421-429.
R-7
Ells, J.E., A.E. McSay, P.N. Soltanpour, F.C. Schweissing, M.E. Bartolo, and E.G. Kruse. 1993.Onion irrigation and nitrogen leaching in the Arkansas Valley of Colorado, 1990-1991.HortTechnology. 3:184-187.
Engle, C.F., F.E. Koehler, K.J. Morrison, and A.R. Halvorson. 1975. Dry land wheat nitrogenneeds (with moisture and nitrate tests) for eastern Washington. Washington StateFertilizer Guide, FG-34.
Evans, J., N.A. Fettell, G.E. O'Connor, D.J. Carpenter, and P.M. Chalk. 1997. Effect of soiltreatment with cereal straw and method of crop establishment on field pea (Pisumsativuum) fixation. Biol. Fertil. Soils. 24:87-95.
Ervin, E.H. and A.J. Koski. 1998. Drought avoidance aspects and crop coefficients of Kentuckybluegrass and tall fescue turfs in the semiarid west. Crop Sci. 38: 788-795.
Fanning, C. D. A. R. Halvorson, K. J. Morrison, and F. E. Koehler. 1976. Fertilizer guide:Improved pasture and hay for Eastern Washington. Washington State University, Coop.Ext. Public. FG-37.
Fawcett, J.A. and Frey, K.J. 1982. Nitrogen harvest index variation in Avena sativa and Avenasterilis Oats. Proc. Iowa Acad. Sci. 89:155-159.
Fenn, L.B., R.M. Taylor, M.L. Binzel, and C.M. Burks. 1991. Calcium stimulation ofammonium absorption in onion. Agron. J. 83:840-843.
Ferguson, G.A., I.L. Pepper, and W.R. Kneebone. 1986. Growth of creeping bentgrass on a newmedium for turfgrass growth: clinoptilolite zeolite-amended sand. Agron. J. 78:1095-1098.
Fiez, T.E., B.C. Miller and W.L. Pan. 1994a. Assessment of spatially variable nitrogen fertilizermanagement in winter wheat. J. Prod. Agric. 7:56-93.
Fiez, T.E., B.C. Miller and W.L. Pan. 1994b. Winter wheat yield and grain protein across variedlandscape positions. Agron. J. 86:1026-1032.
Fiez, T. E., W. L. Pan, and B. C. Miller. 1995. Nitrogen efficiency analysis of winter wheatamong landscape positions. Soil Sci. Soc. Am. J. 59:1666-1671.
Follett, R.F., M.J. Shaffer, M.K. Brodahl, and G.A. Reichman. 1994. NLEAP simulation ofresidual soil nitrate for irrigated and nonirrigated corn. J. Soil Water Cons. 49(4):375-382.
Fox., R.H., J.M. Kern, and W.P. Piekielek. 1986. Nitrogen fertilizer source, and method andtime of application effects on no-till corn yields and nitrogen uptakes. Agron. J. 78:741-746.
Francis, D.D., J.S. Schepers, and M.F. Vigil. 1993. Post-anthesis nitrogen loss from corn. Agron.J. 85:659-663.

R-8
Frye, W.W. Smith, W.G. Williams, R.J.. 1985. Economics of winter cover crops as a source ofnitrogen for no-till corn. J. Soil Water Cons. 40: 246-248.
Gao, S. 1995. Wheat root growth, distribution and nitrogen uptake in response to an enhancedammonium supply. Ph.D. Dissertation, Washington State University, Pullman WA. 97p.
Gascho, G.J. and J.E. Hook. 1991. Development of a fertigation program for sprinkler-irrigatedcorn. J. Prod. Agric. 4: 306-312.
Gass, W.B., G.A. Peterson, R.D. Hauck, and R.A. Olson. 1971. Recovery of residual nitrogenby corn (Zea mays L.) from various soil depths as measured by 15N tracer techniques.Soil Sci. Soc. Am. Proc. 35:290-294.
Gately, T.F., and D.M. McAleese. 1976. Effects of fertilizer N and number of years in tillage onthe protein and non-protein content of feeding barley grain (cv. Nessa) and on N uptakeand recovery. J. Agric. Sci. Camb. 87:243-249.
Geist, J.M. 1976. Orchardgrass growth on nitrogen and sulfur fertilized volcanic ash soil. Journalof Range Management. 29:415-418.
George, T., and P.W. Singleton. 1992. Nitrogen assimilation traits and dinitrogen fixation insoybean and common bean. Agron. J. 84:1020-1028.
Ghosh, D.C. 1985. Influence of nitrogen, phosphorous and cutting on growth and yield of oat.Indian J. Agron. 30:172-176.
Glenn, B.P., D.G. Ely, S. Glenn, L.W. Douglass, L.P. Bush, and R.W. Hemken. 1985. Effects ofammonium nitrate and potassium sulfate fertilization on nitrogen and sulfur compositionof tall fescue and orchardgrass. Journal of Plant Nutrition. 8:15-38.
Goss, R. L., K. J. Morrison, A. R. Halvorson. 1982. Fertilizer guide: home lawns, playfields andother turf. Washington State University, Coop. Ext. Public. FG-24.
Greig, W.S. Blakeslee, L. 1988. Potatoes: optimum use and distribution with comparative costsby major regions of the U.S. Washington State University, Cooperative. Ext. Bull. 1495.
Griffith, M. and H. C. H. McIntyre. 1993. The interrelationship of growth and frost tolerance inwinter rye. Physiol. Plant. 87:335-344.
Griffith, M., P. A., D. S. C. Yang, W. Hon and B. A. Moffat. 1992. Antifreeze protein producedendogenously in winter rye leaves. Plant Physiol. 100:593-596.
Guillard, K., and D.W. Allinson. 1985. Legume growth and residual effects on oat (Avena sativaL.) production. Commun. in Soil Sci. Plant Anal. 16:375-383.
Guillard, Karl, Gary F. Griffin, Derek W. Allinson, M. Moosa Rafey, William R. Yamartino, andStephen W. Pietrzyk. 1995. Nitrogen utilization of selected cropping systems in the U.S.

R-9
Northeast: I. Dry matter yield, N uptake, apparent N recovery, and N use efficiency.Agron. J. 87:193-199.
Halvorson, A.R. 1977. Nitrogen fertilizer use during drought in the summer fallow wheat area ofeastern Washington. Washington State Univ. Cooperative. Ext. Bull. EM-4264.
Halvorson, A. R., F.E. Koehler, W.L. Pan, C.F. Engle, K.J. Morrison, and E.T. Field. 1986.Winter wheat fertilizer guide. Washington State University Coop. Ext., EB-1390.
Hammond, M.W. and R. Neilan. 1992. Research for reduction of nitrate leaching into ColumbiaBasin Groundwater: Final report. Upper Grant Conservation District. Ephrata, WA.
Hanks, R.J. 1983. Yield and water-use relationships: An overview. p. 393-412. In H.M.Taylor,W.R. Jordan and T.R. Sinclair (eds.) Limitations to efficient water use in cropproduction. Am. Soc. Agron., Madison, WI.
Harms, C. L. and B. B. Tucker. 1973. Influence of nitrogen fertilization and other factors onyield, prussic acid, nitrate, and total nitrogen concentrations of sudangrass cultivars.Agron. J. 65:21-26.
Harper, J.E., and A.H. Gibson. 1984. Differential nodulation tolerance to nitrate among legumespecies. Crop Sci. 24:797-801.
Hart, P. B. S., D. S. Powlson, P. R. Poulton, A. E. Johnston and D. S. Jenkinson. 1993. Theavailability of the nitrogen in the crop residues of winter wheat to subsequent crops. J.Agric. Sci. 121:335-362.
Hedge, D.M. 1986. Growth analysis of onion (Allium capa L.) in relation to irrigation andnitrogen fertilization. J. Agron. Crop Sci. 157:227-234.
Heichel G.H., D.K. Barnes, and C.P. Vance. 1981. Nitrogen fixation of alfalfa in the seedingyear. Crop Sci. 21:330-335.
Hellstrom, A. 1994. Growth analysis in Brassica using a mechanistic growth model. Swedish J.of Agric. Research 24:57-65.
Henriksen, K. 1987. Effect of N- and P- fertilization on yield and harvest time in bulb onions(Allium capa L.). Acta Horticulture. 198:207-215.
Hensel, D.R., and J.R. Shumaker. 1992. Evaluation of cultural practices, nitrogen rates, andcultivar selection for sweet onion production in northeast Florida. Proc. Fla. State Hort.Soc. 105:338-340.
Hermanson, R.E., A.C.S. Rao, W.L. Pan, K.F. Duncan, and M.A. Wright. 1995. Manure nutrientbalancer manual, ver. 1.0. Cooperative Ext. Washington State Univ.
Hills, F.J. and A. Ulrich. 1971. Nitrogen nutrition. In R.T. Johnson et al. (eds.), Advances insugarbeet production: Principles and practices. The Iowa State University Press, Ames.

R-10
Hills, F.J., F.E. Broadbent, and M. Fried. 1978. Timing and rate of fertilizer nitrogen forsugarbeets related to nitrogen uptake and pollution potential. J. Environ. Qual. 7:368-372.
Hodgson, D.R., G.M. Whiteley, and A. E. Bradnam. 1989. Effects of waterlogging in the springon soil conditions and the growth and yield of spring barley in three cultivation systems.J. Agric. Sci. Camb. 112:265-276.
Honeycutt, C. W., L. J. Potaro and W. A. Halteman. 1991. Predicting nitrate formation from soil,fertilizer, crop residue and sludge with thermal units. J. Environ. Qual. 20:850-856.
Hoyt, G.D. and R.L. Mikkelsen. 1991. Soil nitrogen movement under winter cover crops andresidues. p. 91-94. In W.L. Hargrove (ed.) Cover crops for clean water. Proc. W. Tenn.Exp. Sta. April 9-11, 1991. Soil and Water Conservation Society, Ankeny, IA.
Huang, Y. D.H. Rickerl, and K.D. Kephart. 1996. Recovery of deep-point injected soilnitrogen-15 by switchgrass, alfalfa, ineffective alfalfa, and corn. J. Environ. Qual.25:1394-1400.
Huang, Z.T., and A.M. Petrovic. 1994. Clinoptilolite zeolite influence on nitrate leaching andnitrogen use efficiency in simulated sand based golf greens. J. Environ. Qual. 23:1190-1194.
Huett, D.O. and E. Belinda Dettmann. 1992. Nutrient uptake and partitioning by zucchini squash,head lettuce, and potato in response to nitrogen. Aust. J. Agric.
Huggins, D.R. 1991. Redesigning no-tillage cropping systems : alternatives for increasingproductivity and nitrogen use efficiency. Ph.D. Dissertation, Pullman WA. 235 p.
Huggins, D.R., and W.L. Pan. 1992. Nitrogen efficiency component analysis: an evaluation ofcropping system differences in productivity. Agron J. 85:898-905.
Huggins, D.R., and W.L. Pan. 1993. Nitrogen efficiency component analysis: an evaluation ofcropping system differences in productivity. Agron. J. 85:898-905.
Huggins, D.R., W.L. Pan, and J.L. Smith. 1989a. Improving yield, percent protein and N useefficiency of no-till hard red spring wheat through crop rotation and fall N fertilization.Proc. Far West Regional Fertilization Conference, Coeur d'Alene, ID. 23-25 July. 1989.
Huggins, D. R., W. L. Pan, and J. L. Smith. 1989b. Management considerations for yield,percent protein, and N use efficiency of hard red spring wheat. In STEEP ProgressReport, p. 96-98, Annual STEEP Conference, Portland, Oregon.
Hummel, Jr., N.W. 1989. Resin-coated urea evaluation for turfgrass fertilization. Agron. J.81:290-294.
Humphreys, D. Gavin, Donald L. Smith, and Diane E. Mather. 1994. Nitrogen fertilizerapplication and seeding date effects on oat grain milling quality. Agron J. 86:838-843.

R-11
Ifenkwe, O.P., and E.J. Allen. 1983. Nitrogen and potassium uptake by high-yielding potatocrops. J. Agric. Sci. Camb. 101:103-111.
Incerti, M., and G.J.O. Leary. 1990. Rooting depth of wheat in the Victorian Mallee. Aust. J.Exp. Agric. 30:817-824.
Jackson, T.L., H.M. Reisenauer, and G.M. Horner. 1952. Nitrogen recommendations for wheatproduction in eastern Washington, Stations Circular No. 179. Inst. of Agricultural.
Jackson, W. A., W. L. Pan, R. H. Moll, and E. J. Kamprath. l986. Uptake, translocation, andreduction of nitrate. In C. A. Neyra, ed., Biochemical Basis of Plant Breeding. CRCPress, Boca Raton, Florida.
Jackson, G.D., R.K. Berg, G.D. Kushnak, T.K. Blake, and G. I. Yarrow. 1994. Nitrogen effectson yield, beta-glucan content, and other quality factors of oat and waxy hulless barley.Commun. Soil Sci. Plant Anal. 25:3047-3055.
Jacobsen, J.S., D.L. Tanaka, and J.W. Bauder. 1993. Spring wheat response to fertilizerplacement and nitrogen rate with limited moisture. Commun. Soil Sci. Plant Anal. 24:187-195.
Jacquot, H.D. 1953. Annual cropping with nitrogen in the intermediate rainfall areas of easternWashington, Stations Circular No. 214. Inst. of Agricultural Sciences, State College ofWashington.
Janzen, H.H., T.L. Roberts, and C.W. Lindwall. 1991. Uptake of point- injected nitrogen bywinter wheat as influenced by time of application. Soil Sci. Soc. Am. J. 55:259-264.
Jensen, E. S. 1994. Availability of nitrogen in 15N-labelled mature pea residues to subsequentcrops in the field. Soil Biol. Biochem. 26(4):465-472.
Jensen, E.S. 1996. Nitrogen acquisition by peas and barley and the effect of their crop residueson available nitrogen for subsequent crops. Biol. Fert. Soils. 23:459-464.
Joern, B.C., and M.L. Vitosh. 1995. Influence of applied nitrogen on potato. Part II: Recoveryand partitioning of applied nitrogen. Am. Pot. J. 72:73-84.
Johnson, G.V., and W.R. Raun. 1995. Nitrate leaching in continuous winter wheat: use of a soil-plant buffering concept to account for fertilizer nitrogen. J. Prod. Agric. 8(4):486-491.
Kahn, G. M., S. K. Agawal. 1983. Effect of moisture stress, sowing methods and nitrogen onnutrient content and their uptake by mustard (Brassica juncea Coss.). Indian J. Agronomy28:425-431.
Karlen, D.L., P.G. Hunt, and T.A. Matheny. 1996. Fertilizer 15nitrogen recovery by corn,wheat, and cotton grown with and without pre-plant tillage on Norfolk Loamy sand.Crop Sci. 36:975-981

R-12
Kairudin, N., and K.J. Frey. 1988. Soil N Availability and nitrogen harvest index of oats. Jour.Iowa Acad. Sci. 95:73-78.
Kanneganti, V. R. and S. D. Klausner. 1994. Nitrogen recovery by orchardgrass from dairymanure applied with or without fertilizer nitrogen. Commun. Soil Sci. Plant Analysis26(15-16):2771-2783).
Kanyama-Phiri, G.Y., C.A. Raguse, and K.L. Taggard. 1990. Responses of a perennial grass-legume mixture to applied nitrogen and differing soil textures. Agron. J. 82:488-495.
Kessavalou, Anabayan and Daniel T. Walters. 1997. Winter rye as a cover crop followingsoybean under conservation tillage. Agron. J. 89:68-74.
Khanif, Y.M., O. Van Cleemput, and L. Baert. 1984. Field study of the fate of labelled fertilizernitrate applied to barley and maize in sandy soils. Fert. Res. 5:289-294.
Kleinkopf, G.E. 1994. Nitrogen requirements of russet burbank potatoes. Spud Topics. vol.36(21), Washington State Potato Commission, Moses Lake, WA.
Kleinkopf, G.E. and R. E. Ohms. 1977. Nitrogen and time of application in potato yield andquality. Proc. Idaho Potato School. p. 15-17.
Kleinkopf, G.E. and R.B. Dwelle. 1978. Effect of nitrogen fertilization on tuber set and tubersize. Proc. Idaho Potato School. p. 26-28.
Kleinkopf, G.E. and D. T. Westermann. 1980. Effects of N and cultural practices on potatogrowth and quality. Proc. Idaho Potato School. p. 12-18.
Kleinkopf, G.E. and D. T. Westermann. 1986. Petiole testing for efficient nitrogenmanagement. Proc. Univ. Idaho Winter Commodity Schools. 18:163-165.
Klepper, B., and R. W. Rickman, C. M. Peterson. 1982. Quantitative characterization ofvegetative development in small cereal grains. Agron. J. 74:789-792.
Klepper, B., and R. W. Rickman. 1990. Modelling crop root growth and function. Adv. Agron.44:113-132.
Klepper, B., R. K. Belford, and R. W. Rickman. 1984. Root and shoot development in winterwheat. Agron. J. 76:117-122.
Koehler, F.E. 1960. Nitrogen uptake and moisture use by wheat. Proc. Fertilizer Conference ofthe Pacific Northwest, Salt Lake City, UT. 13-15 July. 1960.
Koenig, R.T. 1993. Morphological development, productivity and nutrient use by spring wheatin response to an enhanced ammonium supply. Ph.D. Dissertation, Washington StateUniversity, Pullman WA. 194p.

R-13
Krenzer, E. G., Jr., T. L. Nipp and R. W, McNew. 1991. Winter wheat mainstem leaf appearanceand tiller formation vs. moisture treatment. Agron. J. 83:663-667.
Kucey, R.M.N. 1986. Effect of fertilizer form, method and timing of application on barley yieldand N uptake under dryland conditions in southern Alberta. Can. J. Soil Sci. 66:615-621.
Kucey, R.M.N. 1989a. Contribution of N2 fixation to field bean and pea N uptake over thegrowing season under field conditions in southern Alberta. Can. J. Plant Sci. 69:695-699.
Kucey, R.M.N. 1989b. The influence of rate and time of mineral N application on yield and N2fixation by field bean. Can. J. Plant Sci. 69:427-436.
Kuchenbach, R. O., and S.A. Barber. 1987. Yearly variation of root distribution with depth inrelation to nutrient uptake and corn yields. Commun. in Soil Sci. Plant Anal. 18(3):255-263.
Kunelius, H.T., and M. Suzuki. 1977. Response of orchard grass to multiple harvests and rates ofnitrogen in post-seeding years. Can. J. Plant Sci. 57:763-770.
Kuo, S. 1985. Nitrogen and phosphorus requirements for sweet corn in western Washington.Agric. Res. Ctr. College of Agric. and Home Econ. Washington State Univ.
Kuo, S., U.M. Sainjo, and E. Jellum. 1996. Winter cover cropping influence on nitrogenmineralization, pre-sidedress soil nitrate test, and corn yields. Biol Fertil Soils. 22:310-317.
Ladd, J. N. and M. Amato. 1986. The fate of nitrogen from legume and fertilizer sources in soilssuccessively cropped with wheat under field conditions. Soil Biol. Biochem. 18(4):417-425.
Ladd, J. N., M. Amato, R. B. Jackson and J. H. A. Butler. 1983. Utilization by wheat crops ofnitrogen from legume residues decomposing in soils in the field. Soil Biol. Biochem.15(3):231-238.
Lamb, J.F.S., D.K. Barnes, M.P. Russelle, C.P. Vance, G.H. Heichel, and K.I Hanjum. 1995.Ineffectively and effectively nodulated alfalfas demonstrate biological nitrogen fixationcontinues with high nitrogen fertilizer. Crop Sci. 35:153-157.
Lang, N.S. and R.G. Stevens. 1997. Survey of central Washington Fertilizer recommendations.Proc. 1997 Wash. Potato Conf., Moses Lake, WA. pg 73-82.
Lang, N.S., R.G. Stevens, R.E. Thornton, W.L. Pan, and S. Victory. 1997. Irrigated potatonutrient management guide for central Washington. Proc. 1997 Wash. Potato Conf.,Moses Lake, WA. pg 47-72.
Larrson S., and A.G. Gorny. 1988. Grain yield and drought resistance indices of oat cultivars infield rain shelter and laboratory experiments. J. Agron.Crop Sci. 161:277-286.

R-14
LaRue, T. A., and T.G. Patterson. 1981. How much nitrogen do legumes fix? Adv. Agron.34:15-38.
Lauer, D. A. 1985. Russet Burbank yield response to sprinkler-applied nitrogen fertilizer. Am.Pot. J. 63:61-69.
Lauer, D.A. 1984. Response of Russet Burbank potatoes to sprinkler-applied N fertilizer onsandy soils. Proc. Wash. State Potato Conf. p. 39-49.
Lauer, D.A. 1986. Russet burbank yield response to sprinkler-applied nitrogen fertilizer. Am.Pot. J. 63:61-69.
Law, A. G., K. J. Morrison, A. R. Halvorson and C. D. Fanning. 1975. Fertilizer guide: Grassseed for Eastern Washington. Washington State University, Coop. Ext. Public. FG-38.
Lawlor, D.J. Kanemasu, E.T. Albrecht, W.C. III Johnson, D.E.. 1990. Seed productionenvironment influence on the base temperature for growth of sorghum genotypes. Agron.J. 82: 643-647.
Leggett, G.E. 1959. Relationships between wheat yields, available moisture, and availablenitrogen in eastern Washington dry land areas, Bulletin 609. Inst. of AgriculturalSciences, State College of Washington.
Leggett, G.E., and W.L. Nelson. 1960. Wheat production as influenced by cropping sequenceand nitrogen fertilization in the 10 to 15 inch rainfall area of eastern Washington, Bulletin608. Inst. of Agricultural Sciences, State College of Washington.
Lesczynski, D. B., and C. B. Tanner. 1976. Seasonal variation of root distribution of irrigated,field-grown Russet Burbank potato. Am. Potato J. 53: 69-78.
Levin, A., D. B. Beegle, and R. H. Fox. 1987. Effect of tillage on residual nitrogen availabilityfrom alfalfa to succeeding corn crops. Agron. J. 79: 34-38.
Lewis, C. E. and C. W. Knight. 1987. Yield response of rapeseed to row spacing and rates ofseeding and N-fertilization in interior Alaska. Can. J. Plant Sci. 67:53-57.
Liang, B.C. and A.F. MacKenzie. 1994. Corn yield, nitrogen uptake and nitrogen use efficiencyas influenced by nitrogen fertilization. Can. J. Soil Sci. 74: 235-240.
Linford, K., and R. E. McDole. 1977. Survey to investigate potato rooting in southern Idahosoils. p. 109-114. Proc. Annu. Pac. Northwest Fertilizer Conference, Twin Falls, ID.,Plant Food Assoc., Portland, OR.
Loffler, C. M., T. L. Rauch, and R. H. Busch. 1985. Grain and plant protein relationships in hardred spring wheat. Crop Sci. 25: 521-524.
Lory, J.A., G.W. Randall, and M.P. Russelle. 1995. Crop sequence effects on response of cornand soil inorganic nitrogen to fertilizer and manure nitrogen. Agron. J. 87: 876-883.

R-15
Lucero, D.W., D.C. Martens, J.R. McKenna, and D.E. Starner. 1995. Poultry litter effects onunmanaged pasture yield, nitrogen and phosphorus uptakes, and botanical composition.Commun. Soil Sci. Plant Anal. 26:861-881.
Macduff, J. H., M. J. Hopper, A. Wild and F. E. Trim. 1987. Comparison of the effects of roottemperature on nitrate and ammonium nutrition of oilseed rape (Brassica napus L.) inflowing solution culture. J. Expt. Botany 38(192):1104-1120.
Mahler, R. L. and G. A. Murray. 1989. Northern Idaho fertilizer guide: winter rapeseed. CIS 785.Cooperative Extension Service, Agricultural Experiment Station, University of Idaho.
Mahler, R.L., D.F. Bezdicek, and R.E. Witters. 1979. Influence of slope position on nitrogenfixation and yield of dry peas. Agron. J. 71:348-351.
Mahler, R.L., F.E. Koehler, and L.K. Lutcher. 1994. Nitrogen source, timing of application, andplacement: effects on winter wheat production. Agron. J. 86:637-642.
Maier, N.A., A. P. Dahlenburg, and T.K. Twigden. 1990. Effect of nitrogen on the yield andquality of irrigated onions (Allium capa L.) cv. Cream Gold grown on siliceous sands.Aust. J. Exp. Agric. 30:845-851.
Malone, M. 1993. Rapid inhibition of leaf growth by root cooling in wheat: Kinetics andmechanism. J. Exp. Bot. 44(268):1663-1669.
Marshall, H.G., F.L. Kolb, and G.W.Roth. 1987. Effects of nitrogen fertilizer rate, seedling rate,and row spacing on semidwarf and conventional height spring oat. Crop Sci. 27:572-575.
Maskina, M.S., J.F. Power, J.W. Doran, W.W. Wilhelm. 1993. Residual effects of no-till cropresidues on corn yield and nitrogen uptake. Soil Sci. Soc. Am. J. 57:1555-1560.
Mason, M. G. and I. C. Rowland. 1992. Effect of amount and quality if previous crop residues onthe nitrogen fertilizer response of a wheat crop. Aus. J. Expt. Agric. 32:363-370.
McCracken, D. V., S. J. Corak, M. S. Smith, W. W. Frye, and R. L. Blevins. 1989. Residualeffects of nitrogen fertilization and winter cover cropping on nitrogen availability. SoilSci. Soc. Am. J. 53:1459-1464.
McEwen, J., R. J. Darby, M. V. Hewitt, and D. P. Yeoman. 1989. Effects of field beans, fallow,lupines, oats, oilseed rape, peas, ryegrass, sunflowers and wheat on nitrogen residues inthe soil and on the growth of a subsequent wheat crop. J. Agric. Sci. 115:209-219.
McLean L.A., F.W. Sosulski, and C. G. Youngs. 1974. Effects of nitrogen and moisture on yieldand protein in field peas. Can. J. Plant Sci. 54:301-305.
McMaster, G. S. and W. W. Wilhelm. 1995. Accuracy of equations predicting the phyllochron ofwheat. Crop Science 35(1):30-36.

R-16
McNeal, F. H., G. O. Boatwright, M. A. Berg, and C. A. Watson. 1968. Nitrogen in plant partsof seven spring wheat varieties at successive stages of development. Crop Sci. 8: 535-537.
McNeal, F. H., M. A. Berg, P. L. Brown, and C. F. McGuire. 1971. Productivity and qualityresponse of five spring wheat genotypes, Triticum aestivum L., to nitrogen fertilizer.Agron. J. 63: 908-910.
McTaggart, I.P., and K.A. Smith. 1995. The effect of rate, form and timing of fertilizer N onnitrogen uptake and grain N content in spring malting barley. J. Agric. Sci. Camb.125:341-353.
Meek, B.D., D.L. Carter, D.T. Westermann, and R.E. Peckenpaugh. 1994. Root-zone mineralnitrogen changes as affected by crop sequence and tillage. Soil Sci. Soc. Am. J. 58:1464-1469.
Meisinger, J.J., W.L. Hargrove, R.L. Mikkelsen, J.R. Williams, and V.W. Benson. 1991.Effects of cover crops on ground water quality. p. 57-68. In W.L. Hargrove (ed.) Covercrops for clean water. Proc. W. Tenn. Exp. Sta. April 9-11, 1991. Jackson, TN. Soil andWater Conservation Society, Ankeny, IA.
Menelik, G., R.B. Reneau Jr., and D.C. Martens. 1994. Corn yields and nitrogen uptake asinfluenced by tillage and applied nitrogen. Journal of Plant Nutrition. 17(6):911-931.
Merrill, S.D., D.R. Upchurch, A.L. Black, and A. Bauer. 1994. Theory of Minirhizotron rootdirectionality observation and application to wheat and corn. Soil Sci. Soc. Am. J.58:664-671.
Millard, P., and B. Marshall. 1986. Growth, nitrogen uptake and partitioning within the potato(Solanum tuberosum L.) crop, in relation to nitrogen application. J. Agric. Sci. Camb.107: 421-429.
Miller, M. H., E. G. Beauchamp and J. D. Lauzon. 1994. Leaching of nitrogen and phosphorusfrom the biomass of three cover crop species. J. Environ. Qual. 23:267-272.
Miltner, E.D., B.E. Branham, E.A. Paul, and P.E. Rieke. 1996. Leaching and mass balance of15N-labeled urea applied to a Kentucky Bluegrass turf. Crop Sci. 36:1427-1433.
Mohammad, M. J. A.. 1993. Wheat growth and P uptake responses to mycorrhizal inoculationand deep P placement. Ph.D. diss. Washington State University., Pullman.
Moorby, H. and P. H. Nye. 1984. The effect of temperature variation over the root system onroot extension and phosphate uptake by rape. Plant Soil 78:283-293.
Morton, J. 1976. Fertigation management of irrigated grains in light textured soils. Proc.Fertilizer Conference of the Pacific Northwest, Billings, MT. 13-15 July. 1976.

R-17
Moyer, J.L., and D.W. Sweeney. 1990. Tall fescue response to placement of urea/ammoniumnitrate solution. Soil Sci. Am. J. 54:1153-1156.
Moyer, J.L., D.W. Sweeney, and R.E. Lamond. 1995. Response of tall fescue to fertilizerplacement at different levels of phosphorus, potassium, and soil pH. 1995. J. Plant Nutr.18:729-746.
Muldoon, D. K. 1985. The effect of nitrogen fertilizer on the growth, mineral composition anddigestibility of a sorghum X sudangrass hybrid and Japanese barnyard millet. Aust. J.Expt. Agric. 25:411-416.
Mulla, D.J., A.U. Bhatti, M.W. Hammond, and J.A. Benson. 1992. A comparison of winterwheat yield and quality under uniform vesus spatially variable fertilizer management.Agriculture, Ecosystems, and Environment. 38: 301-311.
Narang, R. S., and S. Singh. 1985. Nitrogen management in Indian mustard. Ind. J. Agron.30:477-482.
N'Dayegamiye, Adrien. 1996. Response of silage corn and wheat to dairy manure and fertilizersin long-term fertilized and manured trials. Can. J. of Soil Sci. 76:357-363.
Nedel, J.L., S.E. Ullrich, and W.L. Pan. 1997. Nitrogen use by standard height and semi-dwarfbarley isotypes. Brasilia. 32:147-153.
Nedel, J.L., S.E. Ullrich, J.A. Clancy, and W.L. Pan. 1993. Barley semidwarf and standardisotype yield and malting quality response to nitrogen. Crop Sci. 33:258-263.
Nelson, D. P. 1990. Potato root morphology and nutrient transport to developing tubers. Ph.D.dissertation, Washington State University, Pullman, WA.
Nickel, S.E., R. Kent Crookston, and Michael P. Russelle. 1995. Root growth and distributionare affected by corn-soybean cropping sequence. Agron. J. 87:895-902.
Nielsen, N.E. and H.E. Jensen. 1986. The course of nitrogen uptake by spring barley from soiland fertilizer nitrogen. Plant Soil 91:391-395.
Nwadukwe, P.O., and V.O. Chude. 1995. Effects of nitrogen and phosphorus fertilization onseed crop of onion (Allium capa L.) in a semiarid tropical soils. Trop. Agric. 72:216-219.
Nykiforuk, C. L. and A. M. Johnson-Flanagan. 1994. Germination and early seedlingdevelopment under low temperature in canola. Crop Sci. 34:1047-1054.
Oberle, S.L., and D.R. Keeney. 1990. Factors influencing corn fertilizer N requirements in thenorthern U.S. corn belt. J. Prod. Agric. 3(4):527-534.
Ojala, J.C., J.C. Stark, and G. E. Kleinkopf. 1990. Influence of irrigation and nitrogenmanagement on potato yield and quality. Am. Pot. J. 67:29-43.

R-18
Olson, R.A. and L.T. Kurtz. 1982. Crop nitrogen requirements, utilization, and fertilization. In:Stevensen, F.J., J.M. Bremner, R.D. Hauck, and D.R. Keeney (eds). Nitrogen inagricultural soils. Agron. Monogr. 22. ASA,CSA, and SSSA, Madison, WI.
Olson, R.A. and D.H. Sander. 1988. Corn production. p. 639-686. In G.F. Sprague and J.W.Dudley (ed.) Corn and corn improvement. ASA Monogr. 18. ASA, Madison, WI.
Olson, R.V., L.S. Murphy, H.C. Moser, and C.W. Swallow. 1979. Fate of tagged fertilizernitrogen applied to winter wheat. Soil Sci. Soc. Am. J. 43: 973-975.
Oquist, G., V. M. Hurry and N. P. A. Huner. 1993. Low-temperature effects on photosynthesisand correlation with freezing tolerance in spring and winter
Overman, A. R., and S.R. Wilkinson. 1995. An extended nitrogen, phosphorus, and potassiummodel for tall fescue. Commun. Soil Sci. Plant Anal. 26:3417-3434.
Overman, Allen R., Denise M. Wilson, and Eugene J. Kamprath. 1994. Estimation of yield andnitrogen removal by corn. Agron. J. 86:1012-1016.
Pan, W. L., J. Brunty, M. Moneymaker, R. Bolton, R. Stevens, R. Boydston, G. Santo, R.Thornton, and S. Victory. 1997. Nitrogen recycling in potato rotations. Proc.Washington State Potato Conf. and Trade Show, p. 33-40. Wash. State Potato Comm.,Moses Lake, WA. p.33-39.
Pan, W.L., J.J. Camberato, R.H. Moll, E.J. Kamprath, and W.A. Jackson. 1995. Altering source-sink relationships in profile maize hybrids: consequences for nitrogen uptake andremobilization. Crop Sci. 35:836-845.
Pan, W.L. and A.G. Hopkins. 1991. Plant development and N and P use of winter barley. I.Evidence of water stress-induced P deficiency in an eroded toposequence. Plant Soil 135:9-19.
Pan, W.L. and L.K. Hiller. 1992. Growth and development of potato root types: Implicationsfor placement and timing strategies in fertility management. Proc. Wash. State PotatoConf. and Trade Fair. p. 105-111.
Pan, W.L., E. Lundquist, R. Bolton, and L.K. Hiller. 1994. Potato root development and Nuptake. Proc. Wash. State Potato Conf. and Trade Fair, p. 107-111, Washington StatePotato Commission, Moses Lake, WA.
Pan, W. L., D. P. Nelson, and S. Mohebbi. 1990. Potato root growth and function. InProceedings of Twenty-ninth Annual Washington State Potato Conference, p. 109-112,Moses Lake, WA, Feb. 1-2, 1990.
Pare, T., F.P. Chalifour, J. Bourassa, and H. Antoun. 1992. Forage corn dry-matter yields and Nuptake as affected by previous legumes and N fertilizer. Can. J. Plant Sci. 72:699-712.

R-19
Parr, J F. 1973. Chemical and biochemical considerations for maximizing the efficiency offertilizer nitrogen. J. Environ. Qual. 2: 75-84.
Paul, J.W., and G.E. Beauchamp. 1993. Nitrogen availability for corn in soils amended withurea, cattle slurry, and solid and composted manures. Can. J. Soil Sci. 73:253-266.
Peacock, C.H., and P.F. Daniel. 1992. A comparison of turfgrass response to biologicallyamended fertilizers. HortScience. 27:883-884.
Pelter, G. Q., E. J. Sorensen, R. E., Thornton and R. Stevens. 1992. Dry bulb onion production inthe Columbia Basin. Washington State University Cooperative Extension. EB 1693.16pp.
Peterson, P. W., W. J. Moldovan, K. J. Morrison, S. Fransen, and C. B. Kelsey. 1984. Pasturemanagement guide for Northeast Washington. Washington State University, Coop. Ext.Public. EB 1297.
Petrovic, A.M. 1990. The fate of nitrogenous fertilizers applied to turfgrass. J. Environ. Qual.19:1-14.
Phillips, R. E., R. L. Blevins, G. W. Thomas, W.W. Frye and S.H. Phillips. 1980. No-tillageagriculture. Science 208:1108-1113.
Porter, L.K. 1995. Irrigated corn 15N uptake, and NO3 carryover and leaching. Conf. Proc.,Clean water, clean environment, 21st century: team agriculture, working together toprotect water resources. ASAE. Mar 5-8, 1995, Kansas City, Mo. p. 171-174.
Power, J.F., D.L. Grunes, and G.A. Reichman. 1961. The influence of phosphorus fertilizationand moisture on growth and nutrient absorption by spring wheat: I. Plant growth, Nuptake, and moisture use. Soil Sci. Soc. Am. Proc. 25:207-210.
Power, J.F., W.W. Wilhelm, and J. W. Doran. 1986. Crop residue effects on soil environmentand dryland maize and soya bean production. Soil and Tillage Res. 8:101-111.
Powlson, D.S., P.B.S. Hart, P.R. Poulton, A.E. Johnston, and D.S. Jenkinson. 1992. Influence ofsoil type, crop management and weather on the recovery of 15N-labeled fertiizer appliedto winter wheat in spring. J.Agric. Sci. 118:83-100.
Quemada, M. and M. L. Cabrera. 1995. Carbon and nitrogen mineralized from leaves and stemsof four cover crops. Soil Sci. Soc. Am. J. 59:471-477.
Raczkowski, C.W. 1984. Fate of subsurface banded (knife) and broadcast N applied to tallfescue (Festuca arundinacea Schreb.). M.S. thesis. Kansas State Univ., Manhattan.
Raczkowski, C.W., and D.E. Kissel. 1989. Fate of subsurface-banded and broadcast nitrogenapplied to tall fescue. Soil Sci. Am. J. 53:566-570.

R-20
Ramsey, B. R., and A. P. L. Callinan. 1994. Effects of nitrogen fertilizer on canola production in north central Victoria. Aus. J. Exptl. Agric. 34:789-796.
Rao, E., and P.N. Arora. 1979. Studies on uptake of nitrogen by potato crop. Indian J. Agron.24(4):442-444.
Rao, S.C., and T.H. Dao. 1996. Nitrogen placement and tillage effects on dry matter and nitrogenaccumulation and redistribution in winter wheat. Agron. J. 88:365-371.
Rasmussen, P.E., and C.R. Rhodes. 1991. Tillage, soil depth, and precipitation effects on wheatresponse to nitrogen. Soil Sci. Soc. J. Am. 55:1221-124.
Rasmussen, Paul E., and F. Vance Pumphrey. 1977. Nutrient uptake and distribution inprocessing peas (Pisum sativum L.) grown under dryland and irrigated conditions innortheast Oregon. p. 147-153. Proc. 28th Annual Pacific Northwest FertilizerConference, Twin Falls, ID. 12 July-14 July. 1977.
Raun, W.R., and G.V. Johnson. 1995. Soil-plant buffering of inorganic nitrogen in continuouswinter wheat. Agron. J. 87:827-834.
Read, J.C. and R. M. Jones. 1987. Oat silage yield as affected by time of application of nitrogenfertilizer, seeding rate, and planting date. Texas Agric. Expt. Sta., Nov. 1987, p. 29-30.
Reeves, D.W., C.W. Wood, and J.T. Touchton. 1993. Timing nitrogen applications for corn in awinter legume conservation-tillage system. Agron. J. 85:98-106.
Reisenauer, H.M., and G.E. Leggett. 1957. Eastern Washington soils need sulfur, Circular 317.Inst. Of Agricultural Sciences, State College of Washington.
Rennie, R.J., and G.A. Kemp. 1983. N2-fixation in field beans quantified by 15N isotopedilution. II. Effect of cultivars of beans. Agron. J. 75:645-649.
Rennie, R.J., and G.A. Kemp. 1984. 15N-determined time course for N2 fixation in two cultivarsof field bean. Agron. J. 76:146-154.
Rickman, R.W., S.E. Waldman, and B. Klepper. 1996. MODWht3: a development-driven whaetgrown simulation. Agron. J. 88:176-185.
Roberts, S., and H.H. Cheng. 1984. The use of nitrogen-15 isotope to study nitrogen nutrition ofpotatoes. Proc. NW Fertilizer Conference, Pasco, WA. 17-18 July. 1984.
Roberts, S., H.H. Cheng, and F.O. Farrow. 1991. Potato uptake and recovery of nitrogen-15-enriched ammonium nitrate from periodic applications. Agron. J. 83:378-381.
Salo, T. 1996. Simulated and measured nitrogen status in soil and in onion crops. ActaHorticulture. 428:193-204.

R-21
Sarrantonio, M. 1992. Opportunities and challenges for the inclusion of soil-improving crops invegetable production systems. Hort. Sci. 27: 754-758.
Sarrantonio, M. and T. W. Scott. 1988. Tillage effects on availability of nitrogen to cornfollowing a winter green manure crop. Soil Sci. Soc. Am. J. 52:1661-1668.
Sartain, J.B. 1992. Natural organic slow-release N sources for turfgrass. Proc. Fla. State Hort.Soc. 105:224-226.
Schomberg, H. H., J. L. Steiner and P. W. Unger. 1994. Decomposition and nitrogen dynamicsof crop residues: Residue quality and water effects. Soil Sci. Soc. Am. J. 58:372-381.
Schuurman, J.J. 1980. Root and crop growth of oats as affected by the length of periods of highwater-table. Neth. J. agric. Sci. 28:20-28.
Schwarz, K.U. Leon, J. Geisler, G. 1991. Genetic variability in root development of springbarley (H. vulgare L.) and oats (A. sativa L.). Dev. Agric. Managed-Forest Ecol. 24:639-646.
Sharratt, B. S. 1991. Shoot growth, root length density, and water use of barley grown atdifferent soil temperatures. Agron. J. 83:237-239.
Sharratt, B.S., and V.L. Cochran. 1993. Skip-row and equidistant-row barley with nitrogenplacement: yield, nitrogen uptake, and root density. Agron. J. 85:246-250.
Shennan, C. 1992. Cover crops, N cycling, and soil properties in semi-irrigated vegetableproduction systems. Hort. Sci. 27:749-755.
Shipley, P.R., J.J. Meisinger, and A.M. Decker. 1992. Conserving residual corn fertilizernitrogen with winter cover crops. Agron. J. 84:869-876.
Singh, U.N., and R.A. Singh. 1979. Effect of nitrogen on the yield of rainfed oat and its nitrogenuptake and moisture use. Indian J. Agric. Sci. 49:945-949.
Smith, C. J., G. C. Wright, M. R. Wooroofe. 1988. The effect of irrigation and nitrogen fertilizeron rapeseed (Brassica napus) production in southeastern Australia. II. Nitrogenaccumulation and oil yield. Irrig. Sci. 9: 15-25.
Smith, D.L., and D.J. Hume. 1985. Effects of irrigation and fertilizer on N2(C2H2) fixation andyield of white bean and soybean. Can. J. Plant Sci. 65:307-316.
Smith, S. J. and A. N. Sharpley. 1990. Soil nitrogen mineralization in the presence of surface andincorporated crop residues. Agronomy Journal 82:112-116.
Sollenberger, L.E., W.C. Templeton Jr., and R.R. Hill, Jr. 1984. Orchardgrass and perennialryegrass with applied nitrogen and in mixtures with legumes. 1. Total dry matter andnitrogen yields. Grass and Forage Science. 39:255-262.

R-22
Sowers, K.E. 1992. Spring nitrogen applications with point injection or topdress to optimizenitrogen use efficiency, yield and protein in soft white winter wheat. MS Thesis.Washington State University, Pullman WA. 114p.
Sowers, K.E., W.L. Pan, B.C. Miller, and J. L. Smith. 1994. Nitrogen use efficiency of splitnitrogen applications in soft winter wheat. Agron. J. 86:942-948.
Stahnke, G.K., S.E. Brauen, R.S. Byther, A.L. Antonelli, and G. Chastagner. 1997. Homelawns. Washington State Univ. Coop. Ext. Serv., Ext. Bull. 482.
Staley, T.E., W.L. Stout, G.A. Jung. 1991. Nitrogen use by tall fescue and switchgrass on acidicsoils of varying water holding capacity. Agron J. 83:732-738.
Stanford, G., J.N. Carter, D.T. Westermann, and J.J. Meisinger. 1977. Residual nitrate andmineralizable soil nitrogen in relation to nitrogen uptake by irrigated sugarbeets. Agron.J. 69:303-308.
Starr, J.L. and H.C. DeRoo. 1981. The fate of nitrogen fertilizer applied to turfgrass. Crop Sci.21:531-536.
Starrett, S.K., N.E. Christians, and T.A. Austin. 1995. Fate of amended urea in turfgrassbiosystems. Commun. Soil Sci. Plant Anal. 26:1595-1606.
Staver, K. W., B. B. Brinsfield. 1995. Assessing the impact of changes in management practiceson nutrient transport from coastal plain agricultural systems. Chesapeake ResearchConsortium Report, Project CA NPS#3.
Steen, E. and B. Lindén. 1987. Role of fine roots in the nitrogen economy of sugar beet. J.Agronomy and Crop Science. 158:1-7.
Stevens, R.G. 1988. Effect of nitrogen source, rate and timing on yield and quality of WallaWalla sweet onions. Proc. 39th Ann. Far West Preg. Fert. Conf. Bozeman, MT. July 11-13. pg. 123-132.
Stevens, R. G., and S. Roberts. 1988. Fertilizer guide: Winter wheat (soft white) CentralWashington Irrigated. Washington State University, Coop. Ext. Public EB 1487..
Stevens, R.G. 1992. Assessment of the effects of current hop yard management on nitrogencycling relative to water quality. Unpublished annual report, Hop Research Council.
Stevens, Robert G. 1997. Nitrogen management of winter onions in Washington. p. 104-113.Proc. v.2 Western Nutrient Management Conference. Potash and Phosphate Institute.Salt Lake City, UT. 6-7 Mar. 1997.
Stevens, R.G., and V.I. Prest. 1995. Eastern Washington field test. p. 48-74. In Recycled yardDebris compost growth trial results, 1993-1994. Washington State Univ. Res. Ctr.

R-23
Stevens, R.G., R.G. Evans, and S.T. Kenny. 1995. Investigation of the effect of rate and timingof nitrogen application on yield and quality of hops. Washington Hop Industry -1995Annual Reports, Washington Hop Commission, Hop Growers of Washington, andWashington State University.
Stevens, R.G., R.G. Evans, and S.T. Kenny, and V. Prest. 1993. Investigation of the effect ofrate and time of nitrogen application on yield and quality of hops. 1993 Report,Washington Hop Commission.
Stevens, R.G., R.G. Evans, and S.T. Kenny, and V. Prest. 1994. Investigation of the effect ofrate and time of nitrogen application on yield and quality of hops. 1994 Report,Washington Hop Commission.
Stirling, G.D., Q.D.A. Ivory., and D.A. Ivory. 1981. Nitrogen and phosphorus fertilization offorage oats in the Maranoa region of southern Queensland. Queensland Journal ofAgricultural and Animal Sciences. 38:143-153.
Stoker, R., K. E. Carter. 1984. Effect of irrigation and nitrogen on yield and quality of oilseedrape. New Zealand J. of Exptl. Agric. 12:219-224.
Stout, W.L. 1995. Evaluating the "added nitrogen interaction" effect in forage grasses. Commun.Soil Sci. Plant Anal. 26:2829-2841.
Stout, W.L., and G.A. Jung. 1992. Influences of soil environment on biomass and nitrogenaccumulation rates of orchardgrass. Agron. J. 84:1011-1019.
Stute, J. K., and J.L. Posner. 1995. Synchrony between legume nitrogen release and corn demandin the upper Midwest. Agron. J. 87:1063-1069.
Taylor, A. J., C. J. Smith, I. B. Wilson. 1991. Effect of irrigation and nitrogen fertilizer on yield,oil content, nitrogen accumulation and water use of canola. Fert. Res. 29:249-260.
Tester, C. F. 1989. Tall fescue growth in greenhouse, growth chamber, and field plots amendedwith sewage sludge compost and fertilizer. Soil Sci. 148:452-458.
Teuber, L.R., D.A. Phillips, S. Geng, and W.F. Lehman. 1991. Predicted and actual yield andnitrogen concentration of alfalfa in different nitrogen environments. Crop Sci. 31:1459-1464.
Thornton, R. E., s.L. Victory, and M. W. Hammond. 1997. A comparison of pre-plant nitrogenbest management practices on potatoes and their effect on nitrate leaching in theColumbia Basin. In S. Thornton (ed) Proceedings of the thirty-sixth annual WashingtonState Potato Conference, WA State Potato Commission, Moses Lake, WA.
Tillman, B.A., W.L. Pan, and S.E. Ullrich. 1991. Nitrogen use by northern-adapted barleygenotypes under no-till. Agron. J. 83:194-201.

R-24
Tindall, T.A., J.C. Stark, and B.D. Brown. 1993. Nutrient management. p. 21-28. In L.D.Robertson and J.C. Stark (ed.) Idaho spring barley production guide. Univ. of IdahoCooperative Ext. Bull. 742.
Turner, D.O. 1979. Nitrogen fertilization of orchardgrass pasture as influenced by irrigation. p.1-15. Washington State Agriculture Research Center. Washington Agric. Res. Center.Bull. 881.
Turner, D.O.. 1976. Fertilizer guide: Sweet corn for western Washington. Washington StateUniversity Cooperative Extension Service. FG-39.
Turner, D.O., A.R. Halvorson, and M. Jarmin. 1975. Fertilizer guide: Peas for westernWashington. Washington State University Cooperative Extension Service. FG-27.
Turner, D.O., W.P. Mortensen, A.R. Halvorson, and A.S. Baker. 1982. Alfalfa-grass seedlingsfor western Washinton. Washington State University Cooperative Extension Service.FG-16.
Turner, T. R., and N. W. Hummel, Jr. 1992. Nutritional requirements and fertilization. In:Waddington, D.V., Carrow, R.N., and Shearman, R.C. (eds) Turfrass - Agron. Monogr.32. American Society of Agronomy, Crop Science Society of America, and Soil ScienceSociety of America. Madison, WI. Pp. 385-439.
Undersander, D. J. and S. Christiansen. 1986. Interactions of water variables and growing degreedays on heading phase of winter wheat. Agricultural and Forest Meteorology 38:169-180.
Utomo, M. W. W. Frye and R. L. Blevins. 1990. Sustaining soil nitrogen for corn using hairyvetch cover crop. Agron. J. 82:979-983.
Vandecaveye, S.C., and L.V. Bond. 1936. Yield and composition of alfalfa as affected byvarious fertilizers and soil types. J. Am. Soc. of Agron. 28:491-504.
Vanotti, M. B. and L. G. Bundy. 1994. Frequency of nitrogen fertilizer carryover in the humidMidwest. Agron. J. 86:881-886.
Vanotti, M. B., and L. G. Bundy. 1995. Soybean effects on soil nitrogen availability in croprotation. Agron. J. 87:676-680.
Varvel, G. E. and T. A. Peterson. 1992. Nitrogen fertilizer recovery by soybean in monocultureand rotation systems. Agron. J. 84:215-218.
Vaughan, B., D.G. Westfall, and K.A. Barbarick. 1990. Nitrogen rate and timing effects onwinter wheat grain yield, grain protein, and economics. J. Prod. Agric. 3:324-328.
Vepraskas, M.J., and M.G. Wagger. 1990. Corn root distribution and yield response to subsoilingfor Paleudults having different aggregate sizes. Soil Sci. Soc. J. Am. 54:849-854.

R-25
Veseth, R., R. McDole, C. Engle, and J. Vomocil. 1986. Fertilizer band location for cereal rootaccess in no-till and minimum tillage systems. STEEP Extension Publication PNW283,U. Idaho, Washington State University, Oregon State University.
Vigil, M. F. and D. E. Kissel. 1991. Equations for estimating the amount of nitrogen mineralizedfrom crop residues. Soil Sci. Soc. Am. J. 55:757-761.
Wagger, M. G. 1989. Time of desiccation effects on plant composition and subsequent nitrogenrelease from several annual winter cover crops. Agron. J. 81:236-241.
Wagger, M.G. 1989. Cover crop management and nitrogen rate in relation to growth and yield ofno-till corn. Agron. J. 81: 533-538.
Wagger, M.G. and D.B. Mengel. 1988. The role of nonleguminous cover crops in the efficientuse of water and nitrogen. p. 115-127. In Cropping strategies for efficient use of waterand nitrogen. Special pub. no. 51. ASA-CSSA-SSSA, Madison, WI.
Walters, D.T., and G.L. Malzer. 1990. Nitrogen management and nitrification inhibitor effects onnitrogen-15 Urea: I. Yield and fertilizer use efficiency. Soil Sci. Soc. Am. J. 54:115-122.
Washington Agricultural Statistics Service. 1996. Washington Agricultural Statistics, 1995-96.Olympia, WA
Webster, C.P., R.J. Dowdell, and R.Q. Cannell. 1985. Uptake of labelled nitrate by roots ofwinter barley on a direct-drilled or ploughed silt loam soil. Soil and Tillage Research.5:381-389.
Weinert, T. 1996. Cover Crops and the N Cycle in a Potato-Based Rotation. Master’s Thesis,Washington State University. 123 pp.
Weinert, T. L., W. Pan, M. Moneymaker, G. Santo, R. Stevens. 1995. Green-manured wintercover crops in irrigated potato rotations. In Proceedings of the WA Potato Conference, p.23-28, Moses Lake, WA.
Westcott, M.P., M. L. Knox, and J.L. Wraith. 1994. Kinetics of soil-plant nitrate relations inpotato and peppermint: A model for derivative diagnosis. Common Soil Sci. Plant Anal.25:469-478.
Westcott, M.P., L.E. Welty, M.L. Knox, and L.S. Prestbye. 1995. Managing alfalfa and berseemclover for forage and plowdown nitrogen in barley rotations. Agron. J. 87:1176-1181.
Westermann, D.T., and J.J. Kolar. 1978. Symbiotic N2(C2H2) fixation by bean. Crop Sci.18:986-990.
Westermann, D.T. and R.E. Sojka. 1996. Tillage and nitrogen placement effects on nutrientuptake by potato. Soil Sci. Soc. J. Am. 60:1448-1453.

R-26
Westermann, D.T., G.E. Kleinkopf, and L.K. Porter. 1988. Nitrogen fertilizer efficiencies onPotatoes. Am. Pot. J. 65:377-386.
Westermann, D.T., G.E. Kleinkopf, L.K. Porter, and G.E. Leggett. 1981. Nitrogen sources forbean seed production. Agron. J. 75:660-664.
Whitmore, A. P. 1995. Modelling the mineralization and leaching of nitrogen from crop residuesduring three successive growing seasons. Ecological Modelling 81:233-241.
Wolfe, D. W., D.T. Topoleski, N.A. Gundersheim, and B.A. Ingall. 1995. Growth and sensitivityof four vegetable crop to soil compaction. J. Amer. Hort. Sci. 120:956-963.
Worzella, W.W. 1932. Root development in hardy and non-hardy winter wheat varities. Journalof the American Society of Agronomy. 24:626-637.
Wright, G. C., C. J. Smith, M. R. Woodroofe. 1988. The effect of irrigation and nitrogenfertilizer on rapeseed (Brassica napus) production in southeastern Australia. I. Growthand seed yield. Irrig. Sci. 9:1-13
Wuest, S.B., and K.G. Cassman. 1992a. Fertilizer-nitrogen use efficiency of irrigated wheat: I.Uptake efficiency of preplant versus late-season application Agron. J. 84:682-688.
Wuest, S.B., and K.G. Cassman. 1992b. Fertilizer-nitrogen use efficiency of irrigated wheat: II.Partitioning efficiency of preplant versus late-season application. Agron. J. 84:689-694.
Wyland, L. J., L. E. Jackson and K. F. Schulbach. 1995. Soil-plant nitrogen dynamics followingincorporation of a mature rye cover crop in a lettuce production system. J. of Agric. Sci124:17-25.
Section 4
Adriano, D.C., A.E. Erickson, A.R. Wolcott, and B.J. Ellis. 1974. Certain environmentalproblems associated with long-term land disposal of food processing wastes. In Loehr,R.C. (ed.). Processing and management of agricultural wastes. Proceedings of the 1974Cornell Agricultural Waste Management Conference. p. 222-233. Cornell University,Ithaca, NY.
Ardern, D.A. 1976. The agricultural use of municipal sludge. In Loehr, R.C. (ed.). Land as awaste management alternative. Proceeding of the 1976 Cornell Agricultural WasteManagement Conference, p. 583-601. Ann Arbor Science Publisherss Inc., Ann Arbor,MI.
ASAE Standards. 1993. Manure Production and Characteristics. 1993. ASAE Data: ASAED384.1. American Society of Agricultural Engineers, East Lansing, MI.
Bezdicek, D.F., J.M. Sims, M.H. Ehlers, J. Conrath, and R.E. Hermanson. 1977. Nutrientbudget in a dairy anaerobic lagoon - evaluation for land application. In Loehr, R.C. (ed.)Food, fertilizer and agricultural residues. Proceedings of the 1977 Cornell Agricultural

R-27
Waste Management Conference. p. 681-692. Ann Arbor Science Publishers Inc., AnnArbor, MI.
Bock, B.R. and Hergert, G.W. 1991. Fertilizer Nitrogen Management. In R.F. Follett, D.R.Keeney, and R.M. Cruse (eds.). Managing Nitrogen for Groundwater Quality and FarmProfitability. SSSA, Madison, WI. p.139-164.
Carey, B.M. 1995. Vadose zone monitoring Deer Park, Washington: A municipal effluent landapplication site. Washington State Department of Ecology, Environmental Investigationsand Laboratory Services Program Publication 94-148.
Carey, B.M. and J.A. Jacobson. 1994. Vadose zone monitoring at Tree Top Land ApplicationSite in Selah, Washington, June - December 1992. Washington State Department ofEcology, Environmental Investigations and Laboratory Services Program Publication94-148.
Chescheir, G.M. III and P.W. Westerman. 1984. Rapid Methods for Determining FertilizerValue of Livestock Manures. ASAE Paper 84-4082. American Society of AgriculturalEngineers, East Lansing, MI.
Cogger, C.G., C.F. Engle, and R.E. Hermanson. 1987. Sewage sludge guidellines forWashington. Part three: Sample problem and worksheet for calculating sludgeapplication rates. Washington State University Cooperative Extension EB1432.
Cook, K.V. 1996. Review of six potato processing facilities in the Columbia Basin,Washington. Washington State Department of Ecology, Water Quality Program,Watershed Management Section Publication WQ-R-95-90.
Gamroth, M.J. 1991. NCALC-A Software Program for Balancing Manure Resource Use.Proceedings of the 1991 Northwest and Lower Columbia Dairy Shortcourses. OregonState and Washington State Universities p. 97-102.
Hermanson, R.E. 1996. Manure sampling for nutrient analysis with worksheets for calculatingfertilizer values. Washington State University Cooperative Extension EB1819.
Hermanson, R.E., A.C.S. Rao, W.L. Pan, K.F. Duncan, and M.A. Wright. 1995. MNB: ManureNutrient Balancer, Version 1.0. Washington State University Cooperative Extension:MCP0026.
Hermanson, R.E., J.A. Moore, and C.F. Engle. 1983. How to Calculate Manure ApplicationRates in the Pacific Northwest. Washington State University Cooperative ExtensionPNW0239.
Jewell, W.J. 1976. Organic assimilation capacities of land treatment systems receivingvegetable processing wastewaters. In 31st Annu. Purdue Univ. Ind. Waste Conf. WestLafayette, Ind. p. 38

R-28
Jewell, W.J., and R.C. Loehr. 1975. Land treatment of food processing wastes. Paper no. 75-2513. Presented at the Winter Meeting of the Am. Soc. of Agric. Eng., Chicago, Ill.Dec. 1975.
Jones, J.L. and R.J. Wagner. 1995. Water-quality assessment of the Central Columbia Plateauin Washington and Idaho -- Analysis of available nutrient and pesticide data for groundwater, 1942-92. U.S. Geological Survey Water-Resources Investigations Report 94-4258.
Kelling, K.A., Walsh, L.M., Keeney, D.R., Ryan, J.A. and A.E. Peterson. 1977. A field study ofagricultural use of sewage sludge: II Effect on soil N and P. J. Environ. Qual. 6:345-352.
Krauss, G.D. and A.L. Page. 1997. Wastewater, sludge and food crops. BioCycle, Feb., p. 74-82.
Liu, D.H.F., B.G. Liptak, and P.A. Bouis. 1997 (2nd ed.). Environmental engineers' handbook.CRC Press LLC, Boca Raton, FL.
Long, F.L., Z. F. Lund, and R.E. Hermanson. 1975. Effect of Soil-Incorporated Dairy CattleManure on Runoff Water Quality and Soil Properties. Journal of Environmental Quality4 (2): 163-166.
Magdoff, F.R. and F.W. Chromec. 1977. Nitrogen mineralization from sewage sludge. J.Environ. Sci. Health A12:191-201.
Magdoff, F.R. and J.F. Amadon. 1980. Nitrogen availability from sewage sludge. J. Environ.Qual. 9:451-455.
Meisinger, J.J. and G.W. Randall. 1991. Estimating Nitrogen Budgets for Soil-Crop Systems.In R.F. Follett, D.R. Keeney, and R.M. Cruse. (eds.), Managing Nitrogen forGroundwater Quality and Farm Profibablity. SSSA, Madison, WI. p. 85-124.
Midwest Plan Service. 1985. Animal Waste Utilization. In T.L. Loudon et al. (eds.), LivestockWaste Facilities Handbook, Midwest Plan Service, Iowa State University, Ames, IA.
Moore, J.A. and M.J. Gamroth. Rev. 1989. Calculating the Fertilizer Value of Manure FromLivestock Operations. Oregon State University Extension Service EC1094.
Palazzo, A.J. 1976. Land application of wastewater: Forage growth and utilization of appliedN, P, and K. In Loehr, R.C. (ed.). Land as a waste management alternative. Proceedingsof the 1976 Cornell Agricultural Waste Management Conference p. 171-180. Ann ArborScience Publichsers Inc., Ann Arbor, MI.
Ritter, W.F. 1987. An overview of factors affecting land application of food processing wastes.In James, L.G. and M.J. English (eds.) Irrigation systems for the 21st century.Conference proceedings p. 521-528. Portland, OR, July 28-30, 1987, ASCE.

R-29
Smith, J.H. 1986. Decomposition of potato processing wastes in soil. Journal of EnvironmentalQuality, Vol. 15, no. 1: 13-16.
Smith, J.H. and J.R. Peterson. 1982. Recycling of nitrogen through land application ofagricultural, food processing, and municipal wastes. In F.J. Stevenson (ed.) Nitrogen inagricultural soils. Agronomy 22: 791-831. American Society of Agronomy.
Smith, J.H., C.W. Robbins, J.A. Bondurant, and C.W. Hayden. 1978. Treatment and disposal ofpotato processing wastewater by irrigation. USDA-SEA, Conserv. Res. Rep. 22: 43.
Smith, J.H. 1976. Treatment of potato processing wastewater on agricultural land. J. Environ.Qual. 5: 113-116.
Smith, J.L. and D. B. McWhorter. 1976. Continuous subsurface injection of liquid organicwastes. In Loehr, R.C. (ed.). Land as a waste management alternative. Proceedings ofthe 1976 Cornell Agricultural Waste Management Conference p. 643-656. Ann ArborScience Publishers Inc., Ann Arbor, MI.
Smith, J.H., C.W. Robbins, J.A. Bondurant, and C.W. Hayden. 1976. In Loehr, R.C. (ed.)Treatment of potato processing wastewater on agricultural land: Water and organicloading, and the fate of applied plant nutrients. Land as a waste management alternative.Proceedings of the 1976 Cornell Agricultural Waste Management Conference p. 769-780.Ann Arbor Science Publishers Inc., Ann Arbor, MI.
Smith, J. H., C.W. Robbins, and C.W. Hayden. 1975. Plant nutrients in potato processingwastewater used for irrigation. p. 159-165. In Proc. 26th Ann. Pacific NorthwestFertilizer Conf., 15-17 July 1975, Salt Lake City, Utah.
Soil Conservation Service, U.S. Department of Agriculture. 1993. Nutrient Management —Organic Nutrients. Interim Washington Standard WA590-3. U.S. Department ofAgriculture.
Soil Conservation Service, U.S. Department of Agriculture. 1992. National EngineeringHandbook, Agricultural Waste Management Field Handbook, Part 651. U.S. Departmentof Agriculture.
Sullivan, D.M. 1998. Fertilizing with biosolids. Oregon State University Extension Service.PNW 0508.
Sullivan, D.M., D.M. Granatstein, C.G. Cogger, C.L. Henry, and K.P. Dorsey. 1993. Draft.Biosolids management guidelines for Washington State. Washington State Departmentof Ecology Publication 93-80.
Thompson, R.B., D. Morse, K.A. Kelling, and L.E. Lanyon. 1997. Computer Programs thatCalculate Manure Application Rates. Journal of Production Agriculture 10:58-69.

R-30
Tunney, H. 1979. Dry Matter, Specific Gravity, and Nutrient Relationships of Cattle and PigSlurry. In J.C. Hawkins (ed.), Engineering Problems with Effluents From Livestock.Proc. C.E.C. Seminar, Cambridge, England Publ. C.E.C. Luxembourg, p. 430-447.
USEPA. 1983. Process design manual for land application of municipal biosolids. EPA-625/1-83-016. EPA, Cincinnati, OH.
2. Section 5
Addiscott, T. M. and D.S. Powlson. 1992. Partitioning losses of nitrogen fertilizer betweenleaching and denitrification. Journal of Agricultural Science, Cambridge (1992),118:101-107.
Altman, S. J. and R.P. Parizek. 1995. Dilution of Nonpoint-Source Nitrate in Groundwater. J.Environ. Qual. 24:707-718.
Ambus, P., and R. Lowrance. 1991. Comparison of denitrification in two riparian soils. SoilSci. Soc. Am. J. 55:994-997.
Andersson, R., T. Kindt, P.O.Johansson, and L. Maxe. 1984. An attempt to reduce nitrate ingroundwater used for municipal water supply by changing agricultural practices. Nord.Hydrol. 15: 185-194.
Apsimon, H.M. and M. Kruse-Plass. 1991. The role of ammonia as an atmospheric pollutant. In:V.C. Nielsen, J.H. Voorburg, and P. L'Hermite (eds.) Odour and Ammonia Emissionsfrom Livestock Farming. Elsevier Science Publishers, Essex, England.
Aschmann, S.G., M.S. McIntosh, J.S. Angle, and R.L. Hill. 1992. Nitrogen movement under ahardwood forest amended with liquid wastewater sludge. Agriculture, Ecosystems andEnvironment. 38: 249-263.
Bergstrom, Lars. 1987. Nitrate leaching and drainage from annual and perennial crops in tile-drained plots and lysimeters. J. Environ. Qual. 16:11-18.
Bergstrom, L. and N. Brink. 1986. Effects of differential applications of fertilizer N on leachinglosses and distribution of inorganic N in the soil. Plant Soil. 93:333-345.
Bock, B.R., and G.W. Hergert. 1991. Fertilizer Nitrogen Management. p. 139-164. In: R. F.Follett, D. R. Keeney, and R. M. Cruse (eds.) Managing Nitrogen for GroundwaterQuality and Farm Profitability. Soil Science Society of America, Inc., Madison, WI.
Cabrera, M.L., S.C. Chiang, W.C. Merka, O.C. Pancorbo, and S.A. Thompson. 1994.Pelletizing and soil water effects on gaseous emissions from surface-applied poultrylitter. Soil Sci. Soc. Am. J. 58:807-811.

R-31
Chaney, K. 1989. Effect of nitrogen fertilizer rate on soil nitrate nitrogen content afterharvesting winter wheat. Journal of Agricultural Science, Cambridge (1990), 114:171-176.
Colbourn, P., M.M. Iqbal, and I.W.Harper. 1984. Estimation of the total gaseous nitrogen lossesfrom clay soils under laboratory and field conditions. Journal of Soil Science. 35: 11-22.
Comfort, S.D., K.A. Kelling, D.R. Keeney, and J.C. Converse. 1990. Nitrous oxide productionfrom injected liquid dairy manure. Soil Sci Soc. Am. J. 54:421-427.
Doran, J.W. 1980. Soil microbial and biochemical changes associated with reduced tillage. SoilSci. Soc. Am. J. 44:765-771.
Egginton, Gwen M. and K.A. Smith. 1986. Losses of nitrogen by denitrification from a grasslandsoil fertilized with cattle slurry and calcium nitrate. Journal of Soil Science. 37:69-80.
Estavillo, J. M., M. Rodriguez, and C. Gonalez-Murua. 1996. Nitrogen losses by denitrificationand leaching in grassland. The effect of cow slurry application. Fert. Res. 43: 197-201.
Fillery, I. R. P. 1983. p.33-64. In: J. R. Freney and J. R. Simpson (eds.) Gaseous Loss ofNitrogen from Plant-Soil Systems. The Hague: Martinus Nijhoff/Dr W. Junk Publishers.
Firestone, M. K. (1982). Biological Denitrification. p.289-326, In: F. J. Stevenson (ed.)Nitrogen in Agricultural Soils. American Society of Agronomy, Madison, WI.
Fox, R.H. and W.P. Piekielek. 1983. Response of corn to nitrogen fertilizer and the predictionof soil nitrogen availability with chemical test in Pennsylvania. Pennsylvania Agric. Exp.Stn. Bull. 843.
Francis, G.S., R.J. Haynes, and P.H. Williams. 1994. Nitrogen mineralization, nitrate leachingand crop growth after ploughing-in leguminous and non-leguminous grain crop residues.Journal of Agricultural Science, Cambridge (1994). 123, 81-87. Cambridge UniversityPress.
Gaines, T.P. and S.T. Gaines. 1994. Soil texture effect on nitrate leaching in soil percolates.Commun. Soil Sci. Plant anal. 25(13 & 14): 2561-2570.
Gilliam, J.W. and G.D. Hoyt. 1987. Effect of Conservation Tillage on Fate and Transport ofNitrogen. p. 217-240. In: T.L. Logan et al. (ed.) Effects of Conservation Tillage onGroundwater Quality: Nitrates and Pesticides. Lewis Publishers, Inc. Chelsea, Michigan.
Glendining, M.J., D.S. Powlson, P.R. Poulton, N.J.Bradbury, D. Palazzo, and X. Li. 1996. Theeffects of long-term applications of inorganic nitrogen fertilizer on soil nitrogen in theBroadbalk Wheat Experiment. Journal of Agricultural Science, Cambridge (1996). 127,347-363. Cambridge University Press.

R-32
Goulding, K. W. T. and C. P. Webster. 1989. Denitrification Losses of Nitrogen from ArableSoils as Affected by Old and New Organic Matter from Leys and Farmyard Manure.p.225-234. In: J. A. Hansen and K. Henriksen (eds.) Nitrogen in Organic Wastes Appliedto Soils. Academic Press Inc., San Diego, CA.
Goulding, K. W. T., C. P. Webster, D.S. Powlson, and P.R. Poulton. 1993. Denitrification lossesof nitrogen fertilizer applied to winter wheat following ley and arable rotations asestimated by acetylene inhibition and 15N balance. Journal of Soil Science. 44:63-72.
Groffman, P.M., A.J. Gold, and R.C. Simmons. 1992. Nitrate dynamics in riparian Forests:Microbial studies. J. Environ. Qual. 21:666-671.
Hart, P.B.S., D.S. Powlson, P.R. Poulton, A.E. Johnston, and D.S. Jenkinson. 1993. Theavailability of the nitrogen in the crop residues of winter wheat to subsequent crops.Journal of Agricultural Science, Cambridge (1993). 121, 355-362. Cambridge UniversityPress.
Haycock, N.E. and T.P. Burt. 1993. Role of floodplain sediments in reducing the nitrateconcentration of subsurface run-off: A case study in the Cotswolds. UK. Hydrol. Proc.7:287-295.
Hill, A.R. 1986. Nitrate and chloride distribution and balance under continuous potatocropping. Agriculture, Ecosystems and Environment. 15: 267-280.
Jacobson, S. N. and M. Alexander. 1980. Nitrate loss from soil in relation to temperature,carbon source, and denitrifier populations. Soil Biology and Biochemistry. 12:501-505.
Jansson, P.-E., R. Singh Antil, and G. Ch. Borg. 1989. Simulation of Nitrate Leaching fromArable Soils Treated with Manure. p. 150-166. . In: Jens AA. Hansen and KajHenriksen (eds.) Nitrogen in Organic Wastes Applied to Soils. Academic Press.,London.
Jarvis, S. C., M. Sherwood. and J.H.A.M. Steenvoorden. 1987. Nitrogen Losses from AnimalManures: from Grazed Pastures and from Applied Slurry. p.195-212. In: H. G. v.d.Meer, et al. (eds) Animal Manure on Grassland and Fodder Crops. Martinus NijhoffPublishers, Dodrecht, Netherlands.
Jemison, John M. Jr., and Richard H. Fox. 1994. Nitrate leaching from nitrogen-fertilized andmanured corn measured with zero-tension pan lysimeters. J. Environ. Qual. 23:337-343.
Jokela, William E. 1992. Nitrogen Fertilizer and Dairy Manure Effects on Corn Yield and SoilNitrate. Soil Sci. Soc. Am. J. 56: 148-154.
Jokela, W.E. and G.W. Randall. 1989. Corn yield and residual soil nitrate as affected by timeand rate of nitrogen application. Agron. J. 81:720-726.

R-33
Jones, M.B., J.E.Street, and W.A. Williams. 1974. Leaching and uptake of nitrogen applied toannual grass and clover-grass mixtures in lysimeters. Agronomy Journal. 66:March/April 1974, 256-258.
Kanwar, R.S., J.L.Baker, and J.M. Laflen. 1985. Nitrate movement through the soil profile inrelation to tillage system and fertilizer application method. Transactions of the ASAE.26(6):November-December 1985, 1802-1807.
Kimble, J. M., R. J. Bartlett, J. L. McIntosh, and K.E. Varney. 1972. Fate of nitrate frommanure and inorganic nitrogen in a clay soil cropped to continuous corn. J. Environ.Quality. 1:413-415.
Kolenbrander, G.J. 1981. Leaching of Nitrogen in Agriculture. In: J.C. Brogan (ed.) NitrogenLosses and Surface Runoff from Landspreading of Manures. Martinus Nijhoff/Dr. JunkPublishers. The Hague.
Kolenbrander, G.J. 1969. Nitrate content and nitrogen loss in drainwater. Neth. J. Agric. Sci.17: 246-255.
Lamb, J.A., G.A. Peterson, and C.R. Fenster. 1985. Fallow Nitrate Accumulation in a Wheat-fallow Rotation as Affected by Tillage System. Soil Sci. Soc. Am. J. 49: 1441-1446.
Letey, J., J.M. Blair, D. Devitt, L.J. Lund, and P. Nash. 1977. Nitrate-nitrogen in effluent fromagricultural tile drains in California. Hilgardia. 45:289-319.
Logan, T.J., G.W. Randall, and D.R. Timmons. 1980. Nutrient content of the tile drainage fromcropland in the North Central Region. NC Regional Publ. 268. Res. Bull. 1119.OARDC, Wooster, OH.
Loro, P.J., D.W. Bergstrom, and E.G. Beauchamp. 1997. Intensity and duration ofdenitrification following application of manure and fertilizer to soil. J. Environ. Qual.26:706-713.
Lowrance, R. 1992a. Groundwater nitrate and denitrification in a Coastal Plain riparian forest.J. Environ. Qual. 21:401-405.
Lowrance, R. 1992b. Nitrogen outputs from a field-size agricultural watershed. J. Environ.Qual. 21:602-607.
Maag, M. 1989. Denitrification Losses from Soil Receiving Pig Slurry or Fertilizer. p.235-246.In: J. A. Hansen and K. Henriksen (eds.) Nitrogen in Organic Wastes Applied to Soils.Academic Press Inc., San Diego, CA
MacDonald, Andrew J., David S. Powlson. Paul R. Poulton, and David S. Jenkinson. 1989.Unused fertilizer nitrogen in arable soils—its contribution to nitrate leaching. J. Sci.Food Agric. 46:407-419.

R-34
MacLean, A.J. 1977. Movement of nitrate with different cropping systems in two soils. Can J.Soil Sci. 57:27-33.
Maddux, L.D., C.W. Raczkowski, D.E. Kissel, and P.L. Barnes. 1991. Broadcast andsubsurface-banded urea nitrogen in urea ammonium nitrate appied to corn. Soil Sci. Soc.Am. J. 55:264-267.
Magdoff, F.R. 1991. Understanding the Magdoff pre-sidedress nitrate test for corn. J. Prod.Agric. 4:297-305.
Martin, E.C., T.L. Loudon, J.T. Ritchie, and A. Werner. 1994. Use of drainage lysimeters toevaluate nitrogen and irrigation management strategies to minimize nitrate leaching inmaize production. Transactions of the ASAE. 37(1):79-83.
McCracken, Daniel V., M. Scott Smith, John H. Grove, Charles T. McKown, and Robert L.Blevins. 1994. Nitrate leaching as influenced by cover cropping and nitrogen source.Soil Sci. Soc. Am. J. 58: 1476-1483.
Medalie, L., W.B. Bowden, and C.T. Smith. 1994. Nitrogen leaching following land applicationof aerobically digested municipal sewage sludge in a northern hardwood forest. J.Environ, Qual. 23:130-138.
Meisinger, J. J. and G. W. Randall. 1991. Estimating Nitrogen Budgets for Soil-Crop Systems.p.85-124. In: R. F. Follett, D. R. Keeney, and R. M. Cruse (eds.) Managing Nitrogen forGroundwater Quality and Farm Profitability. Soil Science Society of America, Inc.,Madison, WI.
Mosier, A. R., W.D. Guenzi, and E.E. Xchweizer. 1986. Soil Losses of Dinitrogen and NitrousOxide from Irrigated Crops in Northeastern Colorado. Soil Science Society of AmericaJournal. 50:344-348.
Olson. R.V. 1982. Immobilization, nitrification, and losses of fall-applied, labeled ammonium-nitrogen during growth of winter wheat. Agronomy Journal. 74: 991-995.
Owens, L.B. 1990. Nitrate-nitrogen concentrations in percolate from lysimeters planted to alegume-grass mixture. J. Environ. Qual. 19:131-135.
Pain, B.F., and R.B. Thompson. 1989. Ammonia Volitilization from Livestock Slurries Appliedto Land. p. 202-211. In: J. A. Hansen and K. Henriksen (eds.) Nitrogen in OrganicWastes Applied to Soils. Academic Press Inc., San Diego, CA.
Pang, X.P., J. Letey, and L. Wu. 1997. Irrigation quantity and uniformity and nitrogenapplication effects on crop yield and nitrogen leaching. Soil Sci. Soc. Am J. 61:257-261.
Peralta, J.M., C.O. Stockle, K.E. Saxton, and L.G. King. 1997. Nitrogen form an irrigated croprotation available for contaminating ground water: A long-term simulation study.Proceedings of the Conference on Best Management Practices for Irrigated Agriculture

R-35
and the Environment. U.S. Committee on Irrigation and Drainage and Bureau ofReclamation. Fargo, North Dakota, July 16-19, 1997.
Peterson, G.A., and J.F. Power. 1991. Soil, Crop, and Water Management. p. 189-198. In:R.F. Follett, D.R. Keeney, and R.M. Cruse (eds.) Managing Nitrogen for GroundwaterQuality and Farm Profitability. Soil Sci. Soc. Am. Madison, WI.
Postma, D., C. Boesen, H. Kristiansen, and F. Larsen. 1991. Nitrate reduction in an unconfinedsandy aquifer: Water chemistry, reduction processes, and geochemical modeling. WaterResour. Res. 27:2027-2045.
Powlson, D.S., P.R. Poulton, T.M. Addiscott, and D.S.McCann. 1989. Leaching of Nitrate fromSoils Receiving Organic or Inorganic Fertilizers Continuously for 135 Years. p. 334-345.In: Jens AA. Hansen and Kaj Henriksen (eds.) Nitrogen in Organic Wastes Applied toSoils. Academic Press, London.
Pratt, P.F. 1984. Nitrogen use and nitrate leaching in irrigated agriculture. p. 319-333. In: R.D.Hauck (ed.) Nitrogen in Crop Production. Am. Soc. Agron., Madison, WI.
Pratt, P.F. 1979. Integration, discussion, and conclusions. p. 719-769. In: Final Report to theNatl. Sci. Found. For nitrate in effluents from irrigated lands. Univ. of California,Riverside.
Randall, G.W., and T.K. Iragavarapu. 1995. Impact of long-term tillage systems for continouscorn on nitrate leaching to tile drainage. J. Environ. Qual. 24:360-366.
Rijtema, P.E. 1978. Een benadering voor de stikstofemissie uit het graslandbedrijf. Note 982.(gewijzigd), Inst. Cultuurtechniek en Waterhuishouding, Wageningen.
Robbins, C.W. and D.L. Carter. 1980. Nitrate-nitrogen leached below the root zone during andfollowing alfalfa. J. Environ. Qual. 9(3):447-450.
Rolston, D.E., D.L. Hoffman, and D.W. Toy. 1978. Field measurement of denitrification: I.Flux of N2 and N2O. Soil Sci. Soc. Am. J. 42:863-869.
Roth, G.W. and R.H. Fox. 1990. Soil nitrate accumulation following nitrogen-fertilized corn inPennsylvania. J. Environ. Qual. 19:243-248.
Ryden, J. C. 1983. Denitrification loss from a grassland soil in the field receiving different ratesof nitrogen as ammonium nitrate. Journal of Soil Science. 34:355-365.
Ryden, J. C. and L. J. Lund. 1980. Nitrous Oxide Evolution from Irrigated Land. Journal ofEnvironmental Quality. 9:387-393.
Ryker, S.J. and J.L. Jones. 1995. Nitrate concentrations in ground water of the Central ColumbiaPlateau. U.S. Geological Survey Open-File Report 95-445.

R-36
Saint-Fort, R., J.S. Schepers, and R.F Spaulding. 1991. Potentially mineralizable nitrogen andnitrate leaching under different land-use conditions in western Nebraska. J. Environ. Sci.Health. A26(3), 335-345.
Saint-Fort, R., R.M. Raina, and B. Prescott. 1995. Subsurface environmental quality under acattle feedlot and adjacent cropfield. J. Environ. Sci. Health. A30(3), 637-650.
Sawyer, J. E., M.A. Schmitt, R.G. Hoeft, J.C. Siemens and D.H. Vanderholm. 1991. Cornproduction associated with liquid beef manure application methods. J. Prod. Agric.3:335-344.
Scheppers, J.S., and R.H.Fox. 1989. Estimation of N Budgets for Crops. p. 221-246. In: R.F.Follett (ed.) Nitrogen Management and Ground Water Protection. Elsevier SciencePublishers, Inc. Amsterdam.
Schipper, Louis A., J.C. Williamson, H.A. Kettles, and T.W. Speir. 1996. Impact of land-applied tertiary-treated effluent on soil biochemical properties. Journal of EnvironmentalQuality. 25: 1073-1077.
Schroder, J.J., L. ten Holte, H. van Keulen, and J.H.A.M. Steenvoorden. 1993. Effects ofnitrification inhibitors and time and rate of slurry and fertilizer N application on silagemaize yield and losses to the environment. Fertlizer Research. 34: 267-277.
Schroder, J.J., W.J.M. de Groot, and W. van Dijk. 1992. Nitrogen losses from continuous maizeas affected by cover crops. In: J.R. Archer et al. (eds.) Nitrate and Farming Systems,Aspects of Applied Biology. 30:317-326.
Sidle, R.C. and L.T. Kardos. 1979. Nitrate leaching in a sludge-treated forest soil. Soil Sci.Soc. Am. J. 43:278-282.
Sieling, K., O. Gunther-Borstel, and H. Hanus. 1996. Effect of slurry application and mineralnitrogen fertilization on N leaching in different crop combinations. Journal ofAgricultural Science, Cambridge (1997). 128,79-87. Cambridge University Press.
Sims, J. Thomas, Bruce L. Vasilas, Karen L. Gartley, Bill Milliken, and V. Green. 1995.Evaluation of soil and plant nitrogen tests for maize on manured soils of the Atlanticcoastal plain. Agron. J. 87:213-222.
Sims, J. Thomas. 1987. Agronomic evaluation of poultry manure as a nitrogen source forconventional and no-tillage corn. Agron. J. 79:563-570.
Smith, J.H. 1976. Treatment of Potato Processing Waste Water on Agricultural Land. J. Environ.Qual. 5:113-116.
Smith. S. J., A.N. Sharpley, J.W. Naney, W.A. Berg, and O.R. Jones. 1991. Water qualityimpacts associated with wheat culture in the southern plains. J. Environ. Qual. 20:244-249.

R-37
Staricka, J.A. G.R. Benoit, A.E. Olness, J.A. Daniel,and D.R. Huggins. 1994. Movement offall-applied nitrogen during winter in western Minnesota. p. 105-112. In:Environmentally Sound Agriculture. Proc. 2nd conference. Am. Soc. Of Agric.Engineers.
Taylor, H. and H. Vroomen. 1989. Timing of Fertilizer Applications. p. 40-45 In: AgriculturalResources Inputs: Situation and Outlook. U.S. Dept. of Agric. Economic ResearchService. AR-15. August 1989.
Thompson, R.B. and B.F. Pain. 1989. Denitrification from Cattle Slurry Applied to Grassland.p.247-260. In: J. A. Hansen and K. Henriksen (eds.) Nitrogen in Organic Wastes Appliedto Soils. Academic Press Inc., San Diego, CA.
Tindall, James A., Robin L. Petrusak, and Peter B. McMahon. 1995. Nitrate transport andtransformation processes in unsaturated porous media. Journal of Hydrology. 169: 51-94.
Van Den Abbeel, R. A. Claes, and K. Vlassak. 1989. Gaseous Nitrogen Losses from Slurry-Manured Land. p.213-224. In: J. A. Hansen and K. Henriksen (eds.) Nitrogen inOrganic Wastes Applied to Soils. Academic Press Inc., San Diego, CA.
Vetter, H., and G. Steffens. 1981. Surface Runoff. p. 84-86. In: J.C. Brogan (ed.) NitrogenLosses and Surface Runoff from Landspreading of Manures. Martinus Nijhoff/Dr. JunkPublishers. The Hague.
Williams, J.R., and D.E. Kissel. 1991. Water Percolation: An Indicator of Nitrogen-LeachingPotential. p. 59-83. In: R. F. Follett, D. R. Keeney, and R. M. Cruse (eds.) ManagingNitrogen for Groundwater Quality and Farm Profitability. Soil Science Society ofAmerica, Inc., Madison, WI.
Section 6
Addiscott, T. M. and D.S. Powlson. 1992. Partitioning losses of nitrogen fertilizer betweenleaching and denitrification. Journal of Agricultural Science, Cambridge (1992),118:101-107.
Adriano, D.C., P.F. Pratt, and F.H. Takatori. 1972. Nitrate in unsaturated zone of an alluvialsoil in relation to fertilizer nitrogen rate and irrigation level. J. Environ. Qual. 1:418-422.
Alcoz, Mercedes M., Frank M. Hons, and Vincent A. Haby. 1993. Nitrogen Fertilizer TimingEffect on Wheat Production, Nitrogen Uptake Efficiency, and Residual Soil Nitrogen.Agron. J. 85:1198-1203.
Bartholomew, W.V. 1965. Mineralization and immobilization of nitrogen in the decompositionof plant and animal residues. In: W.V. Bartholomew and F.E. Clark (eds.) Soilnitrogen. Agronomy. 10:285-306. Amer. Soc. of Agron., Madison, WI.

R-38
Boawn, L.C., J.L. Nelson, and C.L. Crawford. 1963. Residual nitrogen from NH4NO3 fertilizerand from alfalfa plowed under. Agron. J. 55:231-235.
Bristow, A.W., J.C. Ryden, and D.C.Whitehead. 1987. The fate at several time intervals of15N-labelled ammonimum nitrate applied to an established grass sward. Journal of SoilScience. 38:245-254.
Bundy, L.G., and E.S. Malone. 1988. Effect of residual profile nitrate on corn response toapplied nitrogen. Soil Sci. Soc. Am. J. 52:1377-1383.
Chaney, K. 1989. Effect of nitrogen fertilizer rate on soil nitrate nitrogen content afterharvesting winter wheat. Journal of Agricultural Science, Cambridge (1990), 114:171-176.
Chang, C. and T. Entz. 1996. Nitrogen leaching losses under repeated cattle feedlot manureapplications in southern Alberta. J. Environ. Qual. 25:145-153.
Chichester, F.W. 1977. Effects of increased fertilizer rates on nitrogen content of runoff andpercolate from monolith lysimeters. J. Environ. Qual. 6:211-217.
Cook, K.V. 1996. Review of six potato processing facilities in the Columbia Basin,Washington. Washington State Department of Ecology, Water Quality Program,Watershed Management Section Publication WQ-R-95-90.
Davies, D.B., and R. Sylvester-Bradley. 1995. The contribution of fertiliser nitrogen toleachable nitrogen in the UK: a review. J. Sci. food Agric. 68: m399-406.
Egginton, Gwen M. and K.A. Smith. 1986. Losses of nitrogen by denitrification from a grasslandsoil fertilized with cattle slurry and calcium nitrate. Journal of Soil Science. 37:69-80.
Francis, G.S., R.J. Haynes, and P.H. Williams. 1994. Nitrogen mineralization, nitrate leachingand crop growth after ploughing-in leguminous and non-leguminous grain crop residues.Journal of Agricultural Science, Cambridge (1994). 123, 81-87. Cambridge UniversityPress.
Gast, R.G., W.W. Nelson, and J.M. MacGregor. 1974. Nitrate and chloride accumulation anddistribution in fertilized tile-drained soils. J. Environ. Qual. 3(3): 209-213.
Goss, M.J., P. Colbourn, G.L. Harris, and K.R. Howse. 1988. Leaching of Nitrogen underAutumn-Sown Crops and Effects of Tillage. p. 269-282. In: D.S. Jenkinson and K.A.Smith (eds.) Nitrogen Efficency in Agricultural Soils. Chichester: Elsevier.
Hahne, H.C.H., W. Kroontje, and J.A. Lutz, Jr. 1977. Nitrogen fertilization: I. Nitrateaccumulation and losses under continuous corn cropping. Soil Sci. Soc. Am. J. 41:562-567.
Harris, G.L., M.J. Goss, R.J. Dowdell, K.R. Howse, and P. Morgan. 1984. A study of moledrainage on a clay soil. Journal of Agricultural Science (Cambridge). 102:561-581.

R-39
Hergert, G.W. 1986. Nitrate leaching through sandy soil as affected by sprinkler irrigationmanagement. J. Environ. Qual. 15:272-278.
Hermanson, R.E., A.C.S. Rao, W.L. Pan, K.F. Duncan, and M.A. Wright. 1995. MNB: Manurenutrient balancer, version 1.0. Washington State University Cooperative Extension:MCP0026.
Herron, G.M., G.L. Terman, A.F. Dreier, and R.A. Olson. 1968. Residual nitrate nitrogen infertilized deep loess-derived soils. Agron. J. 60:477-482.
Hubbard, R. K., L.E. Asmussen, and H.D. Allison. 1984. Shallow groundwater quality beneathan intensive multiple-cropping system using center pivot irrigation. J. Environ. Qual.13:156-161.
Isfan D., J. Zizka, A.D’Avignon, and M. Deschenes. 1995. Relations between nitrogen rate,plant nitrogen concentration, yield and residual soil nitrate-nitrogen in silage corn.Commun. Soil Sci. Plant Anal. 26 (15 & 16), 2531-2557.
James, D.W. 1975. Nitrogen fertilizer use efficiency. p. 75-84. In: Proc. 26th Annu. FertilizerConf. Northwest Plant Food Assoc., Salt Lake city, Utah.
Jarvis, S. C., M. Sherwood. and J.H.A.M. Steenvoorden. 1987. Nitrogen Losses from AnimalManures: from Grazed Pastures and from Applied Slurry. p.195-212. In: H. G. v.d.Meer, et al. (eds) Animal Manure on Grasslad and Fodder Crops. Martinus NijhoffPublishers, Dodrecht, Netherlands.
Jemison, John M. Jr., and Richard H. Fox. 1994. Nitrate leaching from nitrogen-fertilized andmanured corn measured with zero-tension pan lysimeters. J. Environ. Qual. 23:337-343.
Johnson, G.V. and W.R.Raun. 1995. Nitrate leaching in continuous winter wheat: use of a soil-plant buffering concept to account for fertilizer nitrogen. J. Prod. Agric. 8: 486-491.
Johnston, A.E., S.P. McGrath, P.R. Poulton, and P.W. Lane. 1989. Accumulation and Loss ofNitrogen from Manure, Sludge, and Compost: Long-term Experiments at Rothamsted andWoburn. p.126-139. In: Jens AA. Hansen and Kaj Henriksen (eds.) Nitrogen in OrganicWastes Applied to Soils. Academic Press., London.
Jokela, W.E. and G.W. Randall. 1989. Corn yield and residual soil nitrate as affected by timeand rate of nitrogen application. Agron. J. 81:720-726.
Jolley, V.D., and W.H. Pierre. 1977. Profile accumulations of fertilizer-dreived nitrate and totalnitrogen recovery in two long-term nitrogen rate experiments with corn. Soil Sci. Soc.Am. J. 41: 373-378.
Keeney, D. R. 1986. Nitrate in Ground Water - Agricultural Contribution and Control. pp.329-351. In: Proceedings - Conference on Agricultural Impacts on Ground Water. Omaha,NE. 11-13 Aug. National Water Well Assoc., Dublin, OH.

R-40
Lerch, R.N., K.A. Barbarick, D.G. Westfall, R.H. Follett, T.M. McBride, and M.F. Owen. 1990.J. Prod. Agric. 3:66-71.
Liang, B.C., M. Remillard, and A.F. MacKenzie. 1991. Influence of fertilizer, irrigation, andnon-growing season precipitation on soil nitrate-nitrogen under corn. J. Environ. Quality.20:123-128.
Linville, K.W. and G.E. Smith. 1971. Nitrate content of soil cores from corn plots after repeatednitrogen fertilization. Soil Sci. 112:249-255.
MacGregor, J.M., G.R. Blake, and S.D. Evans. 1974. Mineral nitrogen movement into subsoilsfollowing continued annual fertilization for corn. Soil Sci. Soc. Am. Proc. 38:110-113.
Martin, D.L., D.G. Watts, L.N. Mielke, K.D. Frank, and D.E. Eisenhauer. 1982. Evaluation ofnitrogen and irrigation management for maize production using water high in nitrate.Soil Sci. Soc. Am. J. 46: 1056-1062.
Meisinger, J. J., T.H. Carski, M.A. Nys, and V.A. Bandel. 1982. Residual nitrae nitrogen inMaryland. p. 215. In: Agronomy Abstracts. ASA, Madison, WI.
Nelson, W.W., and J.M. MacGregor. 1973. Twelve years of continuous corn fertilization withammonium nitrate or urea nitrogen. Soil Sci Sco. Am. Proc. 37:583-586.
Olsen, R.J., R.F. Hensler, O.J. Attoe, S.A. Witzel, and L.A. Peterson. 1970. Fertilizer nitrogenand crop rotation in relation to movement of nitrate nitrogen through soil profiles. SoilSci. Soc Amer. Proc., Vol. 34: 448-452.
Olson. R.V. 1980. Fate of Tagged Nitrogen Fertilizer Applied to Irrigated Corn. Soil Sci. Soc.Am. J. 44: 514-517.
Power, J. F. and F. E. Broadbent. 1989. Proper Accounting for N in Cropping Systems. p.159-181. In: R. F. Follett (ed.) Nitrogen Management and Ground Water Protection. ElsevierScience Publishing Co. Inc., New York, NY.
Powlson, D.S., P.R. Poulton, T.M. Addiscott, and D.S.McCann. 1989. Leaching of Nitrate fromSoils Receiving Organic or Inorganic Fertilizers Continuously for 135 Years. p. 334-345.In: Jens Aa. Hansen and Kaj Henriksen (eds.) Nitrogen in Organic Wastes Applied toSoils. Academic Press, London.
Pratt, P.F. 1984. Nitrogen use and nitrate leaching in irrigated agriculture. p. 319-333. In: R.D.Hauck (ed.) Nitrogen in Crop Production. Am. Soc. Agron., Madison, WI.
Randall, G. 1985. Nitrogen movement. p. 139-152. In: Summarized Proceedings of the PlantNutrient Use and the Environment Symp., Oct. 1985, Kansas city, MO. The FertilizerInstitute, Washington, D.C.
Raun, W.R., and G.V. Johnson. 1995. Soil-plant buffering of inorganic nitrogen in continuouswinter wheat. Agron. J. 87:827-834.

R-41
Robbins, C.W. and D.L. Carter. 1980. Nitrate-nitrogen leached below the root zone during andfollowing alfalfa. J. Environ. Qual. 9(3):447-450.
Roth, G.W. and R.H. Fox. 1990. Soil nitrate accumulation following nitrogen-fertilized corn inPennsylvania. J. Environ. Qual. 19:243-248.
Ryker, S.J. and J.L. Jones. 1995. Nitrate concentrations in ground water of the Central ColumbiaPlateau. U.S. Geological Survey Open-File Report 95-445.
Schepers, J.S., and A.R. Mosier. 1991. Accounting for Nitrogen in Nonequilibrium Soil-Cropsystems. p. 125-138. In: R.F. Follett et al. (eds.) Managing Nitrogen for GroundwaterQuality and Farm Profitability. Soil Science Society of America, Inc., Madison, WI.
Schroder, J.J., L. ten Holte, H. van Keulen, and J.H.A.M. Steenvoorden. 1993. Effects ofnitrification inhibitors and time and rate of slurry and fertilizer N application on silagemaize yield and losses to the environment. Fertlizer Research. 34: 267-277.
Shipley, P.R., J.J. Meisinger, and A. M. Decker. 1992. Conserving residual corn fertilizernitrogen with winter cover crops. Agron, J. 84: 869-876.
Smith, J.H., C.W. Robbins, and C.W. Hayden. 1975. Plant nutrients in potato processingwastewater used for irrigation. In: Proc. 26th Ann. Pacific Northwest Fertilizer Conf., 15-17 July 1975, Salt Lake City, Utah. P. 159-165.
Smith, J.H. and J.R. Peterson. 1982. Recycling of nitrogen through land application ofagricultural, food processing, and municipal wastes. In F.J. Stevenson (ed.) Nitrogen inagricultural soils. Agronomy 22: 791-831. American Society of Agronomy.
Spallacci, P. 1979. Effects of land spreading of large amounts of livestock excreta on crop yieldand crop and water quality. Report EC-Meeting, Oldenburg, Bad Zwischenahn.
Spalding, R.F., M.E. Exner, G.E. Martin, D.D. Snow. 1993. Effects of sludge disposal ongroundwater nitrate concentrations. Journal of Hydrology. 142:213-228.
Stanford, G. 1973. Rationale for optimum nitrogen fertilization in corn production. J. Environ.Qual. 2:159-166.
Timm, H., N.B. Akesson, M.O. O’Brien, W.J. Flocker, and G. York. 1976. Soil and cropresponse to variable loading of canning wastes. Technical Paper, American Soc. OfAgric. Engineers, 1976 Annual Meeting, Davis, CA.
Timmons, D.R. and A.S. Dylla. 1981. Nitrogen leaching as influenced by nitrogen managementand supplemental irrigation level. J. Environ. Qual. 10: 421-426.
Van Der Ploeg, R.R., H. Ringe, and Galina Machulla. 1995. Late fall site-specific soil nitrateupper limits for groundwater protection purposes. J. Environ. Qual. 24:725-733.

R-42
Vetter, H., and G. Steffens. 1981. Surface Runoff. p. 84-86. In: J.C. Brogan (ed.) NitrogenLosses and Surface Runoff from Landspreading of Manures. Martinus Nijhoff/Dr. JunkPublishers. The Hague.
Vinten, A.J.A., B.J. Vivian, F. Wright, and R.S. Howard. 1994. A comparative study of nitrateleaching from soils of differing textures under similar climatic and cropping conditions.Journal of Hydrology. 159: 197-213.
Walters, D.T., and G.L. Malzer. 1990. Nitrogen management and nitrification inhibitor effectson nitrogen-15 urea: II. Nitrogen leaching and balance. Soil Sci. Soc. Am. J. 54: 122-130.
Watts, D.G. 1977. Nitrogen loss for the soil and its relationship to irrigation management. In:PE Fischbach (ed.) Protection of a unique ecological area through improved water andfertility. Tech. Comp. Tep. B-024-NEB. Nebraska Water Resour. Center, Lincoln, NE.
Watts, Darrell G., and Derrel L. Martin. 1981. Effects of water and nitrogen management onnitrate leaching loss from sands. Transactions of the ASAE. p. 911-916.
Watts, D.G., G.W. Hergert, and J.T. Nichols. 1991. Nitrogen leaching losses from irrigatedorchardgrass on sandy soils. J. Environ. Qual. 20:355-362.
Westfall, D.G., J.L. Havlin, G.W. Hergert, and W.R. Raun. 1996. Nitrogen management indryland cropping systems. J. Prod. Agric. 9: 192-199.
Section 7
Baker, J.L. and H.P. Johnson. 1981. Nitrate-nitrogen in tile drainage as affected by fertilization.J. Environ. Qual. 10:519-522.
Baker, J.L., K.K. Campbell, H.P. Johnson, and J.J. Hanway. 1975. Nitrate, phosphorus, andsulfate in subsurface drainage water. J. Environ. Qual. 4:406-412.
Bouwer, Herman. 1989. Linkages with Ground Water. p. 363-372. In: R.F. Follett (ed.)Nitrogen Management and Ground Water Protection. Elsevier Science Publishers,Amsterdam.
Brown, L.C., J.L.Nelson, C.L. Crawford. 1963. Residual nitrogen from NH4NO3 fertilizer andfrom alfalfa plowed under. Agron. J. 55: 231-235.
Daliparthy, Jayaram, Stephen J. Herbert, and Peter L.M. Veneman. 1994. Dairy manureapplications to alfalfa: crop response, soil nitrate, and nitrate in soil water. Agron. J.86:927-933.
Drury, C.F., D.J. McKenney, W.I. Findlay, and J.D.Gaynor. 1993. Influence of tillage on nitrateloss in subsurface runoff and tile drainage. Soil Sci. Soc. Am. J. 57:797-802.
Freeze, R.A. and J.A. Cherry. 1979. Groundwater. Prentice-Hall, Englewood Cliffs, N.J.
R-43
Kladivko, E.J., G.E. Van Scoyoc, E.J. Monke, K.M. Oates, and W. Pask. 1991. Pseticide andnutrient movement into subsurface tile drains on a silt loam soil in Indiana. J. Environ.Qual. 20:264-270.
Lowrance, R.R. and H.B. Pionke. 1989. Transformation and Movement of Nitrate in AquiferSystems. p. 374-392. In: R.F. Follett (ed.) Nitrogen Management and Ground WaterProtection. Elsevier Science Publishers, Amsterdam.
Madison, R.J. and J.O. Brunett. 1985. Overview of the occurrence of nitrate in ground water ofthe United States. p. 93-105. In: U.S.G.S. National Water Summary. U.S. Geol. Surv.Water-Supply Paper 2275.
Magette, W.L., J.D. Wood, and T.H. Ifft. 1990. Nitrate in shallow ground water. ASAE. Pap.90-2502. A. Soc. of Agric. Engr., St. Joseph, MI.
Mathers, A.C., B.A. Stewart, and B. Blair. 1975. Nitrate nitrogen removal from soil profiles byalfalfa. J. Environ. Qual. 4:403-405.
Olsen, R.J., R.F. Hensler, O.J. Attoe, S.A. Witzel, and L.A. Peterson. 1970. Fertilizer nitrogenand crop rotation in relation to movement of nitrate nitrogen through soil profiles. p.448-452. In: Soil Sci. Soc Amer. Proc., Vol. 34.
Pionke, H.B. and R.R. Lowrance. 1991. Fate of Nitrogen in Subsurface Drainage Waters. p.237-258. In: R. F. Follett, D. R. Keeney, and R. M. Cruse (eds.) Managing Nitrogen forGroundwater Quality and Farm Profitability. Soil Science Society of America, Inc.,Madison, WI.
Pratt, P.F., G.H. Cannell, M.J. Garber, and F.L. Blair. 1967. Effects of three nitrogen fertilizerson gains, losses, and distribution of various elements in irrigated lysimeters. Hilgardia38:265-283.
Saint-Fort, R., J.S. Schepers, and R.F Spaulding. 1991. Potentially mineralizable nitrogen andnitrate leaching under different land-use conditions in western Nebraska. J. Environ. Sci.Health. A26(3), 335-345.
Schertz, D.L. and D.A. Miller. 1972. Nitrate N. accumulation in the soil profile under alfalfa.Agron. J. 64:660-664.
Schuman, G.E. and L. F. Elliott. 1978. Cropping an abandoned feedlot to prevent deeppercolation of nitrate-nitrogen. Soil Sci. 126:237-243.
Schuman, G.E., T.M. McCalla, K.E. Saxton, and H.T. Knox. 1975. Nitrate movement and itsdistribution in the soil profile of differentially fertilized corn watersheds. Soil Sci. Soc.Am. Proc. 39:1192-1197.
Sims. J.T. 1987. Agronomic evaluation of poultry manure as a nitrogen source for conventionaland no-tillage corn. Agron. J. 79:397-401.

R-44
Southwick, L.M., G.H. Willis, D.C. Johnson, and H.M. Selim. 1995. Leaching of nitrate,atrazine, and metribuzin from sugarcane in southern Louisiana. J. Environ. Qual.24:684-690.
Stewart, B.A., F.G. Viets, and L. Hutchinson. 1968. Agriculture’s effect on nitrate pollution ofground water. J. of Soil and Water conservation. 21:13-15.
W. Walther. 1989. The Nitrate Leaching Out of Soils and their Significance for Groundwater,Results of Long-term Tests. p. 346-358. In: J. A. Hansen and K. Henriksen (eds.)Nitrogen in Organic Wastes Applied to Soils. Academic Press Inc., San Diego, CA.
Section 8
Baker, J.L. and H.P. Johnson. 1981. Nitrate-nitrogen in tile drainage as affected by fertilization.J. Environ. Qual. 10:519-522.
Baker, J.L., K.K. Campbell, H.P. Johnson, and J.J. Hanway. 1975. Nitrate, phosphorus, andsulfate in subsurface drainage water. J. Environ. Qual. 4:406-412.
Bottercher, J., O. Strebel, and W.H.M. Duynisveld. 1985. Vertikale stoffkonzentrationsprofilein grundwasser eines lockergesteins-aquifers und dern deren interpretation (BeispielFurhberg Feld). Z. dt. Geol. Ges. (Hannover). 136:543-552.
Burwell, R.E., G.E. Schuman, K.E. Saxton, and H.G. Heinemann. 1976. Nitrogen in subsurfacedischarge from agricultural watersheds. J. Environ. Qual. 5:325-329.
Chichester, F.W., and S.J. Smith. 1978. Disposition of N-labeled fertilizer nitrate applied duringcorn culture in field lysimeters. J. Environ. Qual. 7:227-233.
Chichester, F.W. 1977. Effects of increased fertilizer rates on nitrogen content of runoff andpercolate from monolith lysimeters. J. Environ. Qual. 6:211-217.
Daliparthy, Jayaram, Stephen J. Herbert, and Peter L.M. Veneman. 1994. Dairy manureapplications to alfalfa: crop response, soil nitrate, and nitrate in soil water. Agron. J.86:927-933.
Endelman, F.J., D.R. Keeney, J.T.Gilmore, and P.G. Safigna. 1974. Nitrate and chloridemovement in the Plainfield loamy sand under intensive irrigation. J. Environ. Qual.3:295-298.
Englund, J.O. and S. Haldorsen. 1986. Profiles of nitrogen species in a sand-silt aquifer atHaslemoen, Solor, south Norway. Nordic Hydrol. 17:295-304.
Firestone, M. K. 1982. Biological Denitrification. p.289-326, In: F. J. Stevenson (ed.) Nitrogenin Agricultural Soils. American Society of Agronomy, Madison, WI.
Gambrell, R., J. Gilliam, and S. Weed. 1975. Denitrification in subsoils of the North Carolinacoastal plain as afected by soil drainage. J. Environ. Qual. 4:311-316.

R-45
Gast, R.G., W.W. Nelson, and J.M. MacGregor. 1974. Nitrate and chloride accumulation anddistribution in fertilized tile-drained soils. J. Environ. Qual. 3(3): 209-213.
Gast, R.G., W.W. Nelson, and G.W. Randall. 1978. Nitrate accumulation in soils and loss in tiledrainage following nitrogen applications in continuous corn.. J. Environ. Qual. 7(2):258-261.
Gerwing, J.R., A.C. Caldwell, and L.L. Goodroad. 1979. Fertilizer nitrogen distribution underirrigation between soil, plant, and aquifer. J. Environ. Qual. 8:281-284.
Gillham, R.W. 1991. Nitrate Contamination of Groundwater in Southern Ontario and theEvidence for Denitrification. In: I. Bogardi and R.D. Kuzelka (eds.) NitrateContamination: Exposure springer-Verlag, Berlin. Consequence and Control. NATOASI series, Series G: Ecological Sciences. 30: 181-198.
Hallberg, G.R. 1989. Nitrate in Groundwater in the United States. p. 35-74. In: R.F. Follett(ed.) Nitrogen Management and Ground Water Protection. Elsevier Science Publishers,Amsterdam.
Hubbard, R. K., L.E. Asmussen, and H.D. Allison. 1984. Shallow groundwater quality beneathan intensive multiple-cropping system using center pivot irrigation. J. Environ. Qual.13:156-161.
Jackson, W.A., S.R. Wilkinson, and R.A. Leonard. 1977. Land disposal of broiler litter:changes in concentration of chloride, nitrate nitrogen, total nitrogen, and organic matterin a Cecil sandy loam. J. Environ. Qual. 6(1): 58-62.
Jacobs, T.C. and J.W. Gilliam. 1985. Riparian losses of nitrate from agricultural drainagewaters. J. Environ. Qual. 14:472-478.
Jones, M.B., J.E.Street, and W.A. Williams. 1974. Leaching and uptake of nitrogen applied toannual grass and clover-grass mixtures in lysimeters. Agronomy Journal. 66:March/April 1974, 256-258.
Keeney, D. R. 1986. Nitrate in Ground Water - Agricultural Contribution and Control. pp.329-351. In: Proceedings - Conference on Agricultural Impacts on Ground Water. Omaha,NE. 11-13 Aug. National Water Well Assoc., Dublin, OH.
Keeney, D.R. 1981. Soil Nitrogen Chemistry and Biochemistry. p. 259-276. In: I.K. Iskander(ed.) Modeling Wastewater Renovation; Land Treatment. Wiley, New. York.
Kissel, D.E., J.T. Ritchie, and Earl Burnett. 1974. Nitrate and chloride leaching in a swellingclay soil. J. Environ. Qual. 3:401-404.
Krajenbrink, G.J.W., L.J.M. Boumans, and C.R. Meinardi. Hyrochemical Processes in the TopLayer of Groundwater Under Pasture Land. p. 317-333. In: J. A. Hansen and K.Henriksen (eds.) Nitrogen in Organic Wastes Applied to Soils. Academic Press Inc., SanDiego, CA.

R-46
Logan, T.J., G.W. Randall, and D.R. Timmons. 1980. Nutrient content of the tile drainage fromcropland in the North Central Region. NC Regional Publ. 268. Res. Bull. 1119.OARDC, Wooster, OH.
Lowrance, R.R., R.T. Todd, and I.E. Asmussen. 1984. Nutrient cycling in an agriculturalwatershed: I. Phreatic movement. J. Environ. Qual. 13:22-27.
MacGregor, J.M., G.R. Blake, and S.D. Evans. 1974. Mineral nitrogen movement into subsoilsfollowing continued annual fertilization for corn. Soil Sci. Soc. Am. Proc. 38:110-113.
Mariotti, A., A. Landreau, and B. Simon. 1988. 15N isotope biogeochemistry and naturaldenitrification process in groundwater: application to the chalk aquifer of northernFrance. Geochim. Cosmochim. Acta. 52:1869-1878.
Miller, M.H. 1979. Contribution of nitrogen and phosphorus to subsurface drainage water fromintensively cropped mineral and organic soils in Ontario. J. Environ. Qual. 8:42-48.
Owens, L.B. 1990. Nitrate-nitrogen concentrations in percolate from lysimeters planted to alegume-grass mixture. J. Environ. Qual. 19:131-135.
Owens, L.B. 1987. Nitrate leaching losses from monolith lysimeters as influenced bynitrapyrin. J. Environ. Qual. 19:131-135.
Owens, L. B. 1960. Nitrogen movement and transformations in soils as evaluated by a lysimeterstudy utilizing isotropic nitrogen. Soil Sci. Soc. Am. Proc. 24:372-376.
Parkin, T.B., and J.J. Meisinger. 1989. Denitrification below the crop rooting zone as influenceby surface tillage. J. Environ. Qual. 18:12-16.
Payne, W.J. 1981. Denitrification. Wiley and Sons, New York. 214 pp.
Pionke, H.B. and R.R. Lowrance. 1991. Fate of Nitrogen in Subsurface Drainage Waters. p.237-258. In: R. F. Follett, D. R. Keeney, and R. M. Cruse (eds.) Managing Nitrogen forGroundwater Quality and Farm Profitability. Soil Science Society of America, Inc.,Madison, WI.
Ronen, Daniel, and Mordeckai Magaritz. 1985. High concentration of solutes at the upper partof the saturated zone (water table) of a deep aquifer under sewage-irrigated land. Journalof Hydrology. 80: 311-323.
Smith, J.H. and J.R. Peterson. 1982. Recycling of Nitrogen Through Land Application ofAgricultural, Food Processiong, and Municipal Wastes. In F. J. Stevenson (ed.) Nitrogenin Agricultural Soils. Agronomy 22:791-832.
Smith, R.L., B.L. Howes, and J.H. Duff. 1991. Denitrification in nitrate-contaminatedgroundwater: occurrence in steep vertical geochemical gradients. Geochim. Cosmochim.Acta. 55:1815-1825.

R-47
Spalding, R.F., M.E. Exner, G.E. Martin, D.D. Snow. 1993. Effects of sludge disposal ongroundwater nitrate concentrations. Journal of Hydrology. 142:213-228.
Timmons, D.R. and A.S. Dylla. 1981. Nitrogen leaching as influenced by nitrogen managementand supplemental irrigation level. J. Environ. Qual. 10: 421-426.
Timmons, D.R. 1984. Nitrogen leaching as influenced by water application level andnitrification inhibitors. J. Environ. Qual. 13: 305-309.
Trudell, M.R., R.W. Gillham, and J.A. Cherry. 1986. An in-situ study of the occurrence andrate of denitrification in a shallow unconfined sand aquifer. J. Hydrol. 83: 251-268.
Tyler, D.D. and G.W. Thomas. 1977. Lysimeter measurements of nitrate and chloride lossesfrom siol under conventional and no-tillage corn. J. Environ. Qual. 6:63-66.
Vogel, J.C., A.S. Talma, and T.H.E. Heaton. 1981. Gaseous nitrogen as evidence fordenitrification in groundwater. J. Hydrol. 50:191-200.
Weil, R.R., R.A. Weismuller, and R.S. Turner. 1990. Nitrate contamination of groundwaterunder irrigated coastal plain soils. J. Environ. Qual. 19:441-448.
Zwerman, P.J., T. Greweling, S.D. Klausner, and D.J. Lathwell. 1972. Nitrogen and phosphoruscontent of water from tile drains at two levels of management and fertilization. Soil Sci.Soc. Am. Proc. 36:134-137.
Section 9Badini, O., Stockle, C.O., and E.H. Franz. 1997. Application of crop simulation modeling and
GIS to agroclimatic assessment in Burkina Faso. Agriculture Ecosystems andEnvironment (in press).
Castellvi, F., Perez, P.J., Stockle, C.O., and M. Ibanez. 1997. Methods for estimating vaporpressure deficit at a regional scale depending on data availability. Agriculture and ForestMeteorology (in press).
Donatelli, M., C.O. Stockle, E. Ceotto, and M. Rinaldi. 1996. CropSyst validation for croppingsystems at two locations of Northern and Southern Italy. European Journal of Agronomy(in press).
Ferrer, F. and C.O. Stockle. 1995. A model for assessing crop response and water managementin saline conditions. In ICID/FAO Workshop on Irrigation Scheduling: From Theory toPractice. Sept. 1995, Rome, Italy.
Ndlovu, L. 1994. Weather data generation and its use in estimating evapotranspiration. Ph.D.dissertation. Washington State University, Pullman, WA. 143pp.

R-48
Pala, M., C.O. Stockle, and H.C. Harris. 1996. Simulation of durum wheat (triticum durum)growth under differential water and nitrogen regimes in a mediterranean type ofenvironment using CropSyst. Agricultural Systems 51:147-163.
Pannkuk, C.D., C.O. Stockle, and R.I. Papendick. 1998. Evaluating CropSyst simulations ofwheat growth under different tillage and residue management practices in a wheat-fallowregion of the US Pacific Northwest. Agricultural Systems (In press).
Peralta, J.M., C.O. Stockle, K.E. Saxton, and L.G. King. 1997. Nitrogen form an irrigated croprotation available for contaminating ground water: A long-term simulation study.Proceedings of the Conference on Best Management Practices for Irrigated Agricultureand the Environment. U.S. Committee on Irrigation and Drainage and Bureau ofReclamation. Fargo, North Dakota, July 16-19, 1997.
Stockle, C. O., S. Martin and G. S. Campbell. 1994. CropSyst, a cropping systems model:water/nitrogen budgets and crop yield. Agricultural Systems 46:335-359.
Stockle, C.O. 1996. GIS and simulation technologies for assessing cropping systemsmanagement in dry environments. American Journal of Alternative Agriculture 11:115-120.
Stockle, C.O. and M. Donatelli, 1996. The CropSyst Model: A brief description. In: Plentinger,M.C. and F.W.T. Penning de Vries (Ed.), Rotation models for ecological farming.CAMASE/PE workshop report. Quantitative Approaches in Systems Analysis No. 10.AB-DLO, Wageningen, The Netherlands. 138 pp.
Stockle, C.O. and R. Nelson. 1997. CropSyst User's manual. Dept. of Biological SystemsEngineering, Washington State University, Pullman, WA.
Stockle, C.O., M. Cabelguenne, and P. Debaeke. 1997. Validation of CropSyst for watermanagement at a site in southern France using submodels of different complexity.European Journal of Agronomy (accepted).
Stockle, C.O. and P. Debaeke. 1997. Modelling crop nitrogen requirements: a critical analysis.European Journal of Agronomy (accepted).