Embed Size (px)
Citation preview

1 | P a g e
On-Farm Research Partnership
Nitrogen Benefits of Cover Crops
Trial Layout and Measurements
----------------2012/2013 trials----------------
Cover crops have received increasing interest from farmers in recent years. The reasons vary from erosion control and nutrient uptake to improved soil quality, increasing organic matter, and field trafficability. As fertilizer prices continue to increase and producers aim to reduce N loss to the environment, many have asked about the N benefits of cover crops for silage corn systems. On-farm trials are needed to quantify these benefits for NY corn growers.
Goal:
Determine the nitrogen benefits of seeding a cover crop or double crop (e.g., triticale) between corn silage harvest and planting of the next year’s corn crop.
Approach:
Identify 2nd year or higher corn fields that will be harvested for silage this year and next year.
Document the field history—manure use this year (for the 2012 corn crop and the 2012 cover or double crop) and last year (2011 cropping season), fertilizer use this year and last year (including sidedressing amounts if corn sidedressed), soil type, rotation, past soil test, etc).
Per field, implement studies in four reps using the maps on pages 5-6 of this project outline. Plots should be twice the planter/chopper width wide (harvesting the inner rows for yield estimates is the easiest way to go) and long enough to hold silage for a harvest truck (shoot for ~75% full)— in the past this length has ranged from 350 to about 1000 feet, depending on field size and harvest equipment. Each trial should have a control treatment where no cover crop is seeded.
Manure or fertilizer addition prior to, during, or shortly after cover crop seeding is ok but should be consistent across all plots, including unseeded control plots, and be documented on the field history form.
Measurements (2 treatments x 4 reps = 8 plots per trial or 3 treatments x 4 reps = 12 plots per trial) - Fall 2012 at cover crop/double crop seeding:
Setup the trial using the design on pages 5 or 6 of this document.
Always include a no-cover-crop control.
Clearly mark both ends of the field plots and note down distances to the road and roadside markers so it is easy to trace back the plot at PSNT and at harvest time.
Avoid metal flags…plastic ones work just as well and are less risky with field equipment.
For each plot, take SOIL SAMPLES at two depths (0-8 inch and 0-12 inch). Do this PRIOR TO MANURE APPLICATION if manure is applied before the cover crop is

2 | P a g e
seeded. In EACH PLOT, take 15 soil cores each for the two depths (take side-by-side); mix the 15 cores well to make composite samples for each depth. One cup of composite sample for each depth is needed per plot. Clearly label the samples with farm name, field ID/plot #, and sampling depth.
Mail the 8” and 12” soil samples to Quirine Ketterings (323 Morrison Hall, Department of Animal Science, Cornell University, Ithaca, NY 14853).
We will analyze the samples for standard fertility (Cornell Morgan) and ISNT (0-8 inch samples) and PSNT (0-12 inch samples).
- Spring 2012: at cover crop termination or double crop harvest time:
For each plot, take SOIL SAMPLES (0-8 inch and 0-12 inch samples). Do this PRIOR TO MANURE APPLICATION if manure is applied before the corn crop is seeded; 15 soil cores per plot for each depth, taken side-by-side. Mix the 15 cores well, one cup of composite sample is needed per depth per plot. Samples should be taken in the area that will be harvested (so inner 6 rows of a 12 row plot or inner 4 rows of an 8 row plot, etc.).
Harvest the cover crop: Use a 2 square foot frame at three locations in each plot to cut the cover crop at the soil level without soil contamination of the cover crop. Combine in the same bag. Fold over the top of the sample bag and write farm name, field ID number (plot number), and sampling date on bag before leaving the field. In total, each bag should contain the harvest of three 2-square foot areas.
Bagged samples and data sheet go to NMSP at Cornell for processing and analysis.
Take pictures of each of the 8 (or 12) plots so we have a record of visual differences or the lack thereof.
Mail samples and data sheets to Quirine Ketterings (323 Morrison Hall, Department of Animal Science, Cornell University, Ithaca, NY 14853). Email photos of plots (with identification information) to Quirine Ketterings at [email protected]
We will analyze the soil samples for standard fertility (Cornell Morgan) and ISNT (0-8 inch samples) and PSNT (0-12 inch samples).
We will determine the above ground biomass and analyze the harvest samples for C and N content, then calculate total amounts of C and N and the C:N ratio.
- June 2013 (PSNT time):
Sample soils for EACH PLOT at two depths: 0-8 inches and 0-12 inches (take cores next to each other) within the area to be harvested in fall; each sample should be a composite of 15 cores taken between corn rows (inner 6 rows of a 12 row plot or inner 4 rows of an 8 row plot, etc.). Be sure samples are clearly labeled with farm name, field ID/plot #, and sampling depth.
Mail soil samples to Quirine Ketterings (323 Morrison Hall, Department of Animal Science, Cornell University, Ithaca, NY 14853).
We will analyze the samples for standard fertility (Cornell Morgan) and ISNT (0-8 inch samples) and PSNT (0-12 inch samples).
On the same day you take soil samples, also determine stand density (set out 40 feet of tape and count corn plants on the left and the right of the tape (2 readings per plot).
Take pictures of each of the 8 (or 12) plots so we have a record of visual differences or the lack thereof. Email with plot IDs to Quirine Ketterings at [email protected]
3 | P a g e
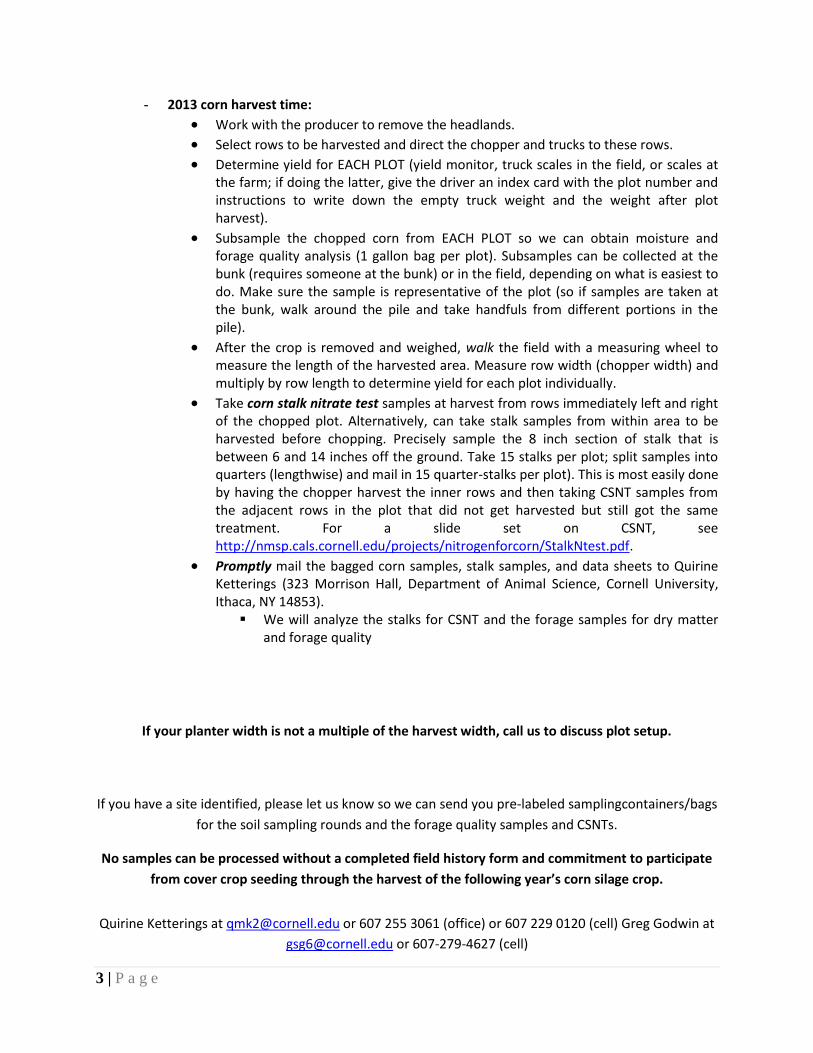
- 2013 corn harvest time:
Work with the producer to remove the headlands.
Select rows to be harvested and direct the chopper and trucks to these rows.
Determine yield for EACH PLOT (yield monitor, truck scales in the field, or scales at the farm; if doing the latter, give the driver an index card with the plot number and instructions to write down the empty truck weight and the weight after plot harvest).
Subsample the chopped corn from EACH PLOT so we can obtain moisture and forage quality analysis (1 gallon bag per plot). Subsamples can be collected at the bunk (requires someone at the bunk) or in the field, depending on what is easiest to do. Make sure the sample is representative of the plot (so if samples are taken at the bunk, walk around the pile and take handfuls from different portions in the pile).
After the crop is removed and weighed, walk the field with a measuring wheel to measure the length of the harvested area. Measure row width (chopper width) and multiply by row length to determine yield for each plot individually.
Take corn stalk nitrate test samples at harvest from rows immediately left and right of the chopped plot. Alternatively, can take stalk samples from within area to be harvested before chopping. Precisely sample the 8 inch section of stalk that is between 6 and 14 inches off the ground. Take 15 stalks per plot; split samples into quarters (lengthwise) and mail in 15 quarter-stalks per plot). This is most easily done by having the chopper harvest the inner rows and then taking CSNT samples from the adjacent rows in the plot that did not get harvested but still got the same treatment. For a slide set on CSNT, see http://nmsp.cals.cornell.edu/projects/nitrogenforcorn/StalkNtest.pdf.
Promptly mail the bagged corn samples, stalk samples, and data sheets to Quirine Ketterings (323 Morrison Hall, Department of Animal Science, Cornell University, Ithaca, NY 14853).
We will analyze the stalks for CSNT and the forage samples for dry matter and forage quality
If your planter width is not a multiple of the harvest width, call us to discuss plot setup.
If you have a site identified, please let us know so we can send you pre-labeled samplingcontainers/bags
for the soil sampling rounds and the forage quality samples and CSNTs.
No samples can be processed without a completed field history form and commitment to participate
from cover crop seeding through the harvest of the following year’s corn silage crop.
Quirine Ketterings at [email protected] or 607 255 3061 (office) or 607 229 0120 (cell) Greg Godwin at
[email protected] or 607-279-4627 (cell)

4 | P a g e
BY BEING AN ON-FARM RESEARCH PARTNER, YOUR FARM DATA BECOME PART OF A STATEWIDE
DATASET THAT BENEFITS THE AGRICULTURAL INDUSTRY. SUCH A DATASET IS ESSENTIAL FOR FINE
TUNING OF OUR LAND GRANT UNIVERSITY GUIDELINES.
New York On-Farm Research Partnership
http://nmsp.cals.cornell.edu/NYOnFarmResearchPartnership
There is great power from research information when
field data are generated through well designed, repeated
and widely implemented trials, with proper data
collection and statistically valid analyses.
Consider being an on-farm research partner!
Relevant Questions and Sound Science for Agricultural
Profitability and Protection of the Environment
For further information or questions:
On-Farm Research Partnership
c/o Quirine M. Ketterings
323 Morrison Hall, Cornell University, Ithaca, NY 14853
http://nmsp.cals.cornell.edu/NYOnFarmResearchPartnership
Email: [email protected]

5 | P a g e
With and Without Cover Crop Comparison
One cover crop only
Harvestable strips are a corn chopper width times two and then field length long enough to get ¾ of a
truck load that can be weighed. If the entire field is seeded with the cover crop, just leave four strips
without cover. An example is listed below (4 replications). All measurements are taken per plot (width of
chopper times 2; harvest inner rows; length: 350-1000 feet depending on field size, truck weights, and
expected yield).
Per field (width of chopper times two):
Field
Plot 1
Cover
crop
Plot 2
No
cover
crop
Plot 3
No
cover
crop
Plot 4
Cover
crop
Plot 5
No
cover
crop
Plot 6
Cover
crop
Plot 7
Cover
crop
Plot 8
No
cover
crop
Block 1 Block 2 Block 3 Block 4

6 | P a g e
Two Cover Crop Species and Control Comparison
Two cover crop species and a control
Harvestable strips are a corn chopper width times two and then field length long enough to get ¾ of a
truck load that can be weighed. If the entire field is seeded with the cover crop, just leave four strips
without cover. An example is listed below (4 replications). All measurements are taken per plot (width of
chopper times 2; harvest inner rows; length: 350-1000 feet depending on field size, truck weights, and
expected yield).
Per field (width of chopper times two):
Field (Cover crop A as planned)
Plot 1
Cover
crop
A
Plot
2
No
cover
crop
Plot 3
Cover
crop
B
Plot 4
No
Cover
crop
Plot 5
Cover
crop
A
Plot 6
Cover
crop
B
Plot
7
No
cover
crop
Plot 8
Cover
crop
A
Plot 9
Cover
crop
B
Plot
10
Cover
crop
A
Plot
11
No
cover
crop
Plot
12
Cover
crop
B
Block 1 Block 2 Block 3 Block 4

7 | P a g e
Nutrient Management Spear Program
Cover Crop Project
General Information Page
2012/2013
Collaborator: Name
Address
Home Phone ( )
Cell Phone ( )
Producer: Name
Company
Address
Phone ( )

8 | P a g e
Field Activities Record 2012/2013
Location:
Experiment: NMSP Cover Crop Project
Date Activity/Notes (For each site visit, describe what was done, list participants, observations made, and any problems encountered or field information received that may help in interpretation of trial results.)
9 | P a g e
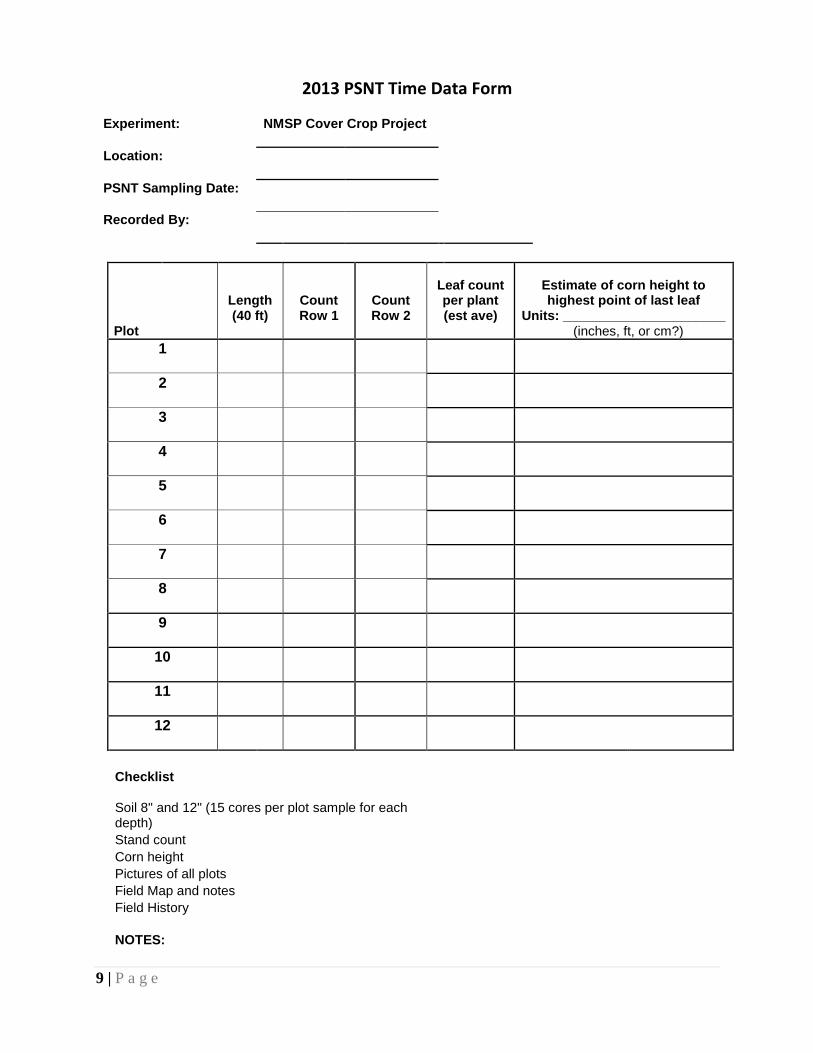
2013 PSNT Time Data Form
Experiment: NMSP Cover Crop Project
Location:
PSNT Sampling Date:
Recorded By:
Plot
Length (40 ft)
Count Row 1
Count Row 2
Leaf count per plant (est ave)
Estimate of corn height to highest point of last leaf
Units: ______________________ (inches, ft, or cm?)
1
2
3
4
5
6
7
8
9
10
11
12
Checklist
Soil 8" and 12" (15 cores per plot sample for each depth)
Stand count Corn height Pictures of all plots Field Map and notes Field History
NOTES:

10 | P a g e
2013 Harvest Time Data Form –Plot lengths
Experiment: NMSP Cover Crop Project
Location:
Harvest Date:
Recorded By:
Plot
Harvested Plot
Length (ft)
# Rows
Harvested
1
2
3
4
5
6
7
8
9
10
11
12
Checklist
Silage subsamples from each plot
Harvested plot lengths
Corn stalk nitrate samples from each plot
NOTES:
11 | P a g e
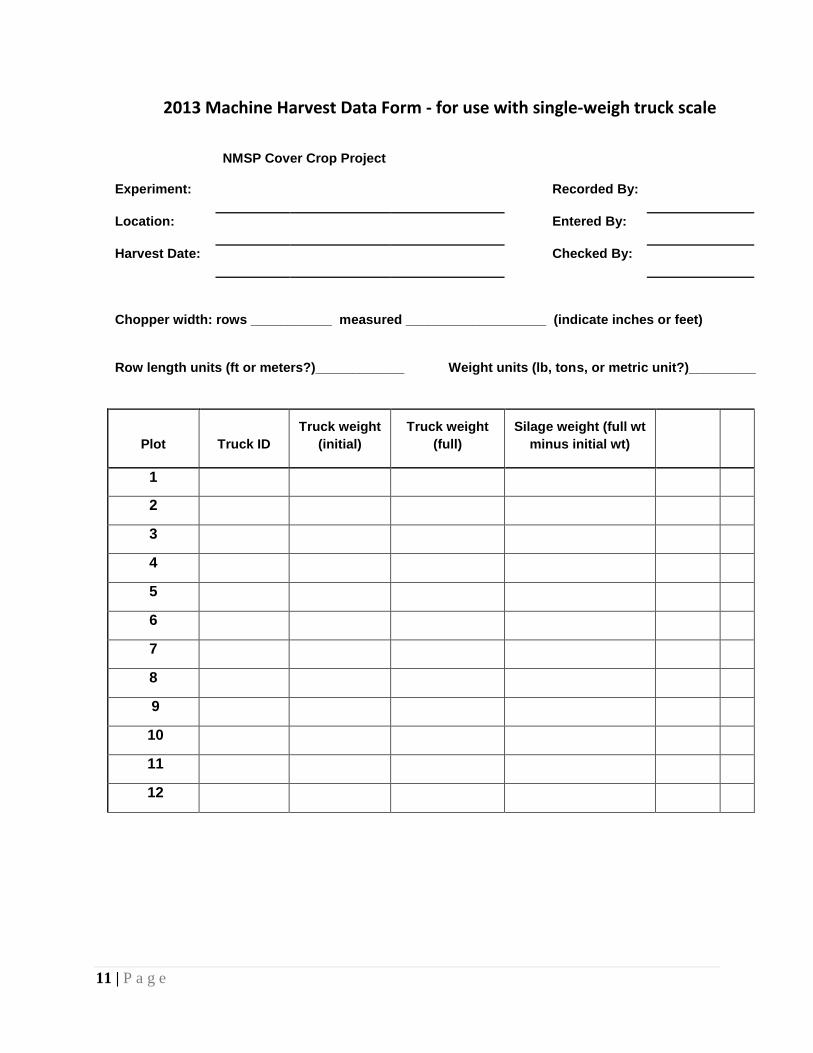
2013 Machine Harvest Data Form - for use with single-weigh truck scale
Experiment:
NMSP Cover Crop Project
Recorded By:
Location:
Entered By:
Harvest Date:
Checked By:
Chopper width: rows ___________ measured ___________________ (indicate inches or feet)
Row length units (ft or meters?)____________ Weight units (lb, tons, or metric unit?)_________
Plot Truck ID
Truck weight
(initial)
Truck weight
(full)
Silage weight (full wt
minus initial wt)
1
2
3
4
5
6
7
8
9
10
11
12
12 | P a g e
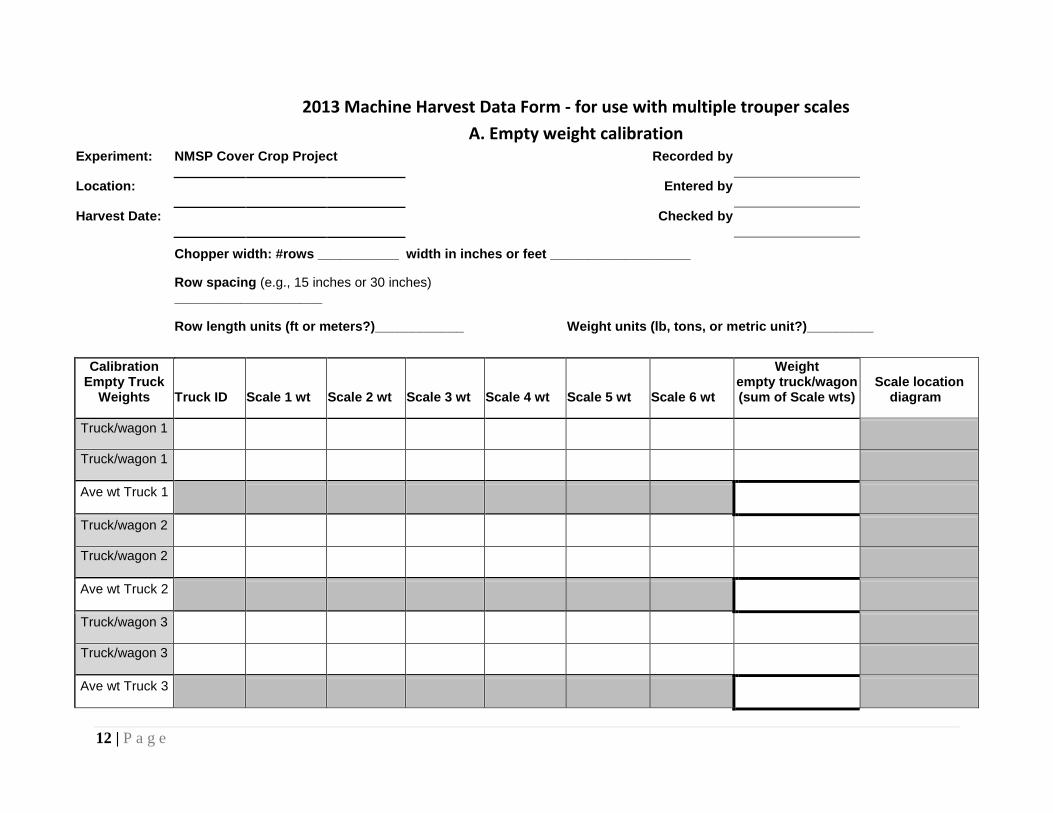
2013 Machine Harvest Data Form - for use with multiple trouper scales
A. Empty weight calibration Experiment: NMSP Cover Crop Project
Recorded by
Location:
Entered by
Harvest Date:
Checked by
Chopper width: #rows ___________ width in inches or feet ___________________
Row spacing (e.g., 15 inches or 30 inches) ____________________
Row length units (ft or meters?)____________
Weight units (lb, tons, or metric unit?)_________
Calibration Empty Truck
Weights Truck ID Scale 1 wt Scale 2 wt Scale 3 wt Scale 4 wt Scale 5 wt Scale 6 wt
Weight empty truck/wagon (sum of Scale wts)
Scale location diagram
Truck/wagon 1
Truck/wagon 1
Ave wt Truck 1
Truck/wagon 2
Truck/wagon 2
Ave wt Truck 2
Truck/wagon 3
Truck/wagon 3
Ave wt Truck 3

13 | P a g e
Calibration Empty Truck
Weights Truck ID Scale 1 wt Scale 2 wt Scale 3 wt Scale 4 wt Scale 5 wt Scale 6 wt
Weight empty truck/wagon (sum of Scale wts)
Scale location diagram
Truck/wagon 4
Ave wt Truck 4
Truck/wagon 5
Truck/wagon 5
Ave wt Truck 5
14 | P a g e
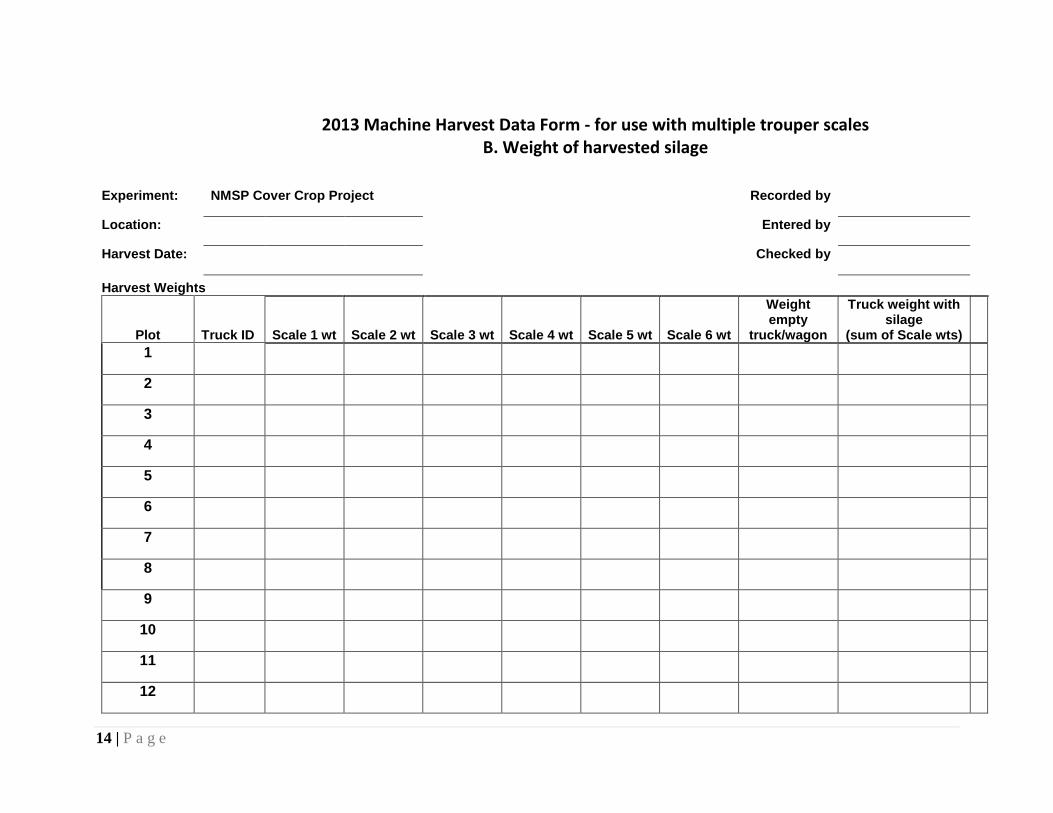
2013 Machine Harvest Data Form - for use with multiple trouper scales B. Weight of harvested silage
Experiment: NMSP Cover Crop Project
Recorded by
Location:
Entered by
Harvest Date:
Checked by
Harvest Weights
Plot Truck ID Scale 1 wt Scale 2 wt Scale 3 wt Scale 4 wt Scale 5 wt Scale 6 wt
Weight empty
truck/wagon
Truck weight with silage
(sum of Scale wts)
1
2
3
4
5
6
7
8
9
10
11
12