Embed Size (px)
Citation preview

Nike Sustainable Manufacturing Excellence Energy and CO2 Program

2 ENERGY / CO2
Total Energy Used
•1,900,000,000 kilowatt hours
Price of Energy
• .00009/watt hour
Total Energy Cost
•$75M
Total Energy Used
•1,900,000,000 kilowatt hours
Carbon Content of Energy
• .000419 pounds of CO2/ watt hour
Total Carbon Footprint
•1,000,000 tCO2
•1,900,000,000 kilowatt hours
Energy Use
•300M pairs
Length of Use
One year
Program Foundation
Energy and CO2 Equation » Understanding energy cost and CO2 emissions
» Reducing energy usage reduces carbon footprint and energy cost
Total Energy Used
3 Energy + CO2
China Steel
Steel
Nike
Annual Energy Use
1,600,000,000 MWh 1,950,000 MWh
Nike Footwear
Energy use equivalent: China Steel: 8 hrs
Nike Footwear: 1 year

4 Energy + CO2
Total Nike Brand Inline FW energy use: 2,000,000 MWh
Above average energy losses from Vietnamese electricity grid: 2,000,000 MWh
Electricity system basics (VN)

5 Energy + CO2
25% of wind turbines in China are not connected to the grid
Greater than Nike inline FW energy use
Electricity system basics (CN)

6 Energy + CO2
Electricity supply and demand (vn)
0
100
200
300
400
500
600
0 1 2 3 4 5 6 7 8 9 10 11 12 13 14 15 16 17 18 19 20 21 22 23 24
Maximum energy supply
0
500
1000
1500
2000
2500
3000
3500
4000
4500
0 1 2 3 4 5 6 7 8 9 10 11 12 13 14 15 16 17 18 19 20 21 22 23 24Source: EIA, EVN
7 ENERGY / CO2
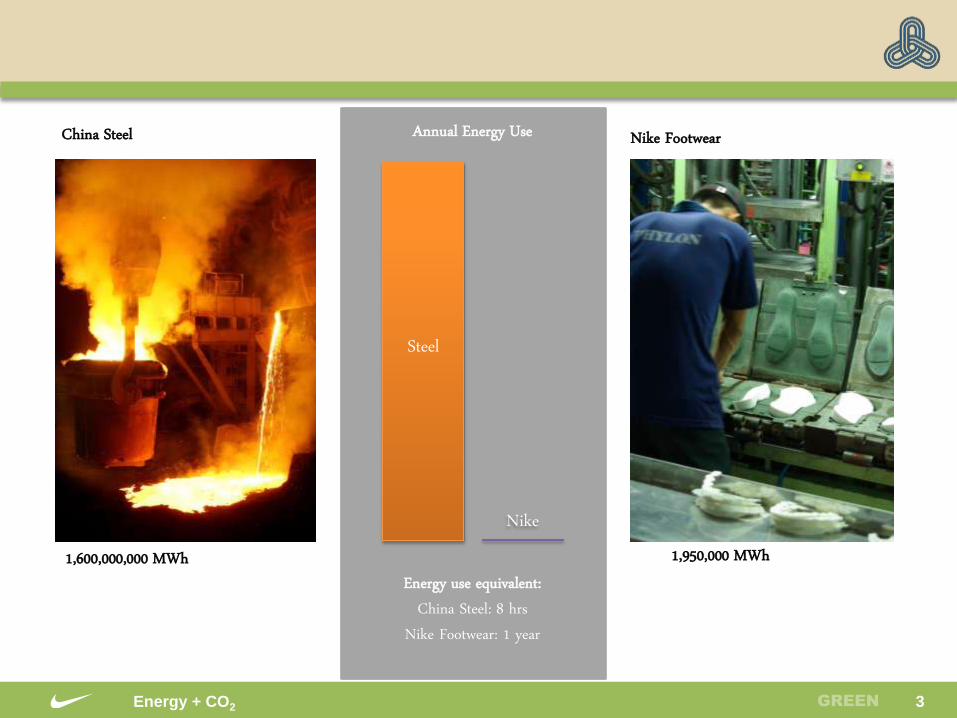
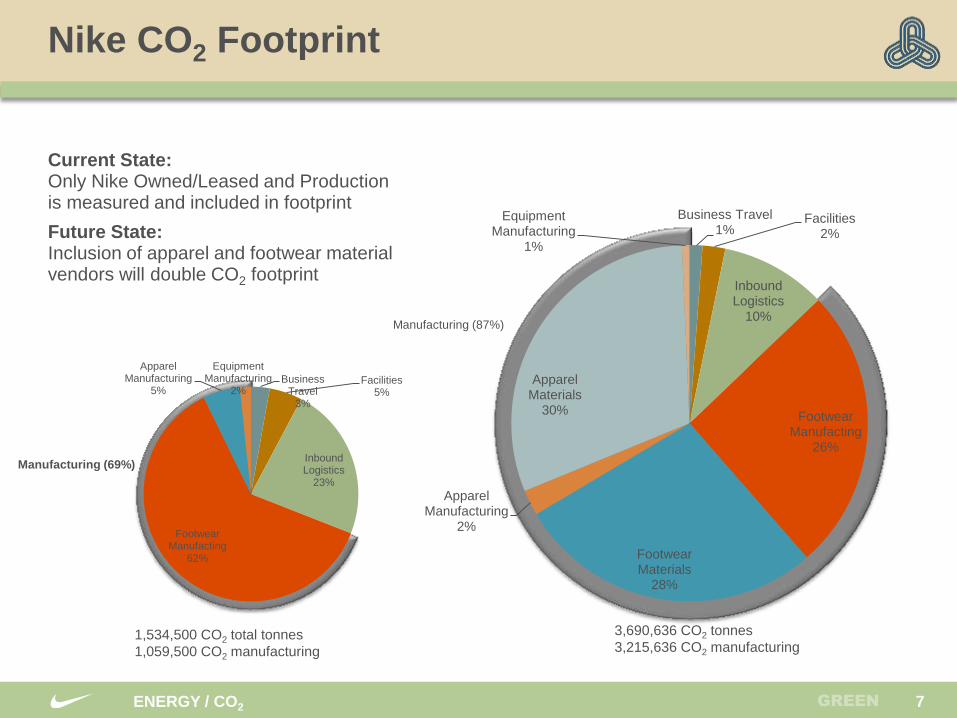
Nike CO2 Footprint
1,534,500 CO2 total tonnes
1,059,500 CO2 manufacturing
Manufacturing (69%)
Business Travel 1%
Facilities 2%
Inbound Logistics
10%
Footwear Manufacting
26%
Footwear Materials
28%
Apparel Manufacturing
2%
Apparel Materials
30%
Equipment Manufacturing
1%
3,690,636 CO2 tonnes
3,215,636 CO2 manufacturing
Current State: Only Nike Owned/Leased and Production is measured and included in footprint
Future State: Inclusion of apparel and footwear material vendors will double CO2 footprint
Manufacturing (87%)
Business Travel
3%
Facilities 5%
Inbound Logistics
23%
Footwear Manufacting
62%
Apparel Manufacturing
5%
Equipment Manufacturing
2%

8 ENERGY / CO2
Energy and CO2 Technical Methodology
Toolset: High energy use equipment technical studies
Target the opportunities: shows which equipment to analyze for each factory type
Footwear Factory
Percent of total energy use
Air Compressors (10%)
Boilers (50%)
Motors (30%)
Apparel/Equipment Factory
Percent of total energy use
Air Compressors (5%)
Motors (25%)
Lighting (20%)
Textile Factory
Percent of total energy use
Air Compressors (3%)
Boilers & Dye Tanks (85%)
Boilers (50%)
Primary Focus:
Existing factories
Factory specific
energy toolsets

9 ENERGY / CO2
Energy and CO2 Technical Methodology
Compressor
Air Dryer
Air Storage Tanks
Distribution
Demand
50 Units
Eliminate 10
Units
50% Leakage
Uncontrolled •Realign units with production
schedules
•Replace units + heat
exchangers
•Eliminate 10 units + boiler
capacity
•Install nozzles
•Inline motors/actuators
•25% reduction in usage
•2 month payback
•Replace lines
•Start detection program
•35% reduction in usage
•2 month payback •Relocate next to
high demand processes
Factory specific
energy toolsets
Map the system: essential lean tool used
to develop energy savings roadmap
$1M USD
5-10% savings
1% savings
10 yr payback
$2500 USD
70% Savings
Primary Focus:
Existing factories

10 ENERGY / CO2
Energy and CO2 Technical Methodology
Toolset: Energy Mapping (process)
Map the System: Essential lean tool used to develop energy savings roadmap
1. Use existing process flow chart
2. Study equipment that uses energy
3. Identify opportunities
4. Develop energy saving plan based on best practices
Primary Focus:
Existing factories
Factory specific
energy toolsets
Step 2 (25 min.)
150A (panel)
55kW motor
85°C
Step 1 300A (panel), 150kW motor
Cycle 1
70-75°C
(10 min.)
Cycle 2
65-70°C
(10 min.)
4 kg/cm2: door & mixing plate actuation
Boiler (shared, remote)
160°C
8kg/cm2
Air
Compressors (shared, remote)
8 kg/cm2
Step 4 (5 min.)
amperage TBD
0.75, 5.5, 3.7, 1.5,
3.7, 1.5kW motors
50°C
Step 3 (5 min.)
150A (panel)
30kW motor
70°C
Chiller 300A (panel)
25°C
Fuel
Source
Cooling
Tower

11 ENERGY / CO2
Energy and CO2 Technical Methodology
2nd
Canteen
Insole
1,000t Press
EVA Roll
Phylon
CMP
1st Canteen
Boiler
Main office
1980 – 2005 Energy & CO2 Program:
Just put solar panels on rooftop
2-3% energy replacement
60 year payback + emissions from manufacturing
100% Solar power for Shoetown FW
Factory:
77,000 kW solar array
$250,000,000 USD

12 ENERGY / CO2
Phylon
2nd
Canteen
Insole
1,000t Press
EVA Roll
CMP
1st Canteen Main office
Boiler
Energy and CO2 Program Methodology
Before After
111mm 98.4mm
Best Methodology (Nike) Energy & CO2 Program:
Complex methodologies and ideas
Eliminate old system (reduce energy loss by 10%)
Project 1: Insulate mold presses
Project 2: Reduce mold mass
Project 3: Install six-sided platen
Project 4: Auto loading mechanism
Project 5: Purchase small boilers
Project 6: Develop energy pull system
Savings of >60% energy & CO2
Extremely fast payback (<1 year). Reduced cycle time.

Saving energy through changing mold
- Changing size of mold : Don’t change X, Y for keeping durability but change Z (Thickness of mold)
Y
Z
Before After
X
111mm 98.4mm
1st Press (Check temperature of
the molds and pre-forms)
Result of 1st Press
(Research suitable forming time)
Result of 2nd Press (Compare temperature with
before)
Prepare molds of before and
after
2nd Press (Apply new forming
time)
- Testing step Measurement temperature
Check gauge and physical properties

14 ENERGY / CO2
Energy and CO2 Program Progression
North Star
100% Sustainable* Energy Use
FY16 FY20-50
10% Reduction 50% Reduction 66% Reduction
100% Green Energy
Energy Waste
(20%)
Fossil
Fuels
Fossil
Fuels Energy
Use
Green
Energy
Energy
Waste
(30%)
Fossil
Fuels
Energy
Use
Program Progression Towards the North Star
Green Energy
<FY08
Energy
Use
Before Energy and CO2 Program:
Energy is a new idea
FY09
Energy
Use
Minimum Energy and CO2 Program:
Elimination of waste using TPM –
Energy best practices
Energy and CO2 Program Progression:
Continuous improvement approach for
energy integrated throughout
organization
Energy and CO2 Continuous
Improvement
Physical
Transformation
Behavioral
Transformation
Learning
Culture
Traditional
Culture
Willing to
change

15 ENERGY / CO2
Energy and CO2 Program Rationale
Excellent Financial Potential
» Average <1 year payback
» Reduce exposure to oil
market prices
Improved operations
» Reduce equipment
downtime
» Improved process integrity
Intangible benefits
» Reduced environmental
impact
» Reduced carbon footprint
Version 3 16
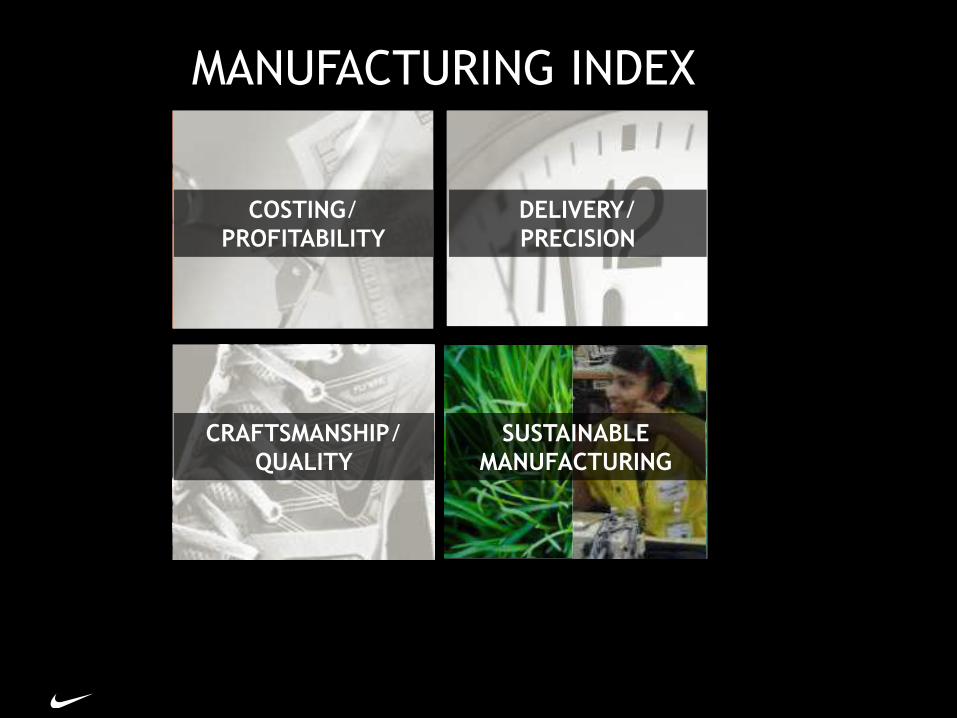
COSTING/
PROFITABILITY
DELIVERY/
PRECISION
CRAFTSMANSHIP/
QUALITY
SUSTAINABLE
MANUFACTURING
MANUFACTURING INDEX

CONSISTENTLY EXCEEDS MINIMUM STANDARDS
MEETS and in some areas may exceed MINIMUM STANDARDS
INCONSISTENT
GLOBAL MANUFACTURING LEADER
DEFINITION: RATING
GOLD
SILVER
BRONZE
YELLOW
RED
Factory performance is rated according to the following definitions:
UNSUCCESSFUL
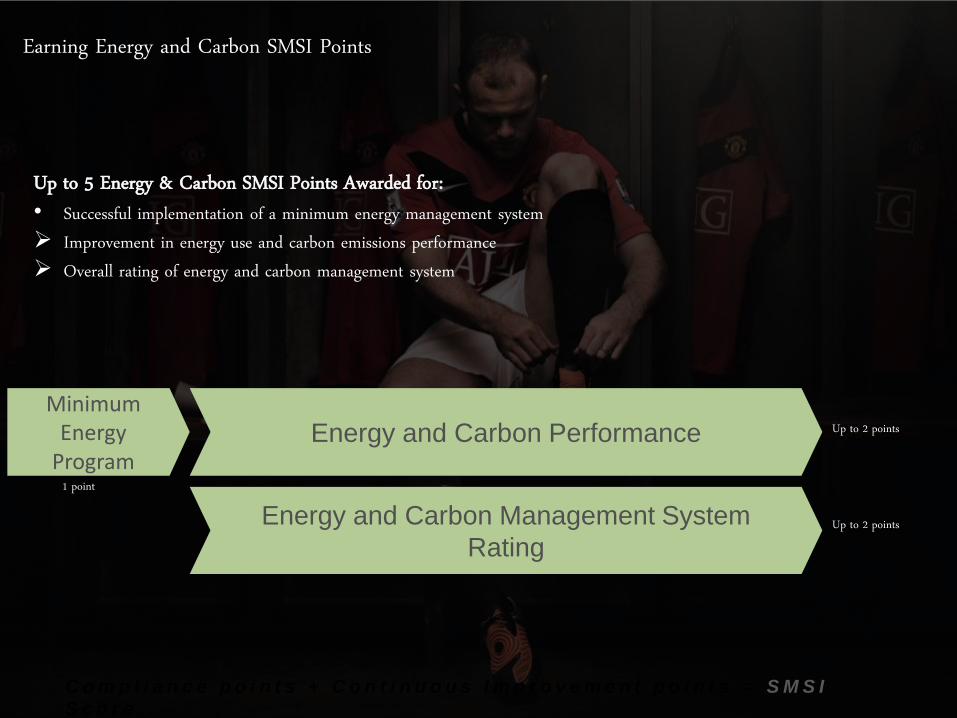
Energy and Carbon Management System
Rating
C o m p l i a n c e p o i n t s + C o n t i n u o u s I m p r o v e m e n t p o i n t s = S M S I
S c o r e
Energy and Carbon Performance
1 point
Up to 2 points
Up to 5 Energy & Carbon SMSI Points Awarded for: • Successful implementation of a minimum energy management system Improvement in energy use and carbon emissions performance Overall rating of energy and carbon management system
Earning Energy and Carbon SMSI Points
Up to 2 points
Minimum Energy
Program

19 ENERGY / CO2
Energy and Carbon Continuous Improvement
Measured by Energy and Carbon Assessment Tool
(Based on Lean Assessment Tool (LAT))
Kaizen Mindset
•Long Term Energy/CO2 Plan
•Annual Energy/CO2 Policy & Activity
•Energy/CO2 Performance Metrics
Built in Quality
•Energy/CO2 PDCA
Just in Time
•New Equipment Introduction
•Energy Pull Systems/Kanban
Operational Stability
•Total Productive Maintenance - Energy
Culture of Empowerment
•Energy Teamwork and Work Teams
•Energy Savings Skill development
Kaizen Mindset
• Energy/CO2 Performance Metrics
Operation Stability
• Total Productive Maintenance - Energy
Culture of Empowerment
• Energy Teamwork and Work Teams
Proliferation – Minimum energy management definition
» Provides a guide for factories to follow to develop an energy program
» Method for Nike to evaluate the progress of development of factory energy programs
Factory specific
energy toolsets Primary Focus:
Existing factories

20 ENERGY / CO2
Energy and Carbon Continuous Improvement
Kaizen Mindset
• Energy/CO2 Performance Metrics
Operation Stability
• Total Productive Maintenance - Energy
Culture of Empowerment
• Energy Teamwork and Work Teams
Proliferation – Minimum energy management definition
Consists of three activities
Provides a robust starting point for continuous improvement efforts
Report energy data into Nike’s One Tool
One Tool automatically calculates total energy use, carbon emissions, and energy
and CO2 KPIs. Used for minimum energy program, SM KPIs, and Nike carbon
footprint calculations. Establishes baseline for factory energy and carbon program.
Include key energy saving procedures into existing TPM program
Results in substantial energy savings and prevents energy waste
Establish a team to develop and deploy energy saving activities
Team is the foundation of the continuous improvement efforts

SM Factory Engagement Opportunities
Community Events
Consulting/Assessments
Training
Calibration/Coaching
Proliferation/Minimum
Standard
Support continuous
improvement efforts of
factories by:
Align energy and CO2 program efforts with sustainable
manufacturing index

199,606,884
8,784,071 4,943,530
110,124,463
91,825,587
8,157,358
71,538,845
229,393,639
128,899,112
0
50,000,000
100,000,000
150,000,000
200,000,000
250,000,000
300,000,000
350,000,000
400,000,000
450,000,000
FW AP EQ
Manufacturing Energy and Carbon Proliferation Report
Nike Brand (FY12)
Not Yet Started
Basic Activity
Minimum Program
3% 3%
52%
81%
30%
9%

23 ENERGY / CO2
Cumulative savings of 2.5B kWhe 220,116 U.S. Homes Nicaragua for one year

24 ENERGY / CO2
New Factory Design Process
Best Practices:
Greenfield factories
Rainwater Harvesting
Solar Exterior Lights
Eco-Pond

25 ENERGY / CO2
Best Practices: Greenfield Factories
Design Charrette: A Design Charrette is an intensive, hands-on workshop that brings people from different disciplines and backgrounds together to explore design options for a particular area or site.
Nike Design Charrette Goal: Integrate best practices into all aspects of factory design
» Building Layout Optimization
» NOS Layout
» Green Architecture
Best Practices:
Greenfield factories
26 ENERGY / CO2
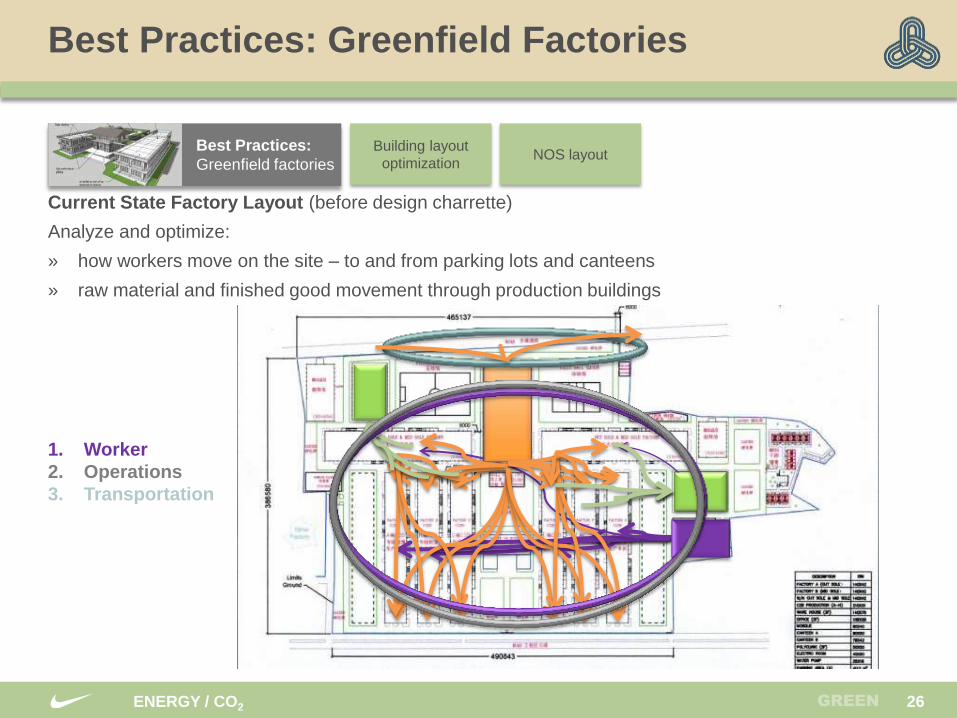
Best Practices: Greenfield Factories
Building layout
optimization NOS layout
Current State Factory Layout (before design charrette)
Analyze and optimize:
» how workers move on the site – to and from parking lots and canteens
» raw material and finished good movement through production buildings
Zones: 1. Worker
2. Operations
3. Transportation
Best Practices:
Greenfield factories
27 ENERGY / CO2
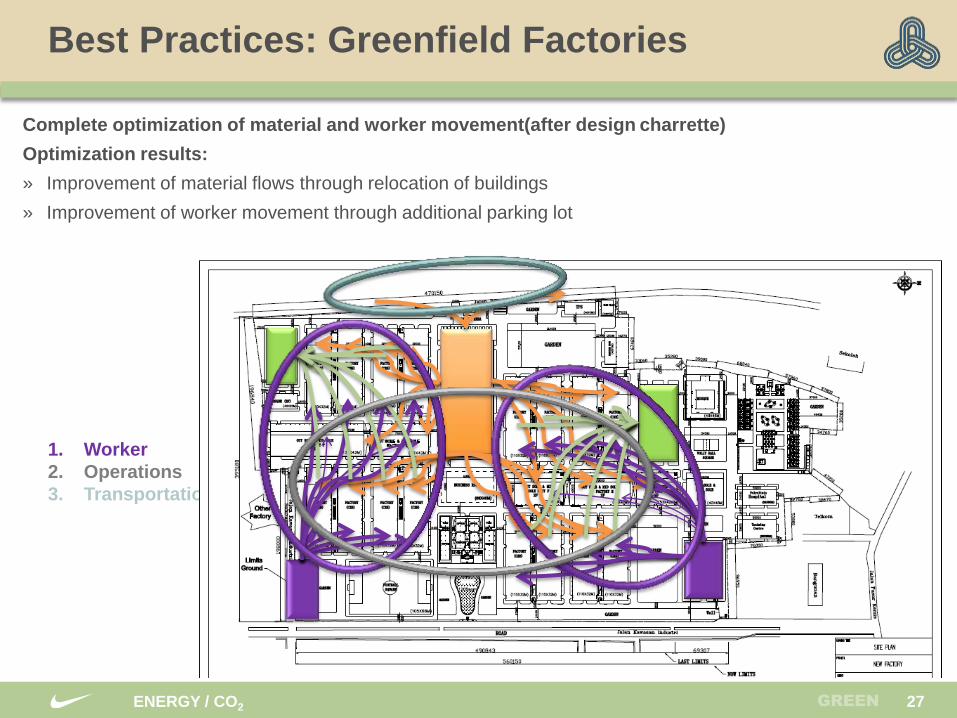
Best Practices: Greenfield Factories
Complete optimization of material and worker movement(after design charrette)
Optimization results:
» Improvement of material flows through relocation of buildings
» Improvement of worker movement through additional parking lot
Zones: 1. Worker
2. Operations
3. Transportation

28 ENERGY / CO2
Best Practices: Greenfield Factories
Integration of Green Design Strategies
Correct integration improves:
» Indoor air temperature
» Worker comfort
» Energy and Water savings
Incorrect integration can:
» Increase construction cost
» Reduced worker comfort
» Increase energy and water use
Green
Architecture
Best Practices:
Greenfield factories