Embed Size (px)
Citation preview
MARINE ECOLOGY PROGRESS SERIES Mar Ecol Prog Ser
Published December 17
Night versus day abundance estimates of zooplankton at two coastal stations in
British Columbia, Canada
W. Shawl, C . L. K. ~ o b i n s o n ~ ~ '
'Fisheries and Oceans Canada, 3225 Stephenson Point Road. Nanaimo, British Columbia V9T 1K3. Canada 2Northwest Ecosystems Institute. Box 513, Lantzville, British Columbia VOR 2H0, Canada
ABSTRACT: Zooplankton abundance at 2 coastal stations in southern British Columbia, Canada, was estimated during the day and the night using oblique bongo net hauls. There were no statistically sig- nificant differences between night and day abundances when calanoid copepods or euphausiids were grouped by species or life history stage. However, statistically significant differences between night and day abundances were found when species and life history stages were considered separately. The euphausiids had the greatest diffcr~nces between night and day catches. The maximum night to day (N:D) catch rdtios were estimated to be 10.6 for Eupl~ausia pacifica and 4.9 for Thysanoessa spinlfera N:D ratios for E. pacifica showed large intrlrannual and station vdriability, and vancd by an order of magnitude. It IS likt~ly that several factors influence these N:D cdtch ratios, including tidal height, moonlight, and the temporal and spatial patchiness of the euphausiids. The majority of calanoid cope- pod genera c~dmined had near equal N:D ratios. The highest copepod N:D catch ratios wrrc found for large female copepods (e g Metridja pacifica or Eucaldnus Dungli), and they ranged from 2 to 8. A few smaller calanoid copepod species had abundance estimates that were statistically higher during the day than the night (e.g N:D - 0.3, Oithona spp.). Overall, we conclude that N:D catch ratios of coastal zooplankton can vary widely within a species over space and time, and that the catch ratios appear to be related to body size: larger animals have higher catches at night. It is recommended that coastal studies using bongo nets to discretely sample copepods or euphausiids should include a 24 h compo- nent In the sampling program to quantify differences between night and day abundance estimates.
KEY WORDS: British Columbia . 24 h sampling . Euphausiids Euphausia pac~fica Night:day catch ratio
INTRODUCTION
Several recent studies have focused on understand- ing the impacts of a changing ocean climate on the production dynamics of important coastal marine fish populations (see articles in Beamish 1995) One aspect of this understanding is to identify and quantify link- ages between the physical/chemical ocean environ- ment and zooplankton communities. These linkages are critical because all developmental stages of most coastal marine fishes include some component of zoo- plankton in their diet. For example, juvenile herring and salmon feed on small zooplankters such as the
'Addressee for correspondence. E-mail: [email protected]
calanoid copepods, while larger fishes such as Pacific hake and adult salmon feed on larger stages and spe- cies of zooplankton such as the euphausi~ds (Ware & McFarlane 1995).
For more than 20 yr, the Canadian Department of Fisheries and Oceans (DFO) has conducted sampling surveys of zooplankton commun.ities at several loca- tions along the west coast of Vancouver Island, British Columbia, to provide data for investigations into link- ages between ocean and fish productivity (e.g. Fulton et al. 1982, Simard & Mackas 1989, Shaw 1994, Mackas 1995, Ware & McFarlane 1995, Shaw unpubl. data). The DFO zooplankton sampling program has relied upon ship-of-opportunity research cruises, and grid-sampling programs such as the La Perouse Project
0 Inter-Research 1998
Resale of full article not pernlitted

144 Mar Ecol Prog Ser 175 143-153, 1998
(Ware & Thomson 1991). For the most part, zooplank- ton sampling cruises have used relatively consistent sampling methodology and gear type (e.g. obl.i.que bongo tows). However, one potentially important and overlooked source of variability in estimating zoo- plankton abundance and biomass during some of the DFO cruises may be the time of day that sampling occurred.
There are potentially large differences in zooplank- ton abundance or biomass estimates when sampling occurs d u r ~ n g the day versus the night, particularly for macrozooplankton such as the euphausiids. For exam- ple, decreased daytime catches of euphausiids might be expected because of deeper daytime depths, due to die1 vertical migrations, and differential avoidance of the sampler. Wiebe et al. (1982) summarized that the primary avoidance stimulus involves day-night varia- tions in ambient light, and that vision is the primary means of net avoidance by euphausilds. Because some adult calanoid copepods reach a large enough size to vertically migrate in response to changing light condi- tions (Mauchline 1998), it follows that their catches may also differ between night and day samples.
The main objective of this study was to test the null hypothesis that there is no significant difference in zooplankton abundance estimates when sampling is conducted during the day versus night. We tested this hypothesis because of the importance in obtaining ground-truthed estimates of zooplankton abundance and biomass for use in process and modelling studies of coastal fish production dynamics (e.g. Robinson &
Ware 1994).
MATERIALS AND METHODS
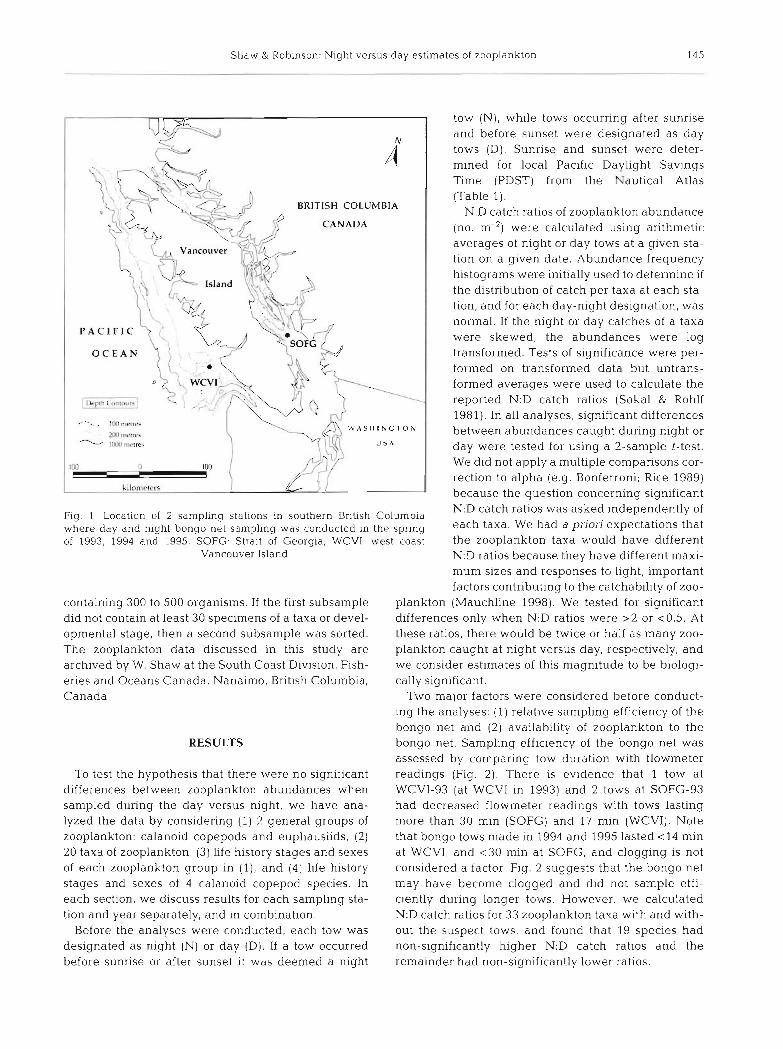
Zooplankton sampling was conducted using a 60 cm diameter bongo net (with two 253 pm black nitex mesh nets) during the spring of 1993, 1994, and 1995 at 2 sta- tions located in southern British Columbia (Table 1, Fig. 1). The first station (SOFG) was located at 49" 22' N, 124" 05' W in the southern Strait of Georgia
near Winchelsea Island. The water properties at SOFG are strongly influenced by seasonal discharge patterns of the Fraser River. The second station (WCVI) was located on the continental shelf off Barkley Sound, at 48" 23.45'N, 125" 20.80' W. Water properties at WCVI are influenced by the Vancouver Island Coastal Cur- rent and the Juan de Fuca Eddy (Thomson et al. 1989).
At each station, bongo tows were conducted every 2 h over a 24 h period in 1994 and 1995; in addition bongo tows were conducted every 1 h at WCVI and every 2 h at SOFG in 1993. Oblique bongo tows were taken from within 5 m of the bottom to surface at both WCVI and SOFG. The bongo net was lowered at about 1 m S-' and raised at 0.3 m S-' obliquely to and from the maximum depth. During a tow, the ship's speed was kept at 3 to 6 km h-' to maintain a wire angle between 30 and 50". The wire angle and the amount of wire out were used to determine the depth at which the bongo net fished. The volume of water filtered during each tow was calculated from a calibrated, stainless steel TSK flowmeter mounted on the inside of the bongo net. After each tow, the outside of the bongo net was washed from the mouth toward the cod-end with a saltwater deck hose. The contents of each cod-end were then transferred to separate 1 litre glass jars, and fixed with buffered 7 % formalin. See Shaw (1994) for more details about the standard sampling methods used.
Zooplankton samples were sorted at the Polish Sea Fisheries Institute Plankton Sorting and Identification Center in Szczecin, Poland, and detailed sorting meth- ods are discussed in Siefert & Incze (t991). Generally, samples of zooplankton from each tow were analyzed for species, stage (e.g. copepodite 4 , adult), size group (e.g. <2 mm, 220 mm), and sex (male and female). For all samples, large organisms such as jellyfish were first removed and noted. The sample was split with a Fol- som plankton splitter to obtain a subsample of about 100 to 200 o r g a ~ s m s >5 mm (maximum dimension). This first split was not made beyond 1/64 of the origi- nal sample. Subsample sizes for organisms c 5 mm var- ied and were often small (1/1024), tvlth the first split
Table 1. Station characteristics and sampling dates for 2 stations sampled for zooplankton using a bongo net. All times in Pacific Daylight Savings Time. Start: time sampling started; SS: sunset; SR: sunrise; D: no. of day tows; N: no. of night tows; WCVI: west
coast Vancouver Island station; SOFG: Strait of Georgia station
WCVI (48" 23.45' N, 125" 20 80' W) SOFG (49" 22.00' N, 124" 05.00' W) Date Start (h) SF? (h) SS (h ) D N Date Start (h] SR (h ) SS (h) D N
1993 12 May 11 15 05:40 20:52 15 8 19May 08:43 05:25 20:58 8 5 1994 21 Jun 15:14 05:15 21:27 8 4 2 Jul I9:51 05:14 21:25 6 3 1995 30 May 14:41 0521 21:13 8 4 10Jun 18:40 05:09 21:21 6 5
Maximum sampling depth
Shaw & Robinson: Night versus day estimates of zooplankton 145
i
BRITISH COLUMBIA
CANADA
,
P A C l F l C
.. .. .. . t m l mvm.
?[K1 rntlrrr - l { l K j nwrwx U S A
k i l o n ~ r t c ~ i J :
tow (N) , while tows occurring after sunrise and before sunset were designated as day tows (D). Sunrise and sunset were deter- mined for local Pacific Daylight Savings Time (PDST) from the Nautical Atlas (Table 1).
N:D catch ratios of zooplankton abundance (no, m2) were calculated using arithmetic averages of night or day tows at a given sta- tion on a given date. Abundance frequency histograms were initially used to determine if the distribution of catch per taxa at each sta- tion, and for each day-night designation, was normal. If the night or day catches of a taxa were skewed, the abundances were log transformed. Tests of significance were per- formed on transformed data but untrans- formed averages were used to calculate the reported N:D catch ratios (Sokal & Rohlf 1981). In all analyses, significant differences between abundances caught during night or day were tested for using a 2-sample t-test. We did not apply a multiple comparisons cor- rection to alpha (e.g. Bonferroni; Rice 1989) because the question concerning significant
Fig. 1 Location of 2 sa~npling stations in southern British Colurnbia N:D catch ratios was asked independently of
where day and night bongo net sampling was conducted In the spring each taxa. We had a priori expectations that of 1993, 1994 and 1995. SOFG- Stralt of Georgia; WCVI: west coast the zooplankton taxa would have different
Vancouver Island N:D ratios because they have different maxi- mum sizes and responses to light, important factors contributing to the catchability of zoo-
containing 300 to 500 organisms. If the first subsample plankton (Mauchline 1998). We tested for significant did not contain at least 30 specimens of a taxa or devel- differences only when N:D ratios were >2 or <0.5. At opmental stage, then a second subsample was sorted. these ratios, there would be twice or half as many zoo- The zooplankton data discussed in this study are plankton caught at night versus day, respectively, and archived by W. Shaw at the South Coast Division, Fish- we consider estimates of this magnitude to be biologi- eries and Oceans Canada, Nanaimo, British Columbia, cally significant. Canada. Two major factors were considered before conduct-
ing the analyses: (1) relative sampling efficiency of the 'bongo net and (2) availability of zooplankton to the
RESULTS bongo net. Sampling efficiency of the bongo net was assessed by con~paring tow duration with flowmeter
To test the hypothesis that there were no significant readings (Fig. 2). There is evidence that 1 tow at differences between zooplankton abundances when WCVI-93 (at WCVI in 1993) and 2 tows at SOFG-93 sampled during the day versus night, we have ana- had decreased flowmeter readings with tows lasting lyzed the data by considering (1) 2 general groups of more than 30 min (SOFG) and 17 min (WCVI). Note zooplankton: calanoid copepods and euphausiids, (2) that bongo tows made in 1994 and 1995 lasted < l 4 min 20 taxa of zooplankton, (3) life history stages and sexes at WCVI, and <30 min at SOFG, and clogging is not of each zooplankton group in (l), and (4) life history considered a factor Fig. 2 suggests that the bongo net stages and sexes of 4 calanoid copepod species. In may have become clogged and did not sample effi- each section, we discuss results for each sampling sta- ciently during longer tows. However, we calculated tion and year separately, and in combination. N:D catch ratios for 33 zooplankton taxa with and with-
Before the analyses were conducted, each tow was out the suspect tows, and found that 19 species had designated as night (N) or day (D). If a tow occurred non-significantly higher N:D catch ratios and the before sunrise or after sunset ~t was deemed a night remainder had non-significantly lower ratios.

146 Mar Ecol Prog Ser 175: 143-253. 1998
WCVI 1993 6000
2000 . 10 11 12 13 14 15
Tow duration (minutes)
SOFG 1993
20 25
Tow duration (minutes)
Fig 2 Comparison of flowmeter readings with duration of bongo tows for SOFG and WCVI in 1993
Another test of the possible clogging of the bongo net is to compare flowmeter readings made between an internally and an externally mounted flowmeter. At WCVI, readings of the inside flowmeter were found to be 9% lower, on average, than the outside meter, while at SOFG inside readings were 2 % higher on average than the outside meter. Overall, the results suggest that sampling efficiencies of the bongo net tows were not significantly affected by clogging, and we retained data from all tows to increase the degrees of freedom in the statistical analyses.
The second factor we considered before conducting analyses was whether zooplankton were available to the bongo net. Strategies used to test the availability of zooplankton to samplers include reducing avoidance by increasing towing speed or increasing net mouth size (Wiebe et al. 1982). In this study, we chose the lat- ter approach and compared bongo net catches of zoo- plankton with catches made from a 1 m by 2 m Tucker trawl with a 253 urn black mesh. Four Tucker tows
were conducted between bongo tows at WCVI-94, and 3 at WCVI-95. The Tucker trawls at WCVI were towed for l l to 20 min to a depth of 100 m and deployedhetrieved at about 1 m S-' One Tucker tow was also conducted between 2 bongo tows at SOFG-94. The trawl at SOFG was towed for < 3 0 min to a depth of 200 m and deployed/retrieved at about 1 m S-'. Com- blned, 4 of the Tucker tows were con- ducted during the day and 4 at night.
Dunng the night, the Tucker trawl caught 65 to 85% of the same species that the bongo nets caught, while during the day the Tucker trawl caught 89 to 124% of the species caught by the bongo nets. It seems that qualitatively both nets were sampling a similar zooplankton commu- nity. We also evaluated for quantitative differences between nets by comparing catches of large-bodied zooplankton, i.e. the euphausiids, because they have the greatest potential for net avoidance. The results indicate that 6 of 8 Tucker trawls gave higher average estimates of euphausiid abundance than did bongo tows conducted immediately before or after the trawl (Fig. 3). However, none of the differences in average abundance be- tween Tucker trawl tows and bongo net hauls were found to be statistically sig- ni.ficant.
Groups of zooplankton
The subsamples of zooplankton were sorted into 2 general groups: calanoid copepods and euphausiids. Examination of the change in abundance at each sta- tion and year indicates that both groups responded in similar ways to sampling conducted over the day, and that there were at least 3 possible patterns in the N:D catch ratios. One pattern identified indicates that zoo- plankton abundance estimates remained within a rela- tively small range over time, except for a very sudden 4- to 10-fold increase in abundance with 1 tow (Fig. 4). N:D catch ratios for this pattern were generally below 1. This pattern may result from sampling a patch of zooplankton. A second pattern id.entified indicates that zooplankton abundance estimates fl.uctuate by up to 2 times even when sampling occurs every hour (Fig. 5). N:D catch ratios for this pattern typically approximated 1 The third pattern identified indicates that the high- est N:D catch ratios were associated with high night and low day catches of zooplankton, part~cularly for

Shaw & Robinson: Night versus day estimates of zooplankton 147
8 Three copepods, Metridia pacifica,
Calanus pacificus, and Clausocalanus
7 spp., showed 1 occurrence each in which night catches were significantly -
E higher than day catches (N:D ratio =
I ' 4.5, 2.6 and 3.1, respectively), while a 3 other copepods (Oithona spp., Neo- - 8 5 calanus spp., Pseudocalanus spp.) m V showed 1 occurrence each ln which 2 B N:D catch ratios were significantly 4 4 E B
less than 0.5 (Table 2), indicating that m day catches were more than twice
4 3 those of night catches. 0 m
E 5 2 0" Zooplankton life history stages
and sex 1
We examined for differences in
o night and day catches of zooplankton 9 6 T m 94T307 94T309 96T311 WTFI S-TNS 95-TS~ 95.~3~9 95TFI segregated by llfe history stage and by
Year and tucker trawl number sex for the 2 general groups of zoo-
Flg. 3. Comparison of euphausiid abundance estlrnates using a Tucker trawl and plankton! calanoid copepods and eu- bongo hauls. Bongo hauls were performed immediately before and after the phausiids, discussed above. Tucker trawl. None of the differences are statistically significant (p > 0.05). Note: Six life history stages were identi- abundances represent averages and S D of all euphaus~id species and stages fied for all calanoid copepods
caught bined: copepodite 1 (Cl ) , copepodite 2 (C2), copepodite 3 (C3), copepodite 4
the larger animals such as the euphausiids. This pat- (C4), copepodite 5 (C5), and adults. When the calanoid tern typically shows a relatively rapid decline in abun- copepods were broken down by stage, 4 of 6 sampling dance as dawn approaches, and a rapid increase in periods show an increasing trend in N:D catch ratios abundance after dusk (Fig. 6). N:D catch ratios were with increasing stage size (Table 3). Note that for sam- typically >2. ples collected in 1995, there was a trend for higher N:D
ratios with the smallest stage (copepodite 1).
Zooplankton species
SOFG 1993 Abundance estimates of 20 zooplankton 250000 - 75000
taxa were examined for significant differ- 1
ences between day and night catches. Of the C ,o,oo Calanovds (N:D ;038\ -7 1 600W E 102 N:D ratios calculated, about 17 4,) (n = 17) 0
L+Luphau~i~d~ (N D = 0 91) - - 0 - had significantly different day-night catch W 2 150WO 45000 g ratios: 9 had significantly higher night than U
day catches, w h ~ l e 8 had significantly higher 2 3 n
day catches (Table 2). Of the significantly G looooO 130000 m E .-
higher N:D catch ratios, the majority be- g m 4 - c
longed to the euphausiids. Euphausia paci- g 50000 - l5000 2 W
fica abundance in 4 of the 9 night catches was significantly higher than in day catches. The o ~ : : : , , : , ' ~ , ' o
N - l l - r v
N:D catch ratios of E. pacifica varied froin ~~~~~~~~~~~~~ 0.50 to 10.6, with an overall average N:D Hour
catch ratio of 4.3. A second euphausiid, Fig. 4. Changes in calano~d copepod and euphausiid abundances over
Thysanoessa spinifera' had N:D catch ratios time, as determined from day (m) and night (m) bongo tows at SOFG in ranging from 1.6 to 4.9, with an average N:D 1993. Shown in parentheses are the estimated niqht:dav (N:DI catch catch ratio of 4.5 (Table 2). ratios

Mar Ecol Prog Ser 175: 143- 153, 1998
Limited data were available de- WCVI 1994
scribing changes in N:D catch ratios for different life history stages of indi- vidual calanoid species. Of the 4 spe-
'E cies (Calanus spp., Pseudocalanus 6
spp., Eucalanus bungji, and Metridia g pacifica) and 3 stages (C4, C5, adult)
m examined, only 4 of the 72 samples 2 had significantly higher N:D catch m
ratios (Table 4). - C
An examination of the changes in 3 abundance of males and females for the 4 copepod species indicates that females tend to have higher N:D catch 0024 0118 0316 0527 0715 0920 1110 1337 1514 1734 1916 2127
Hour ratios (Table 4) . There were several clear examples of higher night catches Fig 6. Changes in calanoid copepod and euphausi~d abundances over time, as than day catches for females, For deterrn~ned from day (D) and night (m) bongo tows at WCVI in 1994. Estimated example, adult Metridid pacifica and night.day (N.D) catch ratios shown in parentheses. Miss~ng Ilnes. no euphausi-
ids caught adult Eucalanus bungii females showed N:D catches of 3.7 and 2.3, re- spectively (Fig. 7). Overall, female zooplankters had an average N:D ratio of 1.7 versus 1.2 for males. This result is consistent with the generally larger body size (length) of females.
Six life history stages were identified for the euphausiids: nauplius, furcilia, calyptopis 1, calyptopis 2, calyptopis 3, and adults. Analysis indicates that there were no statistically significant differences be- tween night and day abundance estimates for stages smaller than adult (Table 5) . However, in 5 of 6 instances adult euphausiids had statistically signifl- cantly higher abunda.nce estimates when bongo sam- pling was conducted at night versus day. When data from all stations were combined the N:D catch ratio for adult euphausiids was 3.6. There were too few data to
make any generalizations about N:D catch ratios and the sex of euphausiids (Table 5).
DISCUSSION
In this study we evaluated for changes in night ver- sus day abundance estimates of zooplankton as mea- sured using oblique bongo net tows at 2 stations in southern British Columbia. The data were evaluated by considering (1) 2 generic groups of zooplankton, (2) 13 zooplankton taxa, and (3) life history stage and sex.
We found relatively few statistically significant dif- ferences between night and day catches of calanoid
copepod genera, life history stages, or sexes. The species, stages, and sexes
W C V I ~ S S ~ that exhibited significantly higher 250000 l MOO N:D ratios tended to be the largest
- copepods. For example, female Eu- " "
'E calanus bungii and female Calanus '5 200000 12000 0 C - c spp. females had significantly higher - o N:D cdlch ratios and they are 6 to c U 4 8 mm and 2.6 to 3.1 mm in length, 5 1- S o $ respectively (Fig 7). Verheye & Field E (1992) also noted that N:D differences e 1 100000 ,,, 2 in catch were higher in larger stages U 3 of Calanoides carinatus, with adult
females exhibiting the highest N:D
50000 3000 catch ratio of 2.7. At this time there is 0020 0220 0419 0617 0820 l018 l218 1418 1621 1835 2017 2217 insufficient information available to
Hour determine if the higher N:D catch
Fig. 5. Changes in calanoid copepod and euphausiid abundances over time, as latios of larger copepods are
determined from day (o) and night (B) bongo tows at WCVI in 1993. Estimated to better visual detection of the bongo night:day (N:D) catch ratios shown in parentheses net, or detection of the bowwave of

Shaw & Robinson: Night versus day estimates of zooplankton
Table 2. Night to day (N:D) catch ratios for selected zooplankton taxa sampled at WCVI and SOFG for 1993 to 1995. N:D ratios significantly >2 or <0.5 are given in bold (p < 0.05). Note: N:D for all years combined calculated from raw data not ratio data
Taxon SOFG WCVl SOFG WCVI Both stations 1993 1994 1995 1993 1994 1995 1993-1995 1993-1995 1993-1995
Centropages spp. Oithona spp. Chaetognatha Thecosomata Hyperiidea Eupha usia pacifica Thysanoessa spinifera Cirripedia Fish/Teleostei larvae Ostracoda Acartia spp. Clausocalanus spp. Neocalanus spp. Paracalanus spp. Pseudocalanus spp. Calanus marshallae Calanus pacificus Eucalanus bungii Metrjdia pacifica Oncaeidae
the net, or to their being less available to the sampler than smaller copepods (Mauchline 1998).
Day abundance estimates for small-bodied zoo- plankton were occasionally found to be 2 to 3 times higher than night estimates (e.g. Pseudocalanus spp.). Brinton & Townsend (1981) also noted that sampling 3 to 6 mm euphausiids (Euphausia pacifica) using bongo nets and 1 m ring nets, in summer, was more effective in the daytime than at night. Robinson & Ware (1994) indicated that copepod abundances were 1.5 to 3 times higher in daytime bongo catches compared to night time catches. In this study, because average abun- dances were depth-integrated, the lower catches of some smaller copepods during the night suggests that they migrated below the maximum depth sampled by the bongo net. However, because sampling was con- ducted to within 5 m of the bottom, and the maximum depths sampled were substantially deeper than the depths to which cope- pods can vertically migrate ( ~ ~ ~ ~ h - Table 3. N:D catch ratios by stage and sex for calanoids caught at WCVI and
SOFG. C l . copepodite 1; C2: copepodite 2. C3: copepodite 3, C4: copepodite 4 , line 1998)1 we discount the idea that C5: copepodite 5. N:D ratios in bold: statistically significant differences between our nighttime copepod estimates were night and day abundances (p < 0.05) low. The high daytime catches of copepods, however, may be related to environmental conditions at the time of sampling. For example, there was a significant positive correlation be- tween the east-west component of tidal velocity and abundance of cope- pods at SOFG in 1993 (Fig. 8). Overall, we suspect that the low N:D catch
ratios of smaller zooplankton were determined primar- ily by environmental conditions at the time of sampling rather than behavioral responses to the bongo net.
The strongest evidence for significant differences between night and day abundance estimates comes from sampling the euphausiids, particularly the adults. We found N:D catch ratios averaged between 4 and 5 for the 2 main species caught, Thysanoessa spinifera and Euphausia pacifica. The average N:D catch ratios estimated for the euphausiids were near the low end of the range of maximum N:D catch ratios reported for a variety of euphausiids in other studies (Table 6). Overall, higher night catches were expected for euphausiids because they were not sam- pled effectively during daylight hours due to vertical migratory behavior and to their visual avoidance of the sampling net.
C1 C2 C3 C4 C5 Adult Male Female
WCVI-93 0.62 0.82 0.72 0.67 0.79 0.83 0.98 0.60 SOFC-93 0.50 0.56 0.62 0.86 0.76 0.70 17.43 SOFC-94 0.44 0.72 0.81 1.00 1.27 1.09 0.03 0.00 WCVI-94 0 9 5 0.97 0.72 1.00 1.13 1.23 0.84 2.18 WCVI-95 1.52 1.11 0.80 0.65 0.66 0.69 2.87 1.23 SOFG-95 1.44 0.85 1.07 0.90 1.03 0.95

Mar Ecol Prog Ser 175: 143-153, 1998
Table 4. N:D catch ratios for 3 life history stages, copepodite 4 (C4), copepodite 5 (C.51, and adult (AdJ, and for 4 specres of calanoid copepods. Limited data is also shown for C5 males and females and adults for each species. N:D ratios in bold: statisti-
cally significant differences between night and day abundances ( p < 0.05)
Station-year Life history stage Calanus spp. Pseudocalanusspp. Eucalanus bungu h4etndia pacrfica
SOFG-93 C4 1.18 0.90 0 93 0.53 C5 1.03 0.84 0.71 0.75 Ad 0.48 0.68 0.20 0 82
WCVI-93 C4 1.1.0 0.70 3.1 0.63 C5 1 .7 1 0.75 2.45 0.79 Ad 1.57 0.77 1.66 3.27
SOFG-94 C4 0.43 1 64 C5 2.08 1.02 1.13 1.38 Ad 1.09 0.90
WCVI-94 C4 2.75 0.76 0.68 C5 1.09 1.21 Ad 1.22 1.80
SOFG-95 C4 7.5 1.48 0.85 0.65 C5 4.1 0.95 0.61 0.89 Ad 1.94 0.91 1.28 0.97
WCVI-95 C4 0.38 0.43 1.42 C5 0.27 0.28 1.42 2.46 Ad 0.14 0.42 8.49
WCVI-93 Ad males 1.0 0.82 0.34 2.8
WCVI-93 Ad females 2.1 0.63 2.32 3.7
WCVI-93 C5 males 0.68 1.87 0.65
WCVI-93 C5 females 0.68 1.20 1.1
adult female E. bungii (6-8mm) N:D = 2.3
adult females M. pacifica (2.6-3.lmm) MD = 3.7
I adult females Calanus spp.
0020 0220 0419 0617 0820 l018 1218 1418 1621 1835 M17 2217
Hour
An interesting property of the N:D ratios calculated for Euphausia pacifica is that they varied by more than an order of magnitude over the course of the study. This result implies that many factors potentially influence the eu- phausiid N:D catch ratios. We had suffi- cient data to examine only a couple of these factors. One coastal oceanic factor that may influence the hourly abun- dance estimates made by the bongo net are tidal conditions. Hourly tidal model estimates were obtained for each sta- tion from M. Foreman, Institute of Ocean Sciences, Sidney, British Colum- bia. The tidal estimates included tidal height above mean tide (m) , and tidal current velocity averaged for the whole water column (north-south and east- west components in cm S- ' ) . We con-
Fig. 7. Significant N:D catch ratios and abun- dances over time for 3 species of calanoid copepods sampled dunng night (M) and day (D) . Data from WCVI, 1993. Missing lines: no
copepods caught

Shaw & Robinson: Night versus day estimates of zooplankton 151
Table 3. N:D catch ratios calculated for various stages and sexes of euphausiids Statisticdllv significant differences between niqht and day abundances: ' p < 0.05, "p < 0.01
I Nauplius Furci.lia Calvptopls l Calyptopis 2 Calyptopis 3 Adult Male Female I WCVI-1993 1.0 SOFG-1993 0.8 SOFG-1994 LYCVI-l994 SOFG-1995 1.4 WCVI-1995 0.6 Combined 0.8
ducted correlation analyses between hourly esti- mates of abundance of euphausiids and the hourly tidal data.
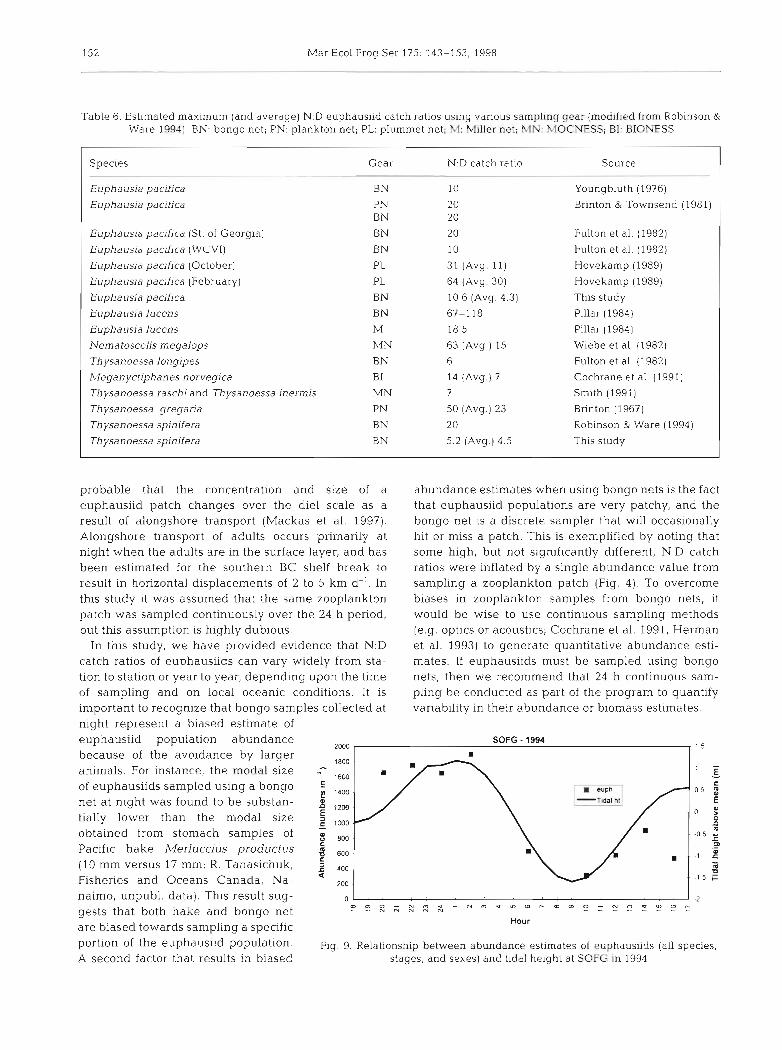
Three of the 6 correlations between Euphausia paci- fica abundance and tidal height were found to be sta- tistically significant. Two of these correlations indi- cated higher euphausiid catches with higher tidal height at WCVI-95 and SOFG-94 (Fig g), while a sig- nificant negative correlation was detected between tidal height and E. pacjfica abundance at SOFG-95. The correlations detected may be spurious because spring tides in coastal BC waters are strongly diurnal, and in early summer the timing of lower low water is during late morning. Hence, diurnal tides are ap- proximately synchronous with daylight, and they Inay be confounded variables (Fig. 9).
It is also possible that ambient light during sampling influences catches of Euphausja pacifica, primarily as a result of increased visual detection of the net with vari- able light levels in the water column (Mauchline 1980). It has also been shown that the vertical range of eu- phausiids is directly proportional to the intensity of moonlight and that the range of depth distribution deepens in relation to the full
visual avoidance of the bongo sampler by thc euphausi- ids (Anderson & Nival 1991).
Another factor that may also be responsible for the large interannual and interstation variability observed in Euphausia pacifica N:D ratios is the inherent tempo- ral and spatial variability in euphausiid populations. For example, we know that euphausiids such as E. pacifica are highly patchy in their horizontal distribu- tions on the southern Vancouver Island shelf, and that this patchiness changes year to year. In some years euphausiids occur in distinct patches because of 'good' local upwelling conditions, while in other years eu- phausiids are more dispersed because of poor coastal upwelling (Ware 61 McFarlane 1995). We can, how- ever, likely discount the effects of seasonal variability on euphausiid N:D catch ratios because sampling tvas conducted in the spring of each year, the period before the arrival of the major euphausiid predator, Pacific hake Merluccius productus. These voracious predators can significantly influence the abundance of euphausi- ids in a local region (Roblnson R Ware 1994, Ware & McFarlane 1995, Robinson unpubl. data). It is also
moon (Roger 1974 in Mauchline 1980). In 2500(]0 - 20
this study, sarnpling occurred over a gra- d ~ e n t of moonlight conditions ranging
200000
from a full moon (WCVI-94) to a new E moon (WCVI-95). We found a significant o
5 positive correlation between E. pacifica '50000
N:D catch ratios and the time of moon set E (r = 0.81; n = 6, p < 0.05). The time that the E rooooo moon sets is directly related to the num- E ber of days from a full moon. Thus, the E. pacifica N:D catch ratios increase by 50000
about 5 times when sampling 1s con- ducted closer to a new moon because
o . : , . ; , , , ; . , , , ; : . : : , , , , , . - 20 night abundance estimates increase. We 2 p ~ ~ ~ o - ~ n v - ~ o v n m + r n r n o ~ ~ ~ ~ N N N N N
did not measure light intensity in the Hour
water but presumably with a new Fig. 8. Relationship between abundances of calanoid copepods (all spec-ies, moon there is less light in the water col- stages and sexes) and the east-\vest component of tidal currt-rlt trelucity at umn at night, and subsequently less SOFG in 1993
152 Mar Ecol Prog Ser 175: 143-153, 1998
Table 6. Est~mated maximum (and average) N:D euphausiid catch ratios using various sampling gear (modified from Robinson & Ware 1994). BN: bongo net; PN: plankton net; PL: plummet net; hl: 4liller net; hlN: hIOCNESS; BI: BIONESS
Species Gear N:D catch ratio Source
Euphausia pacifica BN 10 Youngbluth (1976)
Euphausia pacifica PN 20 Brinton & Townsend (1981) BN 20
Euphaus~a pacifica (St. of Georgia) BN 20 Fulton et al. (1982)
Eupha usia pac111ca (WCVI) B N 10 Fulton et al. (1982)
Euphaus~a paaflca (October) PL 31 (Avg. 11) Hovekamp (1989)
Euphaus~a pacifica (February) PL 64 (Avg. 30) Hovekamp (1989)
Euphausia pacifica BN 10.6 (Avg. 4.3) This study
Euphausia Iucens BN 67-118 Pillar (1984)
Euphausia lucens M 18.5 Pillar (1984)
Nematoscelis rnegalops MN 63 (Avg.) 15 Wiebe et al. (1982)
Thysanoessa longipes BN 6 Fulton et al. ( l 982)
Meganyctiphanes norvegica B1 14 (Avg.) 7 Cochrane et al. (1991)
Thysanoessa raschi and Thysanoessa inerrnis MN 7 Smith (1991)
Th ysanoessa gregaria PN 50 (Avg.) 23 Brinton (1967)
Thysanoessa spin~fera BN 2 0 Roblnson & Ware (1994)
Thysanoessa sp~nifera BN 5.2 (Avg.) 4.5 Thls study
probable that the concentration and size of a euphausiid patch changes over the die1 scale as a result of alongshore transport (Mackas et al. 1997). Alongshore transport of adults occurs primarily a t night when the adults are in the surface layer, and has been estimated for the southern BC shelf break to result in horizontal displacements of 2 to 5 km d-'. In this study it was assumed that the same zooplankton patch was sampled continuously over the 24 h penod, but this assumption is highly dubi0u.s.
In this study, we have provided evidence that N:D catch ratios of euphausilds can vary wide1.y from sta- tion to station or year to year, depending upon the time of sampling and on local oceanic conditions. It is important to recognize that bongo samples collected at night represent a biased estimate of
abundance estimates when using bongo nets is the fact that euphausiid populations are very patchy, and the bongo net is a discrete sampler that will occasionally hit or miss a patch. This is exemplified by noting that some high, but not significantly different, N:D catch ratios were inflated by a single abundance value from sampling a zooplankton patch (Fig. 4). To overcome biases in zooplankton samples from bongo nets, it would be wise to use continuous sampling methods (e.g. optics or acoustics; Cochrane et al. 1991, Herm.a.n et al. 1993) to generate quantitative abundance esti- mates. If e'uphausiids must be sampled using bongo nets, then we recommend that 24 h continuous sam- pling be conducted as part of the program to quantify variability in their abundance or biomass estimates.
euphausiid population abundance because of the avoidance by larger animals. For instance, the modal size 7 of euphausiids sampled using a bongo E
net at night was found to be substan- S tially lower than the modal size = obtained from stomach samples of 8 Pacific hake Merluccius productus 5 (10 mm versus 17 mm; R . Tanasichuk, 2 Fisheries and Oceans Canada, Na-
SOFG - 1994
naimo, unpubl. data). This result sug- o . . 2 ~ m a - ~ o ~ - ~ n ~ n r n ~ m r n ~ ~ ~ ~ ~ y ~ ~
gests that both hake and bongo net - N N N N N
Hour are biased towards sampling a specific portion of the eu~haus i id ~ o ~ u l a t i o n . Fig. 9. Relationship between abundance estimates of euphausiids (all species, A second factor that results in biased stages, and sexes) and tidal height at SOFG in 1994

Shaw & Robinson: Night versus day estimates of zooplankton
LITERATURE CITED
Anderson VP, Nival (1991) A model of the diel vertical migra- tion of zooplankton based on euphausiids. J Mar Res 49: 153-175
Beamish RJ (ed) (1995) Climate change and northern fish populations. Can Spec Publ Fish Aquat Sci 121
Brinton E (1967) Vertical migration and avoidance capability of euphausiids in the California Current. Lirnnol Oceanogr 12:451-483
Brinton E. Townsend AW (1981) A comparison of euphausiid abundances from bongo and l-m CalCOFI nets. CalCOFI Rep 22:lll-125
Cochranc N.A. Sameoto D, Herman AW, Neilson J (1991) Mul- tiple-frequency acoustic backscattering and zooplankton aggregations in the inner Scotian Shelf basins. Can J Fish Aquat Sci 48:340-355
Fulton J , Ara~ MN, Mason JC (1982) Euphausi~ds, coelenter- ates, ctenophores, and other rooplankton from the Cana- dian Pacific coast ichthyoplankton survey, 1980. Can Tech Rep Fish Aquat Sci 1125
Herman AW, Cochrane NA, Sameoto DD (1993) Detection and abundance estimation of euphausiids using an optical plankton counter. Mar Ecol Prog Ser 94,165-173
Hovekamp S (1989) Avoidance of nets by Euphausia pacjfjca in Dabob Bay. J Plankton Res 11:907-924
Mackas DL (1995) Interannual variability of the zooplankton community off southern Vancouver Island. In: Bearnish RJ [ed) Climate change and northern fish populations. Can Spec Publ F~sh Aquat Sci 121:603-615
Mackas DL, Kieser R, Saunders M, Yelland DR. Brown RM, Moore DF (1997) Aggregation of euphausiids and Pacific hake (Merluccius productus) along the outer continental shelf off Vancouver Island. Can J Fish Aquat Sci 54: 2081-2096
Mauchline J (1980) The biology of the mysids and euphausi- ids. Adv Mar Biol 18
Mauchline J (1998) The biology of the calanoid copepods. Adv Mar Biol33
Pillar SC (1984) A comparison of the performance of four zoo- plankton samplers. S Air J Mar Sci 2:l-18
Acknowledgements. We thank Dr L. Ejsymnot and the Polish Rice WR (1989) Analyzing tables of statistical tests. Evolution Plankton Identification and Sorting Center for carefully sort- 43:223-225 ing the zooplankton samples. Dr M. Foreman of the Institute Robinson CLK, Ware DM (1994) Modelling pelagic fish and of Ocean Sciences (DFO) k~ndly provided tidal height model plankton trophodynamics off southwestern Vancouver Is- estimates. Dr J. Napp of the National Marine Fisheries Ser- land, British Columbia. Can J Fish Aquat Sci 51-1.737-1751 vice, Seattle. Dr D. Mackas (DFO), and 3 anonymous review- Shaw W (1994) Oceanographic sampling manual for the long- ers provided valuable comments on the manuscript. term cooperative plankton research monitoring program
(COPRA). Can Tech Rep Fish Aquat Sci 1976 Siefert DLW, Incze LS (1991) Zooplankton of Shelikof Strait,
Alaska, April and May 1989: data from Fist~~ries-Ocean- ography Coordinated Investlgations (FOCI) Cruises. .llaska Fisheries Science Center Processed Report 91-16, National Marine Fisheries Service. Seattle
Simard Y. Mackas DL (1989) Mesoscale aggregations of euphausiid sound scattering layers on the continental shelf off Vancouver Island. Can J Fish Aquat Sci 46: 1238-1249
Smith SL (1991) Growth, development and distribution of the euphausiids Thysanoessa raschii (M. sars) and Thysa- noessa inermis (Kroyer) in the southeastern Bering Sea. In: Sakshaug E, Hopkins CCE, Oritsland, NA (eds) Pro Mare Syn~p Polar Mar Ecol, Trondheim, 12-16 May 1990. Polar Res 10(2):461-478
Sokal RR, FJ Rohlf (1981) Biometry. Freeman and Company, New York
Thomson RE, Hickey BM, LeBlond PH (1989) The Vancouver lsland coastal current: fisheries barrier and conduit. In: Beamish RJ, McFarlane GA (eds) Effects of ocean variabil- ity on recruitment and an evaluation of parameters used in stock assessment models. Can Spec Pub1 Fish Aquat Sci 108:265- 296
Verheye Hh.1, Field JG (1992) Vertical distribution and diel vertlcal migration of Calanoides carinatus (Kroyer, 1849) development stages In the southern Bengu.ela upwelling region. J Exp Mar Biol Ecol 158(1992):123-140
Ware DM, McFarlane GA (1995) Climate induced changes in hake abundance and pelagic community interactions in the Vancouver Island Upwelling System. In: Beamish RJ (ed) Climate change and northern fish populatlons. Can Spec Publ Fish Aquat Sci 121:509-521
Ware DM. Thomson RE (1991) La Perouse Project: sixth annual report, 1990 Canadian Department of Fisheries and Oceans Internal Report. Pacific Biological Station, Nanaimo, BC
Wiebe PH, Boyd SH, Davis BM, Cox J L (1982) Avoidance of towed nets by the euphausiid ~Vernatoscelis megalops. Fish Bull US 80:?5-91
Youngbluth MJ (1976) Vertical distribution and diel migration of euphausiids in the central region of the California Cur- rent Fish Bull US 74-925-936
Editorial responsibility: Otto Kinne (Editor), Oldendorf/Luhe, Germany
Submitted: May 5, 1998; Accepted: August 3, 1998 Proofs received from author(s): November 17, 1998