Embed Size (px)
Citation preview
1Co
pyr
igh
t ©
20
17
Th
e N
iels
en
Co
mp
an
y. C
on
fid
en
tia
l an
d p
rop
rie
tary
.C
op
yrig
ht
© 2
01
7 T
he
Nie
lse
n C
om
pa
ny.
Co
nfi
de
nti
al a
nd
pro
pri
eta
ry.
OOH Online Activation Survey Conducted March 20 – 30, 2017
Diane WilliamsSenior Media Research Architect
2Co
pyr
igh
t ©
20
17
Th
e N
iels
en
Co
mp
an
y. C
on
fid
en
tia
l an
d p
rop
rie
tary
.
Table of Contents
Slide Number
Introduction 3
Survey Questions 4
Significant Finding 5
Definition of Terms 6-8
Key Findings 9
Online Activations from OOH, past six months 10
Online Activations From TV, Radio and Print, past six months 11
Ad Spend Share 12
Calculating Search Activation Share 13
Activation Share for OOH 14
Online Activations Indexed Against Media Spend 15-16
3Co
pyr
igh
t ©
20
17
Th
e N
iels
en
Co
mp
an
y. C
on
fid
en
tia
l an
d p
rop
rie
tary
.
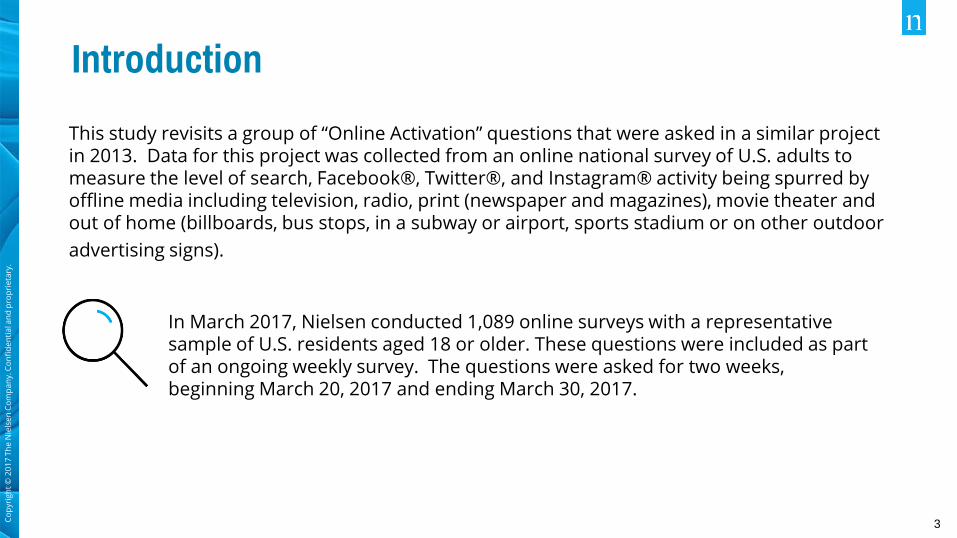
Introduction
This study revisits a group of “Online Activation” questions that were asked in a similar project in 2013. Data for this project was collected from an online national survey of U.S. adults to measure the level of search, Facebook®, Twitter®, and Instagram® activity being spurred by offline media including television, radio, print (newspaper and magazines), movie theater and out of home (billboards, bus stops, in a subway or airport, sports stadium or on other outdoor
advertising signs).
In March 2017, Nielsen conducted 1,089 online surveys with a representative sample of U.S. residents aged 18 or older. These questions were included as part of an ongoing weekly survey. The questions were asked for two weeks, beginning March 20, 2017 and ending March 30, 2017.
4Co
pyr
igh
t ©
20
17
Th
e N
iels
en
Co
mp
an
y. C
on
fid
en
tia
l an
d p
rop
rie
tary
.
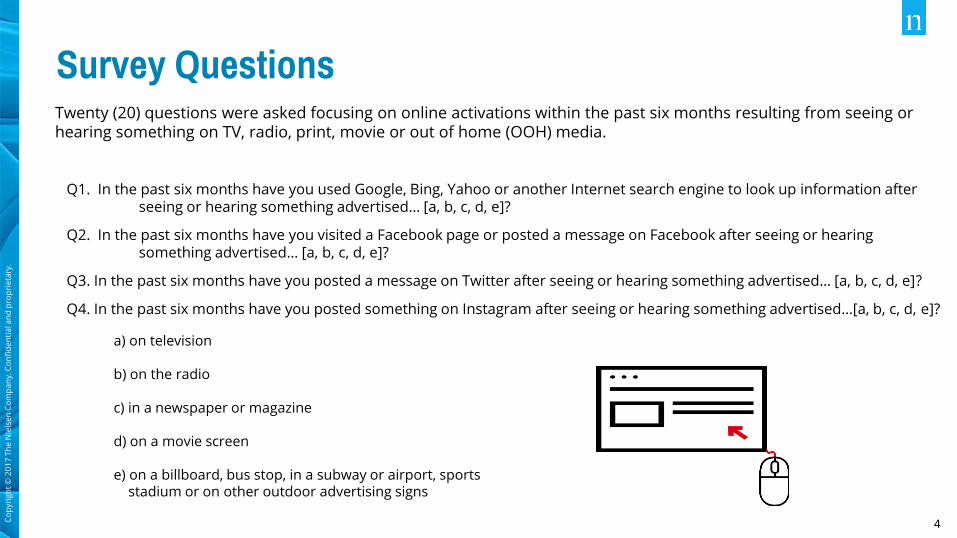
Survey QuestionsTwenty (20) questions were asked focusing on online activations within the past six months resulting from seeing or hearing something on TV, radio, print, movie or out of home (OOH) media.
Q1. In the past six months have you used Google, Bing, Yahoo or another Internet search engine to look up information after seeing or hearing something advertised… [a, b, c, d, e]?
Q2. In the past six months have you visited a Facebook page or posted a message on Facebook after seeing or hearing something advertised… [a, b, c, d, e]?
Q3. In the past six months have you posted a message on Twitter after seeing or hearing something advertised… [a, b, c, d, e]?
Q4. In the past six months have you posted something on Instagram after seeing or hearing something advertised...[a, b, c, d, e]?
a) on television
b) on the radio
c) in a newspaper or magazine
d) on a movie screen
e) on a billboard, bus stop, in a subway or airport, sports stadium or on other outdoor advertising signs
5Co
pyr
igh
t ©
20
17
Th
e N
iels
en
Co
mp
an
y. C
on
fid
en
tia
l an
d p
rop
rie
tary
.
Significant Finding
Out of home media continues to deliver more online activity per ad dollar spent compared to television, radio and print (newspapers and magazines).
Online activations including search, Facebook, Twitter and Instagram activity generated by out of home advertising indexes at nearly four times the rate we would expect given its relative ad spend. For example, outdoor media accounts for 26% of gross search activations generated by television, radio, print and out of home combined but it only accounts for 7% of the total combined advertising spend. These findings are consistent with the results from the 2013 study.
6Co
pyr
igh
t ©
20
17
Th
e N
iels
en
Co
mp
an
y. C
on
fid
en
tia
l an
d p
rop
rie
tary
.
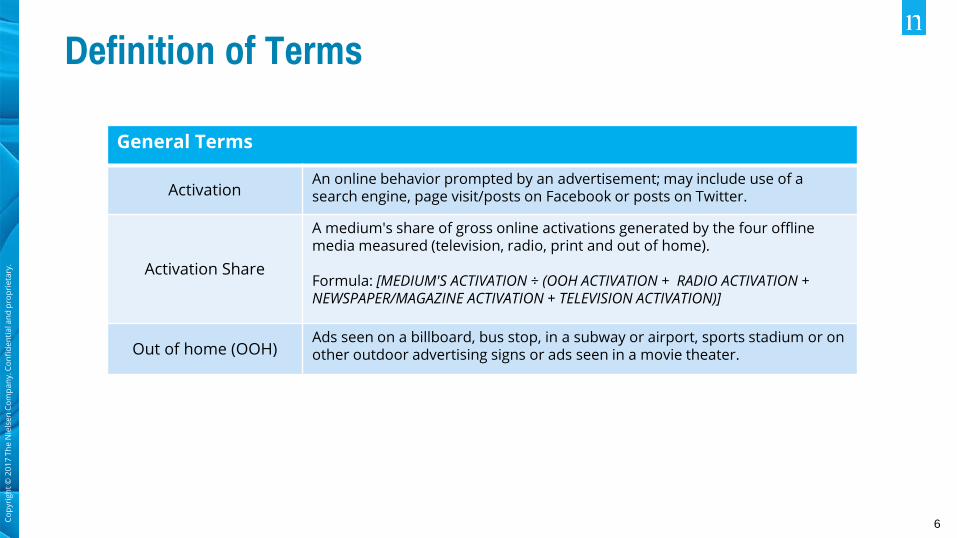
Definition of Terms
General Terms
ActivationAn online behavior prompted by an advertisement; may include use of a search engine, page visit/posts on Facebook or posts on Twitter.
Activation Share
A medium's share of gross online activations generated by the four offline media measured (television, radio, print and out of home).
Formula: [MEDIUM'S ACTIVATION ÷ (OOH ACTIVATION + RADIO ACTIVATION + NEWSPAPER/MAGAZINE ACTIVATION + TELEVISION ACTIVATION)]
Out of home (OOH)Ads seen on a billboard, bus stop, in a subway or airport, sports stadium or on other outdoor advertising signs or ads seen in a movie theater.
7Co
pyr
igh
t ©
20
17
Th
e N
iels
en
Co
mp
an
y. C
on
fid
en
tia
l an
d p
rop
rie
tary
.
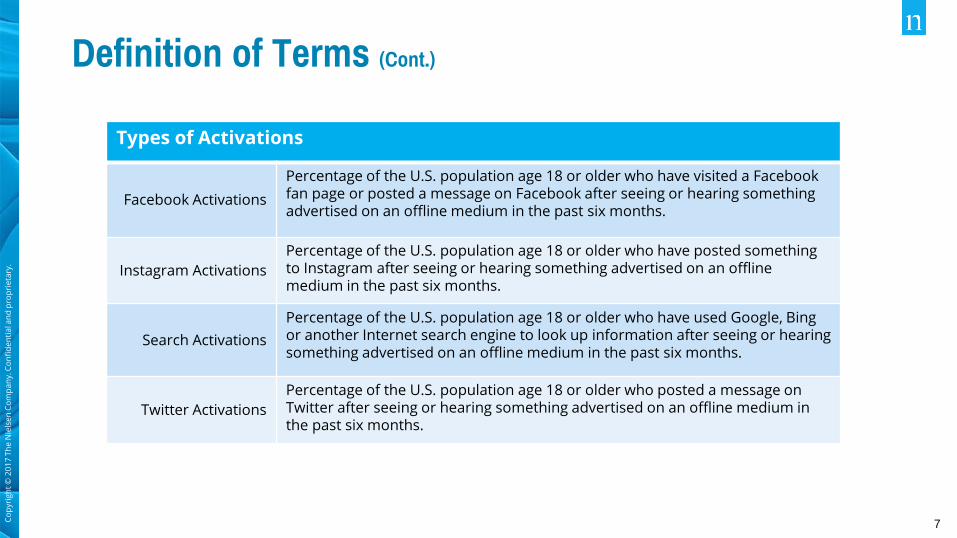
Definition of Terms (Cont.)
Types of Activations
Facebook Activations
Percentage of the U.S. population age 18 or older who have visited a Facebook fan page or posted a message on Facebook after seeing or hearing something advertised on an offline medium in the past six months.
Instagram Activations
Percentage of the U.S. population age 18 or older who have posted something to Instagram after seeing or hearing something advertised on an offline medium in the past six months.
Search Activations
Percentage of the U.S. population age 18 or older who have used Google, Bing or another Internet search engine to look up information after seeing or hearing something advertised on an offline medium in the past six months.
Twitter Activations
Percentage of the U.S. population age 18 or older who posted a message on Twitter after seeing or hearing something advertised on an offline medium in the past six months.
8Co
pyr
igh
t ©
20
17
Th
e N
iels
en
Co
mp
an
y. C
on
fid
en
tia
l an
d p
rop
rie
tary
.
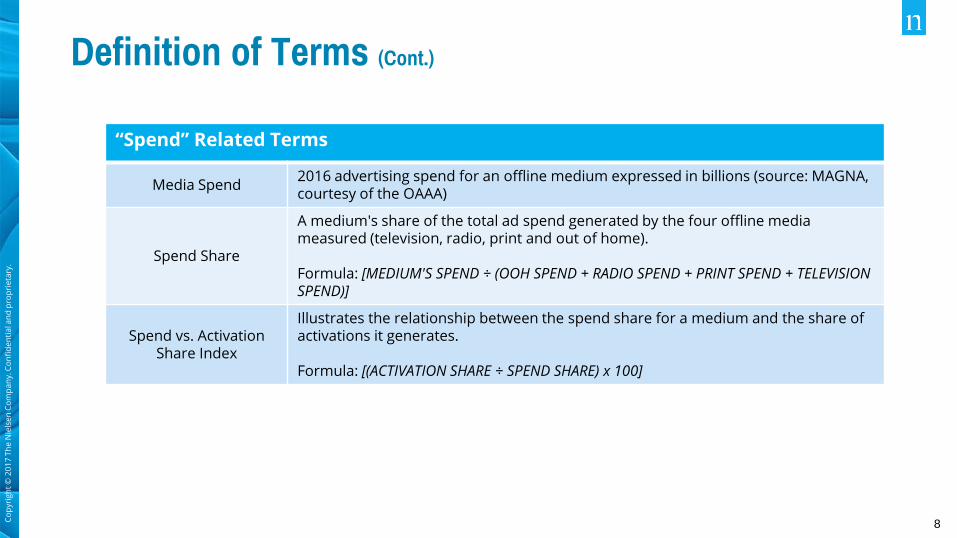
Definition of Terms (Cont.)
“Spend” Related Terms
Media Spend2016 advertising spend for an offline medium expressed in billions (source: MAGNA, courtesy of the OAAA)
Spend Share
A medium's share of the total ad spend generated by the four offline media measured (television, radio, print and out of home).
Formula: [MEDIUM'S SPEND ÷ (OOH SPEND + RADIO SPEND + PRINT SPEND + TELEVISION SPEND)]
Spend vs. Activation Share Index
Illustrates the relationship between the spend share for a medium and the share of activations it generates.
Formula: [(ACTIVATION SHARE ÷ SPEND SHARE) x 100]

9Co
pyr
igh
t ©
20
17
Th
e N
iels
en
Co
mp
an
y. C
on
fid
en
tia
l an
d p
rop
rie
tary
.
Copyright © 2017 The Nielsen Company. Confidential and proprietary. 9
Key Findings
10Co
pyr
igh
t ©
20
17
Th
e N
iels
en
Co
mp
an
y. C
on
fid
en
tia
l an
d p
rop
rie
tary
.
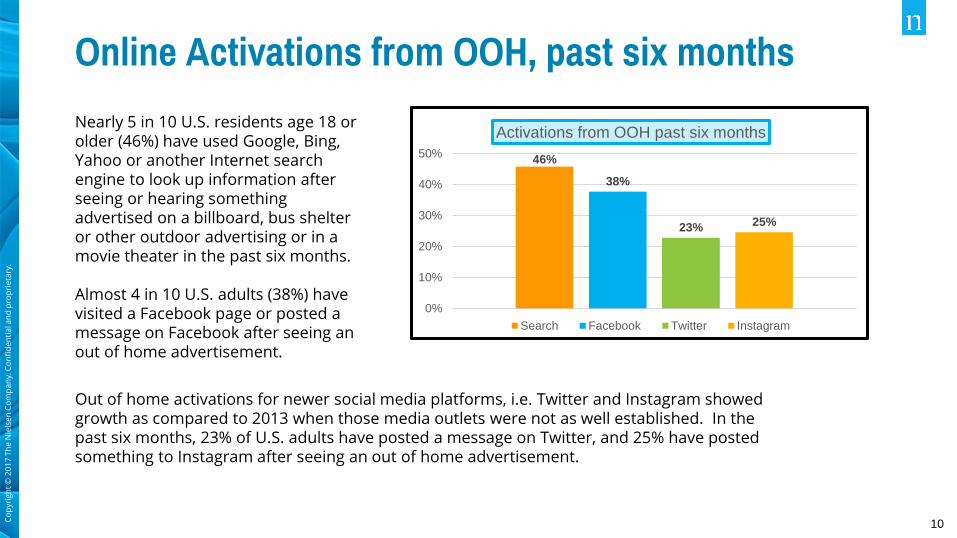
Nearly 5 in 10 U.S. residents age 18 or older (46%) have used Google, Bing, Yahoo or another Internet search engine to look up information after seeing or hearing something advertised on a billboard, bus shelter or other outdoor advertising or in a movie theater in the past six months.
Almost 4 in 10 U.S. adults (38%) have visited a Facebook page or posted a message on Facebook after seeing an out of home advertisement.
Out of home activations for newer social media platforms, i.e. Twitter and Instagram showed growth as compared to 2013 when those media outlets were not as well established. In the past six months, 23% of U.S. adults have posted a message on Twitter, and 25% have posted something to Instagram after seeing an out of home advertisement.
Online Activations from OOH, past six months
46%
38%
23% 25%
0%
10%
20%
30%
40%
50%
Activations from OOH past six months
Search Facebook Twitter Instagram
11Co
pyr
igh
t ©
20
17
Th
e N
iels
en
Co
mp
an
y. C
on
fid
en
tia
l an
d p
rop
rie
tary
.
Online Activations from TV, Radio and Print,
past six months
57%
35% 36%40%
25% 27%22%
16% 16%22%
16% 17%
0%
10%
20%
30%
40%
50%
60%
70%
Television Radio Newspaper/Magazine
Activations from TV, Radio & Newspaper/Magazine
Search Facebook Twitter Instagram
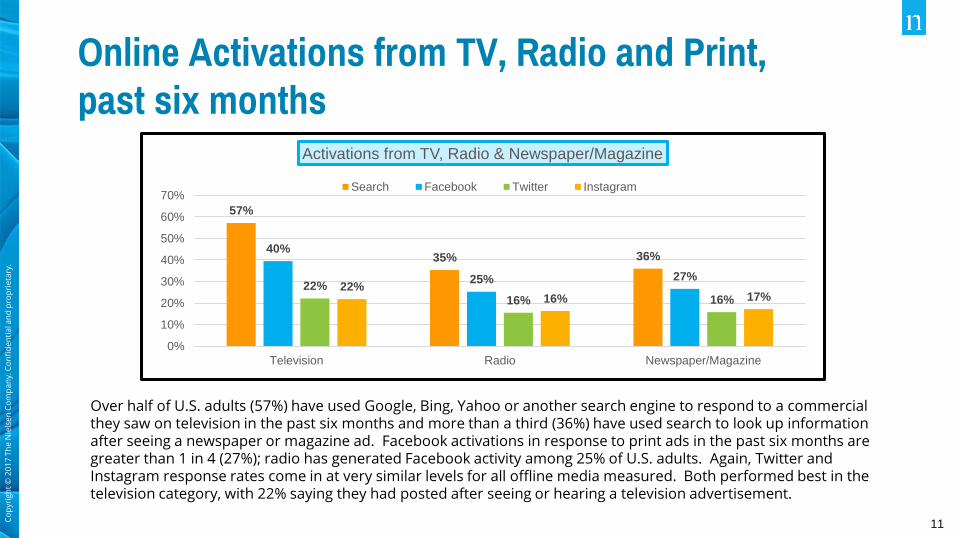
Over half of U.S. adults (57%) have used Google, Bing, Yahoo or another search engine to respond to a commercial they saw on television in the past six months and more than a third (36%) have used search to look up information after seeing a newspaper or magazine ad. Facebook activations in response to print ads in the past six months are greater than 1 in 4 (27%); radio has generated Facebook activity among 25% of U.S. adults. Again, Twitter and Instagram response rates come in at very similar levels for all offline media measured. Both performed best in the television category, with 22% saying they had posted after seeing or hearing a television advertisement.
12Co
pyr
igh
t ©
20
17
Th
e N
iels
en
Co
mp
an
y. C
on
fid
en
tia
l an
d p
rop
rie
tary
.
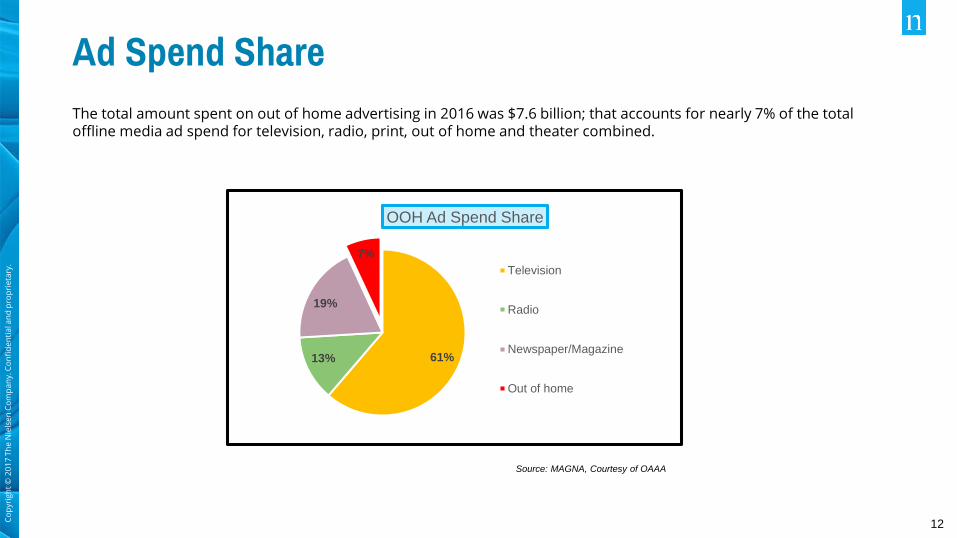
Ad Spend Share
The total amount spent on out of home advertising in 2016 was $7.6 billion; that accounts for nearly 7% of the total offline media ad spend for television, radio, print, out of home and theater combined.
61%13%
19%
7%
OOH Ad Spend Share
Television
Radio
Newspaper/Magazine
Out of home
Source: MAGNA, Courtesy of OAAA
13Co
pyr
igh
t ©
20
17
Th
e N
iels
en
Co
mp
an
y. C
on
fid
en
tia
l an
d p
rop
rie
tary
.
Calculating Search Activation Share
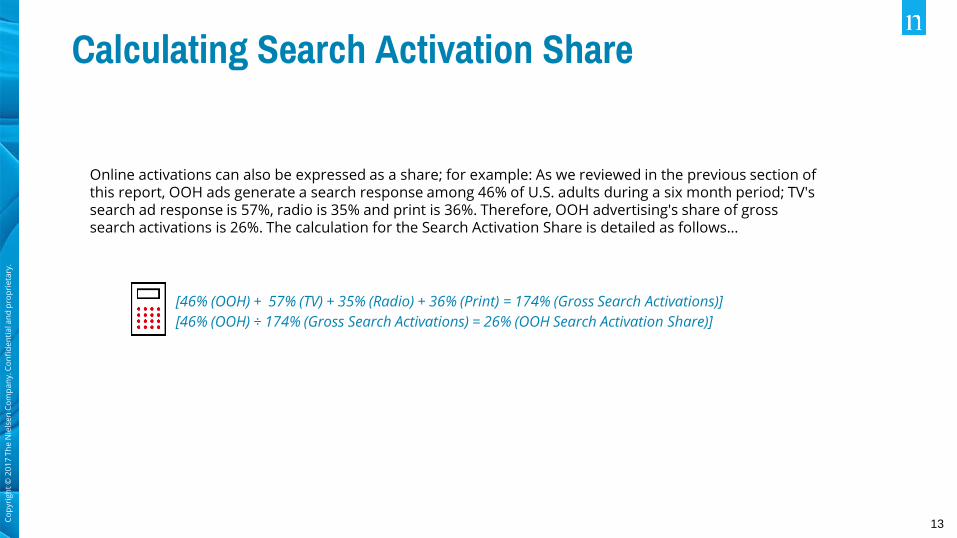
Online activations can also be expressed as a share; for example: As we reviewed in the previous section of this report, OOH ads generate a search response among 46% of U.S. adults during a six month period; TV's search ad response is 57%, radio is 35% and print is 36%. Therefore, OOH advertising's share of gross search activations is 26%. The calculation for the Search Activation Share is detailed as follows…
[46% (OOH) + 57% (TV) + 35% (Radio) + 36% (Print) = 174% (Gross Search Activations)]
[46% (OOH) ÷ 174% (Gross Search Activations) = 26% (OOH Search Activation Share)]
14Co
pyr
igh
t ©
20
17
Th
e N
iels
en
Co
mp
an
y. C
on
fid
en
tia
l an
d p
rop
rie
tary
.
Activation Share for OOH
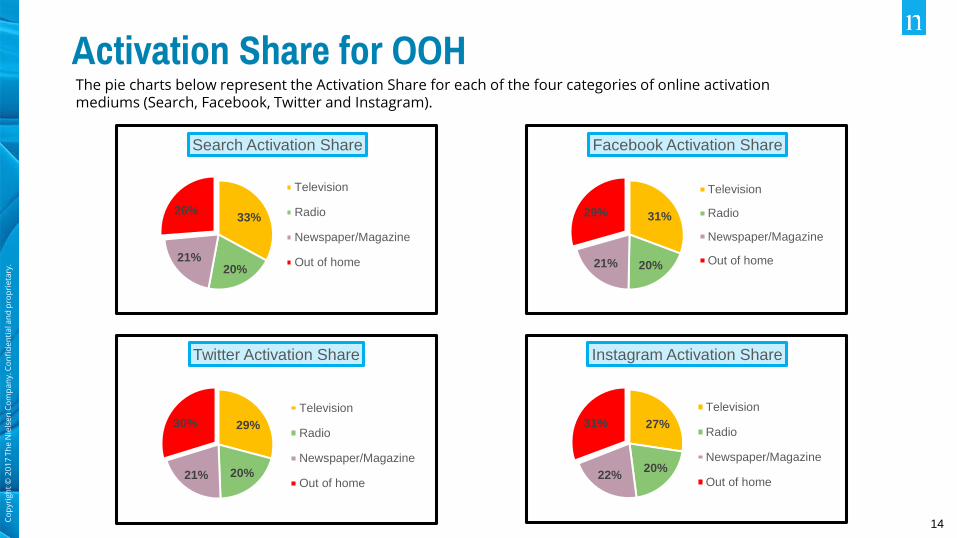
33%
20%21%
26%
Search Activation Share
Television
Radio
Newspaper/Magazine
Out of home
31%
20%21%
29%
Facebook Activation Share
Television
Radio
Newspaper/Magazine
Out of home
29%
20%21%
30%
Twitter Activation Share
Television
Radio
Newspaper/Magazine
Out of home
27%
20%22%
31%
Instagram Activation Share
Television
Radio
Newspaper/Magazine
Out of home
The pie charts below represent the Activation Share for each of the four categories of online activation mediums (Search, Facebook, Twitter and Instagram).
15Co
pyr
igh
t ©
20
17
Th
e N
iels
en
Co
mp
an
y. C
on
fid
en
tia
l an
d p
rop
rie
tary
.
Online Activations Indexed Against Media Spend
If we index the relationship between the ad spend share for each medium and the share of online activationsthey generate, it becomes clear that out of home media delivers substantially more online activity per addollar spent compared to other offline media.
An index of 100 means the online activations generated by the medium is equal to the medium's portion ofadvertising spend (even line); an index above 100 means the medium over-delivers and under 100 means themedium's performance is relatively weak.
Here's the math…
[(Activation Share) ÷ (Ad Spend Share) x 100 = Index Value]
The bar graph on the next slide represents the Online Activations Indexed against Media Spend for each of the four categories of online activation mediums (Search, Facebook, Twitter and Instagram)
16Co
pyr
igh
t ©
20
17
Th
e N
iels
en
Co
mp
an
y. C
on
fid
en
tia
l an
d p
rop
rie
tary
.
Online Activations Indexed Against Media Spend (cont.)
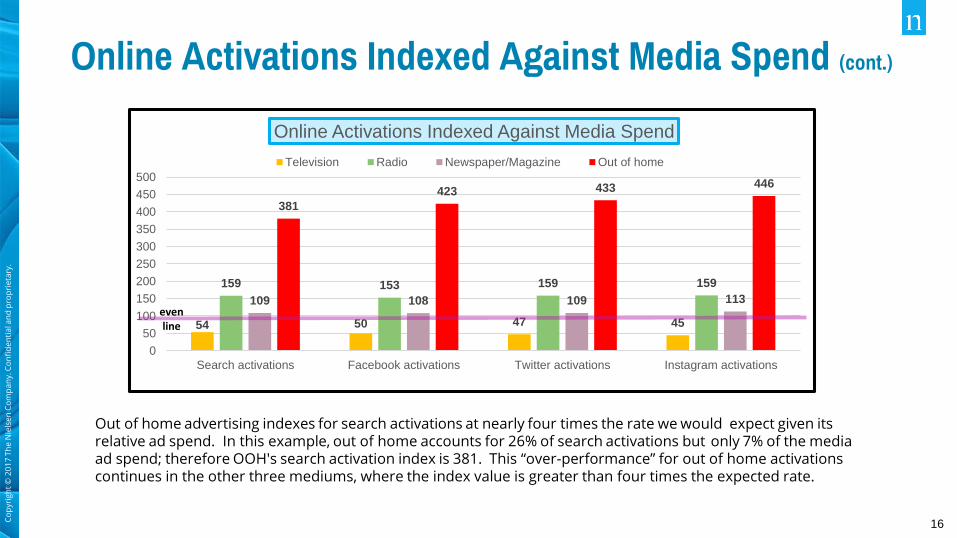
Out of home advertising indexes for search activations at nearly four times the rate we would expect given itsrelative ad spend. In this example, out of home accounts for 26% of search activations but only 7% of the mediaad spend; therefore OOH's search activation index is 381. This “over-performance” for out of home activations continues in the other three mediums, where the index value is greater than four times the expected rate.
54 50 47 45
159 153 159 159
109 108 109 113
381
423 433 446
0
50
100
150
200
250
300
350
400
450
500
Search activations Facebook activations Twitter activations Instagram activations
Online Activations Indexed Against Media Spend
Television Radio Newspaper/Magazine Out of home
evenline

17Co
pyr
igh
t ©
20
17
Th
e N
iels
en
Co
mp
an
y. C
on
fid
en
tia
l an
d p
rop
rie
tary
.
Copyright © 2017 The Nielsen Company. Confidential and proprietary.