Embed Size (px)
Citation preview

Concord Square Planning & Development, Inc.
294 Washington Street, Suite 415, Boston, MA 02108 617-482-1997 www.concordsqdev.com
Final Report October 12, 2016 Revised October 31, 2016
Nichewaug Inn and Academy Property Petersham, MA
Market and Feasibility Analysis
Concord Square Planning & Development, Inc.
Bonz & Associates – Market Analysis
Albert Righter & Tittmann – Architects
Douglas MacLeay – Civil Engineering

Nichewaug Inn – Market and Feasibility Analysis October 31, 2016
Index
Description Tab / Section
Narrative 1 Power Point Presentation - Summary 2 Financial Analysis 3 Market Analysis 4 Conceptual Plans 5 Water Supply and Septic 6


Concord Square Planning & Development, Inc.
Narrative Report
Nichewaug Inn and Academy
October 12, 2016 Revised 10-31-16
Executive Summary
The Nichewaug Inn and Academy Buildings are located on 6.6 acres at the north end of the Petersham Village Center. The original building was constructed in 1899, and has had subsequent modifications. The property has been vacant for over thirty years, with a succession of owners. None of the owners were able to find a financially viable option for redeveloping the buildings and returning them to productive use.
The town acquired the property in 2007. Since that time the buildings have continued to deteriorate, and currently are a significant negative influence, depressing property values, on the Town’s Village Center, which otherwise consists of many beautiful, historic structures. The current situation is not acceptable and steps to address the problem are necessary. Concord Square was engaged in March, 2016 to undertake a feasibility and market analysis in order to provide guidance to the Town on the most feasible and practical next steps for dealing with the property.
A series of four public meetings have been held at the Town Hall – on April 13th, May 23rd, September 7th, and October 6th. In addition, numerous conversations and evaluations have taken place. In addition to Concord Square, other team members include Albert Righter & Tittmann, Architects; Bonz and Associates, for the market study; and Douglas MacLeay for civil engineering, focused on the issues of water supply and septic disposal. This report consists of this Executive Summary, the following narrative, a PowerPoint presentation, an extensive financial analysis of development options, a Market Analysis, and a description of the situation with regard to water supply and septic disposal.
Petersham is a charming rural community with approximately 1,250 residents and 450 households. It is located east of the Quabbin Reservoir, and about 30 miles from Greenfield, Amherst, Fitchburg and Leominster, and Worcester. It is lovely, with many beautiful restored historic homes, and very little in the way of commercial development. The nature of the community and its isolation from population and employment centers means that the real estate and other markets are relatively weak compared to the parts of Massachusetts closer to Boston, or closer to Amherst and Northampton. As a result, the Bonz Market Study concludes that it is unlikely that market rate rental housing, retail, office, restaurant, hotel or hospitality uses would

Nichewaug Inn & Academy Property Consulting – Final Report October 12, 2016 – Revised 10-31-16
Page 2
be financially viable. The conclusion of the report is that “the achievable rental rates for any of these uses would not be sufficient to cover the redevelopment costs.” There are also difficulties with using the State and Federal Historic Tax Credit programs for renovation into rental housing, which are discussed in more detail in subsequent portions of this report.
Accordingly, this report has focused on redevelopment concepts that involve the sale of housing units either as condominiums, single family homes, and / or townhouses. The Bonz Report concludes, based on recent actual sales in the last twelve months in Petersham, Hubbardston, New Salem, Hardwick, and Phillipston, that the sale prices of both condominiums and single family homes would be in the range of $165 to $175 per square foot.
Various demolition options have been considered, including the demolition of the so-called “Connector” building, of the Academy Building, of the kitchen wing of the Inn, the dining wing of the Inn, the Mother Superior addition to the Inn at the southern end, and demolition of all the buildings on the site.
Six redevelopment options have been analyzed. Albert Righter and Tittmann, the architectural firm, has produced conceptual site and buildings plans for each of the first four options. The building plans show unit sizes and whether they are one bedroom or two bedroom units. The six options analyzed are:
Option 1 – redevelopment of the Inn and the Academy Building into 29 housing units;
Option 2 – redevelopment of the Inn into 15 new units; demolition of the other buildings;
Option 3 – partial demolition; 9 renovated units in the Inn, and three new single family homes;
Option 4 – total demolition; construction of 4 single family homes
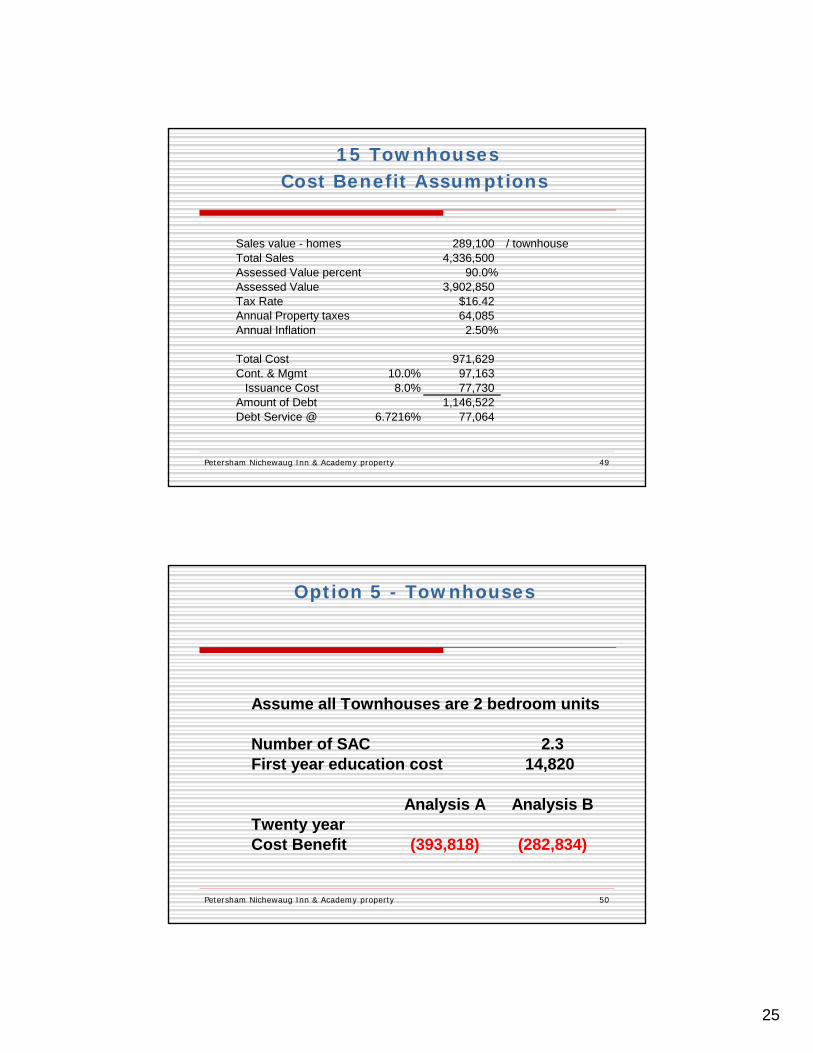
Option 5 – total demolition; construction of 15 new two bedroom townhouses
Option 6 – Retain the Inn and redevelop into rental housing, using tax credits and a new Workforce Housing Program from Mass Housing
In addition, water and septic issues have been considered for each option. Some of the options require an off-site water supply, the feasibility of which is uncertain.
A pro forma with sources and uses of funds has been created for each Option. Based on what are considered reasonable construction costs, only Options 5 and 6 appear to be marginally financially feasible using the sale prices determined by the Bonz analysis, even when increasing the figures by 10% to reflect the potentially higher values because of the overall quality of the Petersham Village Center and the possible passage of time before construction is completed and sales actually take place. This is shown as Analysis A.

Nichewaug Inn & Academy Property Consulting – Final Report October 12, 2016 – Revised 10-31-16
Page 3
Accordingly, an Analysis B was prepared in which the sales prices were increased in order to have the transactions yield a profit to the developer of 18% to 20%. This quantifies the assumptions required to achieve feasibility. The results from these analyses are summarized in the PowerPoint Presentation, and shown in detail in the Financial Analysis.
Given the difficulty in achieving feasibility for any of the Options, it is a conclusion of this Report that the Town must pay for having the environmental cleanup done on the site, and also must pay for much of the demolition required for whichever option is determined to be most advantageous for the Town.
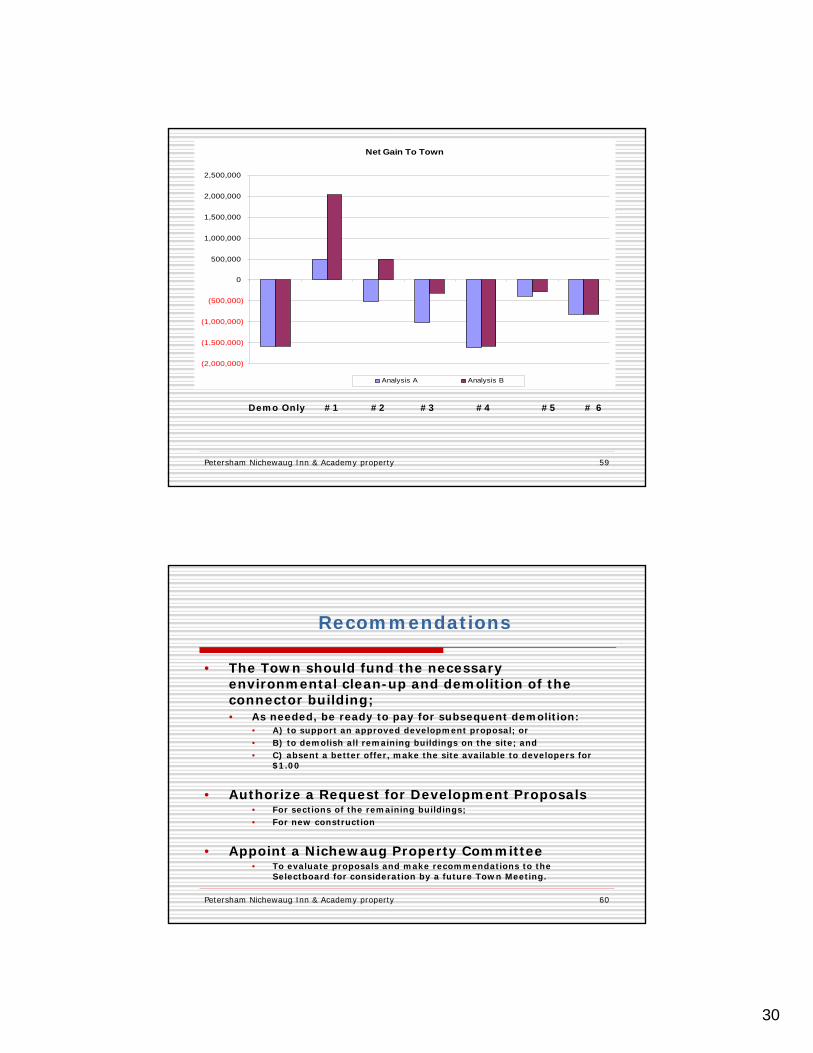
Based on these assumptions and analyses, a cost benefit analysis for the town has been prepared for both Analysis A and Analysis B for each of the six options. The analysis includes as costs to the Town the anticipated debt service on the environmental hazards remediation and demolition costs, plus the cost of educating the estimated number of school aged children. These costs are off-set by projected property tax revenues. The results are as follows:
Demo Only
Option 1 Academy plus Inn 29 units
Option 2 Inn only 15 units
Option 3 Inn 9 units & 3 s.f. homes
Option 4 4 s.f. homes
Option 5 15 Town-house units
Option 6 15 units of rental
(2,000,000)
(1,500,000)
(1,000,000)
(500,000)
0
500,000
1,000,000
1,500,000
2,000,000
2,500,000
Net Gain To Town
Analysis A Analysis B
Nichewaug Inn & Academy Property Consulting – Final Report October 12, 2016 – Revised 10-31-16
Page 4
It is clear from the above that from a financial point of view (there are, of course, other considerations), the best choice for the Town would be Option 1 which involves the renovation of both the Academy Building and the Inn, and which also would require an off-site well, the feasibility of which is unknown. Option 2 holds the prospect of being potentially close to break-even for the Town.
However, the feasibility analyses indicate that in order for Options 1 or 2 to be financially feasible, some combination of lower construction and soft costs, and higher sales prices than those estimated by the Bonz report will be necessary.
In this regard, a key question is to what extent can or could sales prices be higher than those estimated by the Bonz Report. The Report was based, as noted above, on actual sales in Petersham and nearby communities over the prior twelve months. It also looked at all sales since the year 2000. As a result, it provides an accurate picture of what has actually sold.
However, there are several factors which suggest that an imaginative and high quality renovation of the Nichewaug Inn and the Academy Building, coupled with creative financing, might make it possible to have a feasible project, in which sale prices higher than those in the Bonz study could be achieved:
1. There have been no comparable properties for sale in the region over the period that has been analyzed. In other words, there are no sales that could be considered “comparable sales” to what might be developed;
2. There are four sources of demand that could find the proposed condominiums at the Nichewaug Site attractive, and therefore be willing to pay higher prices:
a. Faculty, and the parents of students at Eagle Hill School, ten miles away in Hardwick;
b. Staff of the proposed new Quabbin Retreat treatment center of Heywood Hospital in Gardner. The treatment center is located only a few miles from the site;
c. Visitors and others associated with the Insight Meditation Center in Barre; and d. Current residents of Petersham who would like to downsize. In some cases, these
individuals or couples may require financial assistance that would need to be built into the financing.
A national market study of cell phone demand in 2007 would have focused on the Blackberry and other comparable phones. Such a study would likely (unless done by Apple) have completely missed the potential demand for the iPhone, which was introduced that year, and which since has fully eclipsed the Blackberry-type phones. Similarly, since there are no comparable properties in the region, and no sales comparable to what could be developed at the Nichewaug site, it does not appear reasonable to limit one’s thinking to the proposed sale prices in the Bonz study.

Nichewaug Inn & Academy Property Consulting – Final Report October 12, 2016 – Revised 10-31-16
Page 5
However, it will take a good deal of work, time and expense to adequately assess what that demand might be. It will require more detailed plans, specifics in terms of common areas and activities, a description of finishes, and accurate cost estimates. The potential market needs to be identified, and then the plan designed to meet the requirements of that specific market. All of this, which will be time consuming and costly, must be done in order to determine whether it might be feasible to develop Option 1 or Option 2 – or the other alternatives, for that matter.
Accordingly, the recommendations of this report are as follows:
1. The Town should move forward to carry out the necessary environmental clean-up of the site and demolish the Connector Building in accordance with the bids received in 2015. It is understood that the low bidder is prepared to move forward on the basis of the 2015 bid;
2. Authorize a Request for Development Proposals for the Site. This request should not limit proposals to any of the Options reviewed in this analysis, but should invite potential respondents to be creative in developing a plan which the developer believes can be economically feasible;
3. Appoint a Nichewaug Property Committee to review the proposals that are received and make recommendations to the Selectboard.
4. The Town should be prepared to pay for the demolition of the remaining existing buildings on the site as needed by the development proposal that may be accepted by the Town, so that, absent a better offer, the site could be sold to the Developer for $1.00. The town’s demolition costs would then be offset over time by future real estate tax revenue from the property.
This following pages contain a discussion in more detail of various issues studied and considered by the Report Team.

Nichewaug Inn & Academy Property Consulting – Final Report October 12, 2016 – Revised 10-31-16
Page 6
Topics
1. Potential Uses of the Sites and Preliminary Assessments ................................................................. 7
1.1. Housing ..................................................................................................................................... 7
1.1.1. Single Family Homes ............................................................................................................ 7
1.1.2. Rental Housing ...................................................................................................................... 7
1.1.3. Senior Housing ...................................................................................................................... 8
1.1.4. Seasonal/vacation housing or other alternatives to single family dwelling in town ........... 10
1.1.5. Other types of ownership (co-housing, rent-to-own, etc.) .................................................. 10
1.2. Commercial & Office (including mixed-use) ......................................................................... 11
1.2.1. Municipal and other public office use ................................................................................. 11
1.2.2. Private commercial uses ...................................................................................................... 11
1.3. Open Space, Recreational, and Non-commercial Uses ........................................................... 12
2. Important Issues .............................................................................................................................. 13
2.1. Water Supply and Septic ......................................................................................................... 13
2.1.1. DEP approval for water/septic systems ............................................................................... 13
2.1.2. The Library’s water/septic needs ......................................................................................... 13
2.2. Scale, Density and the Character of Town Center (Single-fam. vs. Townhouse vs. Condo) . 14
2.3. Demolition + New Construction vs. Rehabilitation ................................................................ 15
2.4. Securing the Town’s interest in later stages ............................................................................ 16

Nichewaug Inn & Academy Property Consulting – Final Report October 12, 2016 – Revised 10-31-16
Page 7
Topics
1. Potential Uses of the Site and Preliminary Assessments
1.1. Housing
1.1.1. Single Family Homes
Information from the Public Information Meetings, Focus Group Meetings, Emails, and online Feedback:
In the last several years, the Planning Board has considered what would make sense for the site starting with a blank slate. They evaluated the existing patterns of development and home construction in the Village Center. The finding from this evaluation was that the average lot size was about 25,000 square feet, with frontage of 90 feet. Using this metric for the layout of the Nichewaug site results in the layout of 4 single family building lots fronting on Common Street.
The consulting team’s assessments:
This has been included as Option 4 in the analysis. The market analysis has identified the potential for sale of these lots, both in terms of sales velocity (how long it would take to sell four lots), and the potential sale price of the lots.
It is likely to be the case, according to Doug MacLeay, that each lot could be served by its own well and its own septic field. If this were to be the case, the Library could be granted an easement for a portion of the site to the west of the Library for a septic field, and it might be able to put a new well in front of the Library, between it and Common Street.
However, it is likely to be more practical to have one well for the four homes, and a common septic field. The Library could be one of the uses of both the well and the septic field.
A further option would be for allowing two to four additional homes to be built along the South side of the access driveway into the site.
1.1.2. Rental Housing
Information from the Public Information Meetings, Focus Group Meetings, Emails, and online Feedback:
Each of our presentations to the citizens and officials of Petersham has started with a discussion of rental housing and the prospect of using State and Federal Historic Tax Credits. The tax credits can only be used with rental housing, they are not available for use with homeownership, such as would be the case with condominiums.
The consulting team’s assessments:
Concord Square and Joanne Shelton from Bonz & Company have done market studies on rental housing in recent years in Greenfield, Fitchburg, Northampton, Worcester, and

Nichewaug Inn & Academy Property Consulting – Final Report October 12, 2016 – Revised 10-31-16
Page 8
Southbridge. These communities surround Petersham to the North, South, East and West. As a result, we have a very good idea of the rent levels in these communities.
Petersham is isolated from the adjacent population centers, has a population of 1,234 (2010) and despite the village center being charming, exquisite, and in many ways unchanged over the last 100 years, it does not have a commercial town center as such centers are typically understood, with a collection of shops and services.
As a result, without doing additional market studies, we can conclude with a high degree of certainty that market rate rents in Petersham will be lower than the rents in Greenfield, Northampton, and Worcester.
It is also clear that regardless of rent levels, the depth of demand in Petersham is shallow. Because of the limited population, the distance from major highways, the distance from public transportation and the distance from jobs, demand will be limited. Petersham is a case of “if you build it, they probably will NOT come”. Nice apartments could be built and simply sit empty regardless of how low the rent was set.
Concord Square has prepared financial pro formas for actual rental housing projects in Greenfield, Northampton, Springfield, Worcester and Fitchburg that have been used for Tax Credit Applications for State and Federal Historic and New Market Tax Credits. This work has made it abundantly clear that rental housing proposals involving major renovation work are not feasible using just the State and Federal Historic Tax credits unless rents are as high as in the best locations in Northampton and Amherst – on the order of $1,400 for one bedroom units and $1,800 per unit for two bedroom units.
Since it is clear that rents at these levels cannot be achieved in Petersham, regardless of the quality of the housing provided, we conclude that market rate rental housing is not a viable option in Petersham.
Rental Housing could be feasible provided there were sufficient subsidies available, such as from the Low Income Housing Tax Credit Program. However, the LIHTC subsidies are in short supply, and are unlikely to be available in Petersham (see below for more discussion on this issue).
However, we have prepared an Option 6 in the analysis which includes a pro forma in which the additional subsidy required is provided by a new program at Mass Housing for Workforce Housing. Please see the PowerPoint presentation for a discussion of the overall feasibility of this approach, and the problems involved.
Our conclusion is that rental housing as a form of ownership is not likely to be a feasible option, and our analytical efforts have therefore been primarily concentrated on the ownership of single family homes, townhouses, or a condominium form of ownership.
1.1.3. Senior Housing
(Market rate or affordable, targets senior people in town and/or from the region)

Nichewaug Inn & Academy Property Consulting – Final Report October 12, 2016 – Revised 10-31-16
Page 9
Information from the Public Information Meetings, Focus Group Meetings, Emails, and online Feedback:
Many seniors in Petersham are looking to downsize, but there are few if any workable alternatives in town. In the past several years, there have been 3-4 seniors (senior households) who moved to Athol because they could not afford to stay in their previous houses in Petersham. A survey conducted by the Petersham Committee found that many seniors in town find it inconvenient to live in and maintain their current big houses, and are willing and would like to downsize their living accommodations and remain in Petersham.
It was suggested that the new senior housing should give priority to people in town. It was also suggested that the new housing should be affordable, otherwise some town residents won’t be able to afford it.
The consulting team’s assessment:
It is a clear priority to take care of the needs of the town residents. In addition, local needs generate the true local demand. Demographic data shows a higher percentage of seniors in Petersham compared to State-wide averages. Many of the elderly are looking to downsize from large houses that are expensive to heat and maintain. Some could benefit from community living which might be able to provide options such as meals, health care, community activities, etc. Accordingly, housing for seniors is clearly a viable option, and potentially the most significant local demand from a real estate point of view.
In terms of affordability, the development of affordable housing requires significant subsidies from the Low Income Housing Tax Credit program, the HUD Section 202 program, and / or other sources of funds. In general, obtaining the allocation of the subsidy source is highly competitive, and typically requires, at best, a long waiting period.
In addition, Petersham is disadvantaged when competing for such subsidies because of its low density, low population, and no downtown commercial center with a concentration of services and shops. Therefore, it is not likely to score highly in requests for scarce subsidy resources when competing with places like downtown Athol or downtown Orange – which in themselves are not large communities. Therefore, we believe it would be very difficult and time consuming (a multiple year effort), if not impossible, for this project to receive affordable housing subsidies sufficient to provide the financing for the Nichewaug.
Thus, it is not likely to be feasible to develop the project as an “affordable” project. Most of the units will need to be market rate. However, creative thinking may result in approaches that could provide for affordability for some of the units.
For instance, if the overall project was targeted to but not exclusively for the elderly it would be possible for an individual or a group of individuals to purchase multiple units and then lease them to residents at affordable rents. We understand that this option has been discussed in the Community and bears further exploration.

Nichewaug Inn & Academy Property Consulting – Final Report October 12, 2016 – Revised 10-31-16
Page 10
1.1.4. Seasonal/vacation housing or other alternatives to single family dwelling in town
Information from the Public Information Meetings, Focused Group Meetings, Emails, and online Feedback:
There is a potential market demand for week-end / vacation housing. This type of housing echoes the Town’s history when many were drawn to the open rural landscape, country air, and tranquility of the area. Such market demand appears to have, in fact, inspired the construction of the Nichewaug Inn in 1899.
The consulting team’s assessment:
We think senior housing is a more pressing need for existing town residents. However, the depth of demand for senior housing and the ability of seniors to pay is unlikely to be sufficient to acquire all the units that could be fit into renovated parts of the Inn and Academy Building. Accordingly, potential development plans should include the possibility of attracting those who want vacation or second homes as potential buyers of condominium units or single family homes.
1.1.5. Other types of ownership (co-housing, rent-to-own, etc.)
Information from the Public Information Meetings, Focus Group Meetings, Emails, and online Feedback:
The following ownership models have been proposed:
Co-housing characteristics combined with condo structure: all the units will be condo, and co-housing is optional.
“Rent to own” “Village to village” (membership-based senior living)
The consulting team’s assessment:
Ted Carman spent over a year working with a co-housing group during the nineties, and attended many organizational and planning meetings. He prepared detailed financial analyses for potential co-housing communities. This experience led to the conclusion that it is difficult for a group of people to start a co-housing project from scratch. However, co-housing has worked in situations where a developer builds the project and then opens it up to and requires buyers to accept a co-housing form of ownership and operations. Membership-based living also needs a developer as a lead. Cohousing would therefore require a developer committed to such a concept.
However, we believe that elements of co-housing living could be incorporated into a potential renovation of the main part of the Nichewaug Inn, with more extensive kitchen and dining facilities built into the Music Room renovation. This would allow those residents who chose to have jointly prepared meals to do so, while not limiting sales of the condominiums to buyers who want a co-housing life-style.
“Rent to own” has difficulty with the financial structure, because a “rent-own” requires the unit be sold at the then market price when the sale takes place. It is impossible to know for

Nichewaug Inn & Academy Property Consulting – Final Report October 12, 2016 – Revised 10-31-16
Page 11
certain what the eventual sale price will be, which is a problem for both the developer / and the renter / prospective buyer. It is therefore hard to finance and obtain up-front commitments. Furthermore, rent to own requires that the economics of the rental transaction provide for a feasible project, which, as noted above, does not appear to be the case in Petersham.
1.2. Commercial & Office (including mixed-use)
1.2.1. Municipal and other public office use
Information from the Public Information Meetings, Focus Group Meetings, Emails, and online Feedback:
It was suggested that the Town needs better, additional office space. The existing town office doesn’t meet with handicapped accessible standards. Another suggestion is to provide office space for local groups such as “Aging in Place”.
The consulting team’s assessment:
It appears that the Center School building might have empty space that could potentially accommodate a Town need, if any, for additional office space. The school is designed for 175 students and currently has about 110 students. A new school is being completed in Athol which may draw “Choice” students from Petersham’s school, leaving more space that could potentially be used for Town administrative office.
Space at the Nichewaug Inn or in the Academy Building would be expensive – it would presumably be sold to the Town as a Condominium form of ownership, and is likely to cost as much or more than the proceeds that might be realized from the sale of the current Town Office Building. It would therefore not likely be a net plus for the Town’s financial situation.
1.2.2. Private commercial uses
Information from the Public Information Meetings, Focus Group Meetings, Emails, and online Feedback:
A number of commercial uses have been proposed, including small inn, restaurant, retail store, business space or studio space for providing business support services to town residents who are running home businesses, and small businesses which provide services such as hair dresser, cleaning, and health care to both seniors and the non-seniors. It is also suggested that the existing buildings could be renovated into a multi-use, perhaps multi-phase project that incorporates these commercial uses, town office, and several different types of housing.
The consulting team’s assessment:
Nichewaug Inn & Academy Property Consulting – Final Report October 12, 2016 – Revised 10-31-16
Page 12
It would be difficult to finance a mixed use development in this location and at this scale. As is the case for rental apartments, the ability and willingness of commercial tenants to pay a rent high enough to support the cost of the acquisition and renovation of commercial space is suspect. Given the cost of construction, commercial rents would have to be in excess of $20 per square foot per year in order for the transactions to be financially feasible.
Because of the limited population in Petersham and the relative isolation from nearby population centers it is unlikely that commercial tenants could be attracted that could pay rent at $20 per s.f. per year and be viable businesses.
The residents in the renovated buildings will not support even a small store. Typically, even 200-300 housing units are not sufficient to support a store.
1.3. Open Space, Recreational, and Non-commercial Uses
Information from the Public Information Meetings, Focus Group Meetings, Emails, and online Feedback:
A number of non-commercial uses have been proposed, including new development and the restoration of previous uses on the site:
Renovate the Inn building into a Senior Center which can be used as a town gathering space;
Restore the Community Garden on the site and open it to public use; Restore the Tennis Court on the site and open it to public use; Keep a portion of the site as open space which will continue to be owned by the
Town; Tear down the buildings, build a cemetery in the back part of the site, modeling on
the Mt Auburn Cemetery in Cambridge, and use the front part of the site as recreational space.
The consulting team’s assessment:
A Senior Center as a town gathering space is unlikely to be able to generate revenues to pay for the initial construction and acquisition cost, or for its own maintenance. Such a use would therefore increase the financial burden on the Town.
In several of the Options, the Chapel (the Music Room) could be converted to a common room for the use of the condo community. The Condo Association will pay for its operation and maintenance. Opening this building to the broader Petersham community would have implications for the residents that need to be assessed.
In all the scenarios, it appears feasible for the Community Garden to be retained.
Asking the developer to refurbish the Tennis Court for public use or keeping a portion of the site as Town’s owned open space may make the project less attractive to potential condominium buyers, and therefore also to developers, because it could depress sale prices.

Nichewaug Inn & Academy Property Consulting – Final Report October 12, 2016 – Revised 10-31-16
Page 13
Cemeteries are expensive to design and lay-out, and expensive to maintain, particularly if they have the overall quality of the Mt. Auburn Cemetery. The initial financial costs can be significant.
2. Important Issues
2.1. Water Supply and Septic
2.1.1. DEP approval for water/septic systems
Information from the Public Information Meetings, Focus Group Meetings, Emails, and online Feedback:
The types of water/septic system that meet with DEP’s standards are dependent on the scale of demolition, the type and amount of new development, and the condition of the existing well. In all cases with more than 12 bedrooms the well would be considered a Public Water Supply (“PWS”)
The consulting team’s preliminary assessments:
Please see the report from Douglas MacLeay regarding water supply and septic systems, the e-mail from DEP, and the sketch plan, all included in Section 6 of this report.
2.1.2. Resolving the Library’s water/septic needs
Information from the Public Information Meetings, Focus Group Meetings, Emails, and online Feedback:
The Library is open 19 hours/week, with the peak number of visitors occurring on Tuesdays. Currently the well for the library is in the dirt-floor basement, and the water is not potable. There is one bathroom on the 2nd floor which requires an improved septic system. There are plans to build a bathroom (ADA standard) on the first floor.
In the conceivable future, the library is unlikely to have other functions or have a change of use that would trigger larger water/septic needs.
The consulting team’s assessment:
In most cases, there should not be a problem in providing water and septic for the Library from a new Inn/Academy building renovation project. Potentially the developer could pay for the initial incremental cost, which should be minimal compared with the total project cost. Then the Library would pay yearly maintenance fee to a condo association. The fee would probably be based on the usage of water/septic, proportionally allocated between the Library and the condo component.
However, in certain development scenarios it may be more difficult to require the builder to provide such infrastructure. However, as suggested above, in such a case it might be possible to provide an easement area on the Nichewaug site for the location of a new septic

Nichewaug Inn & Academy Property Consulting – Final Report October 12, 2016 – Revised 10-31-16
Page 14
system for the Library, and the Library could investigate putting a new well into the area in front of the building.
2.2. Scale, Density and the Character of Town Center (Single-family vs. Townhouse vs. Condo)
Information from the Public Information Meetings, Focus Group Meetings, Emails, and online Feedback:
Currently Petersham has very few condominiums or townhouses. Most residents believe that Petersham is defined by its country scenery, open space, and the lack of more densely developed housing, such as condominiums. This character is what attracted many families to move to the community in the first place.
There is concern that higher density housing (or other uses) would not have enough open space, and would degrade the unique quality of the town’s village center.
There are different options regarding the proposed densities. Some people think that 30-40 bedrooms is too dense and will add too much activity to the town center. Others believe that the proposed density won’t add significant activity and vehicle trips to the town center.
There is also concern about the market demand for the units, especially in the scenario with the highest number of units.
The consulting team’s assessment:
The character of Petersham, particularly in the village center, is evidenced by the remarkable collection of 19th and early 20th century buildings around the Town Common and in the Town’s Historic District. Uniquely for Petersham, there are very few instances of later 20th or 21st century buildings intruding into this attractive landscape.
The Nichewaug Inn, although vacant for over 30 years, is an important part of the character of the Village Center. It is an excellent example of late 19th century shingle style architecture. Losing this building to demolition would profoundly change the character of the Village Center.
All the options being considered contain substantial demolition of existing structures on the site. Consequently, the built density of the site will be reduced regardless of what option is chosen by the Town.
From a transportation infrastructure point of view, it appears clear that all the roadways are being used at levels substantially below capacity. Demonstrating this, there is no traffic light in the center of the Town. Adding even as many as 30 new housing units to the site would not put significant strain on roadways or traffic. None of the streets would see a reduction in service capacity.
The types of housing being proposed are not likely to contribute many new school aged children to the Town. Further, the school system is substantially under capacity, so the incremental or marginal cost of a modest number of new children in the school system is

Nichewaug Inn & Academy Property Consulting – Final Report October 12, 2016 – Revised 10-31-16
Page 15
likely to be small. However, these costs have been estimated, and included in the cost benefit analysis for the Town.
In planning new developments, typically adding more square footage, more housing units (or more office space) is the direction taken to make projects more financially feasible. In this case, however, as noted above, there is a major question regarding the depth of the market for new housing units.
The development / financing challenge is to determine an optimum balance between saving a portion of the Nichewaug Inn, possibly developing the balance of the site, and proposing a type of housing that will be supported by the market, and which can afford to be built.
All the Options considered substantially reduce the footprint of the existing structures. The Town can use zoning and design guidelines to control the look and amount of open space of future development.
2.3. Demolition + New Construction vs. Rehabilitation
Information from the Public Information Meetings, Focus Group Meetings, Emails, and online Feedback:
A suggestion has been made to demolish the existing building and build either new single family homes or new townhouses. Arguments for this approach include the fact that total demolition would make it easier to lay out the site plan, and new construction could be less expensive and achieve higher overall quality with ADA accessibility standards.
The consulting team’s preliminary assessments:
Townhouses are typically well suited for young families with children. They are a good way of providing affordable “starter homes” at lower costs for couples starting out. However, it is believed that there is minimal demand for such housing in Petersham, for all the reasons set forth earlier. There are no jobs nearby, few services or retail establishments, and it is a long way to the supermarket. This makes three bedroom townhouses less feasible. Accordingly, Option 5 considers building 15 new two-bedroom townhouses which would have a limited number of children. Such a plan could include some one-story, modest in size, one bedroom units.
It would appear that a small number of single family homes will be acceptable to the market, and are likely to be financially feasible. However, because they typically come with school aged children, over time the education costs are likely to offset the property taxes paid by the units, as shown in the cost benefit analysis.
With regard to total demolition, the existing Inn building has great historic and architectural value and makes an important contribution to the entire Village Center. There are strong reasons to preserve the building, which have been articulately described by a number of residents, as well as by the Massachusetts Historical Commission in their 2010 comments to the Town’s proposal to demolish the Property.

Nichewaug Inn & Academy Property Consulting – Final Report October 12, 2016 – Revised 10-31-16
Page 16
Rehabilitation and reuse, if financially feasible, will preserve the building, restore it to its initial beauty, and enhance the unique character of the town. It is believed that renovation can achieve the same level of quality as new construction. The Academy building is in better physical condition, and has the right dimensions for high-quality residential. It should cost less on a per square foot or per unit basis, and therefore the housing units can be sold for less, or if sold for the same price as units in the Inn, would have higher margins.
Renovating the Nichewaug Inn is likely to increase property values in the Village Center.
It is recommended that the Town delay demolition, except for the Connector Building, until having a developer ready to proceed with a specific plan, or until it becomes clear that no developer is prepared to move forward with a financially feasible plan.
2.4. Securing the Town’s interest in later stages
Information from the Public Information Meetings, Focus Group Meetings, Emails, and online Feedback:
In the past, the Town issued an RFP to seek developer/ development proposals. This approach did not succeed in producing a viable plan that was acceptable to the Town. The question is – how to ensure that a future RFP would be successful at identifying a capable developer, who would be prepared to and capable of carrying out the plan approved by the town?
The consulting team’s preliminary assessments:
As part of this report, Concord Square and its team has provided information about site conditions, local needs, local markets, development plans, and financial feasibility for six Development Options.
This will provide potential developers with a substantial head start in understanding the site and the market. In addition, it is recommended that the Town commit to undertaking the required environmental and demolition work needed for the proposed work.
This is expected to make the proposed project significantly more attractive to potential developers than the RFP issued several years ago.


1
Concord Square Planning & Development, Inc.
Albert, Righter & TittmannArchitects, Inc.
Bonz & Company
Douglas MacLeay
October 6, 2016Revised 10-30-16
Nichewaug Inn & Academy PropertyPetersham, MA
Public Information Meeting #4
1. Village Center Environment
2. Market Study / Water & Septic
3. Development Options ( total of 6 )
4. Cost / Benefit Analysis for the Town
5. Summary of Options / Benefits
6. Recommendations for Town Meeting
Petersham Nichewaug Inn & Academy property 2
Agenda

2
Petersham Nichewaug Inn & Academy property 3
A Quintessential New England Village
Petersham Nichewaug Inn & Academy property 4
Beautiful Homes
3
Petersham Nichewaug Inn & Academy property 5
Outstanding Architecture Quality
Petersham Nichewaug Inn & Academy property 6
No Discordant Notes

4
Petersham Nichewaug Inn & Academy property 7
• Federal and State Historic District
• Consistent Quality
• Very few Buildings after 1940
Emphasis : Historic Preservation
Petersham Nichewaug Inn & Academy property 8
• Gather public input and help build consensus
• Find a feasible solution to:
• Eliminate a fire hazard degrading nearby property values
• Alleviate the Town’s financial burden
• Create long term stable revenues for the Town
• Possibly - Preserve the historic Nichewaug Inn
Our Main Goals

5
Petersham Nichewaug Inn & Academy property 9
Four Primary Options
Option 1• Partial Demolition• 29 new units• Reduce building footprint by 29.7%
Option 2• Partial Demolition• 15 new units• Reduce building footprint by 61.3%
Option 3• Partial Demolition• 9 new units + 3 new houses• Reduce building footprint by 57.1%
Option 4• Total Demolition• 4 new houses• Reduce building footprint by 81.5%
Two additional options analyzed
Option 5 - Complete Demolition with new construction of 15 Townhouses
Option 6 – Retain Inn and redevelop as rental using Tax Credits and Mass Development Workforce Housing Loans;
Petersham Nichewaug Inn & Academy property 10

6
Petersham Nichewaug Inn & Academy property 11
Potential Option 1: Partial Demo, 29 units
Petersham Nichewaug Inn & Academy property 12
Potential Option 1: Inn Renovation 1st Floor
1st Floor 2nd, 3rd Floors
Partial Inn Building- 15 units, 22 bedrooms

7
Petersham Nichewaug Inn & Academy property 13
Potential Option 1: Partial Demo
1st Floor
2nd Floor
Academy Building- 14 units, 20 bedrooms
Petersham Nichewaug Inn & Academy property 14
Potential Option 2: Partial Demo, 15 units

8
Petersham Nichewaug Inn & Academy property 15
Potential Option 3: Partial Demo, 9 units + 3 houses
Petersham Nichewaug Inn & Academy property 16
Potential Option 3: Partial Demo, 9 units + 3 houses
1st Floor 2nd, 3rd Floors
Partial Inn Building- 9 units, 12 bedrooms

9
Petersham Nichewaug Inn & Academy property 17
Potential Option 4: Total Demo, 4 houses
Petersham Nichewaug Inn & Academy property 18
• Prepared by Bonz & Company
• Examined single family and condominium sales since 2000 in:
• Petersham• Hardwick• Hubbardston• New Salem• Phillipston
• Focused on 49 sales in last 12 months for relatively new or substantially renovated units
Market Study

10
Petersham Nichewaug Inn & Academy property 19
Market Study - Findings
Sales Price Square Feet Price / s.f.
Minimum $229,000 1,196 $191.47Maximum $500,000 3,694 $135.35Median $274,950 2,126 $129.33Average $303,446 2,164 $140.22
N = 49
Summary of 12 Month Comparable Sales
Petersham Nichewaug Inn & Academy property 20
Market Study - Conclusions
Unit Type Size
1 BR Condo 700 $165 $175 $115,500 $122,5001 BR Condo 900 $165 $175 $148,500 $157,500
2 BR Condo 1,000 $165 $175 $165,000 $175,0002 BR Condo 1,400 $165 $175 $231,000 $245,000
2 BR SFH 1,600 $165 $175 $264,000 $280,0003 BR SFH 2,000 $165 $175 $330,000 $350,000
Exhibit 4 - Estimated Sales Price of Proposed Units
Price / SF Range Potential Sales Price
11
Petersham Nichewaug Inn & Academy property 21
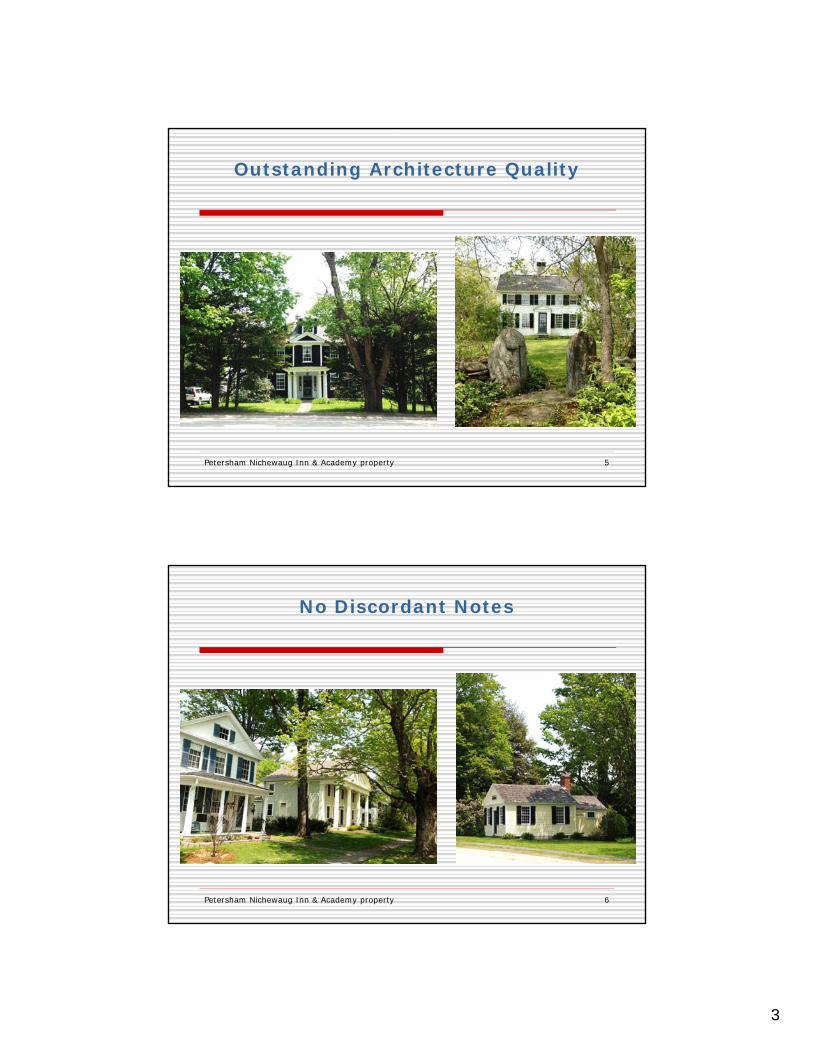
• Hubbardston• Pinecrest Subdivision
• On the market:• Four to-be built at 1,300 to 1,560 s.f. each• $210,000 to $ 260,000• $145 to $182 per s.f.
• New Salem• On the Market
• One 3 bedroom single family:
• 1,200 s.f. at $200,000 or $167 per s.f.
Market Study – New Single Family
Petersham Nichewaug Inn & Academy property 22
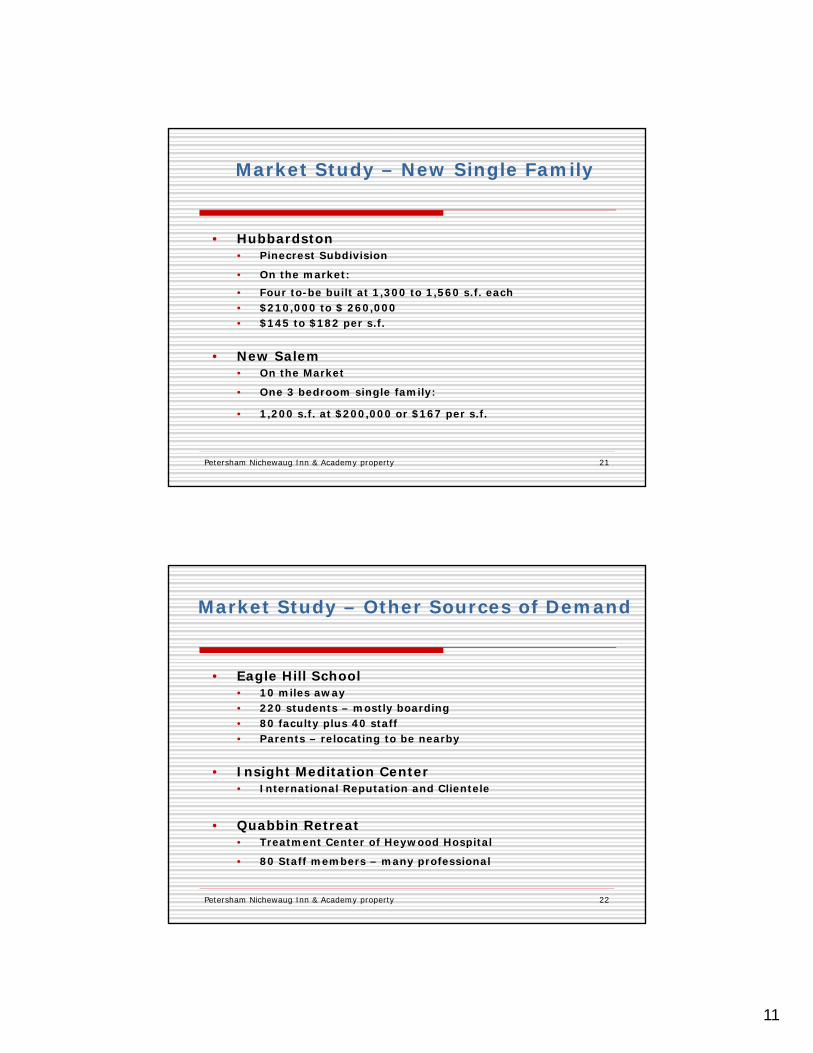
• Eagle Hill School• 10 miles away• 220 students – mostly boarding• 80 faculty plus 40 staff• Parents – relocating to be nearby
• Insight Meditation Center• International Reputation and Clientele
• Quabbin Retreat• Treatment Center of Heywood Hospital
• 80 Staff members – many professional
Market Study – Other Sources of Demand

12
Petersham Nichewaug Inn & Academy property 23
• Housing• Rental housing• Seasonal and vacation housing• Other types of ownership
• Commercial/Office• Town administrative office
• Private commercial uses (Small Inn, restaurant, business
support, etc.)
• Other types of ownership• Town senior center, open space, cemetery, etc.
Assessments of Other Proposed Uses
Petersham Nichewaug Inn & Academy property 24
• Extensive Discussions with Mass DEP• 12 bedrooms or less – private water supply, local control• Over 12 bedrooms requires a Public Water Supply
• With a Zone 1 Protection Area
• Two wells (private) on site appear feasible (24 BRs)
• Max. bedrooms to be served on site with PWS - ± 26
• Off-site Water Supply may be feasible• Necessary for Options 1 & 5 • Require agreements with abutters
Water

13
Petersham Nichewaug Inn & Academy property 25
• 10,000 s.f. leaching area appears sufficient for all development options
• Ideal location appears to be at the southwest corner of the site, but could vary depending on site plan.
• Use common septic for any Development Options
• Include Library needs in design capacity
• Explore innovative systems (such as Ad-Vantax)
Septic
Petersham Nichewaug Inn & Academy property 26
• Financing Requires that developments must be profitable
• Sources of Funds must exceed the Uses of funds;
• For-Sale projects – require 18% to 20% margins
• Historic Sale prices in Petersham are low compared to probable costs.
Development Feasibility

14
Estimated School Costs
Petersham Nichewaug Inn & Academy property 27
Estimated number of School Aged Children (SAC)Per Housing Type
One Bedroom 0.045Two Bedroom 0.152
Single Family Home (3 BRs) 0.95
Estimated Cost / SACSchool Choice Revenue 5,000
Other Costs, Averaged: 30.0% 1,500Budget Amount per student: 6,500
Estimated # school children and Cost per Option
Petersham Nichewaug Inn & Academy property 28
Option 1 Option 2 Option 3 Option 4 Option 5 Option 6Inn + Acad. Inn Inn - 9 units Homes - 4 Townhouses Inn
Condos 15 Condos Homes - 3 15 RentalNumber of Units / type
# 1 BR 15 8 6 8# 2 BR 14 7 3 15 7# Single Family 0 3 4 0
Number of SAC / type1 BR 0.675 0.36 0.27 0 0 0.362 BR 2.128 1.064 0.456 0 2.28 1.064
Single Family 0 0 2.85 3.8 0 0Total per option 2.803 1.424 3.576 3.8 2.28 1.424
Education Costs 18,220 9,256 23,244 24,700 14,820 9,256

15
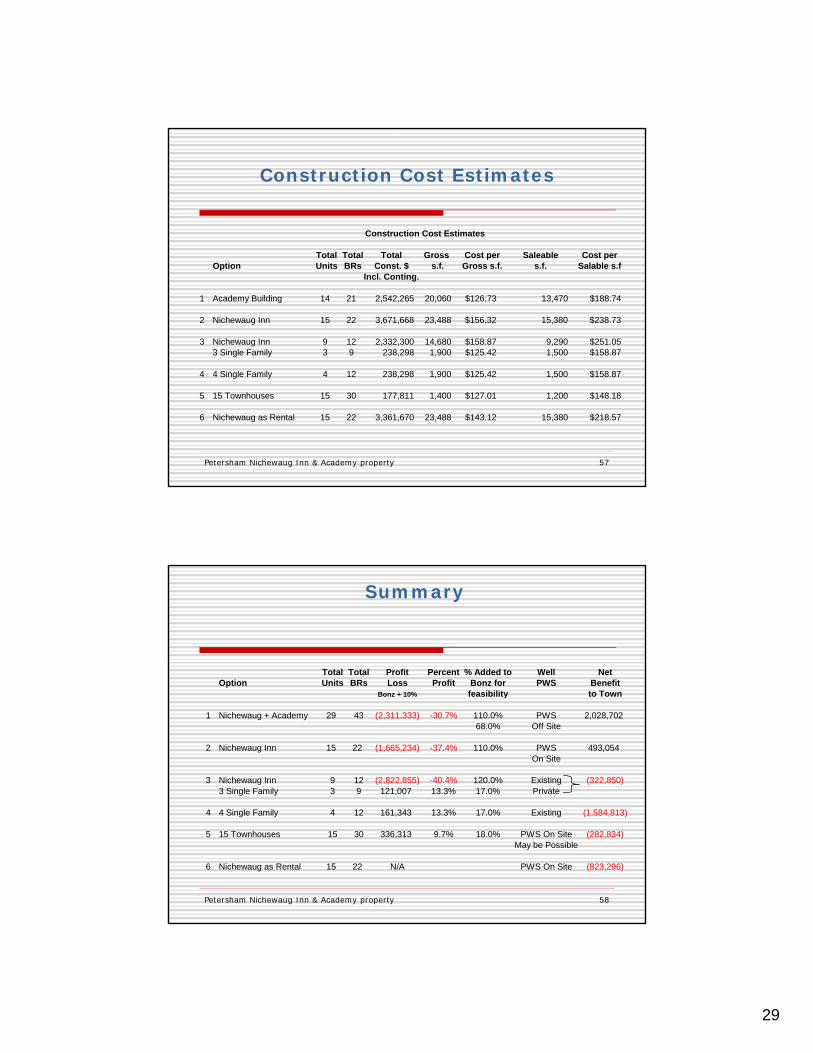
Construction Cost Estimates
Petersham Nichewaug Inn & Academy property 29
Construction Cost Estimates
Total Total Total Gross Cost per Saleable Cost perOption Units BRs Const. $ s.f. Gross s.f. s.f. Salable s.f
Incl. Conting.
1 Academy Building 14 21 2,542,265 20,060 $126.73 13,470 $188.74
2 Nichewaug Inn 15 22 3,671,668 23,488 $156.32 15,380 $238.73
3 Nichewaug Inn 9 12 2,332,300 14,680 $158.87 9,290 $251.053 Single Family 3 9 238,298 1,900 $125.42 1,500 $158.87
4 4 Single Family 4 12 238,298 1,900 $125.42 1,500 $158.87
5 15 Townhouses 15 30 177,811 1,400 $127.01 1,200 $148.18
6 Nichewaug as Rental 15 22 3,361,670 23,488 $143.12 15,380 $218.57
Petersham Nichewaug Inn & Academy property 30
Feasibility – Option 1Unit Size and Number
Inn Academy
1 BR Size 846 7962 BR Size 1,230 1,129
# 1 BR Units 8 7# 2 BR Units 7 7Total Units 15 14
Requires off-site water supply

16
Petersham Nichewaug Inn & Academy property 31
Feasibility – Option 1Nichewaug Inn + Academy Building
Sources of Funds Analysis A Analysis BBonz + Bonz +
Nichewaug Sales 10.0% 2,960,650 5,652,150 110.0%Academy Sales 10.0% 2,592,975 3,960,180 68.0%Cost of Sales @ 6.0% (333,218) (576,740)
Total Sources 5,220,408 9,035,590
Uses of FundsAcquisition $1.00 $1.00Water & Septic 138,000 138,000Soft Costs 1,129,806 1,129,806Academy Const. $113 2,311,150 2,311,150Nichewaug Const. $142 3,337,880 3,337,880Const. Conting. 10.0% 564,903 564,903Misc. 50,000 50,000
7,531,740 7,531,740
Total Sources 5,220,408 9,035,590Total Uses (7,531,740) (7,531,740)
Developer Profit (2,311,333) 1,503,850Profit as % of Costs -30.7% 20.0%
Petersham Nichewaug Inn & Academy property 32
Feasibility – Option 1Unit Pricing
AcademySale Prices Inn Building
Bonz plus 10.0% 10.0%One BR Units $162,903 $153,175Two BR Units $236,775 $217,250Price per s.f. $193 $193
Bonz plus 110.0% 68.0%One BR Units 310,997 233,940Two BR Units 452,025 331,800Price per s.f. $368 $294

17
Petersham Nichewaug Inn & Academy property 33
Option 1 Cost Benefit Assumptions
Total Sales value 9,612,330Assessed Value percent 90.0%Assessed Value 8,651,097Tax Rate $16.42Annual Property taxes 142,051Annual Inflation 2.50%
Total Cost 715,211Cont. & Mgmt 10.0% 71,521Issuance Cost 8.0% 57,217Amount of Debt 843,949Debt Service @ 6.7216% 56,727
Petersham Nichewaug Inn & Academy property 34
Option 1 Cost - Benefit
Option # 1 - Cost / Benefit Summary
Number of SAC 2.803First year education cost 18,220
Analysis A Analysis BTwenty yearCost Benefit 496,545 2,028,702

18
Petersham Nichewaug Inn & Academy property 35
Feasibility – Option 2Nichewaug Inn – 15 Units
Sale Prices # Units
Bonz plus 10.0%One BR Units $162,903 8Two BR Units $236,775 7Price per s.f. $193 15
Size of UnitsBonz plus 110.0%
One BR Units 310,997 846Two BR Units 452,025 1,230Price per s.f. $368
Petersham Nichewaug Inn & Academy property 36
Feasibility – Option 2Source & Uses of Funds
Sources of Funds Analysis A Analysis BBonz + 10.0% 110.0%
Nichewaug Sales 2,960,650 5,652,150Cost of Sales @ 6.0% (177,639) (339,129)
Total Sources 2,783,011 5,313,021
Uses of FundsAcquisition 1 1Water & Septic 84,000 84,000Soft Costs 667,576 667,576Nichewaug Const. $142 3,337,880 3,337,880Const. Conting. 10.0% 333,788 333,788Misc. 25,000 25,000
4,448,245 4,448,245
Total Sources 2,783,011 5,313,021Total Uses (4,448,245) (4,448,245)
Developer Profit (1,665,234) 864,776Profit as % of Costs -37.4% 19.4%

19
Petersham Nichewaug Inn & Academy property 37
Option 2 Cost - Benefit Assumptions
Total Sales value 5,652,150Assessed Value percent 90.0%Assessed Value 5,086,935Tax Rate $16.42Annual Property taxes 83,527Annual Inflation 2.50%
Cost of Env. & Demo 885,201Cont. & Mgmt 10.0% 88,520Issuance Cost 8.0% 70,816Amount of Debt 1,044,537Debt Service @ 6.7216% 70,209
Petersham Nichewaug Inn & Academy property 38
Option 2 Cost - Benefit
Number of SAC 1.4First year education cost 9,256
Analysis A Analysis BTwenty yearCost Benefit (522,985) 493,054

20
Petersham Nichewaug Inn & Academy property 39
Feasibility – Option 3Nichewaug – 9 units
Sale Prices # Units # BRs
Bonz plus 10.0%One BR Units $171,004 6 6Two BR Units $254,100 3 6Price per s.f. $193 9 12
Size of UnitsBonz plus 120.0%
One BR Units 342,008 888Two BR Units 508,200 1,320Price per s.f. $385
Private water supply - 12 Bedrooms
Petersham Nichewaug Inn & Academy property 40
Feasibility – Option 3Nichewaug – 9 Units
Sources of Funds Analysis A Analysis BBonz + 10.0% 120.0%
Nichewaug Sales 1,788,325 3,576,650Cost of Sales @ 6.0% (107,300) (214,599)
Total Sources 1,681,026 3,362,051
Uses of FundsAcquisition 1 1Water & Septic 41,500 41,500Soft Costs 424,055 424,055Nichewaug Const. $144 2,120,273 2,120,273Const. Conting. 10.0% 212,027 212,027Misc. 25,000 25,000
2,822,855 2,822,855
Total Sources 1,681,026 3,362,051Total Uses (2,822,855) (2,822,855)
Developer Profit (1,141,830) 539,196Profit as % of Costs -40.4% 19.1%

21
Petersham Nichewaug Inn & Academy property 41
Cost Benefit – Option 3Nichewaug – 9 Units + 3 S.F. homes
Sales value - Inn 3,576,650Sales value - homes 1,167,075Total Sales 4,743,725Assessed Value percent 90.0%Assessed Value 4,269,353Tax Rate $16.42Annual Property taxes 70,103Annual Inflation 2.50%
Total Cost 958,110Cont. & Mgmt 10.0% 95,811Issuance Cost 8.0% 76,649Amount of Debt 1,130,570Debt Service @ 6.7216% 75,992
Petersham Nichewaug Inn & Academy property 42
Nichewaug – 9 Units + 3 S.F. Homes
Number of SAC 3.6First year education cost 23,244
Analysis A Analysis BTwenty yearCost Benefit (1,024,300) (322,850)

22
Petersham Nichewaug Inn & Academy property 43
Feasibility – Option 4Single Family Homes
Sources of Funds Analysis A Analysis BBonz + 10.0% 17.0%
Sale Proceeds 365,750 389,025Less Cost of Sales @ (21,945) (23,342)
Total Sources 343,805 365,684
Uses of FundsAcquisition from the Town 1 1Water & Septic 10,375 10,375Soft Costs 29,795 29,795Const. Cost 238,298 238,298Misc. 25,000 25,000
Total Uses 303,469 303,469
Total Sources 343,805 365,684Total Uses (303,469) (303,469)
Developer Profit 40,336 62,214Profit as % of Costs 13.3% 20.5%
Petersham Nichewaug Inn & Academy property 44
Feasibility – Option 4Single Family Homes
Constr.Size Cost $ / s.f.
Home 1,500 218,498 $145.67Garage 400 19,800 $49.50
Total 1,900 238,298$125.42
Sales Price 365,750 $243.83

23
Petersham Nichewaug Inn & Academy property 45
4 Single Family HomesCost Benefit Assumptions
Sales value - homes 389,025 per homeTotal Sales 1,556,100Assessed Value percent 90.0%Assessed Value 1,400,490Tax Rate $16.42Annual Property taxes 22,996Annual Inflation 2.50%
Total Cost 971,629Cont. & Mgmt 10.0% 97,163Issuance Cost 8.0% 77,730Amount of Debt 1,146,522Debt Service @ 6.7216% 77,064
Petersham Nichewaug Inn & Academy property 46
4 Single Family Homes
Number of SAC 3.8First year education cost 24,700
Analysis A Analysis BTwenty yearCost Benefit (1,619,958) (1,584,813)

24
Petersham Nichewaug Inn & Academy property 47
Feasibility – Option 5Townhouses
Sources of Funds Analysis A Analysis BBonz + 10.0% 18.0%
Sale Proceeds 269,500 289,100Less Cost of Sales @ (16,170) (17,346)
Total Sources 253,330 271,754
Uses of FundsAcquisition from the Town 1 1Water & Septic 11,200 11,200Soft Costs 22,897 22,897Const. Cost 177,811 177,811Misc. 19,000 19,000
Total Uses 230,909 230,909
Total Sources 253,330 271,754Total Uses (230,909) (230,909)Developer Profit 22,421 40,845Profit as % of Costs 9.7% 17.7%
Petersham Nichewaug Inn & Academy property 48
Feasibility – Option 5Townhouses
Constr.Size Cost $ / s.f.
Home 1,200 167,911 $139.93Garage 200 9,000 $45.00
Total 1,400 176,911$126.37
Sales Price 269,500 $224.58
25
Petersham Nichewaug Inn & Academy property 49
15 TownhousesCost Benefit Assumptions
Sales value - homes 289,100 / townhouseTotal Sales 4,336,500Assessed Value percent 90.0%Assessed Value 3,902,850Tax Rate $16.42Annual Property taxes 64,085Annual Inflation 2.50%
Total Cost 971,629Cont. & Mgmt 10.0% 97,163
Issuance Cost 8.0% 77,730Amount of Debt 1,146,522Debt Service @ 6.7216% 77,064
Petersham Nichewaug Inn & Academy property 50
Option 5 - Townhouses
Assume all Townhouses are 2 bedroom units
Number of SAC 2.3First year education cost 14,820
Analysis A Analysis BTwenty yearCost Benefit (393,818) (282,834)

26
Petersham Nichewaug Inn & Academy property 51
Nichewaug Inn – Option 6(Option 2 as Rentals – 9 Units)
Rent Summary Avg s.f.
No. Leasable Rent Rent Type Units per unit per unit per s.f.
Inn 1 BR 8 846 $1,185 $1.40Inn 2 BR 7 1,230 $1,661 $1.35
Petersham Nichewaug Inn & Academy property 52
Feasibility – Option 6Rental Operations
Sources of Funds
Conventional Debt 1,489,000Federal Historic Credit 809,000State Historic Credit 724,000Mass Housing Program 1,100,000Developer Equity 300,000Deferred Developer Fee 407,000
Total 4,829,000

27
Petersham Nichewaug Inn & Academy property 53
Feasibility – Option 6Rental Operations
Uses of FundsRehab Costs
Acquisition 1 0Soft Costs 708,000 530,000Construction Costs 3,112,657 2,888,657Const. Contingency 249,013 231,093Development Fee 657,000 609,719Miscellaneous 18,329 0
Total 4,745,000 4,259,469
Petersham Nichewaug Inn & Academy property 54
Feasibility – Option 6Rental Operations
FEASIBILITY ISSUES WITH THIS OPTION / APPROACH
1. The Mass Housing Program is new, and the funding may not be available / feasible;
2. The Federal & State Historic Tax Credits are likely to require retaining much of the internal layout and organization of the Nichewaug Inn, compromising marketability;
3. It can take two to four years to obtain the full allocation of State Historic Tax Credits.

28
Petersham Nichewaug Inn & Academy property 55
Nichewaug – Option 6Cost Benefit Assumptions
Annual Property taxes 21,440Annual Inflation 2.5%
Total Cost 715,211Cont. & Mgmt 10.0% 71,521
Issuance Cost 8.0% 57,217Amount of Debt 843,949Debt Service @ 6.7216% 56,727
Petersham Nichewaug Inn & Academy property 56
Inn Rental: Option 6 – Cost Benefit
Number of SAC 1.4First year education cost 9,256
Analysis A Analysis BTwenty yearCost Benefit (823,296) (823,296)
29
Construction Cost Estimates
Petersham Nichewaug Inn & Academy property 57
Construction Cost Estimates
Total Total Total Gross Cost per Saleable Cost perOption Units BRs Const. $ s.f. Gross s.f. s.f. Salable s.f
Incl. Conting.
1 Academy Building 14 21 2,542,265 20,060 $126.73 13,470 $188.74
2 Nichewaug Inn 15 22 3,671,668 23,488 $156.32 15,380 $238.73
3 Nichewaug Inn 9 12 2,332,300 14,680 $158.87 9,290 $251.053 Single Family 3 9 238,298 1,900 $125.42 1,500 $158.87
4 4 Single Family 4 12 238,298 1,900 $125.42 1,500 $158.87
5 15 Townhouses 15 30 177,811 1,400 $127.01 1,200 $148.18
6 Nichewaug as Rental 15 22 3,361,670 23,488 $143.12 15,380 $218.57
Petersham Nichewaug Inn & Academy property 58
Summary
Total Total Profit Percent % Added to Well NetOption Units BRs Loss Profit Bonz for PWS Benefit
Bonz + 10% feasibility to Town
1 Nichewaug + Academy 29 43 (2,311,333) -30.7% 110.0% PWS 2,028,70268.0% Off Site
2 Nichewaug Inn 15 22 (1,665,234) -37.4% 110.0% PWS 493,054On Site
3 Nichewaug Inn 9 12 (2,822,855) -40.4% 120.0% Existing (322,850)3 Single Family 3 9 121,007 13.3% 17.0% Private
4 4 Single Family 4 12 161,343 13.3% 17.0% Existing (1,584,813)
5 15 Townhouses 15 30 336,313 9.7% 18.0% PWS On Site (282,834)May be Possible
6 Nichewaug as Rental 15 22 N/A PWS On Site (823,296)
30
Demo Only #1 #2 #3 #4 #5 # 6
Petersham Nichewaug Inn & Academy property 59
Net Gain To Town
(2,000,000)
(1,500,000)
(1,000,000)
(500,000)
0
500,000
1,000,000
1,500,000
2,000,000
2,500,000
Analysis A Analysis B
Petersham Nichewaug Inn & Academy property 60
• The Town should fund the necessary environmental clean-up and demolition of the connector building;• As needed, be ready to pay for subsequent demolition:
• A) to support an approved development proposal; or • B) to demolish all remaining buildings on the site; and• C) absent a better offer, make the site available to developers for
$1.00
• Authorize a Request for Development Proposals• For sections of the remaining buildings;• For new construction
• Appoint a Nichewaug Property Committee• To evaluate proposals and make recommendations to the
Selectboard for consideration by a future Town Meeting.
Recommendations

31
Petersham Nichewaug Inn & Academy property 61
Q & A


Nichewaug Inn Analysis Cost - Benefit Analysis A
Nichewaug Inn - Cost Benefit Analysis Based on Bonz plus 10%
Anticipated CostsEnvironmental Remediation - 2015 bid 494,729Demo of Connector Building - 2015 bid 139,700Demo of other buildings - 2015 Bid 337,200Total Demo and Remediation - 2015 bids: 971,629Contingency, management 10.0% 97,163 (Please see page 8 below for cost breakdown for each option)Costs of Issuance 8.0% 77,730Total Debt to be raised 1,146,522Rounded: 1,150,000
Debt Service Calculation: Annual Maintenance & Insurance @ 1,200Amount of Loan 1,150,000Annual Interest Rate 3.0%Number of Months 20Monthly Pmt 6,442Annual Payment 6.7216% 77,298 (based on one annual payment)
Current Tax Rate $16.42 per thousand
Bonding of Costs
Annual Balance Plus CumulativeYears Debt Service Interest Principal End of Year Operations Cost
1,150,0001 77,298 34,500 42,798 1,107,202 1,200 78,4982 77,298 33,216 44,082 1,063,120 1,236 157,0323 77,298 31,894 45,404 1,017,715 1,273 235,6034 77,298 30,531 46,767 970,949 1,311 314,2135 77,298 29,128 48,170 922,779 1,351 392,8616 77,298 27,683 49,615 873,165 1,391 471,5507 77,298 26,195 51,103 822,061 1,433 550,2818 77,298 24,662 52,636 769,425 1,476 629,0559 77,298 23,083 54,215 715,210 1,520 707,874
10 77,298 21,456 55,842 659,368 1,566 786,73711 77,298 19,781 57,517 601,851 1,613 865,64812 77,298 18,056 59,243 542,609 1,661 944,60713 77,298 16,278 61,020 481,589 1,711 1,023,61614 77,298 14,448 62,850 418,738 1,762 1,102,67615 77,298 12,562 64,736 354,002 1,815 1,181,79016 77,298 10,620 66,678 287,325 1,870 1,260,95717 77,298 8,620 68,678 218,646 1,926 1,340,18118 77,298 6,559 70,739 147,908 1,983 1,419,46219 77,298 4,437 72,861 75,047 2,043 1,498,80320 77,298 2,251 75,047 (0) 2,104 1,578,206
Totals 1,545,961 395,961 1,150,000
Concord Square Planning & Development, Inc.
Page 110/31/2016 161030 v. 9 Nichewaug Pro Forma Analysiis 10-30-16.xls

Nichewaug Inn Analysis Cost - Benefit Analysis A
Option 1 Analysis Academy Building plus Nichewaug Inn: Number of units: 29Option 1 Cost Benefits Analysis
Total Sales value 5,553,625Assessed Value percent 90.0%Assessed Value 4,998,263Tax Rate $16.42Annual Property taxes 82,071Annual Inflation 2.50% = Proposition 2 1/2 maximum annual increase in tax levy.
Total Cost 715,211Cont. & Mgmt 10.0% 71,521
Issuance Cost 8.0% 57,217Amount of Debt 843,949Debt Service @ 6.7216% 56,727
Annual School Costs 18,220 Estimated annual increase: 2.5% (please see p. 9 below for assumptions)
Annual Annual Annual Net Rev. CumulativeYears Debt Service School Costs Revenues per year Revenues
1 56,727 18,220 82,071 7,125 7,1252 56,727 18,675 84,123 8,722 15,8473 56,727 19,142 86,226 10,358 26,2054 56,727 19,620 88,382 12,035 38,2405 56,727 20,111 90,592 13,754 51,9946 56,727 20,614 92,856 15,516 67,5107 56,727 21,129 95,178 17,322 84,8328 56,727 21,657 97,557 19,173 104,0059 56,727 22,199 99,996 21,071 125,076
10 56,727 22,754 102,496 23,016 148,09211 56,727 23,323 105,058 25,009 173,10112 56,727 23,906 107,685 27,053 200,15413 56,727 24,503 110,377 29,147 229,30114 56,727 25,116 113,136 31,294 260,59515 56,727 25,744 115,965 33,495 294,09016 56,727 26,387 118,864 35,750 329,84017 56,727 27,047 121,836 38,062 367,90218 56,727 27,723 124,881 40,432 408,33419 56,727 28,416 128,003 42,861 451,19420 56,727 29,127 131,204 45,350 496,545
1,134,532 465,411 2,096,488 496,545
Concord Square Planning & Development, Inc.
Page 210/31/2016 161030 v. 9 Nichewaug Pro Forma Analysiis 10-30-16.xls

Nichewaug Inn Analysis Cost - Benefit Analysis A
Option 2 Analysis Nichewaug Inn - 15 Units
Total Sales value 2,960,650Assessed Value percent 90.0%Assessed Value 2,664,585Tax Rate $16.42Annual Property taxes 43,752Annual Inflation 2.50%
Cost of Env. & Demo 885,201Cont. & Mgmt 10.0% 88,520
Issuance Cost 8.0% 70,816Amount of Debt 1,044,537Debt Service @ 6.7216% 70,209
Annual School Costs 9,256 Estimated annual increase: 2.5%
Annual Annual Annual Net Rev. CumulativeYears Debt Service School Costs Revenues per year Revenues
1 70,209 9,256 43,752 (35,713) (35,713)2 70,209 9,487 44,846 (34,850) (70,563)3 70,209 9,725 45,967 (33,966) (104,530)4 70,209 9,968 47,117 (33,060) (137,590)5 70,209 10,217 48,295 (32,132) (169,722)6 70,209 10,472 49,502 (31,180) (200,901)7 70,209 10,734 50,739 (30,204) (231,105)8 70,209 11,002 52,008 (29,204) (260,309)9 70,209 11,278 53,308 (28,179) (288,488)
10 70,209 11,559 54,641 (27,128) (315,615)11 70,209 11,848 56,007 (26,051) (341,666)12 70,209 12,145 57,407 (24,947) (366,613)13 70,209 12,448 58,842 (23,815) (390,429)14 70,209 12,759 60,313 (22,655) (413,084)15 70,209 13,078 61,821 (21,467) (434,551)16 70,209 13,405 63,367 (20,248) (454,799)17 70,209 13,741 64,951 (18,999) (473,798)18 70,209 14,084 66,575 (17,719) (491,517)19 70,209 14,436 68,239 (16,407) (507,923)20 70,209 14,797 69,945 (15,061) (522,985)
1,404,186 236,441 1,117,642 (522,985)
Concord Square Planning & Development, Inc.
Page 310/31/2016 161030 v. 9 Nichewaug Pro Forma Analysiis 10-30-16.xls

Nichewaug Inn Analysis Cost - Benefit Analysis A
Option 3 Analysis Nichewaug Inn - 9 Units + 3 homes
Sales value - Inn 1,788,325Sales value - homes 1,097,250Total Sales 2,885,575Assessed Value percent 90.0%Assessed Value 2,597,018Tax Rate $16.42Annual Property taxes 42,643Annual Inflation 2.50%
Total Cost 958,110Cont. & Mgmt 10.0% 95,811
Issuance Cost 8.0% 76,649Amount of Debt 1,130,570Debt Service @ 6.7216% 75,992
Annual School Costs 23,244 Estimated annual increase: 2.5%
Annual Annual Annual Net Rev. CumulativeYears Debt Service School Costs Revenues per year Revenues
1 75,992 23,244 42,643 (56,593) (56,593)2 75,992 23,825 43,709 (56,108) (112,701)3 75,992 24,421 44,802 (55,611) (168,312)4 75,992 25,031 45,922 (55,101) (223,414)5 75,992 25,657 47,070 (54,579) (277,993)6 75,992 26,298 48,247 (54,044) (332,037)7 75,992 26,956 49,453 (53,495) (385,532)8 75,992 27,630 50,689 (52,933) (438,464)9 75,992 28,321 51,956 (52,356) (490,821)
10 75,992 29,029 53,255 (51,765) (542,586)11 75,992 29,754 54,587 (51,160) (593,746)12 75,992 30,498 55,951 (50,539) (644,285)13 75,992 31,261 57,350 (49,903) (694,187)14 75,992 32,042 58,784 (49,250) (743,437)15 75,992 32,843 60,253 (48,582) (792,019)16 75,992 33,664 61,760 (47,896) (839,916)17 75,992 34,506 63,304 (47,194) (887,110)18 75,992 35,368 64,886 (46,474) (933,584)19 75,992 36,253 66,509 (45,736) (979,320)20 75,992 37,159 68,171 (44,980) (1,024,300)
1,519,841 593,760 1,089,302 (1,024,300)
Concord Square Planning & Development, Inc.
Page 410/31/2016 161030 v. 9 Nichewaug Pro Forma Analysiis 10-30-16.xls

Nichewaug Inn Analysis Cost - Benefit Analysis A
Option 4 Analysis Four Single Family Homes - 12 bedrooms
Sales value - homes 365,750 per homeTotal Sales 1,463,000Assessed Value percent 90.0%Assessed Value 1,316,700Tax Rate $16.42Annual Property taxes 21,620Annual Inflation 2.50%
Total Cost 971,629Cont. & Mgmt 10.0% 97,163
Issuance Cost 8.0% 77,730Amount of Debt 1,146,522Debt Service @ 6.7216% 77,064
Annual School Costs 24,700 Estimated annual increase: 2.5%
Annual Annual Annual Net Rev. CumulativeYears Debt Service School Costs Revenues per year Revenues
1 77,064 24,700 21,620 (80,144) (80,144)2 77,064 25,318 22,161 (80,221) (160,365)3 77,064 25,950 22,715 (80,300) (240,665)4 77,064 26,599 23,283 (80,381) (321,046)5 77,064 27,264 23,865 (80,464) (401,510)6 77,064 27,946 24,461 (80,549) (482,059)7 77,064 28,644 25,073 (80,636) (562,695)8 77,064 29,361 25,700 (80,725) (643,420)9 77,064 30,095 26,342 (80,817) (724,237)
10 77,064 30,847 27,001 (80,911) (805,147)11 77,064 31,618 27,676 (81,007) (886,154)12 77,064 32,409 28,368 (81,105) (967,259)13 77,064 33,219 29,077 (81,206) (1,048,465)14 77,064 34,049 29,804 (81,310) (1,129,775)15 77,064 34,900 30,549 (81,416) (1,211,191)16 77,064 35,773 31,313 (81,525) (1,292,716)17 77,064 36,667 32,095 (81,636) (1,374,352)18 77,064 37,584 32,898 (81,751) (1,456,103)19 77,064 38,524 33,720 (81,868) (1,537,970)20 77,064 39,487 34,563 (81,988) (1,619,958)
1,541,286 630,953 552,281 (1,619,958)
Concord Square Planning & Development, Inc.
Page 510/31/2016 161030 v. 9 Nichewaug Pro Forma Analysiis 10-30-16.xls

Nichewaug Inn Analysis Cost - Benefit Analysis A
Option 5 Analysis New Construction - Townhouses - # units: 15
Sales value - homes 269,500 per townhouseTotal Sales 4,042,500Assessed Value percent 90.0%Assessed Value 3,638,250Tax Rate $16.42Annual Property taxes 59,740Annual Inflation 2.50%
Total Cost 971,629Cont. & Mgmt 10.0% 97,163
Issuance Cost 8.0% 77,730Amount of Debt 1,146,522Debt Service @ 6.7216% 77,064
Annual School Costs 14,820 Estimated annual increase: 2.5%
Annual Annual Annual Net Rev. CumulativeYears Debt Service School Costs Revenues per year Revenues
1 77,064 14,820 59,740 (32,144) (32,144)2 77,064 15,191 61,234 (31,021) (63,165)3 77,064 15,570 62,764 (29,870) (93,036)4 77,064 15,960 64,334 (28,690) (121,726)5 77,064 16,359 65,942 (27,481) (149,207)6 77,064 16,767 67,590 (26,241) (175,448)7 77,064 17,187 69,280 (24,971) (200,419)8 77,064 17,616 71,012 (23,668) (224,088)9 77,064 18,057 72,787 (22,334) (246,421)
10 77,064 18,508 74,607 (20,965) (267,386)11 77,064 18,971 76,472 (19,563) (286,949)12 77,064 19,445 78,384 (18,125) (305,074)13 77,064 19,931 80,344 (16,652) (321,726)14 77,064 20,430 82,352 (15,141) (336,868)15 77,064 20,940 84,411 (13,593) (350,461)16 77,064 21,464 86,521 (12,007) (362,468)17 77,064 22,000 88,684 (10,380) (372,848)18 77,064 22,550 90,902 (8,713) (381,561)19 77,064 23,114 93,174 (7,004) (388,566)20 77,064 23,692 95,503 (5,253) (393,818)
1,541,286 378,572 1,526,040 (393,818)
Concord Square Planning & Development, Inc.
Page 610/31/2016 161030 v. 9 Nichewaug Pro Forma Analysiis 10-30-16.xls

Nichewaug Inn Analysis Cost - Benefit Analysis A
Option 6 Analysis Rental - Inn 29 apartments
Sales value - homes N/ATotal Sales N/AAssessed Value percent N/AAssessed Value N/ATax Rate N/AAnnual Property taxes 21,440Annual Inflation 2.5%
Total Cost 715,211Cont. & Mgmt 10.0% 71,521
Issuance Cost 8.0% 57,217Amount of Debt 843,949Debt Service @ 6.7216% 56,727
Annual School Costs 9,256 Estimated annual increase: 2.5%
Annual Annual Annual Net Rev. CumulativeYears Debt Service School Costs Revenues per year Revenues
1 56,727 9,256 21,440 (44,543) (44,543)2 56,727 9,487 21,976 (44,238) (88,781)3 56,727 9,725 22,525 (43,926) (132,706)4 56,727 9,968 23,089 (43,606) (176,312)5 56,727 10,217 23,666 (43,278) (219,590)6 56,727 10,472 24,257 (42,942) (262,531)7 56,727 10,734 24,864 (42,597) (305,128)8 56,727 11,002 25,485 (42,244) (347,372)9 56,727 11,278 26,123 (41,882) (389,254)
10 56,727 11,559 26,776 (41,510) (430,764)11 56,727 11,848 27,445 (41,130) (471,894)12 56,727 12,145 28,131 (40,740) (512,634)13 56,727 12,448 28,834 (40,340) (552,975)14 56,727 12,759 29,555 (39,931) (592,906)15 56,727 13,078 30,294 (39,511) (632,416)16 56,727 13,405 31,052 (39,081) (671,497)17 56,727 13,741 31,828 (38,639) (710,136)18 56,727 14,084 32,623 (38,187) (748,324)19 56,727 14,436 33,439 (37,724) (786,047)20 56,727 14,797 34,275 (37,249) (823,296)
1,134,532 236,441 547,677 (823,296)
Concord Square Planning & Development, Inc.
Page 710/31/2016 161030 v. 9 Nichewaug Pro Forma Analysiis 10-30-16.xls

Nichewaug Inn Analysis Cost - Benefit Analysis A
Town Costs per Option Inn + Acad. Inn Inn - 9 units Homes - 4 Townhouses Inn + Acad.Condos 15 Condos Homes - 3 15 Rental
Option 1 Option 2 Option 3 Option 4 Option 5 Option 6
Environmental Cost 494,729 494,729 494,729 494,729 494,729 494,729Connector Building Demo 139,700 139,700 139,700 139,700 139,700 139,700Other Demo 80,782 250,772 323,681 337,200 337,200 80,782
Total Costs 715,211 885,201 958,110 971,629 971,629 715,211
Other Demo s.f. 9,759 30,295 39,103 53,783 53,783 9,759Other Demo Cost / s.f. $8.28 $8.28 $8.28 $6.27 $6.27 $6.27Other Demo Cost 80,782 250,772 323,681 337,200 337,200 61,185
Bid from 2015 Grosss.f. $ / s.f.
Environmental Remediation - 2015 bid 494,729 68,366 $7.24Demo of Connector Building - 2015 bid 139,700 14,583 $9.58Demo of other buildings - 2015 Bid 337,200 53,783 $6.27Total Demo and Remediation - 2015 bids: 971,629
Concord Square Planning & Development, Inc.
Page 810/31/2016 161030 v. 9 Nichewaug Pro Forma Analysiis 10-30-16.xls

Nichewaug Inn Analysis Cost - Benefit Analysis A
Estimates of number of school aged children
Estimated number of School Aged Children (SAC)Per Housing Type
One Bedroom 0.045Two Bedroom 0.152
Single Family Home (3 BRs) 0.95
Estimated Cost / SACSchool Choice Revenue 5,000
Other Costs, Averaged: 30.0% 1,500 (this is a guess, and not based on any analysis)Budget Amount per student: 6,500
Option 1 Option 2 Option 3 Option 4 Option 5 Option 6Inn + Acad. Inn Inn - 9 units Homes - 4 Townhouses Inn
Condos 15 Condos Homes - 3 15 RentalNumber of Units / type# 1 BR 15 8 6 8# 2 BR 14 7 3 15 7# Single Family 0 3 4
Number of SAC / type1 BR 0.675 0.36 0.27 0 0 0.362 BR 2.128 1.064 0.456 0 2.28 1.064
Single Family 0 0 2.85 3.8 0 0Total per option 2.8 1.4 3.6 3.8 2.3 1.4
Education Costs 18,220 9,256 23,244 24,700 14,820 9,256
In 2003 and 2004 Concord Square participated in a major study carried out by the Center for Urban and Regional Policy at Northeastern University in conjuction with the analysis related to the proposed passage of Smart Growth Zoning, Chapter 40R, and the related Smart Growth School Cost Insurance Supplement, Chapter 40S. The former was passed by the legislature and signed by the Governor in 2004 as Chapter 40R to the Mass General Laws, and the latter was passed and signed in 2005 as Chapter 40S. In both cases, the legislature, the Secretary of Administration and Finance, and the Governor accepted the school cost assumptions and the analysis that was prepared.
The number of School Aged Children assumed for various housing types was as follows:
Concord Square Planning & Development, Inc.
Page 910/31/2016 161030 v. 9 Nichewaug Pro Forma Analysiis 10-30-16.xls

Nichewaug Inn Analysis Cost - Benefit Analysis B
Nichewaug Inn - Cost Benefit Analysis Based on Financial Feasibility Amounts
Anticipated CostsEnvironmental Remediation - 2015 bid 494,729Demo of Connector Building - 2015 bid 139,700Demo of other buildings - 2015 Bid 337,200Total Demo and Remediation - 2015 bids: 971,629Contingency, management 10.0% 97,163 (Please see page 8 below for cost breakdown for each option)Costs of Issuance 8.0% 77,730Total Debt to be raised 1,146,522Rounded: 1,150,000
Debt Service Calculation:Amount of Loan 1,150,000Annual Interest Rate 3.0%Number of Months 20Monthly Pmt 6,442Annual Payment 6.7216% 77,298 (based on one annual payment)
Current Tax Rate $16.42 per thousand
Bonding of Costs
Annual Balance Plus CumulativeYears Debt Service Interest Principal End of Year Operations Cost
1,150,0001 77,298 34,500 42,798 1,107,202 1,200 78,4982 77,298 33,216 44,082 1,063,120 1,236 157,0323 77,298 31,894 45,404 1,017,715 1,273 235,6034 77,298 30,531 46,767 970,949 1,311 314,2135 77,298 29,128 48,170 922,779 1,351 392,8616 77,298 27,683 49,615 873,165 1,391 471,5507 77,298 26,195 51,103 822,061 1,433 550,2818 77,298 24,662 52,636 769,425 1,476 629,0559 77,298 23,083 54,215 715,210 1,520 707,874
10 77,298 21,456 55,842 659,368 1,566 786,73711 77,298 19,781 57,517 601,851 1,613 865,64812 77,298 18,056 59,243 542,609 1,661 944,60713 77,298 16,278 61,020 481,589 1,711 1,023,61614 77,298 14,448 62,850 418,738 1,762 1,102,67615 77,298 12,562 64,736 354,002 1,815 1,181,79016 77,298 10,620 66,678 287,325 1,870 1,260,95717 77,298 8,620 68,678 218,646 1,926 1,340,18118 77,298 6,559 70,739 147,908 1,983 1,419,46219 77,298 4,437 72,861 75,047 2,043 1,498,80320 77,298 2,251 75,047 (0) 2,104 1,578,206
Totals 1,545,961 395,961 1,150,000
Concord Square Planning & Development, Inc.
Page 1010/31/2016 161030 v. 9 Nichewaug Pro Forma Analysiis 10-30-16.xls

Nichewaug Inn Analysis Cost - Benefit Analysis B
Option 1 Analysis Academy Building plus Nichewaug Inn: Number of units: 29Option 1 Cost Benefits Analysis
Total Sales value 9,612,330Assessed Value percent 90.0%Assessed Value 8,651,097Tax Rate $16.42Annual Property taxes 142,051Annual Inflation 2.50% = Proposition 2 1/2 maximum annual increase in tax levy.
Total Cost 715,211Cont. & Mgmt 10.0% 71,521
Issuance Cost 8.0% 57,217Amount of Debt 843,949Debt Service @ 6.7216% 56,727
Annual School Costs 18,220 Estimated annual increase: 2.5% (please see p. 18 below for assumptions)
Annual Annual Annual Net Rev. CumulativeYears Debt Service School Costs Revenues per year Revenues
1 56,727 18,220 142,051 67,105 67,1052 56,727 18,675 145,602 70,201 137,3063 56,727 19,142 149,242 73,374 210,6794 56,727 19,620 152,973 76,626 287,3065 56,727 20,111 156,798 79,960 367,2666 56,727 20,614 160,718 83,377 450,6437 56,727 21,129 164,736 86,880 537,5238 56,727 21,657 168,854 90,470 627,9949 56,727 22,199 173,075 94,150 722,144
10 56,727 22,754 177,402 97,922 820,06611 56,727 23,323 181,837 101,788 921,85412 56,727 23,906 186,383 105,751 1,027,60513 56,727 24,503 191,043 109,813 1,137,41814 56,727 25,116 195,819 113,977 1,251,39415 56,727 25,744 200,714 118,244 1,369,63916 56,727 26,387 205,732 122,618 1,492,25717 56,727 27,047 210,876 127,102 1,619,35918 56,727 27,723 216,147 131,698 1,751,05719 56,727 28,416 221,551 136,408 1,887,46520 56,727 29,127 227,090 141,237 2,028,702
1,134,532 465,411 3,628,644 2,028,702
Concord Square Planning & Development, Inc.
Page 1110/31/2016 161030 v. 9 Nichewaug Pro Forma Analysiis 10-30-16.xls

Nichewaug Inn Analysis Cost - Benefit Analysis B
Option 2 Analysis Nichewaug Inn - 15 Units
Total Sales value 5,652,150Assessed Value percent 90.0%Assessed Value 5,086,935Tax Rate $16.42Annual Property taxes 83,527Annual Inflation 2.50%
Cost of Env. & Demo 885,201Cont. & Mgmt 10.0% 88,520
Issuance Cost 8.0% 70,816Amount of Debt 1,044,537Debt Service @ 6.7216% 70,209
Annual School Costs 9,256 Estimated annual increase: 2.5%
Annual Annual Annual Net Rev. CumulativeYears Debt Service School Costs Revenues per year Revenues
1 70,209 9,256 83,527 4,062 4,0622 70,209 9,487 85,616 5,919 9,9813 70,209 9,725 87,756 7,822 17,8034 70,209 9,968 89,950 9,773 27,5765 70,209 10,217 92,199 11,773 39,3496 70,209 10,472 94,504 13,822 53,1717 70,209 10,734 96,866 15,923 69,0948 70,209 11,002 99,288 18,076 87,1709 70,209 11,278 101,770 20,283 107,453
10 70,209 11,559 104,314 22,546 129,99911 70,209 11,848 106,922 24,864 154,86312 70,209 12,145 109,595 27,241 182,10513 70,209 12,448 112,335 29,678 211,78214 70,209 12,759 115,144 32,175 243,95715 70,209 13,078 118,022 34,734 278,69116 70,209 13,405 120,973 37,358 316,04917 70,209 13,741 123,997 40,047 356,09718 70,209 14,084 127,097 42,804 398,90019 70,209 14,436 130,274 45,629 444,52920 70,209 14,797 133,531 48,525 493,054
1,404,186 236,441 2,133,681 493,054
Concord Square Planning & Development, Inc.
Page 1210/31/2016 161030 v. 9 Nichewaug Pro Forma Analysiis 10-30-16.xls

Nichewaug Inn Analysis Cost - Benefit Analysis B
Option 3 Analysis Nichewaug Inn - 9 Units + 3 homes
Sales value - Inn 3,576,650Sales value - homes 1,167,075Total Sales 4,743,725Assessed Value percent 90.0%Assessed Value 4,269,353Tax Rate $16.42Annual Property taxes 70,103Annual Inflation 2.50%
Total Cost 958,110Cont. & Mgmt 10.0% 95,811
Issuance Cost 8.0% 76,649Amount of Debt 1,130,570Debt Service @ 6.7216% 75,992
Annual School Costs 23,244 Estimated annual increase: 2.5%
Annual Annual Annual Net Rev. CumulativeYears Debt Service School Costs Revenues per year Revenues
1 75,992 23,244 70,103 (29,133) (29,133)2 75,992 23,825 71,855 (27,962) (57,095)3 75,992 24,421 73,652 (26,761) (83,856)4 75,992 25,031 75,493 (25,530) (109,387)5 75,992 25,657 77,380 (24,269) (133,655)6 75,992 26,298 79,315 (22,976) (156,631)7 75,992 26,956 81,298 (21,650) (178,281)8 75,992 27,630 83,330 (20,292) (198,573)9 75,992 28,321 85,413 (18,899) (217,472)
10 75,992 29,029 87,549 (17,472) (234,944)11 75,992 29,754 89,737 (16,009) (250,953)12 75,992 30,498 91,981 (14,509) (265,462)13 75,992 31,261 94,280 (12,972) (278,434)14 75,992 32,042 96,637 (11,397) (289,831)15 75,992 32,843 99,053 (9,782) (299,613)16 75,992 33,664 101,530 (8,127) (307,740)17 75,992 34,506 104,068 (6,430) (314,170)18 75,992 35,368 106,670 (4,691) (318,861)19 75,992 36,253 109,336 (2,908) (321,769)20 75,992 37,159 112,070 (1,081) (322,850)
1,519,841 593,760 1,790,751 (322,850)
Concord Square Planning & Development, Inc.
Page 1310/31/2016 161030 v. 9 Nichewaug Pro Forma Analysiis 10-30-16.xls

Nichewaug Inn Analysis Cost - Benefit Analysis B
Option 4 Analysis Four Single Family Homes - 12 bedrooms
Sales value - homes 389,025 per homeTotal Sales 1,556,100Assessed Value percent 90.0%Assessed Value 1,400,490Tax Rate $16.42Annual Property taxes 22,996Annual Inflation 2.50%
Total Cost 971,629Cont. & Mgmt 10.0% 97,163
Issuance Cost 8.0% 77,730Amount of Debt 1,146,522Debt Service @ 6.7216% 77,064
Annual School Costs 24,700 Estimated annual increase: 2.5%
Annual Annual Annual Net Rev. CumulativeYears Debt Service School Costs Revenues per year Revenues
1 77,064 24,700 22,996 (78,768) (78,768)2 77,064 25,318 23,571 (78,811) (157,579)3 77,064 25,950 24,160 (78,855) (236,434)4 77,064 26,599 24,764 (78,899) (315,333)5 77,064 27,264 25,383 (78,945) (394,278)6 77,064 27,946 26,018 (78,992) (473,270)7 77,064 28,644 26,668 (79,040) (552,311)8 77,064 29,361 27,335 (79,090) (631,400)9 77,064 30,095 28,018 (79,140) (710,541)
10 77,064 30,847 28,719 (79,192) (789,733)11 77,064 31,618 29,437 (79,246) (868,979)12 77,064 32,409 30,173 (79,300) (948,279)13 77,064 33,219 30,927 (79,356) (1,027,635)14 77,064 34,049 31,700 (79,413) (1,107,048)15 77,064 34,900 32,493 (79,472) (1,186,520)16 77,064 35,773 33,305 (79,532) (1,266,052)17 77,064 36,667 34,138 (79,594) (1,345,646)18 77,064 37,584 34,991 (79,657) (1,425,303)19 77,064 38,524 35,866 (79,722) (1,505,025)20 77,064 39,487 36,763 (79,788) (1,584,813)
1,541,286 630,953 587,426 (1,584,813)
Concord Square Planning & Development, Inc.
Page 1410/31/2016 161030 v. 9 Nichewaug Pro Forma Analysiis 10-30-16.xls

Nichewaug Inn Analysis Cost - Benefit Analysis B
Option 5 Analysis New Construction - Townhouses - # units: 15
Sales value - homes 289,100 / townhouseTotal Sales 4,336,500Assessed Value percent 90.0%Assessed Value 3,902,850Tax Rate $16.42Annual Property taxes 64,085Annual Inflation 2.50%
Total Cost 971,629Cont. & Mgmt 10.0% 97,163
Issuance Cost 8.0% 77,730Amount of Debt 1,146,522Debt Service @ 6.7216% 77,064
Annual School Costs 14,820 Estimated annual increase: 2.5%
Annual Annual Annual Net Rev. CumulativeYears Debt Service School Costs Revenues per year Revenues
1 77,064 14,820 64,085 (27,800) (27,800)2 77,064 15,191 65,687 (26,568) (54,367)3 77,064 15,570 67,329 (25,305) (79,673)4 77,064 15,960 69,012 (24,012) (103,684)5 77,064 16,359 70,738 (22,685) (126,370)6 77,064 16,767 72,506 (21,326) (147,695)7 77,064 17,187 74,319 (19,932) (167,628)8 77,064 17,616 76,177 (18,504) (186,131)9 77,064 18,057 78,081 (17,040) (203,171)
10 77,064 18,508 80,033 (15,539) (218,711)11 77,064 18,971 82,034 (14,001) (232,712)12 77,064 19,445 84,085 (12,425) (245,137)13 77,064 19,931 86,187 (10,809) (255,945)14 77,064 20,430 88,342 (9,152) (265,097)15 77,064 20,940 90,550 (7,454) (272,552)16 77,064 21,464 92,814 (5,714) (278,266)17 77,064 22,000 95,134 (3,930) (282,196)18 77,064 22,550 97,513 (2,102) (284,299)19 77,064 23,114 99,950 (228) (284,527)20 77,064 23,692 102,449 1,693 (282,834)
1,541,286 378,572 1,637,024 (282,834)
Concord Square Planning & Development, Inc.
Page 1510/31/2016 161030 v. 9 Nichewaug Pro Forma Analysiis 10-30-16.xls

Nichewaug Inn Analysis Cost - Benefit Analysis B
Option 6 Analysis Rental - Inn 29 apartments
Sales value - homes N/ATotal Sales N/AAssessed Value percent N/AAssessed Value N/ATax Rate N/AAnnual Property taxes 21,440Annual Inflation 2.50%
Total Cost 715,211Cont. & Mgmt 10.0% 71,521
Issuance Cost 8.0% 57,217Amount of Debt 843,949Debt Service @ 6.7216% 56,727
Annual School Costs 9,256 Estimated annual increase: 2.5%
Annual Annual Annual Net Rev. CumulativeYears Debt Service School Costs Revenues per year Revenues
1 56,727 9,256 21,440 (44,543) (44,543)2 56,727 9,487 21,976 (44,238) (88,781)3 56,727 9,725 22,525 (43,926) (132,706)4 56,727 9,968 23,089 (43,606) (176,312)5 56,727 10,217 23,666 (43,278) (219,590)6 56,727 10,472 24,257 (42,942) (262,531)7 56,727 10,734 24,864 (42,597) (305,128)8 56,727 11,002 25,485 (42,244) (347,372)9 56,727 11,278 26,123 (41,882) (389,254)
10 56,727 11,559 26,776 (41,510) (430,764)11 56,727 11,848 27,445 (41,130) (471,894)12 56,727 12,145 28,131 (40,740) (512,634)13 56,727 12,448 28,834 (40,340) (552,975)14 56,727 12,759 29,555 (39,931) (592,906)15 56,727 13,078 30,294 (39,511) (632,416)16 56,727 13,405 31,052 (39,081) (671,497)17 56,727 13,741 31,828 (38,639) (710,136)18 56,727 14,084 32,623 (38,187) (748,324)19 56,727 14,436 33,439 (37,724) (786,047)20 56,727 14,797 34,275 (37,249) (823,296)
1,134,532 236,441 547,677 (823,296)
Concord Square Planning & Development, Inc.
Page 1610/31/2016 161030 v. 9 Nichewaug Pro Forma Analysiis 10-30-16.xls
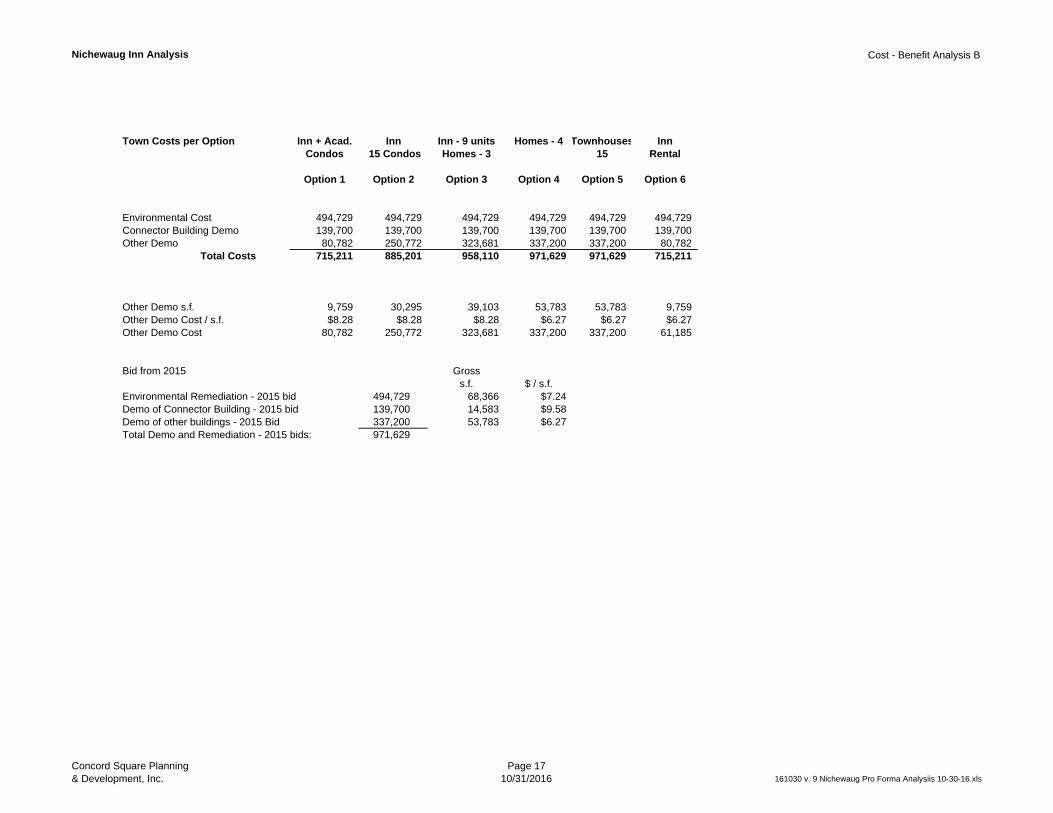
Nichewaug Inn Analysis Cost - Benefit Analysis B
Town Costs per Option Inn + Acad. Inn Inn - 9 units Homes - 4 Townhouses InnCondos 15 Condos Homes - 3 15 Rental
Option 1 Option 2 Option 3 Option 4 Option 5 Option 6
Environmental Cost 494,729 494,729 494,729 494,729 494,729 494,729Connector Building Demo 139,700 139,700 139,700 139,700 139,700 139,700Other Demo 80,782 250,772 323,681 337,200 337,200 80,782
Total Costs 715,211 885,201 958,110 971,629 971,629 715,211
Other Demo s.f. 9,759 30,295 39,103 53,783 53,783 9,759Other Demo Cost / s.f. $8.28 $8.28 $8.28 $6.27 $6.27 $6.27Other Demo Cost 80,782 250,772 323,681 337,200 337,200 61,185
Bid from 2015 Grosss.f. $ / s.f.
Environmental Remediation - 2015 bid 494,729 68,366 $7.24Demo of Connector Building - 2015 bid 139,700 14,583 $9.58Demo of other buildings - 2015 Bid 337,200 53,783 $6.27Total Demo and Remediation - 2015 bids: 971,629
Concord Square Planning & Development, Inc.
Page 1710/31/2016 161030 v. 9 Nichewaug Pro Forma Analysiis 10-30-16.xls

Nichewaug Inn Analysis Cost - Benefit Analysis B
Estimates of number of school aged children
Estimated number of School Aged Children (SAC) per housing type:
One Bedroom 0.045Two Bedroom 0.152
Single Family Home (3 BRs) 0.95
Estimated Cost / SACSchool Choice Revenue 5,000
Other Costs, Averaged: 30.0% 1,500 (this is a guess, and not based on any analysis)Budget Amount per student: 6,500
Option 1 Option 2 Option 3 Option 4 Option 5 Option 6Inn + Acad. Inn Inn - 9 units Homes - 4 Townhouses Inn
Condos 15 Condos Homes - 3 15 RentalNumber of Units / type
# 1 BR 15 8 6 8# 2 BR 14 7 3 15 7# Single Family 0 3 4 0
Number of SAC / type1 BR 0.675 0.36 0.27 0 0 0.362 BR 2.128 1.064 0.456 0 2.28 1.064
Single Family 0 0 2.85 3.8 0 0Total per option 2.8 1.4 3.6 3.8 2.3 1.4
Education Costs 18,220 9,256 23,244 24,700 14,820 9,256
In 2003 and 2004 Concord Square participated in a major study carried out by the Center for Urban and Regional Policy at Northeastern University in conjuction with the analysis related to the proposed passage of Smart Growth Zoning, Chapter 40R, and the related Smart Growth School Cost Insurance Supplement, Chapter 40S. The former was passed by the legislature and signed by the Governor in 2004 as Chapter 40R to the Mass General Laws, and the latter was passed and signed in 2005 as Chapter 40S. In both cases, the legislature, the Secretary of Administration and Finance, and the Governor accepted the school cost assumptions and the analysis that was prepared.
The number of School Aged Children assumed for various housing types was as follows:
Concord Square Planning & Development, Inc.
Page 1810/31/2016 161030 v. 9 Nichewaug Pro Forma Analysiis 10-30-16.xls

Nichewaug Inn Analysis Nichewaug Option 1
Nichewaug InnPro Forma Analysis A Analysis B
Sale Prices at Bonz Study Bonz StudyPlus
Sources of Funds 10.0%Plus
Sale Proceeds, Nichewaug @ $ / s.f. 2,960,650 5,652,150 110.0%Sale Proceeds, Academy Building 2,592,975 3,960,180 68.0%Less Cost of Sales @ 6.0% (333,218) (576,740)Other 0 0
Total Sources 5,220,408 9,035,590
Uses of FundsAcquisition from the Town 1 1Public Water Supply 88,000 88,000Septic Fields 50,000 50,000Soft Costs @ this % of Construction: 20.0% 1,129,806 1,129,806Academy Construction Costs 20,536 $112.54 2,311,150 2,311,150Nichewaug Const. Costs 23,488 $142.11 3,337,880 3,337,880Construction Contingency @ 10.0% 564,903 564,903Misc. 50,000 50,000
7,531,740 7,531,740
Total Sources 5,220,408 9,035,590Total Uses (7,531,740) (7,531,740)
Developer Profit (2,311,333) 1,503,850Profit as % of Costs -30.7% 20.0%
Summary of Assumptions Academy Nichewaug Academy Nichewaug
Sale Price - 1 BRs $153,175 $162,903 $233,940 $310,997Sale Price - 2 BRs $217,250 $236,775 $331,800 $452,025Sale Price per saleable s.f. $192.50 $192.50 $294.00 $367.50
Gross s.f. 20,060 23,488 7 8 1 BR UnitsSame for Saleable s.f. 13,470 15,380 7 7 2 BR Units
Both Efficiency 67.1% 65.5% 14 15 TotalAnalyses Const. Cost Est. / gross s.f. $115.21 $142.11 Total Units 29
Const. Cost Est. / saleable s.f. $171.58 $217.03 Total BRs 43
Concord Square Planning & Development, Inc.
Page 1910/31/2016 161030 v. 9 Nichewaug Pro Forma Analysiis 10-30-16.xls

Nichewaug Inn Analysis Nichewaug Option 1
Development Summary
Requires off-site water supply
Academy Inn AcademySale Prices Inn Building
1 BR Size 846 796Bonz plus 10.0% 10.0% 2 BR Size 1,230 1,129
One BR Units $162,903 $153,175Two BR Units $236,775 $217,250 # 1 BR Units 8 7Price per s.f. $193 $193 # 2 BR Units 7 7
Total Units 15 14
Bonz plus 110.0% 68.0% Requires off-site water supplyOne BR Units 310,997 233,940Two BR Units 452,025 331,800Price per s.f. $368 $294
Sources of Funds Analysis A Analysis BBonz + Bonz +
Nichewaug Sales 10.0% 2,960,650 5,652,150 110.0%Academy Sales 10.0% 2,592,975 3,960,180 68.0%Cost of Sales @ 6.0% (333,218) (576,740)
Total Sources 5,220,408 9,035,590
Uses of FundsAcquisition $1.00 $1.00Water & Septic 138,000 138,000Soft Costs 1,129,806 1,129,806Academy Const. $113 2,311,150 2,311,150Nichewaug Const. $142 3,337,880 3,337,880Const. Conting. 10.0% 564,903 564,903Misc. 50,000 50,000
7,531,740 7,531,740
Total Sources 5,220,408 9,035,590Total Uses (7,531,740) (7,531,740)
Developer Profit (2,311,333) 1,503,850Profit as % of Costs -30.7% 20.0%
Concord Square Planning & Development, Inc.
Page 2010/31/2016 161030 v. 9 Nichewaug Pro Forma Analysiis 10-30-16.xls

Nichewaug Inn Analysis Nichewaug Option 1
Basic InformationLot Size in Acres 6.67 Demo Cost Per s.f. Total ConnectorLot Size in square feet: 290,545Existing Buildings - Gross s.f. 68,366 Gross s.f. 68,366 14,583Proposed Demolition (24,342) Total Demo Cost 476,900 139,700
Demo Cost per gross s.f. $6.98 $9.58Environmental Remediation - 2015 bid 494,729 Average Cost: $8.28Demo of Connector Building - 2015 bid 139,700Demo of other buildings - 2015 Bid 337,200Total Demo and Remediation - 2015 bids: 971,629
Option 1 GrossProposed after
Building Analysis # Stories Gross s.f. Demolition Demo Academy Nichewaug
Academy BuildingFootprint 10,268 2.0 20,536 20,536 20,536Connector 4,861 3.0 14,583 14,583 0
Nichewaug InnDining Wing 2,936 3.0 8,808 0 8,808 8,808Kitchen Wing 2,353 3.0 7,059 7,059 0 0
Music Room 2,306 1.0 2,306 2,306 2,306Main Building 5,198 2.9 15,074 2,700 12,374 12,374
68,366 24,342 44,024 20,536 23,488Percent 35.6% 64.4%
Other Information Footprint # Stories total s.f.South Addition 900 3.0 2,700 (Mother Superior Wing)
Connector Building 4,861 3.0 14,583Demo Cost Bid, 2015 $139,700Price per s.f. $28.74 $9.58
Total Demo s.f. 24,342Projected Cost, 2015 Bid @ $ / s.f. $9.58 $233,188Plus Inflation @ # yrs: 2.0 6.0% $13,991
Projected Demo cost to Town: $247,179
Less discount for private work / no prevailing wages: 20.0% ($49,436)Projected Demo Cost for Developer $197,743
Concord Square Planning & Development, Inc.
Page 2110/31/2016 161030 v. 9 Nichewaug Pro Forma Analysiis 10-30-16.xls

Nichewaug Inn Analysis Nichewaug Option 1
Condominum Development & Sale Analysis
Academy Building GSF NSF Eff 1 Bed 2 Bed Total
Floor 1 10,320 6,160 60% 2 4 6
Floor 2 9,740 7,310 75% 5 3 8
Total 20,060 13,470 67% 7 7 14Total Bedrooms 7 14 21
Nichewaug Inn GSF NSF Eff 1 Bed 2 Bed TotalFloor 1 9,228 4,550 49% 4 1 5 Dormer
Floor 2 6,997 5,700 81% 2 3 5 Loss Factor
Floor 3 6,297 5,130 81% 2 3 5 90.0%
Total 22,522 15,380 68% 8 7 15Total Bedrooms 8 14 22
Combined GSF NSF Eff 1 Bed 2 Bed TotalTotal 42,582 28,850 68% 15 14 29Total Bedrooms 15 28 43
Concord Square Planning & Development, Inc.
Page 2210/31/2016 161030 v. 9 Nichewaug Pro Forma Analysiis 10-30-16.xls

Nichewaug Inn Analysis Nichewaug Option 1
Construction Cost Estimate
Water Supply To ToOffsite Well Costs 80,000 Academy NichewaugContingency @ 10.0% 8,000 50.0% 50.0%
Total 88,000 44,000 44,000
Septic FieldEstimated Cost 80,000 40,000 40,000
Unit $ per UnitConstruction Costs s.f. $ / s.f. Amount
Academy BuildingWest Entrance 600 $50.00 30,000Elevator 80,000Housing Unit Construction 13,470 $125.00 1,683,750Common Area Construction 6,590 $60.00 395,400Site and Landscaping 50,000Parking Spaces 24 $3,000.00 72,000
Subtotal 2,311,150Nichewaug Inn
Elevator 125,000Housing Unit Construction 15,380 $150.00 2,307,000Music Room Construction 2,306 $125.00 288,250Common Area Construction 4,836 $100.00 483,630Site and Landscaping 50,000Parking Spaces 28 $3,000.00 84,000
Subtotal 3,337,880
Total Construction 5,649,030
Concord Square Planning & Development, Inc.
Page 2310/31/2016 161030 v. 9 Nichewaug Pro Forma Analysiis 10-30-16.xls

Nichewaug Inn Analysis Nichewaug Option 1
The following is for Analysis A Bonz
Bonz Price Adjusted Adjusted TotalAcademy Building Saleable Saleable Sale Price Per Price Price Price Sales
Unit 3 Bedrooms S.F. S.F. per s.f. Unit Adjustment 1 BRs 2 BRs1 BRs 2 BRs 10.0%
Floor 1 A101 1 820 $175.00 143,500 14,350 157,850 157,850
A102 1 840 $175.00 147,000 14,700 161,700 161,700
A103 2 1,200 $175.00 210,000 21,000 231,000 231,000
A104 2 1,100 $175.00 192,500 19,250 211,750 211,750
A 105 2 1,100 $175.00 192,500 19,250 211,750 211,750
A106 2 1,100 $175.00 192,500 19,250 211,750 211,750
Floor 2 A 201 1 820 $175.00 143,500 14,350 157,850 157,850
A 202 1 840 $175.00 147,000 14,700 161,700 161,700
A 203 2 1,200 $175.00 210,000 21,000 231,000 231,000
A 204 2 1,100 $175.00 192,500 19,250 211,750 211,750
A 205 2 1,100 $175.00 192,500 19,250 211,750 211,750
A 206 1 750 $175.00 131,250 13,125 144,375 144,375
A 207 1 750 $175.00 131,250 13,125 144,375 144,375
A 208 1 750 $175.00 131,250 13,125 144,375 144,375 Totals 14 21 5,570 7,900 2,357,250 235,725 1,072,225 1,520,750 2,592,975
Number of Units 7 7 153,175 217,250
Concord Square Planning & Development, Inc.
Page 2410/31/2016 161030 v. 9 Nichewaug Pro Forma Analysiis 10-30-16.xls

Nichewaug Inn Analysis Nichewaug Option 1
Bonz Adjusted Adjusted TotalSaleable Saleable Sale Price Price Price Price Price Sales
Unit Bedrooms S.F. S.F. per s.f. per unit Adjustment 1 BRs 2 BRs
Nichewaug Inn 1 BRs 2 BRs 10.0%Floor 1 N 101 1 800 $175.00 140,000 14,000 154,000 154,000
N 102 1 900 $175.00 157,500 15,750 173,250 173,250 N 103 1 750 $175.00 131,250 13,125 144,375 144,375 N 104 2 900 $175.00 157,500 15,750 173,250 173,250 N 105 2 1200 $175.00 210,000 21,000 231,000 231,000
Floor 2 N 201 2 1400 $175.00 245,000 24,500 269,500 269,500 N 202 1 900 $175.00 157,500 15,750 173,250 173,250 N 203 2 1300 $175.00 227,500 22,750 250,250 250,250 N 204 1 900 $175.00 157,500 15,750 173,250 173,250 N 205 2 1200 $175.00 210,000 21,000 231,000 231,000
Floor 3 N 301 2 1260 $175.00 220,500 22,050 242,550 242,550 N 302 1 810 $175.00 141,750 14,175 155,925 155,925 N 303 2 1170 $175.00 204,750 20,475 225,225 225,225 N 304 2 810 $175.00 141,750 14,175 155,925 155,925 N 305 2 1080 $175.00 189,000 18,900 207,900 207,900
Total 15 24 6770 8610 2,691,500 269,150 1,303,225 1,657,425 2,960,650
8 7
Total Saleable Avg PriceSummary of units and sale prices Avg. Price Avg. Price Total Sale s.f. per s.f.
# 1 BRs 1 BRs # 2 BRs 2 BRs Total Units Bedrooms Proceeds
Academy 7 153,175 7 217,250 14 21 2,592,975 13,470 $192.50Nichewaug Inn 8 162,903 7 236,775 15 24 2,960,650 15,380 $192.50Totals 15 158,363 14 227,013 29 45 5,553,625
Concord Square Planning & Development, Inc.
Page 2510/31/2016 161030 v. 9 Nichewaug Pro Forma Analysiis 10-30-16.xls

Nichewaug Inn Analysis Nichewaug Option 1
The following is for Analysis B
Bonz Price Adjusted Adjusted TotalAcademy Building Saleable Saleable Sale Price Per 1 BR Price Price Price Sales
Unit 3 Bedrooms S.F. S.F. per s.f. Unit Adjustment 1 BRs 2 BRs1 BRs 2 BRs 68.0%
Floor 1 A101 1 820 $175.00 143,500 97,580 241,080 241,080
A102 1 840 $175.00 147,000 99,960 246,960 246,960
A103 2 1,200 $175.00 210,000 142,800 352,800 352,800
A104 2 1,100 $175.00 192,500 130,900 323,400 323,400
A 105 2 1,100 $175.00 192,500 130,900 323,400 323,400
A106 2 1,100 $175.00 192,500 130,900 323,400 323,400
Floor 2 A 201 1 820 $175.00 143,500 97,580 241,080 241,080
A 202 1 840 $175.00 147,000 99,960 246,960 246,960
A 203 2 1,200 $175.00 210,000 142,800 352,800 352,800
A 204 2 1,100 $175.00 192,500 130,900 323,400 323,400
A 205 2 1,100 $175.00 192,500 130,900 323,400 323,400
A 206 1 750 $175.00 131,250 89,250 220,500 220,500
A 207 1 750 $175.00 131,250 89,250 220,500 220,500
A 208 1 750 $175.00 131,250 89,250 220,500 220,500 Totals 14 21 5,570 7,900 2,357,250 1,602,930 1,637,580 2,322,600 3,960,180
13,470 Number of Units 7 7 233,940 331,800
Concord Square Planning & Development, Inc.
Page 2610/31/2016 161030 v. 9 Nichewaug Pro Forma Analysiis 10-30-16.xls

Nichewaug Inn Analysis Nichewaug Option 1
Bonz Adjusted Adjusted TotalSaleable Saleable Sale Price Price Price Price Price Sales
Nichewaug Inn Unit Bedrooms S.F. S.F. per s.f. per unit Adjustment 1 BRs 2 BRs110.0%
Floor 1 N 101 1 800 $175.00 140,000 154,000 294,000 294,000
N 102 1 900 $175.00 157,500 173,250 330,750 330,750
N 103 1 750 $175.00 131,250 144,375 275,625 275,625
N 104 1 900 $175.00 157,500 173,250 330,750 330,750
N 105 2 1200 $175.00 210,000 231,000 441,000 441,000
Floor 2 N 201 2 1400 $175.00 245,000 269,500 514,500 514,500
N 202 1 900 $175.00 157,500 173,250 330,750 330,750
N 203 2 1300 $175.00 227,500 250,250 477,750 477,750
N 204 1 900 $175.00 157,500 173,250 330,750 330,750
N 205 2 1200 $175.00 210,000 231,000 441,000 441,000
Floor 3 N 301 2 1260 $175.00 220,500 242,550 463,050 463,050
N 302 1 810 $175.00 141,750 155,925 297,675 297,675
N 303 2 1170 $175.00 204,750 225,225 429,975 429,975
N 304 1 810 $175.00 141,750 155,925 297,675 297,675
N 305 2 1080 $175.00 189,000 207,900 396,900 396,900
Total 15 22 6,770 8,610 2,691,500 2,960,650 2,487,975 3,164,175 5,652,150
8 7
Total Saleable Avg Price Avg PriceSummary of units and sale prices Avg. Price Avg. Price Total Sale s.f. per s.f. per unit
# 1 BRs 1 BRs # 2 BRs 2 BRs Total Units Bedrooms Proceeds
Academy 7 233,940 7 331,800 14 21 3,960,180 13,470 $294.00 282,870Nichewaug Inn 8 310,997 7 452,025 15 22 5,652,150 15,380 $367.50 376,810Totals 15 544,937 14 783,825 29 43 9,612,330
Concord Square Planning & Development, Inc.
Page 2710/31/2016 161030 v. 9 Nichewaug Pro Forma Analysiis 10-30-16.xls

Nichewaug Inn Analysis Nichewaug Option 1
Academy, Analysis B, Summary
Saleable Sale Price Sale PriceUnit # Bedrooms S.F. per s.f.
Floor 1 A101 1 820 241,080 $294
A102 1 840 246,960 $294A103 2 1,200 352,800 $294A104 2 1,100 323,400 $294A 105 2 1,100 323,400 $294A106 2 1,100 323,400 $294
Floor 2 A 201 1 820 241,080 $294
A 202 1 840 246,960 $294A 203 2 1,200 352,800 $294A 204 2 1,100 323,400 $294A 205 2 1,100 323,400 $294A 206 1 750 220,500 $294
A 207 1 750 220,500 $294
A 208 1 750 220,500 $294Totals 14 21 13,470 3,960,180
Number of Units 14 14
Concord Square Planning & Development, Inc.
Page 2810/31/2016 161030 v. 9 Nichewaug Pro Forma Analysiis 10-30-16.xls

Nichewaug Inn Analysis Nichewaug Option 1
Nichewaug Analysis B, Summary
Saleable Sale Price Sale PriceUnit # Bedrooms S.F. per s.f.
N 101 1 800 294,000 $367.50N 102 1 900 330,750 $367.50N 103 1 750 275,625 $367.50N 104 1 900 330,750 $367.50N 105 2 1,200 441,000 $367.50N 201 2 1,400 514,500 $367.50N 202 1 900 330,750 $367.50N 203 2 1,300 477,750 $367.50N 204 1 900 330,750 $367.50N 205 2 1,200 441,000 $367.50N 301 2 1,260 463,050 $367.50N 302 1 810 297,675 $367.50N 303 2 1,170 429,975 $367.50N 304 1 810 297,675 $367.50N 305 2 1,080 396,900 $367.50
22 15,380 5,652,150
Concord Square Planning & Development, Inc.
Page 2910/31/2016 161030 v. 9 Nichewaug Pro Forma Analysiis 10-30-16.xls

Nichewaug Inn Analysis Nichewaug - 15 UnitsOption 2
Nichewaug InnPro Forma Analysis A Analysis B
Sale Prices at Bonz Study Bonz StudyPlus Plus
Sources of Funds 10.0% 110.0%
Sale Proceeds, Nichewaug @ $ / s.f. 2,960,650 5,652,150Less Cost of Sales @ 6.0% (177,639) (339,129)Other 0 0
Total Sources 2,783,011 5,313,021
Uses of FundsAcquisition from the Town 1 1Public Water Supply 44,000 44,000Septic Fields 40,000 40,000Soft Costs @ this % of Construction: 20.0% 667,576 667,576Nichewaug Const. Costs 23,488 $142.11 3,337,880 3,337,880Construction Contingency @ 10.0% 333,788 333,788Misc. 25,000 25,000
4,448,245 4,448,245
Total Sources 2,783,011 5,313,021Total Uses (4,448,245) (4,448,245)
Developer Profit (1,665,234) 864,776Profit as % of Costs -37.4% 19.4%
Summary of Assumptions Nichewaug Nichewaug
Sale Price - 1 BRs $162,903 $310,997Sale Price - 2 BRs $236,775 $452,025Sale Price per saleable s.f. $192.50 $367.50
Gross s.f. 23,488 8 1 BR UnitsSame for Saleable s.f. 15,380 7 2 BR Units
Both Efficiency 65.5% 15 TotalAnalyses Const. Cost Est. / gross s.f. $142.11 Total Units 15
Const. Cost Est. / saleable s.f. $217.03 Total BRs 22
Concord Square Planning & Development, Inc.
Page 3010/31/2016 161030 v. 9 Nichewaug Pro Forma Analysiis 10-30-16.xls
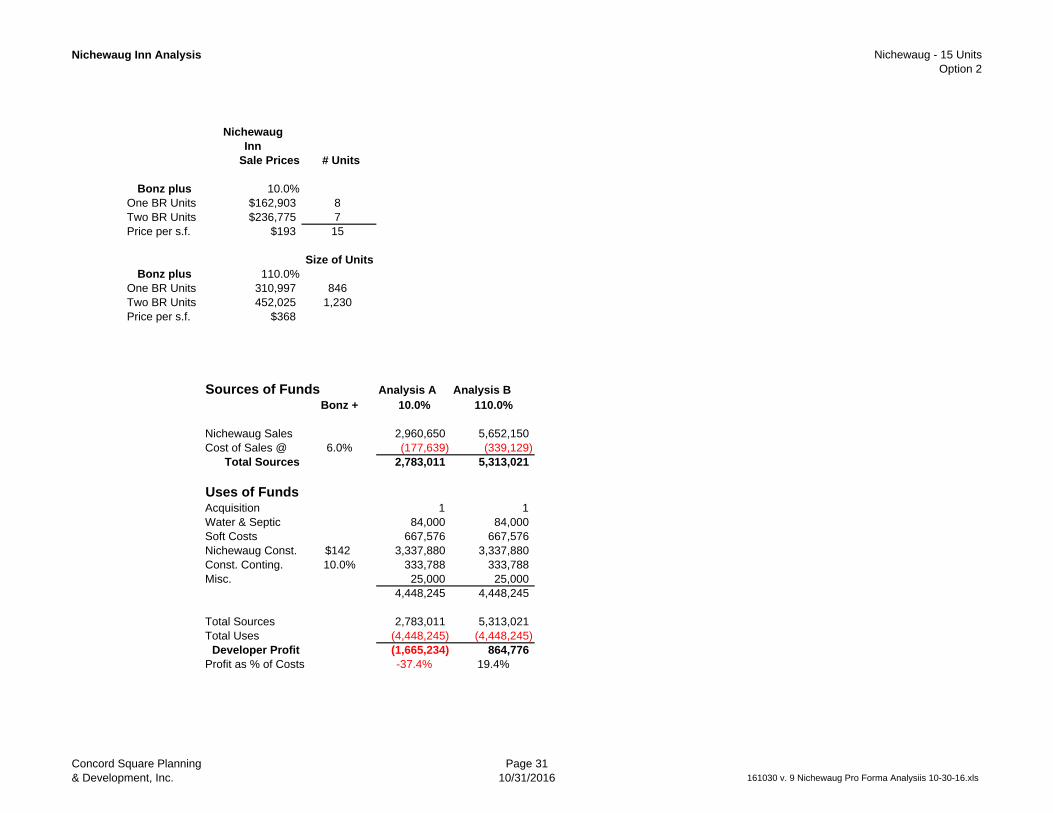
Nichewaug Inn Analysis Nichewaug - 15 UnitsOption 2
NichewaugInn
Sale Prices # Units
Bonz plus 10.0%One BR Units $162,903 8Two BR Units $236,775 7Price per s.f. $193 15
Size of UnitsBonz plus 110.0%
One BR Units 310,997 846Two BR Units 452,025 1,230Price per s.f. $368
Sources of Funds Analysis A Analysis BBonz + 10.0% 110.0%
Nichewaug Sales 2,960,650 5,652,150Cost of Sales @ 6.0% (177,639) (339,129)
Total Sources 2,783,011 5,313,021
Uses of FundsAcquisition 1 1Water & Septic 84,000 84,000Soft Costs 667,576 667,576Nichewaug Const. $142 3,337,880 3,337,880Const. Conting. 10.0% 333,788 333,788Misc. 25,000 25,000
4,448,245 4,448,245
Total Sources 2,783,011 5,313,021Total Uses (4,448,245) (4,448,245)
Developer Profit (1,665,234) 864,776Profit as % of Costs -37.4% 19.4%
Concord Square Planning & Development, Inc.
Page 3110/31/2016 161030 v. 9 Nichewaug Pro Forma Analysiis 10-30-16.xls

Nichewaug Inn Analysis Nichewaug - 15 UnitsOption 2
Basic InformationLot Size in Acres 6.67Lot Size in square feet: 290,545Existing Buildings - Gross s.f. 68,366Proposed Demolition (44,878)
Environmental Remediation - 2015 bid 494,729Demo of Connector Building - 2015 bid 139,700Demo of other buildings - 2015 Bid 337,200Total Demo and Remediation - 2015 bids: 971,629
Demo Cost Per s.f. Total Connector
Gross s.f. 68,366 14,583Total Demo Cost 476,900 139,700Demo Cost per gross s.f. $6.98 $9.58Average Cost: $8.28
Option 1 GrossProposed after
Building Analysis # Stories Gross s.f. Demolition Demo Academy Nichewaug
Academy BuildingFootprint 10,268 2.0 20,536 20,536 0 0Connector 4,861 3.0 14,583 14,583 0
Nichewaug InnDining Wing 2,936 3.0 8,808 0 8,808 8,808Kitchen Wing 2,353 3.0 7,059 7,059 0 0
Music Room 2,306 1.0 2,306 2,306 2,306Main Building 5,198 2.9 15,074 2,700 12,374 12,374
68,366 44,878 23,488 0 23,488Percent 65.6% 34.4%
South Addition Footprint # Stories s.f.900 3.0 2,700 (Mother Superior Wing)
Demolition Costs
Price per s.f. $8.28Total Demo s.f. 44,878 Discount for Private Developer 20.0% ($78,755)Projected Cost, 2015 Bid @ $ / s.f. $8.28 $371,485 Projected Demo Cost for Developer $315,019Plus Inflation @ # yrs: 2 6.0% $22,289
Projected Demo Cost for Town $393,774
Concord Square Planning & Development, Inc.
Page 3210/31/2016 161030 v. 9 Nichewaug Pro Forma Analysiis 10-30-16.xls

Nichewaug Inn Analysis Nichewaug - 15 UnitsOption 2
Condominum Development & Sale Analysis
Nichewaug Inn GSF NSF Eff 1 Bed 2 Bed TotalFloor 1 9,228 4,550 49% 4 1 5 Dormer
Floor 2 6,997 5,700 81% 2 3 5 Loss Factor
Floor 3 6,297 5,130 81% 2 3 5 90.0%
Total 22,522 15,380 68% 8 7 15Total Bedrooms 8 14 22
Construction Cost Estimate
Water SupplyNichewaug
Offsite Well Costs 80,000 ShareContingency @ 10.0% 8,000 50.0%
Total 88,000 44,000
Septic FieldEstimated Cost 80,000 40,000
Construction Costs Unit $ per Units.f. $ / s.f. Amount
Nichewaug InnElevator 125,000Housing Unit Construction 15,380 $150.00 2,307,000Music Room Construction 2,306 $125.00 288,250Common Area Construction 4,836 $100.00 483,630Site and Landscaping 50,000Parking Spaces @ 2 28 $3,000.00 84,000
Subtotal 3,337,880
Total Construction 3,337,880
Concord Square Planning & Development, Inc.
Page 3310/31/2016 161030 v. 9 Nichewaug Pro Forma Analysiis 10-30-16.xls

Nichewaug Inn Analysis Nichewaug - 15 UnitsOption 2
The following is for Analysis A
Bonz Adjusted Adjusted Total
Nichewaug Inn Saleable Saleable Sale Price Price Price Price Price SalesUnit # Bedrooms S.F. S.F. per s.f. per unit Adjustment 1 BRs 2 BRs
10.0%Floor 1 N 101 1 800 $175.00 140,000 14,000 154,000 154,000
N 102 1 900 $175.00 157,500 15,750 173,250 173,250 N 103 1 750 $175.00 131,250 13,125 144,375 144,375 N 104 2 900 $175.00 157,500 15,750 173,250 173,250 N 105 2 1,200 $175.00 210,000 21,000 231,000 231,000
Floor 2 N 201 2 1,400 $175.00 245,000 24,500 269,500 269,500
N 202 1 900 $175.00 157,500 15,750 173,250 173,250
N 203 2 1,300 $175.00 227,500 22,750 250,250 250,250
N 204 1 900 $175.00 157,500 15,750 173,250 173,250
N 205 2 1,200 $175.00 210,000 21,000 231,000 231,000
Floor 3 N 301 2 1,260 $175.00 220,500 22,050 242,550 242,550
Dormer factor N 302 1 810 $175.00 141,750 14,175 155,925 155,925
90.0% N 303 2 1,170 $175.00 204,750 20,475 225,225 225,225
N 304 2 810 $175.00 141,750 14,175 155,925 155,925
N 305 2 1,080 $175.00 189,000 18,900 207,900 207,900
Total 15 24 6,770 8,610 2,691,500 269,150 1,303,225 1,657,425 2,960,650
8 7
Total Saleable Avg PriceSummary of units and sale prices Avg. Price Avg. Price Total Sale s.f. per s.f.
# 1 BRs 1 BRs # 2 BRs 2 BRs Total Units Bedrooms Proceeds
Nichewaug Inn 8 162,903 7 236,775 15 24 2,960,650 15,380 $192.50Totals 8 162,903 7 236,775 15 24 2,960,650
Concord Square Planning & Development, Inc.
Page 3410/31/2016 161030 v. 9 Nichewaug Pro Forma Analysiis 10-30-16.xls

Nichewaug Inn Analysis Nichewaug - 15 UnitsOption 2
The following is for Analysis B
Bonz Adjusted Adjusted Total
Nichewaug Inn Saleable Saleable Sale Price Price Price Price Price SalesUnit Bedrooms S.F. S.F. per s.f. per unit Adjustment 1 BRs 2 BRs
110.0%Floor 1 N 101 1 800 $175.00 140,000 154,000 294,000 294,000
N 102 1 900 $175.00 157,500 173,250 330,750 330,750 N 103 1 750 $175.00 131,250 144,375 275,625 275,625 N 104 1 900 $175.00 157,500 173,250 330,750 330,750 N 105 2 1,200 $175.00 210,000 231,000 441,000 441,000
Floor 2 N 201 2 1,400 $175.00 245,000 269,500 514,500 514,500
N 202 1 900 $175.00 157,500 173,250 330,750 330,750
N 203 2 1,300 $175.00 227,500 250,250 477,750 477,750
N 204 1 900 $175.00 157,500 173,250 330,750 330,750
N 205 2 1,200 $175.00 210,000 231,000 441,000 441,000
Floor 3 N 301 2 1,260 $175.00 220,500 242,550 463,050 463,050
N 302 1 810 $175.00 141,750 155,925 297,675 297,675
Dormer factor N 303 2 1,170 $175.00 204,750 225,225 429,975 429,975
90.0% N 304 1 810 $175.00 141,750 155,925 297,675 297,675
N 305 2 1,080 $175.00 189,000 207,900 396,900 396,900
Total 15 22 6,770 8,610 2,691,500 2,960,650 2,487,975 3,164,175 5,652,150
8 7Avg. Size 846 1,230
Total Saleable Avg Price Avg. PriceSummary of units and sale prices Avg. Price Avg. Price Total Sale s.f. per s.f. per unit
# 1 BRs 1 BRs # 2 BRs 2 BRs Total Units Bedrooms Proceeds
Nichewaug Inn 8 310,997 7 452,025 15 22 5,652,150 15,380 $367.50 376,810Totals 8 310,997 7 452,025 15 22 5,652,150 15,380 $367.50 376,810
Avg. Size per unit 1,025
Concord Square Planning & Development, Inc.
Page 3510/31/2016 161030 v. 9 Nichewaug Pro Forma Analysiis 10-30-16.xls
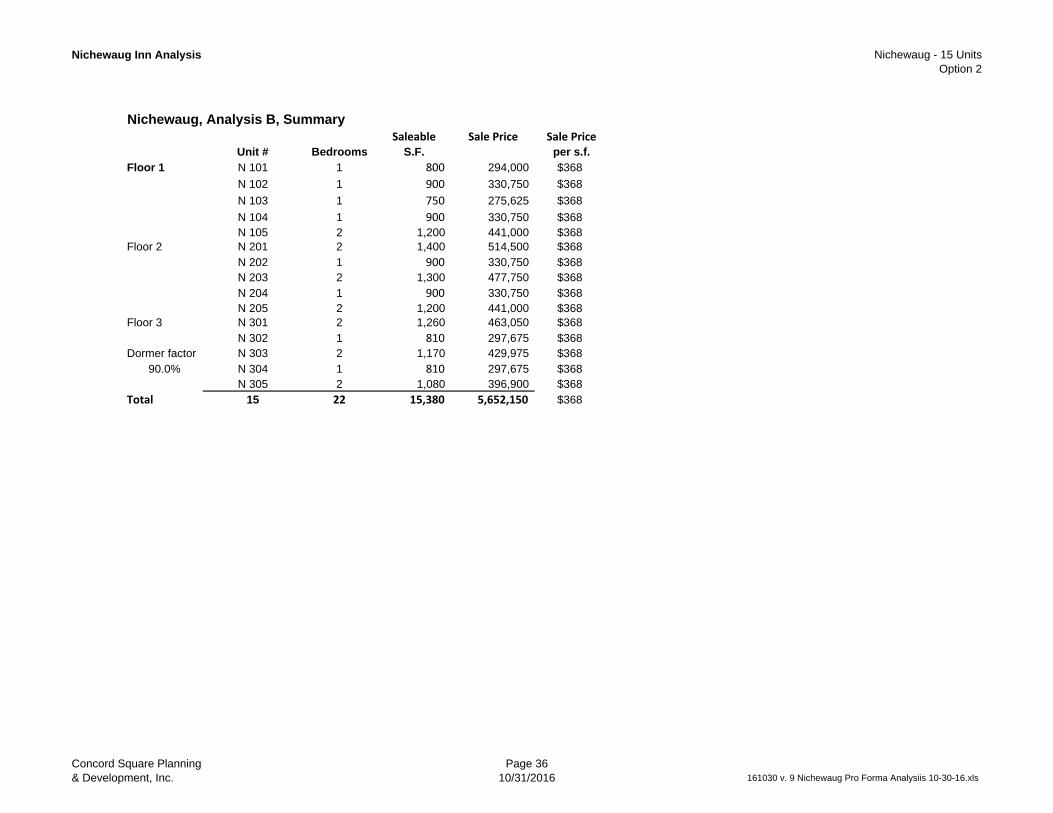
Nichewaug Inn Analysis Nichewaug - 15 UnitsOption 2
Nichewaug, Analysis B, SummarySaleable Sale Price Sale Price
Unit # Bedrooms S.F. per s.f.Floor 1 N 101 1 800 294,000 $368
N 102 1 900 330,750 $368
N 103 1 750 275,625 $368
N 104 1 900 330,750 $368N 105 2 1,200 441,000 $368
Floor 2 N 201 2 1,400 514,500 $368N 202 1 900 330,750 $368N 203 2 1,300 477,750 $368N 204 1 900 330,750 $368N 205 2 1,200 441,000 $368
Floor 3 N 301 2 1,260 463,050 $368N 302 1 810 297,675 $368
Dormer factor N 303 2 1,170 429,975 $36890.0% N 304 1 810 297,675 $368
N 305 2 1,080 396,900 $368Total 15 22 15,380 5,652,150 $368
Concord Square Planning & Development, Inc.
Page 3610/31/2016 161030 v. 9 Nichewaug Pro Forma Analysiis 10-30-16.xls
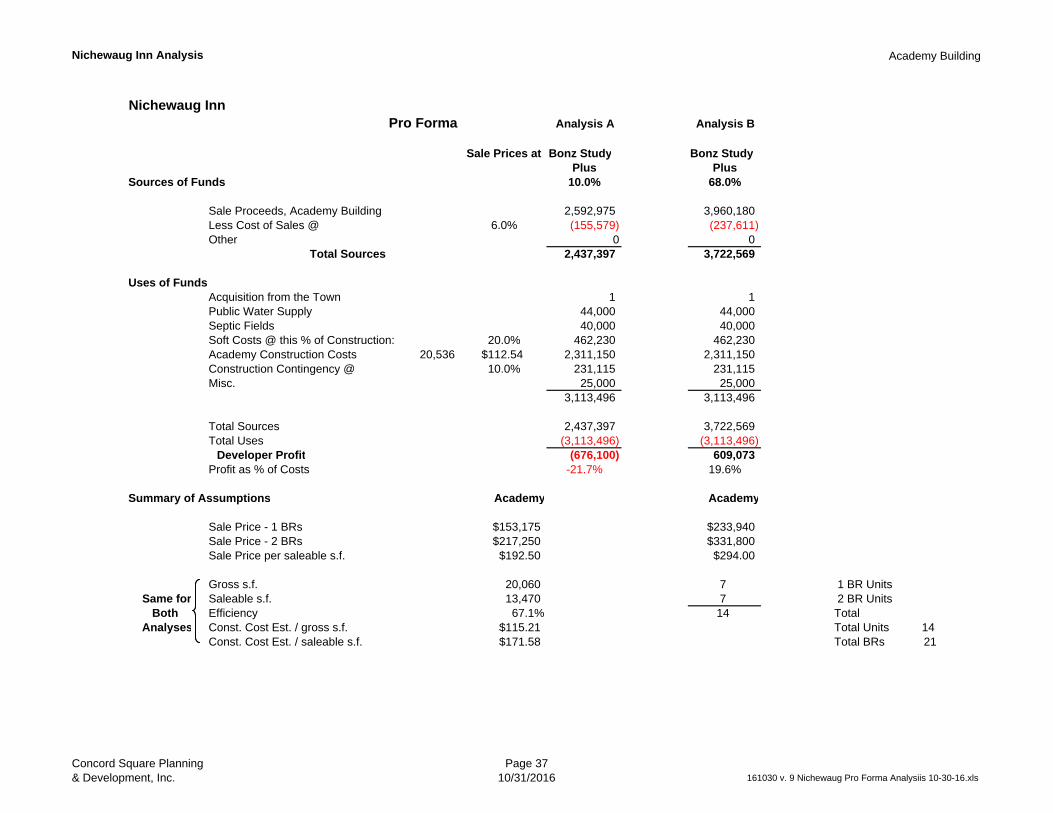
Nichewaug Inn Analysis Academy Building
Nichewaug InnPro Forma Analysis A Analysis B
Sale Prices at Bonz Study Bonz StudyPlus Plus
Sources of Funds 10.0% 68.0%
Sale Proceeds, Academy Building 2,592,975 3,960,180Less Cost of Sales @ 6.0% (155,579) (237,611)Other 0 0
Total Sources 2,437,397 3,722,569
Uses of FundsAcquisition from the Town 1 1Public Water Supply 44,000 44,000Septic Fields 40,000 40,000Soft Costs @ this % of Construction: 20.0% 462,230 462,230Academy Construction Costs 20,536 $112.54 2,311,150 2,311,150Construction Contingency @ 10.0% 231,115 231,115Misc. 25,000 25,000
3,113,496 3,113,496
Total Sources 2,437,397 3,722,569Total Uses (3,113,496) (3,113,496)
Developer Profit (676,100) 609,073Profit as % of Costs -21.7% 19.6%
Summary of Assumptions Academy Academy
Sale Price - 1 BRs $153,175 $233,940Sale Price - 2 BRs $217,250 $331,800Sale Price per saleable s.f. $192.50 $294.00
Gross s.f. 20,060 7 1 BR UnitsSame for Saleable s.f. 13,470 7 2 BR Units
Both Efficiency 67.1% 14 TotalAnalyses Const. Cost Est. / gross s.f. $115.21 Total Units 14
Const. Cost Est. / saleable s.f. $171.58 Total BRs 21
Concord Square Planning & Development, Inc.
Page 3710/31/2016 161030 v. 9 Nichewaug Pro Forma Analysiis 10-30-16.xls
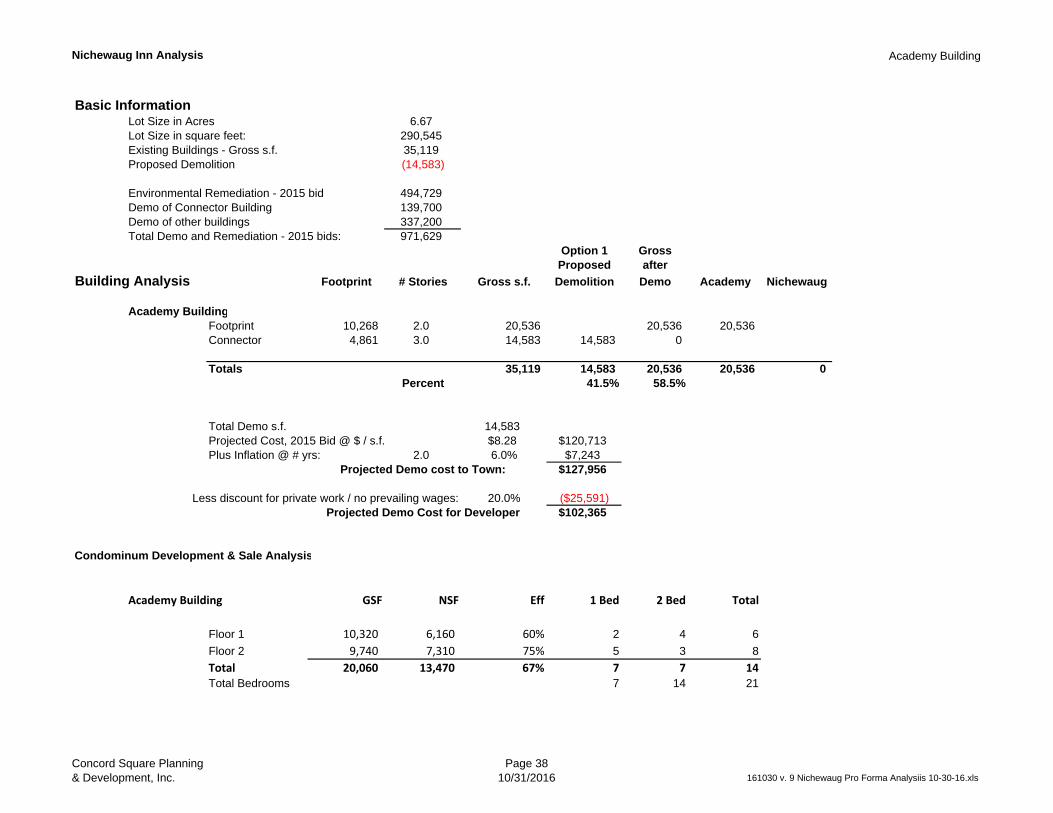
Nichewaug Inn Analysis Academy Building
Basic InformationLot Size in Acres 6.67Lot Size in square feet: 290,545Existing Buildings - Gross s.f. 35,119Proposed Demolition (14,583)
Environmental Remediation - 2015 bid 494,729Demo of Connector Building 139,700Demo of other buildings 337,200Total Demo and Remediation - 2015 bids: 971,629
Option 1 GrossProposed after
Building Analysis Footprint # Stories Gross s.f. Demolition Demo Academy Nichewaug
Academy BuildingFootprint 10,268 2.0 20,536 20,536 20,536Connector 4,861 3.0 14,583 14,583 0
Totals 35,119 14,583 20,536 20,536 0Percent 41.5% 58.5%
Total Demo s.f. 14,583Projected Cost, 2015 Bid @ $ / s.f. $8.28 $120,713Plus Inflation @ # yrs: 2.0 6.0% $7,243
Projected Demo cost to Town: $127,956
Less discount for private work / no prevailing wages: 20.0% ($25,591)Projected Demo Cost for Developer $102,365
Condominum Development & Sale Analysis
Academy Building GSF NSF Eff 1 Bed 2 Bed Total
Floor 1 10,320 6,160 60% 2 4 6
Floor 2 9,740 7,310 75% 5 3 8
Total 20,060 13,470 67% 7 7 14Total Bedrooms 7 14 21
Concord Square Planning & Development, Inc.
Page 3810/31/2016 161030 v. 9 Nichewaug Pro Forma Analysiis 10-30-16.xls

Nichewaug Inn Analysis Academy Building
Construction Cost Estimate
Water SupplyShare to
Offsite Well Costs 80,000 AcademyContingency @ 10.0% 8,000 50.0%
88,000 44,000Septic Field
Estimated Cost 80,000 40,000
Unit $ per UnitConstruction Costs s.f. $ / s.f. Amount
Academy BuildingWest Entrance 15' x 20' x 2 600 $50.00 30,000Elevator- two stops 80,000Housing Unit Construction 13,470 $125.00 1,683,750Common Area Construction 6,590 $60.00 395,400Site and Landscaping 50,000Parking Spaces 24 $3,000.00 72,000
Subtotal 2,311,150
Concord Square Planning & Development, Inc.
Page 3910/31/2016 161030 v. 9 Nichewaug Pro Forma Analysiis 10-30-16.xls
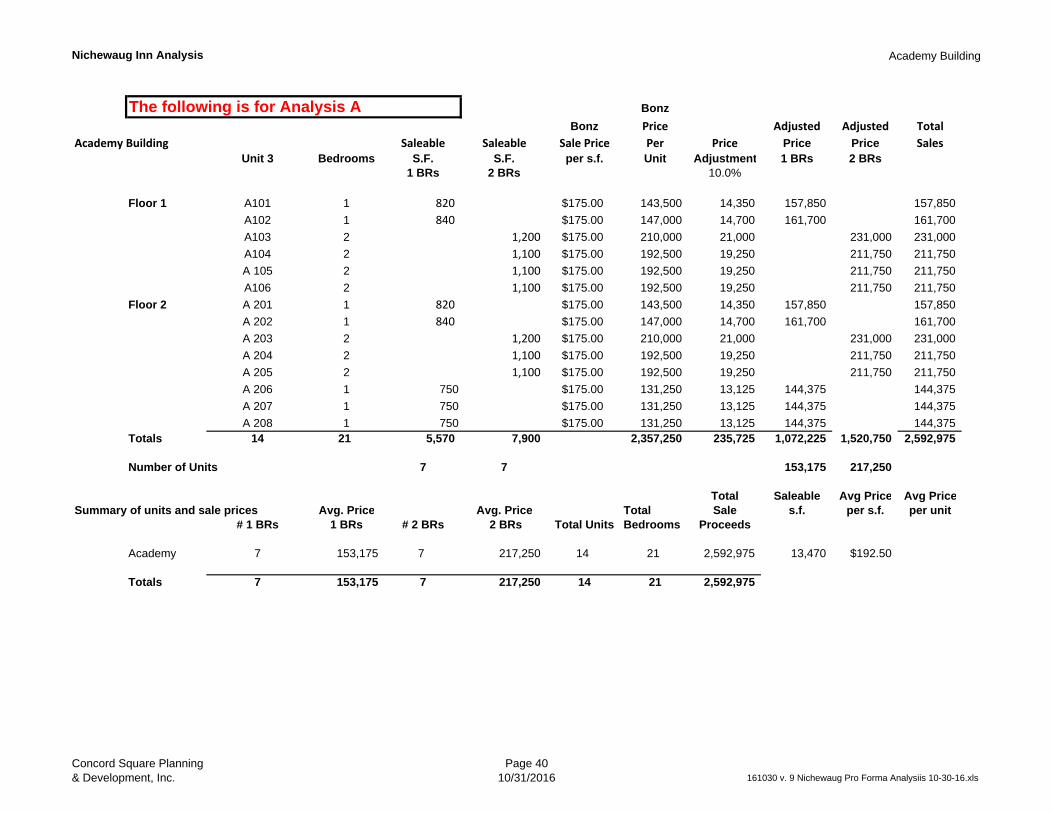
Nichewaug Inn Analysis Academy Building
The following is for Analysis A Bonz
Bonz Price Adjusted Adjusted TotalAcademy Building Saleable Saleable Sale Price Per Price Price Price Sales
Unit 3 Bedrooms S.F. S.F. per s.f. Unit Adjustment 1 BRs 2 BRs1 BRs 2 BRs 10.0%
Floor 1 A101 1 820 $175.00 143,500 14,350 157,850 157,850
A102 1 840 $175.00 147,000 14,700 161,700 161,700
A103 2 1,200 $175.00 210,000 21,000 231,000 231,000
A104 2 1,100 $175.00 192,500 19,250 211,750 211,750
A 105 2 1,100 $175.00 192,500 19,250 211,750 211,750
A106 2 1,100 $175.00 192,500 19,250 211,750 211,750
Floor 2 A 201 1 820 $175.00 143,500 14,350 157,850 157,850
A 202 1 840 $175.00 147,000 14,700 161,700 161,700
A 203 2 1,200 $175.00 210,000 21,000 231,000 231,000
A 204 2 1,100 $175.00 192,500 19,250 211,750 211,750
A 205 2 1,100 $175.00 192,500 19,250 211,750 211,750
A 206 1 750 $175.00 131,250 13,125 144,375 144,375
A 207 1 750 $175.00 131,250 13,125 144,375 144,375
A 208 1 750 $175.00 131,250 13,125 144,375 144,375 Totals 14 21 5,570 7,900 2,357,250 235,725 1,072,225 1,520,750 2,592,975
Number of Units 7 7 153,175 217,250
Total Saleable Avg Price Avg PriceSummary of units and sale prices Avg. Price Avg. Price Total Sale s.f. per s.f. per unit
# 1 BRs 1 BRs # 2 BRs 2 BRs Total Units Bedrooms Proceeds
Academy 7 153,175 7 217,250 14 21 2,592,975 13,470 $192.50
Totals 7 153,175 7 217,250 14 21 2,592,975
Concord Square Planning & Development, Inc.
Page 4010/31/2016 161030 v. 9 Nichewaug Pro Forma Analysiis 10-30-16.xls

Nichewaug Inn Analysis Academy Building
The following is for Analysis B
Bonz Price Adjusted Adjusted TotalAcademy Building Saleable Saleable Sale Price Per 1 BR Price Price Price Sales
Unit # Bedrooms S.F. S.F. per s.f. Unit Adjustment 1 BRs 2 BRs1 BRs 2 BRs 68.0%
Floor 1 A101 1 820 $175.00 143,500 97,580 241,080 241,080
A102 1 840 $175.00 147,000 99,960 246,960 246,960
A103 2 1,200 $175.00 210,000 142,800 352,800 352,800
A104 2 1,100 $175.00 192,500 130,900 323,400 323,400
A 105 2 1,100 $175.00 192,500 130,900 323,400 323,400
A106 2 1,100 $175.00 192,500 130,900 323,400 323,400
Floor 2 A 201 1 820 $175.00 143,500 97,580 241,080 241,080
A 202 1 840 $175.00 147,000 99,960 246,960 246,960
A 203 2 1,200 $175.00 210,000 142,800 352,800 352,800
A 204 2 1,100 $175.00 192,500 130,900 323,400 323,400
A 205 2 1,100 $175.00 192,500 130,900 323,400 323,400
A 206 1 750 $175.00 131,250 89,250 220,500 220,500
A 207 1 750 $175.00 131,250 89,250 220,500 220,500
A 208 1 750 $175.00 131,250 89,250 220,500 220,500 Totals 14 21 5,570 7,900 2,357,250 1,602,930 1,637,580 2,322,600 3,960,180
13,470 Number of Units 7 7 233,940 331,800
Total Saleable Avg PriceSummary of units and sale prices Avg. Price Avg. Price Total Sale s.f. per s.f.
# 1 BRs 1 BRs # 2 BRs 2 BRs Total Units Bedrooms Proceeds
Academy 7 233,940 7 331,800 14 21 3,960,180 13,470 $294.00
Totals 7 233,940 7 331,800 14 21 3,960,180
Concord Square Planning & Development, Inc.
Page 4110/31/2016 161030 v. 9 Nichewaug Pro Forma Analysiis 10-30-16.xls

Nichewaug Inn Analysis Academy Building
Academy, Analysis B, Summary
Saleable Sale Price Sale PriceUnit # Bedrooms S.F. per s.f.
Floor 1 A101 1 820 241,080 $294
A102 1 840 246,960 $294A103 2 1,200 352,800 $294A104 2 1,100 323,400 $294A 105 2 1,100 323,400 $294A106 2 1,100 323,400 $294
Floor 2 A 201 1 820 241,080 $294
A 202 1 840 246,960 $294A 203 2 1,200 352,800 $294A 204 2 1,100 323,400 $294A 205 2 1,100 323,400 $294A 206 1 750 220,500 $294
A 207 1 750 220,500 $294
A 208 1 750 220,500 $294Totals 14 21 13,470 3,960,180
Number of Units 14 14
Concord Square Planning & Development, Inc.
Page 4210/31/2016 161030 v. 9 Nichewaug Pro Forma Analysiis 10-30-16.xls

Nichewaug Inn Analysis Nichewaug - 9 UnitsOption 3
Nichewaug InnPro Forma Analysis A Analysis B
Sale Prices at Bonz Study Bonz StudyPlus Plus
Sources of Funds 10.0% 120.0%
Sale Proceeds, Nichewaug @ $ / s.f. 1,788,325 3,576,650Less Cost of Sales @ 6.0% (107,300) (214,599)
Total Sources 1,681,026 3,362,051
Uses of FundsAcquisition from the Town 1 1Private Water Supply 16,500 16,500Septic Fields 25,000 25,000Soft Costs @ this % of Construction: 20.0% 424,055 424,055Nichewaug Const. Costs 14,680 $144.43 2,120,273 2,120,273Construction Contingency @ 10.0% 212,027 212,027Misc. 25,000 25,000
2,822,855 2,822,855
Total Sources 1,681,026 3,362,051Total Uses (2,822,855) (2,822,855)
Developer Profit (1,141,830) 539,196Profit as % of Costs -40.4% 19.1%
Summary of Assumptions Nichewaug Nichewaug
Sale Price - 1 BRs $171,004 $342,008Sale Price - 2 BRs $254,100 $508,200Sale Price per saleable s.f. $192.50 $385.00
Gross s.f. 14,680 6 1 BR UnitsSame for Saleable s.f. 9,290 3 2 BR Units
Both Efficiency 63.3% 9 TotalAnalyses Const. Cost Est. / gross s.f. $144.43 Total Units 9
Const. Cost Est. / saleable s.f. $228.23 Total BRs 12
Concord Square Planning & Development, Inc.
Page 4310/31/2016 161030 v. 9 Nichewaug Pro Forma Analysiis 10-30-16.xls

Nichewaug Inn Analysis Nichewaug - 9 UnitsOption 3
NichewaugInn
Sale Prices # Units # BRs
Bonz plus 10.0%One BR Units $171,004 6 6Two BR Units $254,100 3 6Price per s.f. $193 9 12
Size of UnitsBonz plus 120.0%
One BR Units 342,008 888Two BR Units 508,200 1,320Price per s.f. $385
Private water supply - 12 Bedrooms
Sources of Funds Analysis A Analysis BBonz + 10.0% 120.0%
Nichewaug Sales 1,788,325 3,576,650Cost of Sales @ 6.0% (107,300) (214,599)
Total Sources 1,681,026 3,362,051
Uses of FundsAcquisition 1 1Water & Septic 41,500 41,500Soft Costs 424,055 424,055Nichewaug Const. $144 2,120,273 2,120,273Const. Conting. 10.0% 212,027 212,027Misc. 25,000 25,000
2,822,855 2,822,855
Total Sources 1,681,026 3,362,051Total Uses (2,822,855) (2,822,855)
Developer Profit (1,141,830) 539,196Profit as % of Costs -40.4% 19.1%
Concord Square Planning & Development, Inc.
Page 4410/31/2016 161030 v. 9 Nichewaug Pro Forma Analysiis 10-30-16.xls

Nichewaug Inn Analysis Nichewaug - 9 UnitsOption 3
Basic InformationLot Size in Acres 6.67Lot Size in square feet: 290,545Existing Buildings - Gross s.f. 68,366Proposed Demolition (53,686)
Environmental Remediation - 2015 bid 494,729Demo of Connector Building - 2015 bid 139,700Demo of other buildings - 2015 Bid 337,200Total Demo and Remediation - 2015 bids: 971,629
Demo Cost Per s.f. Total Connector
Gross s.f. 68,366 14,583Total Demo Cost 476,900 139,700Demo Cost per gross s.f. $6.98 $9.58Average Cost: $8.28
GrossProposed after
Building Analysis # Stories Gross s.f. Demolition Demo Academy Nichewaug
Academy BuildingFootprint 10,268 2.0 20,536 20,536 0 0Connector 4,861 3.0 14,583 14,583 0
Nichewaug InnDining Wing 2,936 3.0 8,808 8,808 0 0Kitchen Wing 2,353 3.0 7,059 7,059 0 0
Music Room 2,306 1.0 2,306 2,306 2,306Main Building 5,198 2.9 15,074 2,700 12,374 12,374
68,366 53,686 14,680 0 14,680Percent 78.5% 21.5%
South Addition Footprint # Stories s.f.900 3.0 2,700 (Mother Superior Wing)
Price per s.f. $8.28 Town Demo Cost $471,058Total Demo s.f. 53,686 Private Discount % 20.0%Projected Cost, 2015 Bid @ $ / s.f. $8.28 $444,394 Potential savings (94,212)Plus Inflation @ # yrs: 2.0 6.0% $26,664 Developer Cost 376,846
Projected Demo Cost for Town $471,058
Concord Square Planning & Development, Inc.
Page 4510/31/2016 161030 v. 9 Nichewaug Pro Forma Analysiis 10-30-16.xls

Nichewaug Inn Analysis Nichewaug - 9 UnitsOption 3
Condominum Development & Sale Analysis
Nichewaug Inn GSF NSF Eff 1 Bed 2 Bed TotalFloor 1 6,431 2,450 38% 2 1 3 Dormer
Floor 2 4,125 3,600 87% 2 1 3 Loss Factor
Floor 3 3,712 3,240 87% 2 1 3 90.0%
Total 14,268 9,290 65% 6 3 9Total Bedrooms 6 6 12
Construction Cost Estimate
Water Supply
Well Renovation / Upgrades 15,000Contingency @ 10.0% 1,500
16,500Septic Field
Estimated Cost 25,000
Construction Costs Unit $ per Units.f. $ / s.f. Amount
Nichewaug InnElevator 125,000Housing Unit Construction 9,290 $150.00 1,393,500Music Room Construction 2,306 $100.00 230,600Common Area Construction 2,672 $100.00 267,173Site and Landscaping 50,000Parking Spaces @ 2 18 $3,000.00 54,000
Subtotal 2,120,273
Total Construction 2,120,273
Concord Square Planning & Development, Inc.
Page 4610/31/2016 161030 v. 9 Nichewaug Pro Forma Analysiis 10-30-16.xls

Nichewaug Inn Analysis Nichewaug - 9 UnitsOption 3
The following is for Analysis A
Bonz Adjusted Adjusted Total
Nichewaug Inn Saleable Saleable Sale Price Price Price Price Price SalesUnit # Bedrooms S.F. S.F. per s.f. per unit Adjustment 1 BRs 2 BRs
10.0%Floor 1 N 101 1 800 $175.00 140,000 14,000 154,000 154,000
N 102 1 900 $175.00 157,500 15,750 173,250 173,250 N 103 1 750 $175.00 131,250 13,125 144,375 144,375 N 104 $175.00 - - - - N 105 $175.00 - -
Floor 2 N 201 2 1,400 $175.00 245,000 24,500 269,500 269,500
N 202 1 900 $175.00 157,500 15,750 173,250 173,250
N 203 2 1,300 $175.00 227,500 22,750 250,250 250,250
N 204 $175.00 - - - -
N 205 $175.00 - - - -
Floor 3 N 301 2 1,260 $175.00 220,500 22,050 242,550 242,550
Dormer factor N 302 1 810 $175.00 141,750 14,175 155,925 155,925
90.0% N 303 1 1,170 $175.00 204,750 20,475 225,225 225,225
N 304 $175.00 - - - -
N 305 $175.00 - - - -
Total 9 12 5,330 3,960 1,625,750 162,575 1,026,025 762,300 1,788,325
6 3
Total Saleable Avg PriceSummary of units and sale prices Avg. Price Avg. Price Total Sale s.f. per s.f.
# 1 BRs 1 BRs # 2 BRs 2 BRs Total Units Bedrooms Proceeds
Nichewaug Inn 6 171,004 3 254,100 9 12 1,788,325 9,290 $192.50Totals 6 171,004 3 254,100 9 12 1,788,325
Concord Square Planning & Development, Inc.
Page 4710/31/2016 161030 v. 9 Nichewaug Pro Forma Analysiis 10-30-16.xls

Nichewaug Inn Analysis Nichewaug - 9 UnitsOption 3
The following is for Analysis B
Bonz Adjusted Adjusted Total
Nichewaug Inn Saleable Saleable Sale Price Price Price Price Price SalesUnit Bedrooms S.F. S.F. per s.f. per unit Adjustment 1 BRs 2 BRs
120.0%Floor 1 N 101 1 800 $175.00 140,000 168,000 308,000 308,000
N 102 1 900 $175.00 157,500 189,000 346,500 346,500 N 103 1 750 $175.00 131,250 157,500 288,750 288,750 N 104 $175.00 - - - - N 105 $175.00 - - - -
Floor 2 N 201 2 1,400 $175.00 245,000 294,000 539,000 539,000
N 202 1 900 $175.00 157,500 189,000 346,500 346,500
N 203 2 1,300 $175.00 227,500 273,000 500,500 500,500
N 204 $175.00 - - - -
N 205 $175.00 - - - -
Floor 3 N 301 2 1,260 $175.00 220,500 264,600 485,100 485,100
N 302 1 810 $175.00 141,750 170,100 311,850 311,850
Dormer factor N 303 1 1,170 $175.00 204,750 245,700 450,450 450,450
90.0% N 304 $175.00 - - - -
N 305 $175.00 - - - -
Total 9 12 5,330 3,960 1,625,750 1,950,900 2,052,050 1,524,600 3,576,650
6 3Avg. Size 888 1,320
Total Saleable Avg Price Avg. PriceSummary of units and sale prices Avg. Price Avg. Price Total Sale s.f. per s.f. per unit
# 1 BRs 1 BRs # 2 BRs 2 BRs Total Units Bedrooms Proceeds
Nichewaug Inn 6 342,008 3 508,200 9 12 3,576,650 9,290 $385.00 397,406Totals 6 342,008 3 508,200 9 12 3,576,650
Avg. Size per unit 1,032
Concord Square Planning & Development, Inc.
Page 4810/31/2016 161030 v. 9 Nichewaug Pro Forma Analysiis 10-30-16.xls

Nichewaug Inn Analysis Nichewaug - 9 UnitsOption 3
Nichewaug, Analysis B, SummarySaleable Sale Price Sale Price
Unit # Bedrooms S.F. per s.f.Floor 1 N 101 1 800 308,000 $385
N 102 1 900 346,500 $385
N 103 1 750 288,750 $385
N 104 1 ‐ - N 105 2 0 -
Floor 2 N 201 2 1,400 539,000 $385N 202 1 900 346,500 $385N 203 2 1,300 500,500 $385N 204 1 ‐ - N 205 2 0 -
Floor 3 N 301 2 1,260 485,100 $385N 302 1 810 311,850 $385
Dormer factor N 303 2 1,170 450,450 $38590.0% N 304 1 ‐ -
N 305 2 0 - Total 14 22 9,290 3,576,650
Concord Square Planning & Development, Inc.
Page 4910/31/2016 161030 v. 9 Nichewaug Pro Forma Analysiis 10-30-16.xls

Nichewaug Inn Analysis New Single FamilyOptions 3 and 4
Nichewaug Inn - Single FamilyPro Forma Analysis A Analysis B Total Homes
Sale Prices at Bonz Study Bonz StudyPlus Plus
Sources of Funds 10.0% 17.0% 3 4
Sale Proceeds @ $ / s.f. of: $192.50 365,750 $204.75 389,025 1,167,075 1,556,100Less Cost of Sales @ 6.0% (21,945) (23,342) (70,025) (93,366)
Total Sources 343,805 365,684 1,097,051 1,462,734
Uses of FundsAcquisition from the Town 1 1 3 4Private Water Supply 4,125 4,125 12,375 16,500Septic Fields 6,250 6,250 18,750 25,000Soft Costs @ this % of Construction: 15.0% 29,795 29,795 89,386 119,181Home Const Cost 1,500 $132.42 198,635 198,635 595,904 794,538Garage Cost 400 $45.00 18,000 18,000 54,000 72,000Construction Contingency @ 400 10.0% 21,663 21,663 64,990 86,654Misc. 25,000 25,000 75,000 100,000
303,469 303,469 910,408 1,213,877
Total Sources 343,805 365,684 1,097,051 1,462,734Total Uses (303,469) (303,469) (910,408) (1,213,877)
Developer Profit 40,336 62,214 186,643 248,857Profit as % of Costs 13.3% 20.5% 17.0% 17.0%
Size of home 1,500Size of garage 400Total s.f. 1,900Construction Cost 238,298 (including contingency)Construction Cost per s.f. $125.42
Concord Square Planning & Development, Inc.
Page 5010/31/2016 161030 v. 9 Nichewaug Pro Forma Analysiis 10-30-16.xls

Nichewaug Inn Analysis New Single FamilyOptions 3 and 4
RevenuesBonz Market Study - sale price per s.f. $175.00
Bonz plus Bonz plusSale Price Estimates 10.0% 17.0%
Total s.f. $192.50 $204.75House 1,500Garage 400
1,900 365,750 389,025
Sources of Funds Analysis A Analysis BBonz + 10.0% 17.0% Constr.
Size Cost $ / s.f.Sale Proceeds 365,750 389,025Less Cost of Sales @ (21,945) (23,342) Home 1,500 218,498 $145.67
Total Sources 343,805 365,684 Garage 400 19,800 $49.50
Uses of Funds Total 1,900 238,298Acquisition from the Town 1 1 $125.42Water & Septic 10,375 10,375Soft Costs 29,795 29,795 Sales Price 365,750 $243.83Const. Cost 238,298 238,298Misc. 25,000 25,000
Total Uses 303,469 303,469
Total Sources 343,805 365,684Total Uses (303,469) (303,469)
Developer Profit 40,336 62,214Profit as % of Costs 13.3% 20.5%
Construction Cost Estimate
Water SupplyExisting Well - Refurbish 15,000 Number of Homes 4Contingency @ 10.0% 1,500 BRs per home 3
16,500 Total BRs 12 (private well)
Well Cost per home 4 4,125
Septic FieldEstimated Cost 25,000Septic Cost per home 4 6,250
Concord Square Planning & Development, Inc.
Page 5110/31/2016 161030 v. 9 Nichewaug Pro Forma Analysiis 10-30-16.xls

Nichewaug Inn Analysis New Single FamilyOptions 3 and 4
Construction Cost EstimatesSize of Home: 1,500
Per Per HouseSq. Foot
FoundationFootings and foundation labor 3.38 5,071Footings & foundation material 1.87 2,805Waterproofing, etc. 0.22 324Floors labor and material 2.16 3,236Foundation Total 7.62 11,436
StructureLabor for framing 7.91 11,867Trusses 3.60 5,394Panels and loose lumber 17.98 26,971Windows and Ex doors 4.03 6,041Siding - vinyl shakes 6.47 9,709Roofing 3.60 5,394Insulation - to code. 2.30 3,452Balconies and porches 3.60 5,394Total - Structure 49.48 74,224
HVAC, Plumbing, ElectricHVAC 8.63 12,946Plumbing 10.79 16,182Electric 5.61 8,415Fire Protections 3.88 5,826Total HVAC, etc. 28.91 43,369
Drywall 9.35 14,0259.35 14,025
Interior FinishesMaterials 5.18 7,768Labor 4.32 6,473Painting 3.88 5,826Cabinets, vanities, granite counters 7.19 10,788Total interior Finish 20.57 30,855
FlooringTile, ceramic 3.16 4,747Hardwood 3.74 5,610Carpet 1.73 2,589Total Flooring 8.63 12,946
Concord Square Planning & Development, Inc.
Page 5210/31/2016 161030 v. 9 Nichewaug Pro Forma Analysiis 10-30-16.xls

Nichewaug Inn Analysis New Single FamilyOptions 3 and 4
Per Per HouseSq. Foot
Misc.Appliances 1.55 2,330Mirrors, shelving, towel bars, TP. 0.86 1,295
2.42 3,625
Site ImprovementsDriveways 0.86 1,295Sidewalks 0.43 647Site Work 0.86 1,295Punch Work 0.69 1,036Landscape 2.59 3,884Total - Site 5.44 8,156
132.42$ 198,635
Garage s.f. of: 400 45.00 18,00018,000
Home size: 1,500 216,635Garage size 400 Square feet 1,900Total s.f. 1,900 Cost per s.f. $114.02
Concord Square Planning & Development, Inc.
Page 5310/31/2016 161030 v. 9 Nichewaug Pro Forma Analysiis 10-30-16.xls

Nichewaug Inn Analysis New TownhousesOption 5
Townhouse DevelopmentPro Forma Analysis A Analysis B
Sale Prices at Bonz Study Bonz StudyPlus Plus
Sources of Funds 10.0% 18.0% Total Homes
15 20
Sale Proceeds @ price per s.f. of: $192.50 269,500 $206.50 289,100 4,336,500 5,782,000Less Cost of Sales @ 6.0% (16,170) (17,346) (260,190) (346,920)
Total Sources 253,330 271,754 4,076,325 5,435,100
Uses of FundsAcquisition from the Town 1 1 15 20Private Water Supply 5,867 5,867 88,000 117,333Septic Fields 5,333 5,333 80,000 106,667Soft Costs @ this % of Construction: 15.0% 22,897 22,897 343,455 457,940Home Const Cost 1,200 $127.21 152,647 152,647 2,289,698 3,052,930Garage Cost 200 $45.00 9,000 9,000 135,000 180,000Construction Contingency @ 10.0% 16,165 16,165 242,470 323,293Misc. 19,000 19,000 285,000 380,000
230,909 230,909 3,463,637 4,618,183
Total Sources 253,330 271,754 4,076,310 5,435,100Total Uses (230,909) (230,909) (3,463,637) (4,618,183)
Developer Profit 22,421 40,845 612,673 816,917Profit as % of Costs 9.7% 17.7% 15.0% 15.0%
Size of unit 1,200Garage 200 (one car)
1,400Construction Cost 168,811Cost per s.f. $120.58
Concord Square Planning & Development, Inc.
Page 5410/31/2016 161030 v. 9 Nichewaug Pro Forma Analysiis 10-30-16.xls

Nichewaug Inn Analysis New TownhousesOption 5
RevenuesBonz Market Study - sale price per s.f. $175.00
Bonz plus Bonz plusSale Price Estimates 10.0% 18.0%
Total s.f. $192.50 $206.50House 1,200Garage 200
1,400 269,500 289,100
Sources of Funds Analysis A Analysis BBonz + 10.0% 18.0% Constr.
Size Cost $ / s.f.Sale Proceeds 269,500 289,100Less Cost of Sales @ (16,170) (17,346) Home 1,200 167,911 $139.93
Total Sources 253,330 271,754 Garage 200 9,000 $45.00
Uses of Funds Total 1,400 176,911Acquisition from the Town 1 1 $126.37Water & Septic 11,200 11,200Soft Costs 22,897 22,897 Sales Price 269,500 $224.58Const. Cost 177,811 177,811Misc. 19,000 19,000
Total Uses 230,909 230,909
Total Sources 253,330 271,754Total Uses (230,909) (230,909)Developer Profit 22,421 40,845Profit as % of Costs 9.7% 17.7%
Construction Cost Estimate
Water SupplyOff Site Well 80,000 Number of Homes 15Contingency @ 10.0% 8,000 BRs per home 2
88,000 Total BRs 30 (requires off-site well)
Well Cost per home 15 5,867
Septic FieldEstimated Cost 80,000Septic Cost per home 15 5,333
Concord Square Planning & Development, Inc.
Page 5510/31/2016 161030 v. 9 Nichewaug Pro Forma Analysiis 10-30-16.xls
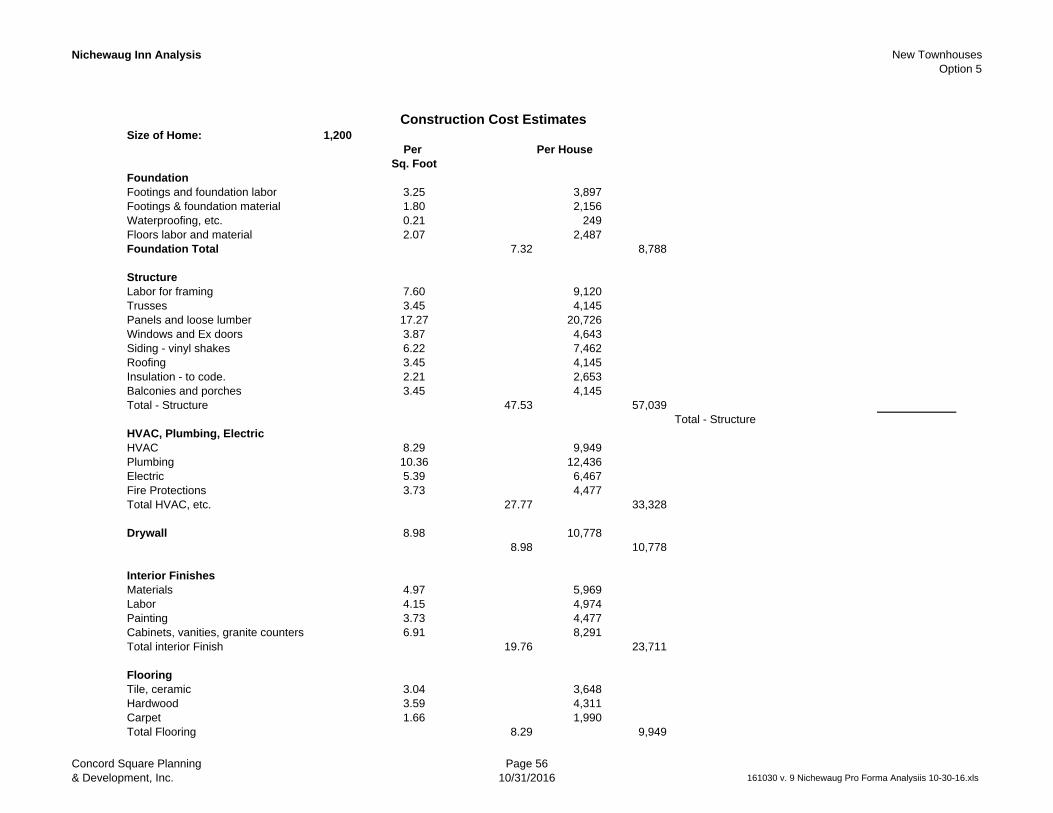
Nichewaug Inn Analysis New TownhousesOption 5
Construction Cost EstimatesSize of Home: 1,200
Per Per HouseSq. Foot
FoundationFootings and foundation labor 3.25 3,897Footings & foundation material 1.80 2,156Waterproofing, etc. 0.21 249Floors labor and material 2.07 2,487Foundation Total 7.32 8,788
StructureLabor for framing 7.60 9,120Trusses 3.45 4,145Panels and loose lumber 17.27 20,726Windows and Ex doors 3.87 4,643Siding - vinyl shakes 6.22 7,462Roofing 3.45 4,145Insulation - to code. 2.21 2,653Balconies and porches 3.45 4,145Total - Structure 47.53 57,039
Total - StructureHVAC, Plumbing, ElectricHVAC 8.29 9,949Plumbing 10.36 12,436Electric 5.39 6,467Fire Protections 3.73 4,477Total HVAC, etc. 27.77 33,328
Drywall 8.98 10,7788.98 10,778
Interior FinishesMaterials 4.97 5,969Labor 4.15 4,974Painting 3.73 4,477Cabinets, vanities, granite counters 6.91 8,291Total interior Finish 19.76 23,711
FlooringTile, ceramic 3.04 3,648Hardwood 3.59 4,311Carpet 1.66 1,990Total Flooring 8.29 9,949
Concord Square Planning & Development, Inc.
Page 5610/31/2016 161030 v. 9 Nichewaug Pro Forma Analysiis 10-30-16.xls

Nichewaug Inn Analysis New TownhousesOption 5
Per Per HouseSq. Foot
Misc.Appliances 1.49 1,791Mirrors, shelving, towel bars, TP. 0.83 995
2.32 2,786
Site ImprovementsDriveways 0.83 995Sidewalks 0.41 497Site Work 0.83 995Punch Work 0.66 796Landscape 2.49 2,985Total - Site 5.22 6,268
127.21$ 152,647
Garage s.f. of 200.00 $45.009,000
Home size: 1,200 161,647Garage size 200 Square feet 1,400Total s.f. 1,400 Cost per s.f. $115.46
Concord Square Planning & Development, Inc.
Page 5710/31/2016 161030 v. 9 Nichewaug Pro Forma Analysiis 10-30-16.xls
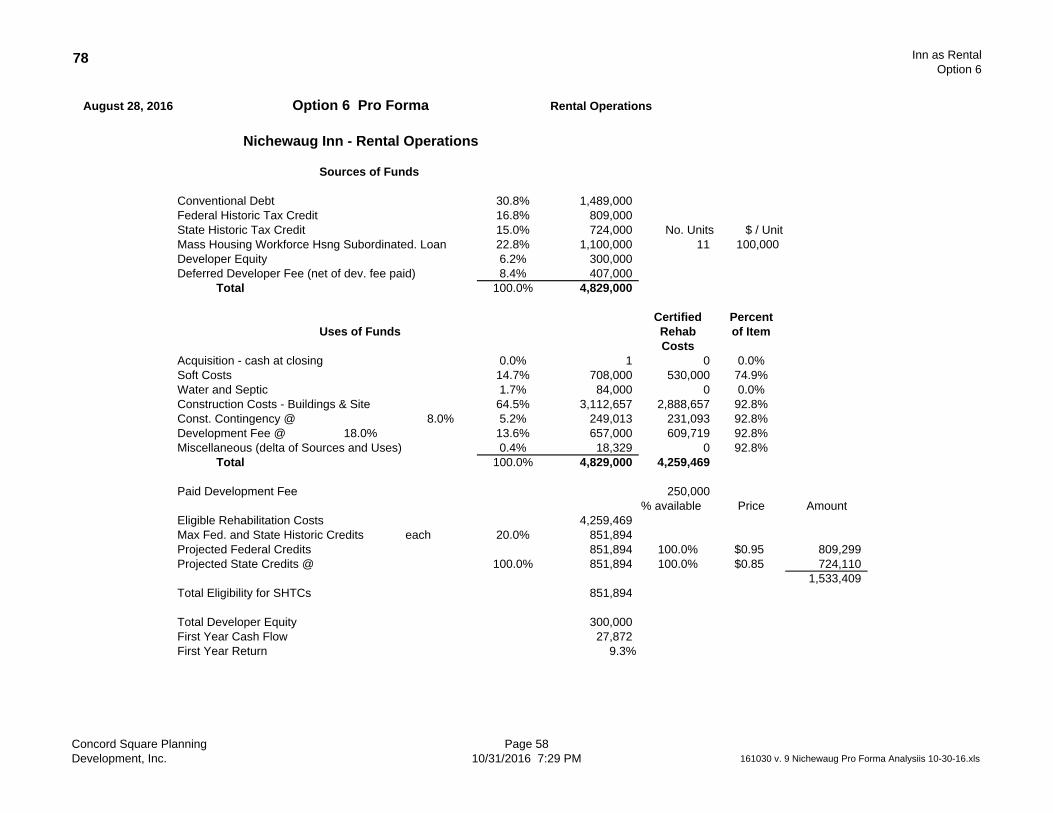
78 Inn as RentalOption 6
August 28, 2016 Option 6 Pro Forma Rental Operations
Nichewaug Inn - Rental Operations
Sources of Funds
Conventional Debt 30.8% 1,489,000Federal Historic Tax Credit 16.8% 809,000State Historic Tax Credit 15.0% 724,000 No. Units $ / UnitMass Housing Workforce Hsng Subordinated. Loan 22.8% 1,100,000 11 100,000Developer Equity 6.2% 300,000Deferred Developer Fee (net of dev. fee paid) 8.4% 407,000
Total 100.0% 4,829,000
Certified PercentUses of Funds Rehab of Item
CostsAcquisition - cash at closing 0.0% 1 0 0.0%Soft Costs 14.7% 708,000 530,000 74.9%Water and Septic 1.7% 84,000 0 0.0%Construction Costs - Buildings & Site 64.5% 3,112,657 2,888,657 92.8%Const. Contingency @ 8.0% 5.2% 249,013 231,093 92.8%Development Fee @ 18.0% 13.6% 657,000 609,719 92.8%Miscellaneous (delta of Sources and Uses) 0.4% 18,329 0 92.8%
Total 100.0% 4,829,000 4,259,469
Paid Development Fee 250,000% available Price Amount
Eligible Rehabilitation Costs 4,259,469Max Fed. and State Historic Credits each 20.0% 851,894Projected Federal Credits 851,894 100.0% $0.95 809,299Projected State Credits @ 100.0% 851,894 100.0% $0.85 724,110
1,533,409Total Eligibility for SHTCs 851,894
Total Developer Equity 300,000First Year Cash Flow 27,872First Year Return 9.3%
Concord Square Planning Development, Inc.
Page 5810/31/2016 7:29 PM 161030 v. 9 Nichewaug Pro Forma Analysiis 10-30-16.xls
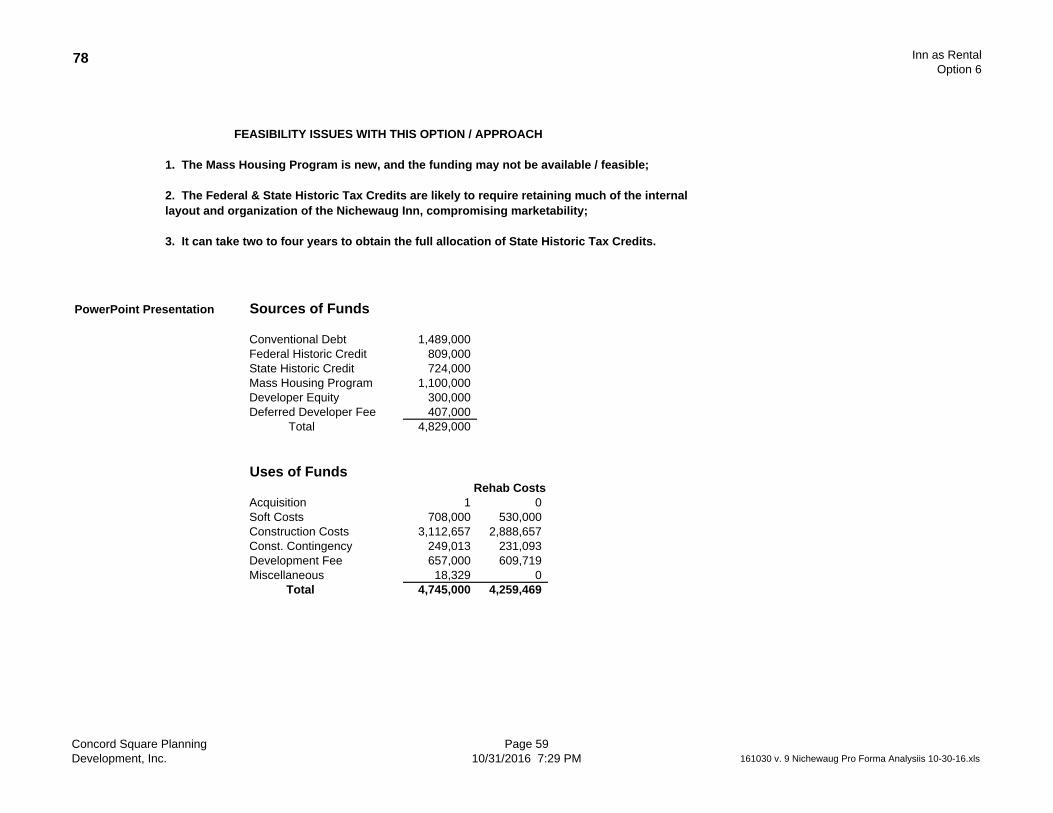
78 Inn as RentalOption 6
PowerPoint Presentation Sources of Funds
Conventional Debt 1,489,000Federal Historic Credit 809,000State Historic Credit 724,000Mass Housing Program 1,100,000Developer Equity 300,000Deferred Developer Fee 407,000
Total 4,829,000
Uses of FundsRehab Costs
Acquisition 1 0Soft Costs 708,000 530,000Construction Costs 3,112,657 2,888,657Const. Contingency 249,013 231,093Development Fee 657,000 609,719Miscellaneous 18,329 0
Total 4,745,000 4,259,469
FEASIBILITY ISSUES WITH THIS OPTION / APPROACH
1. The Mass Housing Program is new, and the funding may not be available / feasible;
2. The Federal & State Historic Tax Credits are likely to require retaining much of the internal layout and organization of the Nichewaug Inn, compromising marketability;
3. It can take two to four years to obtain the full allocation of State Historic Tax Credits.
Concord Square Planning Development, Inc.
Page 5910/31/2016 7:29 PM 161030 v. 9 Nichewaug Pro Forma Analysiis 10-30-16.xls

78 Inn as RentalOption 6
Rent Summary Avg s.f.
No. Leasable Rent Rent Type Units per unit per unit per s.f.
Inn 1 BR 8 846 $1,185 $1.40Inn 2 BR 7 1,230 $1,661 $1.35
Nichewaug Inn Avg s.f. Rentable
Revenue Summary Number of Leasable Total Rent Rent Monthly AnnualType of Unit No. Units Apartments per unit s.f. per s.f. per unit Rent Rent
Inn 1 BR 8 846 6,770 $1.45 $1,227 9,817 117,798Inn 2 BR 7 1,230 8,610 $1.35 $1,661 11,624 139,482
0 15 15,380 21,440 257,2801,025 $1.39 $1,429
Residential Revenues 257,280Resid. Vacancy @ 5.0% (12,864)
Annual Collections 244,416
Concord Square Planning Development, Inc.
Page 6010/31/2016 7:29 PM 161030 v. 9 Nichewaug Pro Forma Analysiis 10-30-16.xls

78 Inn as RentalOption 6
Construction Cost Estimate
Water Supply
Well Drilling 40,000Contingency @ 10.0% 4,000
44,000Septic Field
Estimated Cost 40,000
Exclusions per unit for Appliances and Cabinets, etc.: 6,000
Unit $ per Unit ExclusionsConstruction Costs s.f. $ / s.f. Amount from QRE
Nichewaug Inn 15Elevator 125,000Housing Unit Construction 15,380 $140.00 2,153,200 90,000Music Room Construction 2,306 $115.00 265,190Common Area Construction 4,836 $90.00 435,267Site and Landscaping 50,000 50,000Parking 28 $3,000.00 84,000 84,000
22,522 Subtotal 3,112,657Total Construction 3,112,657 224,000
7.2%Cost per s.f. Gross Cost
Bldg. Area Cost per s.f.
Inn 22,522 3,112,657 $138.2022,522 3,112,657
$138.20
Concord Square Planning Development, Inc.
Page 6110/31/2016 7:29 PM 161030 v. 9 Nichewaug Pro Forma Analysiis 10-30-16.xls

78 Inn as RentalOption 6
QRE % of QREMaximum Amount
Estimate of Soft Costs Totals Maximum is: 92.8%
A & E. @ % of Const. Budget: 6.0% 186,759 mos % out Interest Rate Amt 100.0% 173,319Interest during Construction 41,692 14 60.0% 4.0% 1,489,000 100.0% 38,692Interest on Bridge Loans for FHT 60.0% 33,991 14 100.0% 6.0% 485,579 100.0% 31,544Interest on Bridge Loans for SHT 75.0% 38,016 14 100.0% 6.0% 543,082 100.0% 35,280Closing Costs 75,000 50.0% 34,801Tax Credit Sale / Transaction 25,000 50.0% 11,600Legal and other Fees 75,000 50.0% 34,801Lender Legal 25,000 50.0% 11,600Deal Structure / Tax Advice 25,000 50.0% 11,600Other 10,000 100.0% 9,280Appraisal 8,500 0.0% 0Environmental, including Report 2,500 100.0% 2,320Survey 5,000 0.0% 0Closing Costs - Out of Pocket - Title / Recordin 10,000 0.0% 0Accounting/Cost Certification 10,000 100.0% 9,280Taxes During Construction 15,000 100.0% 13,921Insurance During Construction 10,000 100.0% 9,280Pre-construction carrying costs 0 100.0% 0Operating Costs During Construction 0 100.0% 0Year 1 Operating Deficit 15,000 100.0% 13,921Building Permit @ 0.60% 18,676 100.0% 17,332Dev., Hist. Preservation and Misc. Consulting 30,000 100.0% 27,841Accounting During Construction 8,000 100.0% 7,424Historic tax credit recapture insurance 10,000 100.0% 9,280Inspecting Engineer 5,000 100.0% 4,640Miscellaneous 3,400 100.0% 3,155Soft Cost Contingency @ 5.0% 20,985 100.0% 19,475
Total 708,000 530,000
Estimated Costs Eligible for Rehabilitation Tax Credit Base 74.9%Amount for Tax Credit Base 530,000
Soft Costs Excluding Interest and A & E 407,542
Concord Square Planning Development, Inc.
Page 6210/31/2016 7:29 PM 161030 v. 9 Nichewaug Pro Forma Analysiis 10-30-16.xls

78 Inn as RentalOption 6
Estimated Operating CostsPer Unit TotalPer Year Budget
Number of apartments 15Utilities
Common Area Electric 234 3,515 Electricity - Vacant 13 194 Water/Sewer 721 10,817 Gas Heat & Hot Water 262 3,927
Subtotal: 1,230 18,453
Repairs and Mainteance Air Conditioning 22 336 Heating 51 758 Plumbing 19 285 Roofing 15 220 Electric 15 219 R & M Sprinklers 28 420 Fire Alarm/Exstinq. Inspesct. 38 563 Carpet/Flooring 30 450 R & M Building Supplies 63 938 Keys, Locks & Doors 15 228 Trash Compactor 0 0 Appliances 28 423 Common Areas 25 375 Misc. R & M 50 750 Apt. Turnover - Repairs 50 750
Subtotal: 448 6,714
Concord Square Planning Development, Inc.
Page 6310/31/2016 7:29 PM 161030 v. 9 Nichewaug Pro Forma Analysiis 10-30-16.xls

78 Inn as RentalOption 6
Per Unit TotalPer Year Budget
15Contract Services
Cleaning - Apt. Turnover 94 1,404Janitor - Contract 116 1,743Trash/Recycling Maint. 50 750Window Cleaning 37 550Painting - Apt. Turnover 224 3,360Trash Removal 139 2,087Elevator Contract 160 2,400Grounds Contract 150 2,249Snow Removal Contract 471 7,070Bldg. Maint. Payroll 350 5,250Carpet Cleaning 38 563HVAC Contract Maint. 32 480
Subtotal: 1,860 27,904
Insurance, Mgmt. Fee, TaxesMgmt. Fee @ 5.00% 815 12,221 Real Estate Taxes 1,429 21,440 Personal Property Taxes 27 398 Property Insurance 712 10,676
Subtotal: 2,982 44,734
General and Administrative Manager/Leasing Payroll 250 3,750 Legal and Professional 15 221 Audit / tax return 236 3,544Office 25 375 Bad Debt 250 3,750 Misc. Admin. 15 224
Subtotal: 791 11,863 Total Expenses 7,311 109,669
Replacement Reserve @ $ / unit 300 300 4,500Expenses plus Replacement Reserve 7,611 114,169
Concord Square Planning Development, Inc.
Page 6410/31/2016 7:29 PM 161030 v. 9 Nichewaug Pro Forma Analysiis 10-30-16.xls

78 Inn as RentalOption 6
Per Unit TotalSummary of Operating Costs 15
Utilities. 1,230 18,453Repairs and Maintenance 448 6,714Contract Services 1,860 27,904Insurance, Mgmt Fee, Taxes 2,982 44,734General and Admin 791 11,863Replacement Reserves 300 4,500
Totals 7,611 114,169
Operating Costs @ $ per unit 6,182 92,729 114,169Residential Property Taxes @ $ / unit of: 1,429 21,440
Total Operating Costs 114,169
Operating Costs / s.f. 15,380 $7.42 (on leasable s.f.)
Operating Costs / unit 15 7,611
Concord Square Planning Development, Inc.
Page 6510/31/2016 7:29 PM 161030 v. 9 Nichewaug Pro Forma Analysiis 10-30-16.xls

78 Inn as RentalOption 6
Debt Service and Cash Flow
Net Operating Income
Annual Collections 244,416Annual Operating Expenses (114,169)Net Operating Income 130,247
Value @ Cap Rate of: 7.0% 1,860,675Max Loan @ LTV of: 80.0% 1,488,540
Conventional Loan
Amount of Loan 1,488,540Interest Rate 4.00%Debt Service Coverage: 1.381Term - years 25Debt Service 94,285Debt Service Constant 6.334%Interest Payment, year 1 59,542Principal Payment 34,743Payment to FHTC @ 1.0% 8,090Cash Flow after Debt Service 27,872
Amount of Cash Equity Investment 300,000
Concord Square Planning Development, Inc.
Page 6610/31/2016 7:29 PM 161030 v. 9 Nichewaug Pro Forma Analysiis 10-30-16.xls

78 Inn as RentalOption 6
Six Year Operating Projection:
Revenues increase 0.0% 2.0% 2.0% 2.0% 2.0% 2.0%Operating Expense 0.0% 2.0% 2.0% 2.0% 2.0% 2.0%
Years 1 2 3 4 5 6
Revenues 244,416 249,304 254,290 259,376 264,564 269,855Expenses (114,169) (116,452) (118,781) (121,157) (123,580) (126,052)Net Op. Income 130,247 132,852 135,509 138,219 140,984 143,803
Interest Payments (59,542) (58,152) (56,707) (55,203) (53,640) (52,014)Payment to FHTC (8,090) (8,090) (8,090) (8,090) (8,090) 0Principal Payment (34,743) (36,133) (37,578) (39,081) (40,645) (42,270)Cash Flow 27,872 30,477 33,134 35,845 38,609 49,519
Loan Balance 1,453,797 1,417,664 1,380,085 1,341,004 1,300,360 1,258,089
Concord Square Planning Development, Inc.
Page 6710/31/2016 7:29 PM 161030 v. 9 Nichewaug Pro Forma Analysiis 10-30-16.xls

Nichewaug Inn Analysis Graphs
Chart DataNet Gain to Town over 20 years
Analysis A Analysis B(1,578,206) (1,578,206) Demo Only
496,545 2,028,702 Option 1(522,985) 493,054 Option 2
(1,024,300) (322,850) Option 3(1,619,958) (1,584,813) Option 4
(393,818) (282,834) Option 5(823,296) (823,296) Option 6
Net Gain To Town
(2,000,000)
(1,500,000)
(1,000,000)
(500,000)
0
500,000
1,000,000
1,500,000
2,000,000
2,500,000
Analysis A Analysis B
Concord Square Planning & Development, Inc.
Page 6810/31/2016 161030 v. 9 Nichewaug Pro Forma Analysiis 10-30-16.xls

Residential Market Study
Nichewaug Inn
Petersham, Massachusetts
Prepared for:
Concord Square Development
Date of Report:
October 11, 2016

114 Waltham Street – Suite 23 Lexington, Massachusetts 02420 T 781.862-4861 T.781.862.4860
www.bonzandcompany.com
BONZ AND COMPANY, INC.
Real Estate Advisors
October 11, 2016
Mr. Ted Carmen
Concord Square Planning & Development, Inc.
294 Washington Street, Suite 454
Boston, MA 02108
RE: Market Study- Preliminary Findings
Nichewaug Inn
Petersham, MA
Dear Mr. Carmen:
In accordance with your request, we respectfully submit our market assessment in
relation to the above referenced property.
The Nichewaug Inn is located in Petersham, Massachusetts, on the northwest corner of
the historic town common. The property was originally constructed in 1899 with an
addition in 1952. The Town of Petersham requested proposals related to the preservation,
redevelopment and reuse of the property and selected Concord Square Planning &
Development as the consultant to assist in formulating potential financially feasible
options for the site.
Based on work completed to date, Concord Square Planning & Development have
proposed a variety of residential options on the site, including the renovation of the inn to
provide one and two-bedroom condominium units and/or the demolition of a portion of
the property to allow for the new construction of single-family homes.
You have requested that I provide a summary housing market overview for Petersham, an
estimate of the potential sales price for both the single family homes and condominium
units, and the potential absorption rate for these types of homes. Based on all of the data
reviewed, it is my opinion that the proposed condominium and single family home units
could sell for between $165 and $175 per square foot. The indicated sales price for each
unit type is shown in the following table.

Nichewaug Inn
Market Analysis
Estimated Sales Price of Proposed Units
You also requested my opinion regarding the potential feasibility to develop the Inn into,
a) Market Rate Rental Housing, b) Retail c) Office d) Restaurant and /or d) Hotel /
Hospitality uses. Given the small population of Petersham, the rural nature of the
community, the distance from major area highways as well as from major employment
centers it is very unlikely that any of these uses would be financially viable. Based on my
knowledge of the area and on other projects I have been involved with in Western
Massachusetts, it is my opinion that the achievable rental rates for any these uses would
not be sufficient to cover the redevelopment costs. It may also be challenging to attract a
sufficient number of interested parties.
Given the status of this project, we have used all the pertinent information that is
appropriate for this analysis, which is to analyze the viability of a residential development
in the subject’s market given the information, plans and/or approvals in place at the time
this market study was commissioned.
This report, including all analyses contained within, is based on estimates, assumptions
and other information developed from our research of the market, knowledge of the
industry and meetings during which the property contacts provided us with certain
information. It is possible that some assumptions contained in this report may not
materialize and unanticipated events and circumstances may occur. We have no
responsibility to update this report for events and circumstances occurring after the date
of our report.
Unit Type Size
1 BR Condo 700 $165 $175 $115,500 $122,500
1 BR Condo 900 $165 $175 $148,500 $157,500
2 Br Condo 1,000 $165 $175 $165,000 $175,000
2 Br Condo 1,400 $165 $175 $231,000 $245,000
3 BR SFH 1,600 $165 $175 $264,000 $280,000
3-BR SFH 2,000 $165 $175 $330,000 $350,000
Price/SF Range Potential Sales Pirce
Nichewaug Inn
Market Analysis
We have enjoyed the opportunity to conduct this assignment. If you should have any
questions regarding this report, please do not hesitate to contact us.
Respectfully submitted,
Bonz and Company, Inc.
Joanne F. Shelton
Director
MA Certified General
Real Estate Appraiser, Lic. #75113

Nichewaug Inn
Market Analysis
TABLE OF CONTENTS
SECTION I – MARKET OVERVIEW ...................................................................................................... 2
National For-Sale Market ..................................................................................................................... 2 State For-Sale Market ........................................................................................................................... 2 Local Residential Market ...................................................................................................................... 3
ESTIMATE OF POTENTIAL SALES PRICE ...................................................................................................... 5 SALES PRICE ANALYSIS.............................................................................................................................. 6
Summary of Sale Comparables ............................................................................................................. 8 Conclusion ............................................................................................................................................ 8 Absorption ............................................................................................................................................. 9
ADDENDA ...................................................................................................................................................10
LIST OF EXHIBITS
EXHIBIT 1–LOCAL RESIDENTIAL SALES PRICES .............................................................................................. 4 EXHIBIT 2 –NUMBER OF SALES ....................................................................................................................... 5 EXHIBIT 3– SUMMARY OF COMPARABLE SALES ............................................................................................. 8 EXHIBIT 4 – ESTIMATED SALES PRICE OF PROPOSED UNITS ............................................................................ 8

Nichewaug Inn
Market Analysis
2
SECTION I – MARKET OVERVIEW
The report begins with a general overview of the national and local for-sale housing
market and then provides a detailed examination of comparable properties in Petersham
and the surrounding market area.
National For-Sale Market
Housing market trends reflect the recent improvements in the economy. Data released on
June 28, by the S&P/Case-Shiller U.S. National Home Price Index, covering all nine U.S.
census divisions, recorded a 5.0% annual gain in April 2016, slightly less than the 5.1%
increase in March. After years of volatility, home prices have grown at a rate of around
5% since early 2015. Strong growth in home prices along with growing demand for new
homes have helped make the housing market one of the strongest sectors of the U.S.
economy in recent months.
The impact on the housing market of Britain’s decision to exit the European Union and
the ensuing turmoil in global financial markets is likely to be mixed. On the one hand,
falling yields on U.S. Treasury’s are helping to push mortgage rates lower. The rates for
30-year fixed mortgages have fallen to about 3.5% recently, near their lowest levels in
several years. If mortgage rates remain low, it makes monthly payments more affordable
and can help push up home prices or encourage buyers who are on the sidelines to decide
to purchase a home. But on the other hand, it could undercut consumer confidence and
have a slight negative impact on the U.S. economy, making people hesitate to go out and
make a major purchase such as a home.
State For-Sale Market
Single-family home sales in Massachusetts rose by 20.9 percent in May 2016, according
to data released by The Warren Group on June 28, 2016. There were 5,297 single-family
homes sold in the Bay State, compared with 4,382 in May 2015. Year-to-date, sales were
up by 28.2 percent with 19,554 homes sold in the first five months of 2016 compared
with 15,258 sold during the same time last year. The median sale price of a single-family
home in May was $347,000, a $7,000 increase from $340,000 last year, the highest
median sale price in eight months. Year-to-date prices remained flat, with a median sale
price of $325,500, up 0.2 percent from the same period in 2015.

Nichewaug Inn
Market Analysis
3
Condominium sales for the month rose by 9.0 percent, with 2,146 condos sold compared
with 1,969 sold in May of 2015. This marked the 12th consecutive month of increases in
condo sales. Year-to-date, condo sales increased by 19.4 percent to 7,845 condos sold
compared with 6,573 in the same timeframe last year. The median condo price increased
by 4.4 percent to $335,000, compared with $321,000 in the same month last year. Year-
to-date, condo prices were up 3.2 percent to a median sale price of $310,000 compared
with $300,450 in the same time period last year.
Local Residential Market
To better understand the current local residential market we examined single-family and
condominium sales data since 2000 for Petersham as well as the surrounding
communities of Hubbardston, New Salem, Hardwick and Phillipston.
As can be seen in the following exhibits, sale prices for all of these communities have
fluctuated over the period reviewed, with sale prices generally climbing through 2006
and 2007 and then declining, as with so many communities during the real estate crisis
and recession in 2008. However prices have been trending upwards over the past few
years. The median sale price for a single family home in Petersham was $232,000 in
2015, an 8.15% increase from the previous year but still significantly less than the pre-
recession peak of $372,500.
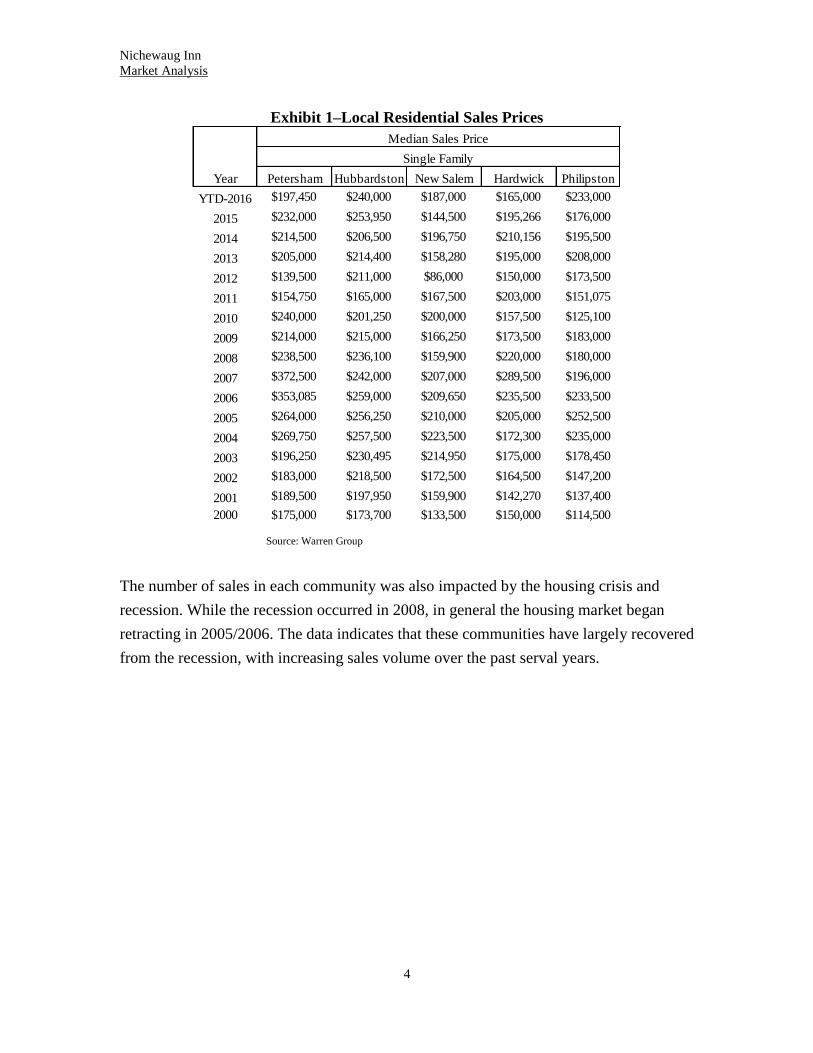
Nichewaug Inn
Market Analysis
4
Exhibit 1–Local Residential Sales Prices
Source: Warren Group
The number of sales in each community was also impacted by the housing crisis and
recession. While the recession occurred in 2008, in general the housing market began
retracting in 2005/2006. The data indicates that these communities have largely recovered
from the recession, with increasing sales volume over the past serval years.
Year Petersham Hubbardston New Salem Hardwick Philipston
YTD-2016 $197,450 $240,000 $187,000 $165,000 $233,000
2015 $232,000 $253,950 $144,500 $195,266 $176,000
2014 $214,500 $206,500 $196,750 $210,156 $195,500
2013 $205,000 $214,400 $158,280 $195,000 $208,000
2012 $139,500 $211,000 $86,000 $150,000 $173,500
2011 $154,750 $165,000 $167,500 $203,000 $151,075
2010 $240,000 $201,250 $200,000 $157,500 $125,100
2009 $214,000 $215,000 $166,250 $173,500 $183,000
2008 $238,500 $236,100 $159,900 $220,000 $180,000
2007 $372,500 $242,000 $207,000 $289,500 $196,000
2006 $353,085 $259,000 $209,650 $235,500 $233,500
2005 $264,000 $256,250 $210,000 $205,000 $252,500
2004 $269,750 $257,500 $223,500 $172,300 $235,000
2003 $196,250 $230,495 $214,950 $175,000 $178,450
2002 $183,000 $218,500 $172,500 $164,500 $147,200
2001 $189,500 $197,950 $159,900 $142,270 $137,400
2000 $175,000 $173,700 $133,500 $150,000 $114,500
Single Family
Median Sales Price

Nichewaug Inn
Market Analysis
5
Exhibit 2 –Number of Sales
Source: Warren Group
Estimate of Potential Sales Price
As noted previously, earlier this year the Town of Petersham requested proposals related
to the preservation, redevelopment and reuse of the property and selected Concord
Square Planning & Development as the consultant to assist in formulating potential
financially feasible options for the site. Based on work completed to date Concord Square
Planning & Development have proposed the following redevelopment options:
1. Retain portions of the Nichewaug Inn and the Academy Building; renovate with 26
condominium units (14 and 12, respectively). Demolish the newer brick connector
building, the kitchen wing, the northern flat-roofed part of the dining room wing
and the ‘Mother Superior’ addition of the Inn, and demolish the garage.
2. Retain only part of the Nichewaug Inn, with 14 condominium units. Demolish the
balance of the site;
3. Retain part of the Inn, as above, demolish the balance of the buildings, and provide
for the development of three homes on individual house lots on the northern access
road;
4. Demolish all the buildings, and allow for the construction of four homes on single
family lots along Common Street
Year Petersham Hubbardston New Salem Hardwick Philipston
YTD-2016 8 13 6 7 4
2015 21 42 14 26 24
2014 22 44 6 19 16
2013 10 45 8 20 17
2012 15 35 8 17 18
2011 12 22 6 18 17
2010 11 30 10 10 11
2009 15 30 6 20 16
2008 10 25 5 11 13
2007 8 48 7 12 21
2006 8 59 16 22 22
2005 17 62 13 31 28
2004 14 71 20 29 27
2003 16 51 6 21 25
2002 11 62 10 16 12
2001 9 46 17 24 25
2000 14 58 8 23 21
Number of Sales
Single Family

Nichewaug Inn
Market Analysis
6
Based on the information provided we have assumed the following:
1. The Condominium Units will be a mix of one and two-bedroom units. The one
bedroom units will range in size from 700 to 900 square feet and the two bedroom
units would be 1,000 to 1,400 square feet. The condominium fees are expected to
be in the range of $200 to $250 per month.
2. The Single Family Homes will be have three-bedroom and one and half
bathrooms, ranging in size from 1,600 to 2,000 square feet, on approximate half
acre sites.
The condominiums and single family homes will have granite countertops, stainless steel
appliances, fully applianced modern kitchen and bathroom, tile floors in the entries,
hardwood floors in the living areas, and carpet in the bedrooms. We have also assumed a
high level of energy efficiency. The residents of the condominium units will also have
access to a large community area.
Sales Price Analysis
In order to estimate a potential sales price for the proposed condominium units and single
family homes, we analyzed sales data in Petersham, and the surrounding communities of
Hubbardston, New Salem, Hardwick and Phillipston over the past 12 months, as well as
listing prices and the supply of units that are currently on the market. For this analysis we
considered only properties of relatively new construction or that have been renovated and
updated and are similar to the proposed units in terms of size and finishes. We excluded
properties with ten or more acres of land. Our extensive analysis of unit sale transactions
was based on research as reported in Multiple Listing Service (MLS) and on conversations
with local area brokers. A summary of the sales data reviewed is shown in the addenda.
The search criteria resulted in a total of 47 sales or listings, a summary of which follows:
Petersham
According to MLS there are 11 single family homes that meet our criteria and that are
either currently available for sale, or have sold in the last 12 months. The seven
properties that sold ranged in size from 2,200 sf to 3,694 sf, with sales prices from
$248,500 to $500,000, or from $112 to $194 per square foot. All of the properties sold for
between 1% and 10% less than their original asking price. The average time on market
was approximately 175 days.

Nichewaug Inn
Market Analysis
7
There are three comparable single family homes currently for sale in Petersham with
asking prices of $209,900, $279,900 and $464,500 or between $137 and $164 per square
foot. One property is under agreement.
Hubbardston
According to MLS there are 23 single family homes that meet our criteria and that are
either currently available for sale, or have sold in the last 12 months. The 13 properties
that sold ranged in size from 1,265 sf to 2,494 sf, with sales prices from $234,000 to
$323,000, or from $119 to $159 per square foot. All of the properties sold for at or
slightly above their original asking price. The average time on market was approximately
80 days.
There are 7 properties currently on the market, including four “to be built” single family
homes within the new Pinecrest subdivision development. These two and three-bedroom
homes will range in size from 1,331 to 1,560 square feet and have asking prices ranging
from $211,800 to $259,000 or from $145 to $182 per square foot. In terms of size,
finishes, new construction etc. these properties are probably most comparable to the units
proposed at the subject site.
New Salem
According to MLS there are only five single family homes that meet our criteria and that
are either currently available for sale, or have sold in the last 12 months. The one single
family home sale was for a four-bedroom 2,289 square foot home that sold for $325,900
or $141 per square foot. It was on the market for 7 months and sold for 5% below asking.
There are three properties currently on the market, including a “to be built” three-
bedroom single family home with 1,196 square feet with an asking price of $199,900 or
$167 per square foot. In terms of size, finishes, new construction etc. this property is
most comparable to the units proposed at the subject site.
Phillipston
According to MLS there are eight single family homes that meet our criteria, including
five that have sold in the last 12 months, two that are currently under agreement and one
that is being marketed for sale. Sale prices range from $229,000 to $354,000 or from $98
to $193 per square foot. Average marketing time was around 90 days.

Nichewaug Inn
Market Analysis
8
Summary of Sale Comparables
A summary of the sales, unit square footage, and sales per square foot of for all of the
comparable properties by unit type is illustrated in the following exhibit. As shown the
list/sale prices range from a low of $76.77 per square foot to a high of $225 per square
foot, with an average of between $138 and $140 per square foot.
Exhibit 3– Summary of Comparable Sales
Conclusion
Based on all of the data reviewed, it is my opinion that the proposed condominium and
single family home units could sell for between $165 and $175 per square foot. The
indicated sales price for each unit type is shown in the following table.
Exhibit 4 – Estimated Sales Price of Proposed Units
List Price Sales Price Size (SF) Price/SF
Min $199,900 $229,000 1,196 $76.77
Max $535,000 $500,000 3,694 $225.00
Median $269,900 $274,950 2,126 $138.16
Average $298,623 $303,446 2,164 $140.92
Unit Type Size
1 BR Condo 700 $165 $175 $115,500 $122,500
1 BR Condo 900 $165 $175 $148,500 $157,500
2 Br Condo 1,000 $165 $175 $165,000 $175,000
2 Br Condo 1,400 $165 $175 $231,000 $245,000
3 BR SFH 1,600 $165 $175 $264,000 $280,000
3-BR SFH 2,000 $165 $175 $330,000 $350,000
Price/SF Range Potential Sales Pirce

Nichewaug Inn
Market Analysis
9
Absorption
The subject development is located in a small rural community in Western
Massachusetts, and the limited sales activity in Petersham and the surrounding area
reflect this. According to the data provided by The Warren Group and MLS, over the past
five years there have been approximately 10 to 20 sales of single family homes in
Petersham each year. For the communities of New Salem, Hardwick and Phillipston, the
number of sales ranges from 6 to 26 sales per year. Hubbardston has the highest sales
volume with between 22 and 42 sales per year over the past five years.
According to MLS, of the 24 sales of single family homes in Petersham over the past 12
months, Days on Market ranged from 21 days to 306 days, with an average of 112 days,
or approximately 3.5 months.
For the subject development I would assume a substantial marketing period of at least 12-
24 months prior to construction completion, with the potential to pre-sell 5 to 6 units and
the balance of the units selling at a rate of one every three months after completion.

Nichewaug Inn
Market Analysis
10
ADDENDA
Appendix 1 – MLS Sales Data
# ADDRESS TOWN STATUS LIST PRICE SALE PRICE SF PRICE/SF BR BA
Lot 115A Cheyenne Drive Hubbardston, MA ACT $211,900 1,344 $157.66 2 1
12 Main Street Hubbardston, MA ACT $230,000 2,996 $76.77 4 2
Lot 7A Birches Road Hubbardston, MA ACT $242,900 1,331 $182.49 3 1
Lot 115B Cheyenne Drive Hubbardston, MA ACT $251,900 1,728 $145.78 2 1
Lot 40 Pitcherville Road Hubbardston, MA ACT $259,000 1,560 $166.03 3 1
41 Cross Road Hubbardston, MA ACT $265,000 1,728 $153.36 3 1
16 Evergreen Road Hubbardston, MA ACT $450,000 2,000 $225.00 3 2
8 Iroquois Avenue Hubbardston, MA BOM $269,900 1,296 $208.26 3 2
11 Rollingwoods Hubbardston, MA CTG $219,900 1,630 $134.91 3 2
118 New Westminster Rd Hubbardston, MA SLD $234,000 $234,000 1,265 $184.98 3 1
8 Chippewa St Hubbardston, MA SLD $249,900 $254,000 1,636 $155.26 4 2
15 Navajo St. Hubbardston, MA SLD $255,000 $260,000 1,768 $147.06 3 1
12 Geordie Ln Hubbardston, MA SLD $259,900 $259,900 1,728 $150.41 3 2
19 Adams Rd Hubbardston, MA SLD $269,900 $259,900 1,872 $138.84 3 2
5 Mare Meadow Ln Hubbardston, MA SLD $269,900 $269,900 2,208 $122.24 4 2
8 Laurel Street Hubbardston, MA SLD $269,900 $274,900 1,728 $159.09 3 1
54 Seminole Ave Hubbardston, MA SLD $289,900 $272,500 1,810 $150.55 3 2
26 Ragged Hill Road Hubbardston, MA SLD $299,000 $294,000 2,432 $120.89 3 1
10 Mare Meadow Ln Hubbardston, MA SLD $299,900 $298,000 2,494 $119.49 3 2
148 Old Westminster Rd Hubbardston, MA SLD $300,000 $300,000 2,282 $131.46 4 2
37 Root Rd Hubbardston, MA SLD $319,000 $317,000 2,480 $127.82 3 2
96 Old Westminster Road Hubbardston, MA SLD $329,900 $323,000 1,872 $172.54 3 2
102 Barre Rd. Hubbardston, MA UAG $319,900 2,674 $119.63 4 2
96 MT JEFFERSON ROAD Hubbardston, MA UAG $359,900 2,894 $124.36 4 2
0 Wendell Rd New Salem, MA ACT $199,900 1,196 $167.14 3 1
17 W Main New Salem, MA ACT $239,900 1,942 $123.53 4 2
246 North Main Street New Salem, MA ACT $250,000 2,923 $85.53 4 2
62 Michael Lane New Salem, MA PCG $225,000 2,052 $109.65 4 2
10 Hunt Road New Salem, MA SLD $339,900 $325,000 2,289 $141.98 4 2
163 Hardwick Road Petersham, MA ACT $209,900 1,276 $164.50 3 2
23 Barre Rd Petersham, MA ACT $279,900 1,768 $158.31 3 2
19 S Main ST Petersham, MA ACT $464,500 3,379 $137.47 4 3
28 Birch DR Petersham, MA SLD $248,500 $248,500 2,200 $112.95 3 2
2 Old Waite RD Petersham, MA SLD $325,000 $312,000 2,323 $134.31 3 2
25 Birch Drive Petersham, MA SLD $334,900 $320,000 2,776 $115.27 5 2
172 Nelson RD Petersham, MA SLD $348,900 $329,000 2,254 $145.96 4 3
101 East ST Petersham, MA SLD $475,000 $468,500 3,312 $141.46 4 2
108 South Petersham, MA SLD $524,900 $500,000 3,694 $135.35 5 3
26 N Main ST Petersham, MA SLD $535,000 $480,000 2,466 $194.65 3 3
58 Birch DR Petersham, MA UAG $312,000 2,314 $134.83 3 2
5 Petersham Rd Phillipston, MA ACT $339,900 1,763 $192.80 3 2
110 School House Rd Phillipston, MA SLD $229,900 $229,000 2,032 $112.70 4 2
55 Baldwinville Rd Phillipston, MA SLD $259,900 $253,000 2,300 $110.00 3 2
160 State Rd Phillipston, MA SLD $269,900 $265,000 2,408 $110.05 3 3
9 Pine Meadow Road Phillipston, MA SLD $269,900 $267,500 2,727 $98.09 2 2
375 Petersham Rd Phillipston, MA SLD $289,900 $275,000 1,908 $144.13 3 2
600 Highland Ave Phillipston, MA UAG $279,900 2,600 $107.65 3 2
110 Ward Hill Road Phillipston, MA UAG $354,900 3,204 $110.77 4 2
Source: MLS
Nichewaug Inn
Market Analysis
11
Appendix 2 - Qualifications
Qualifications of Joanne Shelton
Director
Bonz and Company, Inc.
Employment
Ms. Shelton is Director and Principal of the firm and has been with Bonz and Company
Inc. since 1998. Previously Ms. Shelton was employed by Plymouth Development
Corporation, England, and Laganside Development Corporation in Belfast, Northern
Ireland, two of the thirteen development corporations in the United Kingdom.
Education
Ms. Shelton holds Bachelor of Science in Estate Management (Real Estate Studies),
University of Ulster, Jordanstown, Northern Ireland and has also completed extensive
appraisal courses and seminars offered by the Appraisal Institute as well as real estate
financial classes at Boston area universities. Ms Shelton is a Massachusetts and Rhode
Island licensed Certified General Real Estate Appraiser and is MAP Certified and HUD
Approved for appraisals and market studies completed as part of the financing
requirements for HUD’s Multi-Family Accelerated Processing
Experience
1) Housing and related development assignments: Market-rate, low, moderate, and mixed
income housing ranging from town-house development to high-rise condominiums and
rental apartments
2) Commercial properties: Medical office building suburban office buildings, large office
parks, and downtown high-rise office buildings, retail districts, shopping centers, box
retail facilities, specialty retail facilities; mixed-use developments, and related properties:
3) Industrial and related special purpose properties: R&D facilities, research
laboratories, industrial parks, distribution facilities, and manufacturing facilities;
4) Special Purpose Properties Institutional facilities, theaters and schools, and other such
properties;
Among the institutional, public, and private clients whom Ms. Shelton has served are:
Citizens Financial Group, Bank of America, PNC Bank Corporation, Wainwright Bank,
Harvard Pilgrim Health Care, Beacon Companies, Boston Properties, Boston University
and Northeastern University, Massachusetts Housing Investment Corporation, The
Community Builders, Rockport Mortgage, CW Capital, East Boston CDC, Cambridge
Housing Authority and Rhode Island Housing Authority
Appraisal Certification:
Massachusetts Certified General Real Estate Appraiser: License: #75113
Rhode Island Certified General Real Estate Appraiser: Certification No. A01373G


PETERSHAM, MANICHEWAUG INN 07 SEPT 2016
0 30' 60' 120'
SITE PLAN - OPTION 1NICHEWAUG INN - 15 UNITS (22 BEDS)
ACADEMY - 14 UNITS (21 BEDS)
LOT SIZE290,545 SF
EXISTING BUILDING FOOTPRINT33,275 SF (11.5% OF LOT)
PROPOSED BUILDING FOOTPRINT19,548 SF (6.7% OF LOT)
BUILDING FOOTPRINT REDUCED BY41.3% (13,727 SF)

PETERSHAM, MANICHEWAUG INN 07 SEPT 2016
0 30' 60' 120'
SITE PLAN - OPTION 2NICHEWAUG INN - 15 UNITS (22 BEDS)
LOT SIZE290,545 SF
EXISTING BUILDING FOOTPRINT33,275 SF (11.5% OF LOT)
PROPOSED BUILDING FOOTPRINT9,228 SF (3.2% OF LOT)
BUILDING FOOTPRINT REDUCED BY72.2% (24,047 SF)

PETERSHAM, MANICHEWAUG INN 07 SEPT 2016
0 30' 60' 120'
SITE PLAN - OPTION 3NICHEWAUG INN - 9 UNITS (12 BEDS)SINGLE FAMILY HOMES - 3 (9 BEDS)
LOT SIZE290,545 SF
EXISTING BUILDING FOOTPRINT33,275 SF (11.5% OF LOT)
PROPOSED BUILDING FOOTPRINT10,957 SF (3.8% OF LOT)
BUILDING FOOTPRINT REDUCED BY67.1% (22,318 SF)

PETERSHAM, MANICHEWAUG INN 07 SEPT 2016
0 30' 60' 120'
SITE PLAN - OPTION 4SINGLE FAMILY HOMES - 4 (12 BEDS)
LOT SIZE290,545 SF
EXISTING BUILDING FOOTPRINT33,275 SF (11.5% OF LOT)
PROPOSED BUILDING FOOTPRINT6,144 SF (2.1% OF LOT)
BUILDING FOOTPRINT REDUCED BY81.5% (27,131 SF)

PETERSHAM, MANICHEWAUG INN 07 SEPT 2016
0 10' 20' 40'
ACADEMY - FIRST FLOOR PLAN
PetershamUnit and Area Summary8/1/2016
Academy Building GSF NSF Eff 1 Bed 2 Bed TotalFloor 1 10,320 6,160 60% 2 4 6Floor 2 10,320 7,310 71% 5 3 8Total 20,640 13,470 65% 7 7 14Total Bedrooms 7 14 21
Nichewaug Inn GSF NSF Eff 1 Bed 2 Bed TotalFloor 1 8,422 4,050 48% 3 1 4Floor 2 6,190 5,200 84% 1 3 4Floor 3 6,190 5,200 84% 1 3 4Total 20,802 14,450 69% 5 7 12Total Bedrooms 5 14 19
Combined GSF NSF Eff 1 Bed 2 Bed TotalTotal 41,442 27,920 67% 12 14 26Total Bedrooms 12 28 40
Academy Building - Floor 1 Unit Type Net SF1 1 Bed 820 2 1 Bed 840 3 2 Bed 1,200 4 2 Bed 1,100 5 2 Bed 1,100 6 2 Bed 1,100 Total 6,160
Academy Building - Floor 2Unit Type Net SF1 1 Bed 820 2 1 Bed 840 3 2 Bed 1,200 4 2 Bed 1,100 5 2 Bed 1,100 6 1 Bed 750 7 1 Bed 750 8 1 Bed 750 Total 7,310
Nichewaug Inn - Floor 1Unit Type Net SF1 1 Bed 800 2 1 Bed 900 3 1 Bed 750 4 2 Bed 1,600 Total 4,050
Nichewaug Inn -Floors 2 and 3Unit Type Net SF1 2 Bed 1,400 2 1 Bed 900 3 2 Bed 1,300 4 2 Bed 1,600 Total 5,200

PETERSHAM, MANICHEWAUG INN 07 SEPT 2016
0 10' 20' 40'
ACADEMY - SECOND FLOOR PLAN
PetershamUnit and Area Summary8/1/2016
Academy Building GSF NSF Eff 1 Bed 2 Bed TotalFloor 1 10,320 6,160 60% 2 4 6Floor 2 10,320 7,310 71% 5 3 8Total 20,640 13,470 65% 7 7 14Total Bedrooms 7 14 21
Nichewaug Inn GSF NSF Eff 1 Bed 2 Bed TotalFloor 1 8,422 4,050 48% 3 1 4Floor 2 6,190 5,200 84% 1 3 4Floor 3 6,190 5,200 84% 1 3 4Total 20,802 14,450 69% 5 7 12Total Bedrooms 5 14 19
Combined GSF NSF Eff 1 Bed 2 Bed TotalTotal 41,442 27,920 67% 12 14 26Total Bedrooms 12 28 40
Academy Building - Floor 1 Unit Type Net SF1 1 Bed 820 2 1 Bed 840 3 2 Bed 1,200 4 2 Bed 1,100 5 2 Bed 1,100 6 2 Bed 1,100 Total 6,160
Academy Building - Floor 2Unit Type Net SF1 1 Bed 820 2 1 Bed 840 3 2 Bed 1,200 4 2 Bed 1,100 5 2 Bed 1,100 6 1 Bed 750 7 1 Bed 750 8 1 Bed 750 Total 7,310
Nichewaug Inn - Floor 1Unit Type Net SF1 1 Bed 800 2 1 Bed 900 3 1 Bed 750 4 2 Bed 1,600 Total 4,050
Nichewaug Inn -Floors 2 and 3Unit Type Net SF1 2 Bed 1,400 2 1 Bed 900 3 2 Bed 1,300 4 2 Bed 1,600 Total 5,200

PETERSHAM, MANICHEWAUG INN 07 SEPT 2016
0 10' 20' 40'
INN - FIRST FLOOR PLAN
PetershamUnit and Area Summary8/1/2016
Single Family House GSF NSF Eff Bedrooms TotalUnit 4,500 4,500 100% 9 9Total 4,500 4,500 100% 9 9Total Bedrooms 9 9
Nichewaug Inn GSF NSF Eff 1 Bed 2 Bed TotalFloor 1 9,228 4,550 49% 4 1 5Floor 2 6,997 5,700 81% 2 3 5Floor 3 6,997 5,700 81% 2 3 5Total 23,222 15,950 69% 8 7 15Total Bedrooms 8 14 22
Combined GSF NSF Eff 1 Bed 2 Bed TotalTotal 27,722 20,450 74% 17 7 24Total Bedrooms 17 14 31
Nichewaug Inn - Floor 1Unit Type Net SF1 1 Bed 800 2 1 Bed 900 3 1 Bed 750 4 1 Bed 900 5 2 Bed 1,200 Total 4,550
Nichewaug Inn -Floors 2 and 3Unit Type Net SF1 2 Bed 1,400 2 1 Bed 900 3 2 Bed 1,300 4 1 Bed 900 5 2 Bed 1,200 Total 5,700

PETERSHAM, MANICHEWAUG INN 07 SEPT 2016
0 10' 20' 40'
INN - SECOND & THIRD FLOOR PLAN
PetershamUnit and Area Summary8/1/2016
Single Family House GSF NSF Eff Bedrooms TotalUnit 4,500 4,500 100% 9 9Total 4,500 4,500 100% 9 9Total Bedrooms 9 9
Nichewaug Inn GSF NSF Eff 1 Bed 2 Bed TotalFloor 1 9,228 4,550 49% 4 1 5Floor 2 6,997 5,700 81% 2 3 5Floor 3 6,997 5,700 81% 2 3 5Total 23,222 15,950 69% 8 7 15Total Bedrooms 8 14 22
Combined GSF NSF Eff 1 Bed 2 Bed TotalTotal 27,722 20,450 74% 17 7 24Total Bedrooms 17 14 31
Nichewaug Inn - Floor 1Unit Type Net SF1 1 Bed 800 2 1 Bed 900 3 1 Bed 750 4 1 Bed 900 5 2 Bed 1,200 Total 4,550
Nichewaug Inn -Floors 2 and 3Unit Type Net SF1 2 Bed 1,400 2 1 Bed 900 3 2 Bed 1,300 4 1 Bed 900 5 2 Bed 1,200 Total 5,700

PETERSHAM, MANICHEWAUG INN 07 SEPT 2016
0 10' 20' 40'
Nichewaug Inn (9 Unit) GSF NSF Eff 1 Bed 2 Bed TotalFloor 1 6,690 2,450 37% 4 1 5Floor 2 4,196 3,050 73% 2 3 5Floor 3 4,196 3,050 73% 2 3 5Total 15,082 8,550 57% 8 7 15Total Bedrooms 8 14 22
Nichewaug Inn - Floor 1 (9 Unit)Unit Type Net SF1 1 Bed 800 2 1 Bed 900 3 1 Bed 750 Total 2,450
Nichewaug Inn -Floors 2 and 3 (9 Unit)Unit Type Net SF1 2 Bed 1,400 2 1 Bed 900 3 1 Bed 750 Total 3,050
INN (9 UNIT) - FIRST FLOOR PLAN

PETERSHAM, MANICHEWAUG INN 07 SEPT 2016
0 10' 20' 40'
Nichewaug Inn (9 Unit) GSF NSF Eff 1 Bed 2 Bed TotalFloor 1 6,690 2,450 37% 4 1 5Floor 2 4,196 3,050 73% 2 3 5Floor 3 4,196 3,050 73% 2 3 5Total 15,082 8,550 57% 8 7 15Total Bedrooms 8 14 22
Nichewaug Inn - Floor 1 (9 Unit)Unit Type Net SF1 1 Bed 800 2 1 Bed 900 3 1 Bed 750 Total 2,450
Nichewaug Inn -Floors 2 and 3 (9 Unit)Unit Type Net SF1 2 Bed 1,400 2 1 Bed 900 3 1 Bed 750 Total 3,050
INN (9 UNIT) - SECOND & THIRD FLOOR PLAN


Report on Sewer and Water Supply Nichewaug Inn Property
Petersham, Ma May 2016
(Revised June 13 and October 12, 2016)
By Douglas MacLeay, MacLeay Engineering, Colrain, MA
For Purposes of this report I will use a project size of 30 Bedrooms total. This
would result in a design flow of 3,300 Gallons Per Day and a Zone 1 radius of 178
feet and an Interim Wellhead Protection Area Radius of 473 feet.
1 PUBLIC WATER SUPPLY
There are several options for a water supply to serve this property. I will list and discuss each
separately.
Existing Well on Site:
Based on the DEP email received on June 10, 2016 the option of using
the existing well is no longer an option.
While the DEP is not encouraging this option they have not completely ruled it out. The existing
well supplied the existing facility at the time of it’s closing as a school. The current water supply
rules went into effect in the early 1990’s. Had this well been in active use and registered with
DEP it would continue to be grandfathered as a water supply as long as it tested satisfactory.
The lack of continuous use has left its status in limbo. If the DEP were to consider allowing it’s
use as a Public Water supply a pump test would have to be conducted to determine both the
quantity and quality of water available. Estimated cost to test $10,000.00
If this well were to be re‐activated its presence would affect the location and cost of a
subsurface sewage disposal system to serve the property. There would also potentially be
restrictions on activities near the well.

Drill and Test a New Well on South end of Property:
Based on notes from Ann Lewis’s 2010 Meeting with Mass. DEP, they would consider allowing a
new well to be drilled and tested with a Zone 1 contained on the property. Estimated Cost
$20,000.00. Based on the DEP email of Friday June 10, 2016 drilling and testing a new well on
the property would be limited to either the equivalent of three, three bedroom homes or siting
a fully compliant well if a larger development is chosen. There is some question as to the ability
to site a well with the Zone 1 totally contained on the property and keep the septic system
outside the Interim Wellhead Protection Area.
Locating a Public Water Supply Well in this area would limit the siting choices for a new
subsurface sewage disposal system to serve the facility. The use restrictions which would be
imposed would likely be a negative to the use of this area.
Drill and Test a New Well on Trustees of Reservation Land Across Route
32:
While this option certainly has some controversy, it is clear from a survey plan recorded at the
Worcester Registry of Deeds Plan Book 172 Plan 127 that as of December 1950 the sewage
from the Inn was discharged to this property. The deed to the Nichewaug Inn property appears
to continue to recite rights on the former Fiske property. Lacking other viable options
negotiations might be made for siting a well on this property as a better and less disruptive
option to having a disposal system on the land. Estimated Cost $30,000.00
Removing the well from the property allows more freedom in the design and siting of the
sewage treatment facility and the use of the open spaces.
However, note that as a non‐profit organization with land holdings across the state the
Trustees’ conservation land is frequently eyed as a potential site for a water supply or
wastewater facility. The Trustees have always opposed these proposals due to various
concerns such as the intent of the original donor of the land and of setting a precedent that
their conservation lands not be altered to accommodate non‐conservation uses. In addition, it
is understood that the easement was extinguished by the Trustees when the Trustees assisted
with the conveyance of the Nichewaug Inn property to town ownership in 2007.
Obtain a nearby parcel on which to site a new well either by purchase
or easement:
The purpose of this option as in the previous option is that it avoids restrictions on the use of
the Nichewaug Inn property related to Public Water Supply. This also allows more options in

the design of sewage treatment and aesthetic placement of facilities. Estimated Cost
$30,000.00 + Land Cost.
Formation of a Water Supply District within the Center Village Area of
Petersham:
This option presents a long term solution not just to water supply for the Nichewaug Inn
property but to the village. Many properties in the village are not large enough to contain both
a water supply well and a sewage disposal system. Removing wells from these lots will permit
more cost effective septic repair on these lots. Additional benefits result from having better
fire protection and lower insurance rates within the village area. This would also potentially
benefit real estate values.
While this is a much more expensive option, it is more inclusive and beneficial to the entire
village. Many opportunities for grants and financing of Public Water Supply systems exist.
There currently are few grants or financing options for sewage disposal. I am not able within
the scope of this report to make a cost estimate for this option but would recommend pursuing
a grant to study the cost and feasibility.
2 SEWAGE TREATMENT:
For this report the sewage discharge is considered to be 3,300 gallons per day resulting from 30
bedrooms. The existing records indicate the soils are a sandy loam with a percolation rate of
30+ minutes per inch and an estimated seasonal high water table of 22 inches. The Title 5
loading Rate is .33 gallons per day per square foot for a percolation rate of 30 minutes per inch.
A standard leaching area design would require 10,000 square feet of leaching surface. In terms
of leach fields this would equate to two fields of 50feet x 100 feet or equivalent
If one used an alternative system such as the Elgin Mantis M5 the required area would drop
40% to 6,000 square feet of leaching surface. A similar result could be achieved with other
similar alternative systems.
The oldest technology in existence for treatment the recirculating sand filter used in
conjunction with a pressure dosed leach area would reduce this to 5,000 square feet of
leaching surface.
A more modern approach which also yields a reduction of 50% or 5,000 square feet of leaching
surface is the Orenco Systems Ad‐Vantex AX‐100 geo‐textile treatment unit which functions the
same as a recirculating sand filter, but is more contained and easier to maintain.
Given the site constraints I believe the most cost effective system for this site would be the Ad‐
Vantex. This system requires a contract with an operator having a class 3 treatment plant
operators license to ensure regular monitoring and servicing. The system also has an advanced

control panel which would be connected to a dedicated phone line allowing the master
computer to report operating issues to the operator and the owner as they occur. An added
benefit is that the authorized operator can access the panel remotely to adjust the process.
The above examples are given to show alternatives, there are other technologies which have
been approved by Mass DEP that give reductions similar to those above.
The construction of a system to serve this property would be considered to be the repair of an
existing failed system as long as the design did not increase flows from the historical flow for
the property.
Conclusion:
While at one time it appears that there were recorded deed rights to use the
former Fiske property across Route 32, these have apparently been extinguished,
and I feel that the treatment system would be most effective constructed on the
immediate property. I believe that the best results can be achieved by removing
the water supply from the immediate site and keeping the treatment system on
the site. Given the location of the village within a reach of the Quabbin
Watershed and the issues discouraging construction of a village wide treatment
system as well as the lack of public money for such a project, on‐site solutions at
present seem the best answer to waste disposal.

1
Ted Carman
From: Henry Woolsey <[email protected]>Sent: Tuesday, October 04, 2016 12:29 PMTo: Ted CarmanSubject: FW: Nichewaug Inn water supply, Petersham
From: Paine, Douglas (DEP) [mailto:[email protected]] Sent: Friday, July 29, 2016 11:44 AM To: Henry Woolsey Subject: Re: Nichewaug Inn water supply, Petersham
Henry, Here's a brief summary of our Wednesday discussion. Although we discussed several options, the last diagram, showing the two wells on the current Inn property appears to present the best option. That depiction showed a smaller well, with a Zone I radius of 100‐feet serving 9 unit (12‐bedrooms) within a structure identified as the Inn. A second, larger well with a Zone I radius of 150‐feet, would serve a separate 12 unit (20 bedroom) structure identified on the plan as the Academy. MassDEP would allow two (or more) PWS wells on one property, with overlapping Zone I protection areas. Although there is no minimum separation distance between the two (or more) wells, the closer they are, the more likely that the wells would adversely impact each other, so maximizing the separation distance is generally considered to be beneficial. Each PWS well must have a Zone I which is either owned or controlled by the PWS owner. If not through ownership, Zone I control may be through an easement, a CR, or in some cases an MOU. Uses within the Zone I must be limited to passive recreation (walking, cross country skiing, etc.). In order to estimate the amount of water required for a residential project, MassDEP would assign a flow rate of 110 gallons per day per bedroom. In the scenario presented, the required flow from both wells combined would be 3,520 gallons per day. Zone Is are calculated using the formula [150 x log of pumping rate (in gallons per day)] ‐ 350. Wastewater flow rates in excess of 2,000 gallons per day on a single parcel, may result in a requirement for additional wastewater treatment.

r • :cg:_ ... ··--...... ' .. ~ t·~;::;:; ___ ~--=-=-:::-:-:::-:_:::::=-""::-=-:--::::~=-=:-::-:_=-::_::-:_:::-:_::-=-::-::-::::--:_:::-.,!..:~-=-""-----------:..- --------~-__ ':'_ -_ -_ ._ ... _ .... _ .. __ .. ,,,._
------------~-=-:...:;- - - - - - -- - - -l ~----------~--------=~::;.,,,.
",...., ', _____ ~ ~ .......... _ ' . ~----.. - .. \
' '
-
' - ® !Ji{ -
\ -\ -\ -
W£L<. I .·
' i
• () 16 " u .. o t i 1: * : 4
.JUL'1 ,~, 2ol b.