Embed Size (px)
Citation preview
Prepared by
NHS Staff Survey Results - 2018
Lyndsay Duggan, OD Co-ordinator
Our main Goals for 2018 were to:
1. Increase employee engagement score
2. Engage staff in taking responsibility and accountability for the survey
3. Exceed last year’s completion percentage
NHS Staff Survey 20182018 Goals
• Launched in June 2018
• 27 Champions across the Trust
• Minimum one champion representing each directorate / department
NHS Staff Survey 2018What is new for 2018 – Staff Survey Champions
The Staff Survey 2018 went live on 19th September 2018 and closed 30th November 2018
49% of NEAS employees completed the online survey!
NHS Staff Survey 2018Introduction
NHS Staff Survey 2018
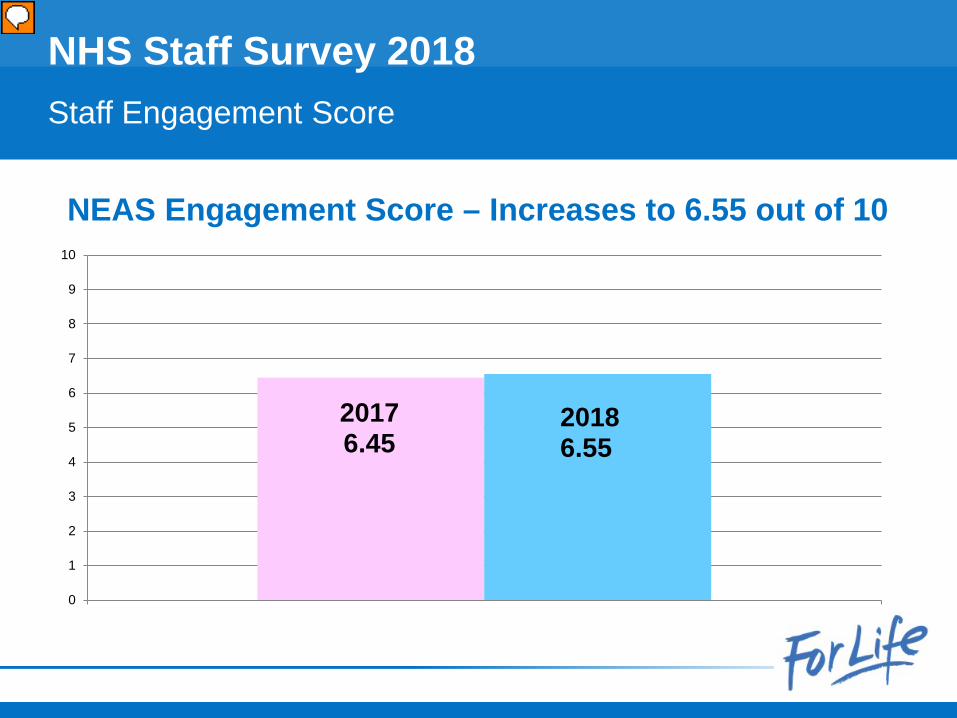
NHS Staff Survey 2018Staff Engagement Score
2017 6.45
20186.55
0
1
2
3
4
5
6
7
8
9
10
NEAS Engagement Score – Increases to 6.55 out of 10
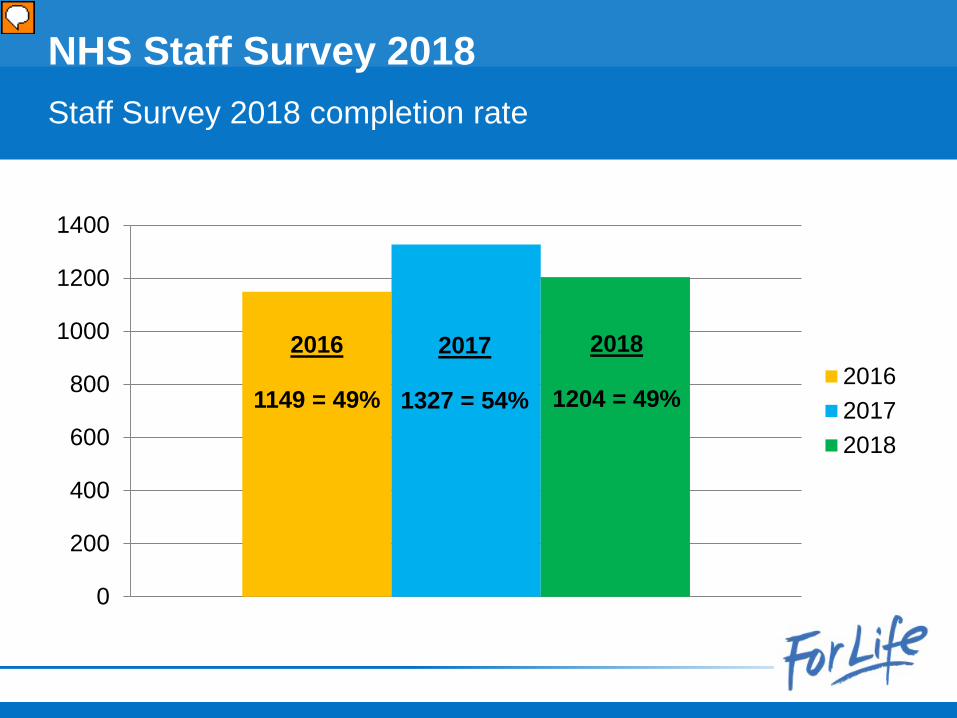
NHS Staff Survey 2018Staff Survey 2018 completion rate
2016
1149 = 49%
2017
1327 = 54%
2018
1204 = 49%
0
200
400
600
800
1000
1200
1400
201620172018
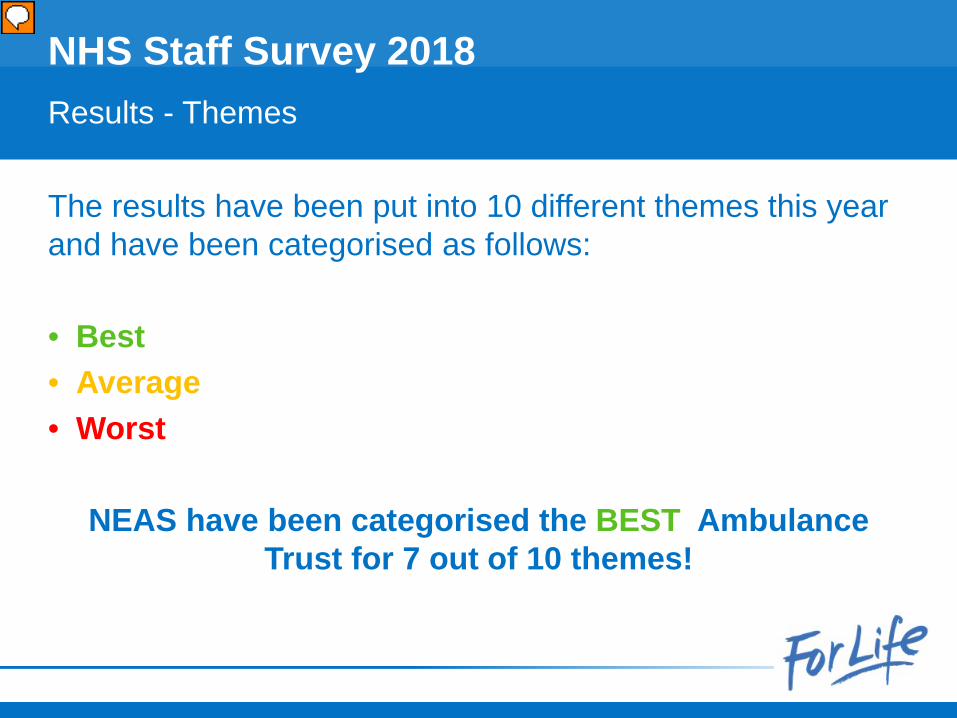
The results have been put into 10 different themes this year and have been categorised as follows:
• Best • Average• Worst
NEAS have been categorised the BEST Ambulance Trust for 7 out of 10 themes!
NHS Staff Survey 2018Results - Themes
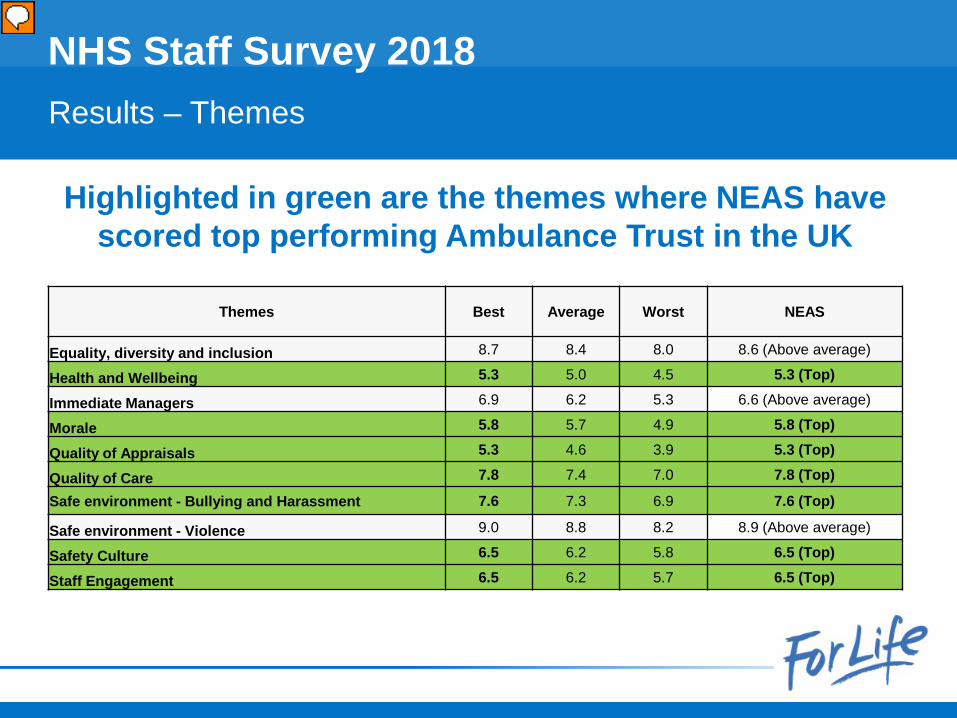
Themes Best Average Worst NEAS
Equality, diversity and inclusion 8.7 8.4 8.0 8.6 (Above average)
Health and Wellbeing 5.3 5.0 4.5 5.3 (Top)
Immediate Managers 6.9 6.2 5.3 6.6 (Above average)
Morale 5.8 5.7 4.9 5.8 (Top)
Quality of Appraisals 5.3 4.6 3.9 5.3 (Top)
Quality of Care 7.8 7.4 7.0 7.8 (Top)
Safe environment - Bullying and Harassment 7.6 7.3 6.9 7.6 (Top)
Safe environment - Violence 9.0 8.8 8.2 8.9 (Above average)
Safety Culture 6.5 6.2 5.8 6.5 (Top)
Staff Engagement 6.5 6.2 5.7 6.5 (Top)
NHS Staff Survey 2018Results – Themes
Highlighted in green are the themes where NEAS have scored top performing Ambulance Trust in the UK
NEAS – Highest scores
for 2018
NHS Staff Survey 2018
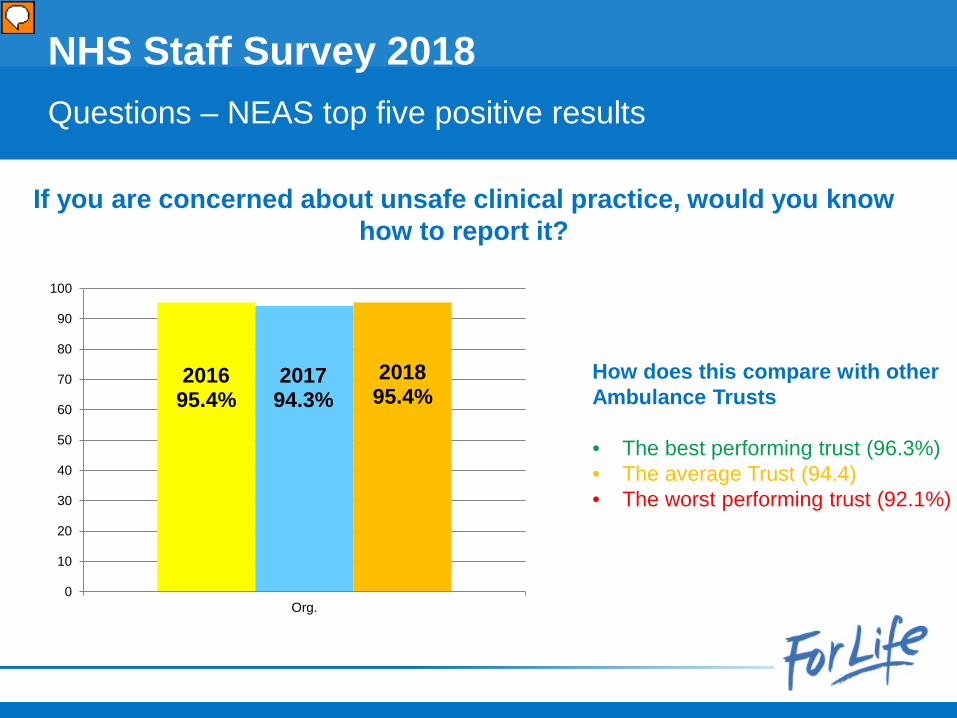
NHS Staff Survey 2018Questions – NEAS top five positive results
201695.4%
201794.3%
201895.4%
0
10
20
30
40
50
60
70
80
90
100
Org.
If you are concerned about unsafe clinical practice, would you know how to report it?
How does this compare with other Ambulance Trusts
• The best performing trust (96.3%)• The average Trust (94.4) • The worst performing trust (92.1%)
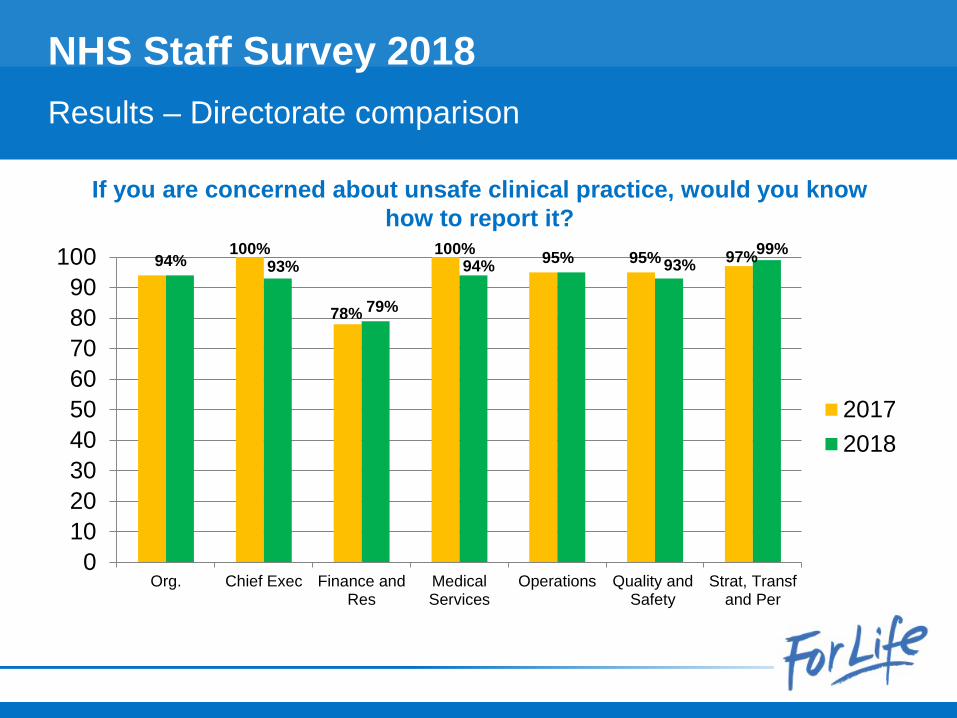
100%
78%
100% 95% 97%94% 93%
79%
94% 95% 93%99%
0102030405060708090
100
Org. Chief Exec Finance andRes
MedicalServices
Operations Quality andSafety
Strat, Transfand Per
20172018
NHS Staff Survey 2018Results – Directorate comparison
If you are concerned about unsafe clinical practice, would you know how to report it?
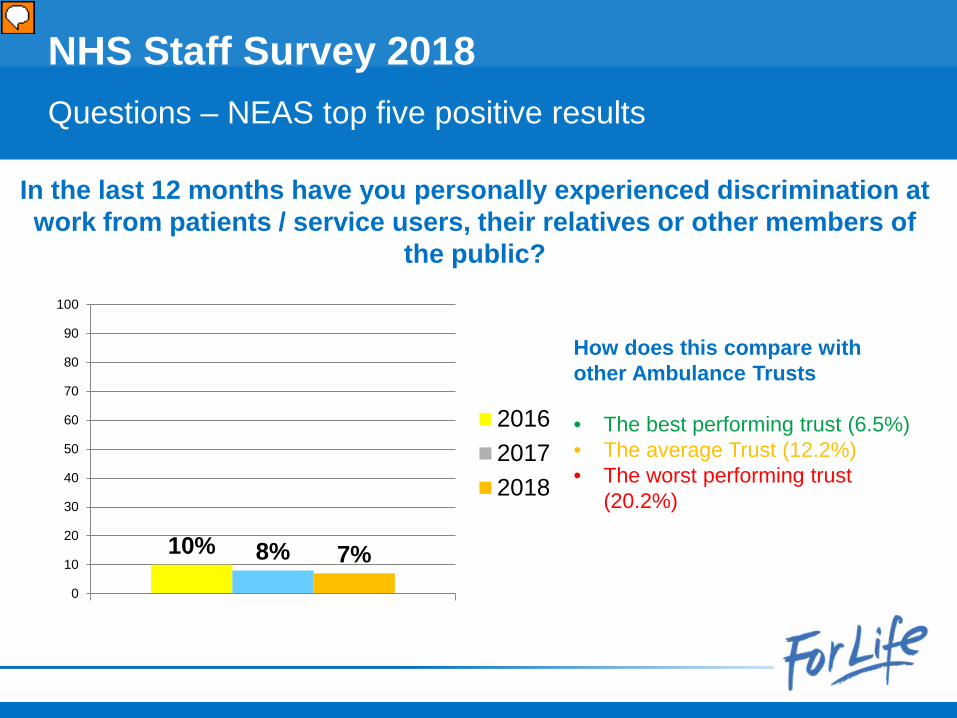
NHS Staff Survey 2018Questions – NEAS top five positive results
In the last 12 months have you personally experienced discrimination at work from patients / service users, their relatives or other members of
the public?
How does this compare with other Ambulance Trusts
• The best performing trust (6.5%)• The average Trust (12.2%) • The worst performing trust
(20.2%)
10% 8% 7%0
10
20
30
40
50
60
70
80
90
100
201620172018
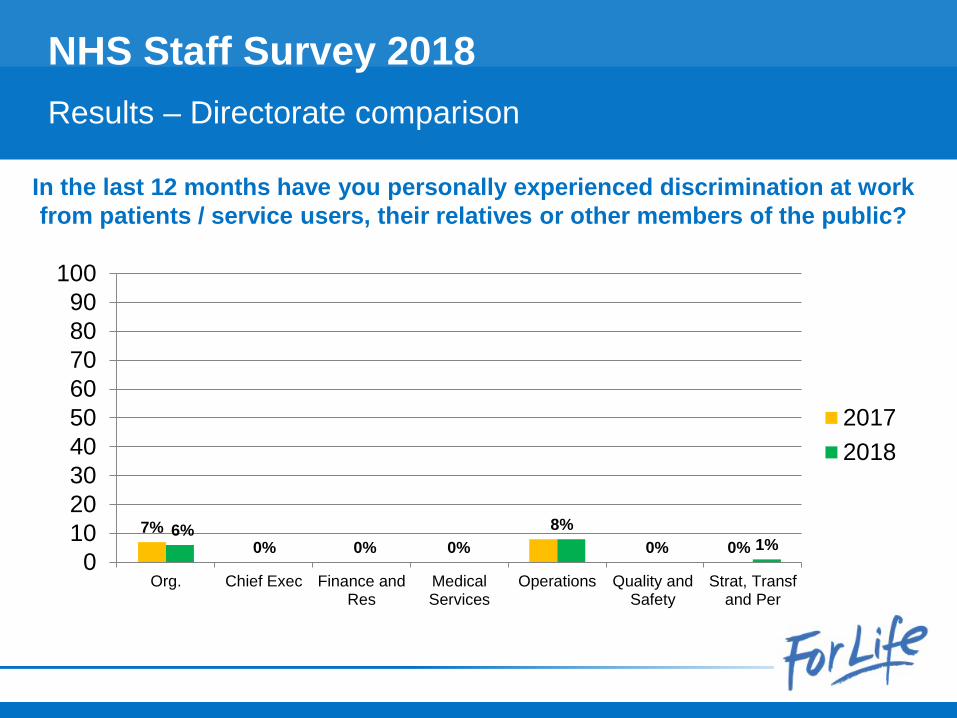
7%0%
6%0% 0% 0%
8%0% 1%
0102030405060708090
100
Org. Chief Exec Finance andRes
MedicalServices
Operations Quality andSafety
Strat, Transfand Per
20172018
NHS Staff Survey 2018Results – Directorate comparison
In the last 12 months have you personally experienced discrimination at work from patients / service users, their relatives or other members of the public?
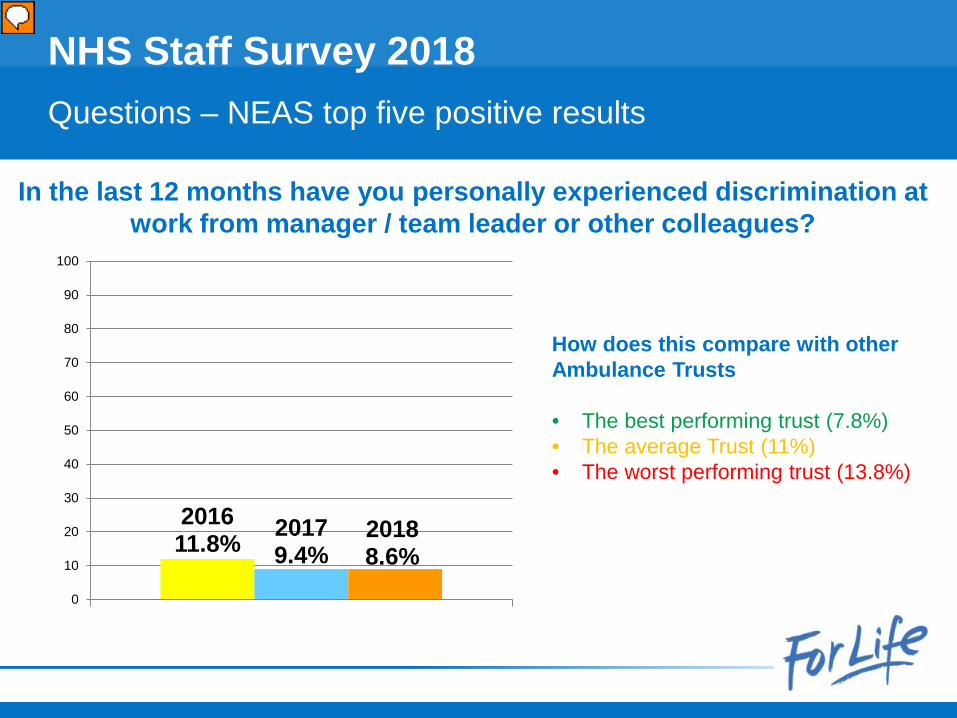
201611.8% 2017
9.4%20188.6%
0
10
20
30
40
50
60
70
80
90
100
NHS Staff Survey 2018Questions – NEAS top five positive results
How does this compare with other Ambulance Trusts
• The best performing trust (7.8%)• The average Trust (11%) • The worst performing trust (13.8%)
In the last 12 months have you personally experienced discrimination at work from manager / team leader or other colleagues?
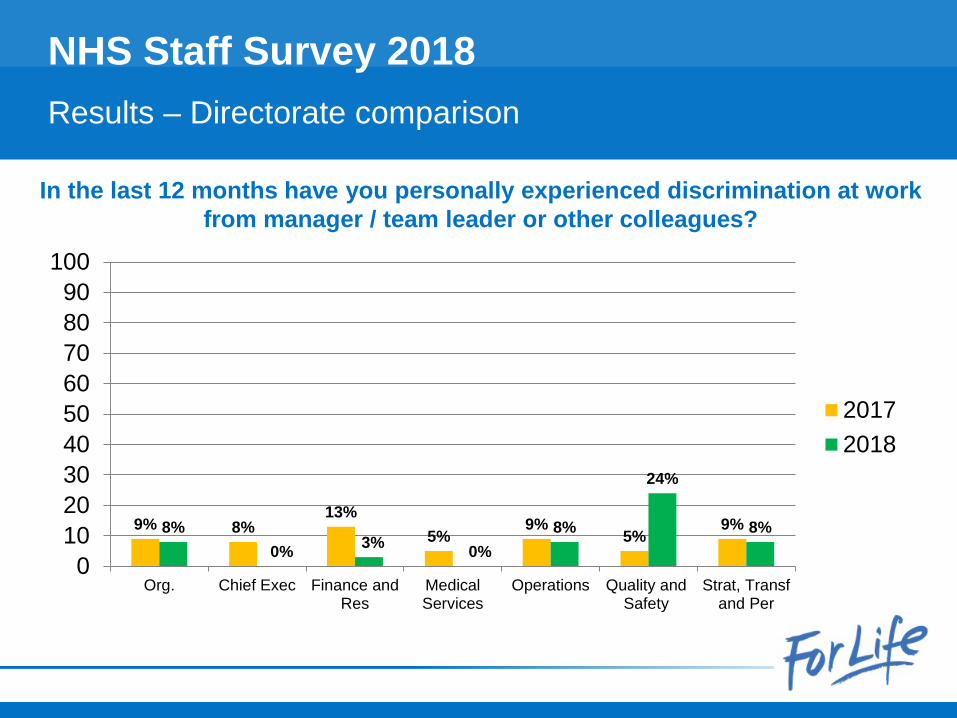
9% 8%13%
5%9%
5%9%8%
0% 3% 0%8%
24%
8%
0102030405060708090
100
Org. Chief Exec Finance andRes
MedicalServices
Operations Quality andSafety
Strat, Transfand Per
20172018
NHS Staff Survey 2018Results – Directorate comparison
In the last 12 months have you personally experienced discrimination at work from manager / team leader or other colleagues?
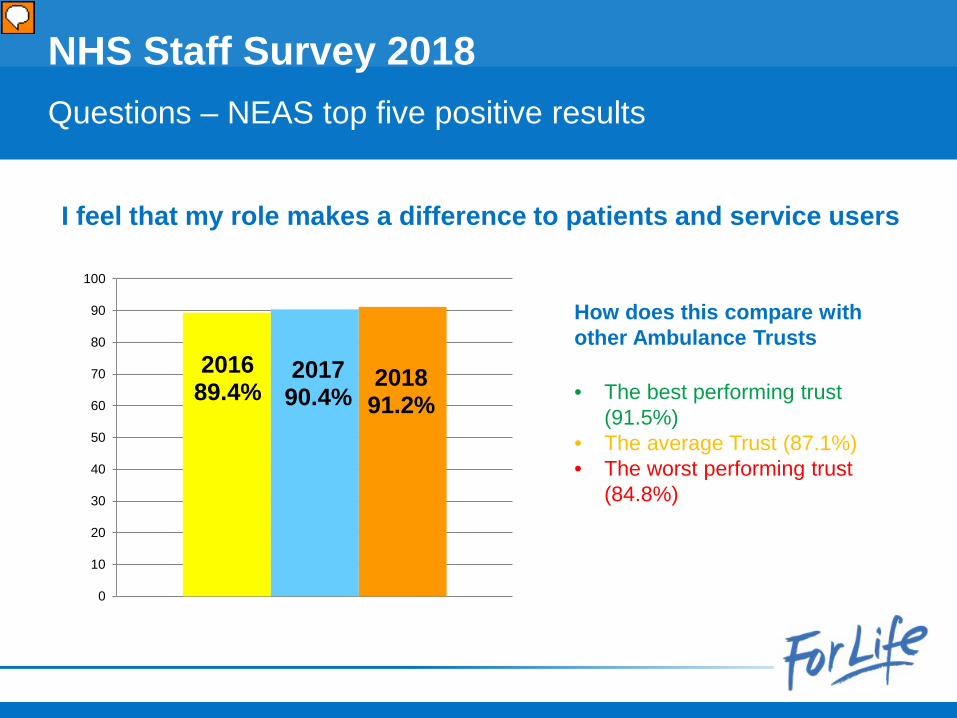
201689.4%
201790.4%
201891.2%
0
10
20
30
40
50
60
70
80
90
100
NHS Staff Survey 2018Questions – NEAS top five positive results
How does this compare with other Ambulance Trusts
• The best performing trust (91.5%)
• The average Trust (87.1%) • The worst performing trust
(84.8%)
I feel that my role makes a difference to patients and service users
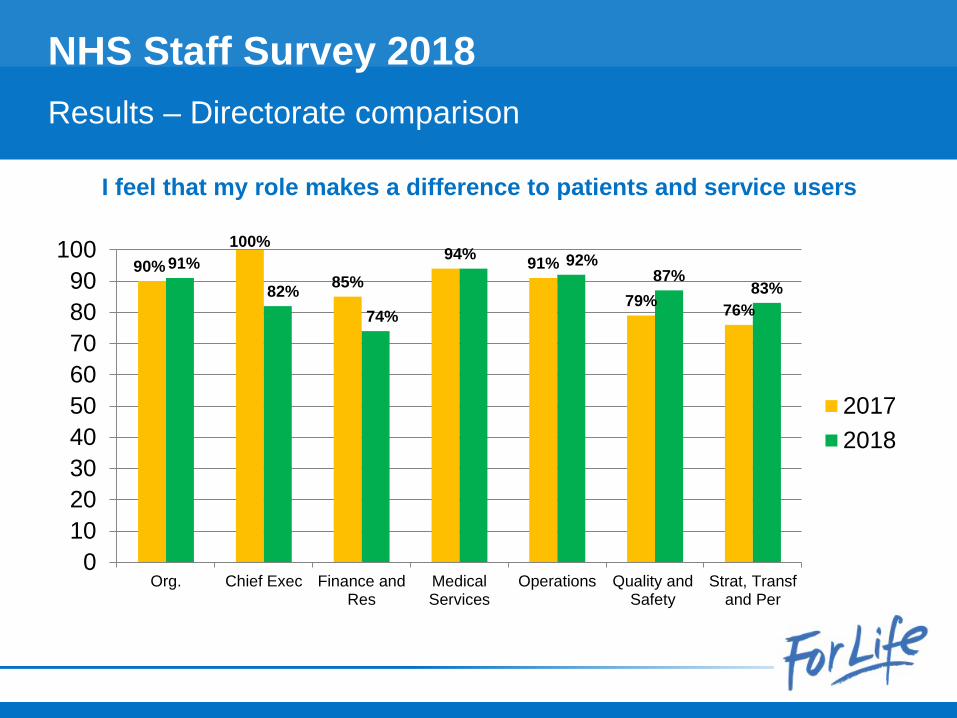
90%100%
85%94% 91%
79% 76%
91%82%
74%
92%87%
83%
0102030405060708090
100
Org. Chief Exec Finance andRes
MedicalServices
Operations Quality andSafety
Strat, Transfand Per
20172018
NHS Staff Survey 2018Results – Directorate comparison
I feel that my role makes a difference to patients and service users
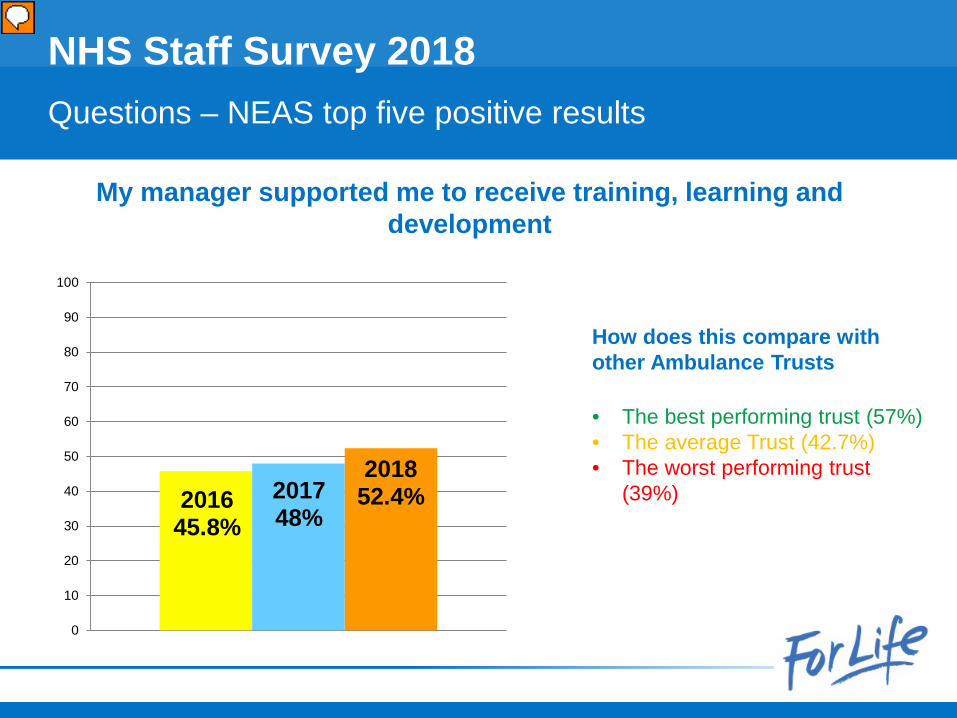
201645.8%
201748%
201852.4%
0
10
20
30
40
50
60
70
80
90
100
NHS Staff Survey 2018Questions – NEAS top five positive results
How does this compare with other Ambulance Trusts
• The best performing trust (57%)• The average Trust (42.7%) • The worst performing trust
(39%)
My manager supported me to receive training, learning and development
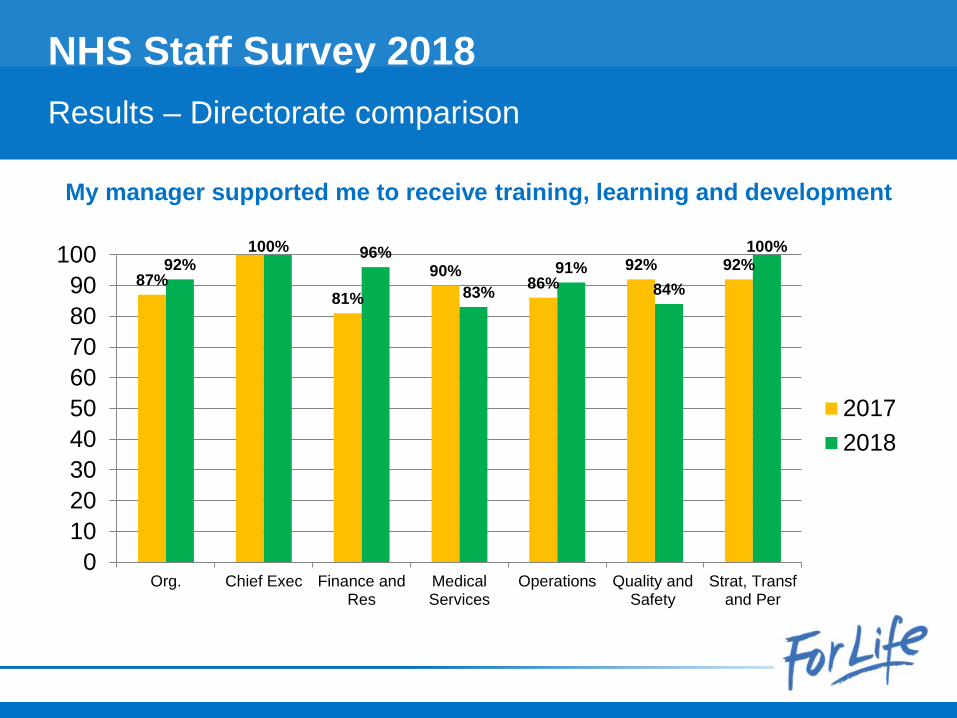
87%81%
90%86%
92% 92%92%100% 96%
83%91%
84%
100%
0102030405060708090
100
Org. Chief Exec Finance andRes
MedicalServices
Operations Quality andSafety
Strat, Transfand Per
20172018
NHS Staff Survey 2018Results – Directorate comparison
My manager supported me to receive training, learning and development
NEAS – The bottom FIVE
scores for 2018
NHS Staff Survey 2018
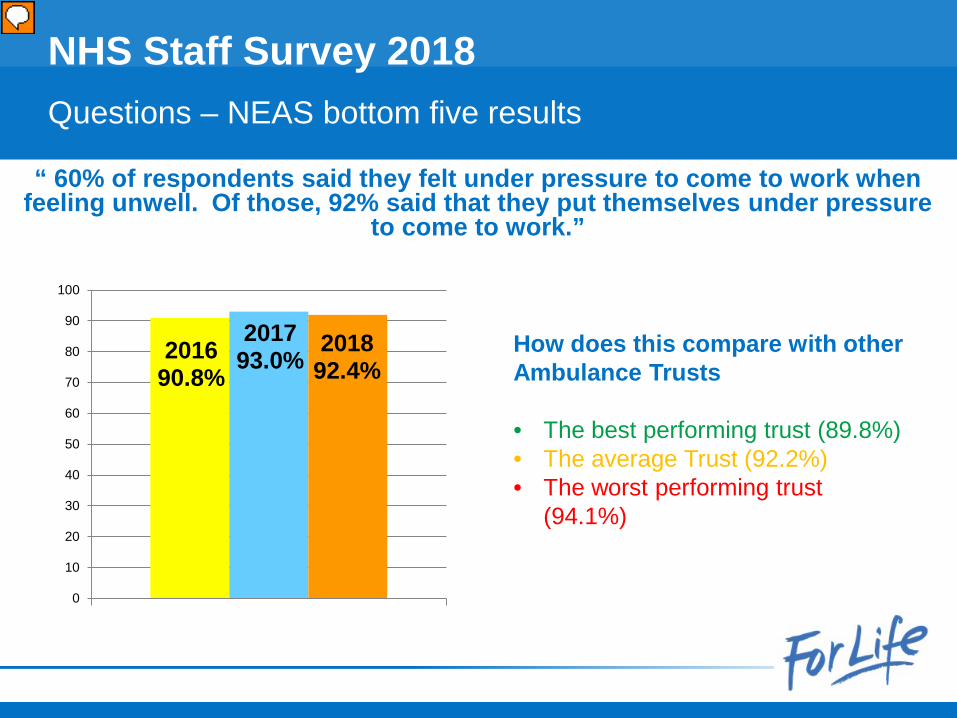
NHS Staff Survey 2018Questions – NEAS bottom five results
201690.8%
201793.0%
201892.4%
0
10
20
30
40
50
60
70
80
90
100
How does this compare with other Ambulance Trusts
• The best performing trust (89.8%)• The average Trust (92.2%) • The worst performing trust
(94.1%)
“ 60% of respondents said they felt under pressure to come to work when feeling unwell. Of those, 92% said that they put themselves under pressure
to come to work.”
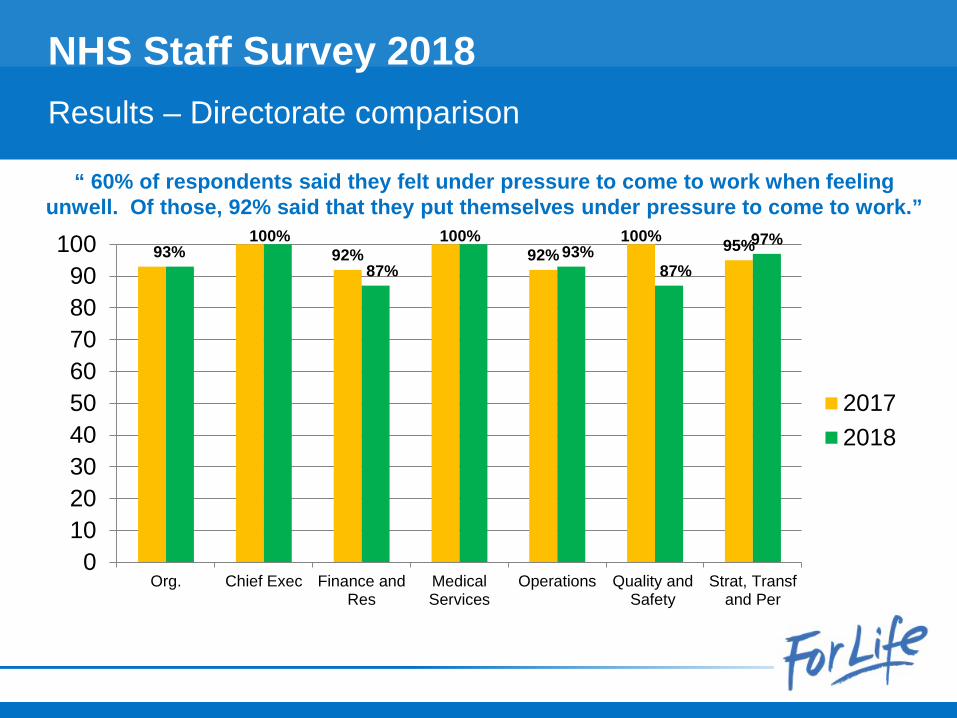
92% 92%100% 95%93%
100%
87%
100%93%
87%
97%
0102030405060708090
100
Org. Chief Exec Finance andRes
MedicalServices
Operations Quality andSafety
Strat, Transfand Per
20172018
NHS Staff Survey 2018Results – Directorate comparison
“ 60% of respondents said they felt under pressure to come to work when feeling unwell. Of those, 92% said that they put themselves under pressure to come to work.”
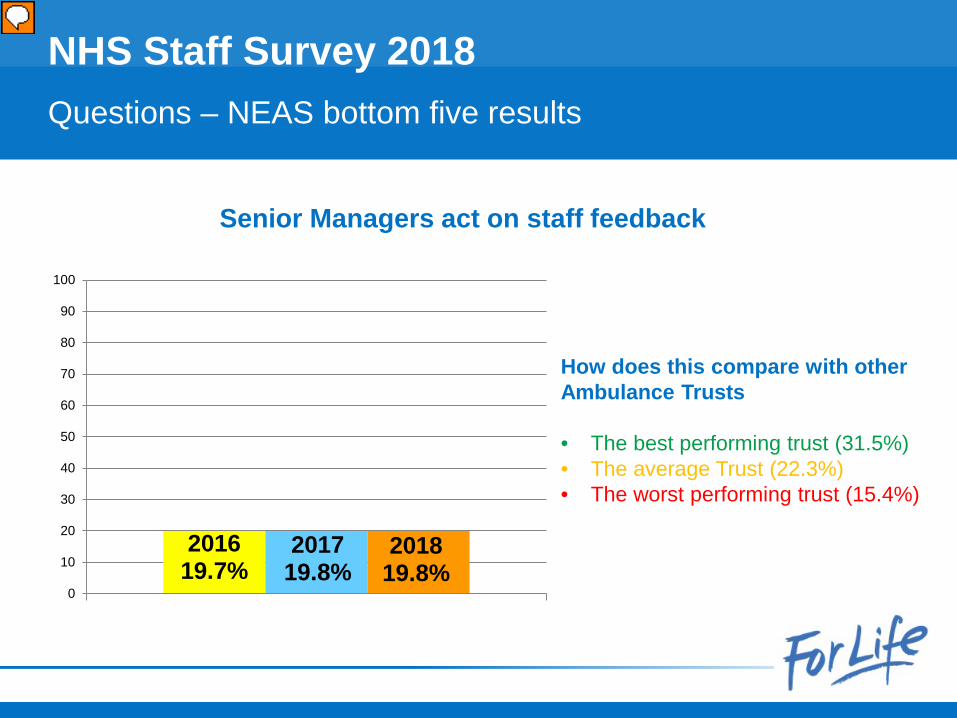
201619.7%
201719.8%
201819.8%
0
10
20
30
40
50
60
70
80
90
100
NHS Staff Survey 2018 Questions – NEAS bottom five results
Senior Managers act on staff feedback
How does this compare with other Ambulance Trusts
• The best performing trust (31.5%)• The average Trust (22.3%) • The worst performing trust (15.4%)
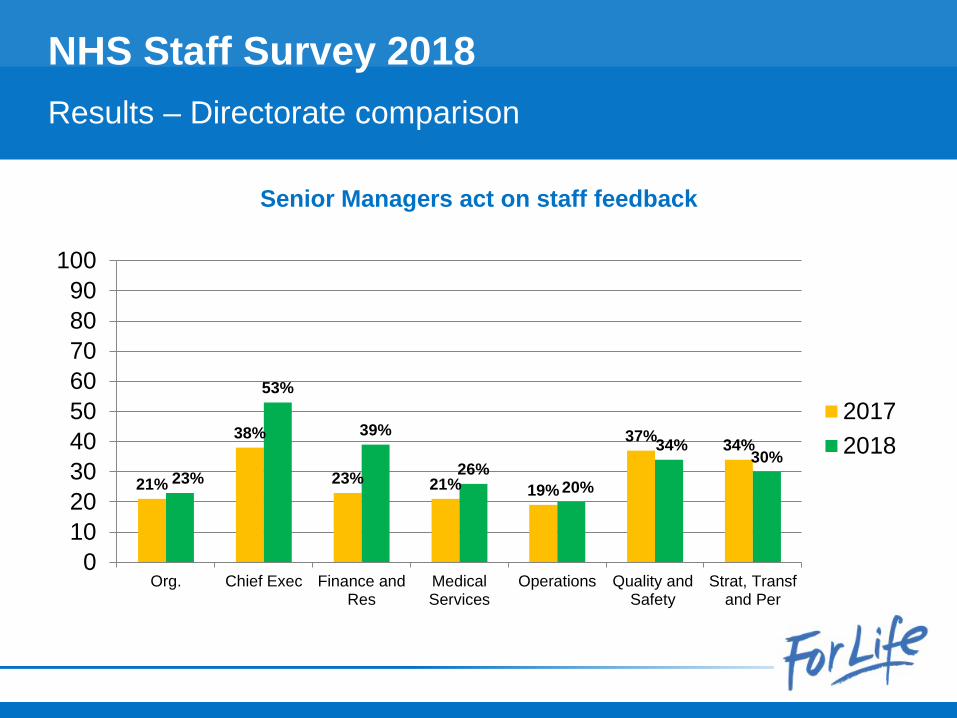
21%
38%
23% 21% 19%
37% 34%
23%
53%
39%
26%20%
34%30%
0102030405060708090
100
Org. Chief Exec Finance andRes
MedicalServices
Operations Quality andSafety
Strat, Transfand Per
20172018
NHS Staff Survey 2018 Results – Directorate comparison
Senior Managers act on staff feedback
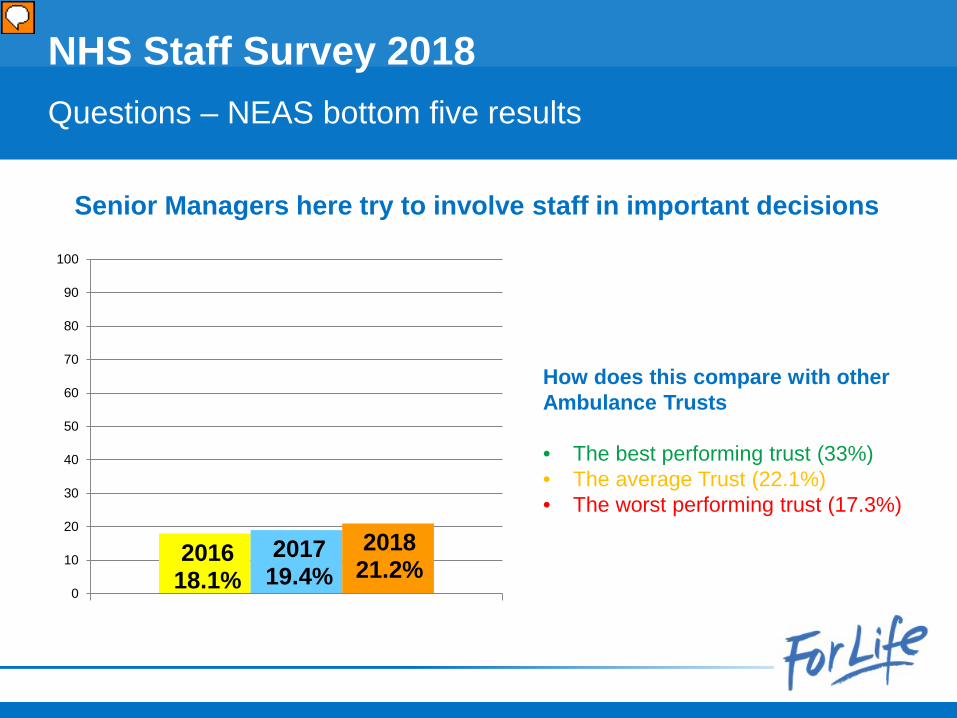
201618.1%
201719.4%
201821.2%
0
10
20
30
40
50
60
70
80
90
100
NHS Staff Survey 2018Questions – NEAS bottom five results
Senior Managers here try to involve staff in important decisions
How does this compare with other Ambulance Trusts
• The best performing trust (33%)• The average Trust (22.1%) • The worst performing trust (17.3%)
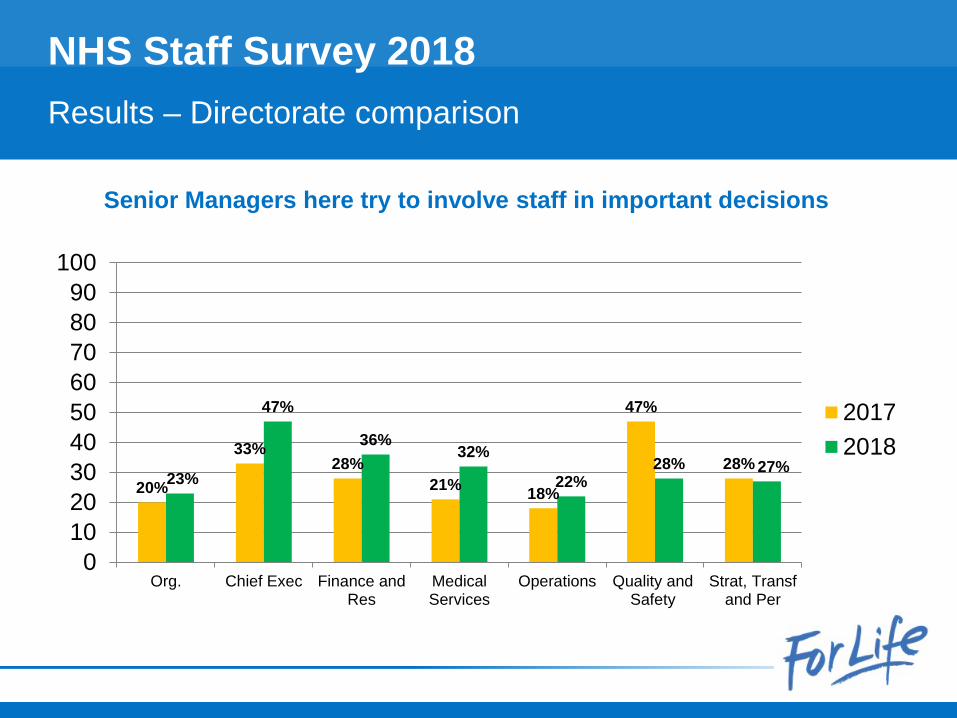
20%
33%28%
21% 18%
47%
28%23%
47%
36%32%
22%28% 27%
0102030405060708090
100
Org. Chief Exec Finance andRes
MedicalServices
Operations Quality andSafety
Strat, Transfand Per
20172018
NHS Staff Survey 2018Results – Directorate comparison
Senior Managers here try to involve staff in important decisions
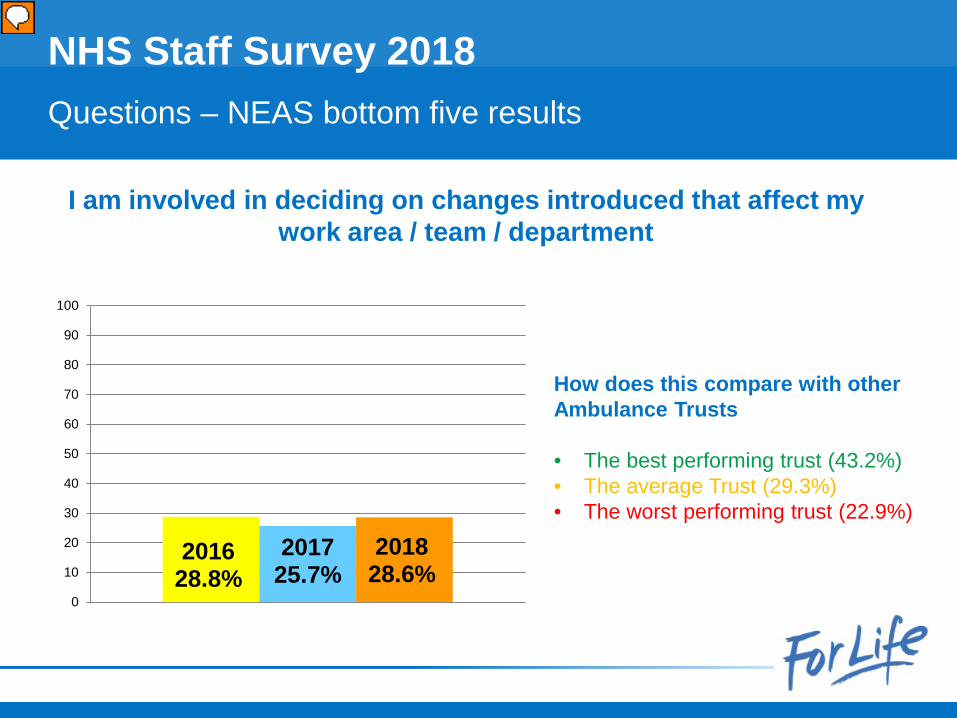
NHS Staff Survey 2018Questions – NEAS bottom five results
I am involved in deciding on changes introduced that affect my work area / team / department
How does this compare with other Ambulance Trusts
• The best performing trust (43.2%)• The average Trust (29.3%) • The worst performing trust (22.9%)
201628.8%
201725.7%
201828.6%
0
10
20
30
40
50
60
70
80
90
100
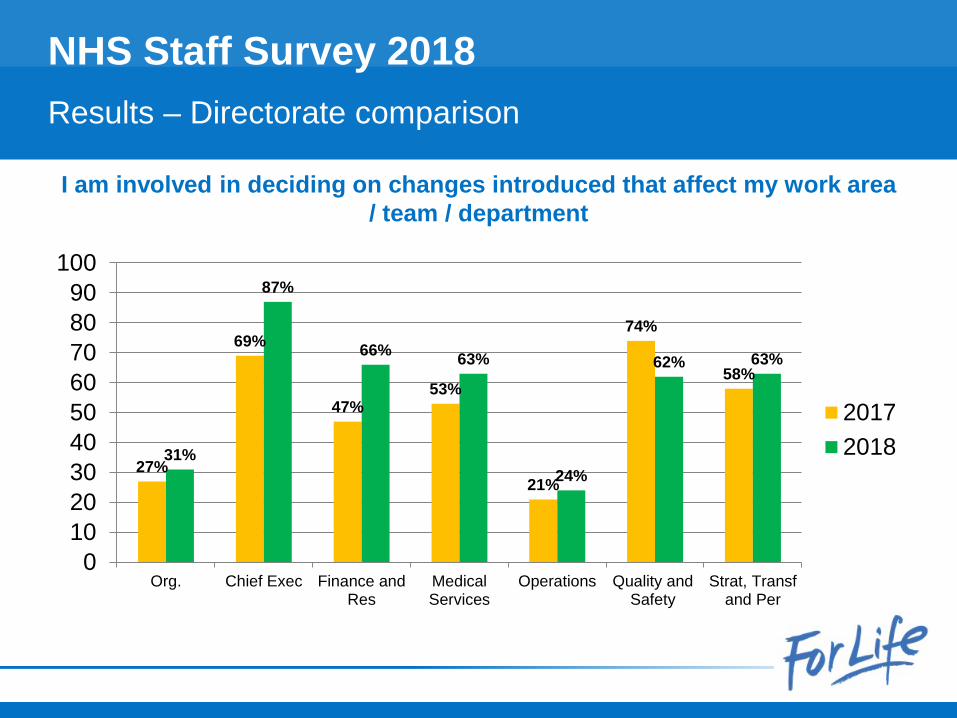
27%
69%
47%53%
21%
74%
58%
31%
87%
66% 63%
24%
62% 63%
0102030405060708090
100
Org. Chief Exec Finance andRes
MedicalServices
Operations Quality andSafety
Strat, Transfand Per
20172018
NHS Staff Survey 2018Results – Directorate comparison
I am involved in deciding on changes introduced that affect my work area / team / department
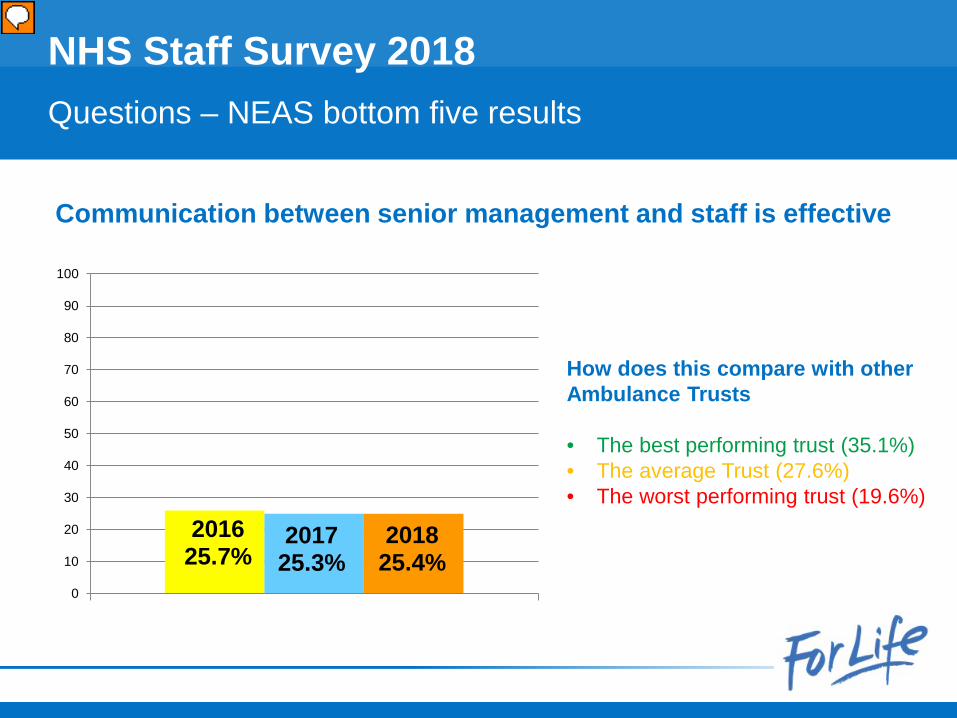
201625.7%
201725.3%
201825.4%
0
10
20
30
40
50
60
70
80
90
100
NHS Staff Survey 2018Questions – NEAS bottom five results
How does this compare with other Ambulance Trusts
• The best performing trust (35.1%)• The average Trust (27.6%) • The worst performing trust (19.6%)
Communication between senior management and staff is effective
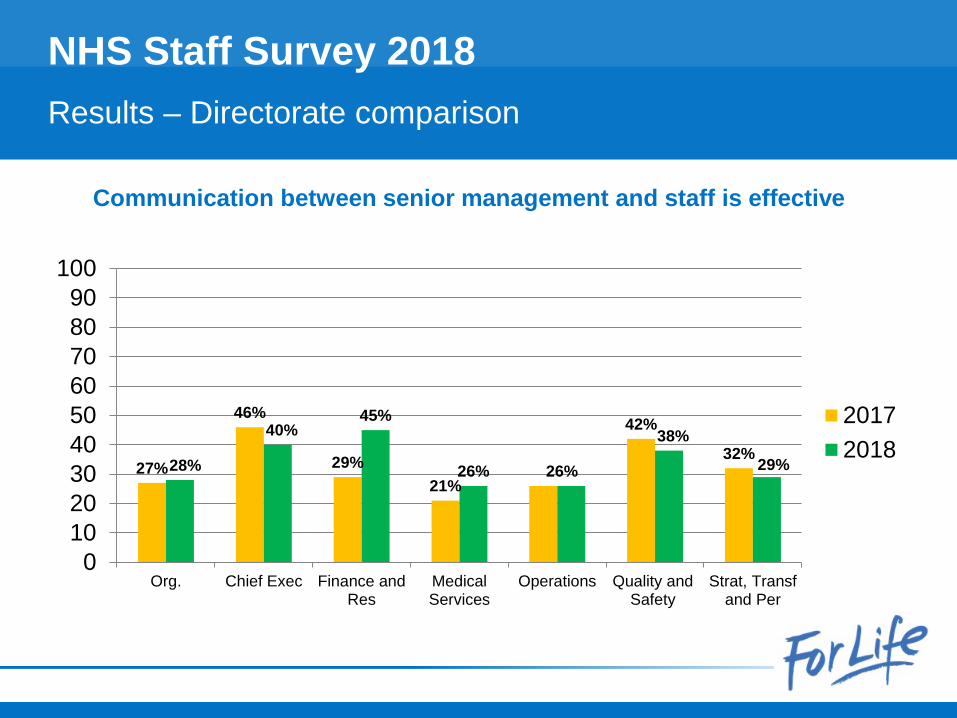
27%
46%
29%21%
42%
32%28%
40%45%
26% 26%
38%
29%
0102030405060708090
100
Org. Chief Exec Finance andRes
MedicalServices
Operations Quality andSafety
Strat, Transfand Per
20172018
NHS Staff Survey 2018Results – Directorate comparison
Communication between senior management and staff is effective
FIVE Significantly improved scores for 2018
NHS Staff Survey 2018
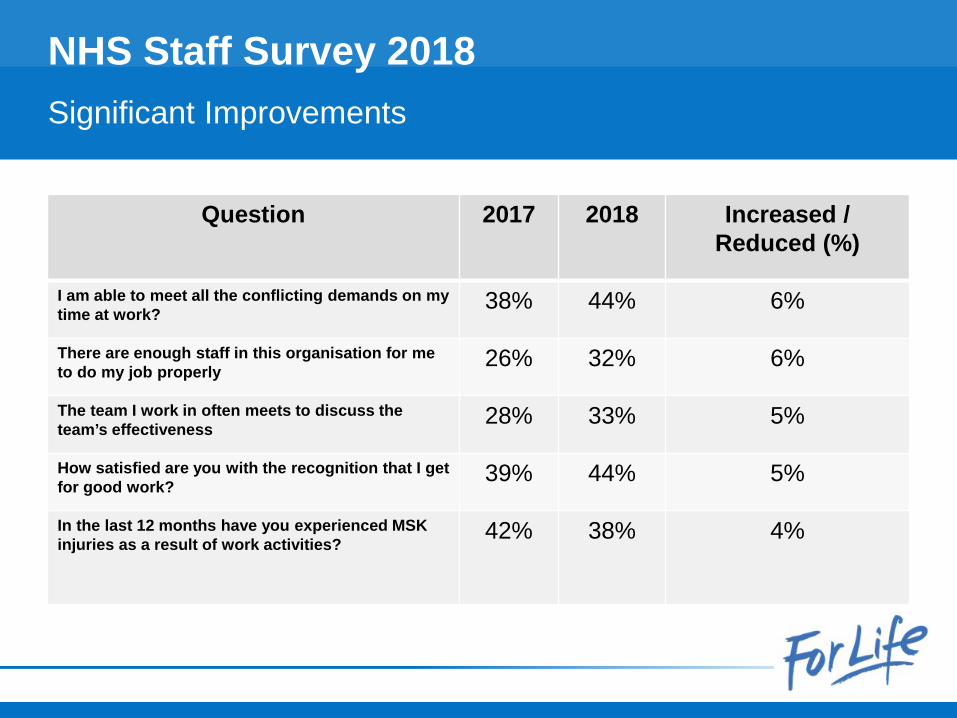
Question 2017 2018 Increased / Reduced (%)
I am able to meet all the conflicting demands on my time at work? 38% 44% 6%
There are enough staff in this organisation for me to do my job properly 26% 32% 6%
The team I work in often meets to discuss the team’s effectiveness 28% 33% 5%
How satisfied are you with the recognition that I get for good work? 39% 44% 5%
In the last 12 months have you experienced MSK injuries as a result of work activities? 42% 38% 4%
NHS Staff Survey 2018Significant Improvements
NEAS do not have any significant deteriorations scores for 2018.
NHS Staff Survey 2018Significant Deteriorations
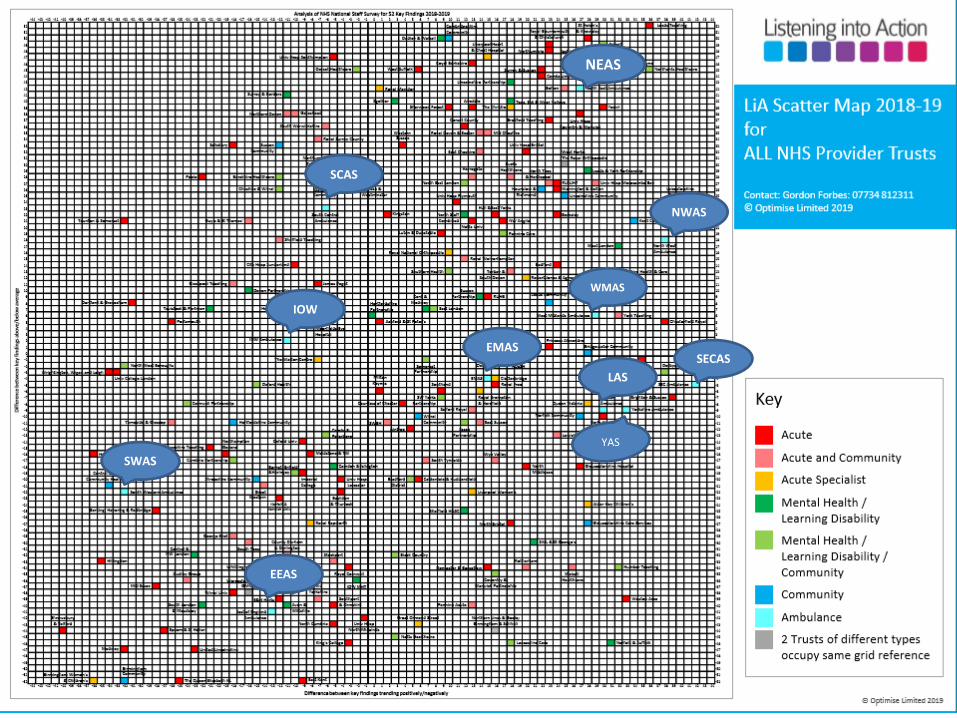
NEAS
NWAS
WMAS
SCAS
IOW
SECASLAS
EMAS
EEAS
SWASYAS
NHS Staff Survey 2018Recommendations for Action
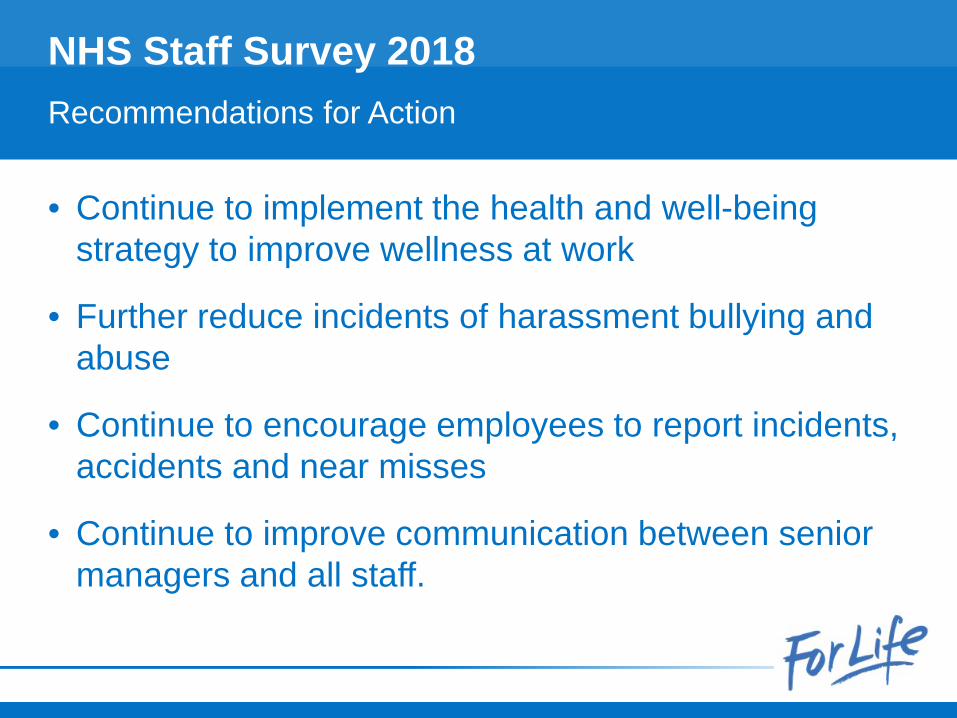
• Continue to implement the health and well-being strategy to improve wellness at work
• Further reduce incidents of harassment bullying and abuse
• Continue to encourage employees to report incidents, accidents and near misses
• Continue to improve communication between senior managers and all staff.
NHS Staff Survey 2018Recommendations for Action
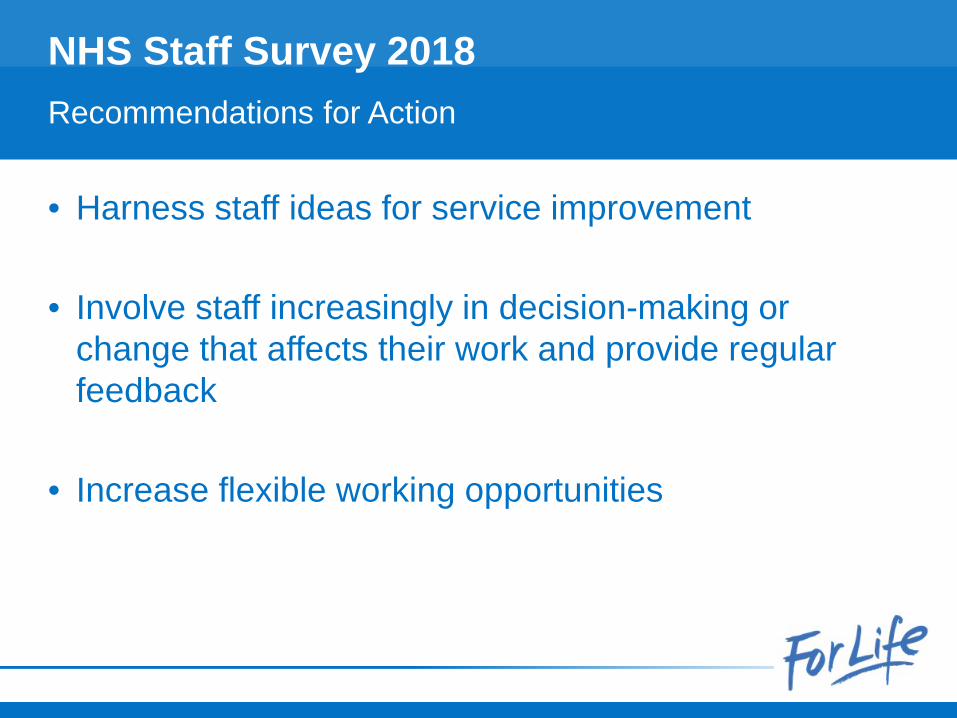
• Harness staff ideas for service improvement
• Involve staff increasingly in decision-making or change that affects their work and provide regular feedback
• Increase flexible working opportunities
NHS Staff Survey 2018Recommendations for Action
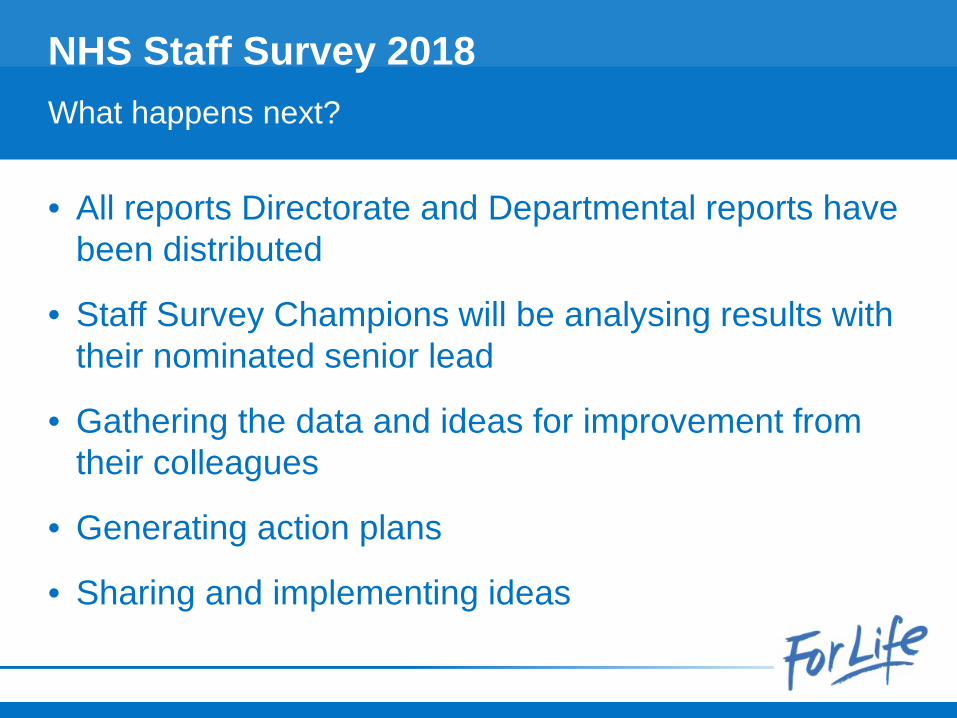
• All reports Directorate and Departmental reports have been distributed
• Staff Survey Champions will be analysing results with their nominated senior lead
• Gathering the data and ideas for improvement from their colleagues
• Generating action plans
• Sharing and implementing ideas
NHS Staff Survey 2018What happens next?
/North East Ambulance Service/North East Ambulance Service
© Copyright 2017 North East Ambulance Service NHS Foundation Trust
www.neas.nhs.uk/North East Ambulance Service @NEAmbulance