Embed Size (px)
Citation preview
Development of
Laser Vibrometer
Impact Testing of
High Level Waste
Canisters
thDirector, BARC talks to 59 batch
BARC Training School Graduates
ISSN: 0976-2108
N E W S L E T T E R
Bi-monthly • July-August • 2016


Editorial Committee
Chairman
Dr. G.K. Dey
Materials Group
Editor
Dr. G. Ravi Kumar
SIRD
Members
Dr. G. Rami Reddy, RSD
Dr. A.K. Tyagi, Chemistry Divn.
Dr. S. Kannan, FCD
Dr. C.P. Kaushik, WMD
Dr. S. Mukhopadhyay,
Seismology Divn.
Dr. S.M. Yusuf, SSPD
Dr. B.K. Sapra, RP&AD
Dr. J.B. Singh, MMD
Dr. S.K. Sandur, RB&HSD
Dr. R. Mittal, SSPD
Dr. Smt. S. Mukhopadhyay, ChED
C O N T E N T S
Scientists Honoured
Automation System for Fuel Pin Fabrication in Shielded FacilityDesign, Manufacturing& Automation Group and
Nuclear Fuels Group 1
6
2
10
15
19
30
29
25
Technology Development for the Alpha Decontamination of Raffinate of Metallurgical Waste by Hollow Fibre Renewable Liquid Membrane ProcessC.S. Kedari, B.K. Kharwandikar and K. Banerjee
Development, Validation and Application of Computer Code to Solve Population Balance Equations for Liquid-Liquid Dispersion by QMOMSourav Sarkar, K.K. Singh and K.T. Shenoy
Development of Laser VibrometerAseem Singh Rawat, Nitin Kawade
Impact Testing of High Level Waste CanistersP. P. Karkhanis and Kailash Agarwal
Technology Development of 500Kg Multi Axis Shake TableP. Ramakrishna, Shiju Varghese, Jay Shah,
P.K. Limaye and N.L.Soni
thDirector, BARC talks to 59 batch BARC Training School Graduates
thInauguration of 60 Batch OCES and th13 Batch OCDF

Automation System for Fuel Pin Fabrication in Shielded FacilityDesign, Manufacturing& Automation Group and Nuclear Fuels Group
|BARC Newsletter 2016 1| July-August
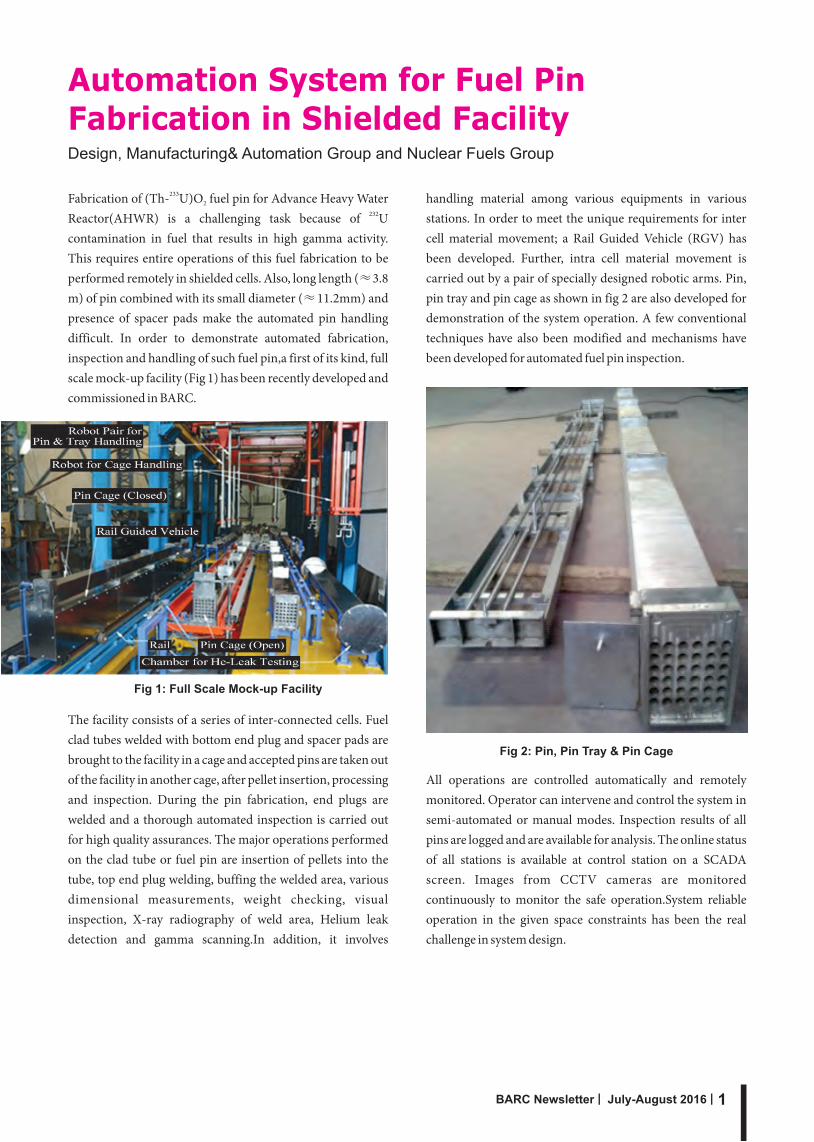
233Fabrication of (Th- U)O fuel pin for Advance Heavy Water 2232Reactor(AHWR) is a challenging task because of U
contamination in fuel that results in high gamma activity. This requires entire operations of this fuel fabrication to be performed remotely in shielded cells. Also, long length (≈3.8 m) of pin combined with its small diameter (≈11.2mm) and presence of spacer pads make the automated pin handling difficult. In order to demonstrate automated fabrication, inspection and handling of such fuel pin,a first of its kind, full scale mock-up facility (Fig 1) has been recently developed and commissioned in BARC.
handling material among various equipments in various stations. In order to meet the unique requirements for inter cell material movement; a Rail Guided Vehicle (RGV) has been developed. Further, intra cell material movement is carried out by a pair of specially designed robotic arms. Pin, pin tray and pin cage as shown in fig 2 are also developed for demonstration of the system operation. A few conventional techniques have also been modified and mechanisms have been developed for automated fuel pin inspection.
Fig 1: Full Scale Mock-up Facility
Fig 2: Pin, Pin Tray & Pin Cage
The facility consists of a series of inter-connected cells. Fuel clad tubes welded with bottom end plug and spacer pads are brought to the facility in a cage and accepted pins are taken out of the facility in another cage, after pellet insertion, processing and inspection. During the pin fabrication, end plugs are welded and a thorough automated inspection is carried out for high quality assurances. The major operations performed on the clad tube or fuel pin are insertion of pellets into the tube, top end plug welding, buffing the welded area, various dimensional measurements, weight checking, visual inspection, X-ray radiography of weld area, Helium leak detection and gamma scanning.In addition, it involves
All operations are controlled automatically and remotely monitored. Operator can intervene and control the system in semi-automated or manual modes. Inspection results of all pins are logged and are available for analysis. The online status of all stations is available at control station on a SCADA screen. Images from CCTV cameras are monitored continuously to monitor the safe operation.System reliable operation in the given space constraints has been the real challenge in system design.

thDirector, BARC talks to 59 batch BARC Training School Graduates
This is an interview given by Shri K.N. Vyas, Director, BARC thto the 59 batch BARC training school graduates. This
interview appeared in the trainees magazine kaarvan released thduring the graduation function of the 59 Training
School Batch. This is being reprinted here in the BARC Newsletter on the request of Head, HRDD and permission from Shri K.N. Vyas
Kaarvaan: Sir, you have received several awards and have played an important role in Nation's Nuclear Programme. Could you please share with us your experience and factors that have motivated you to put your greatest efforts?
Shri K N Vyas (Director, BARC): Dear friends, let me tell you that awards are the last thing on our minds and we only work with a sense of duty, devotion and passion towards achieving the objectives set forth by our leaders. Awards and recognition follow in the natural course to our efforts and contributions. I am grateful to my leaders and mentors who have guided and groomed me to reach a level of capability where I could make meaningful contributions and receive these awards.
I was fortunate to be motivated from an early stage thanks to the guidance and support of stalwarts such as Dr. Sekhar Basu (Chairman, Atomic Energy Commission and Secretary, Department of Atomic Energy), Shri A K Anand (former Director, Reactor Projects Group), and Shri S K Mehta (former Director, Reactor Group and a graduate from the first batch of BARC Training School). Sometime later, I had the good fortune of working with Shri V K Mehra, a graduate
thfrom the 13 batch of BARC Training School, under whose
|BARC Newsletter March-April 2016 1| |BARC Newsletter July-August 2016 2|
tutelage, I learnt many of the intricacies and nuances of reactor engineering and core design.
A little later, I started working on the design and development of a novel type of fuel. Let me admit that though I loved the challenge, I did have apprehensions about the feasibility and success of the new design. However, with considerable support from Atomic Fuels Division, we were able to fabricate and test the fuel successfully, giving me immense satisfaction. I thereafter developed some computer codes to predict fuel defects and failures, which were well matched by experimental observations, providing me another source of immense professional satisfaction.
Considering the fact that these were all projects of national importance, being monitored and scrutinized at the highest levels, they gave me immense satisfaction and kept me motivated and energized.
Kaarvaan: Could you please tell us about the major changes that you have observed in BARC as an organisation over the span of your career here?
Shri Vyas: The changes have mostly been positive - improvement in equipment's features and availability, a manifold improvement in computation capabilities and a vast improvement in the availability of channels of commmunications serving scientific needs. There was a time when we had to travel to Tata Institute of Fundamental Research, the other end of Mumbai to run our computer codes, a full day affair even at its best. Material characterisation was a slow and painstaking process due to the

lack of equipment and infrastructure. We are much better equipped now to carry out these tasks, thereby considerably speeding up and enhancing the work output . Of course, such changes are visible not only at our institution but all over the country, due to increased prosperity and advancement in various spheres. The manufacturing facilities at BARC have also kept pace with world trends and we have been able to deliver quality components with excellent performance characteristics to the FERMI Lab Project.
Of course, as the organisation ages, certain trends and behaviour patterns do crop up which may be slightly undesirable to the well being of an organisation. I do admit that there are many more diversions as compared to earlier times. However, such issues are being constantly addressed by the management and the overall sense of the organisation has always been postive and work oriented. This is proven by the fact that the average enhancement of knowledge level and work output has seen a steady improvement at all times.
Kaarvaan: Sir, which are the two or three major accomplishments that have given you the maximum satisfaction?
Shri Vyas: As already mentioned, the challenges in providing a novel fuel design towards which I was fortunate to make a significant contribution gave me immense satisfaction. There have also been other aspects of my work, the details of which cannot be fully divulged due to their strategic nature. There was one particularly challenging assignment, involving the design of equipment for functioning under extremely severe conditions while its size and weight were to be kept as low as possible. Its functioning was not only crucial to overall project, but any delay caused due to likely failure had huge implications for the successful completion of the project. However, all went off well due to the great team work and dedication and the rest as they say is history.
Kaarvaan: Sir, what in your opinion is the best possible yardstick or parameter for assessment of growth of BARC?
Shri Vyas: I personally belive that we have the skills, talent and the resources to deliver what is good for the society. This should be the aim and objective of our Institution. It is neither necessary nor advisable to measure every activity with a yardstick of performance. However, there is no doubt that the overall direction of our research should lead to the betterment of society in the long run. No society can consider itself to be evolved unless it wipes the tear of the every man women and child. People toil hard and long to make a livelihood, in fields, farms and factories and we owe it to them to give back to the society what we take from it. The least we can do is to ensure the timely completion of projects, or even early completion, for every day saved in implementation of projects translates
|BARC Newsletter July-August 2016 3|
into huge dividends to the society. I do agree that basic science research cannot fetch tangible benefits in the immediate future. However, great science produces great benefits, as evidenced by the Einstein's famous mass-energy equivalence
2relation E= mc , the impact of which to the society and world history has been phenomenal.
Kaarvaan: In his speech on the National Technology Day Dr. C. Ganguly stated that our work force has good technical skills but lacks in financial management skills. Being an active researcher, do you agree with this view and as Director, BARC, what suggestions would you make to strengthen managerial skills amongst the employees?
Shri Vyas: Dr. C. Ganguly has proven to be an excellent manager while also being an accomplished academician. His record of transforming the work culture and productivity at NFC has been spectacular. He brought these about by leveraging the active involvement of the employees and devising simple indigenous solutions to difficult and complex problems. Due to the process initiated by him, Nuclear Fuel Complex today has become one of the largest fuel producing plants in the world. The lessons in management education focus upon 'being better organized' and 'harnessing the minds and resources' to maximize the returns with the efforts invested. Dr. Ganguly succeeded in the application of this simple principle, in achieving increased production at NFC. In my opinion, we are sometimes lost in the continuous loop of efforts, trying to achive perfection, thereby losing precious time and causing delays in the completion of projects. In this context, I am reminded of the adage 'better is the enemy of the good', as a result of which the better perhaps never gets delivered. We must avoid this mindset and sometimes decide to take a leap of faith.
Coming back to Dr. Ganguly's point, good financial management dictates that output should be maximized within the constraints of available funds. While the curriculum at the training school educates us on carrying out a technical task to the best of our capability as an individual, it doesn't equip us to deal with aspects such as cash flows and financial optimisations, which in my view are very crucial in the execution of large projects. Dr. Ganguly was perhaps hinting at widening our horizons along these lines as well so as to be able to achieve sure success in the execution of large scale nuclear projects.
Kaarvaan: Sir, is there any possibility of incorporating such topics into the curriculum through lectures or workshops?
Shri Vyas: In fact, there exist such mechanisms even today in our system whereby future leaders with discernible management capabilities are identified and deputed for training to management institutes. However, it does take considerable effort to modify the established mindsets of

researchers with 20-25 years of experience. The results have been mixed and outcomes have not always been commensurate with expectations.
Kaarvaan: Sir, do you see any possibility of the creation of a cadre based service like the Indian Administrative Service (IAS), ie Indian Nuclear Services (INS)?
Shri Vyas: Though it sounds as a good proposition, I have my own doubts about its acceptability. Deploying nuclear professionals everywhere in the country as is done in the case of IAS would have numerous limitations. The BARC Training School has stood the test of ages for generating industry ready professionals with 'homogenous thinking' across a breadth of topics. There are numerous examples of cross domain work profiles, physicists often taking up challenging assignments in reactor engineering if the need arises. Similarly, engineering graduates are ready to take up assignments outside their core disciplines after completion of the training school programme. The speciality of our training programme has been its capability to orient every incumbent in a manner that facilitates the understanding of the complexities of other disciplines. At present, I feel that we should continue with the present system which has delivered over a long run.
Kaarvaan: Sir, as you know some projects of Department of Atomic Energy (DAE) have had faced considerable public opposition, which has led to long delays and substantial monetary losses. What should be the mandate of BARC in this regard to create awareness about nuclear energy so as to gain wider public acceptance?
Shri Vyas: One of the ways of achieving this is to engage with all sections of the society in a continuous and interactive manner, informing and educating them on the benefits of our programmes. We are putting considerable efforts in this direction. However, the issues are not always very simple. To borrow an analogy, we know that a politician from outside the region is not easily accepted by the locals, not withstanding his credentials. So also is with our programmes. Ever so often, we identify a site and send a team to commence preliminary work. However, the presence of our personnel, most of whom are branded as 'outsiders', as per the local understanding, is not easily accepted, the locals often fearing for their land and
|BARC Newsletter July-August 2016 4|
their livelihood. This is further exacerbated by vested interests, who infilterate the local population and spread falsehoods and misconceptions about nuclear energy. Radiation itself being unseen, provokes an irrational fear in the minds of many. I have in fact noticed this fear even in brave soldiers, who are otherwise not afraid to face bullets in the battlefield. This situation requires continuous and sustained campaigning from our side to gain the confidence and trust of the people. There are no quickfix solutions and we are constantly endeavouring to do what it takes to address this issue.
Kaarvaan: Sir, what in your opinion is the best way to cope up with reluctance and inhibitions in the minds of fresh graduates regarding joining DAE?
Shri Vyas: Probably many of the engineering graduates feel that the work in BARC or DAE does not have too many engineering applications and that it relates more to basic sciences and research. The truth is that our activities encompass both engineering and fundamental research to equal degrees. I hope that you too share this opinion of mine. This is again a matter of public perception. We have been arranging outreach programmes to inform the aspirants in a straight forward and lucid manner about our activities, it's strengths and weaknesses. DAE is unique in the sense that, in contrast to other government departments, in the matters pertaining to science and technology, hierarchy has literally no role to play. If one possesses expertise, competence and foresight pertaining to an area of research, he/she is allowed to pursue the same irrespective of the seniority in the hierarchy.
A large number of intelligent and talented youngsters like you join us every year and we should not be overly concerend about those who suffer from inhibitions about being a part of the DAE family?
Kaarvaan: What do you think is the best way to utilize the research potential of a scientist in case he/she has research interests other than in the area offered under the work demanded?
Shri Vyas: When you are young, your thoughts are not driven by an objective analysis of facts. To classify work as good or bad is not a proper assessment of the work profiles involved. The work domains involved are many and varied, each offering its own challenges and satisfactions. I would like to assure you that we treat all domains on an equal footing and urge you to avoid such a thought process and mindset. However, let me assure you that in some cases where there is a genuine mismatch, efforts are made to realign work profiles to suit the officer's strengths after due consideration. There are also avenues for relocations to other Groups/Divisions if and when required. In short, I would like to emphasise that with your skills, intelligence and talents, most of you would excel in

any domain you are placed in, if you are willing to put in the hard work required to succeed.
Kaarvaan: Sir, what aspirations are you setting to keep the momentum going in the years ahead?
Shri Vyas: Aspiration is rather a strong word to be used in this context. Actually, the nature of the sector and the types of complex problems required to be solved means that the work needs to be carried out over the long term in a sustained manner. There are no quick solutions. Our motto is to excel in whatever task we carry out without feeling the necessity for setting short term artificial targets which do not serve any useful purpose.
BARC extends continuous support to other organizations in the DAE. Since our main objective is to add pace to DAE's nuclear power programme, NPCIL naturally derives the maximum support from us. Organizations like HWB and NFC are beneficiaries of our basic and applied research in several areas including materials' research, setting up prototypes and bringing out technologies to the level of maturity for deployment. Our chemical engineers have developed solvents for fuel reprocessing, with collaboration with HWB and there are numerous other such examples.
Apart from this Dr. Basu (AEC Chairman) has taken the initiative to maximise the societal benefits of the nuclear energy programme as well as support to other non-DAE organisation in their programems.
To give an example, BARC, at the behest of ISRO, has helped in development of a Lithium ion battery and the technology has been transferred to a company which will soon be
|BARC Newsletter July-August 2016 5|
manufacturing the batteries. We also aim to help NALCO in extracting valuable minerals (other than aluminium), for which the technology is being developed. Furthermore, large amount of work has been carried out in Physics related to Materials Sciences using synchrotron radiation sources and by utilizing beam lines which are exclusively constituted for our experiments.
BARC has also developed a low cost membrane filter to primarily treat radioactive wastewater before disposal. This technology was transferred last month for the purpose of desalination of of sea water. A similar membrane had been earlier develped for purification of brackish water. Our scientists are continuously and passionetely striving to deliver benefits to the society with a variety of applications.
BARC is known for its rich scientific legacy. The reputation and prestige associated with the post of Director BARC is primarily on account of the collective efforts and minds of more than 4000 scientists and engineers supporting him in his endeavours. This is the strength of BARC. We shall always strive collectively to follow a path of providing solutions to the problems not only of the Department but of the entire nation.
Kaarvaan: Sir, any message you may like to deliver to the trainees and soon-to-be-inducted scientists and engineers.
Shri Vyas: Try to give your best to the unit of DAE that you would be joining. Never forget that you are amongst the best in the country. Be disciplined and hardworking, so that you can hold your head high at all times.
I wish you all the best!
Jai Hind!

Technology Development for the Alpha Decontamination of Raffinate of Metallurgical Waste by Hollow Fibre Renewable Liquid Membrane ProcessC.S. KedariFuel Reprocessing DivisionB.K. KharwandikarProcess Development DivisionK. BanerjeeNuclear Recycle Group
In the metallurgical waste processing facility(MWPF) a fluoride bearing, highly salted (due to Ca, Mg and Al nitrates), acidic and alpha active raffinate solution is generated. This waste solution contains residual quantity of Pu and Am. A hollow fibre renewable liquid membrane(HFRLM) process has been developed and tested with an actual 5 L raffinate solution from MWPF to diminish its alpha active nature. After treatment, the raffinate is totally depleted from Pu whereas, 37 Bq/mL alpha activity remained is due to traces of Am-241. Further evaluation for the alpha decontamination of product solution is under progress.
Introduction
Metallurgical process of Pu generates large quantity of alpha active waste in the form of slag and broken magnesium crucibles(metallurgical waste, MW). A dedicated facility (metallurgical waste processing facility, MWPF) has been created in FRD/BARC to treat this waste to facilitate its final disposal. The raffinate solution generated in the process of MWPF carries residual quantity of Pu and Am, in presence of a very high concentration of Ca, Mg and Al nitrates. Storage obligation of this alpha bearing solution is an economical liability and great concern of radiological safety. Conventional methods of separation, such as solvent extraction, ion exchange, precipitation, etc. are not economically as well as technically suitable to extract Pu and Am from such a low concentration and highly salted solutions. Liquid membrane(LM), a process intensification technology is mainly focused on the replacement of large, expensive and energy intensive equipments with that of cheaper and more efficient apparatus1. This technology provides feasibility to combine multiple operations in a single unit2. Hence, for obtaining the alpha decontamination of raffinate solution of MWPF a LM process with it's more recent configuration i.e. hollow fibre renewable liquid membrane (HFRLM) is developed. The metal ion carrier chosen for the LM process is N,N,N′,N′-tetra-2-ethylhexyl diglycolamide (TEHDGA) whereas, a complexing reagent Diethylene Triamine Pentacaetic Acid (DTPA) along with lactic acid(LA) are used in the receiving solution(Fig.1).
Experimental
Reagents: Lactic acid, dodecane and DTPA and TEHDGA where procured from a local supplier. The raffinate solution was obtained from MWPF with the composition described in Table 1. Specifications of Hollow fibre membrane support are given in Table 2.
Procedures: All HFRLM experiments were carried out in a glove box. Indigenously assembled membrane system(Fig.2), equipped with two pumps, pressure gauges, rotameters and hollow fibre membrane module was used. Feed (a raffinate solution) was kept re-circulating through shell side of the membrane module where as an emulsion of strip solution with organic extractant was flowed in closed loop through the lumen side of the hollow fibres. About 0.2 bar higher pressure
Receiving solution: an emulsion of(DTPA+LA)+(TEHDGA+IDA+dodecan Feed solution:
5 L raffinate solution of MWPF
1
2
22
2
3
3
44
5 6
7
Feed
Aqueous strip solution
Organic LM phase in
fibre lumen and pores
Cross section of
hollow fibre module
ShellM-DTPA TEHDGA-M
TEHDGA IDA
dodecane Na
+ OH
- H
+ DTPA
+
Emulsion
TEHDGA+IDA+ dodecane
Lumen LM
H+
HNO3
M(NO3)Mn+ 30 LPH20 LPH
7
Fig.1 Schematic diagram of HFRLM process
|BARC Newsletter July-August 2016 6|

Module reference Liqui-cel extra flow 2.5 × 8Porosity of the membrane 40%Material of the fibres PolypropyleneNumber of fibres 10,000 Membrane contact area 1.4 m2 Membrane thickness 40 µm Priming Volumes Shell side – 300 mL and Tube side – 200 mL (included
volume of connecting tubes)
was always maintained at shell side of the membrane module to restrict entrainment of organic phase to the feed solution. Samples were withdrawn from both feed and receiving solutions at fixed intervals. The pH of the aqueous part of receiving phase was monitored and maintained >3 by the addition of NaOH pallets. Concentration of Pu and Am were determined by alpha and gamma radiometry respectively. All other metal ions were determined by ICP-OES Spectrometer. The pH in the aqueous solution was measured by Metrohm 692 pH/ion meter.
The permeability coefficient, K of Am was obtained f
graphically using equation
1
The concentrations of Am in the feed solution at 0 and t hours are represented by [Am] and [Am] respectively. A and VF F,0 F,t
are effective area of the membrane and volume of feed solution respectively.
Table 1: Composition of the raffinate solution(5 L) received from MWPF (before and after HFRLM treatment)
MWPF Raffinate
[HNO3], [Am], [Pu], [Th], 137Cs [Al], [Ca], [Mg],
M mg/L mg/L mg/L µCi/L g/L g/L g/L
Initial 1.2 1.8 2.57 235 44.8 21.3 6.27 16.8
After Cycle I
0.55 15.59*
(115) ** BDL BDL 44.8 20.5 5.62 16.8
After Cycle II
0.35 0.010*
(180000)** BDL BDL 44.3 20.4 4.30 16.0
*, values are in unit µg/L, **, values given in parenthesis are the decontamination factors
Table 2: Specifications of hollow fibre module used
Fig. 3: Concentration profile of feed solution on time scale for cycle I
0.0
0.4
0.8
1.2
1.6
2.0
0 2 4 6
[Am
], m
g/L
Time, hr
1.8 mg/L
15.6 µg/L 0
20
40
60
80
100
0 2 4 6
% r
em
ova
l o
f A
m
Time, hr
99.6 %
0.0E+00
4.0E+06
8.0E+06
1.2E+07
1.6E+07
0 2 4 6
Bq
/mL
Time, hr
1.36 × 10⁷
118520 Bq/mL
Bq/mL
Fig.2: Hollow Fibre Renewable Liquid Membrane
equipment with process solutions
|BARC Newsletter 2016 7| July-August
Receiving phase
Feed solution
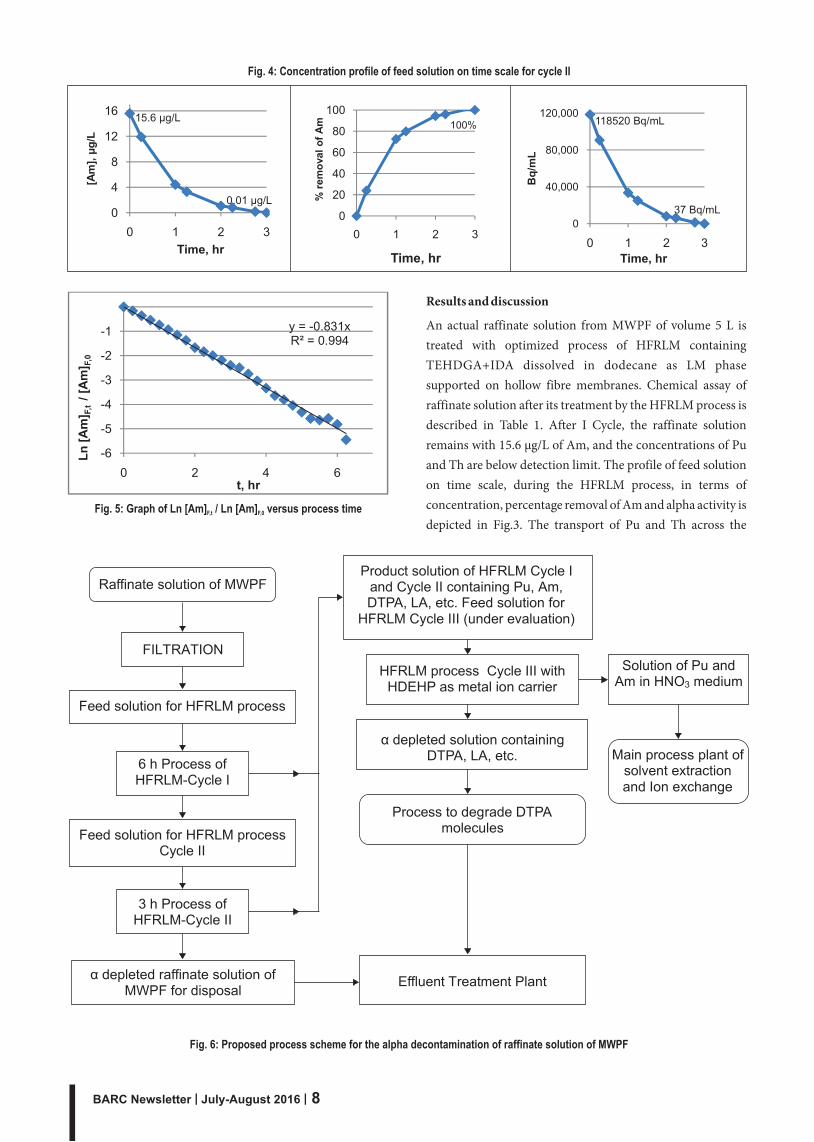
Results and discussion
An actual raffinate solution from MWPF of volume 5 L is treated with optimized process of HFRLM containing TEHDGA+IDA dissolved in dodecane as LM phase supported on hollow fibre membranes. Chemical assay of raffinate solution after its treatment by the HFRLM process is described in Table 1. After I Cycle, the raffinate solution remains with 15.6 µg/L of Am, and the concentrations of Pu and Th are below detection limit. The profile of feed solution on time scale, during the HFRLM process, in terms of concentration, percentage removal of Am and alpha activity is depicted in Fig.3. The transport of Pu and Th across the
0
40,000
80,000
120,000
0 1 2 3
Bq
/mL
Time, hr
0
20
40
60
0 1 2 3
% r
em
oval
of
Am
Time, hr
0
4
8
12
0 1 2 3
[Am
], µ
g/L
Time, hr
15.6 µg/L
16
0.01 µg/L
100% 80
100118520 Bq/mL
37 Bq/mL
Fig. 4: Concentration profile of feed solution on time scale for cycle II
y = -0.831xR² = 0.994
-6
-5
-4
-3
-2
-1
0 2 4 6
Ln
[A
m] F
,t/
[Am
] F,0
t, hr
Fig. 5: Graph of Ln [Am] / Ln [Am] versus process timeF,t F,0
Feed solution for HFRLM process
FILTRATION
Feed solution for HFRLM process Cycle II
6 h Process of HFRLM-Cycle I
3 h Process of HFRLM-Cycle II
α depleted raffinate solution of MWPF for disposal
Product solution of HFRLM Cycle I and Cycle II containing Pu, Am, DTPA, LA, etc. Feed solution for
HFRLM Cycle III (under evaluation)
HFRLM process Cycle III with HDEHP as metal ion carrier
α depleted solution containing DTPA, LA, etc.
Process to degrade DTPA molecules
Solution of Pu and Am in HNO3 medium
Raffinate solution of MWPF
Effluent Treatment Plant
Main process plant of solvent extraction and Ion exchange
Fig. 6: Proposed process scheme for the alpha decontamination of raffinate solution of MWPF
|BARC Newsletter July-August 2016 8|
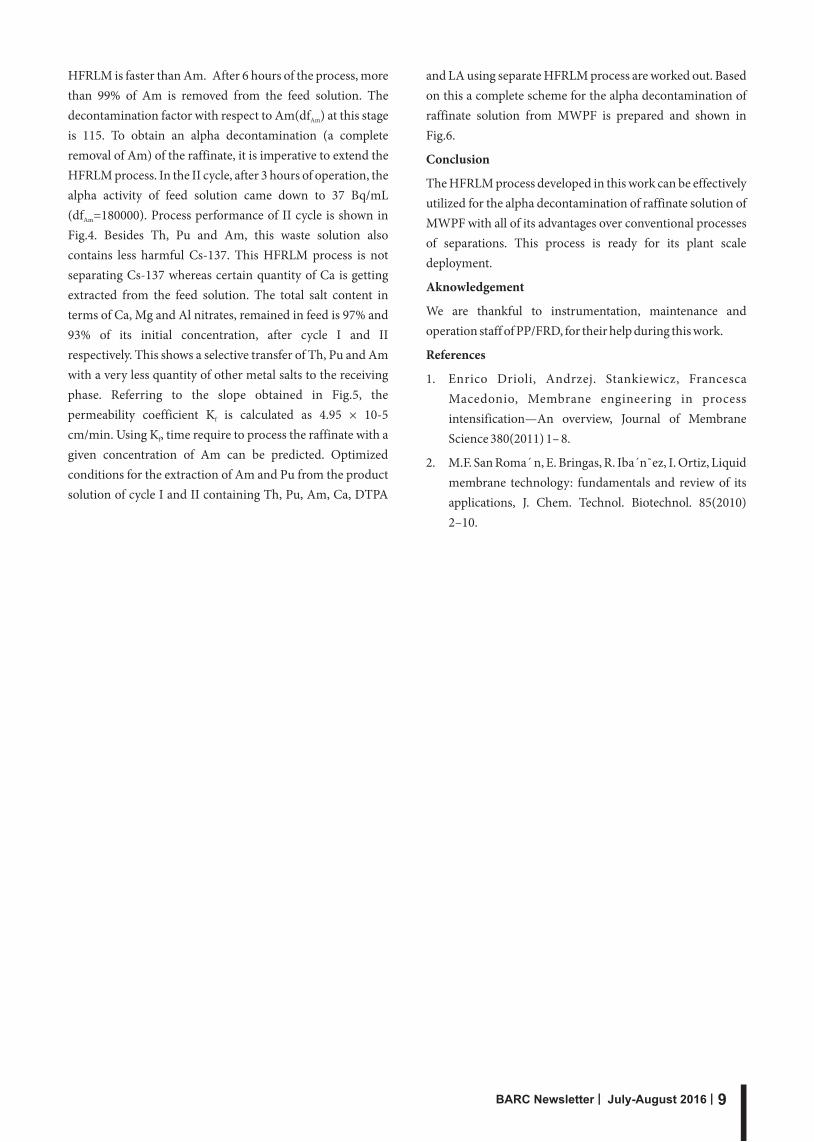
HFRLM is faster than Am. After 6 hours of the process, more than 99% of Am is removed from the feed solution. The decontamination factor with respect to Am(df ) at this stage Am
is 115. To obtain an alpha decontamination (a complete removal of Am) of the raffinate, it is imperative to extend the HFRLM process. In the II cycle, after 3 hours of operation, the alpha activity of feed solution came down to 37 Bq/mL (df =180000). Process performance of II cycle is shown in Am
Fig.4. Besides Th, Pu and Am, this waste solution also contains less harmful Cs-137. This HFRLM process is not separating Cs-137 whereas certain quantity of Ca is getting extracted from the feed solution. The total salt content in terms of Ca, Mg and Al nitrates, remained in feed is 97% and 93% of its initial concentration, after cycle I and II respectively. This shows a selective transfer of Th, Pu and Am with a very less quantity of other metal salts to the receiving phase. Referring to the slope obtained in Fig.5, the permeability coefficient K is calculated as 4.95 × 10⁻⁵ f
cm/min. Using K , time require to process the raffinate with a f
given concentration of Am can be predicted. Optimized conditions for the extraction of Am and Pu from the product solution of cycle I and II containing Th, Pu, Am, Ca, DTPA
and LA using separate HFRLM process are worked out. Based on this a complete scheme for the alpha decontamination of raffinate solution from MWPF is prepared and shown in Fig.6.
Conclusion
The HFRLM process developed in this work can be effectively utilized for the alpha decontamination of raffinate solution of MWPF with all of its advantages over conventional processes of separations. This process is ready for its plant scale deployment.
Aknowledgement
We are thankful to instrumentation, maintenance and operation staff of PP/FRD, for their help during this work.
References
1. Enrico Drioli, Andrzej. Stankiewicz, Francesca Macedonio, Membrane engineering in process intensification—An overview, Journal of Membrane Science 380(2011) 1– 8.
2. M.F. San Roma´ n, E. Bringas, R. Iba´n˜ez, I. Ortiz, Liquid membrane technology: fundamentals and review of its applications, J. Chem. Technol. Biotechnol. 85(2010) 2–10.
|BARC Newsletter 2016 9| July-August
Impact Testing of High Level Waste Canisters
Introduction
The vitrification technology using Joule Heated CermaicMelter(JHCM) has been mastered by India and a large quantity of HLW has been processed and converted into vitrified waste filled canisters. The glass filled canisters are sealed by remote welding using an Autogeneous Orbital Welding Machine inside a hot cell. After decontamination of outer surface, the vitrified waste filled canisters are to be stored in an interim storage facility named as Vitrified Waste Storage Facility (VWSF) in stacks of 4 canisters in one location.
Description of HLW canister:
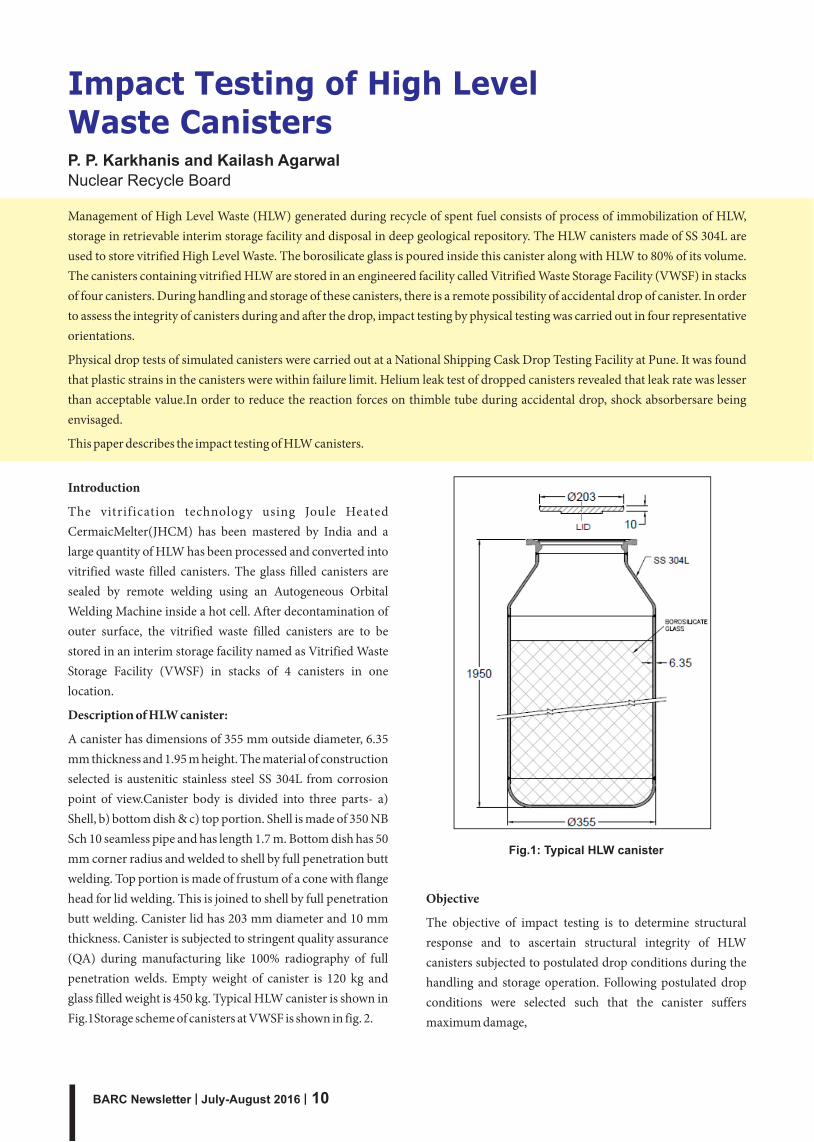
A canister has dimensions of 355 mm outside diameter, 6.35 mm thickness and 1.95 m height. The material of construction selected is austenitic stainless steel SS 304L from corrosion point of view.Canister body is divided into three parts- a) Shell, b) bottom dish & c) top portion. Shell is made of 350 NB Sch 10 seamless pipe and has length 1.7 m. Bottom dish has 50 mm corner radius and welded to shell by full penetration butt welding. Top portion is made of frustum of a cone with flange head for lid welding. This is joined to shell by full penetration butt welding. Canister lid has 203 mm diameter and 10 mm thickness. Canister is subjected to stringent quality assurance (QA) during manufacturing like 100% radiography of full penetration welds. Empty weight of canister is 120 kg and glass filled weight is 450 kg. Typical HLW canister is shown in Fig.1Storage scheme of canisters at VWSF is shown in fig. 2.
P. P. Karkhanis and Kailash Agarwal
Nuclear Recycle Board
Management of High Level Waste (HLW) generated during recycle of spent fuel consists of process of immobilization of HLW, storage in retrievable interim storage facility and disposal in deep geological repository. The HLW canisters made of SS 304L are used to store vitrified High Level Waste. The borosilicate glass is poured inside this canister along with HLW to 80% of its volume. The canisters containing vitrified HLW are stored in an engineered facility called Vitrified Waste Storage Facility (VWSF) in stacks of four canisters. During handling and storage of these canisters, there is a remote possibility of accidental drop of canister. In order to assess the integrity of canisters during and after the drop, impact testing by physical testing was carried out in four representative orientations.
Physical drop tests of simulated canisters were carried out at a National Shipping Cask Drop Testing Facility at Pune. It was found that plastic strains in the canisters were within failure limit. Helium leak test of dropped canisters revealed that leak rate was lesser than acceptable value.In order to reduce the reaction forces on thimble tube during accidental drop, shock absorbersare being envisaged.
This paper describes the impact testing of HLW canisters.
Objective
The objective of impact testing is to determine structural response and to ascertain structural integrity of HLW canisters subjected to postulated drop conditions during the handling and storage operation. Following postulated drop conditions were selected such that the canister suffers maximum damage,
Fig.1: Typical HLW canister
|BARC Newsletter July-August 2016 10|

Drop 3: Canister falling from 6 m height onto its lid with its CG in line with point of impact on an unyielding target surface
Drop 4: Canister falling from a height of 9 m in guided vertical orientation onto another canister kept on an unyielding target surface.
The basis for selecting above representative orientations are described below,
Drop 1: At VWSF, maximum handling height for canister is 12 m and during accidental drop, canister will get guided by thimble tube in vertical orientation. Hence 12 m vertical drop has been selected.
Drop 2 & Drop 3: In the hot cell, maximum handling height of HLW canister is 6 m. The canister may fall in different possible orientations; however the maximum damage will occur in corner orientation where centerline joining canister CG and point of impact is vertical. Hence 6 m corner and inverted corner orientation has been selected.
Drop 4: For this drop, the accidental scenario considered was fall of canister in thimble tube at VWSF on another canister already present at bottom location. Here drop height will be 9 m.
In all above drops it was required to demonstrate integrity of canisters after impact testing. This means canister body which is containment boundary of vitrified HLW shall not breach.
Method
A two-step process was carried out to assess the integrity of canisters under the postulated drop testing. In first step, impact testing was carried out by FE simulation.Insecond step,Physical drop testing of simulated canisters was carried out at a National Shipping Cask Drop Testing Facility at Pune. FE simulation was carried out to know the deformations beforehand. FE simulation is not described in this paper due to space limitations. The results of FE simulation were also used to plan for physical drop test in order to validate the methodology and results.
Physical Drop Testing
Test Description:
The physical drop testing was performed to check the structural integrity of HLW canisters during postulated drop tests. The drop tests were carried out at the National Shipping Cask Drop TestingFacility at Pune. The drop test facility consists of 10 Te goliath crane, quick release mechanism and unyielding drop surface. The target surface provided for drop was unyielding as defined by IAEA in Reference 4.
For drop testing purpose, five nos. of SS canisters were fabricated as per its technical specification and ASME Sec. III,
Fig.2: Typical storage scheme at VWSF
Drop 1: Canister falling from a height of 12 m onto an unyielding target surface
Drop 2: Canister falling from 6 m height on its corner with its center of gravity (CG) in line with point of impact onto an unyielding target surface
|BARC Newsletter 2016 11| July-August

NC. Canisters were filled with inactive borosilicate glass during commissioning trials of JHCM such that actual weight of vitrified HLW is simulated. After filling with glass, the lid was welded remotely to the canister using Autogeneous Orbital Welding Machine inside a hot cell.
For Drop 4, a fabricated MS guide pipe of 12 m height was used which simulates thimble tube of VWSF. A glass filled canister was positioned inside guide pipe at bottom and another canister was dropped onto it from a height of 9 m. Refer fig. 3 shows test setup.
Fig 3: Test Setup for Drop 4
Instrumentation:
Theinstrumentation provided for drop test included accelerometer for measuring 'g' values, strain gauges with data acquisition system & low pass filter for measuring strain levels during drop tests at designated locations and high speed photography (HSP) system for recording and measurement of deformations. The instrumentation used had valid calibration. The locations of strain gauges was decided based on FE simulation results.
Post drop investigations:
After completion of drop tests, following investigations were carried out on the drop tested canisters:
a) Visual inspection
b) Dimensional measutement
c) Dye Penetrant (DP) Test
d) Helium leak test:
Results
The srain results are given in fig. 4 to 7.
Fig 4:Strain data for 12 m Vertical Drop
Fig 5:Strain Data for 6 m Vertical Corner
Fig 6:Strain Data for 6 m inverted corner Drop
Fig 7:Strain Data for 9 m Canister on Canister Drop
|BARC Newsletter July-August 2016 12|

Helium Leak Testing
In order to ensure leak tightness of canisters after drop testing, Helium leak test was carried out on dropped canisters. The acceptable leak rate of Helium from dropped canister was required to be less than ´ atm-cc/sec. The test method used was detector probe technique (snifer probe). Test was
2carried out at 1.2 kg/cm pressure for 15 minutes duration. Fig. 8 shows test setup of Helium leak test.
-4 1 10
Following are the resuts of Helium leak testing:
Leak rate observed for Drop 1 tested canister = ´ atm-cc/sec.
Leak rate observed for Drop 2 tested canister = ´ atm-cc/sec.
Leak rate observed for Drop 3 tested canister = ´ atm-cc/sec.
Leak rate observed for Drop 4 tested canister = 2. ´ atm-cc/sec.
-5 2.9 10
-6 4.2 10
-5 2.2 10
-5 1 10
The strain results are also tabulated in table 1.Table 1: Strain gauge results
Table 2 gives comparison of acceleraometer & HSP results.
Fig 8: Test set up for Helium leak test
|BARC Newsletter 2016 13| July-August

Observations& discussions
The plastic strains are observed to be in ±3%maxand that too in localised regions (near drop surface). These are well within typical failure limits of 10-13% for SS 304L.
For all drops, visuallyno cracks were observed and the canister integrity was maintained (lid & body).No glass fragments were observed near impacting surface. DP test of impact region revealed no cracks.
In drop 4, the gap between neck and lid was reduced but still sufficient for remote handling. The bottom deformed canister was also tested for remote retreivability with its handling grapple and it was observed that remote handling of deformed canister was possible from the storage grids.
Leak rate observed in Helium leak testing for all cases was less than acceptable value of ´ atm-cc/sec.
The physical testing was carried out at room temperature. However, in actual case, the canister surface temperature may reach max. 250°C due to heat generating nature of its contents. From engineering judgement, the plastic strains at this temperature may not exceed ±5-6% which are well within limiting values (assumed conservatively).
Shock Absorbers for Thimble Tube
Very high impact forces are exerted on thimble tube which is used to store the canisters during postulated accident. In order to reduce the impact forces, two types of shock absorbers are envisaged. The high reaction forced during 12 m drop will be reduced by use of shock absorber. The evaluation of proposed shock absorbers is being carried out by NRB.
Conclusion
Physical drop test was carried out to evaluate canister response. No significant plastic strains were observed in
-4 1 10
physical drop testswhich does not amount to failure.Visually all drop tested canisters maintained structural integrity.This fact was also confirmed by DP test and Helium leak test.Based on the results it is concluded that canister maintains structural integrity in postulated accidental scenario.
References
1. Raj, K., Prasad, K. K. and Bansal, N. K. (2006), “Radioactive Waste Management in India”, Nuclear Engineering and Design, 236 (2006) 914-930.
2. ASME (American Society of Mechanical Engineers). 2010 ASME Boiler and Pressure Vessel Code, 2010 Edition. New York.
3. ASTM (American Society for Testing of Materials), Standard Practice for Preparing, Cleaning and Evaluating Corrosion Test Specimens. ASTM G1-03, 2003
4. IAEA (International Atomic Energy Agency) Safety Standards, Regulations for the Safe Transport of Radioactive Material, IAEA SSR-6, 2012.
5. Josephson, G. B. and Alzheimer, J. M., Hanford Immobilised High-Level Waste Canister Drop Testing, October 2005. Technical report no. PNWD-3678 WTP-RPT-120, Rev. 0. Pacific Northwest National Laboratory for RPP WTP project.
6. Mastilovic, Streten, Drop Calculations of HLW canisters and Pu Can-in-canister. Technical report no. CAL-EBS-ME-000015, 2001 Rev 00. Office of Scientific & Technical Information (OSTI), US Dept. Of Energy.
7. Kanwar Raj and C. P. Kaushik, Glass Matrices for Vitrification of Radioactive Waste – anUpdate on R & D Efforts, International Seminar on Science and Technology of Glass Materials (ISSTGM-2009)
|BARC Newsletter July-August 2016 14|
Development of Laser VibrometerAseem Singh Rawat, Nitin Kawade
Laser & Plasma Technology Division
In this article, development of a noncontact vibration measuring instrument based on optical triangulation principle has been discussed. The design aspects of the sensor, consisting of low power diode laser in visible range, focusing optics, one dimensional position sensing detector and processing electronics has been elaborated in detail. The sensor measures vibration amplitude in the range of ±5 mm and vibration frequency in the range of 0.1 Hz - 1 kHz from a distance of 200mm and generates proportional analog output voltage. The output of sensor is fed to PC through ADC card where in-house developed software program perform calculation on received data to find vibration amplitude and frequency and then display it graphically. The calibration of sensor in terms of vibration frequency and amplitude is done against accelerometer and commercial laser sensor in the vibration test laboratory of RED, BARC.
|BARC Newsletter 2016 15| July-August
Introduction:
Vibration is the motion of a particle or a body or a system of 1connected bodies displaced from its position of equilibrium .
The system tends to return to its equilibrium position under the action of restoring force. The back and forth movement of the system about its position of equilibrium results in vibration. The vibration of an object is expressed in terms of its amplitude and frequency. The detection of vibration plays an important role in the different areas of structural health monitoring and industrial engineering. In general, vibration detection can be divided into two categories: contact type and non-contact type. Usually in the contact type vibration sensing, the sensor is attached to the machines or instruments in order to detect the vibration amplitude and frequency. In some applications where precise vibration measurement is required or in toxic and hazardous environment, addition of contact sensor becomes impractical due to inaccessibility or since this attachment adds a mass on the instrument or the machine and might alter its vibration characteristics. The other category of vibration sensors are non-contact type. Measurement of vibration through optical technique has gained importance due to its non-contact, non-destructive nature and high speed. Optical methods are more useful generally for remote measurement in hazardous & toxic environment, where human/operator intervention is very difficult.
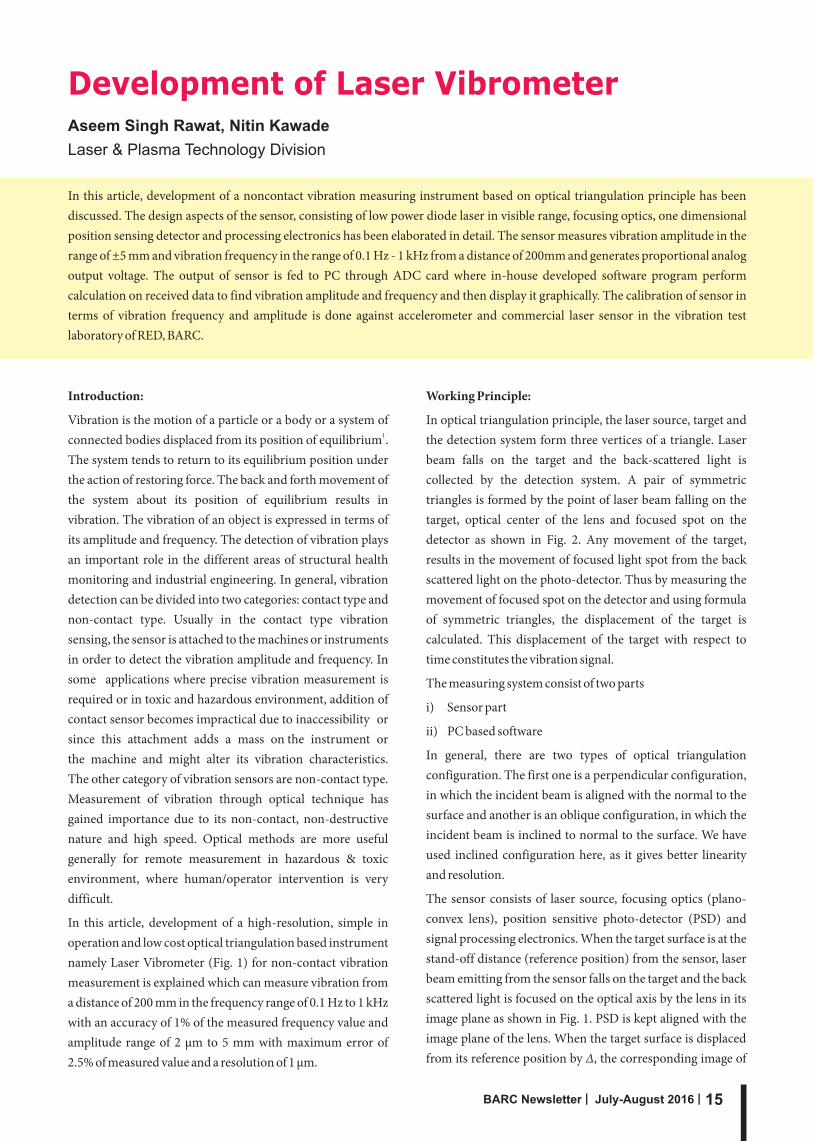
In this article, development of a high-resolution, simple in operation and low cost optical triangulation based instrument namely Laser Vibrometer (Fig. 1) for non-contact vibration measurement is explained which can measure vibration from a distance of 200 mm in the frequency range of 0.1 Hz to 1 kHz with an accuracy of 1% of the measured frequency value and amplitude range of 2 µm to 5 mm with maximum error of 2.5% of measured value and a resolution of 1 µm.
Working Principle:
In optical triangulation principle, the laser source, target and the detection system form three vertices of a triangle. Laser beam falls on the target and the back-scattered light is collected by the detection system. A pair of symmetric triangles is formed by the point of laser beam falling on the target, optical center of the lens and focused spot on the detector as shown in Fig. 2. Any movement of the target, results in the movement of focused light spot from the back scattered light on the photo-detector. Thus by measuring the movement of focused spot on the detector and using formula of symmetric triangles, the displacement of the target is calculated. This displacement of the target with respect to time constitutes the vibration signal.
The measuring system consist of two parts
i) Sensor part
ii) PC based software
In general, there are two types of optical triangulation configuration. The first one is a perpendicular configuration, in which the incident beam is aligned with the normal to the surface and another is an oblique configuration, in which the incident beam is inclined to normal to the surface. We have used inclined configuration here, as it gives better linearity and resolution.
The sensor consists of laser source, focusing optics (plano-convex lens), position sensitive photo-detector (PSD) and signal processing electronics. When the target surface is at the stand-off distance (reference position) from the sensor, laser beam emitting from the sensor falls on the target and the back scattered light is focused on the optical axis by the lens in its image plane as shown in Fig. 1. PSD is kept aligned with the image plane of the lens. When the target surface is displaced from its reference position by Δ, the corresponding image of

1 1 1
the laser spot is displaced at the detector by δ. The PSD converts optical displacement signal into electrical signal. The electrical signal is processed by the electronic circuit to generate the output voltage which is proportional to the displacement of focused spot (δ). In Optical triangulation sensors, the amount of laser spot displaced on the detector for a given displacement of the target depends on the geometrical parameters chosen in sensor configuration. The geometrical parameters are focal length of lens (f), angle between the laser beam and lens optical axis (θ), and the distance between the laser beam and the optical axis of lens in the plane of the lens also called as base-length (d). For chosen above parameters of sensor, the distance between lens optical center and target or stand-off distance L is given byo
L = d/tanθ (1)o
And distance between lens optical center and PSD is given by
(2)
Thus the relation between the target displacement Δ and displacement of centroid of the image spot ( δ) at the detector is calculated using the laws of symmetric triangles and is given
2as (3)
The output voltage of sensor is proportional to δ which is fed to the PC after digitisation. For known values of L , L ,θ and o i
measured value of δ ,the target displacement Δ is calculated by the PC based software using (3) above. The FFT of the time domain displacement signal gives frequency content of the vibration and peak-to-peak amplitude of the displacement signal gives amplitude of vibration. The calculated values are then graphically displayed on monitor for user interface.
System description:
The laser vibrometer instrument consists of a sensor, interfaced to PC through a data acquisition card (Analog to
Fig. 1: Photograph of laser Vibrometer sensor with PC interface
digital converter) and software on PC for vibration calculation. In the sensor, laser diode (Make: Lasiris) with 5 mW output power and wavelength (λ) equal to 635 nm is used as the light source as shown in Fig. 2.
The laser is selected in visible wavelength range for ease of alignment. Laser beam falls on the surface of the target at an
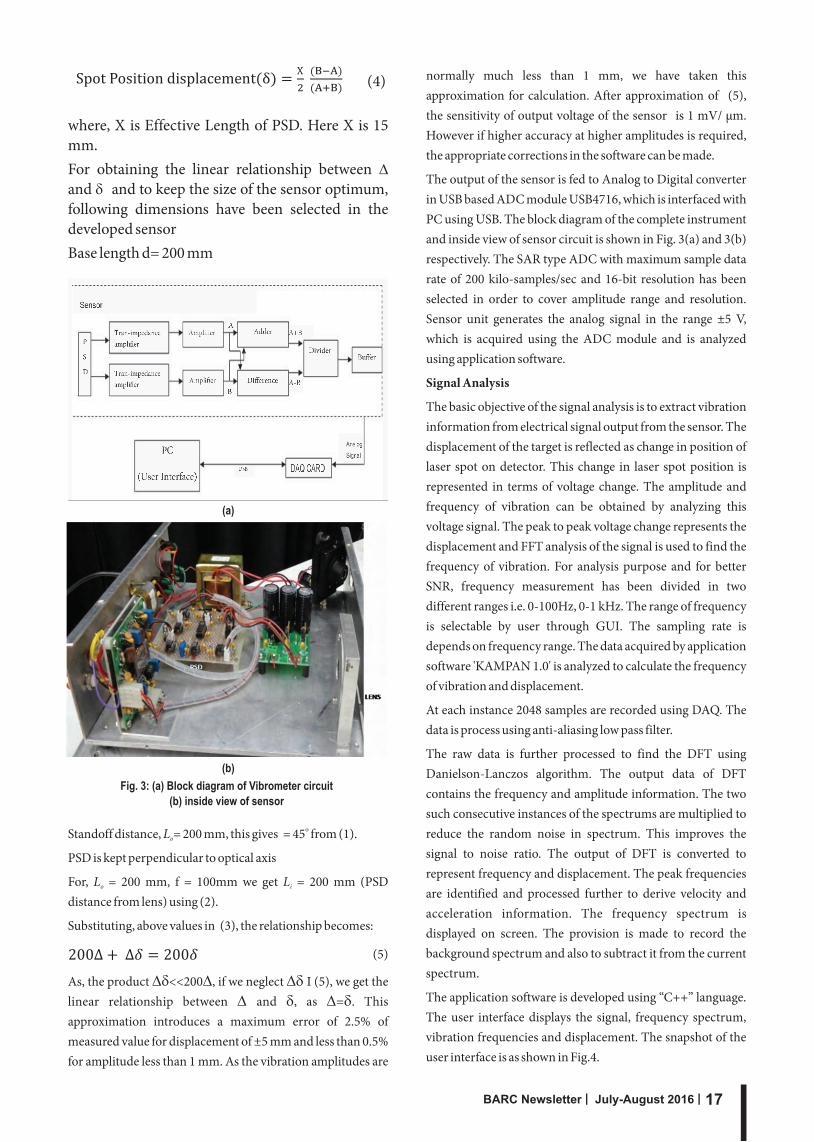
oinclined angle of 45 to its normal and back scatters. A portion of the backscattered light is collected by the focusing optics via Plano-convex lens of focal length f = 100 mm, Diameter = 50 mm and is focused on a PSD, SL-15 (Make: UDT) having active area of length 15 mm and width 1 mm. For proper alignment, it is necessary to have laser beam, lens optical axis and normal to the target surface in the same plane. This ensures that the focused spot falls within active area of PSD. The photo-detector converts optical signal into electrical signal. The PSD selected has a common cathode and two anode pins, which are at the two ends of its length. The PSD has the characteristic that if the focused spot falls at its center, then the output currents at its two anodes are equal. But if the focused spot is falling away from the center, then the current through the anode which is nearer to the spot will be proportionately more than the anode which is relatively further from the spot. The PSD is biased in reverse mode with cathode connected to +15V. The two current outputs from PSD are amplified and are converted to voltage using trans-impedance amplifiers to give two output voltages A and B as shown in Fig. 3(a). The sum (A+B) and difference (B-A) are determined using Op-Amp based adder and difference circuit and division is implemented using multiplier IC AD734. Then spot movement on PSD (δ) is calculated using relation,
Fig. 2: Schematic diagram of Laser Vibrometer
|BARC Newsletter July-August 2016 16|
X (4)
where, X is Effective Length of PSD. Here X is 15 mm. For obtaining the linear relationship between and and to keep the size of the sensor optimum, following dimensions have been selected in the developed sensorBase length d= 200 mm
D
d
(a)
(b)
Fig. 3: (a) Block diagram of Vibrometer circuit
(b) inside view of sensor
oStandoff distance, L = 200 mm, this gives = 45 from (1).o
PSD is kept perpendicular to optical axis
For, L = 200 mm, f = 100mm we get L = 200 mm (PSD o i
distance from lens) using (2).
Substituting, above values in (3), the relationship becomes:
(5)
As, the product Dd<<200D, if we neglect Dd I (5), we get the linear relationship between D and d, as D=d. This approximation introduces a maximum error of 2.5% of measured value for displacement of ±5 mm and less than 0.5% for amplitude less than 1 mm. As the vibration amplitudes are
normally much less than 1 mm, we have taken this approximation for calculation. After approximation of (5), the sensitivity of output voltage of the sensor is 1 mV/ µm. However if higher accuracy at higher amplitudes is required, the appropriate corrections in the software can be made.
The output of the sensor is fed to Analog to Digital converter in USB based ADC module USB4716, which is interfaced with PC using USB. The block diagram of the complete instrument and inside view of sensor circuit is shown in Fig. 3(a) and 3(b) respectively. The SAR type ADC with maximum sample data rate of 200 kilo-samples/sec and 16-bit resolution has been selected in order to cover amplitude range and resolution. Sensor unit generates the analog signal in the range ±5 V, which is acquired using the ADC module and is analyzed using application software.
Signal Analysis
The basic objective of the signal analysis is to extract vibration information from electrical signal output from the sensor. The displacement of the target is reflected as change in position of laser spot on detector. This change in laser spot position is represented in terms of voltage change. The amplitude and frequency of vibration can be obtained by analyzing this voltage signal. The peak to peak voltage change represents the displacement and FFT analysis of the signal is used to find the frequency of vibration. For analysis purpose and for better SNR, frequency measurement has been divided in two different ranges i.e. 0-100Hz, 0-1 kHz. The range of frequency is selectable by user through GUI. The sampling rate is depends on frequency range. The data acquired by application software 'KAMPAN 1.0' is analyzed to calculate the frequency of vibration and displacement.
At each instance 2048 samples are recorded using DAQ. The data is process using anti-aliasing low pass filter.
The raw data is further processed to find the DFT using Danielson-Lanczos algorithm. The output data of DFT contains the frequency and amplitude information. The two such consecutive instances of the spectrums are multiplied to reduce the random noise in spectrum. This improves the signal to noise ratio. The output of DFT is converted to represent frequency and displacement. The peak frequencies are identified and processed further to derive velocity and acceleration information. The frequency spectrum is displayed on screen. The provision is made to record the background spectrum and also to subtract it from the current spectrum.
The application software is developed using “C++” language. The user interface displays the signal, frequency spectrum, vibration frequencies and displacement. The snapshot of the user interface is as shown in Fig.4.
|BARC Newsletter 2016 17| July-August

Experimental results and discussion :
Laser vibrometer Sensor is tested against the accelerometer (model no. BNK 4396) and commercial laser sensor (µepsilon make : model no OPTO NCDT 1700) for measurement of vibration of shaker at RED vibration lab and the results obtained are summarized as follows:
1) Test have been carried out on shaker for vibration frequency range of 0 to 1 kHz and amplitude range of 2 µm to 10 mm.
2) The sigma(σ) value calculated for 5 readings by different
sensors at 10 Hz vibration frequency are as follows:
a) Accelerometer: Average=4.0616 mm, σ=0.046 mm
b) Laser Vibrometer: Average=4.0098 mm, σ=0.007mm
c) µEpsilon laser sensor: Average=4.0756 mm, σ=0.003
mm
3) Frequency values obtained from all the three sensor for complete range of measurement are identical and equal to the set frequency value.
4) Laser Vibrometer can measure highest vibration amplitude of 10 mm
5) At lower value of Vibration amplitude ( less than 2 µm), the percentage error increases and the amplitude information becomes unreliable although it shows correct frequency.
6) The readings of laser Vibrometer are more closer to Accelerometer readings than readings of µepsilon Laser sensor.
7) The maximum difference in the amplitude measurement reading between laser Vibrometer and accelerometer is less than 5 %.
8) Thus in the present set of readings , frequency range 0- 1 kHz could be verified and amplitude range 2 µm – 10 mm. For testing of instrument at higher frequencies (> 1 kHz) with higher amplitude ( > 2 µm) a different shaker should be available.
Conclusion:
A vibration measuring instrument Laser Vibrometer has been developed by designing a vibration sensor based on optical triangulation technique and it is interfaced with the PC where a software program developed in C++ language computes the frequency and amplitude components of vibration from the signal received. The sensor measures vibration in the frequency range of 0.1 Hz to 1 kHz with an accuracy of 1% of measured value and displacement range of ±5 mm with a resolution of 1 micron.
Acknowledgment:
The authors are thankful to Head, LPTD for his support and encouragement in carrying out this work. For calibration of laser vibrometer, help extended by Shri S K Sinha,SO/H and Shri Anil kumar Narayan of Vibration lab, RED,BARC is thankfully acknowledged. For assembly and skilfully testing of the instrument, the authors are thankful to Shri Ramdas Gangurde, Tech (F), LPTD
References
1. Dennis H Shreve, "Introduction to Vibration Technology", url{http://www.krelco.com/downloads/ VT1_2.pdf}, November 1994, Accessed on:23-5-2016
2. Aseem Singh Rawat, Ravi Dhawan, N O Kawade, “Development of laser triangulation based vibration measurement sensor”, Proceeding of National Laser Symposium(NLS-24), December 2015.
Fig. 4: Snapshot of the user interface at PC
|BARC Newsletter July-August 2016 18|

Technology Development of 500Kg
Multi Axis Shake TableP. Ramakrishna, Shiju Varghese, Jay Shah, P.K. Limaye and N.L. SoniRefuelling Technology Division
An indigenous six degrees of freedom servo hydraulic shake table has been developed and commissioned at Hall-3, BARC to demonstrate the technology of multi axis servo-hydraulic shake tables. The important components of shake table- servo hydraulic linear actuators, hydraulic power supply and servo controller has been briefly described. The multi axis shake table control algorithm has been described whose performance was simulated and later implemented in shake table. The article ends with description of benchmark tests conducted during commissioning and some experiments conducted using shake table.
|BARC Newsletter 2016 19| July-August
Multi axis servo hydraulic shake tables are used in seismic qualification of systems, structures and components of nuclear reactors. Major multi axis shake table installations in India including CPRI, SERC & IGCAR are imported and being largely used by DAE. As an import substitute a multi axis shake table is being developed at Refuelling Technology Division.
A state of art six degrees of freedom (6 DOF) 500Kg servo hydraulic shake table has been indigenously developed and commissioned at Hall-3, BARC to demonstrate the technology of designing and developing 6DOF servo-hydraulic shake tables. All the components of the shake table were designed by us, fabricated at different vendors and
integrated at Fluid Power Lab, Hall-3, RTD. The key components of shake table are servo hydraulic linear actuators, hydraulic power supply and servo controller. The brief specification of 6DOF shake table is given in Table 1.
System description:
Shake table controller developed in house simultaneously controls eight numbers of high performance servo hydraulic actuators in real time. Good filtration and degassing of oil is maintained to meet the high performance requirements. Modern sensors with digital communication interfaces such as CAN bus and SPI are used to minimize noise related problems. 150 MHz 32 bit DSP processor take 40 feedback sensors to control the table at loop update rate of 1 KHz.
Mechanical Specifications Degrees of freedom Six (three translational & three rotational)
Max payload 500 Kg
Size of table 0.5m X 0.5m
Mounting configuration on table top female M8 x 1.25 threads on 80 mm square pitch
Max X & Y offset of payload from C.G 0.2m C.G of specimen above table top 0.1m Frequency of operation 0.1Hz(up to 0.2g)-50Hz(up to 1.5g).
Max. Horizontal displacement (X&Y) ±0.05m
Max. Vertical displacement (Z) ±0.05m
Max. Velocity in X,Y & Z axis ±0.8m/s
Max horizontal acceleration(X&Y) 1.5g @ full load, 5g @ noload, please refer Fig.1 -performance curve Max vertical acceleration(Z) 1g @ full load, 5g @ noload.
Duration of test 10 min for 3 axis random, long duration for sine, cosine , sine sweep. Wave form Sine, Sine sweep, random, spectrum compatible time history
Control System Specifications Control hardware Indigenous dual axis digital servo controller (DACCI) networked through
CANBus. EMI / EMC qualified as per IEC 61000-4-x.
Control loop update rate 1KHz Control algorithms Degree of freedom control, Three variable Control, Transfer function based
Iterative Control
Data acquisition (Internal) Up to 80 channel, 1KHz sampling frequency (for acquiring table parameters) Functions Run, Stop, Parking & Homing, Real time plots of any variables, On line
controller tuning
Actuator instrumentation Each servo actuator is provided with LVDT, MEMS accelerometer, two
pressure transmitters and a load cell.
Table 1: Specification of 6DOF shake table
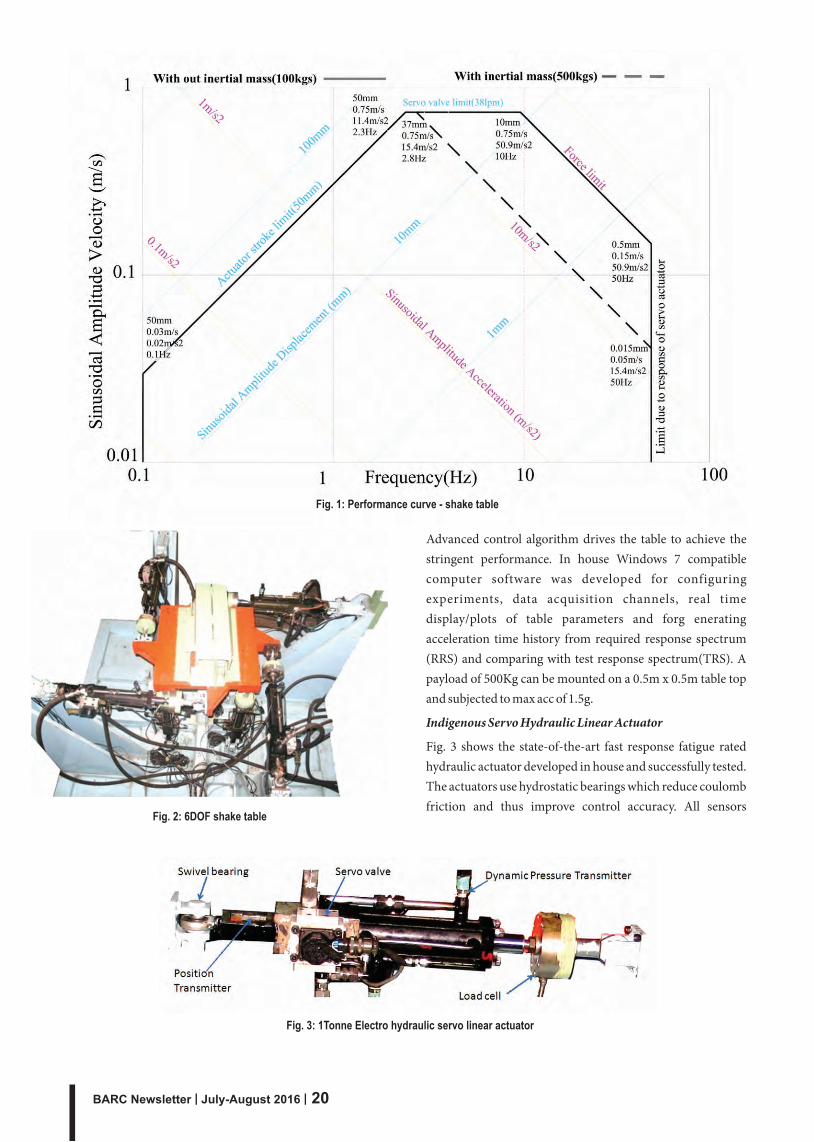
Advanced control algorithm drives the table to achieve the stringent performance. In house Windows 7 compatible computer software was developed for configuring experiments, data acquisition channels, real time display/plots of table parameters and forg enerating acceleration time history from required response spectrum (RRS) and comparing with test response spectrum(TRS). A payload of 500Kg can be mounted on a 0.5m x 0.5m table top and subjected to max acc of 1.5g.
Indigenous Servo Hydraulic Linear Actuator
Fig. 3 shows the state-of-the-art fast response fatigue rated hydraulic actuator developed in house and successfully tested. The actuators use hydrostatic bearings which reduce coulomb friction and thus improve control accuracy. All sensors
Fig. 1: Performance curve - shake table
Fig. 2: 6DOF shake table
Fig. 3: 1Tonne Electro hydraulic servo linear actuator
|BARC Newsletter July-August 2016 20|

(LVDT, Accelerometer, Load cell and Pressure transmitter) are inbuilt for accurate feedback. Servo valve is closely mounted to increase the dynamic response and stiffness of actuator. Eight such actuators with swivel bearings at the ends were built and connected between table top and ground as shown in Fig 2.
Hydraulic Power Supply (HPS)
Hydraulic Power Supply along with hydraulic accumulator bank forms an important subsystem of shake table development. It gives clean, cool and pressurised fluid to drive all eight actuators simultaneously in shake table. A gear pump used for offline filtration and cooling the fluid also charges the main axial piston pumps. Energy efficient load sensing scheme is used for pressure control. In addition to mechanical
filters, electrostatic oil cleaner as shown in Fig 4 is used to remove sub-micron particles. Thus NAS 5 cleanliness is maintained by good filtration techniques for hydrostatic bearings and servo valves. Particle counter as shown in Fig 5 is used for measuring cleanliness. An innovative way of increasing effective bulk modulus of oil by degassing was used. The increase in natural frequency of actuators due to degassing is observed in bode plot as seen in Fig 6. Hydraulic accumulator bank provides instantaneous flow required for faster actuator response.
Dynamic simulation of shake table in six degree freedom
The shake table is an over constraint (eight actuators for 6 degrees of freedom) parallel manipulator. Before actually implementing the multi axis shake table control algorithm, it was dynamically simulated by developing eight actuator shake table model as shown in Fig 7. A dynamic modeling and analysis software simulating rigid body machines and their motions, using the standard Newtonian dynamics of forces and torques was used. The dynamic equations are solved with their mass properties, their possible motions, kinematic constraints and coordinate systems to initiate and measure body motions. Instead of using inverse kinematics for
Fig. 4: Electrostatic oil cleaner
Fig. 5: Automatic Particle counter Fig. 7: Dynamic model of Shake Table
Fig. 6: Bode plot before & after degassing
|BARC Newsletter 2016 21| July-August

conversion of 6DOF set points to 8 actuator length time histories, a simple transformation matrix was used taking advantage of the parallel orientation of actuators to coordinate system. This simple transformation leads to easy realization in real time implementation of code. In simulation, it was verified that eight actuator length time histories resulted in smooth and synchronous motion of table. The effect of cross loading interaction of actuators with the table top, effect of eccentric mass and effect of force balance compensation was studied in these simulations. Also performance of advance controllers was investigated in these simulations.
Indigenous Servo Controller
Fig 8 shows Double Actuator Controller with Dual CANBus Interface (DACCI) which is used to control two of our servo hydraulic actuators. Four numbers of DACCI are networked through CANBus in order to simultaneously control all eight actuators in real time. Printed circuit boards was carefully designed and qualified as per IEC 61000-4-x series standards. The table is displacement controlled with velocity and differential pressure feedbacks for superior dynamic performances. The control algorithm as shown in Fig 9 works by converting the individual displacements to modal displacements by a transformation matrix and servo controller operates on modal displacements by comparing with the user input commands to generate a modal controller output. This modal output is converted back to individual actuator outputs by another transformation matrix and thus used to control individual actuator. Differential Pressure
Fig. 8: Shake Table Controller
Fig. 9: Shake table control algorithm for generation of control output to one of the horizontal actuators
|BARC Newsletter July-August 2016 22|
feedback is used in local cascade control for resonance damping at high frequency. MEMS technology based high resolution accelerometer (1.9 mg @60Hz) was used for acceleration feedback. Load Cell (Full bridge-Current Excitation) was used for table force balance compensation.
150 MHz 32 bit DSP processor with inbuilt FPU provides high computational power for high order floating point matrix multiplications. 40 feedback sensors are used to control the table at control loop update rate of 1 KHz. Position feedback is from LVDT with 16bit ADC, 2 pole analog filter, 64 times oversampling decimation filter.
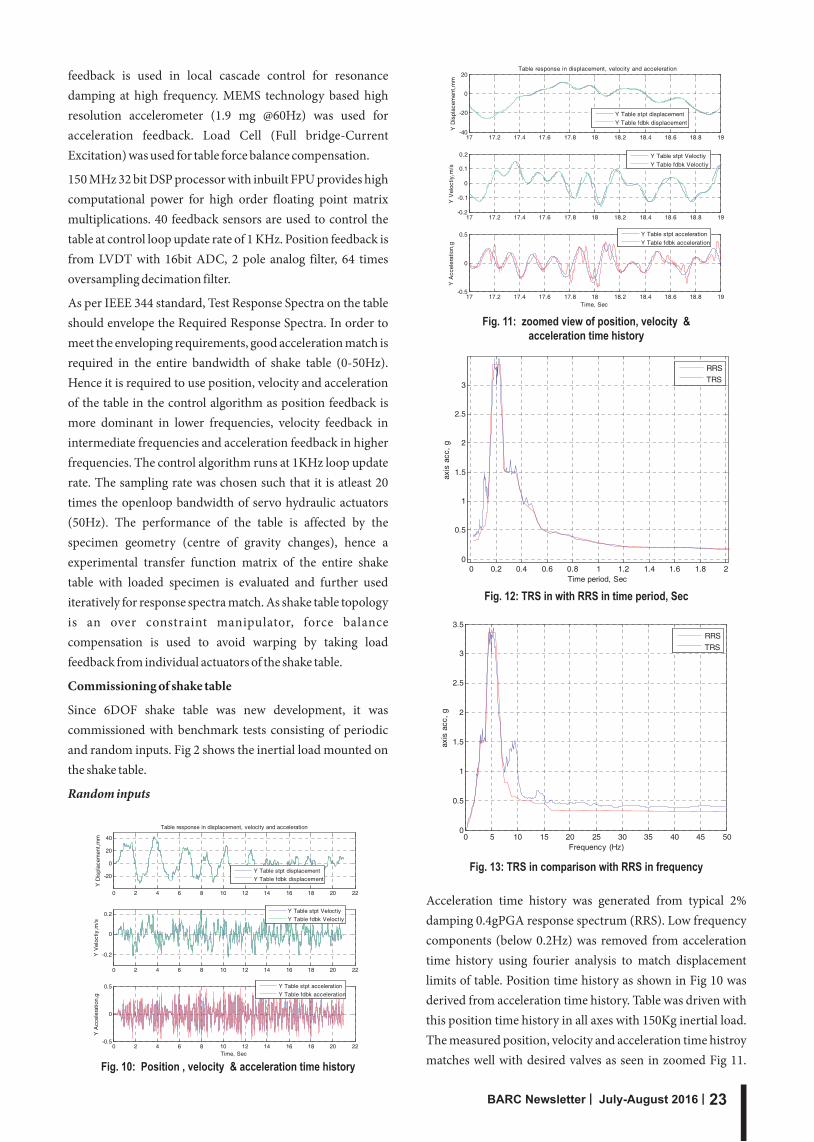
As per IEEE 344 standard, Test Response Spectra on the table should envelope the Required Response Spectra. In order to meet the enveloping requirements, good acceleration match is required in the entire bandwidth of shake table (0-50Hz). Hence it is required to use position, velocity and acceleration of the table in the control algorithm as position feedback is more dominant in lower frequencies, velocity feedback in intermediate frequencies and acceleration feedback in higher frequencies. The control algorithm runs at 1KHz loop update rate. The sampling rate was chosen such that it is atleast 20 times the openloop bandwidth of servo hydraulic actuators (50Hz). The performance of the table is affected by the specimen geometry (centre of gravity changes), hence a experimental transfer function matrix of the entire shake table with loaded specimen is evaluated and further used iteratively for response spectra match. As shake table topology is an over constraint manipulator, force balance compensation is used to avoid warping by taking load feedback from individual actuators of the shake table.
Commissioning of shake table
Since 6DOF shake table was new development, it was commissioned with benchmark tests consisting of periodic and random inputs. Fig 2 shows the inertial load mounted on the shake table.
Random inputs
Fig. 10: Position , velocity & acceleration time history
Fig. 11: zoomed view of position, velocity & acceleration time history
Acceleration time history was generated from typical 2% damping 0.4gPGA response spectrum (RRS). Low frequency components (below 0.2Hz) was removed from acceleration time history using fourier analysis to match displacement limits of table. Position time history as shown in Fig 10 was derived from acceleration time history. Table was driven with this position time history in all axes with 150Kg inertial load. The measured position, velocity and acceleration time histroy matches well with desired valves as seen in zoomed Fig 11.
Fig. 12: TRS in with RRS in time period, Sec
Fig. 13: TRS in comparison with RRS in frequency
|BARC Newsletter 2016 23| July-August
Test response spectrum (TRS) was constructed from measured acceleration time history. TRS envelopes well with RRS as seen in Fig 12 in time period axis execpt in periods below 0.15Secs and which is seen more clearly in Fig 13 in frequency axis for greater than 7Hz. The TRS is slightly higher than RRS at higher fequencies due to some back lash present in the swivel joint between the actuator and the table.
Periodic inputs
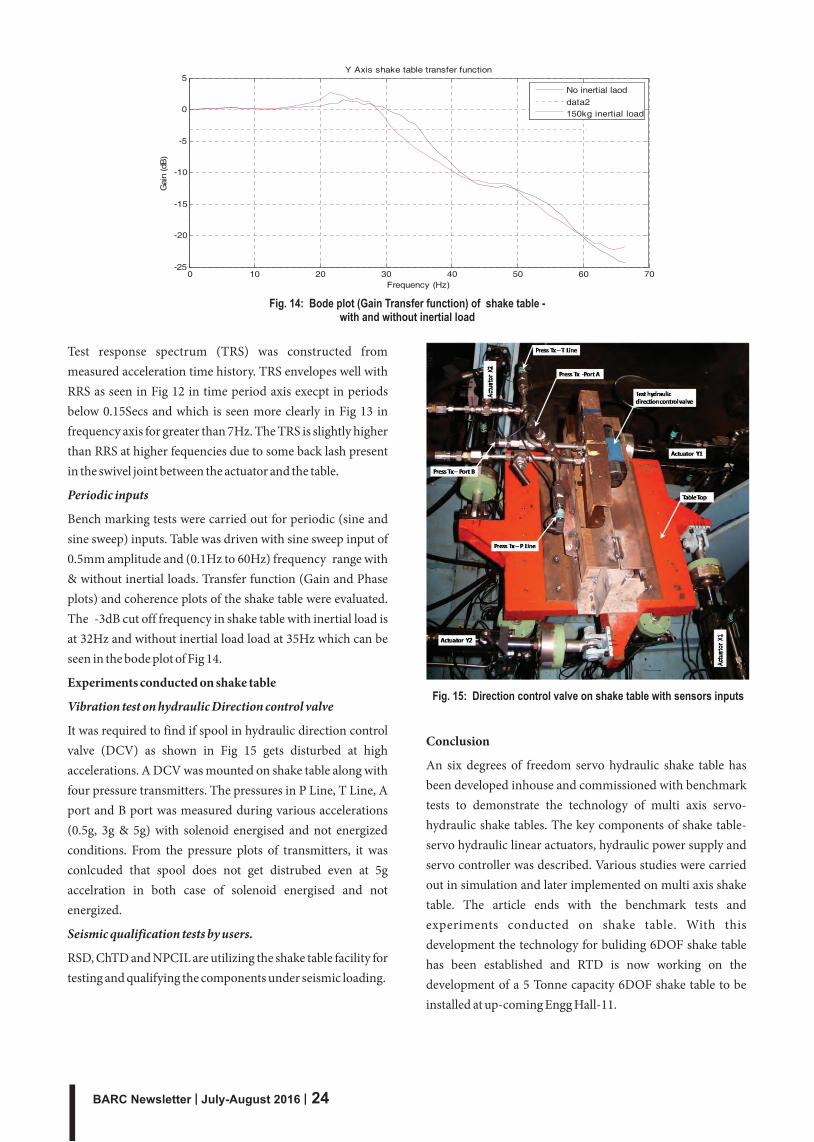
Bench marking tests were carried out for periodic (sine and sine sweep) inputs. Table was driven with sine sweep input of 0.5mm amplitude and (0.1Hz to 60Hz) frequency range with & without inertial loads. Transfer function (Gain and Phase plots) and coherence plots of the shake table were evaluated. The -3dB cut off frequency in shake table with inertial load is at 32Hz and without inertial load load at 35Hz which can be seen in the bode plot of Fig 14.
Experiments conducted on shake table
Vibration test on hydraulic Direction control valve
It was required to find if spool in hydraulic direction control valve (DCV) as shown in Fig 15 gets disturbed at high accelerations. A DCV was mounted on shake table along with four pressure transmitters. The pressures in P Line, T Line, A port and B port was measured during various accelerations (0.5g, 3g & 5g) with solenoid energised and not energized conditions. From the pressure plots of transmitters, it was conlcuded that spool does not get distrubed even at 5g accelration in both case of solenoid energised and not energized.
Seismic qualification tests by users.
RSD, ChTD and NPCIL are utilizing the shake table facility for testing and qualifying the components under seismic loading.
Fig. 14: Bode plot (Gain Transfer function) of shake table -with and without inertial load
Conclusion
An six degrees of freedom servo hydraulic shake table has been developed inhouse and commissioned with benchmark tests to demonstrate the technology of multi axis servo-hydraulic shake tables. The key components of shake table- servo hydraulic linear actuators, hydraulic power supply and servo controller was described. Various studies were carried out in simulation and later implemented on multi axis shake table. The article ends with the benchmark tests and experiments conducted on shake table. With this development the technology for buliding 6DOF shake table has been established and RTD is now working on the development of a 5 Tonne capacity 6DOF shake table to be installed at up-coming Engg Hall-11.
Fig. 15: Direction control valve on shake table with sensors inputs
|BARC Newsletter July-August 2016 24|
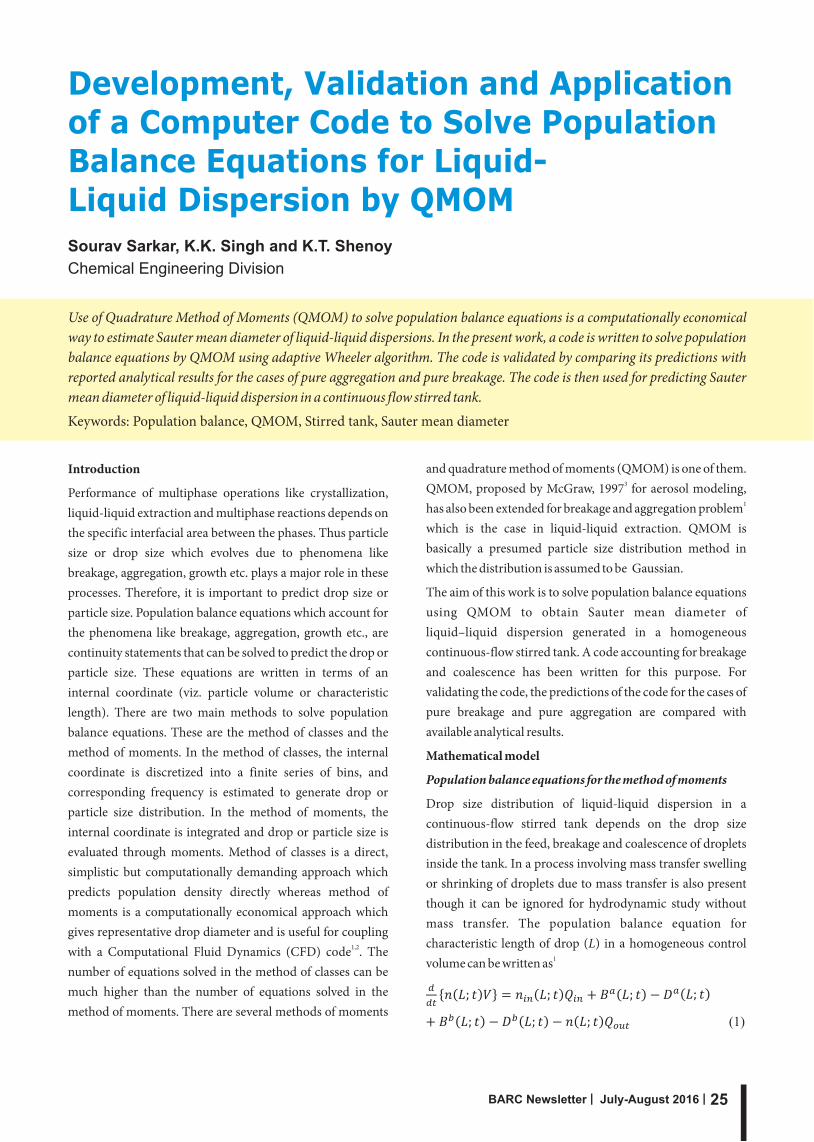
Development, Validation and Application of a Computer Code to Solve Population Balance Equations for Liquid-Liquid Dispersion by QMOM
Sourav Sarkar, K.K. Singh and K.T. Shenoy
Chemical Engineering Division
Use of Quadrature Method of Moments (QMOM) to solve population balance equations is a computationally economical way to estimate Sauter mean diameter of liquid-liquid dispersions. In the present work, a code is written to solve population balance equations by QMOM using adaptive Wheeler algorithm. The code is validated by comparing its predictions with reported analytical results for the cases of pure aggregation and pure breakage. The code is then used for predicting Sauter mean diameter of liquid-liquid dispersion in a continuous flow stirred tank.
Keywords: Population balance, QMOM, Stirred tank, Sauter mean diameter
|BARC Newsletter 2016 25| July-August
Introduction
Performance of multiphase operations like crystallization, liquid-liquid extraction and multiphase reactions depends on the specific interfacial area between the phases. Thus particle size or drop size which evolves due to phenomena like breakage, aggregation, growth etc. plays a major role in these processes. Therefore, it is important to predict drop size or particle size. Population balance equations which account for the phenomena like breakage, aggregation, growth etc., are continuity statements that can be solved to predict the drop or particle size. These equations are written in terms of an internal coordinate (viz. particle volume or characteristic length). There are two main methods to solve population balance equations. These are the method of classes and the method of moments. In the method of classes, the internal coordinate is discretized into a finite series of bins, and corresponding frequency is estimated to generate drop or particle size distribution. In the method of moments, the internal coordinate is integrated and drop or particle size is evaluated through moments. Method of classes is a direct, simplistic but computationally demanding approach which predicts population density directly whereas method of moments is a computationally economical approach which gives representative drop diameter and is useful for coupling
1,2with a Computational Fluid Dynamics (CFD) code . The number of equations solved in the method of classes can be much higher than the number of equations solved in the method of moments. There are several methods of moments
and quadrature method of moments (QMOM) is one of them. 3QMOM, proposed by McGraw, 1997 for aerosol modeling,
1has also been extended for breakage and aggregation problem which is the case in liquid-liquid extraction. QMOM is basically a presumed particle size distribution method in which the distribution is assumed to be Gaussian.
The aim of this work is to solve population balance equations using QMOM to obtain Sauter mean diameter of liquid–liquid dispersion generated in a homogeneous continuous-flow stirred tank. A code accounting for breakage and coalescence has been written for this purpose. For validating the code, the predictions of the code for the cases of pure breakage and pure aggregation are compared with available analytical results.
Mathematical model
Population balance equations for the method of moments
Drop size distribution of liquid-liquid dispersion in a continuous-flow stirred tank depends on the drop size distribution in the feed, breakage and coalescence of droplets inside the tank. In a process involving mass transfer swelling or shrinking of droplets due to mass transfer is also present though it can be ignored for hydrodynamic study without mass transfer. The population balance equation for characteristic length of drop (L) in a homogeneous control
1volume can be written as

|BARC Newsletter 26| July-August 2016
a bHere B and B are birth rates of droplet of size L at any time t a bdue to aggregation and breakage, respectively. D and D are
the death rates of droplet size L at any time t due to aggregation and breakage, respectively. V is the volume of the control volume and Q is the inlet flow rate and Q is the outlet flow in out
rate. n(L;t) is the number of droplets having characteristic length L per unit volume at any time t and n (L;t) is the in
number of droplets with characteristic length L per unit volume of the inlet stream at any time t. Population balance equation can be re-written as Eq. 2 for a batch system.
The expressions for the birth and death rates are given by Eq. 4(3) to (6) .
Where, b is the aggregation (coalescence) kernel, a is the breakage kernel and b is the daughter droplet distribution. In literature, several kernels have been reported. The right combination of the kernels may change from system to system. To solve Eq. 1 or Eq. 2 using QMOM a further transformation is needed i.e. aggregation, breakage and other terms present in Eq. 1 must be written in terms of moment. Moment transformation is done by applying Eq. 7 which
thdefines the k order moment.
Eqs. (3)-(6) are substituted into Eq. (1) and then integrated Kwith respect to L after multiplying with L . Assuming Q = Q in out
ththe equation of k moment can be written as
Second term in the right hand side of Eq. 8 is derived by assuming a variable “u ”such that and thus
Application of QMOM and discretization
Eq. 8 is a non-linear integro-differential equation, which can be solved using quadrature approximation with adaptive
4Wheeler algorithm , which determines weights (w ) and i
abscissas (L ) from the moments. The algorithm is based on i
the minimization of the error by replacing integral of Eq. (7)
with its quadrature approximation as given in Eq. (9). Adaptive wheeler algorithm determines N/2 weights and N/2 abscissas from N moments by finding eigenvalues and eigenvectors. Discretized form of Eq. 8 is shown in Eq. 10.
Where and .
Results and discussion
Validation with analytical results
QMOM-based population balance model is solved for the cases for which analytical solutions exist to check the accuracy of the code. Two cases- only aggregation and only breakage – are solved.
Case 1: This case corresponds to pure aggregation in a batch stirred tank. A constant aggregation kernel is used which is represented by b = 1 . Due to the absence of breakage, a = 0 ij i
and daughter droplet distribution is not required. The 2analytical solution for this case is given by Eq. 11 .
Case 2: No aggregation is assumed. Breakage kernel is proportional to volume of the particle and daughter droplet distribution is assumed to be uniform. Analytical solution for
2the moments for this case is given by Eq. 12 .
For both the cases, assumed initial drop size distribution is given by Eq. 13. N and v are number of drops per unit 0 0
volume and volume of the domain of interest and t is time. 3 3Values of N and v are 1/m and 1 m , respectively. 0 0
Comparison of analytical results with the results obtained from our code for the two cases are shown in Fig. 1 and Fig. 2. It should be noted that the third moment, which represents volume of the dispersed phase, is constant over time as the volume of the dispersed phase remains conserved.
Prediction of Sauter mean diameter for a continuous flow stirred tank
After validation, the code is used to predict drop Sauter mean diameter of liquid-liquid dispersion in a continuous flow stirred tank. The liquid-liquid system is wet phosphoric acid dispersed in a mixture of di-2-ethyl hexyl phosphoric acid (D2EHPA), tributyl phosphate (TBP) and dodecane. This phase system is important for recovery of uranium and other
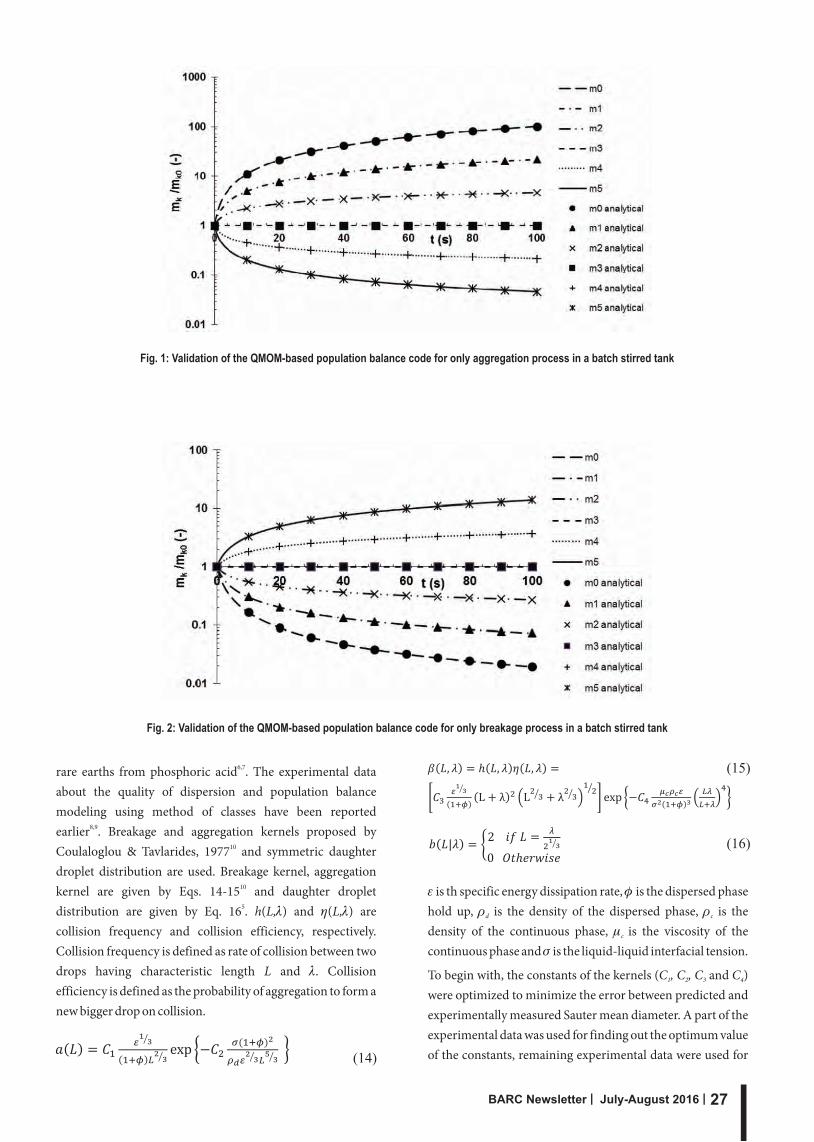
|BARC Newsletter 2016 27| July-August
Fig. 1: Validation of the QMOM-based population balance code for only aggregation process in a batch stirred tank
Fig. 2: Validation of the QMOM-based population balance code for only breakage process in a batch stirred tank
6,7rare earths from phosphoric acid . The experimental data about the quality of dispersion and population balance modeling using method of classes have been reported
8,9earlier . Breakage and aggregation kernels proposed by 10Coulaloglou & Tavlarides, 1977 and symmetric daughter
droplet distribution are used. Breakage kernel, aggregation 10kernel are given by Eqs. 14-15 and daughter droplet 5distribution are given by Eq. 16 . h(L,l) and h(L,l) are
collision frequency and collision efficiency, respectively. Collision frequency is defined as rate of collision between two drops having characteristic length L and l. Collision efficiency is defined as the probability of aggregation to form a new bigger drop on collision.
e is th specific energy dissipation rate, f is the dispersed phase hold up, r is the density of the dispersed phase, r is the d c
density of the continuous phase, m is the viscosity of the c
continuous phase and s is the liquid-liquid interfacial tension.
To begin with, the constants of the kernels (C , C , C and C ) 1 2 3 4
were optimized to minimize the error between predicted and experimentally measured Sauter mean diameter. A part of the experimental data was used for finding out the optimum value of the constants, remaining experimental data were used for

|BARC Newsletter 28| July-August 2016
Table 1: Average error in prediction of Sauter mean diameter for different combinations of the values of the model constants
Fig. 3: Comparison of measured and predicted Sauter mean diameters of liquid-liquid dispersion in a continuous flow stirred tank
validation. Table 1 lists different values of the constants tried and corresponding error. Model 6 shows minimum error so it is used for the validation. The model with optimized constants (Model 6) is validated with another set of experimental data and error is found to be about 14%. Fig. 3 shows the
comparison of the Sauter mean diameters predicted by the code with the experimental Sauter mean diameters. The experimental data shown in Fig. 3 are the experimental data which were not used in optimization of model constants.
Conclusion
QMOM-based population balance code is written and validated by comparing its predictions with the analytical results for two special cases. The code is then used to estimate the Sauter mean diameter of liquid-liquid dispersion in a continuous flow stirred tank. The code with optimized values of constants of breakage and coalescence kernels is found to predict Sauter mean drop diameter with an average error of less than 15%. The code will be further extended to make it applicable for columnar contactors.
References
1. Marchisio, D. L., Vigil, R. D. & Fox, R. O., 2003. Implementation of the quadrature method of moments in CFD codes for aggregation–breakage problems. Chemical Engineering Science, 58(15), pp. 3337-3351.
2. Gimbun, J., Nagy, Z. K. & Rielly, C. D., 2009. Simultaneous quadrature method of moments for the solution of population balance equations, using a differential algebraic equation framework. Industrial & Engineering Chemistry Research, 48(16), pp. 7798-7812.
3. McGraw, R., 1997. Description of aerosol dynamics by the quadrature method of moments. Aerosol Science and Technology, 27(2), pp. 255-265.
4. Wheeler, J.C., 1974. Modified moments and Gaussian quadratures. Rocky Mountain Journal of Mathematics, 4(2), pp. 287-296.
5. Marchisio, D. L., Vigil, R. D. & Fox, R. O., 2003. Q u a d r a t u r e m e t h o d o f m o m e n t s f o r aggregation–breakage processes. Journal of Colloid and Interface Science, 258(2), pp. 322-334.
6. Jayachandran, K., Pius, I.C., Venugopal, C.K., Raman, V.A., Dubey, B.P., Vithal, G.K., Mukerjee, S.K., Aggarwal, S.K., Ramakumar, K.L. and Venugopal, V., 2013. Novel method for stripping uranium from the organic phase in the recovery of uranium from wet process phosphoric acid (WPA). Industrial & Engineering Chemistry Research, 52(15), pp.5418-5427.
7. Al-Thyabat, S. & Zhang, P., 2015. REE extraction from phosphoric acid, phosphoric acid sludge, and phosphogypsum. Mineral Processing and Extractive Metallurgy, 124(3), pp. 143-150.
8. Singh, K. K., Mahajani, S. M., Shenoy, K. T. & Ghosh, S. K., 2008. Representative drop sizes and drop size distributions in A/O dispersions in continuous flow stirred tank. Hydrometallurgy, 90(2), pp. 121-136.
9. Singh, K. K., Mahajani, S. M., Shenoy, K. T. & Ghosh, S. K., 2009. Population balance modeling of liquid−liquid dispersions in homogeneous continuous-flow stirred tank. Industrial & Engineering Chemistry Research, 48(17), pp. 8121-8133.
10. Coulaloglou, C. A. & Tavlarides, L. L., 1977. Description of interaction processes in agitated liquid-liquid dispersions. Chemical Engineering Science, 32(11), pp. 1289-1297.

thThe inauguration function of the 60 batch was held on stAugust 1 , 2016 in the august presence of Shri K.N.Vyas,
Director, BARC.
Dr. M.Ramanamurthi, Head, OCES, in the opening remarks welcomed the gathering and congratulated the trainees for their selection to this prestigious programme from amongst a large number of aspiring candidates. He mentioned that the BARC Training School was one of the foundation institutes of DAE and that the infusion of young blood in the form of these trainees added dynamism, enterprise and energy to the programmes of the Department. The BARC fraternity should welcome them into their fold and nurture them with care and concern.
Dr A.P.Tiwari, Head, HRDD highlighted the tough selection process that the trainees had negotiated to gain selection, and urged them to live up to the high standards expected of them. The rigourous one year OCES would transform them into nuclear science and technology specialists, capable of carrying out the multifarious tasks in all aspects of the nuclear
thInauguration of 60 Batch OCES and th13 Batch OCDF
|BARC Newsletter 2016 29| July-August
fuel cycle, he said. He advised them to strive hard and focus on the course work without having to worry about aspects such as accommodation, boarding, study materials, computer facilities etc. which were being taken care of by the Department.
Dr. K.N.Vyas, Director, BARC in his inaugural address recalled the great legacy of the BARC Training School and its contributions of the Department. Much has been achieved, he said, but a lot more needs to be done in advanced reactor technologies and associated aspects of nuclear fuel cycle, and the onus would lie upon these young shoulders to carry forward the mandate of the Department. The year long programme would provide them the tools the tackle the challenges expected in meeting the objectives of the Department and at the same time give an opportunity to build a unique camaraderie amongst the batch mates which would stand them in good stead all through their careers.
The event was concluded with a vote of thanks proposed by Dr M.Ramanamurthi.
from left: Dr. S.K. Singh, HRDD; Dr. G.K. Dey, Director, Materials Group; Dr. A.P. Tiwari, Head, HRDD,
Dr. M. Ramanamurthi, HRDD and Shri K.N. Vyas, Director, BARC
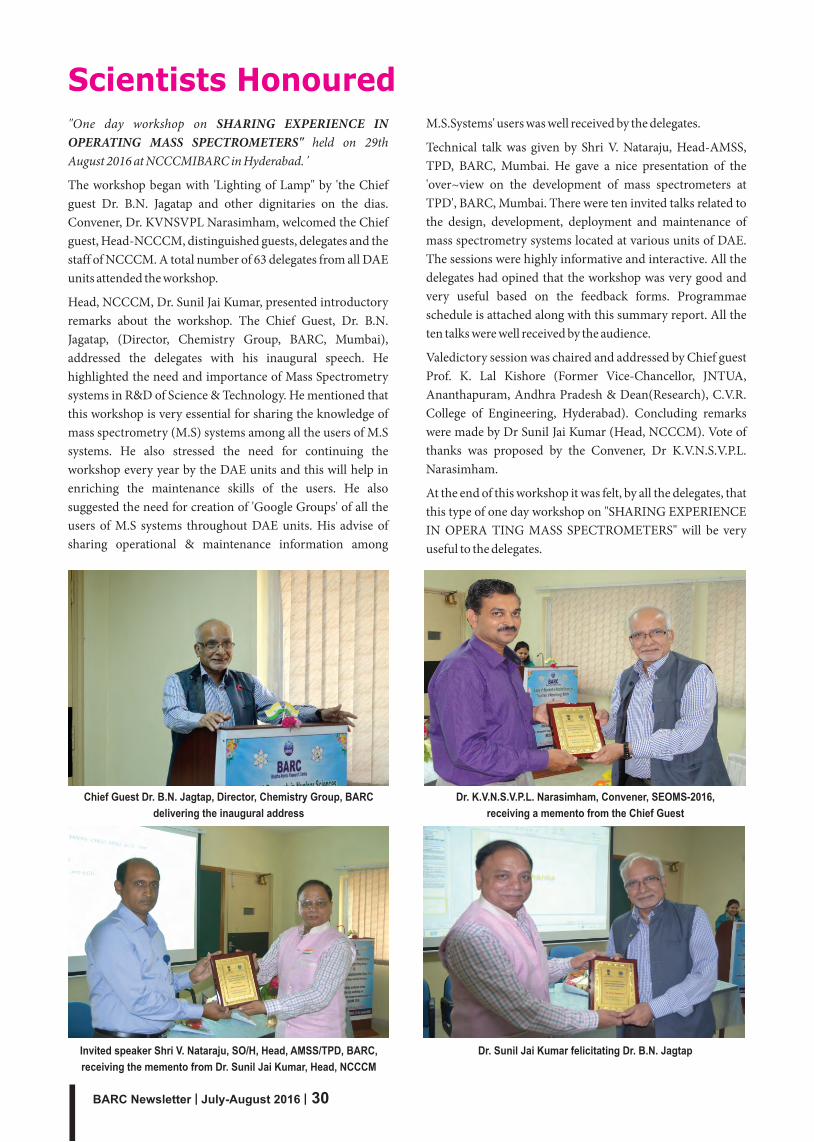
Scientists Honoured"One day workshop on SHARING EXPERIENCE IN OPERATING MASS SPECTROMETERS" held on 29th August 2016 at NCCCMIBARC in Hyderabad. '
The workshop began with 'Lighting of Lamp" by 'the Chief guest Dr. B.N. Jagatap and other dignitaries on the dias. Convener, Dr. KVNSVPL Narasimham, welcomed the Chief guest, Head-NCCCM, distinguished guests, delegates and the staff of NCCCM. A total number of 63 delegates from all DAE units attended the workshop.
Head, NCCCM, Dr. Sunil Jai Kumar, presented introductory remarks about the workshop. The Chief Guest, Dr. B.N. Jagatap, (Director, Chemistry Group, BARC, Mumbai), addressed the delegates with his inaugural speech. He highlighted the need and importance of Mass Spectrometry systems in R&D of Science & Technology. He mentioned that this workshop is very essential for sharing the knowledge of mass spectrometry (M.S) systems among all the users of M.S systems. He also stressed the need for continuing the workshop every year by the DAE units and this will help in enriching the maintenance skills of the users. He also suggested the need for creation of 'Google Groups' of all the users of M.S systems throughout DAE units. His advise of sharing operational & maintenance information among
|BARC Newsletter 30| July-August 2016
M.S.Systems' users was well received by the delegates.
Technical talk was given by Shri V. Nataraju, Head-AMSS, TPD, BARC, Mumbai. He gave a nice presentation of the 'over~view on the development of mass spectrometers at TPD', BARC, Mumbai. There were ten invited talks related to the design, development, deployment and maintenance of mass spectrometry systems located at various units of DAE. The sessions were highly informative and interactive. All the delegates had opined that the workshop was very good and very useful based on the feedback forms. Programmae schedule is attached along with this summary report. All the ten talks were well received by the audience.
Valedictory session was chaired and addressed by Chief guest Prof. K. Lal Kishore (Former Vice-Chancellor, JNTUA, Ananthapuram, Andhra Pradesh & Dean(Research), C.V.R. College of Engineering, Hyderabad). Concluding remarks were made by Dr Sunil Jai Kumar (Head, NCCCM). Vote of thanks was proposed by the Convener, Dr K.V.N.S.V.P.L. Narasimham.
At the end of this workshop it was felt, by all the delegates, that this type of one day workshop on "SHARING EXPERIENCE IN OPERA TING MASS SPECTROMETERS" will be very useful to the delegates.
Chief Guest Dr. B.N. Jagtap, Director, Chemistry Group, BARC
delivering the inaugural address
Invited speaker Shri V. Nataraju, SO/H, Head, AMSS/TPD, BARC,
receiving the memento from Dr. Sunil Jai Kumar, Head, NCCCM
Dr. Sunil Jai Kumar felicitating Dr. B.N. Jagtap
Dr. K.V.N.S.V.P.L. Narasimham, Convener, SEOMS-2016,
receiving a memento from the Chief Guest

Edited & Published by:Scientific Information Resource Division
Bhabha Atomic Research Centre, Trombay, Mumbai 400 085, IndiaBARC Newsletter is also available at URL:http://www.barc.gov.in
Central Complex at BARC


