Embed Size (px)
Citation preview

1
No. 16-071E
July 29, 2016
Consolidated Financial Results for the First Quarter Ended June 30, 2016
Tokyo, July 29, 2016 -- Sony Corporation today announced its consolidated financial results for the first quarter ended June 30, 2016 (April 1, 2016 to June 30, 2016). (Billions of yen, millions of U.S. dollars, except per share amounts)
First Quarter ended June 30 2015 2016 Change in yen 2016*
Sales and operating revenue ¥1,808.1 ¥1,613.2 -10.8% $15,662 Operating income 96.9 56.2 -42.0 546 Income before income taxes 138.7 57.0 -58.9 554 Net income attributable to Sony Corporation’s
stockholders 82.4 21.2 -74.3 205 Net income attributable to Sony Corporation’s
stockholders per share of common stock: - Basic ¥70.52 ¥16.78 -76.2 $0.16 - Diluted 70.36 16.44 -76.6 0.16 * U.S. dollar amounts have been translated from yen, for convenience only, at the rate of 103 yen = 1 U.S. dollar, the approximate Tokyo
foreign exchange market rate as of June 30, 2016. All amounts are presented on the basis of Generally Accepted Accounting Principles in the U.S. (“U.S. GAAP”). Sony Corporation and its consolidated subsidiaries are together referred to as “Sony”. The average foreign exchange rates during the quarters ended June 30, 2015 and 2016 are presented below. First Quarter ended June 30 2015 2016 Change
The average rate of yen 1 U.S. dollar ¥121.3 ¥108.1 12.3% (yen appreciation)
1 Euro 134.2 122.1 9.9 (yen appreciation) Consolidated Results for the First Quarter Ended June 30, 2016 Sales and operating revenue (“Sales”) decreased by 10.8% compared to the same quarter of the previous fiscal year (“year-on-year”) to 1,613.2 billion yen (15,662 million U.S. dollars). This significant decrease was mainly due to the impact of foreign exchange rates, a decrease in Mobile Communications (“MC”) segment sales reflecting a significant decrease in smartphone unit sales, a decrease in revenues in the Financial Services segment due to the deterioration in investment performance in the separate account at Sony Life Insurance Co., Ltd. (“Sony Life”), as well as decreases in sales in the Semiconductors and Imaging Products & Solutions (“IP&S”) segments due to the impact of the earthquakes in the Kumamoto region in 2016 (“2016 Kumamoto Earthquakes”). This decrease was partially offset by an increase in Game & Network Services (“G&NS”) segment sales reflecting increases in PlayStation 4 (“PS4”) software sales. On a constant currency basis, sales decreased 3% year-on-year. For further details about the impact of foreign exchange rate fluctuations on sales and operating income (loss), see Notes on page 8.
News & Information
1-7-1 Konan, Minato-ku Tokyo 108-0075 Japan

2
Operating income decreased 40.7 billion yen year-on-year to 56.2 billion yen (546 million U.S. dollars). This significant decrease was mainly due to the deterioration of operating results in the Semiconductors segment, partially offset by an improvement in the G&NS and MC segments. Operating income in the current quarter includes a 20.3 billion yen (197 million U.S. dollars) impairment charge against long-lived assets in the Semiconductors segment resulting from the termination of development and manufacturing of certain high-functionality camera modules for external sale, as well as net charges of 13.6 billion yen (132 million U.S. dollars) in expenses resulting from the 2016 Kumamoto Earthquakes in the Semiconductors segment. 6.8 billion yen (66 million U.S. dollars) was incurred in expenses, which includes repair costs of certain fixed assets and a loss on disposal of inventories directly damaged by the 2016 Kumamoto Earthquakes. Of these charges, approximately 1.3 billion yen (12 million U.S. dollars) was offset by probable insurance recoveries. In addition, there were idle facility costs at manufacturing sites affected by the earthquakes, totaling 8.1 billion yen (78 million U.S. dollars). Operating income in the same quarter of the previous fiscal year included a 151 million U.S. dollar (18.1 billion yen) gain on the remeasurement to fair value of Sony Music Entertainment (“SME”)’s 51% equity interest in Orchard Media, Inc. (“The Orchard”), which had previously been accounted for under the equity method, as a result of SME increasing its ownership interest to 100%, in the Music Segment, as well as a gain of 12.3 billion yen from the sale of a part of the logistics business, in connection with the formation of a logistics joint venture, recorded in Corporate and elimination.
During the current quarter, restructuring charges, net, decreased 8.4 billion yen year-on-year to 1.7 billion yen (17 million U.S. dollars). Equity in net income of affiliated companies, recorded within operating income, was a loss of 0.8 billion yen (8 million U.S. dollars), compared to income of 0.4 billion yen in the same quarter of the previous fiscal year. This deterioration was mainly due to a deterioration of equity in net income (loss) for SA Reinsurance Ltd. in the Financial Services segment. The net effect of other income and expenses decreased 41.0 billion yen year-on-year to income of 0.8 billion yen (8 million U.S. dollars), primarily due to the absence of a 46.8 billion yen gain on the sale of certain shares of Olympus Corporation (“Olympus”) and a 2.7 billion yen gain on the sale of shares in connection with the above-mentioned formation of a logistics joint venture, recorded in the same quarter of the previous fiscal year. Income before income taxes decreased 81.7 billion yen year-on-year to 57.0 billion yen (554 million U.S. dollars). Income taxes: During the current quarter, Sony recorded 20.5 billion yen (199 million U.S. dollars) of income tax expense, resulting in an effective tax rate of 35.9% which exceeded the effective tax rate of 28.7% in the same quarter of the previous fiscal year. This higher effective tax rate was mainly due to the fact that Sony Corporation and its national tax filing group in Japan, which has established valuation allowances for deferred tax assets, had losses during the current quarter compared to having profits in the same quarter of the previous fiscal year. Net income attributable to Sony Corporation’s stockholders, which deducts net income attributable to noncontrolling interests, decreased 61.3 billion yen year-on-year to 21.2 billion yen (205 million U.S. dollars). Operating Performance Highlights by Business Segment “Sales and operating revenue” in each business segment represents sales and operating revenue recorded before intersegment transactions are eliminated. “Operating income (loss)” in each business segment represents operating income (loss) reported before intersegment transactions are eliminated and excludes unallocated corporate expenses.
Mobile Communications (MC) (Billions of yen, millions of U.S. dollars) First Quarter ended June 30 2015 2016 Change in yen 2016 Sales and operating revenue ¥280.5 ¥185.9 -33.7% $1,805 Operating income (loss) (22.9) 0.4 - 4

3
Sales decreased 33.7% year-on-year (a 30% decrease on a constant currency basis) to 185.9 billion yen (1,805 million U.S. dollars). This decrease was mainly due to a reduction in mid-range smartphone unit sales, as well as a reduction in smartphone unit sales in unprofitable geographical areas where downsizing measures were implemented during the previous fiscal year, partially offset by an improvement in product mix of smartphones reflecting an increased focus on high value-added models.
Operating income of 0.4 billion yen (4 million U.S. dollars) was recorded, compared to an operating loss of 22.9 billion yen recorded in the same quarter of the previous fiscal year. Despite the significant decrease in sales, profitability improved significantly primarily due to the improvement in product mix, cost reductions mainly resulting from the benefit of restructuring initiatives and a significant decrease in restructuring charges. During the current quarter, there was a 4.4 billion yen positive impact from foreign exchange rate fluctuations (net of the impact of foreign exchange hedging).
Game & Network Services (G&NS) (Billions of yen, millions of U.S. dollars)
First Quarter ended June 30 2015 2016 Change in yen 2016
Sales and operating revenue ¥288.6 ¥330.4 +14.5% $3,208 Operating income 19.5 44.0 +126.3 427
The G&NS segment includes the Hardware, Network, and Other categories. Hardware includes home and portable game consoles; Network includes network services relating to game, video and music content provided by Sony Interactive Entertainment; Other includes packaged software and peripheral devices.
Sales increased 14.5% year-on-year (a 25% increase on a constant currency basis) to 330.4 billion yen (3,208 million U.S. dollars). This significant increase was primarily due to a significant increase in PS4 software sales including sales through the network, partially offset by the impact of foreign exchange rates and decreases in PlayStation®3 hardware and software sales.
Operating income increased 24.6 billion yen year-on-year to 44.0 billion yen (427 million U.S. dollars). This significant increase was primarily due to the above-mentioned increase in PS4 software sales and PS4 hardware cost reductions, partially offset by an increase in marketing costs. During the current quarter, there was a 1.3 billion yen negative impact from foreign exchange rate fluctuations.
Imaging Products & Solutions (IP&S) (Billions of yen, millions of U.S. dollars)
First Quarter ended June 30 2015 2016 Change in yen 2016
Sales and operating revenue ¥164.7 ¥122.2 -25.8% $1,187 Operating income 17.7 7.5 -57.7 73
The IP&S segment includes the Still and Video Cameras as well as Other categories. Still and Video Cameras includes interchangeable lens cameras, compact digital cameras, consumer video cameras and video cameras for broadcast; Other includes display products such as projectors and medical equipment. Due to certain changes in Sony’s organizational structure, sales and operating revenue and operating income (loss) of the IP&S segment of the comparable prior period have been reclassified to conform to the current presentation. For details, please see Notes on page 8.
Sales decreased 25.8% year-on-year (an 18% decrease on a constant currency basis) to 122.2 billion yen (1,187 million U.S. dollars). This significant decrease in sales was mainly due to lower sales of Still and Video Cameras, reflecting the difficulty of procuring components due to the 2016 Kumamoto Earthquakes and a contraction of the market, as well as the impact of foreign exchange rates, partially offset by an improvement in the product mix of Still and Video Cameras, reflecting a shift to high value-added models.
Operating income decreased 10.2 billion yen year-on-year to 7.5 billion yen (73 million U.S. dollars). This significant decrease was mainly due to the impact of the above-mentioned decrease in sales and the negative impact

4
of foreign exchange rates, partially offset by the above-mentioned improvement in product mix and a reduction of fixed costs. During the current quarter, there was a 5.7 billion yen negative impact from foreign exchange rate fluctuations.
Home Entertainment & Sound (HE&S) (Billions of yen, millions of U.S. dollars) First Quarter ended June 30
2015 2016 Change in yen 2016 Sales and operating revenue ¥253.1 ¥235.9 -6.8% $2,290 Operating income 10.9 20.2 +85.3 197 The HE&S segment includes the Televisions as well as Audio and Video categories. Televisions includes LCD televisions; Audio and Video includes Blu-ray DiscTM players and recorders, home audio, headphones and memory-based portable audio devices. Sales decreased 6.8% year-on-year (a 4% increase on a constant currency basis) to 235.9 billion yen (2,290 million U.S. dollars). This decrease was primarily due to the impact of foreign exchange rates, partially offset by an increase in LCD television unit sales. Operating income increased 9.3 billion yen year-on-year to 20.2 billion yen (197 million U.S. dollars). This increase was primarily due to cost reductions and an improvement in product mix reflecting a shift to high value-added models, partially offset by an increase in research and development expenses, as well as the negative impact of foreign exchange rates. During the current quarter, there was a 2.6 billion yen negative impact from foreign exchange rate fluctuations.
Semiconductors (Billions of yen, millions of U.S. dollars) First Quarter ended June 30 2015 2016 Change in yen 2016 Sales and operating revenue ¥187.4 ¥144.4 -22.9% $1,402 Operating income (loss) 32.7 (43.5) - (423) The Semiconductors segment includes image sensors and camera modules. Due to certain changes in Sony’s organizational structure, sales and operating revenue and operating income (loss) of the former Devices segment of the comparable prior period have been reclassified to conform to the current presentation. For details, please see Notes on page 8. Sales decreased 22.9% year-on-year (a 14% decrease on a constant currency basis) to 144.4 billion yen (1,402 million U.S. dollars). This decrease was primarily due to a significant decrease in sales of image sensors, reflecting the impact of a decrease in image sensor production due to the 2016 Kumamoto Earthquakes, lower demand for image sensors for mobile products, and the impact of foreign exchange rates. Sales to external customers decreased 21.4% year-on-year. Operating loss of 43.5 billion yen (423 million U.S. dollars) was recorded, compared to operating income of 32.7 billion yen recorded in the same quarter of the previous fiscal year. This significant deterioration was due to the impact of the above-mentioned decrease in sales, the 20.3 billion yen (197 million U.S. dollars) impairment charge against long-lived assets for camera modules, net charges of 13.6 billion yen (132 million U.S. dollars) for expenses resulting from the 2016 Kumamoto Earthquakes and the negative impact of foreign exchange rates. During the current quarter, there was a 8.2 billion yen negative impact from foreign exchange rate fluctuations.

5
Components (Billions of yen, millions of U.S. dollars) First Quarter ended June 30 2015 2016 Change in yen 2016 Sales and operating revenue ¥57.1 ¥44.1 -22.7% $429 Operating loss (2.3) (4.7) - (46) The Components segment includes batteries and recording media. Due to certain changes in Sony’s organizational structure, sales and operating revenue and operating income (loss) of the former Devices segment of the comparable prior period have been reclassified to conform to the current presentation. For details, please see Notes on page 8. Sales decreased 22.7% year-on-year (a 14% decrease on a constant currency basis) to 44.1 billion yen (429 million U.S. dollars). This decrease was primarily due to a significant decrease in sales in the battery business and the impact of foreign exchange rates. Operating loss increased 2.4 billion yen year-on-year to 4.7 billion yen (46 million U.S. dollars). This increase was primarily due to the above-mentioned decrease in sales and impairment charges against the long-lived assets in the recording media business, partially offset by a decrease in depreciation expenses in the battery business pursuant to a 30.6 billion yen impairment charge against its long-lived assets recorded in the previous fiscal year. During the current quarter, there was a 1.2 billion yen negative impact from foreign exchange rate fluctuations.
* * * * * Total inventory of the six Electronics* segments above as of June 30, 2016 was 636.2 billion yen (6,177 million U.S. dollars), a decrease of 41.6 billion yen, or 6.1% year-on-year. Inventory increased by 36.1 billion yen, or 6.0% compared with the level as of March 31, 2016. * The term “Electronics” refers to the sum of the MC, G&NS, IP&S, HE&S, Semiconductors and Components segments. In connection with the realignment made from the first quarter of the fiscal year ending March 31, 2017, total inventory of the six Electronics segments as of June 30, 2015 and March 31, 2016 has been reclassified to conform to the current presentation. For further details, please see Notes on page 8.
* * * * * Pictures (Billions of yen, millions of U.S. dollars) First Quarter ended June 30 2015 2016 Change in yen 2016 Sales and operating revenue ¥171.5 ¥183.3 +6.9% $1,780 Operating loss (11.7) (10.6) - (103) The Pictures segment is comprised of the Motion Pictures, Television Productions, and Media Networks categories. Motion Pictures includes the worldwide production, acquisition and distribution of motion pictures and direct-to-video content; Television Productions includes the production, acquisition and distribution of television programming; Media Networks includes the operation of television and digital networks worldwide. The results presented in Pictures are a yen-translation of the results of Sony Pictures Entertainment Inc. (“SPE”), a U.S.-based operation that aggregates the results of its worldwide subsidiaries on a U.S. dollar basis. Management analyzes the results of SPE in U.S. dollars, so discussion of certain portions of its results is specified as being on “a U.S. dollar basis.” Sales increased 6.9% year-on-year (a 20% increase on a U.S. dollar basis) to 183.3 billion yen (1,780 million U.S. dollars). The increase in sales on a U.S. dollar basis was primarily due to higher sales of Motion Pictures and Media Networks. Sales of Motion Pictures were significantly higher than the same quarter of the previous fiscal year primarily due to higher theatrical and television licensing revenues. Theatrical revenues increased due to the strong worldwide theatrical performance of films released in the current quarter including The Angry Birds Movie. Sales of Media Networks increased primarily due to higher advertising revenues in India and Latin America.
6
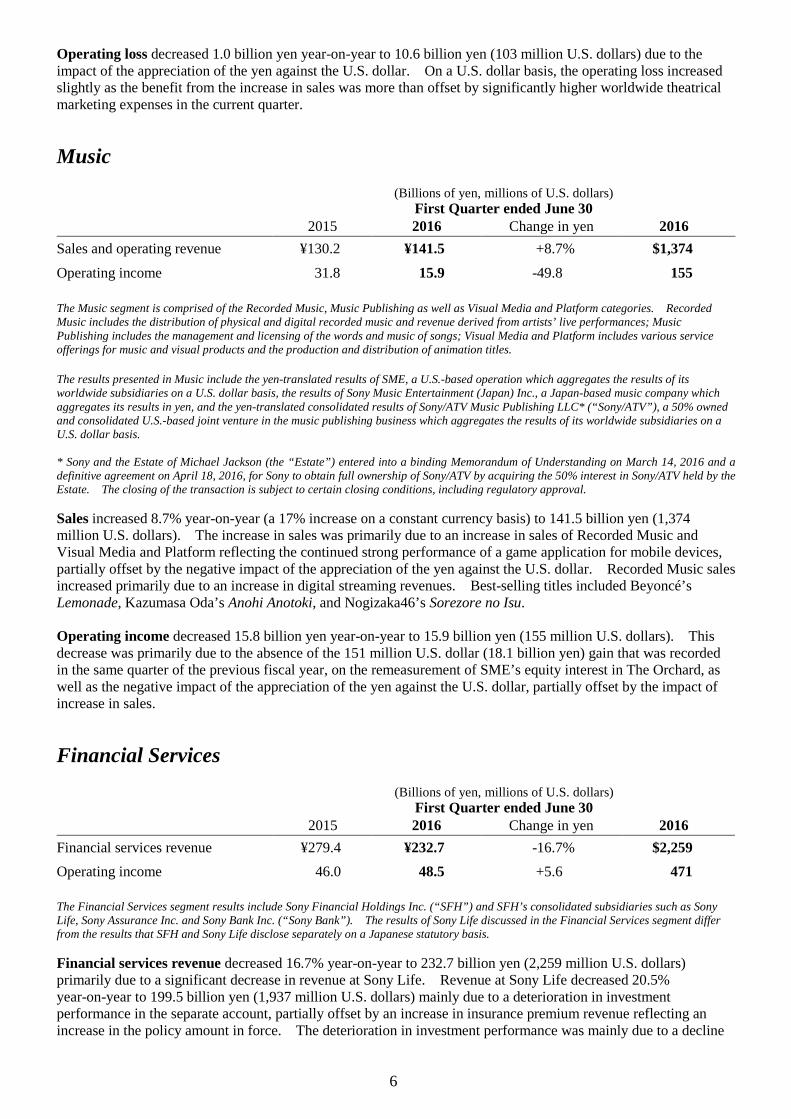
Operating loss decreased 1.0 billion yen year-on-year to 10.6 billion yen (103 million U.S. dollars) due to the impact of the appreciation of the yen against the U.S. dollar. On a U.S. dollar basis, the operating loss increased slightly as the benefit from the increase in sales was more than offset by significantly higher worldwide theatrical marketing expenses in the current quarter.
Music (Billions of yen, millions of U.S. dollars) First Quarter ended June 30 2015 2016 Change in yen 2016 Sales and operating revenue ¥130.2 ¥141.5 +8.7% $1,374 Operating income 31.8 15.9 -49.8 155 The Music segment is comprised of the Recorded Music, Music Publishing as well as Visual Media and Platform categories. Recorded Music includes the distribution of physical and digital recorded music and revenue derived from artists’ live performances; Music Publishing includes the management and licensing of the words and music of songs; Visual Media and Platform includes various service offerings for music and visual products and the production and distribution of animation titles. The results presented in Music include the yen-translated results of SME, a U.S.-based operation which aggregates the results of its worldwide subsidiaries on a U.S. dollar basis, the results of Sony Music Entertainment (Japan) Inc., a Japan-based music company which aggregates its results in yen, and the yen-translated consolidated results of Sony/ATV Music Publishing LLC* (“Sony/ATV”), a 50% owned and consolidated U.S.-based joint venture in the music publishing business which aggregates the results of its worldwide subsidiaries on a U.S. dollar basis. * Sony and the Estate of Michael Jackson (the “Estate”) entered into a binding Memorandum of Understanding on March 14, 2016 and a definitive agreement on April 18, 2016, for Sony to obtain full ownership of Sony/ATV by acquiring the 50% interest in Sony/ATV held by the Estate. The closing of the transaction is subject to certain closing conditions, including regulatory approval. Sales increased 8.7% year-on-year (a 17% increase on a constant currency basis) to 141.5 billion yen (1,374 million U.S. dollars). The increase in sales was primarily due to an increase in sales of Recorded Music and Visual Media and Platform reflecting the continued strong performance of a game application for mobile devices, partially offset by the negative impact of the appreciation of the yen against the U.S. dollar. Recorded Music sales increased primarily due to an increase in digital streaming revenues. Best-selling titles included Beyoncé’s Lemonade, Kazumasa Oda’s Anohi Anotoki, and Nogizaka46’s Sorezore no Isu. Operating income decreased 15.8 billion yen year-on-year to 15.9 billion yen (155 million U.S. dollars). This decrease was primarily due to the absence of the 151 million U.S. dollar (18.1 billion yen) gain that was recorded in the same quarter of the previous fiscal year, on the remeasurement of SME’s equity interest in The Orchard, as well as the negative impact of the appreciation of the yen against the U.S. dollar, partially offset by the impact of increase in sales.
Financial Services (Billions of yen, millions of U.S. dollars) First Quarter ended June 30 2015 2016 Change in yen 2016 Financial services revenue ¥279.4 ¥232.7 -16.7% $2,259 Operating income 46.0 48.5 +5.6 471 The Financial Services segment results include Sony Financial Holdings Inc. (“SFH”) and SFH’s consolidated subsidiaries such as Sony Life, Sony Assurance Inc. and Sony Bank Inc. (“Sony Bank”). The results of Sony Life discussed in the Financial Services segment differ from the results that SFH and Sony Life disclose separately on a Japanese statutory basis. Financial services revenue decreased 16.7% year-on-year to 232.7 billion yen (2,259 million U.S. dollars) primarily due to a significant decrease in revenue at Sony Life. Revenue at Sony Life decreased 20.5% year-on-year to 199.5 billion yen (1,937 million U.S. dollars) mainly due to a deterioration in investment performance in the separate account, partially offset by an increase in insurance premium revenue reflecting an increase in the policy amount in force. The deterioration in investment performance was mainly due to a decline

7
in the Japanese stock market during the current quarter, as compared with a rise in the same quarter of the previous fiscal year. Operating income increased 2.6 billion yen year-on-year to 48.5 billion yen (471 million U.S. dollars). This increase was mainly due to an increase in operating income at Sony Bank, reflecting a foreign exchange gain on foreign currency-denominated customer deposits compared to a loss in the same quarter of the previous fiscal year. Operating income at Sony Life was 41.5 billion yen (403 million U.S. dollars), essentially flat year-on-year.
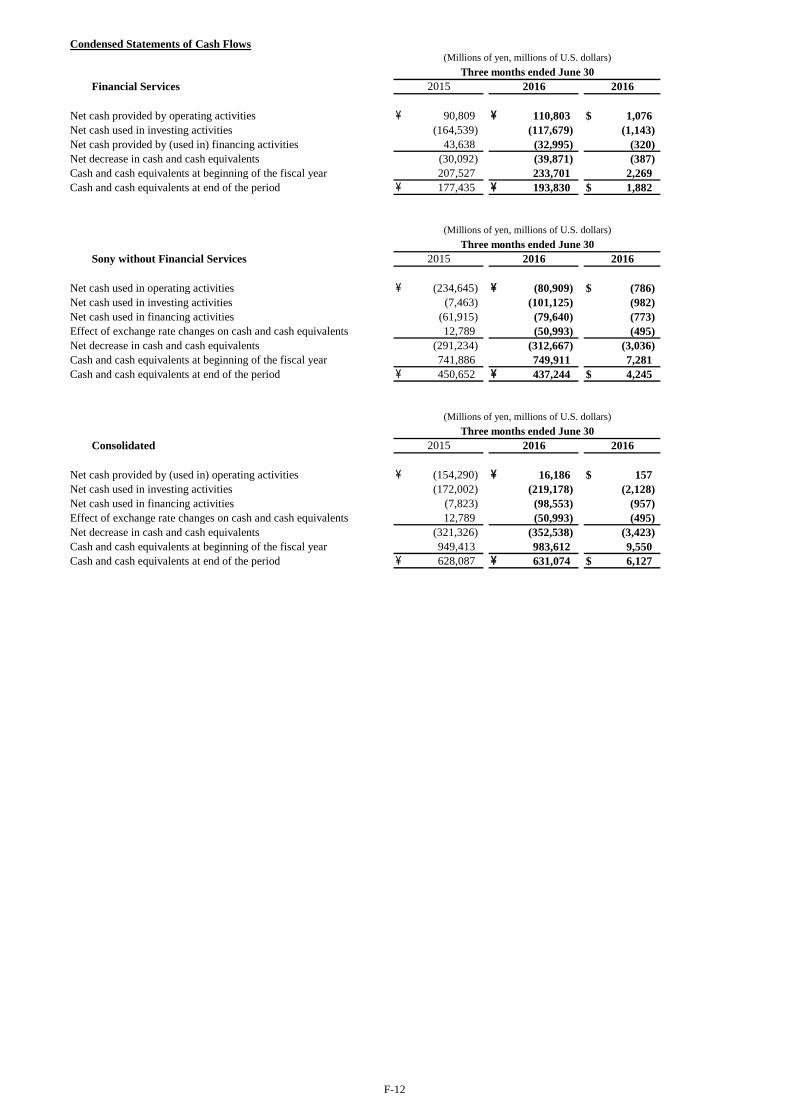
* * * * * Cash Flows For Consolidated Statements of Cash Flows, charts showing Sony’s cash flow information for all segments, all segments excluding the Financial Services segment and the Financial Services segment alone, please refer to pages F-4 and F-12. Operating Activities: During the current quarter, there was a net cash inflow of 16.2 billion yen (157 million U.S. dollars) from operating activities, compared to a net cash outflow of 154.3 billion yen in the same quarter of the previous fiscal year. For all segments excluding the Financial Services segment, there was a net cash outflow of 80.9 billion yen (786 million U.S. dollars), a decrease of 153.7 billion yen, or 65.5% year-on-year. This decrease was primarily due to a smaller decrease in accrued expenses in other current liabilities and an improvement in net income after taking into account non-cash adjustments (including depreciation and amortization, gain on sales of securities investments and other operating income (expense)). The Financial Services segment had a net cash inflow of 110.8 billion yen (1,076 million U.S. dollars), an increase of 20.0 billion yen, or 22.0% year-on-year. This increase was primarily due to an increase in net income after taking into account depreciation and amortization, including amortization of deferred insurance acquisition costs. Investing Activities: During the current quarter, Sony used 219.2 billion yen (2,128 million U.S. dollars) of net cash in investing activities, an increase of 47.2 billion yen, or 27.4% year-on-year. For all segments excluding the Financial Services segment, there was a net cash outflow of 101.1 billion yen (982 million U.S. dollars), an increase of 93.7 billion yen, or 1,255% year-on-year. The increase was mainly due to the absence of the cash inflow from the sales of certain shares of Olympus recorded in the same quarter of the previous fiscal year and an increase in the amount of fixed asset purchases. The Financial Services segment used 117.7 billion yen (1,143 million U.S. dollars) of net cash, a decrease of 46.9 billion yen, or 28.5% year-on-year. This decrease was mainly due to a year-on-year decrease in payments for investments and advances at Sony Life. In all segments excluding the Financial Services segment, net cash used in operating and investing activities combined*1 for the current quarter was 182.0 billion yen (1,767 million U.S. dollars), a decrease of 60.1 billion yen, or 24.8% year-on-year. Financing Activities: Net cash used by financing activities during the current quarter was 98.6 billion yen (957 million U.S. dollars), an increase of 90.7 billion yen, or 1,160% year-on-year. For all segments excluding the Financial Services segment, there was a 79.6 billion yen (773 million U.S. dollars) net cash outflow, an increase of 17.7 billion yen, or 28.6% year-on-year. This increase was primarily due to a decrease in short-term borrowings compared to an increase in the same quarter of the previous fiscal year, partially offset by a year-on-year decrease in repayment of long-term debt. In the Financial Services segment, there was a 33.0 billion yen (320 million U.S. dollars) net cash outflow, compared to a 43.6 billion yen net cash inflow in the same quarter of the previous fiscal year. This change was primarily due to a decrease in short-term borrowings at Sony Life in the current quarter, compared to an increase in the same quarter of the previous fiscal year.

8
Total Cash and Cash Equivalents: Accounting for the above factors and the effect of fluctuations in foreign exchange rates, the total outstanding balance of cash and cash equivalents at June 30, 2016 was 631.1 billion yen (6,127 million U.S. dollars). Cash and cash equivalents of all segments excluding the Financial Services segment was 437.2 billion yen (4,245 million U.S. dollars) at June 30, 2016, a decrease of 13.4 billion yen, or 3.0% compared with the balance as of June 30, 2015, and a decrease of 312.7 billion yen, or 41.7% compared with the balance as of March 31, 2016. Sony believes that it continues to maintain sufficient liquidity through access to a total, translated into yen, of 505.8 billion yen (4,911 million U.S. dollars) of unused committed lines of credit with financial institutions in addition to the cash and cash equivalents balance at June 30, 2016. Within the Financial Services segment, the outstanding balance of cash and cash equivalents was 193.8 billion yen (1,882 million U.S. dollars) at June 30, 2016, an increase of 16.4 billion yen, or 9.2% compared with the balance as of June 30, 2015, and a decrease of 39.9 billion yen, or 17.1% compared with the balance as of March 31, 2016. *1 Sony has included the information for cash flow from operating and investing activities combined, excluding the Financial Services segment’s
activities, as Sony’s management frequently monitors this financial measure, and believes this non-U.S. GAAP measurement is important for use in evaluating Sony’s ability to generate cash to maintain liquidity and fund debt principal and dividend payments from business activities other than its Financial Services segment. This information is derived from the reconciliations prepared in the Condensed Statements of Cash Flows on page F-12. This information and the separate condensed presentations shown below are not required or prepared in accordance with U.S. GAAP. The Financial Services segment’s cash flow is excluded from the measure because SFH, which constitutes a majority of the Financial Services segment, is a separate publicly traded entity in Japan with a significant minority interest and it, as well as its subsidiaries, secure liquidity on their own. This measure may not be comparable to those of other companies. This measure has limitations because it does not represent residual cash flows available for discretionary expenditures principally due to the fact that the measure does not deduct the principal payments required for debt service. Therefore, Sony believes it is important to view this measure as supplemental to its entire statement of cash flows and together with Sony’s disclosures regarding investments, available credit facilities and overall liquidity.
A reconciliation of the differences between the Consolidated Statement of Cash Flows reported and cash flows from operating and investing activities combined excluding the Financial Services segment’s activities is as follows: (Billions of yen, millions of U.S. dollars) First quarter ended June 30 2015 2016 2016 Net cash provided by (used in) operating activities reported in the consolidated statements
of cash flows ¥ (154.3) ¥ 16.2 $ 157 Net cash used in investing activities reported in the consolidated statements of cash flows (172.0) (219.2) (2,128) (326.3) (203.0) (1,971) Less: Net cash provided by operating activities within the Financial Services segment 90.8 110.8 1,076 Less: Net cash used in investing activities within the Financial Services segment (164.5) (117.7) (1,143) Eliminations *2 10.5 14.1 137 Cash flow used by operating and investing activities combined excluding the Financial
Services segment’s activities ¥ (242.1) ¥ (182.0) $ (1,767)
*2 Eliminations primarily consist of intersegment dividend payments.
* * * * *
Notes Business Segment Realignment Sony realigned its business segments from the first quarter of the fiscal year ending March 31, 2017 to reflect a change in the Corporate Executive Officers in charge of certain segments and modifications to the organizational structure of certain segments as of April 1, 2016. As a result of this realignment, Sony has separated the Devices segment into a Semiconductors segment and a Components segment. In addition, the operations of the automotive camera business, which were included in the IP&S segment, and the operations of the Imaging Device Development Division, which were included in Corporate and elimination, are now included in the Semiconductors segment. The sales and operating revenue and operating income (loss) of each segment in the fiscal year ended March 31, 2016 have been reclassified to conform to the current presentation. Impact of Foreign Exchange Rate Fluctuations on Sales and Operating Income (Loss) For all segments other than Pictures and Music, the impact of foreign exchange rate fluctuations on sales is calculated by applying the change in the yen’s periodic weighted average exchange rates for the first quarter ended June 30, 2015 from the first quarter ended June 30, 2016 to the major transactional currencies in which the sales are denominated. The impact of foreign exchange rate fluctuations on operating income (loss) described herein is calculated by subtracting from the impact on sales the impact on cost of sales and selling, general and administrative expenses calculated by applying the same major transactional currencies calculation process to cost of sales and selling, general and administrative expenses as for the impact on sales. Additionally, the MC segment enters into its own foreign exchange hedging transactions. The impact of those transactions is included in the impact of foreign exchange rate fluctuations on operating income (loss) for that segment. Since

9
the worldwide subsidiaries of the Pictures segment and of SME and Sony/ATV in the Music segment are aggregated on a U.S. dollar basis and are translated into yen, the impact of foreign exchange rate fluctuations is calculated by applying the change in the periodic weighted average exchange rates for the first quarter ended June 30, 2015 from the first quarter ended June 30, 2016 from U.S. dollar to yen to the U.S. dollar basis operating results. This information is not a substitute for Sony’s consolidated financial statements measured in accordance with U.S. GAAP. However, Sony believes that these disclosures provide additional useful analytical information to investors regarding the operating performance of Sony.
* * * * *
Outlook for the Fiscal Year Ending March 31, 2017 The forecast for consolidated results for the fiscal year ending March 31, 2017, as announced on May 24, 2016, has been revised as follows. (Billions of yen) Change - July Forecast from March 31, 2016
Results May
Forecast July
Forecast March 31, 2016
Results May
Forecast Sales and operating revenue ¥8,105.7 ¥7,800 ¥7,400 -8.7% -5.1% Operating income 294.2 300 300 + ¥5.8 bil - Income before income taxes 304.5 270 270 - 34.5 bil - Net income attributable to Sony
Corporation’s stockholders 147.8 80 80 - 67.8 bil -
Assumed foreign currency exchange rates for the remainder of the current fiscal year ending March 31, 2017 are the following.
Remainder of the current fiscal year
(For your reference) Remainder of the current fiscal year
at the time of the May forecast* Consolidated forecast and
forecasts for each segment Consolidated forecast Forecasts for each segment
1 U.S. dollar approximately 103 yen approximately 110 yen approximately 113 yen 1 Euro approximately 114 yen approximately 120 yen approximately 129 yen * The assumed foreign currency exchange rates for the segments were different from the assumed foreign currency exchange rates for the consolidated forecasts. The financial impact of the difference between the rates was included in the forecast for All Other, Corporate and elimination. Consolidated sales for the fiscal year ending March 31, 2017 are expected to be lower than the May forecast primarily due to the impact of foreign exchange rates as well as a decrease in sales of the MC, Pictures and G&NS segments, partially offset by an increase in sales in the IP&S segment. Consolidated operating income is expected to remain unchanged from the May forecast due to an expected decrease in operating loss in All Other, Corporate and elimination and expected increases in operating income in the IP&S and HE&S segments. This increase is expected to be offset by deterioration in the operating results of the Semiconductors, Components and Pictures segments. The negative impact on consolidated operating income related to the 2016 Kumamoto Earthquakes is expected to be approximately 26 billion yen in the IP&S segment and approximately 48 billion yen in the Semiconductors segment. In addition, since the sales of these two segments are expected to be lower than the level anticipated prior to the earthquakes, approximately 6 billion yen in fixed costs that were scheduled to be allocated to these two segments based on sales are no longer expected to be allocated from All Other, Corporate and elimination, resulting in a total expected negative impact on consolidated operating income of approximately 80 billion yen. However, this impact is expected to be partially offset by approximately 10 billion yen in insurance recoveries for the fiscal year ending March 31, 2017 that are expected to be included in the Semiconductors segment. At the time of the May forecast, the total negative impact on consolidated operating income related to the 2016 Kumamoto Earthquakes was expected to be approximately 115 billion yen, of which approximately 45 billion yen was expected to be in the IP&S segment, approximately 60 billion yen was expected to be in the Semiconductors segment and approximately 10 billion yen was expected to be in All Other, Corporate and elimination. At the time of the May forecast, Sony also expected this impact to be partially offset by approximately 10 billion yen in insurance recoveries for the fiscal year ending March 31, 2017, in the Semiconductors segment.
10
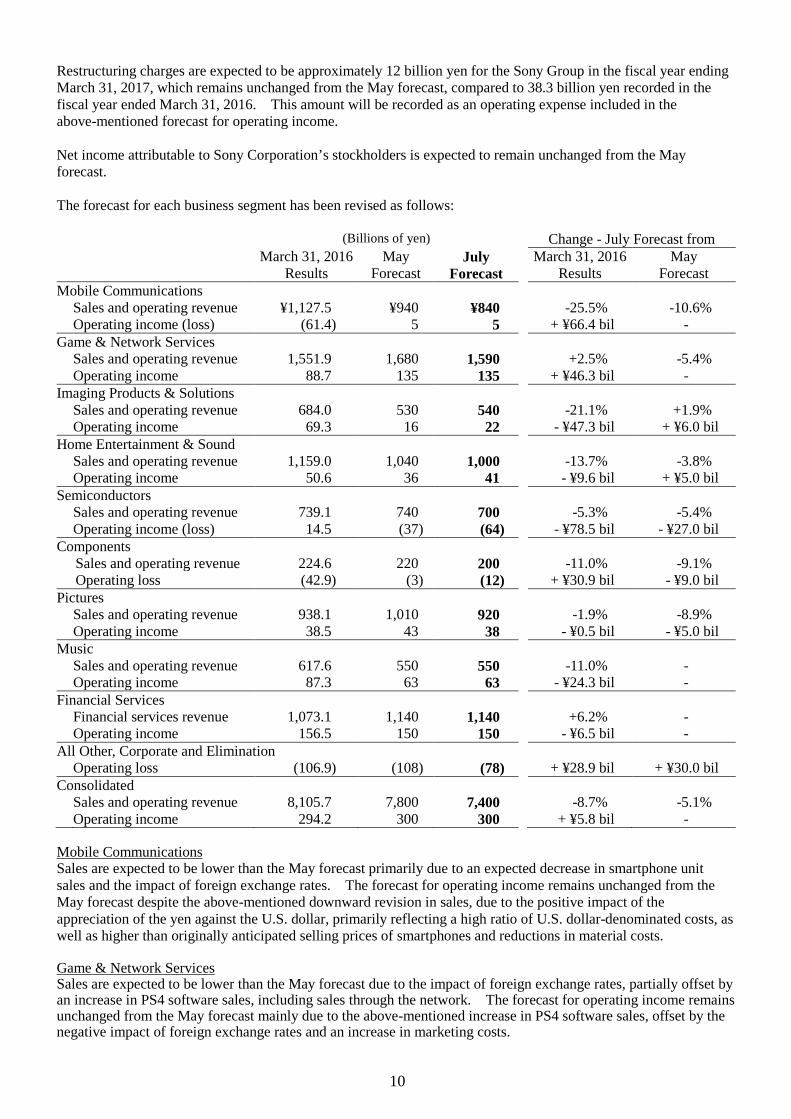
Restructuring charges are expected to be approximately 12 billion yen for the Sony Group in the fiscal year ending March 31, 2017, which remains unchanged from the May forecast, compared to 38.3 billion yen recorded in the fiscal year ended March 31, 2016. This amount will be recorded as an operating expense included in the above-mentioned forecast for operating income. Net income attributable to Sony Corporation’s stockholders is expected to remain unchanged from the May forecast. The forecast for each business segment has been revised as follows: (Billions of yen) Change - July Forecast from March 31, 2016
Results May
Forecast July
Forecast March 31, 2016
Results May
Forecast Mobile Communications Sales and operating revenue ¥1,127.5 ¥940 ¥840 -25.5% -10.6% Operating income (loss) (61.4) 5 5 + ¥66.4 bil - Game & Network Services Sales and operating revenue 1,551.9 1,680 1,590 +2.5% -5.4% Operating income 88.7 135 135 + ¥46.3 bil - Imaging Products & Solutions Sales and operating revenue 684.0 530 540 -21.1% +1.9% Operating income 69.3 16 22 - ¥47.3 bil + ¥6.0 bil Home Entertainment & Sound Sales and operating revenue 1,159.0 1,040 1,000 -13.7% -3.8% Operating income 50.6 36 41 - ¥9.6 bil + ¥5.0 bil Semiconductors Sales and operating revenue 739.1 740 700 -5.3% -5.4% Operating income (loss) 14.5 (37) (64) - ¥78.5 bil - ¥27.0 bil Components
Sales and operating revenue 224.6 220 200 -11.0% -9.1% Operating loss (42.9) (3) (12) + ¥30.9 bil - ¥9.0 bil
Pictures Sales and operating revenue 938.1 1,010 920 -1.9% -8.9% Operating income 38.5 43 38 - ¥0.5 bil - ¥5.0 bil Music Sales and operating revenue 617.6 550 550 -11.0% - Operating income 87.3 63 63 - ¥24.3 bil - Financial Services Financial services revenue 1,073.1 1,140 1,140 +6.2% - Operating income 156.5 150 150 - ¥6.5 bil - All Other, Corporate and Elimination Operating loss (106.9) (108) (78) + ¥28.9 bil + ¥30.0 bil Consolidated Sales and operating revenue 8,105.7 7,800 7,400 -8.7% -5.1% Operating income 294.2 300 300 + ¥5.8 bil - Mobile Communications Sales are expected to be lower than the May forecast primarily due to an expected decrease in smartphone unit sales and the impact of foreign exchange rates. The forecast for operating income remains unchanged from the May forecast despite the above-mentioned downward revision in sales, due to the positive impact of the appreciation of the yen against the U.S. dollar, primarily reflecting a high ratio of U.S. dollar-denominated costs, as well as higher than originally anticipated selling prices of smartphones and reductions in material costs. Game & Network Services Sales are expected to be lower than the May forecast due to the impact of foreign exchange rates, partially offset by an increase in PS4 software sales, including sales through the network. The forecast for operating income remains unchanged from the May forecast mainly due to the above-mentioned increase in PS4 software sales, offset by the negative impact of foreign exchange rates and an increase in marketing costs.

11
Imaging Products & Solutions Sales are expected to be higher than the May forecast due to a shorter-than-expected delay in the supply of components used for Still and Video Cameras resulting from the 2016 Kumamoto Earthquakes, partially offset by the impact of foreign exchange rates. Operating income is expected to be higher than the May forecast mainly due to the above-mentioned increase in sales and an expected improvement in product mix resulting from a shift to high value-added models in Still and Video Cameras, partially offset by the negative impact of foreign exchange rates. Home Entertainment & Sound Sales are expected to be lower than the May forecast primarily due to the impact of foreign exchange rates. Operating income is expected to be higher than the May forecast mainly due to cost reductions and an expected improvement in product mix, partially offset by the negative impact of foreign exchange rates. Semiconductors Sales are expected to be lower than the May forecast primarily due to lower-than-expected image sensor sales reflecting the impact of foreign exchange rates, partially offset by a faster-than-expected recovery from the 2016 Kumamoto Earthquakes. Operating income is expected to be lower than the May forecast mainly due to the negative impact of foreign exchange rates, partially offset by the favorable impact of the above-mentioned recovery. Components Sales are expected to be lower than the May forecast due to lower-than-expected sales in the battery business. Operating income is expected to be lower than the May forecast primarily due to the above-mentioned decrease in sales and impairment charges against long-lived assets in the recording media business in the current quarter. As announced on July 28, 2016, there is a possibility of recording a loss related to the transfer of the battery business if the binding definitive agreements are signed. This potential loss is not reflected in the consolidated results forecast because the amount of such loss will depend on the final negotiated terms of the definitive agreements. Pictures The forecasts for sales and operating income are expected to be lower than the May forecast primarily due to the negative impact of the appreciation of the yen against the U.S. dollar. Music The forecasts for sales and operating income remain unchanged from the May forecast due to the strong performance of Recorded Music and the strong performance of Visual Media and Platform, which benefitted from a game application for mobile devices, offset by the negative impact of the appreciation of the yen against the U.S. dollar. Financial Services The forecasts for financial services revenue and operating income remain unchanged from the May forecast. The effects of future gains and losses on investments held by the Financial Services segment due to market fluctuations have not been incorporated within the above forecast as it is difficult for Sony to predict market trends in the future. Accordingly, future market fluctuations could further impact the current forecast.
12
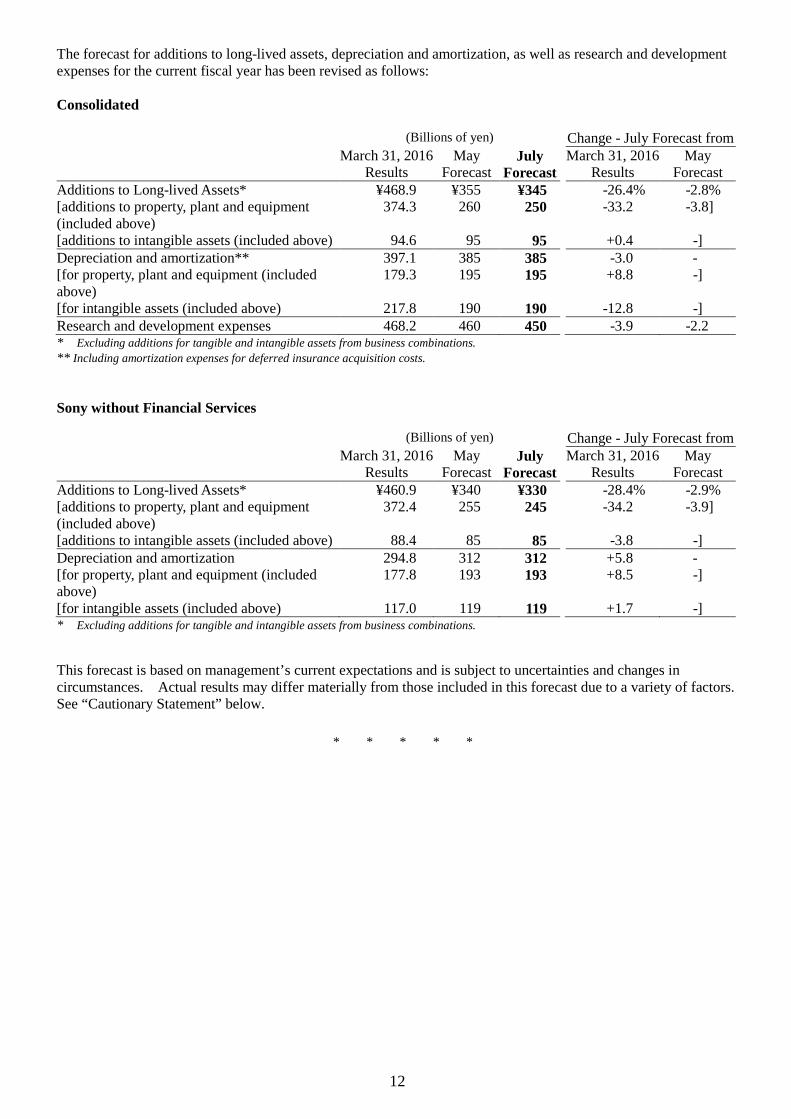
The forecast for additions to long-lived assets, depreciation and amortization, as well as research and development expenses for the current fiscal year has been revised as follows: Consolidated (Billions of yen) Change - July Forecast from March 31, 2016
Results May
Forecast July
Forecast March 31, 2016
Results May
Forecast Additions to Long-lived Assets* ¥468.9 ¥355 ¥345 -26.4% -2.8% [additions to property, plant and equipment (included above)
374.3 260 250 -33.2 -3.8]
[additions to intangible assets (included above) 94.6 95 95 +0.4 -] Depreciation and amortization** 397.1 385 385 -3.0 - [for property, plant and equipment (included above)
179.3 195 195 +8.8 -]
[for intangible assets (included above) 217.8 190 190 -12.8 -] Research and development expenses 468.2 460 450 -3.9 -2.2 * Excluding additions for tangible and intangible assets from business combinations. ** Including amortization expenses for deferred insurance acquisition costs. Sony without Financial Services (Billions of yen) Change - July Forecast from March 31, 2016
Results May
Forecast July
Forecast March 31, 2016
Results May
Forecast Additions to Long-lived Assets* ¥460.9 ¥340 ¥330 -28.4% -2.9% [additions to property, plant and equipment (included above)
372.4 255 245 -34.2 -3.9]
[additions to intangible assets (included above) 88.4 85 85 -3.8 -] Depreciation and amortization 294.8 312 312 +5.8 - [for property, plant and equipment (included above)
177.8 193 193 +8.5
-]
[for intangible assets (included above) 117.0 119 119 +1.7 -] * Excluding additions for tangible and intangible assets from business combinations. This forecast is based on management’s current expectations and is subject to uncertainties and changes in circumstances. Actual results may differ materially from those included in this forecast due to a variety of factors. See “Cautionary Statement” below.
* * * * *

13
Cautionary Statement
Statements made in this release with respect to Sony’s current plans, estimates, strategies and beliefs and other statements that are not historical facts are forward-looking statements about the future performance of Sony. Forward-looking statements include, but are not limited to, those statements using words such as “believe,” “expect,” “plans,” “strategy,” “prospects,” “forecast,” “estimate,” “project,” “anticipate,” “aim,” “intend,” “seek,” “may,” “might,” “could” or “should,” and words of similar meaning in connection with a discussion of future operations, financial performance, events or conditions. From time to time, oral or written forward-looking statements may also be included in other materials released to the public. These statements are based on management’s assumptions, judgments and beliefs in light of the information currently available to it. Sony cautions investors that a number of important risks and uncertainties could cause actual results to differ materially from those discussed in the forward-looking statements, and therefore investors should not place undue reliance on them. Investors also should not rely on any obligation of Sony to update or revise any forward-looking statements, whether as a result of new information, future events or otherwise. Sony disclaims any such obligation. Risks and uncertainties that might affect Sony include, but are not limited to: (i) the global economic environment in which Sony operates and the economic conditions in Sony’s markets, particularly levels of
consumer spending; (ii) foreign exchange rates, particularly between the yen and the U.S. dollar, the euro and other currencies in which Sony makes significant
sales and incurs production costs, or in which Sony’s assets and liabilities are denominated; (iii) Sony’s ability to continue to design and develop and win acceptance of, as well as achieve sufficient cost reductions for, its products
and services, including televisions, game and network platforms and smartphones, which are offered in highly competitive markets characterized by severe price competition and continual new product and service introductions, rapid development in technology and subjective and changing consumer preferences;
(iv) Sony’s ability and timing to recoup large-scale investments required for technology development and production capacity; (v) Sony’s ability to implement successful business restructuring and transformation efforts under changing market conditions; (vi) Sony’s ability to implement successful hardware, software, and content integration strategies for all segments excluding the Financial
Services segment, and to develop and implement successful sales and distribution strategies in light of the Internet and other technological developments;
(vii) Sony’s continued ability to devote sufficient resources to research and development and, with respect to capital expenditures, to prioritize investments correctly (particularly in the electronics businesses);
(viii) Sony’s ability to maintain product quality and customers’ satisfaction with its existing products and services; (ix) the effectiveness of Sony’s strategies and their execution, including but not limited to the success of Sony’s acquisitions, joint ventures
and other strategic investments; (x) significant volatility and disruption in the global financial markets or a ratings downgrade; (xi) Sony’s ability to forecast demands, manage timely procurement and control inventories; (xii) the outcome of pending and/or future legal and/or regulatory proceedings; (xiii) shifts in customer demand for financial services such as life insurance and Sony’s ability to conduct successful asset liability
management in the Financial Services segment; (xiv) the impact of changes in interest rates and unfavorable conditions or developments (including market fluctuations or volatility) in the
Japanese equity markets on the revenue and operating income of the Financial Services segment; (xv) Sony’s ability to anticipate and manage cybersecurity risk, including the risk of unauthorized access to Sony’s business information,
potential business disruptions or financial losses; and (xvi) risks related to catastrophic disasters or similar events. Risks and uncertainties also include the impact of any future events with material adverse impact. Investor Relations Contacts:
Tokyo New York London Atsuko Murakami Justin Hill Toshiyuki Takahashi +81-(0)3-6748-2111 +1-212-833-6722 +44-(0)1932-816-000
IR home page: http://www.sony.net/IR/ Presentation slides: http://www.sony.net/SonyInfo/IR/library/er.html

F-1
(Unaudited)Consolidated Financial StatementsConsolidated Balance Sheets
Current assets:Cash and cash equivalents \ 983,612 \ 631,074 \ -352,538 $ 6,127 Marketable securities 946,397 897,494 -48,903 8,714 Notes and accounts receivable, trade 926,375 917,215 -9,160 8,905 Allowance for doubtful accounts and sales returns (72,783) (47,800) +24,983 (464)Inventories 683,146 717,930 +34,784 6,970 Other receivables 206,058 234,730 +28,672 2,279 Deferred income taxes 40,940 38,744 -2,196 376 Prepaid expenses and other current assets 482,982 512,999 +30,017 4,980 Total current assets 4,196,727 3,902,386 -294,341 37,887
Film costs 301,228 310,317 +9,089 3,013 Investments and advances:
Affiliated companies 164,874 161,296 -3,578 1,566 Securities investments and other 9,069,209 9,208,539 +139,330 89,403
9,234,083 9,369,835 +135,752 90,969 Property, plant and equipment:
Land 121,707 120,204 -1,503 1,167 Buildings 655,379 635,916 -19,463 6,174 Machinery and equipment 1,795,991 1,773,934 -22,057 17,223 Construction in progress 69,286 57,891 -11,395 562
2,642,363 2,587,945 -54,418 25,126 Less-Accumulated depreciation 1,821,545 1,803,994 -17,551 17,515
820,818 783,951 -36,867 7,611 Other assets:
Intangibles, net 615,754 576,101 -39,653 5,593 Goodwill 606,290 567,870 -38,420 5,513 Deferred insurance acquisition costs 511,834 510,568 -1,266 4,957 Deferred income taxes 97,639 96,533 -1,106 937 Other 289,017 264,184 -24,833 2,566
2,120,534 2,015,256 -105,278 19,566 Total assets \ 16,673,390 \ 16,381,745 \ -291,645 $ 159,046
Current liabilities:Short-term borrowings \ 149,272 \ 111,116 \ -38,156 $ 1,079 Current portion of long-term debt 187,668 154,189 -33,479 1,497 Notes and accounts payable, trade 550,964 609,843 +58,879 5,921 Accounts payable, other and accrued expenses 1,367,115 1,194,303 -172,812 11,595 Accrued income and other taxes 88,865 89,072 +207 865 Deposits from customers in the banking business 1,912,673 1,900,796 -11,877 18,454 Other 574,193 523,156 -51,037 5,079 Total current liabilities 4,830,750 4,582,475 -248,275 44,490
Long-term debt 556,605 533,718 -22,887 5,182 Accrued pension and severance costs 462,384 452,981 -9,403 4,398 Deferred income taxes 450,926 448,895 -2,031 4,358 Future insurance policy benefits and other 4,509,215 4,601,792 +92,577 44,678 Policyholders’ account in the life insurance business 2,401,320 2,388,889 -12,431 23,193 Other 330,302 298,256 -32,046 2,895 Total liabilities 13,541,502 13,307,006 -234,496 129,194 Redeemable noncontrolling interest 7,478 6,293 -1,185 61 Equity:Sony Corporation’s stockholders’ equity:
Common stock 858,867 859,002 +135 8,340 Additional paid-in capital 1,325,719 1,326,415 +696 12,878 Retained earnings 936,331 957,497 +21,166 9,296 Accumulated other comprehensive income (653,318) (730,465) -77,147 (7,092)Treasury stock, at cost (4,259) (4,280) -21 (42)
2,463,340 2,408,169 -55,171 23,380 Noncontrolling interests 661,070 660,277 -793 6,411 Total equity 3,124,410 3,068,446 -55,964 29,791 Total liabilities and equity \ 16,673,390 \ 16,381,745 \ -291,645 $ 159,046
(Millions of yen, millions of U.S. dollars)March 31 June 30 Change from June 30
2016March 31, 2016
LIABILITIES AND EQUITY
ASSETS 2016 2016

F-2
Consolidated Statements of Income
Sales and operating revenue:Net sales \ 1,503,311 \ 1,362,517 $ 13,228 Financial services revenue 277,689 230,909 2,242 Other operating revenue 27,059 19,773 192
1,808,059 1,613,199 -10.8 % 15,662
Costs and expenses:Cost of sales 1,134,269 1,015,623 9,860 Selling, general and administrative 378,722 338,097 3,282 Financial services expenses 232,038 181,631 1,763 Other operating (income) expense, net (33,454) 20,873 203
1,711,575 1,556,224 -9.1 15,108
Equity in net income (loss) of affiliated companies 423 (783) - (8)
Operating income 96,907 56,192 -42.0 546
Other income:Interest and dividends 2,652 3,227 31 Gain on sale of securities investments, net 50,782 72 1 Foreign exchange gain, net - 1,615 16 Other 647 1,030 10
54,081 5,944 -89.0 58
Other expenses:Interest 4,394 3,801 37 Foreign exchange loss, net 5,746 - - Other 2,138 1,319 13
12,278 5,120 -58.3 50
Income before income taxes 138,710 57,016 -58.9 554
Income taxes 39,812 20,475 199
Net income 98,898 36,541 -63.1 355
Less - Net income attributable to noncontrolling interests 16,457 15,375 150
Net income attributable to Sony Corporation’s stockholders \ 82,441 \ 21,166 -74.3 % $ 205
Per share data:Net income attributable to Sony Corporation’s stockholders — Basic \ 70.52 \ 16.78 -76.2 % $ 0.16 — Diluted 70.36 16.44 -76.6 0.16
Net income \ 98,898 \ 36,541 -63.1 % $ 355
Other comprehensive income, net of tax –Unrealized gains (losses) on securities (47,066) 20,395 198 Unrealized losses on derivative instruments (636) (145) (1)Pension liability adjustment 202 3,226 31 Foreign currency translation adjustments 27,607 (90,998) (883)
Total comprehensive income (loss) 79,005 (30,981) - (300)
Less - Comprehensive income attributable to noncontrolling interests 13,460 25,000 244
Comprehensive income (loss) attributable to Sony Corporation’s stockholders \ 65,545 \ (55,981) - % $ (544)
(Millions of yen, millions of U.S. dollars, except per share amounts)Three months ended June 30
2015 2016 2016Change from 2015
Consolidated Statements of Comprehensive Income(Millions of yen, millions of U.S. dollars)
Three months ended June 302015 2016 Change from 2015 2016

F-3
Supplemental equity and comprehensive income information
Balance at March 31, 2015 \ 2,317,077 \ 611,392 \ 2,928,469 Exercise of stock acquisition rights 1,130 - 1,130 Stock based compensation 287 - 287
Comprehensive income:Net income 82,441 16,457 98,898 Other comprehensive income, net of tax –
Unrealized losses on securities (43,356) (3,710) (47,066)Unrealized losses on derivative instruments (636) - (636)Pension liability adjustment 200 2 202 Foreign currency translation adjustments 26,896 711 27,607
Total comprehensive income 65,545 13,460 79,005
Dividends declared - (9,847) (9,847)Transactions with noncontrolling interests shareholders and other 26 1,985 2,011 Balance at June 30, 2015 \ 2,384,065 \ 616,990 \ 3,001,055
Balance at March 31, 2016 \ 2,463,340 \ 661,070 \ 3,124,410 Exercise of stock acquisition rights 268 - 268 Stock based compensation 568 - 568
Comprehensive income:Net income 21,166 15,375 36,541 Other comprehensive income, net of tax –
Unrealized gains on securities 9,029 11,366 20,395 Unrealized losses on derivative instruments (145) - (145)Pension liability adjustment 3,216 10 3,226 Foreign currency translation adjustments (89,247) (1,751) (90,998)
Total comprehensive income (loss) (55,981) 25,000 (30,981)
Dividends declared - (16,434) (16,434)Transactions with noncontrolling interests shareholders and other (26) (9,359) (9,385)Balance at June 30, 2016 \ 2,408,169 \ 660,277 \ 3,068,446
Balance at March 31, 2016 $ 23,916 $ 6,418 $ 30,334 Exercise of stock acquisition rights 3 - 3 Stock based compensation 6 - 6
Comprehensive income:Net income 205 150 355 Other comprehensive income, net of tax –
Unrealized gains on securities 88 110 198 Unrealized losses on derivative instruments (1) - (1)Pension liability adjustment 31 0 31 Foreign currency translation adjustments (867) (16) (883)
Total comprehensive income (loss) (544) 244 (300)
Dividends declared - (160) (160)Transactions with noncontrolling interests shareholders and other (1) (91) (92)Balance at June 30, 2016 $ 23,380 $ 6,411 $ 29,791
(Millions of yen, millions of U.S. dollars)Sony Corporation’sstockholders’ equity
Noncontrollinginterests Total equity
Sony Corporation’sstockholders’ equity
Noncontrollinginterests Total equity

F-4
Consolidated Statements of Cash Flows
Cash flows from operating activities:Net income \ 98,898 \ 36,541 $ 355 Adjustments to reconcile net income to net cashprovided by (used in) operating activities:
Depreciation and amortization, including amortization of deferred insurance acquisition costs 87,021 93,557 908 Amortization of film costs 63,356 61,229 594 Accrual for pension and severance costs, less payments (3,035) 3,449 33 Other operating (income) expense, net (33,454) 20,873 203 Gain on sale or devaluation of securities investments, net (50,706) (72) (1) (Gain) loss on revaluation of marketable securities held in the financial services business for trading purposes, net (19,088) 47,138 458 Loss on revaluation or impairment of securities investments held in the financial services business, net 2,069 2 0Deferred income taxes 5,471 (266) (3) Equity in net (income) loss of affiliated companies, net of dividends 798 2,533 25 Changes in assets and liabilities: Increase in notes and accounts receivable, trade (83,030) (80,709) (784) Increase in inventories (103,603) (75,044) (729) Increase in film costs (105,273) (98,223) (954) Increase in notes and accounts payable, trade 132,276 76,274 741 Decrease in accrued income and other taxes (6,378) (2,776) (27) Increase in future insurance policy benefits and other 128,265 55,216 536 Increase in deferred insurance acquisition costs (21,790) (20,528) (199) Increase in marketable securities held in the financial services business for trading purposes (21,679) (26,702) (259) Increase in other current assets (62,015) (75,600) (734) Decrease in other current liabilities (147,587) (62,884) (611) Other (14,806) 62,178 605 Net cash provided by (used in) operating activities (154,290) 16,186 157
Cash flows from investing activities:Payments for purchases of fixed assets (77,034) (106,002) (1,029) Proceeds from sales of fixed assets 2,484 1,829 18 Payments for investments and advances by financial services business (316,299) (205,729) (1,997) Payments for investments and advances (other than financial services business) (4,323) (2,585) (25) Proceeds from sales or return of investments and collections of advances by financial services business 153,984 88,144 856 Proceeds from sales or return of investments and collections of advances (other than financial services business) 74,358 2,383 23 Proceeds from sales of businesses 17,790 - -
Other (22,962) 2,782 26 Net cash used in investing activities (172,002) (219,178) (2,128)
Cash flows from financing activities:Proceeds from issuance of long-term debt 9,712 1,031 10 Payments of long-term debt (84,767) (48,607) (472) Increase (decrease) in short-term borrowings, net 62,111 (34,895) (339) Increase in deposits from customers in the financial services business, net 20,392 12,406 120 Dividends paid (59) (12,679) (123) Other (15,212) (15,809) (153)
Net cash used in financing activities (7,823) (98,553) (957)
Effect of exchange rate changes on cash and cash equivalents 12,789 (50,993) (495)
Net decrease in cash and cash equivalents (321,326) (352,538) (3,423) Cash and cash equivalents at beginning of the fiscal year 949,413 983,612 9,550
Cash and cash equivalents at end of the period \ 628,087 \ 631,074 $ 6,127
(Millions of yen, millions of U.S. dollars)
2015 2016 2016Three months ended June 30

F-5
Business Segment Information
Sales and operating revenueMobile Communications
Customers \ 279,536 \ 184,868 -33.9 % $ 1,795 Intersegment 988 1,055 10 Total 280,524 185,923 -33.7 1,805
Game & Network ServicesCustomers 265,898 310,768 +16.9 3,017 Intersegment 22,691 19,611 191 Total 288,589 330,379 +14.5 3,208
Imaging Products & SolutionsCustomers 163,514 120,365 -26.4 1,169 Intersegment 1,233 1,861 18 Total 164,747 122,226 -25.8 1,187
Home Entertainment & SoundCustomers 252,487 234,915 -7.0 2,281 Intersegment 662 1,004 9 Total 253,149 235,919 -6.8 2,290
SemiconductorsCustomers 150,506 118,273 -21.4 1,148 Intersegment 36,859 26,157 254 Total 187,365 144,430 -22.9 1,402
ComponentsCustomers 49,007 37,841 -22.8 367 Intersegment 8,079 6,295 62 Total 57,086 44,136 -22.7 429
PicturesCustomers 171,420 183,123 +6.8 1,778 Intersegment 129 194 2 Total 171,549 183,317 +6.9 1,780
MusicCustomers 126,980 138,019 +8.7 1,340 Intersegment 3,211 3,495 34 Total 130,191 141,514 +8.7 1,374
Financial ServicesCustomers 277,689 230,909 -16.8 2,242 Intersegment 1,697 1,810 17 Total 279,386 232,719 -16.7 2,259
All OtherCustomers 58,710 47,431 -19.2 460 Intersegment 18,866 13,154 128 Total 77,576 60,585 -21.9 588
Corporate and elimination (82,103) (67,949) - (660)Consolidated total \ 1,808,059 \ 1,613,199 -10.8 % $ 15,662
Mobile Communications \ (22,924) \ 415 - % $ 4 Game & Network Services 19,459 44,031 +126.3 427 Imaging Products & Solutions 17,731 7,506 -57.7 73 Home Entertainment & Sound 10,923 20,241 +85.3 197 Semiconductors 32,724 (43,549) - (423)Components (2,298) (4,735) - (46)Pictures (11,687) (10,640) - (103)Music 31,750 15,938 -49.8 155 Financial Services 45,972 48,547 +5.6 471 All Other (2,097) (2,072) - (20)Total 119,553 75,682 -36.7 735
Corporate and elimination (22,646) (19,490) - (189)Consolidated total \ 96,907 \ 56,192 -42.0 % $ 546
(Millions of yen, millions of U.S. dollars)Three months ended June 30
2015 2016 Change 2016
Game & Network Services (“G&NS”) intersegment amounts primarily consist of transactions with All Other.Semiconductors intersegment amounts primarily consist of transactions with the Mobile Communications (“MC”) segment, the G&NS segmentand the Imaging Products & Solutions (“IP&S”) segment.All Other intersegment amounts primarily consist of transactions with the Pictures segment, the Music segment and the G&NS segment.Corporate and elimination includes certain brand and patent royalty income.
The 2015 segment disclosure above has been reclassified to reflect the change in the business segment classification discussed in Note 5.Operating income (loss) is sales and operating revenue less costs and expenses, and includes equity in net income (loss) of affiliated companies.Corporate and elimination includes headquarters restructuring costs, and certain other corporate expenses, including the amortization of certainintellectual property assets such as the cross-licensing of intangible assets acquired from Ericsson at the time of the Sony Mobile Communicationsacquisition, which are not allocated to segments.Pursuant to a separation of Sony’s businesses into distinct subsidiaries and a realignment of corporate functions, beginning from the fiscal yearending March 31, 2017, a change has been made to the method of calculating the amount of corporate costs allocated to each business segment andthe amount of royalties paid by each business segment for brand and patent utilization. As a result of this change, an increase in corporate incomeof 6,503 million yen is included in the Corporate and elimination for the fiscal year ending March 31, 2017. Conversely, an increase (decrease) inexpenses totaling the same amount is included in each of the following business segments: 653 million yen in the MC segment, (28) million yen inthe G&NS segment, 816 million yen in the IP&S segment, 2,897 million yen in the HE&S segment, 772 million yen in the Semiconductorssegment, 323 million yen in the Components segment, 640 million yen in the Pictures segment and 430 million yen in the Music segment. There isno change to the Financial Services segment. These changes have no impact on consolidated operating income.
(Millions of yen, millions of U.S. dollars)Three months ended June 30
Operating income (loss) 2015 2016 Change 2016

F-6
Sales to Customers by Product Category
Mobile Communications \ 279,536 \ 184,868 -33.9 % $ 1,795
Game & Network ServicesHardware 129,465 119,165 -8.0 1,157 Network 105,801 145,558 +37.6 1,413 Other 30,632 46,045 +50.3 447
Total 265,898 310,768 +16.9 3,017
Imaging Products & SolutionsStill and Video Cameras 110,050 75,529 -31.4 733 Other 53,464 44,836 -16.1 436 Total 163,514 120,365 -26.4 1,169
Home Entertainment & SoundTelevisions 168,920 166,293 -1.6 1,614 Audio and Video 81,311 68,307 -16.0 663 Other 2,256 315 -86.0 4 Total 252,487 234,915 -7.0 2,281
Semiconductors 150,506 118,273 -21.4 1,148
Components 49,007 37,841 -22.8 367
PicturesMotion Pictures 58,175 75,322 +29.5 731 Television Productions 50,975 44,193 -13.3 429 Media Networks 62,270 63,608 +2.1 618 Total 171,420 183,123 +6.8 1,778
MusicRecorded Music 89,328 89,706 +0.4 871 Music Publishing 17,844 15,651 -12.3 152 Visual Media and Platform 19,808 32,662 +64.9 317 Total 126,980 138,019 +8.7 1,340
Financial Services 277,689 230,909 -16.8 2,242 All Other 58,710 47,431 -19.2 460 Corporate 12,312 6,687 -45.7 65 Consolidated total \ 1,808,059 \ 1,613,199 -10.8 % $ 15,662
Sales and operating revenue (to external customers)
The above table includes a breakdown of sales and operating revenue to external customers for certain segments shown in theBusiness Segment Information on page F-5. Sony management views each segment as a single operating segment. However, Sonybelieves that the breakdown of sales and operating revenue to external customers for the segments in this table is useful to investorsin understanding sales by product category.
Sony has realigned its product category configuration from the first quarter of the fiscal year ended March 31, 2017. In connectionwith the realignment, all prior period sales amounts by product category in the table above have been reclassified to conform to thecurrent presentation.
In the G&NS segment, Hardware includes home and portable game consoles; Network includes network services relating to game, video and music content provided by Sony Interactive Entertainment; Other includes packaged software and peripheral devices. In the IP&S segment, Still cameras and Video Cameras includes interchangeable lens cameras, compact digital cameras, consumer video cameras and video cameras for broadcast; Other includes display products such as projectors and medical equipment. In the HE&S segment, Televisions includes LCD televisions; Audio and Video includes Blu-ray disc players and recorders, home audio, headphones and memory-based portable audio devices. The Semiconductors segment includes image sensors and camera modules. The Components segment includes batteries and recording media. In the Pictures segment, Motion Pictures includes the worldwide production, acquisition and distribution of motion pictures and direct-to-video content; Television Productions includes the production, acquisition and distribution of television programming; Media Networks includes the operation of television and digital networks worldwide. In the Music segment, Recorded Music includes the distribution of physical and digital recorded music and revenue derived from artists' live performances; Music Publishing includes the management and licensing of the words and music of songs; Visual Media and Platform includes various service offerings for music and visual products and the production and distribution of animation titles.
(Millions of yen, millions of U.S. dollars)Three months ended June 30
2015 2016 Change 2016

F-7
Other Items
Mobile Communications \ 6,196 \ 5,151 -16.9 % $ 50 Game & Network Services 4,640 5,529 +19.2 54 Imaging Products & Solutions 7,098 6,085 -14.3 59 Home Entertainment & Sound 5,581 5,153 -7.7 50 Semiconductors 21,950 25,306 +15.3 245 Components 2,745 880 -67.9 9 Pictures 5,252 4,934 -6.1 48 Music 4,181 3,687 -11.8 36 Financial Services, including deferred insurance acquisition costs 16,521 24,363 +47.5 236 All Other 1,444 1,425 -1.3 14 Total 75,608 82,513 +9.1 801 Corporate 11,413 11,044 -3.2 107 Consolidated total \ 87,021 \ 93,557 +7.5 % $ 908
Mobile Communications \ 7,737 \ 315 \ 8,052 Game & Network Services 15 - 15 Imaging Products & Solutions 44 - 44 Home Entertainment & Sound (57) - (57)Semiconductors (30) - (30)Components - - -
Pictures 49 - 49 Music 77 - 77 Financial Services - - -
All Other and Corporate 1,578 403 1,981 Consolidated total \ 9,413 \ 718 \ 10,131
Mobile Communications \ 322 \ - \ 322 Game & Network Services 110 - 110 Imaging Products & Solutions 7 - 7 Home Entertainment & Sound 12 - 12 Semiconductors 3 - 3 Components - - -Pictures 835 - 835 Music 110 - 110 Financial Services - - -All Other and Corporate 346 - 346 Consolidated total \ 1,745 \ - \ 1,745
Mobile Communications $ 3 $ - $ 3 Game & Network Services 1 - 1 Imaging Products & Solutions 0 - 0 Home Entertainment & Sound 0 - 0 Semiconductor 0 - 0 Components - - -Pictures 8 - 8 Music 1 - 1 Financial Services - - -All Other and Corporate 4 - 4 Consolidated total $ 17 $ - $ 17
Three months ended June 30, 2016
Restructuring charges and associated depreciation
Total netrestructuring
charges
Depreciationassociated with
restructuredassets
Three months ended June 30, 2015
Restructuring charges and associated depreciation
Total netrestructuring
charges
Depreciationassociated with
restructuredassets
Total
Total
Restructuring charges and associated depreciation
Total netrestructuring
charges
Depreciationassociated with
restructuredassets
Total
Depreciation associated with restructured assets as used in the context of the disclosures regarding restructuring activities refers to the increase indepreciation expense caused by revising the useful life and the salvage value of depreciable fixed assets under an approved restructuring plan.Any impairment of the assets is recognized immediately in the period it is identified.
Three months ended June 30, 2016
(Millions of yen, millions of U.S. dollars)
(Millions of yen, millions of U.S. dollars)Three months ended June 30
Depreciation and amortization 2015 2016 2016Change

F-8
Geographic Information
Sales and operating revenue (to external customers)
Japan \ 561,581 \ 511,411 -8.9 % $ 4,965 United States 352,393 353,614 +0.3 3,433 Europe 367,705 345,517 -6.0 3,355 China 130,701 109,073 -16.5 1,059 Asia-Pacific 238,947 191,670 -19.8 1,861 Other Areas 156,732 101,914 -35.0 989 Total \ 1,808,059 \ 1,613,199 -10.8 % $ 15,662
Geographic Information shows sales and operating revenue recognized by location of customers.Major countries and areas in each geographic segment excluding Japan, United States and China are as follows:
(1) Europe: United Kingdom, France, Germany, Russia, Spain and Sweden(2) Asia-Pacific: India, South Korea and Oceania(3) Other Areas: The Middle East/Africa, Brazil, Mexico and Canada
Three months ended June 302015 2016 Change 2016
(Millions of yen, millions of U.S. dollars)

F-9
Condensed Financial Services Financial Statements
Condensed Balance Sheets
Financial Services
Current assets:Cash and cash equivalents \ 233,701 \ 193,830 $ 1,882 Marketable securities 943,195 894,239 8,682 Other 151,248 188,755 1,832
1,328,144 1,276,824 12,396
Investments and advances 9,004,981 9,159,645 88,929 Property, plant and equipment 18,047 18,723 182 Other assets:
Deferred insurance acquisition costs 511,834 510,568 4,957 Other 52,523 52,570 510
564,357 563,138 5,467 Total assets \ 10,915,529 \ 11,018,330 $ 106,974
Current liabilities:Short-term borrowings \ 93,398 \ 71,709 $ 696 Deposits from customers in the banking business 1,912,673 1,900,796 18,454 Other 203,161 206,649 2,006
2,209,232 2,179,154 21,156
Long-term debt 34,567 35,511 345 Future insurance policy benefits and other 4,509,215 4,601,792 44,678 Policyholders’ account in the life insurance business 2,401,320 2,388,889 23,193 Other 374,359 387,569 3,763
Total liabilities 9,528,693 9,592,915 93,135
Equity:Stockholders’ equity of Financial Services 1,385,515 1,425,953 13,844 Noncontrolling interests 1,321 (538) (5)
Total equity 1,386,836 1,425,415 13,839 Total liabilities and equity \ 10,915,529 \ 11,018,330 $ 106,974
The results of the Financial Services segment are included in Sony’s consolidated financial statements. The following schedulesshow unaudited condensed financial statements for the Financial Services segment and all other segments excluding FinancialServices. These presentations are not in accordance with accounting principles generally accepted in the United States of America(“U.S. GAAP”), which is used by Sony to prepare its consolidated financial statements. However, because the Financial Servicessegment is different in nature from Sony’s other segments, Sony believes that a comparative presentation may be useful inunderstanding and analyzing Sony’s consolidated financial statements. Transactions between the Financial Services segment andSony without the Financial Services segment, including noncontrolling interests, are included in those respective presentations, theneliminated in the consolidated figures shown below.
(Millions of yen, millions of U.S. dollars)
ASSETS
LIABILITIES AND EQUITY
2016 2016 2016March 31 June 30

F-10
Current assets:Cash and cash equivalents \ 749,911 \ 437,244 $ 4,245 Marketable securities 3,202 3,255 32 Notes and accounts receivable, trade 847,788 863,525 8,384 Other 1,272,710 1,326,777 12,881
2,873,611 2,630,801 25,542 Film costs 301,228 310,317 3,013 Investments and advances 309,184 289,898 2,815 Investments in Financial Services, at cost 111,476 111,476 1,082 Property, plant and equipment 801,485 763,942 7,417 Other assets 1,559,646 1,455,858 14,134
Total assets \ 5,956,630 \ 5,562,292 $ 54,003
Current liabilities:Short-term borrowings \ 243,543 \ 193,597 $ 1,880 Notes and accounts payable, trade 550,964 609,843 5,921 Other 1,832,039 1,605,118 15,583
2,626,546 2,408,558 23,384 Long-term debt 525,507 501,947 4,873 Accrued pension and severance costs 433,302 423,263 4,109 Other 462,319 415,295 4,033
Total liabilities 4,047,674 3,749,063 36,399 Redeemable noncontrolling interest 7,478 6,293 61 Equity:Stockholders’ equity of Sony without Financial Services 1,796,891 1,718,587 16,685 Noncontrolling interests 104,587 88,349 858
Total equity 1,901,478 1,806,936 17,543 Total liabilities and equity \ 5,956,630 \ 5,562,292 $ 54,003
Current assets:Cash and cash equivalents \ 983,612 \ 631,074 $ 6,127 Marketable securities 946,397 897,494 8,714 Notes and accounts receivable, trade 853,592 869,415 8,441 Other 1,413,126 1,504,403 14,605
4,196,727 3,902,386 37,887 Film costs 301,228 310,317 3,013 Investments and advances 9,234,083 9,369,835 90,969 Property, plant and equipment 820,818 783,951 7,611 Other assets:
Deferred insurance acquisition costs 511,834 510,568 4,957 Other 1,608,700 1,504,688 14,609
2,120,534 2,015,256 19,566 Total assets \ 16,673,390 \ 16,381,745 $ 159,046
Current liabilities:Short-term borrowings \ 336,940 \ 265,305 $ 2,576 Notes and accounts payable, trade 550,964 609,843 5,921 Deposits from customers in the banking business 1,912,673 1,900,796 18,454 Other 2,030,173 1,806,531 17,539
4,830,750 4,582,475 44,490 Long-term debt 556,605 533,718 5,182 Accrued pension and severance costs 462,384 452,981 4,398 Future insurance policy benefits and other 4,509,215 4,601,792 44,678 Policyholders’ account in the life insurance business 2,401,320 2,388,889 23,193 Other 781,228 747,151 7,253
Total liabilities 13,541,502 13,307,006 129,194 Redeemable noncontrolling interest 7,478 6,293 61 Equity:Sony Corporation’s stockholders’ equity 2,463,340 2,408,169 23,380 Noncontrolling interests 661,070 660,277 6,411
Total equity 3,124,410 3,068,446 29,791 Total liabilities and equity \ 16,673,390 \ 16,381,745 $ 159,046
Sony without Financial Services
ASSETS
LIABILITIES AND EQUITY
ASSETS
LIABILITIES AND EQUITY
Consolidated2016
(Millions of yen, millions of U.S. dollars)June 30
2016 2016 2016March 31
March 31(Millions of yen, millions of U.S. dollars)
June 302016 2016

F-11
Condensed Statements of Income
Financial services revenue \ 279,386 \ 232,719 -16.7 % $ 2,259 Financial services expenses 233,736 183,444 -21.5 1,781 Equity in net income (loss) of affiliated companies 322 (728) - (7)Operating income 45,972 48,547 +5.6 471 Other income (expenses), net - - - -
Income before income taxes 45,972 48,547 +5.6 471 Income taxes and other 13,860 13,458 -2.9 130 Net income of Financial Services \ 32,112 \ 35,089 +9.3 % $ 341
Net sales and operating revenue \ 1,530,977 \ 1,383,281 -9.6 % $ 13,430 Costs and expenses 1,480,148 1,375,581 -7.1 13,355 Equity in net income (loss) of affiliated companies 101 (55) - (1)Operating income 50,930 7,645 -85.0 74 Other income (expenses), net 52,248 15,179 -70.9 148 Income before income taxes 103,178 22,824 -77.9 222 Income taxes and other 29,586 8,194 -72.3 80 Net income of Sony without Financial Services \ 73,592 \ 14,630 -80.1 % $ 142
Financial services revenue \ 277,689 \ 230,909 -16.8 % $ 2,242 Net sales and operating revenue 1,530,370 1,382,290 -9.7 13,420
1,808,059 1,613,199 -10.8 15,662 Costs and expenses 1,711,575 1,556,224 -9.1 15,108 Equity in net income (loss) of affiliated companies 423 (783) - (8)Operating income 96,907 56,192 -42.0 546 Other income (expenses), net 41,803 824 -98.0 8 Income before income taxes 138,710 57,016 -58.9 554 Income taxes and other 56,269 35,850 -36.3 349 Net income attributable to Sony Corporation’s stockholders \ 82,441 \ 21,166 -74.3 % $ 205
Sony without Financial Services 2015 2016
Financial Services 2015 2016
Consolidated 2015 2016 Change 2016
(Millions of yen, millions of U.S. dollars)Three months ended June 30
2016
(Millions of yen, millions of U.S. dollars)Three months ended June 30
(Millions of yen, millions of U.S. dollars)Three months ended June 30
Change 2016
Change
F-12
Condensed Statements of Cash Flows
Net cash provided by operating activities \ 90,809 \ 110,803 $ 1,076 Net cash used in investing activities (164,539) (117,679) (1,143)Net cash provided by (used in) financing activities 43,638 (32,995) (320)Net decrease in cash and cash equivalents (30,092) (39,871) (387)Cash and cash equivalents at beginning of the fiscal year 207,527 233,701 2,269 Cash and cash equivalents at end of the period \ 177,435 \ 193,830 $ 1,882
Net cash used in operating activities \ (234,645) \ (80,909) $ (786)Net cash used in investing activities (7,463) (101,125) (982)Net cash used in financing activities (61,915) (79,640) (773)Effect of exchange rate changes on cash and cash equivalents 12,789 (50,993) (495)Net decrease in cash and cash equivalents (291,234) (312,667) (3,036)Cash and cash equivalents at beginning of the fiscal year 741,886 749,911 7,281 Cash and cash equivalents at end of the period \ 450,652 \ 437,244 $ 4,245
Net cash provided by (used in) operating activities \ (154,290) \ 16,186 $ 157 Net cash used in investing activities (172,002) (219,178) (2,128)Net cash used in financing activities (7,823) (98,553) (957)Effect of exchange rate changes on cash and cash equivalents 12,789 (50,993) (495)Net decrease in cash and cash equivalents (321,326) (352,538) (3,423)Cash and cash equivalents at beginning of the fiscal year 949,413 983,612 9,550 Cash and cash equivalents at end of the period \ 628,087 \ 631,074 $ 6,127
Financial Services
Three months ended June 30(Millions of yen, millions of U.S. dollars)
2015
Sony without Financial Services
(Millions of yen, millions of U.S. dollars)
Consolidated
2016
2015 2016 2016
Three months ended June 30
Three months ended June 3020162015
(Millions of yen, millions of U.S. dollars)
2016 2016

F-13
(Notes) 1. U.S. dollar amounts have been translated from yen, for convenience only, at the rate of ¥103 = U.S. $1, the approximate Tokyo
foreign exchange market rate as of June 30, 2016. 2. As of June 30, 2016, Sony had 1,290 consolidated subsidiaries (including variable interest entities) and 103 affiliated companies
accounted for under the equity method.
3. The weighted-average number of outstanding shares used for the computation of earnings per share of common stock are as follows:
Weighted-average number of outstanding shares (Thousands of shares) Three months ended June 30 Net income attributable to Sony Corporation’s stockholders 2015 2016
— Basic 1,168,969 1,261,523 — Diluted 1,171,746 1,287,215
The dilutive effect in the weighted-average number of outstanding shares for the three months ended June 30, 2015 primarily resulted from stock acquisition rights. The dilutive effect in the weighted-average number of outstanding shares for the three months ended June 30, 2016 primarily resulted from convertible bonds which were issued in July 2015.
4. Recently adopted accounting pronouncements: Amendments to the consolidation analysis In February 2015, the Financial Accounting Standards Board (“FASB”) issued Accounting Standards Update (“ASU”) 2015-02 that changes how companies evaluate entities for consolidation. The changes primarily relate to (i) the identification of variable interests related to fees paid to decision makers or service providers, (ii) how entities determine whether limited partnerships or similar entities are variable interest entities, (iii) how related parties and de facto agents are considered in the primary beneficiary determination, and (iv) the elimination of the presumption that a general partner controls a limited partnership. This ASU is effective for Sony as of April 1, 2016. The effect of this ASU did not have a material impact on Sony’s results of operations and financial position. Customer’s accounting for fees paid in a cloud computing arrangement In April 2015, the FASB issued ASU 2015-05 for fees paid in a cloud computing arrangement. The ASU requires entities to account for a cloud computing arrangement that includes a software license element in a manner consistent with the acquisition of other software licenses. A cloud computing arrangement without a software license element is to be accounted for as a service contract. This ASU does not affect the accounting for service contracts by a customer. This ASU is effective for Sony as of April 1, 2016. The effect of this ASU did not have a material impact on Sony’s results of operations and financial position.
5. Sony realigned its business segments from the first quarter of the fiscal year ending March 31, 2017 to reflect a change in the Corporate Executive Officers in charge of certain segments and modifications to the organizational structure of certain segments as of April 1, 2016. As a result of this realignment, Sony has separated the Devices segment into a Semiconductors segment and a Components segment. In addition, the operations of the automotive camera business, which were included in the IP&S segment, and the operations of the Imaging Device Development Division, which were included in Corporate and elimination, are now included in the Semiconductors segment. For further details of current segments and categories, see page F-5 and F-6. In connection with this realignment, the sales and operating revenue and operating income (loss) of each segment for the comparable period have been reclassified to conform to the current presentation.
6. Sony estimates the annual effective tax rate ("ETR") derived from a projected annual net income before taxes and calculates the
interim period income tax provision based on the year-to-date income tax provision computed by applying the ETR to the year-to-date net income before taxes at the end of each interim period. The income tax provision based on the ETR reflects anticipated income tax credits and net operating loss carryforwards; however, it excludes the income tax provision related to significant unusual or extraordinary transactions. Such income tax provision is separately reported from the provision based on the ETR in the interim period in which it occurs.

F-14
7. Certain reclassifications of the financial statements and accompanying footnotes for the three months ended June 30, 2015 have been made to conform to the presentation for the three months ended June 30, 2016.
Other Consolidated Financial Data
(Millions of yen, millions of U.S. dollars) Three months ended June 30 2015 2016 2016
Additions to Long-lived Assets* ¥ 93,761 ¥ 66,021 $ 641 (Property, plant and equipment) (77,485) (49,386) (479) (Intangible assets) (16,276) (16,635) (162) Depreciation and amortization expenses** 87,021 93,557 908 (Property, plant and equipment) (41,931) (42,461) (412) (Intangible assets) (45,090) (51,096) (496) Research and development expenses 111,311 110,178 1,070
* Excluding additions for tangible and intangible assets from business combinations. ** Including amortization expenses for deferred insurance acquisition costs.
Subsequent events On July 28, 2016, Sony and Murata Manufacturing Co., Ltd. (“Murata”) announced that they have entered into a non-binding memorandum of understanding that confirms their intent to negotiate the transfer of the Sony Group’s battery business to the Murata Group (the “Transfer”). Sony and Murata will aim to execute binding definitive agreements, following further due diligence and negotiation of the detailed terms and conditions of the Transfer. There is a possibility that Sony will record a loss related to such Transfer if it signs binding definitive agreements with Murata, depending on the content of such agreements.