Embed Size (px)
Citation preview

1
No. 17-045E
April 28, 2017
Consolidated Financial Results for the Fiscal Year Ended March 31, 2017
Tokyo, April 28, 2017 -- Sony Corporation today announced its consolidated financial results for the fiscal year ended March 31, 2017 (April 1, 2016 to March 31, 2017). (Billions of yen, millions of U.S. dollars, except per share amounts)
Fiscal Year ended March 31 2016 2017 Change in yen 2017*
Sales and operating revenue ¥8,105.7 ¥7,603.3 -6.2% $67,886 Operating income 294.2 288.7 -1.9 2,578 Income before income taxes 304.5 251.6 -17.4 2,247 Net income attributable to Sony Corporation’s
stockholders 147.8 73.3 -50.4 654 Net income attributable to Sony Corporation’s
stockholders per share of common stock: - Basic ¥119.40 ¥58.07 -51.4 $0.52 - Diluted 117.49 56.89 -51.6 0.51 * U.S. dollar amounts have been translated from yen, for convenience only, at the rate of 112 yen = 1 U.S. dollar, the approximate Tokyo
foreign exchange market rate as of March 31, 2017. All amounts are presented on the basis of Generally Accepted Accounting Principles in the U.S. (“U.S. GAAP”). Sony Corporation and its consolidated subsidiaries are together referred to as “Sony”. The average foreign exchange rates during the fiscal years ended March 31, 2016 and 2017 are presented below. Fiscal Year ended March 31 2016 2017 Change
The average rate of yen 1 U.S. dollar ¥120.1 ¥108.4 10.8% (yen appreciation)
1 Euro 132.6 118.8 11.6 (yen appreciation) Consolidated Results for the Fiscal Year Ended March 31, 2017 Sales and operating revenue (“Sales”) decreased by 6.2% compared to the previous fiscal year (“year-on-year”) to 7,603.3 billion yen (67,886 million U.S. dollars). This decrease was mainly due to the impact of foreign exchange rates. On a constant currency basis, sales were essentially flat year-on-year, due to significant increases in Game & Network Services (“G&NS”) and Semiconductors segment sales, substantially offset by a significant decrease in Mobile Communications (“MC”) segment sales. For further details about the impact of foreign exchange rates fluctuations on sales and operating income (loss), see Notes on page 11. Operating income decreased 5.5 billion yen year-on-year to 288.7 billion yen (2,578 million U.S. dollars). This decrease was mainly due to the 962 million U.S. dollars (112.1 billion yen) impairment charge of goodwill recorded in the Pictures segment, substantially offset by an improvement in the operating results of the MC segment and an increase in the operating income of the G&NS segment. Sony made a downward revision in the future profitability projection for the Motion Pictures business within the Pictures segment. Due to the revision, it was determined that the entire amount of goodwill, in the Production & Distribution reporting unit of the Pictures segment, which includes the Motion Pictures business, was impaired and an operating loss was recorded in the Pictures segment.
1-7-1 Konan, Minato-ku Tokyo 108-0075 Japan News & Information

2
In addition, operating income in the current fiscal year included a 42.3 billion yen (378 million U.S. dollars) impairment charge related to the planned transfer of the battery business in the Components segment, a 23.9 billion yen (213 million U.S. dollars) impairment charge against long-lived assets resulting from the termination of the development and manufacturing of certain high-functionality camera modules for external sale in the Semiconductors segment, as well as net charges of 15.4 billion yen (137 million U.S. dollars) in expenses resulting from the earthquakes in the Kumamoto region in 2016 (“the 2016 Kumamoto Earthquakes”), also in the Semiconductors segment. The expenses resulting from the 2016 Kumamoto Earthquakes include 16.7 billion yen (149 million U.S. dollars) of repair costs for certain fixed assets and losses on disposal of inventories that were directly damaged (the “Physical Damage”), as well as 9.4 billion yen (84 million U.S. dollars) of idle facility costs at manufacturing sites. The expenses for the Physical Damage were partially offset by the recognition of 10.7 billion yen (95 million U.S. dollars) of probable insurance recoveries. Offsetting all of the above charges was a 37.2 billion yen (332 million U.S. dollars) gain on the sale of certain shares of M3, Inc. (“M3”) recorded in All Other. Operating income in the previous fiscal year included a 59.6 billion yen impairment charge against long-lived assets in the camera module business in the Semiconductors segment, a 30.6 billion yen impairment charge against long-lived assets for the battery business in the Components segment, a 151 million U.S. dollars (18.1 billion yen) gain in the Music segment on the remeasurement to fair value of Sony Music Entertainment’s (“SME”) 51% equity interest in Orchard Media, Inc. (“The Orchard”), which had previously been accounted for under the equity method, as a result of SME increasing its ownership interest to 100%, as well as a gain of 12.3 billion yen from the sale of a part of the logistics business, in connection with the formation of a logistics joint venture, recorded in Corporate and elimination. During the current fiscal year, restructuring charges, net, increased 22.0 billion yen year-on-year to 60.2 billion yen (538 million U.S. dollars) primarily due to the above-mentioned impairment charge related to the planned transfer of the battery business. This amount is recorded as an operating expense included in the above-mentioned operating income. Equity in net income of affiliated companies, recorded within operating income, increased 1.3 billion yen year-on-year to 3.6 billion yen (32 million U.S. dollars). The net effect of other income and expenses was an expense of 37.1 billion yen (331 million U.S. dollars), compared to income of 10.3 billion yen in the previous fiscal year. This was primarily due to the absence of a 46.8 billion yen gain on the sale of certain shares of Olympus Corporation (“Olympus”) recorded in the previous fiscal year. Income before income taxes decreased 52.9 billion yen year-on-year to 251.6 billion yen (2,247 million U.S. dollars). During the current fiscal year, Sony recorded 124.1 billion yen (1,108 million U.S. dollars) of income tax expense, resulting in an effective tax rate of 49.3% which exceeded the effective tax rate of 31.1% of the previous fiscal year. This higher effective tax rate was mainly due to the nondeductible impairment charge of goodwill recorded during the current fiscal year. Net income attributable to Sony Corporation’s stockholders, which deducts net income attributable to noncontrolling interests, decreased 74.5 billion yen year-on-year to 73.3 billion yen (654 million U.S. dollars).

3
Operating Performance Highlights by Business Segment “Sales and operating revenue” in each business segment represents sales and operating revenue recorded before intersegment transactions are eliminated. “Operating income (loss)” in each business segment represents operating income (loss) reported before intersegment transactions are eliminated and excludes unallocated corporate expenses.
Mobile Communications (MC) (Billions of yen, millions of U.S. dollars) Fiscal Year ended March 31 2016 2017 Change in yen 2017 Sales and operating revenue ¥1,127.5 ¥759.1 -32.7% $6,778 Operating income (loss) (61.4) 10.2 - 91 Sales decreased 32.7% year-on-year (a 29% decrease on a constant currency basis) to 759.1 billion yen (6,778 million U.S. dollars). This significant decrease was primarily due to a decrease in smartphone unit sales mainly in Europe, the Middle East and Latin America, as well as a significant downsizing of unit sales in unprofitable regions. Operating income of 10.2 billion yen (91 million U.S. dollars) was recorded, compared to an operating loss of 61.4 billion yen in the previous fiscal year. Despite the impact of the above-mentioned decrease in sales, operating results improved significantly mainly due to a reduction in operating costs including the benefit of restructuring initiatives, an improvement in profitability resulting from a concentration on fewer geographic areas and a focus on high value-added models, the positive impact of foreign exchange rates, as well as a reduction in restructuring charges. During the current fiscal year, there was a 26.1 billion yen positive impact from foreign exchange rate fluctuations (which includes the impact of foreign exchange hedging).
Game & Network Services (G&NS) (Billions of yen, millions of U.S. dollars) Fiscal Year ended March 31 2016 2017 Change in yen 2017 Sales and operating revenue ¥1,551.9 ¥1,649.8 +6.3% $14,730
Operating income 88.7 135.6 +52.9 1,210 The G&NS segment includes the Hardware, Network, and Other categories. Hardware includes home and portable game consoles; Network includes network services relating to game, video and music content provided by Sony Interactive Entertainment; Other includes packaged software and peripheral devices. Sales increased 6.3% year-on-year (a 16% increase on a constant currency basis) to 1,649.8 billion yen (14,730 million U.S. dollars). This increase was primarily due to an increase in PlayStation®4 (“PS4”) software sales, including sales through the network, as well as an increase in PS4 hardware sales, partially offset by the impact of foreign exchange rates and the impact of a price reduction for PS4 hardware. Operating income increased 46.9 billion yen year-on-year to 135.6 billion yen (1,210 million U.S. dollars). This significant increase was primarily due to PS4 hardware cost reductions and the above-mentioned increase in PS4 software sales, partially offset by the impact of the price reduction for PS4 hardware and a decrease in PlayStation®3 software sales. During the current fiscal year, there was a 2.2 billion yen negative impact from foreign exchange rate fluctuations.

4
Imaging Products & Solutions (IP&S) (Billions of yen, millions of U.S. dollars) Fiscal Year ended March 31 2016 2017 Change in yen 2017 Sales and operating revenue ¥684.0 ¥579.6 -15.3% $5,175 Operating income 69.3 47.3 -31.8 422 The IP&S segment includes the Still and Video Cameras as well as Other categories. Still and Video Cameras includes interchangeable lens cameras, compact digital cameras, consumer video cameras and video cameras for broadcast; Other includes display products such as projectors and medical equipment. Due to certain changes in Sony’s organizational structure, sales and operating revenue and operating income (loss) of the IP&S segment of the comparable prior period have been reclassified to conform to the current presentation. For details, please see Notes on page 11. Sales decreased 15.3% year-on-year (a 7% decrease on a constant currency basis) to 579.6 billion yen (5,175 million U.S. dollars). This significant decrease was mainly due to the impact of foreign exchange rates and a decrease in unit sales resulting from the 2016 Kumamoto Earthquakes. Operating income decreased 22.1 billion yen year-on-year to 47.3 billion yen (422 million U.S. dollars). This significant decrease was mainly due to the negative impact of foreign exchange rates and the impact of the above-mentioned decrease in unit sales, partially offset by an improvement in the product mix of Still and Video Cameras reflecting a shift to high value-added models and cost reductions. During the current fiscal year, there was a 26.5 billion yen negative impact from foreign exchange rate fluctuations.
Home Entertainment & Sound (HE&S) (Billions of yen, millions of U.S. dollars) Fiscal Year ended March 31
2016 2017 Change in yen 2017 Sales and operating revenue ¥1,159.0 ¥1,039.0 -10.4% $9,277 Operating income 50.6 58.5 +15.7 522 The HE&S segment includes the Televisions as well as Audio and Video categories. Televisions includes LCD televisions; Audio and Video includes Blu-ray DiscTM players and recorders, home audio, headphones and memory-based portable audio devices. Sales decreased 10.4% year-on-year (a 1% decrease on a constant currency basis) to 1,039.0 billion yen (9,277 million U.S. dollars), primarily due to the impact of foreign exchange rates. Operating income increased 7.9 billion yen year-on-year to 58.5 billion yen (522 million U.S. dollars). This increase was primarily due to an improvement in the product mix reflecting a shift to high value-added models, partially offset by the negative impact of foreign exchange rates as well as an increase in expenses* resulting from the change in the method of calculating royalties and other costs for brand and patent utilization, pursuant to the separation of Sony’s businesses into distinct subsidiaries and the realignment of corporate functions. During the current fiscal year, there was a 13.4 billion yen negative impact from foreign exchange rate fluctuations. * For further details, see footnote on page F-6.
Semiconductors (Billions of yen, millions of U.S. dollars) Fiscal Year ended March 31 2016 2017 Change in yen 2017 Sales and operating revenue ¥739.1 ¥773.1 +4.6% $6,903 Operating income (loss) 14.5 (7.8) - (70)

5
The Semiconductors segment includes image sensors and camera modules. Due to certain changes in Sony’s organizational structure, sales and operating revenue and operating income (loss) of the former Devices segment of the comparable prior period have been reclassified to conform to the current presentation. For details, please see Notes on page 11. Sales increased 4.6% year-on-year (a 15% increase on a constant currency basis) to 773.1 billion yen (6,903 million U.S. dollars). This increase in sales was primarily due to a significant increase in unit sales of image sensors mainly for mobile products, partially offset by the impact of foreign exchange rates, a significant decrease in sales of camera modules, a business which was downsized, and the decrease in production due to the 2016 Kumamoto Earthquakes. Sales to external customers increased 10.1% year-on-year. Operating loss of 7.8 billion yen (70 million U.S. dollars) was recorded, compared to operating income of 14.5 billion yen in the previous fiscal year. This significant deterioration in operating results was primarily due to the negative impact of foreign exchange rates, the above-mentioned expenses resulting from the 2016 Kumamoto Earthquakes, and a 6.5 billion yen (58 million U.S. dollars) write-down of inventories of certain image sensors mainly for mobile products. This deterioration was partially offset by the above-mentioned year-on-year increase in sales and the decrease in impairment charges against long-lived assets related to the camera module business. During the current fiscal year, there was a 43.7 billion yen negative impact from foreign exchange rate fluctuations.
Components (Billions of yen, millions of U.S. dollars) Fiscal Year ended March 31 2016 2017 Change in yen 2017 Sales and operating revenue ¥224.6 ¥195.4 -13.0% $1,744 Operating loss (42.9) (60.4) - (540) The Components segment includes batteries and recording media. Due to certain changes in Sony’s organizational structure, sales and operating revenue and operating income (loss) of the former Devices segment of the comparable prior period have been reclassified to conform to the current presentation. For details, please see Notes on page 11. Sales decreased 13.0% year-on-year (a 5% decrease on a constant currency basis) to 195.4 billion yen (1,744 million U.S. dollars) primarily due to the impact of foreign exchange rates and a decrease in sales in the battery business. Operating loss increased 17.5 billion yen year-on-year to 60.4 billion yen (540 million U.S. dollars). This significant increase in loss was primarily due to a 42.3 billion yen (378 million U.S. dollars) impairment charge related to the planned transfer of the battery business and the impact of the above-mentioned decrease in sales, partially offset by the absence of the 30.6 billion yen impairment charge related to long-lived assets of the battery business recorded in the previous fiscal year. During the current fiscal year, there was a 3.9 billion yen negative impact from foreign exchange rate fluctuations.
* * * * * Total inventory of the six Electronics* segments above as of March 31, 2017 was 553.2 billion yen (4,939 million U.S. dollars), a decrease of 46.9 billion yen, or 7.8% year-on-year. Inventory decreased by 32.7 billion yen, or 5.6% compared with the level as of December 31, 2016. * The term “Electronics” refers to the sum of the MC, G&NS, IP&S, HE&S, Semiconductors and Components segments. In connection with the realignment made from the fiscal year ended March 31, 2017, total inventory of the six Electronics segments as of March 31, 2016 has been reclassified to conform to the current presentation. For further details, please see Notes on page 11.
* * * * *

6
Pictures (Billions of yen, millions of U.S. dollars) Fiscal Year ended March 31 2016 2017 Change in yen 2017 Sales and operating revenue ¥938.1 ¥903.1 -3.7% $8,064 Operating income (loss) 38.5 (80.5) - (719) The Pictures segment is comprised of the Motion Pictures, Television Productions, and Media Networks categories. Motion Pictures includes the worldwide production, acquisition and distribution of motion pictures and direct-to-video content; Television Productions includes the production, acquisition and distribution of television programming; Media Networks includes the operation of television and digital networks worldwide. The results presented in Pictures are a yen-translation of the results of Sony Pictures Entertainment Inc. (“SPE”), a U.S.-based operation that aggregates the results of its worldwide subsidiaries on a U.S. dollar basis. Management analyzes the results of SPE in U.S. dollars, so discussion of certain portions of its results is specified as being on “a U.S. dollar basis.” Sales decreased 3.7% year-on-year (a 5% increase on a U.S. dollar basis) to 903.1 billion yen (8,064 million U.S. dollars), primarily due to the impact of the appreciation of the yen against the U.S. dollar. The increase in sales on a U.S. dollar basis was primarily due to higher sales for Television Productions and Media Networks. Sales for Television Productions increased primarily due to higher subscription video-on-demand (“SVOD”) licensing revenues. The increase in sales for Media Networks was due to higher advertising and subscription revenues mainly in India, Latin America and the U.S. Operating loss of 80.5 billion yen (719 million U.S. dollars) was recorded, compared to operating income of 38.5 billion yen in the previous fiscal year. This significant deterioration in operating results was primarily due to the above-mentioned 962 million U.S. dollars (112.1 billion yen) impairment charge of goodwill. The operating results for the Pictures segment were also negatively impacted by higher programming and marketing expenses for Media Networks as well as higher theatrical marketing expenses for Motion Pictures.
Music (Billions of yen, millions of U.S. dollars) Fiscal Year ended March 31 2016 2017 Change in yen 2017 Sales and operating revenue ¥619.2 ¥647.7 +4.6% $5,783
Operating income 86.5 75.8 -12.4 677 The Music segment is comprised of the Recorded Music, Music Publishing as well as Visual Media and Platform categories. Recorded Music includes the distribution of physical and digital recorded music and revenue derived from artists’ live performances; Music Publishing includes the management and licensing of the words and music of songs; Visual Media and Platform includes the production and distribution of animation titles, including game applications based on the animation titles, and various service offerings for music and visual products. Due to certain changes in Sony’s organizational structure, sales and operating revenue and operating income (loss) of the Music segment of the comparable prior period have been reclassified to conform to the current presentation. For details, please see Notes on page 11. The Music segment results include the yen-translated results of SME and Sony/ATV Music Publishing LLC (“Sony/ATV”), both U.S.-based operations which aggregate the results of their worldwide subsidiaries on a U.S. dollar basis and the results of Sony Music Entertainment (Japan) Inc., a Japan-based music company which aggregates its results in yen. The segment also includes equity in net income for EMI Music Publishing (“EMI”), an affiliated company accounted for under the equity method for which Sony records 39.8% of EMI’s net income in the segment operating income. Sales increased 4.6% year-on-year (an 11% increase on a constant currency basis) to 647.7 billion yen (5,783 million U.S. dollars). The significant increase in sales on a constant currency basis was due to higher Visual Media and Platform sales and higher Recorded Music sales, and was partially offset by the impact of the appreciation of the yen against the U.S. dollar. Visual Media and Platform sales increased due to the strong performance of Fate/Grand Order, a game application for mobile devices in Japan. Recorded Music sales increased due to an increase in digital streaming revenues. Best-selling music titles included Beyonce’s Lemonade, various hit tracks from The Chainsmokers and Sia’s This is Acting.

7
Operating income decreased 10.7 billion yen year-on-year to 75.8 billion yen (677 million U.S. dollars). Operating income decreased primarily due to the above-mentioned absence of the 151 million U.S. dollar (18.1 billion yen) gain that was recorded in the previous fiscal year on the remeasurement of SME’s equity interest in The Orchard. The operating results of the Music segment were also positively impacted by the above-mentioned increase in sales, partially offset by the negative impact of the appreciation of the yen against the U.S. dollar.
Financial Services (Billions of yen, millions of U.S. dollars) Fiscal Year ended March 31 2016 2017 Change in yen 2017 Financial services revenue ¥1,073.1 ¥1,087.5 +1.3% $9,710 Operating income 156.5 166.4 +6.3 1,486 The Financial Services segment results include Sony Financial Holdings Inc. (“SFH”) and SFH’s consolidated subsidiaries such as Sony Life Insurance Co., Ltd. (“Sony Life”), Sony Assurance Inc. and Sony Bank Inc. (“Sony Bank”). The results of Sony Life discussed in the Financial Services segment differ from the results that SFH and Sony Life disclose separately on a Japanese statutory basis. Financial services revenue was 1,087.5 billion yen (9,710 million U.S. dollars), essentially flat year-on-year. This was primarily due to an improvement in investment performance in the separate account driven by a rise in the stock market, substantially offset by a decrease in insurance premium revenue and a deterioration in investment performance in the general account, all at Sony Life. Revenue at Sony Life was 965.6 billion yen (8,622 million U.S. dollars), essentially flat year-on-year. Operating income increased 9.9 billion yen year-on-year to 166.4 billion yen (1,486 million U.S. dollars) primarily due to an increase in operating income at Sony Life. Operating income at Sony Life increased 15.5 billion yen year-on-year to 154.3 billion yen (1,378 million U.S. dollars) mainly due to decreases in the amortization of deferred insurance acquisition costs and the provision of policy reserves, primarily driven by an increase in interest rates and the improvement in the stock market, partially offset by a decline in net gains on sales of securities in the general account.
* * * * *
Cash Flows For Consolidated Statements of Cash Flows, charts showing Sony’s cash flow information for all segments, all segments excluding the Financial Services segment and the Financial Services segment alone, please refer to pages F-5 and F-17. Operating Activities: During the current fiscal year, there was a net cash inflow of 809.3 billion yen (7,226 million U.S. dollars) from operating activities, an increase of 60.2 billion yen, or 8.0% year-on-year. For all segments excluding the Financial Services segment, there was a net cash inflow of 445.8 billion yen (3,981 million U.S. dollars), an increase of 183.0 billion yen, or 69.6% year-on-year. This increase was primarily due to an increase in net income after taking into account non-cash adjustments (including depreciation and amortization, gain on sales of securities investments and other operating income (expense)) and a decrease of inventories, compared to an increase in the previous fiscal year. The Financial Services segment had a net cash inflow of 376.2 billion yen (3,359 million U.S. dollars), a decrease of 119.1 billion yen, or 24.0% year-on-year. This decrease was primarily due to a decrease in net income after taking into account a net gain or loss on revaluation of marketable securities held for trading purposes. Investing Activities: During the current fiscal year, Sony used 1,254.0 billion yen (11,196 million U.S. dollars) of net cash in investing activities, an increase of 223.6 billion yen, or 21.7% year-on-year. For all segments excluding the Financial Services segment, there was a net cash outflow of 299.4 billion yen (2,674 million U.S. dollars), a decrease of 35.5 billion yen, or 10.6% year-on-year. This decrease was mainly due to a decrease in payments for fixed asset purchases such as semiconductor manufacturing equipment.

8
The Financial Services segment used 953.2 billion yen (8,511 million U.S. dollars) of net cash, an increase of 259.2 billion yen, or 37.3% year-on-year. This increase was mainly due to a year-on-year decrease in proceeds from sales or return of investments and collections of advances at Sony Life. In all segments excluding the Financial Services segment, net cash generated in operating and investing activities combined*1 for the current fiscal year was 146.3 billion yen (1,306 million U.S. dollars), a 218.5 billion yen improvement from net cash used in the previous fiscal year. Financing Activities: Net cash provided by financing activities during the current fiscal year was 452.3 billion yen (4,038 million U.S. dollars), an increase of 72.2 billion yen, or 19.0% year-on-year. For all segments excluding the Financial Services segment, there was a 173.4 billion yen (1,548 million U.S. dollars) net cash outflow, compared to a 144.8 billion yen net cash inflow in the previous fiscal year. During the current fiscal year, there was a net cash outflow as Sony redeemed long-term debt and made a payment for the acquisition of the 50% equity interest in Sony/ATV previously owned by the Estate of Michael Jackson, making Sony/ATV a wholly-owned subsidiary of Sony, partially offset by the issuance of straight bonds by Sony. During the previous fiscal year, Sony issued new stock and convertible bonds. In the Financial Services segment, there was a 611.6 billion yen (5,461 million U.S. dollars) net cash inflow, an increase of 386.7 billion yen, or 171.9% year-on-year. This increase was primarily due to an increase in short-term borrowings at Sony Life and a larger year-on-year increase in deposits from customers at Sony Bank. Total Cash and Cash Equivalents: Accounting for the above factors and the effect of fluctuations in foreign exchange rates, the total outstanding balance of cash and cash equivalents at March 31, 2017 was 960.1 billion yen (8,573 million U.S. dollars). Cash and cash equivalents of all segments excluding the Financial Services segment was 691.8 billion yen (6,177 million U.S. dollars) at March 31, 2017, a decrease of 58.2 billion yen, or 7.8% compared with the balance as of March 31, 2016, and an increase of 211.1 billion yen, or 43.9% compared with the balance as of December 31, 2016. Sony believes that it continues to maintain sufficient liquidity through access to a total, translated into yen, of 524.4 billion yen (4,682 million U.S. dollars) of unused committed lines of credit with financial institutions in addition to the cash and cash equivalents balance at March 31, 2017. Within the Financial Services segment, the outstanding balance of cash and cash equivalents was 268.4 billion yen (2,396 million U.S. dollars) at March 31, 2017, an increase of 34.7 billion yen, or 14.8% compared with the balance as of March 31, 2016, and a decrease of 22.6 billion yen, or 7.8% compared with the balance as of December 31, 2016. *1 Sony has included the information for cash flow from operating and investing activities combined, excluding the Financial Services segment’s
activities, as Sony’s management frequently monitors this financial measure, and believes this non-U.S. GAAP measurement is important for use in evaluating Sony’s ability to generate cash to maintain liquidity and fund debt principal and dividend payments from business activities other than its Financial Services segment. This information is derived from the reconciliations prepared in the Condensed Statements of Cash Flows on page F-17. This information and the separate condensed presentations shown below are not required or prepared in accordance with U.S. GAAP. The Financial Services segment’s cash flow is excluded from the measure because SFH, which constitutes a majority of the Financial Services segment, is a separate publicly traded entity in Japan with a significant minority interest and it, as well as its subsidiaries, secure liquidity on their own. This measure may not be comparable to those of other companies. This measure has limitations because it does not represent residual cash flows available for discretionary expenditures principally due to the fact that the measure does not deduct the principal payments required for debt service. Therefore, Sony believes it is important to view this measure as supplemental to its entire statement of cash flows and together with Sony’s disclosures regarding investments, available credit facilities and overall liquidity.

9
A reconciliation of the differences between the Consolidated Statement of Cash Flows reported and cash flows from operating and investing activities combined excluding the Financial Services segment’s activities is as follows: (Billions of yen, millions of U.S. dollars) Fiscal year ended March 31 2016 2017 2017 Net cash provided by operating activities reported
in the consolidated statements of cash flows ¥ 749.1 ¥ 809.3 $ 7,226
Net cash used in investing activities reported in the consolidated statements of cash flows (1,030.4) (1,254.0) (11,196)
(281.3) (444.7) (3,970) (1) Less: Net cash provided by operating activities
within the Financial Services segment 495.3 376.2 3,359 (2)
Less: Net cash used in investing activities within the Financial Services segment (694.0) (953.2) (8,511) (3)
Eliminations *2 10.5 14.1 124 (4) Cash flow generated (used) by operating and investing activities
combined excluding the Financial Services segment’s activities ¥ (72.1) ¥ 146.3 $ 1,306 (1)-(2)-(3)+(4)
*2 Eliminations primarily consist of intersegment dividend payments.
* * * * *
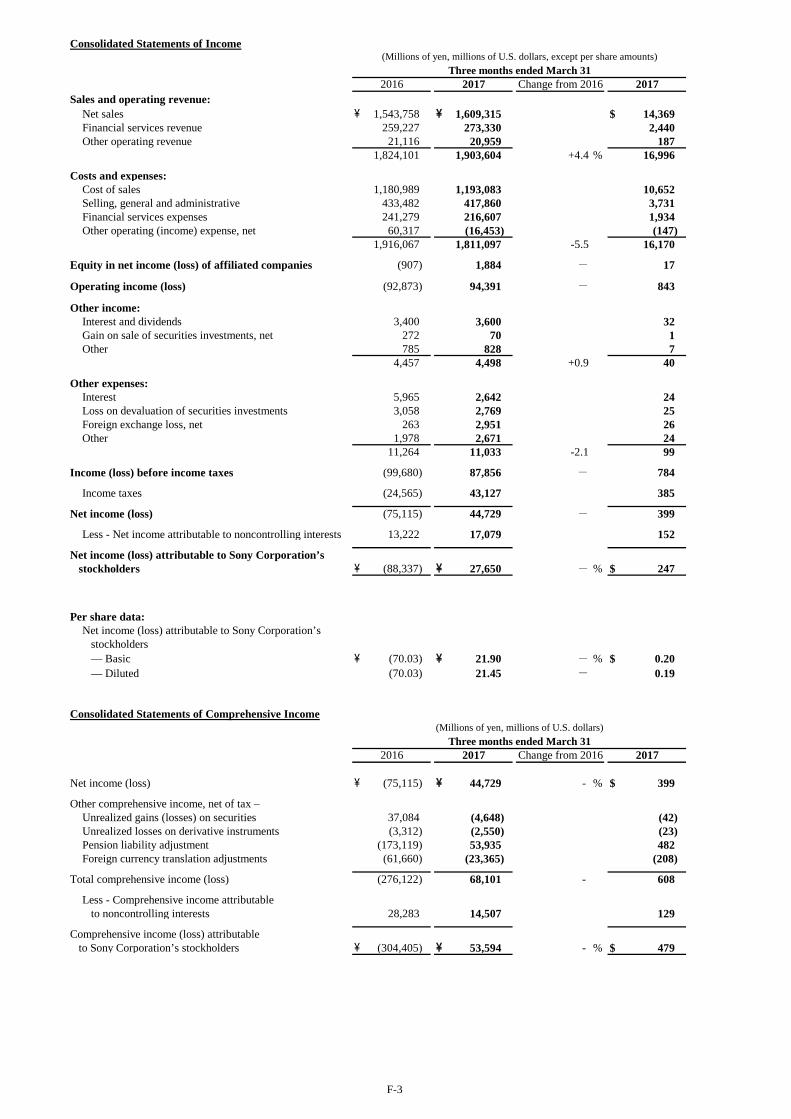
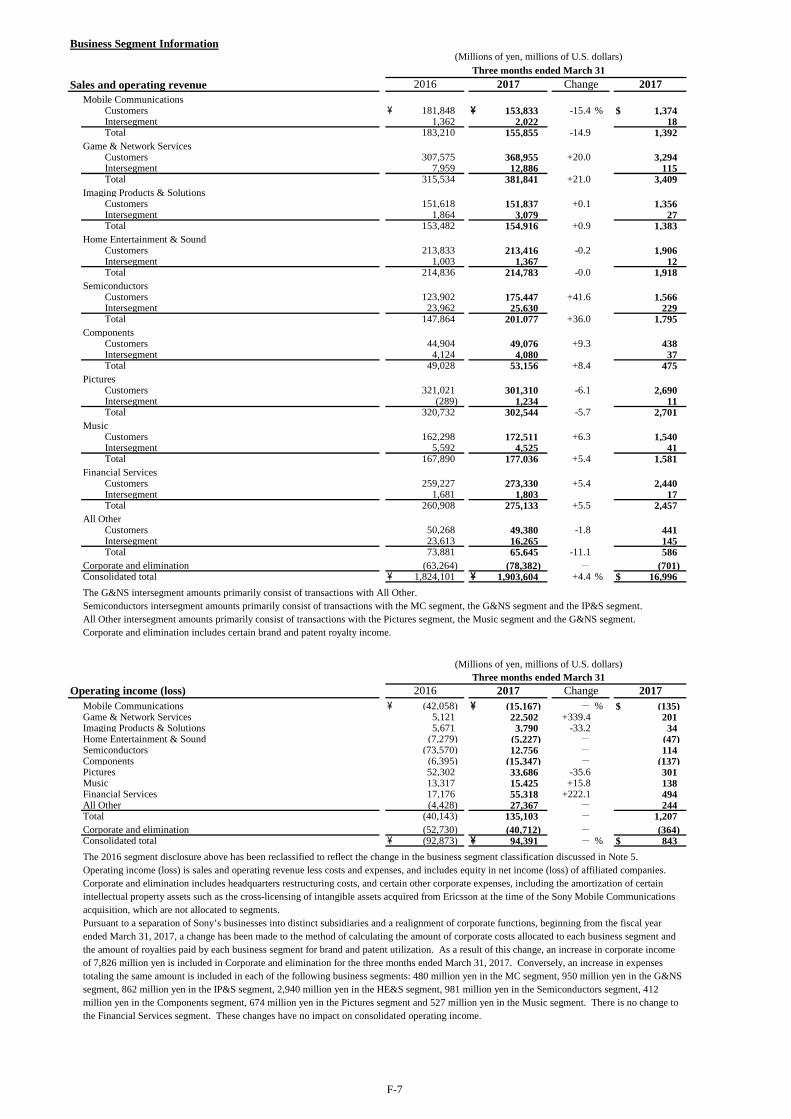
Consolidated Results for the Fourth Quarter ended March 31, 2017 For Consolidated Statements of Income and Business Segment Information for the three months ended March 31, 2017 and 2016, please refer to pages F-3 and F-7 respectively. Sales for the fourth quarter ended March 31, 2017 increased 4.4% year-on-year to 1,903.6 billion yen (16,996 million U.S. dollars) primarily due to an increase in sales in the G&NS and Semiconductors segments, partially offset by a decrease in sales primarily in the MC and Pictures segments. On a constant currency basis, consolidated sales increased 6% year-on-year. For further detail about sales on a constant currency basis, see Notes on page 11. During the current quarter, the average rates of the yen were 113.7 yen against the U.S. dollar and 121.1 yen against the euro, which were 1.4% and 5.0% higher, respectively, compared with the same quarter of the previous fiscal year. In the MC segment, sales decreased significantly mainly due to a decrease in smartphone unit sales. In the G&NS segment, sales increased primarily due to an increase in PS4 software sales including sales through the network, partially offset by the impact of foreign exchange rates. In the IP&S segment, sales were essentially flat year-on-year due to an improvement in the product mix reflecting a shift to high value-added models in Still and Video Cameras, partially offset by the impact of foreign exchange rates. In the HE&S segment, sales were essentially flat year-on-year due to an improvement in the product mix reflecting a shift to high value-added models, offset by a decrease in television unit sales. In the Semiconductors segment, sales increased significantly due to an increase in unit sales of image sensors. Sales to external customers also increased significantly year-on-year. In the Components segment, sales increased mainly due to an increase in sales in the battery business, resulting primarily from an increase in demand for products used in mobile devices, partially offset by the impact of foreign exchange rates. In the Pictures segment, sales decreased primarily due to significantly lower SVOD revenues for Television Productions, as the same quarter of the previous fiscal year included licensing revenues for Breaking Bad, as well as the impact of foreign exchange rates. In the Music segment, sales increased primarily due to higher Visual Media and Platform sales, partially offset by the impact of foreign exchange rates and lower Recorded Music sales primarily due to lower new release revenue as compared to the same quarter of the previous fiscal year. In the Financial Services segment, revenue increased year-on-year mainly due to an improvement in investment performance in the separate account, partially offset by a decrease in insurance premium revenue, both at Sony Life. Operating income of 94.4 billion yen (843 million U.S. dollars) was recorded, compared to an operating loss of 92.9 billion yen in the same quarter of the previous fiscal year. This significant improvement was primarily due to the operating results of the Semiconductors segment. Operating income in the current quarter included the above-mentioned 37.2 billion yen (332 million U.S. dollars)

10
gain on the sale of certain shares of M3, recorded in All Other. Operating income in the same quarter of the previous fiscal year included the above-mentioned 59.6 billion yen impairment charge against long-lived assets in the camera module business in the Semiconductors segment. In the MC segment, the operating loss decreased significantly primarily due to cost reductions resulting from the benefit of restructuring initiatives and a decrease in restructuring charges, partially offset by a decrease in sales. In the G&NS segment, operating income increased significantly primarily due to the above-mentioned increase in PS4 software sales including sales through the network. In the IP&S segment, the negative impact of foreign exchange rates was offset by an increase in sales and cost reductions in Still and Video Cameras, but operating income decreased mainly due to an increase in costs associated with a change in the method of managing the inventory of repair parts. In the HE&S segment, the operating loss decreased year-on-year primarily due to an improvement in product mix reflecting a shift to high value-added models and cost reductions. In the Semiconductors segment, operating results improved significantly due to the absence of the above-mentioned impairment charge against long-lived assets in the camera module business recorded in the same quarter of the previous fiscal year and the impact of the above-mentioned increase in sales. In the Components segment, the operating loss increased mainly due to an additional impairment charge related to the planned transfer of the battery business. In the Pictures segment, operating income decreased due to the impact of the above-mentioned decrease in sales for Television Productions and higher programming expenses for Media Networks. In the Music segment, operating income increased due to an improvement of equity in net income (loss) from affiliated companies, mainly EMI. In the Financial Services segment, operating income increased significantly primarily due to decreases in the amortization of deferred insurance acquisition costs and the provision of policy reserves, primarily driven by the increase in interest rates and the improvement in the stock market compared with the end of the previous fiscal year, at Sony Life. During the current quarter, restructuring charges, net, increased 4.4 billion yen year-on-year to 20.8 billion yen (186 million U.S. dollars). This amount is recorded as an operating expense included in the above-mentioned operating income. Equity in net income of affiliated companies, recorded within operating income, was income of 1.9 billion yen (17 million U.S. dollars), compared to a loss of 0.9 billion yen in the previous fiscal year. The net effect of other income and expenses was an expense of 6.5 billion yen (58 million U.S. dollars), an improvement of 0.3 billion yen compared to the same period of the previous fiscal year. Income before income taxes was income of 87.9 billion yen (784 million U.S. dollars), compared to a loss of 99.7 billion yen in the previous fiscal year. During the current quarter, Sony recorded 43.1 billion yen (385 million U.S. dollars) of income tax expense, resulting in an effective tax rate of 49.1% which exceeded the effective tax rate of 24.6% in the same quarter of the previous fiscal year. This higher effective tax rate was mainly due to the fact that Sony recorded one-time benefits for corporate tax rate reductions and the reversal of certain valuation allowances for local taxes in Japan in the same quarter of the previous fiscal year. Net income attributable to Sony Corporation’s stockholders was income of 27.7 billion yen (247 million U.S. dollars), compared to a loss of 88.3 billion yen in the previous fiscal year.
* * * * *

11
Notes Business Segment Realignment Sony realigned its business segments for the fiscal year ended March 31, 2017 to reflect a change in the Corporate Executive Officers in charge of certain segments and modifications to the organizational structure of certain segments as of April 1, 2016. As a result of this realignment, Sony has separated the Devices segment into a Semiconductors segment and a Components segment. In addition, the operations of the automotive camera business, which were included in the IP&S segment, and the operations of the Imaging Device Development Division, which were included in Corporate and elimination, are now included in the Semiconductors segment. Additionally, certain operations which were included in All Other and Corporate and elimination are now included in the Music segment and All Other, respectively. The sales and operating revenue and operating income (loss) of each segment in the fiscal year ended March 31, 2016 have been reclassified to conform to the current presentation. Impact of Foreign Exchange Rate Fluctuations on Sales and Operating Income (Loss) For all segments other than Pictures and Music, the impact of foreign exchange rate fluctuations on sales is calculated by applying the change in the yen’s periodic weighted average exchange rates for the fiscal year and fourth quarter ended March 31, 2016 from the fiscal year and fourth quarter ended March 31, 2017 to the major transactional currencies in which the sales are denominated. The impact of foreign exchange rate fluctuations on operating income (loss) described herein is calculated by subtracting from the impact on sales the impact on cost of sales and selling, general and administrative expenses calculated by applying the same major transactional currencies calculation process to cost of sales and selling, general and administrative expenses as for the impact on sales. Additionally, the MC segment enters into its own foreign exchange hedging transactions. The impact of those transactions is included in the impact of foreign exchange rate fluctuations on operating income (loss) for that segment. Since the worldwide subsidiaries of the Pictures segment and of SME, Sony/ATV and EMI in the Music segment are aggregated on a U.S. dollar basis and are translated into yen, the impact of foreign exchange rate fluctuations is calculated by applying the change in the periodic weighted average exchange rates for the fiscal year and fourth quarter ended March 31, 2016 from the fiscal year and fourth quarter ended March 31, 2017 from U.S. dollar to yen to the U.S. dollar basis operating results. This information is not a substitute for Sony’s consolidated financial statements measured in accordance with U.S. GAAP. However, Sony believes that these disclosures provide additional useful analytical information to investors regarding the operating performance of Sony.
* * * * *
Outlook for the Fiscal Year Ending March 31, 2018 The forecast for consolidated results for the fiscal year ending March 31, 2018 is as follows: (Billions of yen)
Change from March 31, 2017 Results
March 31, 2017 Results
March 31, 2018 Forecast
Sales and operating revenue (“sales”) ¥7,603.3 ¥8,000 + ¥396.7 bil + 5.2% Operating income 288.7 500 + 211.3 bil + 73.2 Income before income taxes 251.6 470 + 218.4 bil + 86.8 Net income attributable to
Sony Corporation’s stockholders 73.3 255 + 181.7 bil + 247.9
Assumed foreign currency exchange rates for the fiscal year ending March 31, 2018 are below. Due to the recent volatility in foreign exchange rates, the assumed foreign currency exchange rates were revised after the individual segments had already completed their forecasts. Accordingly, the impact of the difference between the currently assumed rates and the rates used when the individual segments completed their forecasts has been included in the forecast for All Other. (For your reference)
Average foreign currency exchange rates for the fiscal year ended March 31, 2017
Assumed foreign currency exchange rates for the fiscal year ending March 31, 2018
Consolidated forecast Segment forecast 1 U.S. dollar 108.4 yen approximately 105 yen approximately 110 yen 1 Euro 118.8 yen approximately 110 yen approximately 115 yen
Consolidated sales for the fiscal year ending March 31, 2018 are expected to increase year-on-year primarily due to an expected increase in sales in the G&NS, Pictures and Semiconductors segments. Consolidated operating income is expected to significantly increase year-on-year due to an expected improvement in the operating results primarily in the Semiconductors and Pictures segments, partially offset by an expected negative impact of foreign exchange rates, mainly due to the difference between the above-mentioned currency rates used for the consolidated forecast and the segment forecast included in All Other. In addition, operating income for the fiscal year ending March 31, 2018 is expected to include an approximately 27.0 billion yen gain on
12
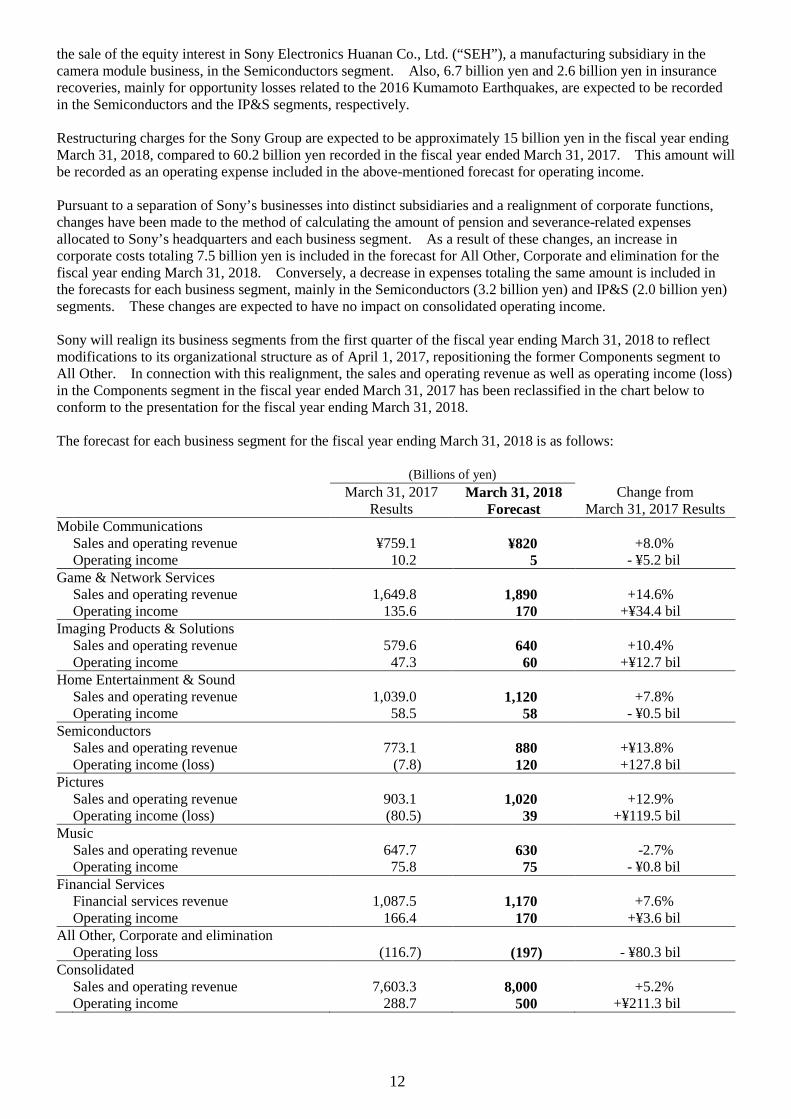
the sale of the equity interest in Sony Electronics Huanan Co., Ltd. (“SEH”), a manufacturing subsidiary in the camera module business, in the Semiconductors segment. Also, 6.7 billion yen and 2.6 billion yen in insurance recoveries, mainly for opportunity losses related to the 2016 Kumamoto Earthquakes, are expected to be recorded in the Semiconductors and the IP&S segments, respectively. Restructuring charges for the Sony Group are expected to be approximately 15 billion yen in the fiscal year ending March 31, 2018, compared to 60.2 billion yen recorded in the fiscal year ended March 31, 2017. This amount will be recorded as an operating expense included in the above-mentioned forecast for operating income. Pursuant to a separation of Sony’s businesses into distinct subsidiaries and a realignment of corporate functions, changes have been made to the method of calculating the amount of pension and severance-related expenses allocated to Sony’s headquarters and each business segment. As a result of these changes, an increase in corporate costs totaling 7.5 billion yen is included in the forecast for All Other, Corporate and elimination for the fiscal year ending March 31, 2018. Conversely, a decrease in expenses totaling the same amount is included in the forecasts for each business segment, mainly in the Semiconductors (3.2 billion yen) and IP&S (2.0 billion yen) segments. These changes are expected to have no impact on consolidated operating income. Sony will realign its business segments from the first quarter of the fiscal year ending March 31, 2018 to reflect modifications to its organizational structure as of April 1, 2017, repositioning the former Components segment to All Other. In connection with this realignment, the sales and operating revenue as well as operating income (loss) in the Components segment in the fiscal year ended March 31, 2017 has been reclassified in the chart below to conform to the presentation for the fiscal year ending March 31, 2018. The forecast for each business segment for the fiscal year ending March 31, 2018 is as follows: (Billions of yen) March 31, 2017
Results March 31, 2018
Forecast Change from
March 31, 2017 Results Mobile Communications Sales and operating revenue ¥759.1 ¥820 +8.0% Operating income 10.2 5 - ¥5.2 bil Game & Network Services Sales and operating revenue 1,649.8 1,890 +14.6% Operating income 135.6 170 +¥34.4 bil Imaging Products & Solutions Sales and operating revenue 579.6 640 +10.4% Operating income 47.3 60 +¥12.7 bil Home Entertainment & Sound Sales and operating revenue 1,039.0 1,120 +7.8% Operating income 58.5 58 - ¥0.5 bil Semiconductors Sales and operating revenue 773.1 880 +¥13.8% Operating income (loss) (7.8) 120 +127.8 bil Pictures Sales and operating revenue 903.1 1,020 +12.9% Operating income (loss) (80.5) 39 +¥119.5 bil Music Sales and operating revenue 647.7 630 -2.7% Operating income 75.8 75 - ¥0.8 bil Financial Services Financial services revenue 1,087.5 1,170 +7.6% Operating income 166.4 170 +¥3.6 bil All Other, Corporate and elimination Operating loss (116.7) (197) - ¥80.3 bil Consolidated Sales and operating revenue 7,603.3 8,000 +5.2% Operating income 288.7 500 +¥211.3 bil

13
Mobile Communications Sales are expected to increase year-on-year mainly due to an increase in smartphone unit sales. Operating income is expected to decrease mainly due to the negative impact of foreign exchange rates as well as an increase in the price of key components, partially offset by a reduction in operating costs. Game & Network Services Sales and operating income are both expected to increase significantly year-on-year primarily due to an increase in network sales. Imaging Products & Solutions Sales and operating income are both expected to increase significantly year-on-year primarily due to an improvement in the product mix reflecting a shift to high value-added models in Still and Video Cameras. Home Entertainment & Sound Sales are expected to increase year-on-year primarily due to an improvement in product mix reflecting a shift to high value-added models. Operating income is expected to be essentially flat year-on-year primarily due to an increase in the price of key components, substantially offset by the above-mentioned improvement in product mix. Semiconductors Sales are expected to increase significantly year-on-year due to an increase in image sensor sales for mobile products and the absence of the impact of the 2016 Kumamoto Earthquakes which resulted in a production decrease in the previous fiscal year. Operating results are expected to improve significantly primarily due to an approximately 27.0 billion yen gain on the above-mentioned sale of the equity interest in SEH in the fiscal year ending March 31, 2018 and the impact of the above-mentioned increase in sales, as well as the absence of a 23.9 billion yen impairment charge against long-lived assets related to the camera module business and 15.4 billion yen of net expenses resulting from the 2016 Kumamoto Earthquakes recorded in the previous fiscal year. Pictures Sales are expected to increase year-on-year due to an expected increase in Media Networks and Television Productions sales. Operating results are expected to improve significantly due to the absence of the impairment charge of goodwill recorded in the previous fiscal year. Music Sales and operating income are both expected to be essentially flat year-on-year primarily due to a decline in physical and digital download sales in Recorded Music, substantially offset by an increase in digital streaming revenues. Financial Services Financial services revenue is expected to increase year-on-year primarily due to an increase in insurance premium revenue, reflecting an increase in policy amount in force at Sony Life. Operating income is expected to be flat year-on-year due to the above-mentioned increase in revenue substantially offset by the fact that the positive impact of market fluctuations realized in the fiscal year ended March 31, 2017 is not incorporated into the forecast for the fiscal year ending March 31, 2018. The effects of future gains and losses on investments held by the Financial Services segment due to market fluctuations have not been incorporated within the above forecast as it is difficult for Sony to predict market trends in the future. Accordingly, future market fluctuations could further impact the current forecast.

14
The forecast for additions to long-lived assets and depreciation and amortization, as well as research and development expenses, for the fiscal year ending March 31, 2018 is as per the tables below: Consolidated (Billions of yen)
March 31, 2017 Results
March 31, 2018 Forecast
Change from March 31, 2017 Results
Additions to Long-lived Assets* ¥272.2 ¥330 +21.2% [additions to property, plant and equipment
(included above) 184.0 235 +27.7]
[additions to intangible assets (included above) * 88.2 95 +7.7] Depreciation and amortization** 327.0 355 +8.5 [for property, plant and equipment (included
above) 169.3 175 +3.4]
[for intangible assets (included above) 157.8 180 +14.1] Research and development expenses 447.5 450 +0.6 * Excluding additions for tangible and intangible assets from business combinations. ** Including amortization expenses for deferred insurance acquisition costs. Sony without Financial Services (Billions of yen) March 31, 2017
Results March 31, 2018
Forecast Change from
March 31, 2017 Results Additions to Long-lived Assets* ¥257.6 ¥310 +20.3% [additions to property, plant and equipment
(included above) 179.3 230 +28.3]
[additions to intangible assets (included above) * 78.3 80 +2.1] Depreciation and amortization 280.0 280 +0.0 [for property, plant and equipment (included
above) 167.4 170 +1.6]
[for intangible assets (included above) 112.6 110 -2.3] * Excluding additions for tangible and intangible assets from business combinations. This forecast is based on management’s current expectations and is subject to uncertainties and changes in circumstances. Actual results may differ materially from those included in this forecast due to a variety of factors. See “Cautionary Statement” below.
* * * * *
Basic Views on Selection of Accounting Standards Sony’s consolidated financial statements are prepared in accordance with U.S. GAAP. Sony’s business is globally diversified and Sony believes that financial statements based on U.S. GAAP contribute to smooth communication with shareholders, investors, and other stakeholders inside and outside of Japan. Sony is considering whether to adopt International Financial Reporting Standards (“IFRS”) while closely monitoring the development of new accounting standards and the stance of regulatory bodies at home and abroad.

15
Cautionary Statement
Statements made in this release with respect to Sony’s current plans, estimates, strategies and beliefs and other statements that are not historical facts are forward-looking statements about the future performance of Sony. Forward-looking statements include, but are not limited to, those statements using words such as “believe,” “expect,” “plans,” “strategy,” “prospects,” “forecast,” “estimate,” “project,” “anticipate,” “aim,” “intend,” “seek,” “may,” “might,” “could” or “should,” and words of similar meaning in connection with a discussion of future operations, financial performance, events or conditions. From time to time, oral or written forward-looking statements may also be included in other materials released to the public. These statements are based on management’s assumptions, judgments and beliefs in light of the information currently available to it. Sony cautions investors that a number of important risks and uncertainties could cause actual results to differ materially from those discussed in the forward-looking statements, and therefore investors should not place undue reliance on them. Investors also should not rely on any obligation of Sony to update or revise any forward-looking statements, whether as a result of new information, future events or otherwise. Sony disclaims any such obligation. Risks and uncertainties that might affect Sony include, but are not limited to: (i) the global economic environment in which Sony operates and the economic conditions in Sony’s markets, particularly levels of
consumer spending; (ii) foreign exchange rates, particularly between the yen and the U.S. dollar, the euro and other currencies in which Sony makes significant
sales and incurs production costs, or in which Sony’s assets and liabilities are denominated; (iii) Sony’s ability to continue to design and develop and win acceptance of, as well as achieve sufficient cost reductions for, its products
and services, including televisions, game and network platforms and smartphones, which are offered in highly competitive markets characterized by severe price competition and continual new product and service introductions, rapid development in technology and subjective and changing consumer preferences;
(iv) Sony’s ability and timing to recoup large-scale investments required for technology development and production capacity; (v) Sony’s ability to implement successful business restructuring and transformation efforts under changing market conditions; (vi) Sony’s ability to implement successful hardware, software, and content integration strategies for all segments excluding the Financial
Services segment, and to develop and implement successful sales and distribution strategies in light of the Internet and other technological developments;
(vii) Sony’s continued ability to devote sufficient resources to research and development and, with respect to capital expenditures, to prioritize investments correctly (particularly in the electronics businesses);
(viii) Sony’s ability to maintain product quality and customers’ satisfaction with its existing products and services; (ix) the effectiveness of Sony’s strategies and their execution, including but not limited to the success of Sony’s acquisitions, joint ventures
and other strategic investments; (x) significant volatility and disruption in the global financial markets or a ratings downgrade; (xi) Sony’s ability to forecast demands, manage timely procurement and control inventories; (xii) the outcome of pending and/or future legal and/or regulatory proceedings; (xiii) shifts in customer demand for financial services such as life insurance and Sony’s ability to conduct successful asset liability
management in the Financial Services segment; (xiv) the impact of changes in interest rates and unfavorable conditions or developments (including market fluctuations or volatility) in the
Japanese equity markets on the revenue and operating income of the Financial Services segment; (xv) Sony’s ability to anticipate and manage cybersecurity risk, including the risk of unauthorized access to Sony’s business information,
potential business disruptions or financial losses; and (xvi) risks related to catastrophic disasters or similar events. Risks and uncertainties also include the impact of any future events with material adverse impact. Investor Relations Contacts:
Tokyo New York London Atsuko Murakami Justin Hill Toshiyuki Takahashi +81-(0)3-6748-2111 +1-212-833-6722 +44-(0)1932-816-000
IR home page: https://www.sony.net/IR/ Presentation slides: https://www.sony.net/SonyInfo/IR/library/er.html

F-1
Consolidated Financial StatementsConsolidated Balance Sheets
Current assets:Cash and cash equivalents \ 983,612 \ 960,142 \ -23,470 $ 8,573 Marketable securities 946,397 1,051,441 +105,044 9,388 Notes and accounts receivable, trade 926,375 1,006,961 +80,586 8,991 Allowance for doubtful accounts and sales returns (72,783) (53,150) +19,633 (475)Inventories 683,146 640,835 -42,311 5,722 Other receivables 206,058 223,632 +17,574 1,997 Deferred income taxes 40,940 - -40,940 -Prepaid expenses and other current assets 482,982 525,861 +42,879 4,694 Total current assets 4,196,727 4,355,722 +158,995 38,890
Film costs 301,228 336,928 +35,700 3,008 Investments and advances:
Affiliated companies 164,874 149,371 -15,503 1,334 Securities investments and other 9,069,209 9,962,422 +893,213 88,950
9,234,083 10,111,793 +877,710 90,284 Property, plant and equipment:
Land 121,707 117,293 -4,414 1,047 Buildings 655,379 666,381 +11,002 5,950 Machinery and equipment 1,795,991 1,842,852 +46,861 16,454 Construction in progress 69,286 28,779 -40,507 257
2,642,363 2,655,305 +12,942 23,708 Less-Accumulated depreciation 1,821,545 1,897,106 +75,561 16,938
820,818 758,199 -62,619 6,770 Other assets:
Intangibles, net 615,754 584,185 -31,569 5,216 Goodwill 606,290 522,538 -83,752 4,666 Deferred insurance acquisition costs 511,834 568,837 +57,003 5,079 Deferred income taxes 97,639 98,958 +1,319 884 Other 289,017 323,396 +34,379 2,887
2,120,534 2,097,914 -22,620 18,732 Total assets \ 16,673,390 \ 17,660,556 \ +987,166 $ 157,684
Current liabilities:Short-term borrowings \ 149,272 \ 464,655 \ +315,383 $ 4,149 Current portion of long-term debt 187,668 53,424 -134,244 477 Notes and accounts payable, trade 550,964 539,900 -11,064 4,821 Accounts payable, other and accrued expenses 1,367,115 1,394,758 +27,643 12,453 Accrued income and other taxes 88,865 106,037 +17,172 947 Deposits from customers in the banking business 1,912,673 2,071,091 +158,418 18,492 Other 574,193 591,874 +17,681 5,284 Total current liabilities 4,830,750 5,221,739 +390,989 46,623
Long-term debt 556,605 681,462 +124,857 6,084 Accrued pension and severance costs 462,384 396,715 -65,669 3,542 Deferred income taxes 450,926 432,824 -18,102 3,865 Future insurance policy benefits and other 4,509,215 4,834,492 +325,277 43,165 Policyholders’ account in the life insurance business 2,401,320 2,631,073 +229,753 23,492 Other 330,302 314,771 -15,531 2,810 Total liabilities 13,541,502 14,513,076 +971,574 129,581 Redeemable noncontrolling interest 7,478 12,058 +4,580 108 Equity:Sony Corporation’s stockholders’ equity:
Common stock 858,867 860,645 +1,778 7,684 Additional paid-in capital 1,325,719 1,275,337 -50,382 11,387 Retained earnings 936,331 984,368 +48,037 8,789 Accumulated other comprehensive income (653,318) (618,769) +34,549 (5,524)Treasury stock, at cost (4,259) (4,335) -76 (39)
2,463,340 2,497,246 +33,906 22,297 Noncontrolling interests 661,070 638,176 -22,894 5,698 Total equity 3,124,410 3,135,422 +11,012 27,995 Total liabilities and equity \ 16,673,390 \ 17,660,556 \ +987,166 $ 157,684
2017March 31, 2016
LIABILITIES AND EQUITY
ASSETS 2016 2017
(Millions of yen, millions of U.S. dollars)March 31 Change from March 31March 31

F-2
Consolidated Statements of Income
Sales and operating revenue:Net sales \ 6,949,357 \ 6,443,328 $ 57,530 Financial services revenue 1,066,319 1,080,284 9,645 Other operating revenue 90,036 79,638 711
8,105,712 7,603,250 -6.2 % 67,886
Costs and expenses:Cost of sales 5,166,894 4,753,010 42,438 Selling, general and administrative 1,691,930 1,505,956 13,446 Financial services expenses 907,758 910,144 8,126 Other operating expense, net 47,171 149,001 1,330
7,813,753 7,318,111 -6.3 65,340
Equity in net income of affiliated companies 2,238 3,563 +59.2 32
Operating income 294,197 288,702 -1.9 2,578
Other income:Interest and dividends 12,455 11,459 102 Gain on sale of securities investments, net 52,068 225 2 Other 2,326 2,734 25
66,849 14,418 -78.4 129
Other expenses:Interest 25,286 14,544 130 Loss on devaluation of securities investments 3,309 7,629 68 Foreign exchange loss, net 20,565 22,181 198 Other 7,382 7,147 64
56,542 51,501 -8.9 460
Income before income taxes 304,504 251,619 -17.4 2,247
Income taxes 94,789 124,058 1,108
Net income 209,715 127,561 -39.2 1,139
Less - Net income attributable to noncontrolling interests 61,924 54,272 485
Net income attributable to Sony Corporation’s stockholders \ 147,791 \ 73,289 -50.4 % $ 654
Per share data:Net income attributable to Sony Corporation’s stockholders — Basic \ 119.40 \ 58.07 -51.4 % $ 0.52 — Diluted 117.49 56.89 -51.6 0.51
Net income \ 209,715 \ 127,561 -39.2 % $ 1,139
Other comprehensive income, net of tax –Unrealized gains (losses) on securities 2,220 (30,293) (270)Unrealized gains (losses) on derivative instruments (1,198) 1,140 10 Pension liability adjustment (171,753) 63,232 565 Foreign currency translation adjustments (83,899) (17,988) (161)
Total comprehensive income (loss) (44,915) 143,652 - 1,283
Less - Comprehensive income attributable to noncontrolling interests 75,329 35,814 320
Comprehensive income (loss) attributable to Sony Corporation’s stockholders \ (120,244) \ 107,838 - % $ 963
Consolidated Statements of Comprehensive Income(Millions of yen, millions of U.S. dollars)
Fiscal year ended March 312016 2017 Change from 2016 2017
(Millions of yen, millions of U.S. dollars, except per share amounts)Fiscal year ended March 31
2016 2017 2017Change from 2016
F-3
Consolidated Statements of Income
Sales and operating revenue:Net sales \ 1,543,758 \ 1,609,315 $ 14,369 Financial services revenue 259,227 273,330 2,440 Other operating revenue 21,116 20,959 187
1,824,101 1,903,604 +4.4 % 16,996
Costs and expenses:Cost of sales 1,180,989 1,193,083 10,652 Selling, general and administrative 433,482 417,860 3,731 Financial services expenses 241,279 216,607 1,934 Other operating (income) expense, net 60,317 (16,453) (147)
1,916,067 1,811,097 -5.5 16,170
Equity in net income (loss) of affiliated companies (907) 1,884 - 17
Operating income (loss) (92,873) 94,391 - 843
Other income:Interest and dividends 3,400 3,600 32 Gain on sale of securities investments, net 272 70 1 Other 785 828 7
4,457 4,498 +0.9 40
Other expenses:Interest 5,965 2,642 24 Loss on devaluation of securities investments 3,058 2,769 25 Foreign exchange loss, net 263 2,951 26 Other 1,978 2,671 24
11,264 11,033 -2.1 99
Income (loss) before income taxes (99,680) 87,856 - 784
Income taxes (24,565) 43,127 385
Net income (loss) (75,115) 44,729 - 399
Less - Net income attributable to noncontrolling interests 13,222 17,079 152
Net income (loss) attributable to Sony Corporation’s stockholders \ (88,337) \ 27,650 - % $ 247
Per share data:Net income (loss) attributable to Sony Corporation’s stockholders — Basic \ (70.03) \ 21.90 - % $ 0.20 — Diluted (70.03) 21.45 - 0.19
Net income (loss) \ (75,115) \ 44,729 - % $ 399
Other comprehensive income, net of tax –Unrealized gains (losses) on securities 37,084 (4,648) (42)Unrealized losses on derivative instruments (3,312) (2,550) (23)Pension liability adjustment (173,119) 53,935 482 Foreign currency translation adjustments (61,660) (23,365) (208)
Total comprehensive income (loss) (276,122) 68,101 - 608
Less - Comprehensive income attributable to noncontrolling interests 28,283 14,507 129
Comprehensive income (loss) attributable to Sony Corporation’s stockholders \ (304,405) \ 53,594 - % $ 479
Consolidated Statements of Comprehensive Income(Millions of yen, millions of U.S. dollars)
Three months ended March 312016 2017 Change from 2016 2017
(Millions of yen, millions of U.S. dollars, except per share amounts)Three months ended March 31
2016 2017 Change from 2016 2017

F-4
Consolidated Statements of Changes in Stockholders' Equity(Millions of yen)
Balance at March 31, 2015 \ 707,038 \ 1,185,777 \ 813,765 \ (385,283) \ (4,220) \ 2,317,077 \ 611,392 \ 2,928,469 Issuance of new shares 150,854 150,854 301,708 301,708 Exercise of stock acquisition rights 975 975 1,950 1,950 Stock based compensation 1,516 1,516 1,516
Comprehensive income:Net income 147,791 147,791 61,924 209,715 Other comprehensive income, net of tax
Unrealized gains (losses) on securities (13,417) (13,417) 15,637 2,220 Unrealized losses on derivative instruments (1,198) (1,198) (1,198) Pension liability adjustment (170,608) (170,608) (1,145) (171,753) Foreign currency translation adjustments (82,812) (82,812) (1,087) (83,899)
Total comprehensive income (loss) (120,244) 75,329 (44,915)
Stock issue costs, net of tax (1,478) (1,478) (1,478) Dividends declared (25,225) (25,225) (20,868) (46,093) Purchase of treasury stock (110) (110) (110) Reissuance of treasury stock (12) 71 59 59 Transactions with noncontrolling interests
(11,913) (11,913) (4,783) (16,696) Balance at March 31, 2016 \ 858,867 \ 1,325,719 \ 936,331 \ (653,318) \ (4,259) \ 2,463,340 \ 661,070 \ 3,124,410
Balance at March 31, 2016 \ 858,867 \ 1,325,719 \ 936,331 \ (653,318) \ (4,259) \ 2,463,340 \ 661,070 \ 3,124,410 Exercise of stock acquisition rights 1,778 1,778 3,556 3,556 Stock based compensation 1,601 1,601 1,601
Comprehensive income:Net income 73,289 73,289 54,272 127,561 Other comprehensive income, net of tax
Unrealized losses on securities (14,101) (14,101) (16,192) (30,293) Unrealized gains on derivative instruments 1,140 1,140 1,140 Pension liability adjustment 63,003 63,003 229 63,232 Foreign currency translation adjustments (15,493) (15,493) (2,495) (17,988)
Total comprehensive income 107,838 35,814 143,652
Stock issue costs, net of tax (30) (30) (30) Dividends declared (25,252) (25,252) (17,068) (42,320) Purchase of treasury stock (114) (114) (114) Reissuance of treasury stock (10) 38 28 28 Transactions with noncontrolling interests
(53,721) (53,721) (41,640) (95,361) Balance at March 31, 2017 \ 860,645 \ 1,275,337 \ 984,368 \ (618,769) \ (4,335) \ 2,497,246 \ 638,176 \ 3,135,422
(Millions of U.S. dollars)
Balance at March 31, 2016 $ 7,668 $ 11,837 $ 8,360 $ (5,833) $ (38) $ 21,994 $ 5,902 $ 27,896 Exercise of stock acquisition rights 16 16 32 32 Stock based compensation 14 14 14
Comprehensive income:Net income 654 654 485 1,139 Other comprehensive income, net of tax
Unrealized losses on securities (125) (125) (145) (270) Unrealized gains on derivative instruments 10 10 10 Pension liability adjustment 563 563 2 565 Foreign currency translation adjustments (139) (139) (22) (161)
Total comprehensive income 963 320 1,283
Stock issue costs, net of tax (0) (0) (0) Dividends declared (225) (225) (153) (378) Purchase of treasury stock (1) (1) (1) Reissuance of treasury stock (0) 0 0 0 Transactions with noncontrolling interests
(480) (480) (371) (851) Balance at March 31, 2017 $ 7,684 $ 11,387 $ 8,789 $ (5,524) $ (39) $ 22,297 $ 5,698 $ 27,995
Additionalpaid-in capital
Retainedearnings
Accumulatedother
comprehensiveincome
Treasury stock,at cost
SonyCorporation’sstockholders’
equity
SonyCorporation’sstockholders’
equityNoncontrolling
interests Total equity
shareholders and other
Noncontrollinginterests Total equity
shareholders and other
shareholders and other
In September 2016, Sony obtained full ownership of its U.S.-based music publishing subsidiary by acquiring the 50% interest in the subsidiary held by the Estate of Michael Jackson (the“Estate”). The aggregate cash consideration paid to the Estate was 750 million U.S. dollars, including 17 million U.S. dollars of distributions to which the subsidiary previously committed.The difference between cash consideration paid and the decrease in the carrying amount of the noncontrolling interests was recognized as a decrease to additional paid-in capital of 70,730million yen.
Common stockAdditional
paid-in capitalRetainedearnings
Accumulatedother
comprehensiveincome
Treasury stock,at cost
Common stock

F-5
Consolidated Statements of Cash Flows
Cash flows from operating activities:Net income \ 209,715 \ 127,561 $ 1,139Adjustments to reconcile net income to net cashprovided by operating activities:
Depreciation and amortization, including amortization of deferred insurance acquisition costs 397,091 327,048 2,920 Amortization of film costs 299,587 297,505 2,656 Accrual for pension and severance costs, less payments (6,383) 9,297 83 Other operating expense, net 47,171 149,001 1,330 (Gain) loss on sale or devaluation of securities investments, net (48,857) 7,404 66(Gain) loss on revaluation of marketable securities held in the financial services business for trading purposes, net 44,821 (55,789) (498) Loss on revaluation or impairment of securities investments held in the financial services business, net 2,653 47 0Deferred income taxes 211 23,798 212 Equity in net loss of affiliated companies, net of dividends 5,045 4,409 39 Changes in assets and liabilities: Increase in notes and accounts receivable, trade (5,828) (37,529) (335) (Increase) decrease in inventories (57,804) 11,199 100 Increase in film costs (318,391) (331,179) (2,957) Decrease in notes and accounts payable, trade (49,525) (1,386) (12) Increase (decrease) in accrued income and other taxes (23,607) 26,701 238 Increase in future insurance policy benefits and other 403,392 433,803 3,873 Increase in deferred insurance acquisition costs (83,774) (93,234) (832) Increase in marketable securities held in the financial services business for trading purposes (107,433) (81,456) (727) (Increase) decrease in other current assets 21,299 (21,402) (191) Increase (decrease) in other current liabilities (25,751) 79,114 706 Other 45,457 (65,650) (584) Net cash provided by operating activities 749,089 809,262 7,226
Cash flows from investing activities:Payments for purchases of fixed assets (375,411) (333,509) (2,978) Proceeds from sales of fixed assets 26,472 13,098 117 Payments for investments and advances by financial services business (1,221,093) (1,233,290) (11,012) Payments for investments and advances (other than financial services business) (20,830) (17,208) (154) Proceeds from sales or return of investments and collections of advances by financial services business 534,072 289,901 2,588 Proceeds from sales or return of investments and collections of advances (other than financial services business) 81,535 16,078 144 Proceeds from sales of businesses 17,790 3,262 29 Other (72,938) 7,695 70
Net cash used in investing activities (1,030,403) (1,253,973) (11,196)
Cash flows from financing activities:Proceeds from issuance of long-term debt 19,076 254,695 2,274 Payments of long-term debt (270,669) (261,299) (2,333) Increase in short-term borrowings, net 92,153 317,827 2,838 Increase in deposits from customers in the financial services business, net 165,169 277,152 2,475 Proceeds from issuance of convertible bonds 120,000 - - Proceeds from issuance of new shares 301,708 - - Dividends paid (12,751) (25,301) (226) Payment for purchase of Sony/ATV shares from noncontrolling interests - (76,565) (684) Other (34,564) (34,207) (306)
Net cash provided by financing activities 380,122 452,302 4,038
Effect of exchange rate changes on cash and cash equivalents (64,609) (31,061) (277)
Net increase (decrease) in cash and cash equivalents 34,199 (23,470) (209) Cash and cash equivalents at beginning of the fiscal year 949,413 983,612 8,782
Cash and cash equivalents at end of the fiscal year \ 983,612 \ 960,142 $ 8,573
(Millions of yen, millions of U.S. dollars)
2016 2017 2017Fiscal year ended March 31

F-6
Business Segment Information
Sales and operating revenueMobile Communications
Customers \ 1,121,925 \ 752,688 -32.9 % $ 6,720 Intersegment 5,548 6,457 58 Total 1,127,473 759,145 -32.7 6,778
Game & Network ServicesCustomers 1,479,775 1,581,568 +6.9 14,121 Intersegment 72,118 68,231 609 Total 1,551,893 1,649,799 +6.3 14,730
Imaging Products & SolutionsCustomers 677,231 571,499 -15.6 5,103 Intersegment 6,724 8,134 72 Total 683,955 579,633 -15.3 5,175
Home Entertainment & SoundCustomers 1,155,085 1,034,215 -10.5 9,234 Intersegment 3,957 4,789 43 Total 1,159,042 1,039,004 -10.4 9,277
SemiconductorsCustomers 599,430 659,779 +10.1 5,891 Intersegment 139,629 113,344 1,012 Total 739,059 773,123 +4.6 6,903
ComponentsCustomers 194,564 172,772 -11.2 1,543 Intersegment 30,048 22,601 201 Total 224,612 195,373 -13.0 1,744
PicturesCustomers 935,827 901,230 -3.7 8,047 Intersegment 2,315 1,899 17 Total 938,142 903,129 -3.7 8,064
MusicCustomers 602,564 630,767 +4.7 5,632 Intersegment 16,675 16,891 151 Total 619,239 647,658 +4.6 5,783
Financial ServicesCustomers 1,066,319 1,080,284 +1.3 9,645 Intersegment 6,750 7,220 65 Total 1,073,069 1,087,504 +1.3 9,710
All OtherCustomers 241,104 202,344 -16.1 1,807 Intersegment 91,092 64,634 577 Total 332,196 266,978 -19.6 2,384
Corporate and elimination (342,968) (298,096) - (2,662)Consolidated total \ 8,105,712 \ 7,603,250 -6.2 % $ 67,886
Mobile Communications \ (61,435) \ 10,164 - % $ 91 Game & Network Services 88,668 135,553 +52.9 1,210 Imaging Products & Solutions 69,320 47,257 -31.8 422 Home Entertainment & Sound 50,558 58,504 +15.7 522 Semiconductors 14,500 (7,811) - (70)Components (42,919) (60,445) - (540)Pictures 38,507 (80,521) - (719)Music 86,509 75,798 -12.4 677 Financial Services 156,543 166,424 +6.3 1,486 All Other 1,667 30,861 +1,751.3 276 Total 401,918 375,784 -6.5 3,355 Corporate and elimination (107,721) (87,082) - (777)Consolidated total \ 294,197 \ 288,702 -1.9 % $ 2,578
(Millions of yen, millions of U.S. dollars)Fiscal year ended March 31
2016 2017 Change 2017
The 2016 segment disclosure above has been reclassified to reflect the change in the business segment classification discussed in Note 5.Operating income (loss) is sales and operating revenue less costs and expenses, and includes equity in net income (loss) of affiliated companies.Corporate and elimination includes headquarters restructuring costs, and certain other corporate expenses, including the amortization of certainintellectual property assets such as the cross-licensing of intangible assets acquired from Ericsson at the time of the Sony Mobile Communicationsacquisition, which are not allocated to segments.Pursuant to a separation of Sony’s businesses into distinct subsidiaries and a realignment of corporate functions, beginning from the fiscal yearended March 31, 2017, a change has been made to the method of calculating the amount of corporate costs allocated to each business segment andthe amount of royalties paid by each business segment for brand and patent utilization. As a result of this change, an increase in corporate incomeof 31,780 million yen is included in Corporate and elimination for the fiscal year ended March 31, 2017. Conversely, an increase in expensestotaling the same amount is included in each of the following business segments: 2,771 million yen in the MC segment, 2,739 million yen in theG&NS segment, 3,413 million yen in the IP&S segment, 13,075 million yen in the Home Entertainment & Sound (“HE&S”) segment, 3,727 millionyen in the Semiconductors segment, 1,462 million yen in the Components segment, 2,569 million yen in the Pictures segment and 2,024 million yenin the Music segment. There is no change to the Financial Services segment. These changes have no impact on consolidated operating income.
Game & Network Services (“G&NS”) intersegment amounts primarily consist of transactions with All Other.Semiconductors intersegment amounts primarily consist of transactions with the Mobile Communications (“MC”) segment, the G&NS segmentand the Imaging Products & Solutions (“IP&S”) segment.All Other intersegment amounts primarily consist of transactions with the Pictures segment, the Music segment and the G&NS segment.Corporate and elimination includes certain brand and patent royalty income.
(Millions of yen, millions of U.S. dollars)Fiscal year ended March 31
Operating income (loss) 2016 2017 Change 2017
F-7
Business Segment Information
Sales and operating revenueMobile Communications
Customers \ 181,848 \ 153,833 -15.4 % $ 1,374 Intersegment 1,362 2,022 18 Total 183,210 155,855 -14.9 1,392
Game & Network ServicesCustomers 307,575 368,955 +20.0 3,294 Intersegment 7,959 12,886 115 Total 315,534 381,841 +21.0 3,409
Imaging Products & SolutionsCustomers 151,618 151,837 +0.1 1,356 Intersegment 1,864 3,079 27 Total 153,482 154,916 +0.9 1,383
Home Entertainment & SoundCustomers 213,833 213,416 -0.2 1,906 Intersegment 1,003 1,367 12 Total 214,836 214,783 -0.0 1,918
SemiconductorsCustomers 123,902 175,447 +41.6 1,566 Intersegment 23,962 25,630 229 Total 147,864 201,077 +36.0 1,795
ComponentsCustomers 44,904 49,076 +9.3 438 Intersegment 4,124 4,080 37 Total 49,028 53,156 +8.4 475
PicturesCustomers 321,021 301,310 -6.1 2,690 Intersegment (289) 1,234 11 Total 320,732 302,544 -5.7 2,701
MusicCustomers 162,298 172,511 +6.3 1,540 Intersegment 5,592 4,525 41 Total 167,890 177,036 +5.4 1,581
Financial ServicesCustomers 259,227 273,330 +5.4 2,440 Intersegment 1,681 1,803 17 Total 260,908 275,133 +5.5 2,457
All OtherCustomers 50,268 49,380 -1.8 441 Intersegment 23,613 16,265 145 Total 73,881 65,645 -11.1 586
Corporate and elimination (63,264) (78,382) - (701)Consolidated total \ 1,824,101 \ 1,903,604 +4.4 % $ 16,996
Mobile Communications \ (42,058) \ (15,167) - % $ (135)Game & Network Services 5,121 22,502 +339.4 201 Imaging Products & Solutions 5,671 3,790 -33.2 34 Home Entertainment & Sound (7,279) (5,227) - (47)Semiconductors (73,570) 12,756 - 114 Components (6,395) (15,347) - (137)Pictures 52,302 33,686 -35.6 301 Music 13,317 15,425 +15.8 138 Financial Services 17,176 55,318 +222.1 494 All Other (4,428) 27,367 - 244 Total (40,143) 135,103 - 1,207 Corporate and elimination (52,730) (40,712) - (364)Consolidated total \ (92,873) \ 94,391 - % $ 843 The 2016 segment disclosure above has been reclassified to reflect the change in the business segment classification discussed in Note 5.Operating income (loss) is sales and operating revenue less costs and expenses, and includes equity in net income (loss) of affiliated companies.Corporate and elimination includes headquarters restructuring costs, and certain other corporate expenses, including the amortization of certainintellectual property assets such as the cross-licensing of intangible assets acquired from Ericsson at the time of the Sony Mobile Communicationsacquisition, which are not allocated to segments.Pursuant to a separation of Sony’s businesses into distinct subsidiaries and a realignment of corporate functions, beginning from the fiscal yearended March 31, 2017, a change has been made to the method of calculating the amount of corporate costs allocated to each business segment andthe amount of royalties paid by each business segment for brand and patent utilization. As a result of this change, an increase in corporate incomeof 7,826 million yen is included in Corporate and elimination for the three months ended March 31, 2017. Conversely, an increase in expensestotaling the same amount is included in each of the following business segments: 480 million yen in the MC segment, 950 million yen in the G&NSsegment, 862 million yen in the IP&S segment, 2,940 million yen in the HE&S segment, 981 million yen in the Semiconductors segment, 412million yen in the Components segment, 674 million yen in the Pictures segment and 527 million yen in the Music segment. There is no change tothe Financial Services segment. These changes have no impact on consolidated operating income.
(Millions of yen, millions of U.S. dollars)
2016 2017 Change 2017Three months ended March 31
The G&NS intersegment amounts primarily consist of transactions with All Other.Semiconductors intersegment amounts primarily consist of transactions with the MC segment, the G&NS segment and the IP&S segment.All Other intersegment amounts primarily consist of transactions with the Pictures segment, the Music segment and the G&NS segment.Corporate and elimination includes certain brand and patent royalty income.
(Millions of yen, millions of U.S. dollars)Three months ended March 31
Operating income (loss) 2016 2017 Change 2017

F-8
Sales to Customers by Product Category
Sales and operating revenue (to external customers)
Mobile Communications \ 1,121,925 \ 752,688 -32.9 % $ 6,720
Game & Network ServicesHardware 721,829 598,373 -17.1 5,343 Network 529,318 714,924 +35.1 6,383 Other 228,628 268,271 +17.3 2,395 Total 1,479,775 1,581,568 +6.9 14,121
Imaging Products & SolutionsStill and Video Cameras 428,777 351,834 -17.9 3,141 Other 248,454 219,665 -11.6 1,962 Total 677,231 571,499 -15.6 5,103
Home Entertainment & SoundTelevisions 797,764 720,557 -9.7 6,434 Audio and Video 354,946 311,771 -12.2 2,784 Other 2,375 1,887 -20.5 16 Total 1,155,085 1,034,215 -10.5 9,234
Semiconductors 599,430 659,779 +10.1 5,891
Components 194,564 172,772 -11.2 1,543
PicturesMotion Pictures 447,355 409,363 -8.5 3,655 Television Productions 270,115 271,886 +0.7 2,428 Media Networks 218,357 219,981 +0.7 1,964 Total 935,827 901,230 -3.7 8,047
MusicRecorded Music 412,718 388,948 -5.8 3,473 Music Publishing 71,258 66,541 -6.6 594 Visual Media and Platform 118,588 175,278 +47.8 1,565 Total 602,564 630,767 +4.7 5,632
Financial Services 1,066,319 1,080,284 +1.3 9,645 All Other 241,104 202,344 -16.1 1,807 Corporate 31,888 16,104 -49.5 143 Consolidated total \ 8,105,712 \ 7,603,250 -6.2 % $ 67,886
The above table includes a breakdown of sales and operating revenue to external customers for certain segments shown in theBusiness Segment Information on page F-6. Sony management views each segment as a single operating segment. However, Sonybelieves that the breakdown of sales and operating revenue to external customers for the segments in this table is useful to investorsin understanding sales by product category.
Sony has realigned its product category configuration from the first quarter of the fiscal year ended March 31, 2017. In connectionwith the realignment, all prior period sales amounts by product category in the table above have been reclassified to conform to thecurrent presentation.
In the G&NS segment, Hardware includes home and portable game consoles; Network includes network services relating to game,video and music content provided by Sony Interactive Entertainment; Other includes packaged software and peripheral devices. Inthe IP&S segment, Still and Video Cameras includes interchangeable lens cameras, compact digital cameras, consumer videocameras and video cameras for broadcast; Other includes display products such as projectors and medical equipment. In the HE&Ssegment, Televisions includes LCD televisions; Audio and Video includes Blu-ray disc players and recorders, home audio,headphones and memory-based portable audio devices. The Semiconductors segment includes image sensors and camera modules.The Components segment includes batteries and recording media. In the Pictures segment, Motion Pictures includes the worldwideproduction, acquisition and distribution of motion pictures and direct-to-video content; Television Productions includes theproduction, acquisition and distribution of television programming; Media Networks includes the operation of television and digitalnetworks worldwide. In the Music segment, Recorded Music includes the distribution of physical and digital recorded music andrevenue derived from artists' live performances; Music Publishing includes the management and licensing of the words and music ofsongs; Visual Media and Platform includes the production and distribution of animation titles, including game applications based onthe animation titles, and various service offerings for music and visual products.
(Millions of yen, millions of U.S. dollars)
2016 2017 Change 2017Fiscal year ended March 31

F-9
Sales to Customers by Product Category
Sales and operating revenue (to external customers)
Mobile Communications \ 181,848 \ 153,833 -15.4 % $ 1,374
Game & Network ServicesHardware 97,341 92,964 -4.5 830 Network 159,916 210,056 +31.4 1,876 Other 50,318 65,935 +31.0 588 Total 307,575 368,955 +20.0 3,294
Imaging Products & SolutionsStill and Video Cameras 80,821 83,872 +3.8 749 Other 70,797 67,965 -4.0 607 Total 151,618 151,837 +0.1 1,356
Home Entertainment & SoundTelevisions 147,366 140,746 -4.5 1,257 Audio and Video 66,498 72,001 +8.3 643 Other (31) 669 - 6 Total 213,833 213,416 -0.2 1,906
Semiconductors 123,902 175,447 +41.6 1,566
Components 44,904 49,076 +9.3 438
PicturesMotion Pictures 148,888 143,662 -3.5 1,283 Television Productions 121,944 103,225 -15.4 922 Media Networks 50,189 54,423 +8.4 485 Total 321,021 301,310 -6.1 2,690
MusicRecorded Music 101,186 94,652 -6.5 845 Music Publishing 18,995 19,750 +4.0 176 Visual Media and Platform 42,117 58,109 +38.0 519 Total 162,298 172,511 +6.3 1,540
Financial Services 259,227 273,330 +5.4 2,440 All Other 50,268 49,380 -1.8 441 Corporate 7,607 (5,491) - (49)Consolidated total \ 1,824,101 \ 1,903,604 +4.4 % $ 16,996
The above table includes a breakdown of sales and operating revenue to external customers for certain segments shown in theBusiness Segment Information on page F-7. Sony management views each segment as a single operating segment. However, Sonybelieves that the breakdown of sales and operating revenue to external customers for the segments in this table is useful to investorsin understanding sales by product category.
Sony has realigned its product category configuration from the first quarter of the fiscal year ended March 31, 2017. In connectionwith the realignment, all prior period sales amounts by product category in the table above have been reclassified to conform to thecurrent presentation.
In the G&NS segment, Hardware includes home and portable game consoles; Network includes network services relating to game,video and music content provided by Sony Interactive Entertainment; Other includes packaged software and peripheral devices. Inthe IP&S segment, Still and Video Cameras includes interchangeable lens cameras, compact digital cameras, consumer videocameras and video cameras for broadcast; Other includes display products such as projectors and medical equipment. In the HE&Ssegment, Televisions includes LCD televisions; Audio and Video includes Blu-ray disc players and recorders, home audio,headphones and memory-based portable audio devices. The Semiconductors segment includes image sensors and camera modules.The Components segment includes batteries and recording media. In the Pictures segment, Motion Pictures includes the worldwideproduction, acquisition and distribution of motion pictures and direct-to-video content; Television Productions includes theproduction, acquisition and distribution of television programming; Media Networks includes the operation of television and digitalnetworks worldwide. In the Music segment, Recorded Music includes the distribution of physical and digital recorded music andrevenue derived from artists' live performances; Music Publishing includes the management and licensing of the words and music ofsongs; Visual Media and Platform includes the production and distribution of animation titles, including game applications based onthe animation titles, and various service offerings for music and visual products.
(Millions of yen, millions of U.S. dollars)
2016 2017 Change 2017Three months ended March 31

F-10
Other Items
Mobile Communications \ 24,186 \ 19,794 -18.2 % $ 177 Game & Network Services 20,798 25,486 +22.5 227 Imaging Products & Solutions 27,612 25,442 -7.9 227 Home Entertainment & Sound 21,781 19,830 -9.0 177 Semiconductors 100,964 102,328 +1.4 914 Components 9,170 1,962 -78.6 18 Pictures 22,375 20,487 -8.4 183 Music 17,795 16,124 -9.4 144 Financial Services, including deferred insurance acquisition costs 102,270 47,056 -54.0 420 All Other 8,597 5,445 -36.7 48 Total 355,548 283,954 -20.1 2,535 Corporate 41,543 43,094 +3.7 385 Consolidated total \ 397,091 \ 327,048 -17.6 % $ 2,920
Mobile Communications \ 20,928 \ 710 \ 21,638 Game & Network Services 135 - 135 Imaging Products & Solutions 204 - 204 Home Entertainment & Sound 1,207 - 1,207 Semiconductors (113) - (113)Components 22 - 22 Pictures 1,601 5 1,606 Music 1,868 - 1,868 Financial Services - - -All Other and Corporate 10,675 1,017 11,692 Consolidated total \ 36,527 \ 1,732 \ 38,259
Mobile Communications \ 688 \ 138 \ 826 Game & Network Services 231 - 231 Imaging Products & Solutions 640 - 640 Home Entertainment & Sound 752 - 752 Semiconductors (9) - (9)Components 43,439 - 43,439 Pictures 2,467 - 2,467 Music 3,590 - 3,590 Financial Services - - -All Other and Corporate 7,915 364 8,279 Consolidated total \ 59,713 \ 502 \ 60,215
Mobile Communications $ 6 $ 1 $ 7 Game & Network Services 2 - 2 Imaging Products & Solutions 6 - 6 Home Entertainment & Sound 7 - 7 Semiconductors (0) - (0)Components 388 - 388 Pictures 22 - 22 Music 32 - 32 Financial Services - - -All Other and Corporate 71 3 74 Consolidated total $ 534 $ 4 $ 538
(Millions of yen, millions of U.S. dollars)
(Millions of yen, millions of U.S. dollars)
Depreciation and amortization 2016 2017 2017ChangeFiscal year ended March 31
Restructuring charges and associated depreciation
Total netrestructuring
charges
Depreciationassociated with
restructuredassets
Total
Depreciation associated with restructured assets as used in the context of the disclosures regarding restructuring activities refers to the increase indepreciation expense caused by revising the useful life and the salvage value of depreciable fixed assets under an approved restructuring plan. Anyimpairment of the assets is recognized immediately in the period it is identified.
Fiscal year ended March 31, 2017
Fiscal year ended March 31, 2017
Restructuring charges and associated depreciation
Total netrestructuring
charges
Depreciationassociated with
restructuredassets
Fiscal year ended March 31, 2016
Restructuring charges and associated depreciation
Total netrestructuring
charges
Depreciationassociated with
restructuredassets
Total
Total
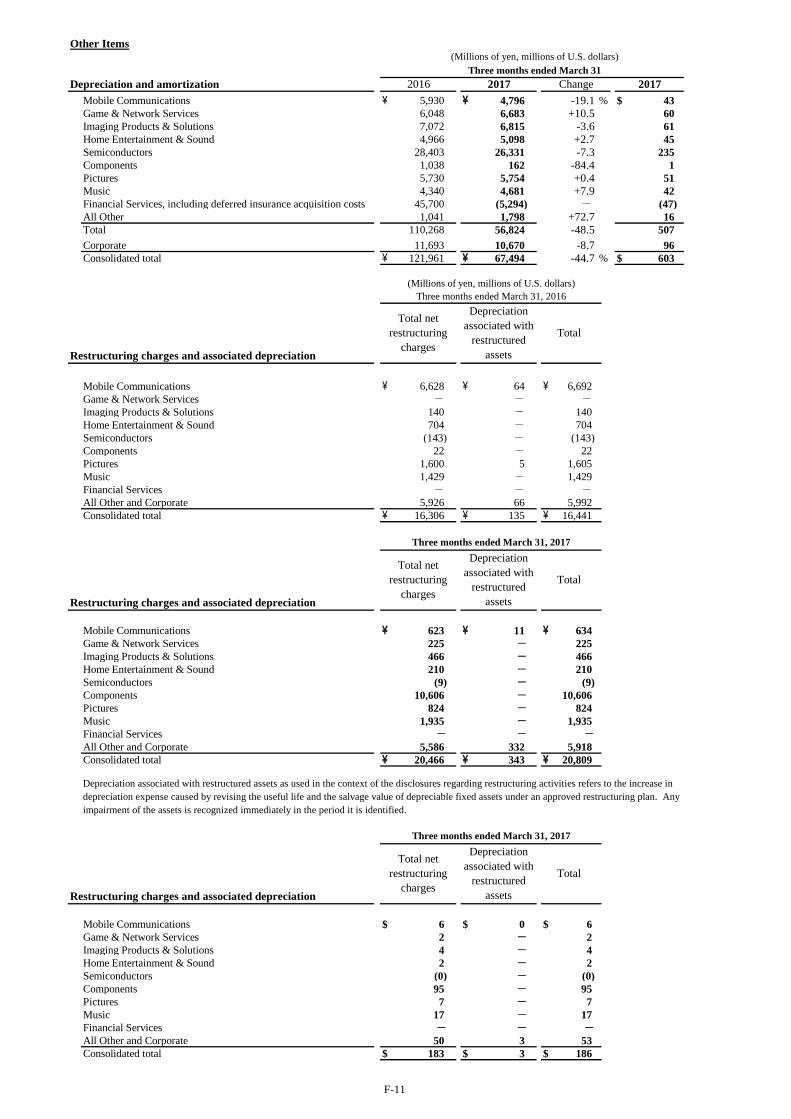
F-11
Other Items
Mobile Communications \ 5,930 \ 4,796 -19.1 % $ 43 Game & Network Services 6,048 6,683 +10.5 60 Imaging Products & Solutions 7,072 6,815 -3.6 61 Home Entertainment & Sound 4,966 5,098 +2.7 45 Semiconductors 28,403 26,331 -7.3 235 Components 1,038 162 -84.4 1 Pictures 5,730 5,754 +0.4 51 Music 4,340 4,681 +7.9 42 Financial Services, including deferred insurance acquisition costs 45,700 (5,294) - (47)All Other 1,041 1,798 +72.7 16 Total 110,268 56,824 -48.5 507 Corporate 11,693 10,670 -8.7 96 Consolidated total \ 121,961 \ 67,494 -44.7 % $ 603
Mobile Communications \ 6,628 \ 64 \ 6,692 Game & Network Services - - -Imaging Products & Solutions 140 - 140 Home Entertainment & Sound 704 - 704 Semiconductors (143) - (143)Components 22 - 22 Pictures 1,600 5 1,605 Music 1,429 - 1,429 Financial Services - - -All Other and Corporate 5,926 66 5,992 Consolidated total \ 16,306 \ 135 \ 16,441
Mobile Communications \ 623 \ 11 \ 634 Game & Network Services 225 - 225 Imaging Products & Solutions 466 - 466 Home Entertainment & Sound 210 - 210 Semiconductors (9) - (9)Components 10,606 - 10,606 Pictures 824 - 824 Music 1,935 - 1,935 Financial Services - - -All Other and Corporate 5,586 332 5,918 Consolidated total \ 20,466 \ 343 \ 20,809
Mobile Communications $ 6 $ 0 $ 6 Game & Network Services 2 - 2 Imaging Products & Solutions 4 - 4 Home Entertainment & Sound 2 - 2 Semiconductors (0) - (0)Components 95 - 95 Pictures 7 - 7 Music 17 - 17 Financial Services - - -All Other and Corporate 50 3 53 Consolidated total $ 183 $ 3 $ 186
Three months ended March 31, 2017
Restructuring charges and associated depreciation
Total netrestructuring
charges
Depreciationassociated with
restructuredassets
Total
Depreciation associated with restructured assets as used in the context of the disclosures regarding restructuring activities refers to the increase indepreciation expense caused by revising the useful life and the salvage value of depreciable fixed assets under an approved restructuring plan. Anyimpairment of the assets is recognized immediately in the period it is identified.
(Millions of yen, millions of U.S. dollars)Three months ended March 31, 2016
Restructuring charges and associated depreciation
Total netrestructuring
charges
Depreciationassociated with
restructuredassets
Total
Three months ended March 31, 2017
Restructuring charges and associated depreciation
Total netrestructuring
charges
Depreciationassociated with
restructuredassets
Total
(Millions of yen, millions of U.S. dollars)
Depreciation and amortization 2016 2017 Change 2017Three months ended March 31
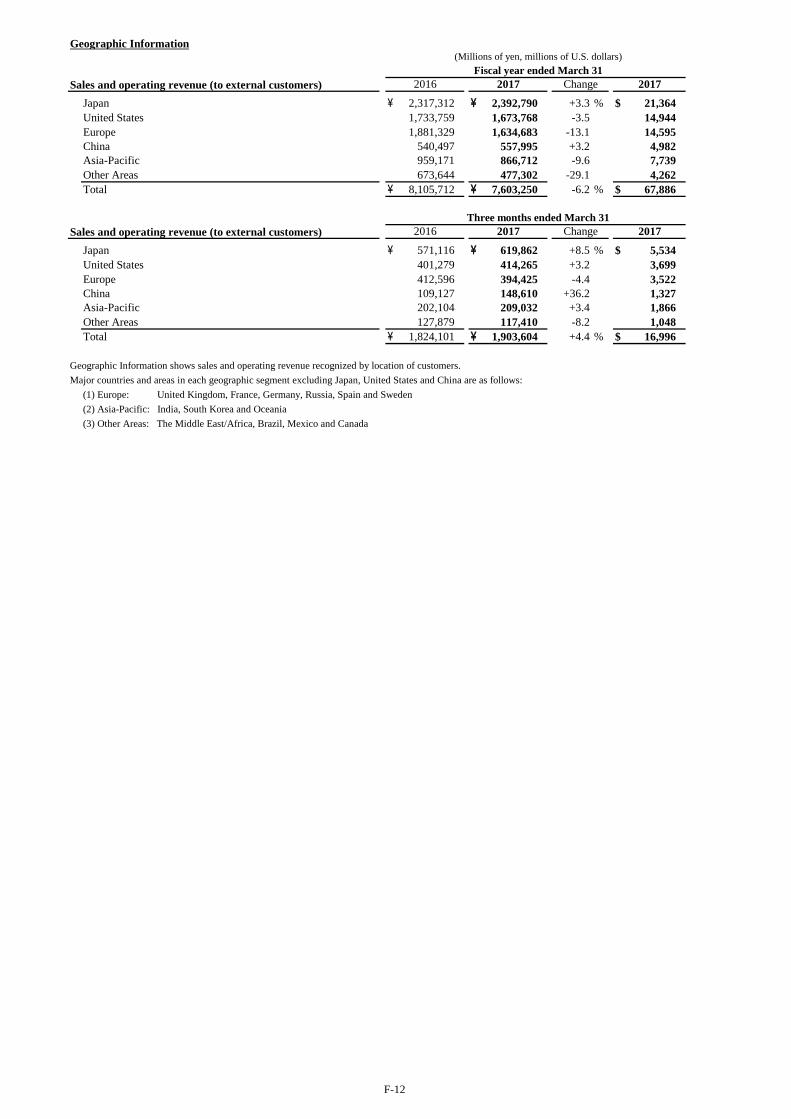
F-12
Geographic Information
Sales and operating revenue (to external customers)Japan \ 2,317,312 \ 2,392,790 +3.3 % $ 21,364 United States 1,733,759 1,673,768 -3.5 14,944 Europe 1,881,329 1,634,683 -13.1 14,595 China 540,497 557,995 +3.2 4,982 Asia-Pacific 959,171 866,712 -9.6 7,739 Other Areas 673,644 477,302 -29.1 4,262 Total \ 8,105,712 \ 7,603,250 -6.2 % $ 67,886
Sales and operating revenue (to external customers)Japan \ 571,116 \ 619,862 +8.5 % $ 5,534 United States 401,279 414,265 +3.2 3,699 Europe 412,596 394,425 -4.4 3,522 China 109,127 148,610 +36.2 1,327 Asia-Pacific 202,104 209,032 +3.4 1,866 Other Areas 127,879 117,410 -8.2 1,048 Total \ 1,824,101 \ 1,903,604 +4.4 % $ 16,996
Geographic Information shows sales and operating revenue recognized by location of customers.Major countries and areas in each geographic segment excluding Japan, United States and China are as follows:
(1) Europe: United Kingdom, France, Germany, Russia, Spain and Sweden(2) Asia-Pacific: India, South Korea and Oceania(3) Other Areas: The Middle East/Africa, Brazil, Mexico and Canada
(Millions of yen, millions of U.S. dollars)
2016 2017 Change 2017Fiscal year ended March 31
2016 2017 Change 2017Three months ended March 31

F-13
Condensed Financial Services Financial Statements
Condensed Balance Sheets
Financial Services
Current assets:Cash and cash equivalents \ 233,701 \ 268,382 $ 2,396 Marketable securities 943,195 1,051,441 9,388 Other 151,248 179,823 1,606
1,328,144 1,499,646 13,390
Investments and advances 9,004,981 9,904,576 88,434 Property, plant and equipment 18,047 21,323 190 Other assets:
Deferred insurance acquisition costs 511,834 568,837 5,079 Other 52,523 69,493 620
564,357 638,330 5,699 Total assets \ 10,915,529 \ 12,063,875 $ 107,713
Current liabilities:Short-term borrowings \ 93,398 \ 411,643 $ 3,675 Deposits from customers in the banking business 1,912,673 2,071,091 18,492 Other 203,161 218,851 1,954
2,209,232 2,701,585 24,121
Long-term debt 34,567 75,511 674 Future insurance policy benefits and other 4,509,215 4,834,492 43,165 Policyholders’ account in the life insurance business 2,401,320 2,631,073 23,492 Other 374,359 370,157 3,305
Total liabilities 9,528,693 10,612,818 94,757
Equity:Stockholders’ equity of Financial Services 1,385,515 1,449,605 12,943 Noncontrolling interests 1,321 1,452 13
Total equity 1,386,836 1,451,057 12,956 Total liabilities and equity \ 10,915,529 \ 12,063,875 $ 107,713
The results of the Financial Services segment are included in Sony’s consolidated financial statements. The following schedulesshow unaudited condensed financial statements for the Financial Services segment and all other segments excluding FinancialServices. These presentations are not in accordance with accounting principles generally accepted in the United States of America(“U.S. GAAP”), which is used by Sony to prepare its consolidated financial statements. However, because the Financial Servicessegment is different in nature from Sony’s other segments, Sony believes that a comparative presentation may be useful inunderstanding and analyzing Sony’s consolidated financial statements. Transactions between the Financial Services segment andSony without the Financial Services segment, including noncontrolling interests, are included in those respective presentations, theneliminated in the consolidated figures shown below.
(Millions of yen, millions of U.S. dollars)
ASSETS
LIABILITIES AND EQUITY
2016 2017 2017March 31 March 31

F-14
Current assets:Cash and cash equivalents \ 749,911 \ 691,760 $ 6,177 Marketable securities 3,202 — — Notes and accounts receivable, trade 847,788 947,602 8,461 Other 1,272,710 1,222,382 10,913
2,873,611 2,861,744 25,551 Film costs 301,228 336,928 3,008 Investments and advances 309,184 285,965 2,553 Investments in Financial Services, at cost 111,476 133,514 1,192 Property, plant and equipment 801,485 735,590 6,569 Other assets 1,559,646 1,463,324 13,065
Total assets \ 5,956,630 \ 5,817,065 $ 51,938
Current liabilities:Short-term borrowings \ 243,543 \ 106,437 $ 950 Notes and accounts payable, trade 550,964 539,900 4,821 Other 1,832,039 1,879,483 16,781
2,626,546 2,525,820 22,552 Long-term debt 525,507 609,692 5,444 Accrued pension and severance costs 433,302 365,427 3,263 Other 462,319 433,761 3,872
Total liabilities 4,047,674 3,934,700 35,131 Redeemable noncontrolling interest 7,478 12,058 108 Equity:Stockholders’ equity of Sony without Financial Services 1,796,891 1,770,632 15,809 Noncontrolling interests 104,587 99,675 890
Total equity 1,901,478 1,870,307 16,699 Total liabilities and equity \ 5,956,630 \ 5,817,065 $ 51,938
Current assets:Cash and cash equivalents \ 983,612 \ 960,142 $ 8,573 Marketable securities 946,397 1,051,441 9,388 Notes and accounts receivable, trade 853,592 953,811 8,516 Other 1,413,126 1,390,328 12,413
4,196,727 4,355,722 38,890 Film costs 301,228 336,928 3,008 Investments and advances 9,234,083 10,111,793 90,284 Property, plant and equipment 820,818 758,199 6,770 Other assets:
Deferred insurance acquisition costs 511,834 568,837 5,079 Other 1,608,700 1,529,077 13,653
2,120,534 2,097,914 18,732 Total assets \ 16,673,390 \ 17,660,556 $ 157,684
Current liabilities:Short-term borrowings \ 336,940 \ 518,079 $ 4,626 Notes and accounts payable, trade 550,964 539,900 4,821 Deposits from customers in the banking business 1,912,673 2,071,091 18,492 Other 2,030,173 2,092,669 18,684
4,830,750 5,221,739 46,623 Long-term debt 556,605 681,462 6,084 Accrued pension and severance costs 462,384 396,715 3,542 Future insurance policy benefits and other 4,509,215 4,834,492 43,165 Policyholders’ account in the life insurance business 2,401,320 2,631,073 23,492 Other 781,228 747,595 6,675
Total liabilities 13,541,502 14,513,076 129,581 Redeemable noncontrolling interest 7,478 12,058 108 Equity:Sony Corporation’s stockholders’ equity 2,463,340 2,497,246 22,297 Noncontrolling interests 661,070 638,176 5,698
Total equity 3,124,410 3,135,422 27,995 Total liabilities and equity \ 16,673,390 \ 17,660,556 $ 157,684
2017
(Millions of yen, millions of U.S. dollars)
2016 2017 2017March 31
March 31(Millions of yen, millions of U.S. dollars)
March 312016 2017
March 31Sony without Financial Services
ASSETS
LIABILITIES AND EQUITY
ASSETS
LIABILITIES AND EQUITY
Consolidated

F-15
Condensed Statements of Income
Financial services revenue \ 1,073,069 \ 1,087,504 +1.3 % $ 9,710 Financial services expenses 915,881 917,479 +0.2 8,192 Equity in net loss of affiliated companies (645) (3,601) - (32)Operating income 156,543 166,424 +6.3 1,486 Other income (expenses), net - - - -Income before income taxes 156,543 166,424 +6.3 1,486 Income taxes and other 37,741 47,711 +26.4 426 Net income of Financial Services \ 118,802 \ 118,713 -0.1 % $ 1,060
Net sales and operating revenue \ 7,044,415 \ 6,527,499 -7.3 % $ 58,281 Costs and expenses 6,909,651 6,412,385 -7.2 57,253 Equity in net income of affiliated companies 2,883 7,164 +148.5 64 Operating income 137,647 122,278 -11.2 1,092 Other income (expenses), net 20,755 (22,728) - (203)Income before income taxes 158,402 99,550 -37.2 889 Income taxes and other 71,451 84,956 +18.9 759 Net income of Sony without Financial Services \ 86,951 \ 14,594 -83.2 % $ 130
Financial services revenue \ 1,066,319 \ 1,080,284 +1.3 % $ 9,645 Net sales and operating revenue 7,039,393 6,522,966 -7.3 58,241
8,105,712 7,603,250 -6.2 67,886 Costs and expenses 7,813,753 7,318,111 -6.3 65,340 Equity in net income of affiliated companies 2,238 3,563 +59.2 32 Operating income 294,197 288,702 -1.9 2,578 Other income (expenses), net 10,307 (37,083) - (331)Income before income taxes 304,504 251,619 -17.4 2,247 Income taxes and other 156,713 178,330 +13.8 1,593 Net income attributable to Sony Corporation’s stockholders \ 147,791 \ 73,289 -50.4 % $ 654
(Millions of yen, millions of U.S. dollars)Fiscal year ended March 31
2017
(Millions of yen, millions of U.S. dollars)
(Millions of yen, millions of U.S. dollars)Fiscal year ended March 31
Change 2017
Change
Fiscal year ended March 31
Consolidated 2016 2017 Change 2017
Sony without Financial Services 2016 2017
Financial Services 2016 2017
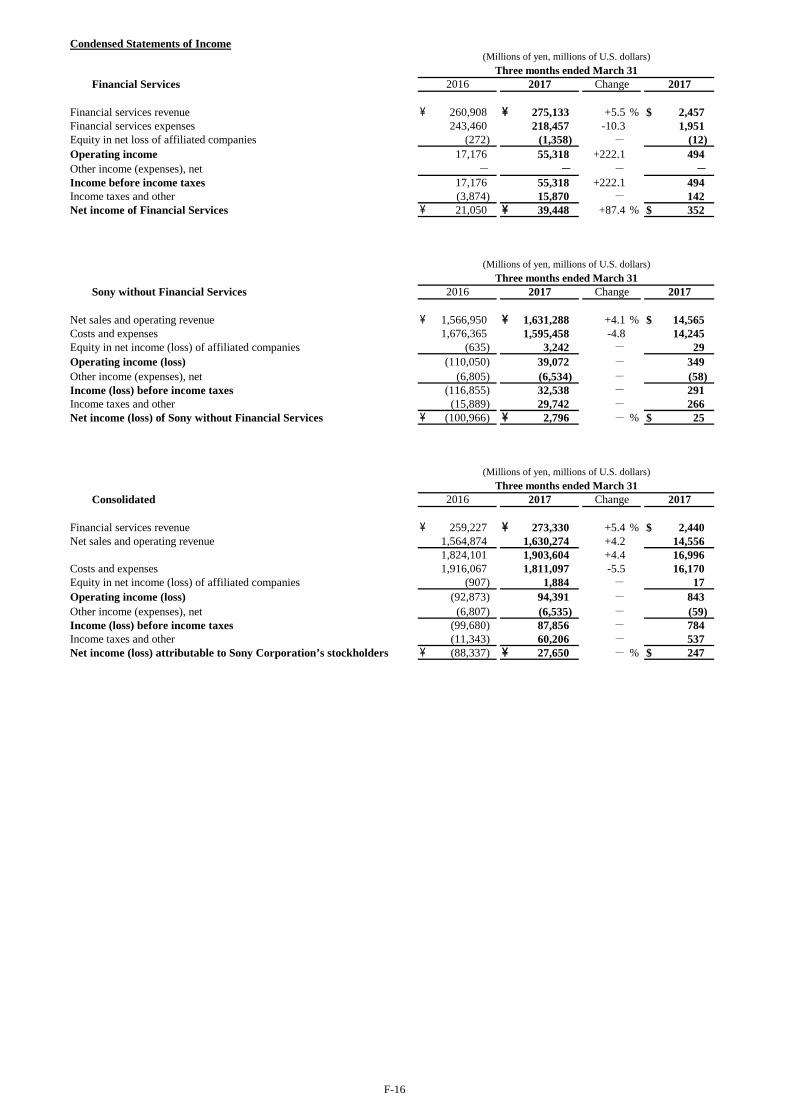
F-16
Condensed Statements of Income
Financial services revenue \ 260,908 \ 275,133 +5.5 % $ 2,457 Financial services expenses 243,460 218,457 -10.3 1,951 Equity in net loss of affiliated companies (272) (1,358) - (12)Operating income 17,176 55,318 +222.1 494 Other income (expenses), net - - - -Income before income taxes 17,176 55,318 +222.1 494 Income taxes and other (3,874) 15,870 - 142 Net income of Financial Services \ 21,050 \ 39,448 +87.4 % $ 352
Net sales and operating revenue \ 1,566,950 \ 1,631,288 +4.1 % $ 14,565 Costs and expenses 1,676,365 1,595,458 -4.8 14,245 Equity in net income (loss) of affiliated companies (635) 3,242 - 29 Operating income (loss) (110,050) 39,072 - 349 Other income (expenses), net (6,805) (6,534) - (58)Income (loss) before income taxes (116,855) 32,538 - 291 Income taxes and other (15,889) 29,742 - 266 Net income (loss) of Sony without Financial Services \ (100,966) \ 2,796 - % $ 25
Financial services revenue \ 259,227 \ 273,330 +5.4 % $ 2,440 Net sales and operating revenue 1,564,874 1,630,274 +4.2 14,556
1,824,101 1,903,604 +4.4 16,996 Costs and expenses 1,916,067 1,811,097 -5.5 16,170 Equity in net income (loss) of affiliated companies (907) 1,884 - 17 Operating income (loss) (92,873) 94,391 - 843 Other income (expenses), net (6,807) (6,535) - (59)Income (loss) before income taxes (99,680) 87,856 - 784 Income taxes and other (11,343) 60,206 - 537 Net income (loss) attributable to Sony Corporation’s stockholders \ (88,337) \ 27,650 - % $ 247
(Millions of yen, millions of U.S. dollars)Three months ended March 31
Consolidated 2016 2017 Change 2017
(Millions of yen, millions of U.S. dollars)Three months ended March 31
Sony without Financial Services 2016 2017 Change 2017
(Millions of yen, millions of U.S. dollars)
Financial Services 2016 2017 Change 2017Three months ended March 31

F-17
Condensed Statements of Cash Flows
Net cash provided by operating activities \ 495,283 \ 376,229 $ 3,359 Net cash used in investing activities (694,031) (953,192) (8,511)Net cash provided by financing activities 224,922 611,644 5,461 Net increase in cash and cash equivalents 26,174 34,681 309 Cash and cash equivalents at beginning of the fiscal year 207,527 233,701 2,087 Cash and cash equivalents at end of the fiscal year \ 233,701 \ 268,382 $ 2,396
Net cash provided by operating activities \ 262,783 \ 445,770 $ 3,981 Net cash used in investing activities (334,900) (299,435) (2,674)Net cash provided by (used in) financing activities 144,751 (173,425) (1,548)Effect of exchange rate changes on cash and cash equivalents (64,609) (31,061) (277)Net increase (decrease) in cash and cash equivalents 8,025 (58,151) (518)Cash and cash equivalents at beginning of the fiscal year 741,886 749,911 6,695 Cash and cash equivalents at end of the fiscal year \ 749,911 \ 691,760 $ 6,177
Net cash provided by operating activities \ 749,089 \ 809,262 $ 7,226 Net cash used in investing activities (1,030,403) (1,253,973) (11,196)Net cash provided by financing activities 380,122 452,302 4,038 Effect of exchange rate changes on cash and cash equivalents (64,609) (31,061) (277)Net increase (decrease) in cash and cash equivalents 34,199 (23,470) (209)Cash and cash equivalents at beginning of the fiscal year 949,413 983,612 8,782 Cash and cash equivalents at end of the fiscal year \ 983,612 \ 960,142 $ 8,573
Financial Services
Fiscal year ended March 31(Millions of yen, millions of U.S. dollars)
2016
Sony without Financial Services
Consolidated
2017
2016 2017 2017
20172016
(Millions of yen, millions of U.S. dollars)Fiscal year ended March 31
(Millions of yen, millions of U.S. dollars)
2017 2017Fiscal year ended March 31

F-18
(Notes) 1. U.S. dollar amounts have been translated from yen, for convenience only, at the rate of ¥112 = U.S. $1, the approximate Tokyo
foreign exchange market rate as of March 31, 2017. 2. As of March 31, 2017, Sony had 1,292 consolidated subsidiaries (including variable interest entities) and 109 affiliated companies
accounted for under the equity method.
3. The weighted-average number of outstanding shares used for the computation of earnings per share of common stock are as follows:
Weighted-average number of outstanding shares (Thousands of shares) Fiscal year ended March 31 Net income attributable to Sony Corporation’s stockholders 2016 2017
— Basic 1,237,802 1,262,023 — Diluted 1,257,883 1,288,343
Weighted-average number of outstanding shares (Thousands of shares) Three months ended March 31 Net income (loss) attributable to Sony Corporation’s stockholders 2016 2017
— Basic 1,261,400 1,262,507 — Diluted 1,261,400 1,288,794
All potential shares were excluded as anti-dilutive for the three months ended March 31, 2016 due to Sony incurring a net loss attributable to Sony Corporation’s stock holders. The dilutive effect in the weighted-average number of outstanding shares for the fiscal year ended March 31, 2016 and the fiscal year and three months ended March 31, 2017 primarily resulted from convertible bonds which were issued in July 2015.
4. Recently adopted accounting pronouncements: Amendments to the consolidation analysis In February 2015, the Financial Accounting Standards Board (“FASB”) issued Accounting Standards Update (“ASU”) 2015-02 that changes how companies evaluate entities for consolidation. The changes primarily relate to (i) the identification of variable interests related to fees paid to decision makers or service providers, (ii) how entities determine whether limited partnerships or similar entities are variable interest entities, (iii) how related parties and de facto agents are considered in the primary beneficiary determination, and (iv) the elimination of the presumption that a general partner controls a limited partnership. This ASU is effective for Sony as of April 1, 2016. The effect of this ASU did not have a material impact on Sony’s results of operations and financial position. Customer’s accounting for fees paid in a cloud computing arrangement In April 2015, the FASB issued ASU 2015-05 for fees paid in a cloud computing arrangement. The ASU requires entities to account for a cloud computing arrangement that includes a software license element in a manner consistent with the acquisition of other software licenses. A cloud computing arrangement without a software license element is to be accounted for as a service contract. This ASU does not affect the accounting for service contracts by a customer. This ASU is effective for Sony as of April 1, 2016. The effect of this ASU did not have a material impact on Sony’s results of operations and financial position. Balance sheet classification of deferred taxes In November 2015, the FASB issued ASU 2015-17 amending the presentation of deferred income taxes and requiring that all deferred tax liabilities and assets be classified as noncurrent on the consolidated balance sheet. This ASU is effective for Sony as of March 31, 2017 and is adopted prospectively. The effect of this ASU did not have a material impact on Sony’s results of operations and financial position.

F-19
5. Sony realigned its business segments from the first quarter of the fiscal year ended March 31, 2017 to reflect a change in the Corporate Executive Officers in charge of certain segments and modifications to the organizational structure of certain segments as of April 1, 2016. As a result of this realignment, Sony has separated the Devices segment into the Semiconductors segment and the Components segment. In addition, the operations of the automotive camera business, which were included in the IP&S segment, and the operations of the Imaging Device Development Division, which were included in Corporate and elimination, are now included in the Semiconductors segment. Additionally, certain operations which were included in All Other and Corporate and elimination are now included in the Music segment and All Other, respectively. For further details of current segments and categories, see page F-8 and F-9. In connection with these realignments, the sales and operating revenue and operating income (loss) of each segment for the comparable period have been reclassified to conform to the current presentation.
6. Certain reclassifications of the financial statements and accompanying footnotes for the fiscal year and three months ended March
31, 2016 have been made to conform to the presentation for the fiscal year and three months ended March 31, 2017, respectively. Other Consolidated Financial Data
(Millions of yen, millions of U.S. dollars) Fiscal year ended March 31 2016 2017 2017
Additions to Long-lived Assets* ¥ 468,937 ¥ 272,203 $ 2,430 (Property, plant and equipment) (374,361) (183,957) (1,642) (Intangible assets) (94,576) (88,246) (788) Depreciation and amortization expenses** 397,091 327,048 2,920 (Property, plant and equipment) (179,272) (169,284) (1,511) (Intangible assets) (217,819) (157,764) (1,409) Research and development expenses 468,183 447,456 3,995
(Millions of yen, millions of U.S. dollars) Three months ended March 31 2016 2017 2017
Additions to Long-lived Assets* ¥ 139,557 ¥ 84,015 $ 750 (Property, plant and equipment) (108,778) (52,987) (473) (Intangible assets) (30,779) (31,028) (277) Depreciation and amortization expenses** 121,961 67,494 603 (Property, plant and equipment) (47,273) (44,437) (397) (Intangible assets) (74,688) (23,057) (206) Research and development expenses 128,133 122,332 1,092
* Excluding additions for tangible and intangible assets from business combinations. ** Including amortization expenses for deferred insurance acquisition costs.
Subsequent events On April 1, 2017, Sony transferred all of the equity interest in Sony Electronics Huanan Co., Ltd. (“SEH”), a wholly-owned subsidiary in the Semiconductors segment that manufactures camera modules, to Shen Zhen O-Film Tech Co., Ltd. The consideration for the transfer is approximately 234 million U.S. dollars, including the assumption of SEH’s debt and the sales price of approximately 95 million U.S. dollars, all of which is subject to customary post-closing adjustments. As the result of the transfer, Sony expects to recognize a gain on transfer totaling approximately 27,000 million yen in other operating (income) expense, net in the consolidated statement of income for the first quarter of the fiscal year ending March 31, 2018.