Embed Size (px)
Citation preview

2000/III
168
News from Rohde & Schwarz
GSM interference analysis system
Radio communication tester for TDMA and AMPS
Digital VXI-based HF receiver for radio reconnaissance systems

Interference impairs the communication in GSM networks. There are many causes of interference, as for example high network
loading, poor or incorrect antenna installa-tion, inadequate RF power setting. ROGER,
the new GSM interference analyzer from Rohde & Schwarz, detects and identifies inter-ference and helps providers to optimize their
networks (page 4).
Dr Jürgen E. Schlienz; Otmar A. Warnierke
Dr Matthias Wuschek
Ralf Plaumann
Rudolf Schindlmeier
Christian Zühlcke
Thomas Bichlmaier
Andreas Henkel
Theodor Fokken
Thomas Braunstorfinger; Andreas Pauly
GSM Interference Analyzer ROGER (TS9958)Full-coverage, mobile and automatic measurement of GSM interference ...... 4
Test cells for investigating emission and susceptibility Attractively priced alternatives to the anechoic chamber..............................7
Universal Radio Communication Tester CMU200Successful mobile-radio tester now with US TDMA and AMPS standards .... 10
Universal Radio Communication Tester CMU200Speeded-up test of GSM mobiles without signalling................................. 16
Digital Video Quality Analyzer DVQDVQ remotely controlled: central monitoring of digital picture quality........ 18
Digital Video Quality Analyzer DVQThe key to high picture quality .............................................................. 20
Spectrum Analyzers R3267 and R3273 from AdvantestVersatile complete solution for testing WCDMA/3GPP systems ................. 22
HF Receiver EM010Digital VXI-based HF receiver with broadband IF output........................... 25
I/Q Simulation Software WinIQSIM ™CDMA2000 test signals in unrivalled variety...........................................27
2 News from Rohde & Schwarz Number 168 (2000/III)
Number 168 2000/III Volume 40
Articles
Software

Mea surements on MPEG2 and DVB-T signals (1)..................................... 30
MIP monitoring in single-frequency networks........................................... 35
Spectrum Analyzer FSP – Remote monitoring via Ethernet......................... 36
Spectrum monitoring and management system for Sri LankaElectromagnetic waves do not stop at frontiers........................................ 40
Test hint: Fast and precise measurement of low RF levels ........................ 38
Microwave Signal Generator SMR as tracking generator for EMI Test Receiver ESI ....................................................... 39
Information in print.............................................................................. 43
Press comments................................................................................... 44
Newsgrams........................................................................................ 45
Sigmar Grunwald
Michael Fischbacher
Ottmar Steffke
Jörg Pfitzner; Georg Schuberth
Roland Minihold
Ottmar Gerlach
Universal Radio Communication Tester CMU200 is proving itself as a tester for all GSM versions in many mobile phone
production lines all over the world. It now comes with extra functions for two non-GSM
networks, namely the US standards TDMA (IS-136) and AMPS (page 10). In pursuit
of the trend to improve throughput in mobile phone production, CMU200 now pro-
vides comprehensive options for GSM mea-surements without signalling (page 16).
News from Rohde & Schwarz Number 168 (2000/III) 3
Imprint
Published by ROHDE&SCHWARZ GmbH&Co. KG · Muehldorfstrasse 15 · 81671 Muenchen · Sup-port Center: Tel. (+49) 01805124242 · E-mail: [email protected] · Fax (+4989) 4129-13777 · Editor and layout: Ludwig Drexl, Redaktion – Technik (German) · English translation: Dept. HW-UK7 · Photos: Stefan Huber · Circulation 90000 fi ve times a year · ISSN 0028-9108 · Supply free of charge through your nearest Rohde&Schwarz representative · Printed in Germany by peschke druck, Muenchen · Reproduction of extracts permitted if source is stated and copy sent to Rohde&Schwarz Muenchen.
Panorama
Refresher topic
Regular features
Application notes

When you compare the load carried by the channels of today’s GSM networks with road traffic, GSM is constantly on the brink of the rush hour. New transmission methods such as GPRS and EDGE will soon have completed the pilot phase all over the world and fill remaining channel resources with packet data. Then, at the latest, high network quality will be a decisive factor in order to be competitive, and this means no or only insignificant interference. Plus, the higher the channel load, the less effective is frequency hopping, which is today successfully used against interference.
Interference must be identified locally
Apart from high network loading, major causes of interference are poor or incorrect antenna installa-tion and inadequate setting of RF power. But whatever the cause, inter-ference has to be identified locally. And since mobiles reveal neither their location nor the source of interfer-ence, a suitable measu rement tech-nique is needed. ROGER (TS9958) is a system developed and optimized by Rohde & Schwarz especially for detecting and identifying interference (FIG 1).
How ROGER works
Just a short configuration of ROGER, and the test tour can start. The test run is automatically controlled by up to four mobile phones, doing away with any manual control. High vehicle speeds are no problem for ROGER either. Interference measurement is per-formed in three steps [1]:• detection of interference,• measurement of interfered/
interfering signals,• assignment of these signals to
base stations.
The signals found can be assigned to the emitting base stations already during the test tour or afterwards on a conventional PC.
Photo 43386/1
FIG 1 Interference measurement system ROGER – compact and lightweight for mobile use
GSM Interference Analyzer ROGER (TS9958)
Full-coverage, mobile and automatic measurement of GSM interference
Signal display
There are signal displays for two test modes: for C0 (BCCH) and Cx (TCH) mea surements. From the disturbed com-posite signal, ROGER filters out fre-quency-correction bursts (FCCHs) for the identification of C0 carriers and displays them. The time axis is struc-tured in lines comparable to a TV frame, arranged such that neighbour-ing FCCHs of an M51 frame (51 TDMA frames) come vertically one below the other. Because of the idle burst at the end of each M51 frame, a staircase pattern is obtained for each detected C0 carrier. So the graphi-cal presentation of the C0 channel of the serving cell (SC) reveals a stair-case with the FCCHs of the SC itself
4 News from Rohde & Schwarz Number 168 (2000/III)
Articles

and further patterns in the case of C0 interference. In the analysis window for adjacent channels or TCH chan-nels of the SC, each staircase pattern indicates the presence of C0 interfer-ence (FIG 2).
In Cx measurement, the composite signal is analyzed in greater detail. Syn-chronization as well as dummy-burst and training sequences are filtered and visualized grouped according to timeslots. The measured sequences of different base stations are shown in time grids corresponding to two verti-cal stripes in the Cx display. Differ-ent base stations are represented by stripes at different positions along the x axis. Interference can be identified immediately: from any further stripes displayed next to the two SC stripes (FIG 3).
In mobile mea surements, the selected signals fluctuate due to fading, reflec-tion and other external influences, result-ing in a variety of signal patterns. ROGER therefore processes interfer-ence signals for graphical representa-tion, as the human eye can analyze complex patterns with high reliability.
Fast identification of base stations
To trace interference back to the emit-ting base station, a feature character-istic of each BTS is used: the expected arrival times of specific signals at the measuring instrument. The times are determined from the measurement posi-tion, the expected sending time and the site of the BTS. When a BTS is selected, the expected arrival time is superim-posed on the displayed sequences in the form of a template. If this matches a signal measured, the latter can be assigned to the selected BTS. In the case of Cx mea surements, the number of possible base stations is reduced by a factor of eight to those whose base-station colour code and training-sequence code are identical (FIGs 3 and 4). The selected BTS is additionally
FIG 2 Display of FCCH bursts of composite signal on C0 channel of SC. Two FCCH patterns are clearly discernible, which indicates strong C0 interference. These signals can be assigned to a base station using a time template that represents the expected arrival time of the signal of a base station. The BTS can be identified as the signal source if the measured signal comes within the template
FIG 3 Display of filtered composite signal for analysis of Cx interference, grouped according to timeslots of TDMA frames. Next to two vertical stripes, other signals are visible that indicate Cx interference. These signals can be assigned to base stations analogously to C0 interference
News from Rohde & Schwarz Number 168 (2000/III) 5
Articles

REFERENCES[1] Wanierke, Otmar A.: Mobile interference
mea surements in GSM networks. News from Rohde & Schwarz (1998), No. 160, pp 24–25
[2] Maier, Johann; Spachtholz, Andreas: Cov-erage Measurement Software ROMES3 – Acquisition, analysis and visualization of data in coverage mea surements. News from Rohde & Schwarz (2000) No. 166, pp 29–32
shown on a map, allowing comparison of the propagation conditions of server and interferer [1].
Power measurement
In the interference charts above, the power values are colour-coded, allow-ing a basic evaluation of interference. For purposes of optimization, the mea-surement system provides the dynamic C/I value for each base station after the SC and interference signals have been selected. The measured and aver-aged power values can be visualized and if necessary modified. Modifica-tion enables evaluation of the range of interference obtained with mobile mea surements (FIG 4). The results of power analysis are stored in a file, and a test report of the analyzed interfer-ence signals is generated (FIG 5). The latter may serve as a basis for network modifications.
Hardware
ROGER consists of: • Test Receiver TS55-RX,• up to four test mobiles of different
make,• a GPS receiver,• a process controller equipped
with A/D converter card and signal-processing card.
Test Receiver TS55-RX is accommo-dated in the controller, making ROGER a highly compact, lightweight unit. The system uses Coverage Mea-surement Software ROMES3 from Rohde & Schwarz [2], affording a state-of-the-art operating concept and the repeated use of position data sources and mobile-phone linkups. Using an indoor module, the software even allows interference detection inside buildings [2].
ROGER can optionally be fitted with a position trigger so that it can carry out classic measurement of coverage
in addition to interference. In particu-lar the option of extending the system by up to eight additional mobiles of different standards (GSM900/1800, CDMA, GPRS) allows space- and cost-saving performance of different tasks with a single unit.
Dr Jürgen E. Schlienz;Otmar A. Wanierke
Reader service card 168/01
FIG 4 Power measurement of interferer at place of interference (power domain). The frequency distribution of the individual power values of the serving cell (violet) and an interferer (red) are shown. In the upper frequency chart SC power can be modified, in the lower one that of the interferer. The two charts come with appropriate default settings and are needed for a very detailed analysis of power statistics. Up to four interferers can in this way be analyzed. In the time-domain chart above, the mobile data in the interference pocket are displayed. The test distance to be evaluated can be selected
FIG 5 Test report of detected interference. Values are automatically gener-ated after identification of interference
6 News from Rohde & Schwarz Number 168 (2000/III)
Articles

Test cells for investigating emission and susceptibility
Attractively priced alternatives to the anechoic chamberMeasurements to verify the compliance of electronic equipment with regulations regarding emission of and susceptibility to interference either necessitate a labora-tory of your own or you have to call on the services of an external provider. Both can be very expensive, especially for small and medium-sized companies that have to carry out such measurements quite often. The alternative is a compact system enabling precompliance measurements and preparation for final accept-ance in your own development lab. Rohde & Schwarz offers several test cells covering the frequency range 150 kHz to 40 GHz that can also be equipped in part with climatic chambers (FIG 1).
Measurement in your own or an external lab?
Standard test sets and systems require a lot of technical know-how, exten-sive aids and fittings and normally also shielded anechoic chambers. The investment (some hundred thousand to several million DM) is hardly a paying proposition for small to medium-sized businesses. So in many cases an exter-nal test lab will be asked to assist. But the costs for complete mea surements carried out by an external service pro-vider can easily amount to between 200 DM and 500 DM per hour. So it is well worth considering what you could do in your own lab by purchas-ing just part of the T&M inventory that is necessary. Relatively little investment will enable precompliance tests to be performed in your own lab, so you need not call on the assistance of a fully fitted, external test lab until it is time for compliance testing. That not only means significant cost savings, it also saves a lot of time thanks to less shipping and travelling backwards and forwards.
S-LINE: measurement environment for frequencies up to 1 GHz
Rohde & Schwarz has developed cost-attractive packages for the perform-ance of precompliance emission and susceptibility mea surements in the
FIG 1 M-LINE with temperature chamber for testing EMC characteristics of EUTs in temperature range –25 °C to 50 °C
Photo 43418/10
News from Rohde & Schwarz Number 168 (2000/III) 7
Articles

150 kHz to 1 GHz frequency range [1]. The package for emission measure-ments consists of EMI Test Receiver ESPC, a shielded S-LINE test cell (TEM line) plus a PC with EMI Soft-ware ESPC-K1. Thanks to compact dimensions of only 1.5 m x 1 m x 1 m (S-LINE 1000) or 1 m x 0.8 m x 0.8 m (S-LINE 700), such a test cell will fit into practically any development lab (FIG 2). S-LINE provides a high degree of shielding effectiveness of over 60 dB and maintains uniform field strength in the test volume (max. 50 cm x 50 cm x 50 cm) for susceptibility mea surements. A large door opening at the chamber’s front allows simple access to the EUT, which is easily observed during mea-surement through a shielded window and chamber lighting.
For susceptibility mea surements the test setup consists – apart from S-LINE – of a signal generator with RF ampli-fier, a power meter and a field sensor. Depending on the equipment used, field strength of over 50 V/m can be produced in the 150 kHz to 2 GHz range. Here too, a PC working with EMS-K1 software controls and super-vises the setup and measures and ana-lyzes the results according to the appli-cable standard.
There is a special version of S-LINE avail-able that is suitable for integration in an automatic production line. It comprises an automatically closing bulkhead at the rear that allows automatic feeding of the EUT into the test cell.
M-LINE: mea surements in the range above 1 GHz
Increasing use of the frequency spec-trum above 1 GHz for wireless speech and data communication has led to more stringent requirements for mea surement of both wanted and unwanted emissions of the equipment involved. Such mea surements are pre-scribed by EMC standards and are mandatory in acceptance tests of ter-minal equipment for example. While
FIG 2 S-LINE is a very compact and cost-attrac-tive EMC test cell that can be used for emission and susceptibility mea surements on EUTs of up to 500 mm x 500 mm x 500 mm
Phot
o 43
101/
2
FIG 3 A horn antenna is mounted on the left inside wall of M-LINE; it serves for radiating signals into the cell and for receiving emissions from the EUT
Phot
o Ro
hde&
Schw
arz
8 News from Rohde & Schwarz Number 168 (2000/III)
some EMC standards have included the microwave range for some time (eg MIL-STD-461/462D, ISO11452), others have only recently extended the EMC measurement range from 1 GHz to 2 GHz (eg IEC 61000-4-3). Acceptance tests on equipment for wire-less speech and data communication – eg Bluetooth – require measurement of radiated spurious emission up to 13 GHz.
Rohde & Schwarz has consequently developed a new test cell – based on S-LINE – for applications in the micro-wave range [2]. Unlike S-LINE, which has a symmetrical TEM line, M-LINE uses a built-in antenna for generating the required field at higher frequen-cies.
Design and characteristicsThe external dimensions of M-LINE cor-respond to those of S-LINE 1000. To eliminate reflection, the cell is lined with 21 cm high pyramid absorbers. They exhibit attenuation of 30 dB at a frequency of 1 GHz, which even increases to 50 dB at higher frequen-cies. The test cell consequently pro-duces reflection attenuation of 25 dB to 35 dB in the useful frequency range from 0.8 GHz to 40 GHz inside a quiet volume of 40 cm in diameter. For immunity tests a homogeneous area of 30 cm x 30 cm can be gener-ated in M-LINE with a maximum dis-tance of 70 cm between antenna and EUT. Optionally M-LINE can also be fitted with a semi-automatic position-ing device for the EUT. Depending on application and frequency range, vari-ous types of antennas such as horns, circularly polarized or small logarith-mic-periodic antennas can be fitted (FIG 3).
Mea surements with different antennas show that field strength of typically 100 V/m in the frequency range of 1 GHz to 7.5 GHz can be achieved inside M-LINE with 200 W amplifier power. The same amplifier power even yields a typical figure of 200 V/m between 7.5 GHz and 18 GHz.
The test cell can be fitted with a tem-perature chamber for mea surements under extreme environmental condi-tions, especially required in accept-ance testing (FIG 1). This allows an EUT to be subjected to temperatures between –25°C and +50°C. The tem-perature in the chamber can either be set manually from an integrated control panel or remotely on a serial interface.
Focal M-LINE applications M-LINE was primarily devised for mea-surements at microwave frequencies on small EUTs. It is suitable for precompli-ance emission and susceptibility mea-surements in a range from 0.8 GHz to 40 GHz. Another application is RF testing via the air interface during pro-duction. This kind of measurement is required for a large number of prod-ucts operating at frequencies above 800 MHz, such as RF modules, mobile or satellite phones. The test cell’s lower limit frequency of 800 MHz was chosen with a particular view to mobile phones operating in the GSM900 band.
REFERENCES[1] Göpel, Dr Klaus-Dieter: EMC Test Cell
S-LINE: Compact EMC test cell of high field homogeneity and wide frequency range. News from Rohde & Schwarz (1996), No. 151, pp 7–9
[2] Wuschek, Dr Matthias: Quiet environment for measurements in the GHz range. EMC-ESD, No. 1/2000, pp 14–15
Condensed data of S-LINEFrequency range 150 kHz to 2 GHzInput power 100 W CW max.Input impedance 50 ΩHomogeneous area S-LINE 1000 approx. 50 cm x 50 cm S-LINE 700 approx. 35 cm x 35 cm
Condensed data of M-LINEFrequency range 800 MHz to 40 GHzInput power 200 W CW max.Quiet zone 400 mm in diameter (with reflection attenuation typ. ≥35 dB)
Reader service card 168/02
Summary
Depending on their functionality, these small systems are available at prices clearly below 100000 DM. They soon pay for themselves because of the time saved in precompliance measure-ments and the costs saved on external services.
Dr Matthias Wuschek
News from Rohde & Schwarz Number 168 (2000/III) 9
Articles

Digital TDMA standard
TDMA (time-division multiple access) is a mobile-radio system based on the TIA/EIA-136 standard, a system similar to GSM. TDMA is used in the United States and South Amer-ica in the cellular band (800 MHz) and the PCS band (1900 MHz). CMU200 covers both versions with Software CMU-K27 and CMU-K28. The narrow TDMA channel band-width of 30 kHz was chosen for rea-sons of compatibility with analog AMPS. TDMA is in fact a digital exten-sion of AMPS and for this reason is also referred to as DAMPS (dig-ital AMPS) (for more information on AMPS see page 14).
TDMA triples AMPS capacity while boosting speech quality. Users of TDMA mobile phones profit from the advantages of the digital system mainly in conurbations, whereas across the vast expanses of the Ameri-can continent the excellent coverage provided by AMPS comes into its own.
TDMA fits three calls into the 30 kHz bandwidth, the time being divided into 40 ms frames, each with six time-slots of 6.66 ms. Each call occupies two timeslots, ie the 1st and 4th, 2nd and 5th, or 3rd and 6th slot, mean-ing that each mobile sends a burst every third timeslot.
The modulation mode used is π/4 DQPSK (differential quadrature phase-shift keying). Each burst trans-mits 162 symbols. With every symbol encoding two bits, a total of 324 bits is transmitted.
Universal Radio Communication Tester CMU200
Successful mobile-radio tester now with US TDMA and AMPS standards
Phot
o 43
238/
11
10 News from Rohde & Schwarz Number 168 (2000/III)
Articles
TDMA measurements in detail
Similar to the case with GSM, CMU200 [1] offers clear pop-up menus for all TDMA measurements; its operating concept is identical for all networks. Remote-control programs cre-
ated for one network can for the most part also be used for other networks.
The tester offers statistical evaluation and automatic limit-value checks for most measurements. Averaging is car-ried out by signal processors in the background, so measurement time is not slowed down by the output of pic-tures.
Measurements are possible both in the signalling mode (with a call set up) and non-signalling mode. The latter is suitable for modules that do not allow complete call setup. For these mea-surements CMU200’s transmitter and receiver can be set in the frequency range 10 MHz to 2.7 GHz separately and independently of frequency band and channel spacing.
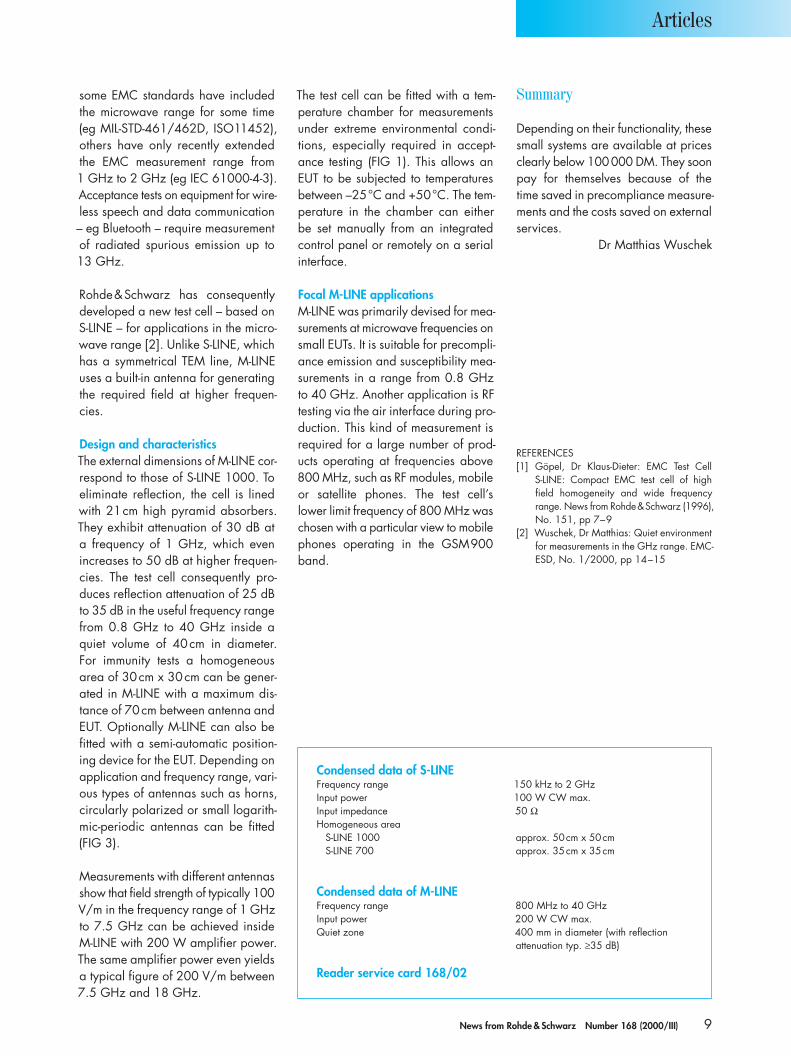
Power versus timeFor TDMA systems it is essential that power be switched on and off exactly at the right times. The standard stipu-lates a 100 kHz filter for power-ver-sus-time measurements. Since this is not a matched filter, power is not con-stant, not even at the symbol times. Power versus time can be displayed
FIG 1 Results of power-versus-time measurement with eightfold oversam-pling shown in tolerance mask. A defective mobile would disturb com-munication in the adjacent timeslot
FIG 2 Simultaneous and clear presentation of all results of modulation analysis with CMU200
with simple or eightfold oversampling. Marked power drops dependent on the modulation mode are visible only with a factor of 8 (FIG 1).
Leakage power is the transmit power of a mobile between bursts. Here a maximum level of –60 dBm is allowed. High transmit power of the mobile calls for a wide dynamic range; for example, 30 dBm transmit power necessitates a dynamic range of 90 dB to check the stipulated switch-off level. This is not possible with a test filter of 100 kHz bandwidth in one and the same mea-surement. So CMU200 automatically performs a two-step measurement with range switching, thus providing the required dynamic range.
For power-versus-time measurements in signalling mode, CMU200 features another application, ie checking of what are called shortened bursts. Short-ened bursts are used for timeslot syn-chronization during handoff and call setup. If this application is selected, the signalling unit of the tester causes the mobile to send shortened bursts and evaluates them in the power-versus-time measurement.
Universal Radio Communication Tester CMU200 (photo left) is proving itself as a tester for all GSM versions in many mobile-phone production lines all over the world. Now it comes with two extra functions for non-GSM net-works – the US TDMA (IS-136) and AMPS standards. Unlike the situation in Europe, there are three competing digital mobile-radio networks in the United States: GSM, CDMA (IS-95) and TDMA (IS-136). Outside the USA, TDMA is becoming increasingly impor-tant in South America, which means a significant enlargement of its market. And there is a fourth system, analog AMPS, which serves as the second mode in CDMA and TDMA mobiles, so that a radio tester for their production and service must be able to handle the standard of the first-generation network too.
News from Rohde & Schwarz Number 168 (2000/III) 11
Articles
Modulation analysisModulation quality is analyzed by measuring the error vector magnitude (EVM). The tester determines the error vector, ie the vector between the ideal and measured signal, at the symbol times and outputs the magnitude versus time. From the resulting data record, further parameters like peak EVM and rms EVM are calculated.
To be able to use the measured data record for determining EVM however, other modulation errors like frequency error, timing error, origin offset and I/Q imbalance have to be determined and corrected in the data record. According to definition, they do not con-tribute to EVM and are to be regarded as separate error sources. CMU200 calculates all these parameters simul-taneously and presents them in clear form (FIG 2).
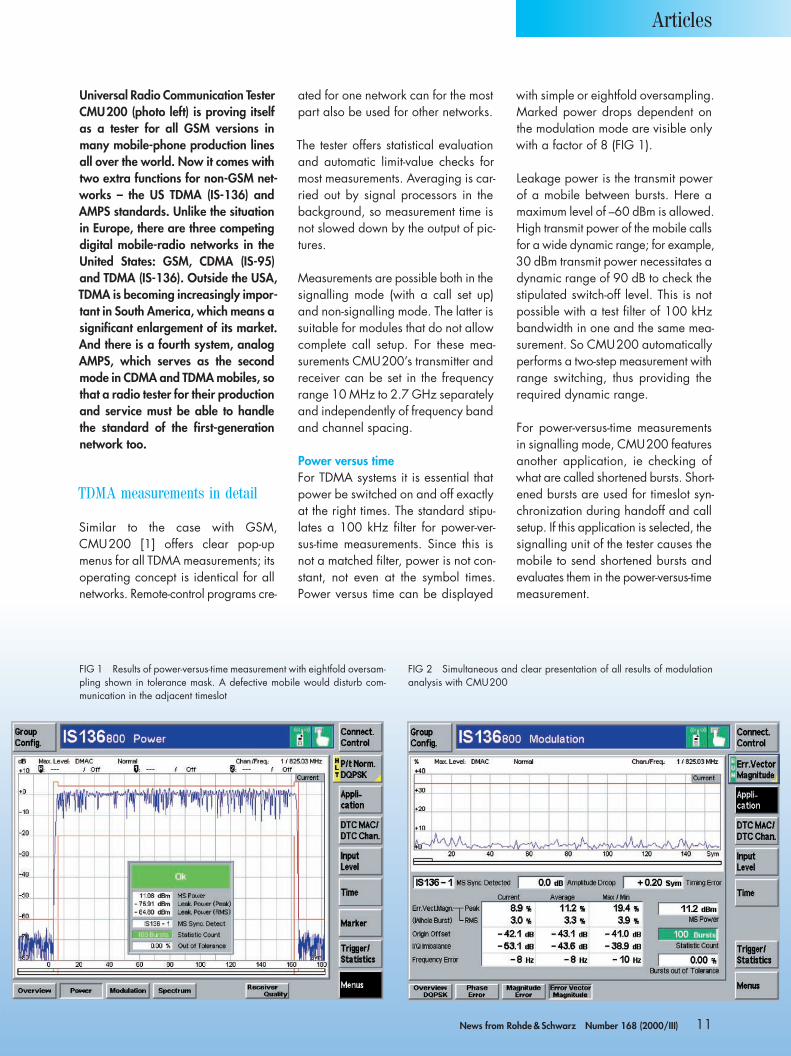
CMU200 offers two more applications in modulation analysis: phase-error and magnitude-error measurement. As with EVM, these major parameters are output in graphical and numerical form. The overview menu for modulation analysis presents all numerical results
at a glance (FIG 3). Measurements are repeated at a fast rate, allowing realtime adjustment of mobile-phone parameters.
Spectral measurementsThe standard calls for measurements in the three nearest adjacent chan-nels above and below the transmis-sion channel. A distinction is made between two types of interference spec-trum. Firstly, there are transients caused by switching power on and off. They occur at the beginning and end of the burst (spectrum due to switching). These spectral components are deter-mined in a peak-value measurement (ACP peak).
The second type of interference spec-trum is caused by modulation (spectrum due to modulation). The spectral com-ponents can be determined by averag-ing adjacent-channel power over a defined range in the middle of the burst (ACP rms). Here too, CMU200 stands out for extremely high measurement speed. It covers all seven channels in a single broadband measurement (FIG 4) and provides a statistical evaluation of results.
For more in-depth analysis, for exam-ple of outliers, each channel can be displayed in the time domain and ana-lyzed by the ACP Time Domain applica-tion. In this way the cause of exces-sive adjacent-channel power can be analyzed, for example high switch-ing transients at one of the two edges (FIG 5).
Receiver measurementsReceiver measurements usually focus on bit error rate (BER); in CMU200 they can be found in the Receiver Qual-ity menu. The TDMA standard specifies a special mode of the mobile phone for BER in which it is able to establish a voice channel independently – ie with-out signalling – and return received data to the tester for evaluation (loop-back). BER measurement for TDMA is therefore included in the non-signal-ling group. An RF generator creates the voice channel with random data, to which the mobile synchronizes in the service mode. The bit errors are then evaluated in the Receiver Quality menu.
During a call, the mobile sends infor-mation to the base station. From this
FIG 3 Summary of all numerical results of modulation analysis in Overview menu
FIG 4 Spectrum due to modulation. In addition to current results, longterm peak value (ACP Peak (Peak)), max. rms value (ACP Peak (RMS)) and average rms value (ACP Avg (RMS)) are output for all channels
12 News from Rohde & Schwarz Number 168 (2000/III)
Articles

information, the base station decides whether its transmit level has to be adjusted or the call handed over to another base station. CMU200 presents all information received from the mobile in the Receiver Quality menu (FIG 6).
The values for BER and RSSI (radio signal strength indicator) refer to the currently active voice channel used by the mobile and the base station. BER is the bit error rate in coarse steps that the mobile recognizes during reception. RSSI is the power of the base station measured on the mobile’s antenna. Apart from information about its own channel, the mobile transmits power values measured on up to 24 adjacent channels. The channels to be logged are signalled to the mobile by the base station. These channels can be selected from a list in the Connection Control/Network menu.
HandoffsCMU200 of course supports all basic signalling functions such as registration, call setup, channel and timeslot hand-off. Since TDMA mobiles usually sup-port the three systems TDM (800 MHz),
TDMA (1900 MHz) and AMPS, hand-offs, ie changes between these sys-tems, play an important role. CMU200 offers handoff from any of the three networks into any other.
Handoffs not only serve for testing the handoff capability of mobiles. In production, they are used for rap-idly changing from one band or net-work to the next, thus saving the time required for renewed registration and call setup.
An interesting feature of CMU200 is the possibility of defining the mobile’s response after breakdown of a call in a new network. There are two pos-sible versions: the old control chan-nel in the old network still exists, or a new control channel is set up in the new system. Here, the mobile’s response and roaming time are of inter-est, ie the time the mobile needs to find a new control channel and, if neces-sary, register anew. The handoff menu provides for complete handoff and handoff with fallback, the latter mean-ing a return to the original network after a call breakdown.
Other callsStandard IS-54 is a step on the way to TDMA. Although it utilizes analog AMPS control channels, the voice chan-nel is digital. It also tripled voice-chan-nel capacity. This mechanism still exists in the system. Plus, if a mobile is regis-tered in one of the three networks, the protocol enables direct call setup to any other network. CMU200 supports these versions too.
AMPS measurements in detail
Here, classic analog measurement engi-neering is used, in which CMU200 is also at home thanks to its flexible, signal-processor-based concept. Mea-surements are organized into FM and audio measurements for transmitters and receivers. AMPS measurements are possible in signalling and non-signalling mode, which corresponds to normal call and service mode. In non-signalling mode, the full CMU200 frequency range from 10 MHz to 2.7 GHz is available with 1 Hz reso-lution. So this mode is also suitable for measurements on modules or for analyzing intermediate frequencies.
FIG 5 Excessive adjacent-channel power caused by high switching tran-sients
FIG 6 Mobile-assisted handoff (MAHO): information sent by mobile to base station is listed in Receiver Quality menu of CMU200 signalling function group
News from Rohde & Schwarz Number 168 (2000/III) 13
Articles

Audio measurements can be per-formed with option CMU-B41, which is entirely based on digital signal process-ing. The filters in the audio path can be set over wide ranges. To ensure maximum ease of operation despite this high versatility, the default settings of filters and signals paths are those of the test specifications.
In signalling mode the Analyzer/Generator and Overview menus pro-vide a fast overview of the main mea-surements and settings (FIG 7).
Transmitter testsIn the TX Tests/Modulation menu, all static transmitter measurements are car-ried out simultaneously (FIG 8). “Static” means measurements performed con-tinuously with constant instrument set-tings.
The transmitter hum & noise measure-ment is carried out in two steps and is therefore separate from static measure-ments. In this application, two audio deviation measurements – with and without predefined modulation of the mobile transmitter – are performed. At the same time a modulated RF carrier
is applied to the receiver. In the second step, the hum caused by crosstalk of the demodulator is measured. The hum & noise result is the ratio of the two measured results in dB.
A special feature is AF level search. This finds the level of the CMU200 AF generator at which the desired target deviation of the mobile modulator is obtained. Since the deviation of the mobile transmitter is precisely defined for all modulation measurements and deviation varies from mobile to mobile, this is a highly efficient means of fulfill-ing the test specification. In this search routine, the user can freely select the start level and accuracy with which the target deviation has to be found. The required AF level is in most cases approximately known, so measurement time can be reduced to a fraction of a second. This is not possible with an IEC/IEEE-bus search routine or with manual control.
Checking the AF frequency response is a very complex transmitter measure-ment. Test specifications stipulate a time-consuming sweep across the audio frequency range. With its TX Audio
FIG 7 Main measurements at a glance: analyzer results and settings are shown on left, generator settings on right
FIG 8 TX Tests/Modulation menu: all current instrument settings are shown on right. Frequency as well as AF generator level and frequency can be set with softkeys on right
Analog AMPS standard
AMPS (advanced mobile phone system) is an analog standard of the first generation based on frequency modulation in the 800 MHz band [2]. Channel bandwidth is 30 kHz, as with TDMA. Signalling information is partly transmitted in the form of simple tones (SAT and ST), and for longer telegrams – especially in the control channel – in the form of PSK-modulated AF signals at 10 kbit/s.
It is still hard to imagine North and South American mobile radio without the “old” analog AMPS; its unpar-alleled advantage is excellent cov-erage. In addition to the modern networks, CMU200 supports AMPS, which still features in all CDMA and TDMA mobiles as a second mode. This combination benefits from the advantages of both techniques, ie the good coverage provided by AMPS and the quality offered by digital networks. Option CMU-K29 adds AMPS functionality to Radio Com-munication Tester CMU200, firming its reputation as a highly versatile multimode tester.
14 News from Rohde & Schwarz Number 168 (2000/III)
Articles

Frequency Response menu, CMU200 offers a much faster alternative: it gen-erates up to 20 simultaneous tones with freely selectable frequency and level. This composite signal is then used to modulate the mobile transmitter. The analyzer measures the levels of the returned and demodulated tones. The audio frequency response is thus checked in one go (FIG 9).
Receiver testsThe RX Tests menu (FIG 10) offers more in-depth receiver measurements. The AF signal demodulated by the mobile is evaluated. The AF analyzer measures the rms value, SINAD and distortion at the same time. For maximum measure-ment speed in production, CMU200 has a special SINAD remote-control command with selectable length of the test interval.
The receiver hum & noise application is a two-step measurement. In this case, the hum on the demodulated AF signal is measured, caused for example by crosstalk of the mobile transmitter on the demodulator.
Another application is receiver sensi-tivity. This parameter is defined as the input signal level at which the SINAD of the demodulated signal is still 12 dB. CMU200 performs this complex search automatically and at high speed.
Just as for transmitters, a time-con-suming sweep is stipulated for check-ing receiver AF frequency response. CMU200 again offers multitone analy-sis, the RX Audio Frequency Response measurement, as an alternative.
State-of-the-art measurement capability
In the advanced features of CMU200, Rohde & Schwarz puts “old” mobile-radio measurement techniques on a new footing, satisfying the high stan-dards of mobile-radio production in the AMPS sector too.
Ralf Plaumann
FIG 9 Measurement of audio frequency response. Preset tolerance limits (red) mark expected preemphasis frequency response of transmitter. They are freely configurable
REFERENCES[1] Mittermaier, Werner; Schmitz, Walter:
Universal Radio Communication Tester CMU200 – On the fast lane into the mobile radio future. News from Rohde & Schwarz (1999) No. 165, pp 4–7
[2] Rösner, Thomas: Digital Radiocommunica-tion Tester CMD80 – CDMA, AMPS and IS-136 measurements with one unit. News from Rohde & Schwarz (1999) No. 165, pp 10–12
Reader service card 168/03
FIG 10 AMPS RX Tests menu for more in-depth receiver mea surements. Current generator settings are listed on right
News from Rohde & Schwarz Number 168 (2000/III) 15
Articles

Universal Radio Communication Tester CMU200
Speeded-up test of GSM mobiles without signallingSearching for ways to improve throughput in the production of mobile phones seems to be heading for complete avoidance of signalling in the production test. In pursuit of this trend, Universal Radio Communication Tester CMU200 (photo left) provides comprehensive options in two operating modes for GSM mea surements without signalling: unsynchronized measurement in the functional group “GSM non-signalling” and synchronized measurement with disabled signalling in the functional group “GSM signalling”.
Unsynchronized measurement
This operating mode is especially useful for mea surements and adjustments on GSM modules and GSM mobiles. CMU200 performs all transmitter mea-surements that are also possible in signalling mode:• Power• Power versus time• Modulation• Spectrum due to switching• Spectrum due to modulation
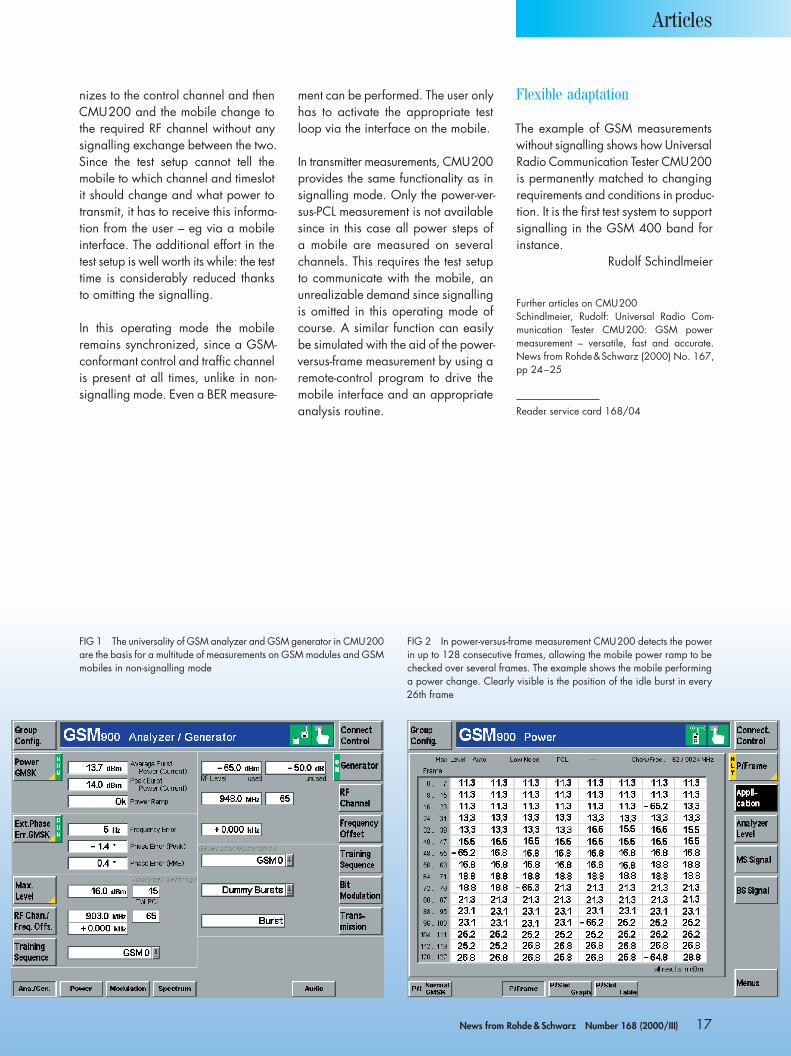
In non-signalling mode (FIG 1) – and in signalling mode too – CMU200 checks tolerances and templates. Any missing signalling information on the transmit level selected by the mobile is provided either by the user or determined from the power measured.
Measurement can be triggered by the RF power of the burst transmitted by the mobile, by an external hardware trig-ger signal, or in a free-running mode. It is also possible to synchronize to the training sequence in the burst.
In both power-versus-slot and power-versus-frame measurement, CMU200 allows easy observation of power as a function of time over several slots or frames. Here the test set determines in realtime the average power in up to 512 consecutive timeslots or in up to 128 consecutive frames (FIG 2). The result is available in tabular form. Since neither GSM-conformant power mea surements nor template checks can be performed in realtime, the test set
evaluates only part of the power ramp and then on this basis calculates the average power. Determination of the training sequence and checking the power-versus-time template are omitted. Such mea surements show whether the mobile ensures correct timing of the idle burst.
The CMU200’s GSM generator is used for receiver mea surements. Besides the usual GSM sequences (0 to 7 and dummy burst), all bits in the training sequence can be set to zero too. For bit modulation the GSM generator pro-vides a large variety of options rang-ing from “unmodulated” through “all bits to 0” and “pseudo-random” to a complete GSM dummy burst. Plus, it is possible to send either just one or all bursts within a GSM frame.
CMU200 will also soon offer a solution on the subject of “edge”: edge mea-surements will be possible in non-signal-ling mode. Of course, when verifying power ramping within an edge burst, CMU200 considers the power/time template modified for edge signals.
Synchronized measurement
The big drawback of unsynchronized measurement is the inability to carry out BER mea surements on GSM mobiles. CMU200 neatly circumvents this prob-lem: all signalling units necessary for setup and cleardown procedures or for a channel change are skipped in signalling mode. The mobile synchro-
Photo 43238/11
16 News from Rohde & Schwarz Number 168 (2000/III)
Articles
nizes to the control channel and then CMU200 and the mobile change to the required RF channel without any signalling exchange between the two. Since the test setup cannot tell the mobile to which channel and timeslot it should change and what power to transmit, it has to receive this informa-tion from the user – eg via a mobile interface. The additional effort in the test setup is well worth its while: the test time is considerably reduced thanks to omitting the signalling.
In this operating mode the mobile remains synchronized, since a GSM-conformant control and traffic channel is present at all times, unlike in non-signalling mode. Even a BER measure-
Further articles on CMU200Schindlmeier, Rudolf: Universal Radio Com-munication Tester CMU200: GSM power measurement – versatile, fast and accurate. News from Rohde & Schwarz (2000) No. 167, pp 24–25
FIG 1 The universality of GSM analyzer and GSM generator in CMU200 are the basis for a multitude of mea surements on GSM modules and GSM mobiles in non-signalling mode
FIG 2 In power-versus-frame measurement CMU200 detects the power in up to 128 consecutive frames, allowing the mobile power ramp to be checked over several frames. The example shows the mobile performing a power change. Clearly visible is the position of the idle burst in every 26th frame
ment can be performed. The user only has to activate the appropriate test loop via the interface on the mobile.
In transmitter mea surements, CMU200 provides the same functionality as in signalling mode. Only the power-ver-sus-PCL measurement is not available since in this case all power steps of a mobile are measured on several channels. This requires the test setup to communicate with the mobile, an unrealizable demand since signalling is omitted in this operating mode of course. A similar function can easily be simulated with the aid of the power-versus-frame measurement by using a remote-control program to drive the mobile interface and an appropriate analysis routine. Reader service card 168/04
Flexible adaptation
The example of GSM mea surements without signalling shows how Universal Radio Communication Tester CMU200 is permanently matched to changing requirements and conditions in produc-tion. It is the first test system to support signalling in the GSM 400 band for instance.
Rudolf Schindlmeier
News from Rohde & Schwarz Number 168 (2000/III) 17
Articles

Digital Video Quality Analyzer DVQ
DVQ remotely controlled: central monitoring of digital picture qualityThe Quality Explorer ™ option (DVQ-B1) further enhances the excellent realtime analysis capability of DVQ (FIG 1), adding the ease of operation and flexibility of a Windows ™ PC. It allows easy configuration of the analyzer via the Ethernet or RS-232-C interface. The Quality Explorer ™ package includes a program-ming interface for custom Windows applications as well as Elementary Stream Analyzer ™ software and Quality Monitor ™ software. With these two programs, each commercial PC, in conjunction with one or more DVQs, becomes a compact, easy-to-operate monitoring center for digital picture quality.
Quality Monitor™ – a critical viewer
Quality Monitor™ continuously records quality parameters, the data rate of the MPEG2-coded video sequence as well as picture activity information and presents them in a clear-cut graphi-cal display (FIG 2). Plus, it logs every error detected by DVQ in the digital video and audio stream. An export function allows subsequent archiving of
results and more in-depth analysis using other programs like Microsoft Excel ™. Quality Monitor ™ and DVQ commu-nicate either on the serial RS-232-C interface or the more powerful Ethernet interface.
DVQ can be fully configured by Quality Monitor ™. Via the Ethernet interface, virtually any number of DVQs – or digital TV programs – can be monitored and remotely controlled from a single Windows ™ PC. QualityMonitor ™ helps service providers and network operators maintain the required QoS (quality of service*) by means of DVQ without any program-ming effort on their own part.
Looking for the bit in the elementary stream
Elementary Stream Analyzer ™ per-forms fast analysis of MPEG2-coded video streams. Together with DVQ, it records and analyzes video ele-mentary streams via the Ethernet or RS-232-C interface and stores them as files (FIG 3). The elementary stream to be analyzed is already available as a file? No problem – Elementary Stream Analyzer ™ imports elementary stream and transport stream data of virtually any length on its flexible data interface.
Photo 43 400
FIG 1 DVQ determines subjective picture quality in realtime and requires no reference signal
18 News from Rohde & Schwarz Number 168 (2000/III)
Articles

REFERENCES* Wörner, Alexander: Optimizing digital
TV networks – QoS maintained automati-cally. News from Rohde & Schwarz (2000) No. 166, pp 38–39
Further articles– Wörner, Alexander; Ibl, Harald: Picture
quality measurements for digital TV. News from Rohde & Schwarz (1999) No. 161, pp 41–43
– Wörner, Alexander: Digital Video Quality Analyzer DVQ – Getting the picture on pic-ture quality. News from Rohde & Schwarz (1999) No. 163, pp 4–6
Analysis covers all levels of the MPEG2 video compression standard. From the sequences and groups of pictures of the elementary stream through motion vectors and macro blocks to the most inconspicuous flag, Elementary Stream Analyzer ™ investigates the perform-ance of the MPEG2 codec that is used and presents the results in a clear and illustrative way. Any syntax errors and deviations from the MPEG2 standard occurring in the elementary stream are detected and displayed. In addi-tion, picture contents are displayed by means of an integrated MPEG2 decoder.
Indispensable tool
Despite outstanding analytical capabil-ity, Elementary Stream Analyzer ™ is nevertheless simple to operate, making it an ideal choice for testing and assess-ing MPEG2 codecs of any type. Qual-ity Explorer ™ is an indispensable tool where one or more DVQs are operated in a network or the extended analytical skills of the DVQ/Quality Explorer ™ team are wanted. Quality Monitor ™ can be downloaded free of charge (www.rohde-schwarz.com – Products & More – DVQ – Download).
Christian Zühlcke
See next page for more about DVQ.
FIG 2 Quality Monitor™ logs results obtained with DVQ and presents them graphically. Results can be stored and imported by other applications
FIG 3 A highlight of Elementary Stream Analyzer™: illustrative display of MPEG2-coded dataReader service card 168/05
News from Rohde & Schwarz Number 168 (2000/III) 19
Articles

Digital Video Quality Analyzer DVQ
The key to high picture qualitySince its introduction about two years ago, Digital Video Quality Analyzer DVQ has ranked as a pioneer in objective picture quality analysis. The new conditional-access options for pay TV, the SNMP remote interface and the extra reference measurement function make DVQ an ideal, future-proof platform for ensuring quality of service in many areas of digital TV.
Conditional access – options for encrypted signals
Since introduction of the European DVB standard, a wide range of new pay TV services have emerged. Digital pay TV is characterized by the encryp-tion of video and audio data and a big increase in TV services. Condi-tional access (CA) systems provide not only data encryption but also sub-scriber access control. When signing up, subscribers are handed out a set-top box and their personal smart card, en abling them to receive the encrypted programs of their pay TV providers.
DVQ is ready to handle new and future measurement tasks, offering high ver-satility and performance reserves that can be utilized for CA modules and smart card readers for example. Mod-ules for the five most common CA sys-tems (see box) are available at present, and modules for further systems are in preparation.
The new CA options extend the range of application of DVQ – whose key asset is automatic picture quality moni-toring in TV transmission networks – to cover transmission channels with encrypted content. DVQ thus turns into a unique combination of professional set-top box with integrated measure-ment functions for picture quality, detec-tion of video and audio defects and comprehensive error logging system.
It is last but not least thanks to the new CA options for DVQ that Rohde & Schwarz won a large-scale order from Europe’s leading satellite operator SES-ASTRA for video and audio quality monitoring in a digital TV transmission network.
FIG 1 SNMP: DVQ device data presented as MIB tree
Monitoring supported by SNMP
SNMP (simple network management protocol) is a standard protocol for the exchange of information and alarm messages between any measuring or operational devices of a transmission
The latest DVQ version incorporates an SNMP agent. This is part of the remote system of the DVQ firmware*. It controls the exchange of measure-ment and configuration data between DVQ and its external SNMP manager. All the SNMP manager requires to
network and a central management sta-tion. SNMP was used so far mainly in communication networks, for instance LANs, for remote querying of device data and alarm messages. With digital TV being transmitted via a variety of routes (satellite, cable or terrestrial) and the necessity of central network management, SNMP is being used to an increasing extent also for TV measuring and operational devices.
communicate with DVQ is a manage-ment information base (MIB) file, in which all device data accessible to the manager are described in the form of a hierarchical tree structure (FIG 1).
The integrated SNMP agent makes DVQ a state-of-the-art system compo-nent for quality monitoring in modern TV transmission networks.
20 News from Rohde & Schwarz Number 168 (2000/III)
Articles

New reference measurement function
The basic DVQ model monitors the signal input for video and audio defects and calculates picture quality of the incoming video signal as an abso-lute value. The new reference measure-ment function* adds two important functions:• Simultaneous monitoring of two
signal inputs (transport stream and ITU-R BT601)
• Comparative picture quality mea-surement of two video signals
The reference measurement is essen-tially implemented by a correlation algorithm for automatic, picture-related calculation of the differential delay between the two signals in a range of ±5 s. The user need make no extra settings; the automatically calculated differential delay is displayed after detection.
For comparative picture quality mea-surement, the effects of picture contents on the quality algorithm, which is sensi-tive to block artifacts, are eliminated. For applications where a comparison between two signals rather than the absolute value of one signal is at the focus of interest, DVQ with the refer-ence measurement function reliably indicates signal degradation. The com-parative method is employed, for exam-ple, to measure picture quality at the output of an MPEG2 encoder relative to the input signal quality (FIG 2).
A powerful partner
Featuring the new CA options, the new reference measurement function and SNMP remote control, DVQ is a versatile and powerful partner in monitoring and maintaining the quality of service in digital TV transmission networks.
Thomas Bichlmaier
Condensed data of new functionsCA optionsInput TS-ASI (DVBA010), 75 W, max. 50 Mbit/sOutput TS-ASI (DVBA010), 75 W, max. 50 Mbit/sSNMPInterface 10Base-TSupported standards SNMPv1 and SNMPv2cReference measurementInput signal combinations TS-ASI/parallel (input) ↔ ITU-R BT601 (ref.) ITU-R BT601 (input) ↔ TS-ASI/parallel (ref.)Max. delay (input reference) ±5 s
Reader service card 168/06
CA standards implemented in DVQ
Conax (DVQ-B10)Irdeto (DVQ-B11)Mediaguard (DVQ-B12)Nagravision (DVQ-B10)Viaccess (DVQ-B10)Other in preparation
FIG 2 Reference measure-ment, here on MPEG2 encoder
MPEG2encoder
ITU-R BT 601(reference signal)
MPEG2 transport stream(test signal including artifacts)
DVQ with reference measurement function
New remote control interfaces and soft-ware options for DVQ are described on page 18.
* All units – including those already supplied – offer the SNMP protocol and the reference measurement function when firmware version 2.0 or higher is installed.
News from Rohde & Schwarz Number 168 (2000/III) 21
Articles

Spectrum Analyzers R3267 and R3273 from Advantest
Versatile complete solution for testing WCDMA/3GPP systemsIn various European countries UMTS licenses are being auctioned off or awarded, accompanied by slogans like “mobile into the Internet, surf with your mobile, WCDMA, 3GPP“, etc. What it is all about is the next, the third generation of mobile radio. The Japanese corporate group NTT led the way, being worldwide the first to put into operation a WCDMA network in line with the NTT DoCoMo standard. Advantest offers a measurement solution for the WCDMA standard which will in future also be effective in Europe.
Standard adopted and yet still in a state of flux
As early as 1997 Advantest, a coop-erating partner of Rohde & Schwarz for many years, developed and sup-plied NTT with measuring instruments
supporting this standard. Meanwhile the WCDMA standard complying with 3GPP (3rd generation partnership project) has been adopted, this proc-ess not yet being completed however, as there will still be amendments and additions. For this standard, which in future will also be effective in Europe, Advantest offers a measurement solu-tion comprising a spectrum analyzer and a signal source. In view of the ongoing modifications of the standard,
it is essential that the measuring instru-ment can be quickly adapted to the changes. This is easily possible by firmware updates, so the user can be sure that the measuring equipment, once purchased, will stay in tune with future requirements.
Spectrum analyzer and signal source – a versatile duo
The measurement system offered by Advantest comprises Spectrum Ana-lyzer R3273 (100 Hz to 26.5 GHz) with modulation analysis (FIG 1, top) or R3267 (100 Hz to 8 GHz, FIG 2) plus WCDMA/3GPP Signal Source R3562 (FIG 1, bottom). This set allows testing of base stations as well as mobile phones and other future user terminals.
New mobile-radio systems and their components are tested in various phases. The first phase is product devel-opment, calling for excellent RF char-acteristics of the measuring equipment used. With noise level of as low as –154 dBm/Hz, phase noise of only –145 dBc/Hz and resolution band-widths of 1 Hz to 10 MHz, to men-tion just a few parameters, the two spectrum analyzers have the necessary qualifications. What is more, they have I/Q inputs that allow various measure-ments at I/Q level in the baseband too, a feature that is especially interest-ing in the development of modules or components.
FIG 1 Spectrum analyzer plus signal source: user-friendly complete solution for mea surements on WCDMA/3GPP systems
Phot
o 43
440/
2
22 News from Rohde & Schwarz Number 168 (2000/III)
Articles

When it comes to production, the main emphasis is on high speed and IEC/IEEE-bus control of all measure-ments, requirements that are definitely in favour of the Advantest duo. Another field of application is the verification of manufactured components, eg testing a base station in line with the measure-ments stipulated in the standard. The Advantest concept speaks for itself: the analyzers measure all specified param-eters at the push of a button since all necessary settings are internally stored. On the other hand the instruments are flexible enough to allow deviations from standard parameters. Both fea-tures are of advantage in repair sta-tions in production. And, as already stated, all measurements can be auto-mated.
The high measurement speed and oper-ating convenience of Analyzers R3267 and R3273 are the result of a number of automatic functions. Optimum match-ing of the internal attenuators to the signal level is particularly important for instance. The attenuators respond to variations of input signal level by automatic level adjustment, either upon the push of a button prior to each measurement or continuously.
For demodulation of signals a scram-bling code is required, which may be
unknown. In this case the analyzers detect the signals with the aid of a special mode – by searching either for the SCH channel or the primary CPICH channel – and demodulate them. Since 3GPP signals may have different data rates, automatic data-rate detection cre-ates the prerequisites for code-domain power measurement of unknown sig-nals, so the data rates need not be known beforehand. FIG 3 shows an example of all parameters determined for a signal.
Comprehensive channel analysis
The individual code channels are ana-lyzed in the code-domain power dis-play mode, where the channels are shown as different bars (FIG 4). Power,
data rate, code number, EVM (error vector magnitude) and other param-eters can be read for each channel. In addition to the graphical representa-tion, results are available in tabular form.
Sometimes it is necessary to deter-mine the power of an individual code versus time. This is possible for all 3GPP codes simultaneously over one slot. Additionally, a specific code can be analyzed over a period of up to two frames. In conjunction with Signal Source R3562 from Advantest, the power control of user terminals or base stations can be tested by sending trans-mitter power control (TPC) bits. The power can be increased or reduced in each slot, so 30 slots or two frames are analyzed in a measurement of maxi-mum duration. Modulation points and transitions can be analyzed in constel-lation and eye diagrams (FIG 5).
Transmitter measurements
Analyzers R3267 and R3273 are suitable for performing practically all TX measurements on base stations and user terminals with the excep-tion of TX power control measurement. A signal source, for instance R3562 from Advantest, is always required for this type of measurement. The signal source generates the TPC information, allowing the user to check the power control.
FIG 3Measured 3GPP signal parameters
FIG 2Spectrum Analyzer
R3267 with frequency range
100 Hz to 8 GHz
Phot
o 43
232/
1
News from Rohde & Schwarz Number 168 (2000/III) 23
Articles

Receiver measurements
RX measurements also require a signal source. The sensitivity of the DUTs is determined in a bit-error-rate (BER) measurement, performed by a BER counter implemented in the signal source. The signal source supplies 3GPP signals in realtime (realtime coder) and generates radio frames including convolution, interleaving and coding. PN9 as well as PN15 sequences may be used.
At home in all standards
Advantest Spectrum Analyzers R3267 and R3273 are not restricted to WCDMA/3GPP and optionally sup-port all other major mobile radio stan-dards like GSM, EDGE, DECT, Blue-tooth, CDMA2000, IS-95, PDC, PHS, IS-136, AMPS, JTACS, NTACS. If sev-eral standards are implemented, you can change between them at a key-stroke.
Andreas Henkel
Condensed data of R3267 and R3273Frequency range R3267 100 Hz to 8 GHz R3273 100 Hz to 26.5 GHzResolution bandwidths 1 Hz to 10 MHzNoise level –154 dBm/HzPhase noise –145 dBc/Hz at 5 MHz offset, 2 GHzACPR performance at 5 MHz offset –72 dBc at 10 MHz offset –80 dBc TX power measurement uncertainty 0.8 dB
Reader service card 168/07
Mea surements to 3GPP standard in detail
Automated mea surements in frequency and time domain• Channel power• Adjacent-channel power ratio (ACPR)• Occupied bandwidth (OBW)• Spurious (inband, outband)• Peak/crest factor, complementary cumulative distribution function (CCDF)
Modulation mea surements• Code-domain power measurement with automatic code and data rate
detection• Code domain versus time, maximum of two frames• Carrier frequency error• ρ (waveform quality)• Time alignment error τ• Level and phase error (normal and peak)• EVM (normal and peak)• I/Q origin offset• Constellation and eye diagrams• Primary CPICH power
FIG 4 Code domain power: power of individual code channels FIG 5 Example of constellation diagram
24 News from Rohde & Schwarz Number 168 (2000/III)
Articles

HF Receiver EM010
Digital VXI-based HF receiver with broadband IF outputFor a number of years Rohde & Schwarz has been producing digital receivers for search and monitoring applications. HF Receiver EM010 is the first receiver based on the VXI standard for use as a plug-in in medium-sized to large radio reconnaissance systems with multiple receiving channels.
Digital receivers with a future
Digital search and monitoring receiv-ers have a long tradition at Rohde & Schwarz. Models EK895/ EK896 have a proven record as radio-communications and monitoring receiv-ers in professional applications. Thanks to digital signal processing, the receiv-ers are open-ended for new modula-tion modes and transmission methods. The A/D conversion meets the most stringent requirements, while the linear-ity and dynamic range of the detected signals are retained in full.
Digital HF Receiver EM 010 based on the VXI standard is a brand-new development, a unique combination of linearity, dynamic range and high functionality within compact dimen-sions:• SOI typ. 95 dBm• TOI typ. 40 dBm• Phase noise better than
–110 dBc/Hz (1 kHz offset)• Sensitivity better than –113 dBm
for SSB (2.75 kHz bandwidth) and 10 dB SINAD
EM010 is designed as a plug-in for use in extensive radio reconnaissance systems where multiple channels are monitored simultaneously (FIG).
The VXI standard (VME bus exten-sion for instrumentation; VME: versa
modular Eurocard IEEE 1014) allows extremely flexible combination of digital receivers with further signal processing components, eg DSP Board GX400DP from Rohde & Schwarz.
Narrowband or broadband?
Radio reconnaissance is increasingly confronted with extremely complex signal scenarios that make great demands on the flexibility of receiving systems. Given the enormous variety of signals encountered, the following ques-tion is more relevant than ever: How can I detect emissions accurately and maintain high signal quality without sacrifices in subsequent demodulation and analysis? In other words, receiver filters should be as narrowband as possible and as broadband as neces-sary.
For instance, weak signals travelling in a disturbed environment or near strong fields must be detected and processed in narrow bands. HF Receiver EM010 is ideal for such critical applications.
The receiver’s digital IF filters afford virtually unlimited adaptability to com-plex signal scenarios. Functions like gain control, noise blanking or squelch are more precise and reproducible than ever before thanks to fully digital signal processing.
These characteristics make EM010 the ideal narrowband receiver for radio scenarios in the shortwave range.
The requirements for the detection of FH (frequency hopping) and DSSS (direct
Phot
o 43
430/
2
Fast digital plug-in HF Receiver EM010 for flex-ible integration in complex radio reconnaissance systems
News from Rohde & Schwarz Number 168 (2000/III) 25
Articles

signal spread spectrum) are completely different, calling for broadband receiv-ers.
Thanks to its versatile digital technology, EM010 is best suited for this purpose too. It comes with a 4 MHz broadband output in addition to an AF output and a narrowband IF output. Used together with another VXI module, a broadband add-on board with A/D converter and an adequate number of digital down-converters (DDCs), EM010 becomes a powerful broadband, digital multichan-nel receiver. In this case the DDCs serve as digital handoff receivers.
Numerous applications
Fitted with the broadband add-on board, EM010 covers a variety of additional applications:• Intermediate storage of broad-
band signals• Signal-adapted detection• Visualization of broadband spec-
trum versus time• Monitoring of broadband fre-
quency occupancy• Implementation of filters for time,
level, frequency and direction (in combination with direction finders)
• Statistics for level/frequency or dwell time/frequency and other user-defined applications
HF Receiver EM010 with its digital versatility opens up the way to process-ing new and complex signal transmis-sion methods in future communications intelligence.
Theodor Fokken
Operating modes• Fixed frequency• Memory scan• Frequency scan• Replay (IF/AF)• Test
Data output• Baseband signal (I and Q) in dig-
ital form, maximum bandwidth 20 kHz
• IF analog (455 kHz)• IF analog (38 kHz to 58 kHz or
40.048 MHz ±2 MHz)• DAT recorder connector AES/
EBU• AF digital• AF analog (line 600 Ω and head-
phones)
Demodulation in fixed frequency mode• AM• FM• SSB• CW
IF bandwidth is selectable in 70 steps from 52 Hz to 20 kHz.
BFO can be set in 1 Hz steps in the frequency range from ±10 kHz.
Squelch selection between language and level. The latter can be set within the limits from –20 dBµV to 100 dBµV in 1 dB steps.
Preamplifier can be switched on and off.
Gain control either automatic (AGC) or manual (MGC).
Two notch filters can be selected inde-pendently of each other.
Memory scan allows setup of all relevant parameters per channel: • Memory location• Frequency• Demodulation mode• Bandwidth• BFO frequency• Preamplifier• AGC/MGC settings• Squelch parameters
In replay mode recorded IF data can be fed back via data interfaces, eg to process them with a different band-width or demodulation mode.
The test mode carries out an extensive selftest of the receiver. This is possible either full-length or abbreviated, but the abbreviated version only signals go or nogo.
Condensed data EM010Frequency range 1.5 MHz to 30 MHz (10 kHz to 1.5 MHz with limited specs)Tuning time <10 ms (bandwidth 20 kHz)SOI typ. 95 dBmTOI typ. 40 dBmNoise figure typ. 9 dB (with preamplifier)Digital IF filters 70 bandwidths from 52 Hz to 20 kHz
Reader service card 168/08
The receiver’s most important features
26 News from Rohde & Schwarz Number 168 (2000/III)
Articles

I/Q Simulation Software WinIQSIM ™
CDMA2000 test signals in unrivalled variety
The way from IS-95 to CDMA2000
Some 60 million subscribers, mainly in North America and Asia, currently com-municate by the IS-95 standard, also known as cdma One, which is clearly number two following GSM with about 300 million subscribers. IS-95A (also known as J-STD-008), the original ver-sion of IS-95, comprises only a small number of channel types, maximally one physical channel (9.6 kbit/s or 14.4 kbit/s) being set up between base station (BS) and mobile station (MS). The modulation in each chan-nel prior to spreading is BPSK on the forward link and 64ary orthogonal on the reverse link at a chip rate of 1.2288 Mchip/s.
Through channel bundling (max. eight channels) in IS-95B, the data rate can be increased to 64 kbit/s. IS-95C retains the 1.2288 Mchip/s rate but uses a modern spreading technique, ie variable spreading factors and dis-tribution of bits to I and Q path (QPSK). IS-95C is also called Phase 1 of CDMA2000.
WinIQSIM ™ and CDMA2000
CDMA2000 is the TIA/Qualcomm candidate for a worldwide WCDMA system. In addition to Phase 1 IS-95C, higher chip rates are defined in Phase 2 and techniques such as trans-mit diversity, turbo codes and extended
spreading codes are introduced. In the meantime the TIA interim stand-ard IS-2000 (1X and 3X), the basis for the CDMA2000 system used in WinIQSIM ™, has been derived from this proposal.
All modes defined in the IS-2000 stan-dard are of course implemented in WinIQSIM ™. First of all the signal chip rate is selected: 1X (1.2288 Mchip/s like IS-95) or 3X (3.6864 Mchip/s). 3X allows two kinds of signal sim-ulation, either in the direct spread mode (single carrier with a chip rate of 3.6864 Mchip/s) or in the multi-carrier mode (three adjacent single carriers each with a chip rate of 1.2288 Mchip/s every 1.25 MHz). The IS-2000 standard also includes various radio configurations (RC1 to
RC9), each defining a group of infor-mation data rates. WinIQSIM ™ takes all defined radio configurations into account.
All channel types defined in the stan-dard are available for total system simulation. Besides the traffic channels, up to 19 special or signalling channels such as pilot, sync and paging can be generated, depending on link direction and radio configuration. Every traffic channel on the forward link consists of a dedicated control channel, a fun-damental channel and, depending on the radio configuration, up to seven supplemental channels.
For realistic simulation of signal sce-narios, WinIQSIM ™ configures the sum signal of up to four BS or MS on
FIG 1 Example of amplifier test: operating panels and test scenario in CDMA2000 system of
WinIQSIM ™
I/Q Simulation Software WinIQSIM™ [1] generates test signals not only for ready established WCDMA (3GPP-FDD), IS-95 und multicarrier systems but now also for the forward link and reverse link of CDMA2000 – and in unmatched variety.
News from Rohde & Schwarz Number 168 (2000/III) 27
Software

the reverse link. Parameters such as channel power, data source, frame length, data rate and Walsh code can be set for each channel.
Amplifier and component tests
Depending on the application, users are interested either in data content and system data structures or physi-cal signal characteristics such as spec-trum, crest factor and signal statistics. With a view to functionality as well as operation, the CDMA2000 system in WinIQSIM ™ allows for both customer groups.
Designers of amplifiers and compo-nents aim for easy generation of a signal scenario that correctly reflects spectral characteristics and signal sta-tistics – crest factor, complementary cumulative distribution function (CCDF) – rather than exploring mobile radio systems in-depth. Here WinIQSIM ™ provides a range of programmable pre-defined settings with just a few mouse clicks (FIG 1). Besides the radio con-
figuration, the required special chan-nels and the kind and number of traffic channels, a setting can be defined to decide whether to generate signals with high, medium or minimum crest factor.
Signal peaks generate the high crest factors of CDMA2000 signals, by superimposing a large number of code channels in a BS for instance. This does not occur very often, yet places extreme demands on the amplifiers. In an attempt to defuse this problem, almost all BS use clipping, which limits the signal peaks before baseband filter-ing and thus reduces crest factors to easy-to-handle values. Of course this clipping functionality has also been implemented in WinIQSIM ™.
WinIQSIM ™ provides a CCDF display in addition to the usual graphic display of the simulated signals such as the time characteristic of the baseband signal or signal spectrum. Information about signal statistics and crest factor, which has a significant bearing on development, can thus be obtained.
Receiver tests
The development of demodulators, receivers and complete CDMA2000 systems necessitates signals that not only exhibit correct physical character-istics but also correct data contents (FIG 2). This allows synchronization tests, for example, or BER measure-ments of the transmitted data by demod-ulation. So all code channels simulated by WinIQSIM ™ can optionally be fully channel-coded (FIG 3), which is a pre-requisite for a comprehensive system test. Individual steps of channel coding can be tested by operating them in the following modes: • Complete (complete coding)• Without interleaving (interleaver
block switched off)• Interleaver only (only the inter-
leaver is active)• Off (no coding)
The orthogonal transmit diversity defined in IS-2000 is also implemented for antenna 1 or 2. The quasi-orthogo-nal Walsh sets intended for increasing BS capacity can be selected as desired. Especially helpful when configuring BS settings are the warning in case of overlapping code channels in the code domain (domain conflicts) and the code domain display.
SMIQ or AMIQ?
Signal Generator SMIQ [2] and I/Q Modulation Generator AMIQ [3] pro-vide two platforms with different appli-cation focuses for signals calculated with WinIQSIM ™ that are to be down-loaded into the signal generator.
Stand-alone Signal Generator SMIQBoth options SMIQ-B60 (arbitrary waveform generator) and SMIQ-K12 (CDMA2000) expand SMIQ to become a comprehensive solution for testing amplifiers and components. For all operating modes the sequence length is a minimum 80 ms. This guar-antees a cyclic signal, and both the sync channel with 26.66 ms as well
FIG 2 Base station configuration panel with code domain display
28 News from Rohde & Schwarz Number 168 (2000/III)
Software

as all other channels with 5 ms, 10 ms, 20 ms, 40 ms or 80 ms frame length fully fit into this time grid.
I/Q Modulation Generator AMIQIn addition to SMIQ’s modulation capabilities, AMIQ, provided with option AMIQ-K12, offers further pos-sibilities. Its well-known strong points such as digital and differential outputs allow precise tests directly in the base-band. Model AMIQ04 performs long BER measurements because this way sequence lengths up to 3 s can be recorded. If an RF test signal is required, an added SMIQ comes in handy.
REFERENCES[1] Pauly, Andreas; Holzhammer, Jens: I/Q
Simulation Software WinIQSIM ™ – New approaches in calculating complex I/Q signals. News from Rohde & Schwarz (1998) No. 159, pp 13–15
[2] Kernchen, Wolfgang: Signal Generator SMIQ: Fit for 3G with new options. News from Rohde & Schwarz (2000) No. 166, pp 10–12
[3] Küfner, Burkhard; Desquiotz, Rene, Dr: I/Q Modulation Generator AMIQ – New models 03 and 04 as well as digital I/Q output option. News from Rohde & Schwarz (2000) No. 166, pp 22–23
WinIQSIM ™ in future
The development from IS-95 to CDMA2000 is not a straight line, there are a lot of offshoots (eg HDR – high data rates). If their importance increases, they will be included in WinIQSIM ™, just like the WCDMA/3GPP line (FDD and TDD) is continu-ously updated.
Thomas Braunstorfinger; Andreas Pauly
Reader service card 168/09
Direct Spread Mode
VariableLengthWalsh
Spreading
AddReserved
Bits
AddFrameQuality
Indicator
Add 8Reserved/EncoderTail Bits
Convolu-tional
or TurboEncoder
SymbolRepetition
SymbolPuncture
BlockInterleaver
DataSource
Channel Coding
Long CodeScrambling
PowerControl
Puncturing
PN ShortCode
Scrambling
Baseband
Filtering
IQModulator
VariableLengthWalsh
Spreading
PN ShortCode
Scrambling
Baseband
Filtering
IQModulator
DEMUX
VariableLengthWalsh
Spreading
PN ShortCode
Scrambling
Baseband
Filtering
IQModulator
VariableLengthWalsh
Spreading
PN ShortCode
Scrambling
Baseband
Filtering
IQModulator
Multicarrier ModeFIG 3 Components of
CDMA2000 channel on forward link including channel coding
News from Rohde & Schwarz Number 168 (2000/III) 29
Software

With the expansion of multi-frequency networks (MFNs) and single-frequency networks (SFNs) for DVB-T*, there is a growing demand for measuring instru-ments and techniques for this modern transmission method. The instruments used for analog TV are not suitable for DVB apart from a few exceptions like spectrum analyzers and thermal power meters.
Not only do the measuring instruments for the three DVB systems, ie• DVB-C for cable transmission,• DVB-S for satellite transmission
and• DVB-T for terrestrial transmission
differ considerably from the conven-tional technology, but the test param-eters and associated test methods as well. This refresher topic, which is to be continued over several issues, presents measuring instruments and techniques from Rohde & Schwarz spe-cially designed for DVB-T. After a brief description of the signal feed and trans-mitters for DVB-T, which explains the special features of the system, test parameters, methods and instruments are described.
In the studio: from programs to transport streams
In the studio, the video data are coded to ITU-R BT.601 and the audio data to AES/EBU in compliance with the MPEG2 guidelines. Data containers for general data such as teletext are
Measurements on MPEG2 and DVB-T signals (1)
TS data distribution
Generation of MPEG2transport stream endless sequences
MPEG2 Measurement Generator DVGwith optional Stream Combiner™ (-B1)
Video coder
Audio coder
Data
PSI/SI
Video coder
Audio coder
Data
PSI/SI
MUX 1
MUX 1
TS-MUX for n programs and in-service TS from Measurement Generator DVG
Studio
Program 1Program 2Program 3Program 4Program n
DVG with option -B1:
in-service
or
out-of-service
measurement
Synchronization of SFNwith MIP parameters
MIP inserter
GPS1 pps
TS-MUX 1
PES
PES
PES
PES
PES
PES
FIG 1Complete signal chain: from MPEG2 studio through TS data distribution to all DVB-T transmit-ters in network
* Abbreviations in italics: explanation in “Glossary” box on page 33.
30 News from Rohde & Schwarz Number 168 (2000/III)
Refresher topic

Transmitter
Transmitter 1…m
GPS1 pps
Protocol analysis withenhanced functionality
Video quality analysis to MPEG2;decoding with enhanced functionality
Input level,QAM/QPSK parameters in2k/8k COFDM mode,constellation diagram,BER, MER
COFDM modulator forDVB-T andRF converter fortransmitter reference
MPEG2 Measurement Decoder DVMDwith optional Stream Explorer™ (-B1)
Digital Video Quality Analyzer DVQwith optional Quality Explorer™ (-B1)
Test sequence control from PC
Spectrum Analyzer FSEA
COFDM spectrum,shoulder distance
TV Test Receiver EFAVersion DVB-T
TV Test Transmitter SFQwith optional DVB-T coder (-B10)
News from Rohde & Schwarz Number 168 (2000/III) 31
Refresher topic

added, as well as the indispensable tables to PSI and SI specifications. The result is a multiplexed, packetized trans-port stream (TS) that can contain a large number of TV programs. For ter-restrial transmission in single-frequency networks, the sync information for the individual transmitters must still be added. Based on GPS, the MIP inserter introduces all important sync data into the TS, which is then sent to all transmit-ters in the network (FIG 1). There are a number of ways of doing this: • Radio-relay or satellite links with
QPSK modulation• Cable over very short distances
or fiber-optic links with ATM and SDH/PDH protocols
In the transmitter: from trans-port stream to DVB-T symbol
The DVB-T transmitter uses COFDM for data modulation. “C” for “coded” stands for a variety of error control measures such as energy dispersal, Reed-Solomon and Viterbi forward error correction, which are enhanced by the convolutional interleaver and the bit and symbol interleaver. After insertion of the TPS carriers and the pilots for channel correction in the receiver, OFDM proper is carried out. The DVB-T symbol is generated together with the guard interval, which precedes the symbol. Then follows D/A conver-sion and boosting of the signal to the desired output power by means of liquid-cooled solid-state amplifiers. Sev-
eral transistorized amplifiers are con-nected in parallel to give output powers in the kilowatt range.
Key measurements in the studio
What measurements on MPEG2 and DVB signals used for digital TV are necessary and sensible?
The output signals produced in digital studios are, except for a few minor differences, the same for the three DVB systems. In the studio, several trans-port streams are coded – one for each program. This is the critical stage to ensure that the transport streams actu-ally intended for transmission have been combined, as signals may be mis-routed by the digital crossbars ahead of the last TS multiplexer allowing unwanted transport streams to pass. Realtime monitoring of the TS protocol
at the studio output is therefore essen-tial.
Monitoring parameters PAT and PMTApart from the data rates of the pro-grams and their elements, the PAT and the PMT to which reference is made in the PATs, are the main param-eters to be monitored. The PAT is a list of all programs in a TS, whereas PMTs contain the associated program elements. The European Guideline ETR290 [1] defines all parameters which a monitoring system must handle. An ideal instrument for this is MPEG2 Measurement Decoder DVMD from Rohde & Schwarz (FIG 2), which com-plies with all ETR290 requirements. A few monitoring examples, a PMT (FIG 3), three-priority error statistics (FIG 4) and an error report (FIG 5) as proposed by the standard are shown as on-screen displays. The program that is currently being decoded is avail-able at the DVMD’s CCVS output.
In-depth measurements with Stream Explorer ™The repetition rates for PSI and SI tables are to be defined with the set-tings in ETR290 for DVB, or with the time references to ISO/IEC13818 for MPEG2. Incorrect program switching is therefore detected immediately and compliance with the MPEG2 protocol is guaranteed. More in-depth meas-urements are possible with Stream Explorer ™ DVMD-B1, an option which allows the user to look at the tables
FIG 3 Program map table output by MPEG2 Measurement Decoder DVMD
FIG 2 MPEG2 Measurement Decoder DVMD [3] Data sheet PD 757.2744
Photo 43179/3
32 News from Rohde & Schwarz Number 168 (2000/III)
Refresher topic

in plain text and at the data in the TS packets. The table contents can be checked for compliance with the DVB system in question. The NIT in particular contains different entries for the three different DVB systems. The plain-text NIT prevents misinterpretations.
Reference TS in endless loopRepeatable protocol measurements should always be possible – at least for the tests performed when setting up a studio. A TS with a live program does not fulfil this requirement: its contents vary constantly giving different, but not widely varying, results at different times. A reference TS is therefore desirable for such measurements.
MPEG2 Measurement Generator DVG (FIG 6), designed for this purpose, has internationally standardized, MPEG2 test sequences for video, audio, data and tables. These sequences are in the form of endless loops and so can be repeated any number of times.
Exceptional conditions sometimes require exceptional signals: the optional Stream Combiner ™ DVG-B1 generates the right data stream for any kind of measurement, no matter how unusual it may be.
Picture quality monitoring using SSCQENot only the MPEG2 protocol has to be monitored but also picture quality after MPEG2 coding at the studio output.
Glossary
AES/EBU Audio Engineering Society/European Broadcasting UnionATM Asynchronous Transfer ModeBER Bit Error RateCOFDM Coded Orthogonal Frequency Division MultiplexingDVB-T Digital Video Broadcast TerrestrialDVB-C Digital Video Broadcast CableDVB-S Digital Video Broadcast SatelliteGPS Global Positioning SystemMPEG2 Motion Picture Experts GroupMIP Megaframe Initialization PacketMFN Multi-Frequency NetworkMUX MultiplexerNIT Network Information TablePAT Program Association TablePES Packetized Elementary StreamPID Packet IdentifierPMT Program Map TablePSI Program-specific InformationQAM Quadrature Amplitude ModulationQPSK Quadrature Phase Shift KeyingSA Spatial ActivitySDH/PDH Synchronous / Plesiochronous Digital Hierarchy (Protocol)SFN Single-Frequency NetworkSI Service InformationSSCQE Single Stimulus Continuous Quality EvaluationTA Temporal ActivityTPS Transmission Parameter SignallingTS Transport Stream
The viewers at home expect constantly high picture quality despite the high data compression. As the original pic-ture is usually not available at the
studio output for comparison with the decoded MPEG2 picture, a method of measuring picture quality without a reference picture has been devel-
FIG 4 Three-priority error statistics output by MPEG2 Measurement Decoder DVMD
FIG 5 Error report
News from Rohde & Schwarz Number 168 (2000/III) 33
Refresher topic

oped. Digital Video Quality Analyzer DVQ (FIG 7) uses an objective version of the SSCQE method described in ITU-R BT.500 [2] to measure the qual-ity of the MPEG2-coded and decoded video signals. Picture quality can also be monitored via the CCVS output on the on-screen display of the video monitor.
Particularly important additional infor-mation is derived from longterm picture quality monitoring with display of the data rate of the measured program and the TA and SA, which is offered by option DVQ-B1. This option has two components. The Quality Moni-tor ™ triggers an alarm if picture qual-ity drops below a certain limit. If the alarm occurs more frequently or over extended periods of time, the settings of the MPEG2 coder and the multiplex equipment must be checked – espe-cially if statistical multiplex coding is
used. Only in this way can constantly high picture quality be guaranteed. The second component of the option, the elementary stream analyzer, provides access to the pixel and macro-block level and to the I, P and B coding level of single pictures.
MIP monitoringThe MIP inserter is the last point in the TS transmission chain (FIG 1) before program distribution to the transmitters of the SFN. The TS packet with the fixed PID 0x0015 contains GPS time information for synchronizing the com-plete SFN. If this information is incom-plete or errored, transmission in the network may collapse. Monitoring the MIP contents is therefore a priority task and implemented in TS monitoring by MPEG2 Measurement Decoder DVMD (see also article on right).
Three instruments cover all measurements
Complete TS monitoring can be effected with just three measuring instru-ments from Rohde & Schwarz:• MPEG2 Measurement Decoder
DVMD,• Digital Video Quality Analyzer
DVQ,• MPEG2 Measurement Generator
DVG with appropriate options for repeatable measurements.
Sigmar Grunwald
(to be continued)
REFERENCES[1] ETR 290 Digital Video Broadcasting (DVB);
Measurement Guidelines for DVB Sys-tems
[2] ITU-R BT.500 Method for the Subjective Assessment of the Quality of Television Pic-tures
[3] Fischbacher, Michael; Weigold, Harald: MPEG2 Generator DVG and MPEG2 Mea-surement Decoder DVMD – Test equipment for digital TV in line with MPEG2. News from Rohde & Schwarz (1996) No. 152, pp 20–23
[4] Wörner, Alexander: Digital Video Quality Analyzer DVQ – Getting the picture on pic-ture quality. News from Rohde & Schwarz (1999) No. 163, pp 4–6
FIG 6 MPEG2 Measurement Generator DVG [3] Data sheet PD 757.2738
FIG 7 Digital Video Quality Analyzer DVQ [4]Data sheet PD 757.4601
Photo 43166/3
Photo 43318/3
34 News from Rohde & Schwarz Number 168 (2000/III)
Refresher topic

TX networkadapter Distribution network
SFNadapter
MPEG2re-
multiplexer
MPEG2TS analysis
MPEG2 TS analysis
MIPinsertion
GPS
10 MHz 1 pps
RX networkadapter
RX networkadapter
DVB-Tmodulator
Syncsystem
GPS
10 MHz 1 pps
MIPevaluation
DVB-Tmodulator
Syncsystem
GPS
10 MHz 1 pps
MIPevaluation
MPEG2TS analysis
Following its successful implementation in satellite and cable systems, digital transmission of TV signals is now also making its entry into terrestrial networks. Besides efficient data compression and flexible multiplexing in line with MPEG2 standards, single-frequency networks (SFNs) allow the best possible utilization of scarce terrestrial frequencies. Such networks are controlled by MIPs (megaframe initialization packets, see box). Prerequisites for the working of an SFN are correct MIP generation and transmission plus continuous monitoring to avoid malfunctions or network failures.
MIP monitoring: an innovative add-on
Both Rohde & Schwarz instruments MPEG2 Realtime Monitor DVRM [1] and MPEG2 Measurement Decoder DVMD [2] can monitor MIPs in real-time – an innovative extra to the many measurement parameters already sup-ported. Each incoming MIP is subjected to twelve individual tests for transmis-sion time, structure and content as rec-ommended by the DVB Measurement Group.
Every error detected immediately pro-duces an alarm signal that is displayed by LEDs on the front panel of the instruments and signalled on one of twelve selectable alarm lines. Plus, the error is registered in error statistics and included in a measurement report with details of its cause.
Here comes Stream Explorer™ with new functions
Stream Explorer™ [3, 4] for DVMD/DVRM is an innovative computer soft-ware option. The extended control and display functions including a table inter-preter are supplemented by a new operating mode specially for MIP moni-toring. Stream Explorer™ reproduces the complete and interpreted content of the incoming MIP in realtime and thus allows in-depth insight into the opera-tion routines irrespective of compliance with error criteria.
This means that DVRM, DVMD and Stream Explorer™ guarantee opera-tional reliability also in new terrestrial SFNs. The first nationwide SFN in Spain is proof of this reliability, where all high-power transmitters are monitored by a DVMD (see Newsgrams p 44).
Michael Fischbacher
SFN and MIP
In single-frequency networks (FIG), neighbouring transmitters with iden-tical program content use exactly the same channel. This is only fea-sible if all transmitters operate syn-chronized and simultaneously. Here the global positioning system (GPS) serves as a time reference. The trans-port stream to be transmitted is pro-vided with additional information allowing exact assignment of the transmit signal to this time reference in the TV transmitters and thus an appropriate time shift. The extra information is transmitted in mega-frame initialization packets (MIPs). Any error in the structure or con-tent of a MIP could cause failure of the complete transmitter network, making overall MIP monitoring indis-pensable.
MIP monitoring in single-frequency networks
Structure of single-frequency network
REFERENCES[1] Fischbacher, Michael: MPEG2 Realtime
Monitor DVRM – Digital broadcast networks: operation secured. News from Rohde & Schwarz (1999) No. 165, pp 14–15
[2] Fischbacher, Michael; Weigold, Harald: MPEG2 Generator DVG and MPEG2 Mea-surement Decoder DVMD – Test equipment for digital TV in line with MPEG2. News from Rohde & Schwarz (1996) No. 152, pp 20–23
[3] Fischbacher, Michael; Rohde, Werner: PC software for MPEG2 dream team DVG/DVMD. News from Rohde & Schwarz (1997) No. 154, p 29
[4] Finkenzeller, Richard; Fischbacher, Michael: MPEG2 transport stream analysis in net-worked DVB monitoring system using Stream Explorer software. News from Rohde & Schwarz (1998) No. 159, pp 24–25
Reader service card 168/10
News from Rohde & Schwarz Number 168 (2000/III) 35
Application notes
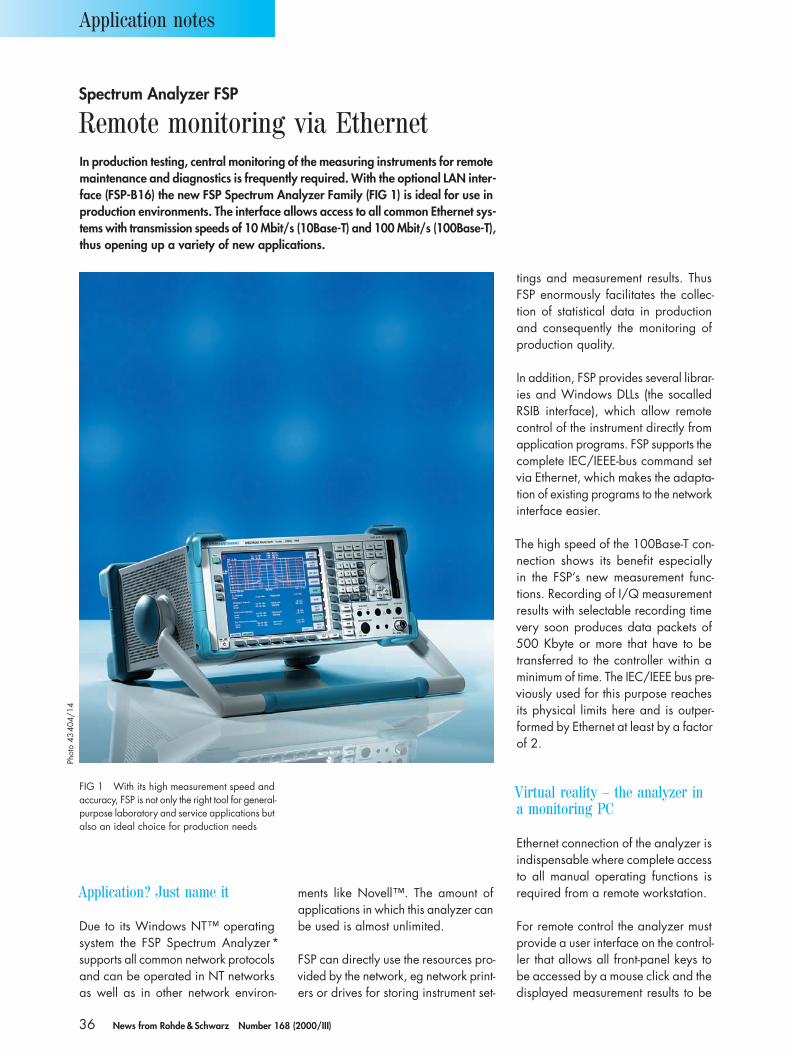
Application? Just name it
Due to its Windows NT ™ operating system the FSP Spectrum Analyzer* supports all common network protocols and can be operated in NT networks as well as in other network environ-
Spectrum Analyzer FSP
Remote monitoring via EthernetIn production testing, central monitoring of the measuring instruments for remote maintenance and diagnostics is frequently required. With the optional LAN inter-face (FSP-B16) the new FSP Spectrum Analyzer Family (FIG 1) is ideal for use in production environments. The interface allows access to all common Ethernet sys-tems with transmission speeds of 10 Mbit/s (10Base-T) and 100 Mbit/s (100Base-T), thus opening up a variety of new applications.
ments like Novell ™. The amount of applications in which this analyzer can be used is almost unlimited.
FSP can directly use the resources pro-vided by the network, eg network print-ers or drives for storing instrument set-
tings and measurement results. Thus FSP enormously facilitates the collec-tion of statistical data in production and consequently the monitoring of production quality.
In addition, FSP provides several librar-ies and Windows DLLs (the socalled RSIB interface), which allow remote control of the instrument directly from application programs. FSP supports the complete IEC/IEEE-bus command set via Ethernet, which makes the adapta-tion of existing programs to the network interface easier.
The high speed of the 100Base-T con-nection shows its benefit especially in the FSP’s new measurement func-tions. Recording of I/Q measurement results with selectable recording time very soon produces data packets of 500 Kbyte or more that have to be transferred to the controller within a minimum of time. The IEC/IEEE bus pre-viously used for this purpose reaches its physical limits here and is outper-formed by Ethernet at least by a factor of 2.
Virtual reality – the analyzer in a monitoring PC
Ethernet connection of the analyzer is indispensable where complete access to all manual operating functions is required from a remote workstation.
For remote control the analyzer must provide a user interface on the control-ler that allows all front-panel keys to be accessed by a mouse click and the displayed measurement results to be
FIG 1 With its high measurement speed and accuracy, FSP is not only the right tool for general-purpose laboratory and service applications but also an ideal choice for production needs
Phot
o 43
404/
14
36 News from Rohde & Schwarz Number 168 (2000/III)
Application notes
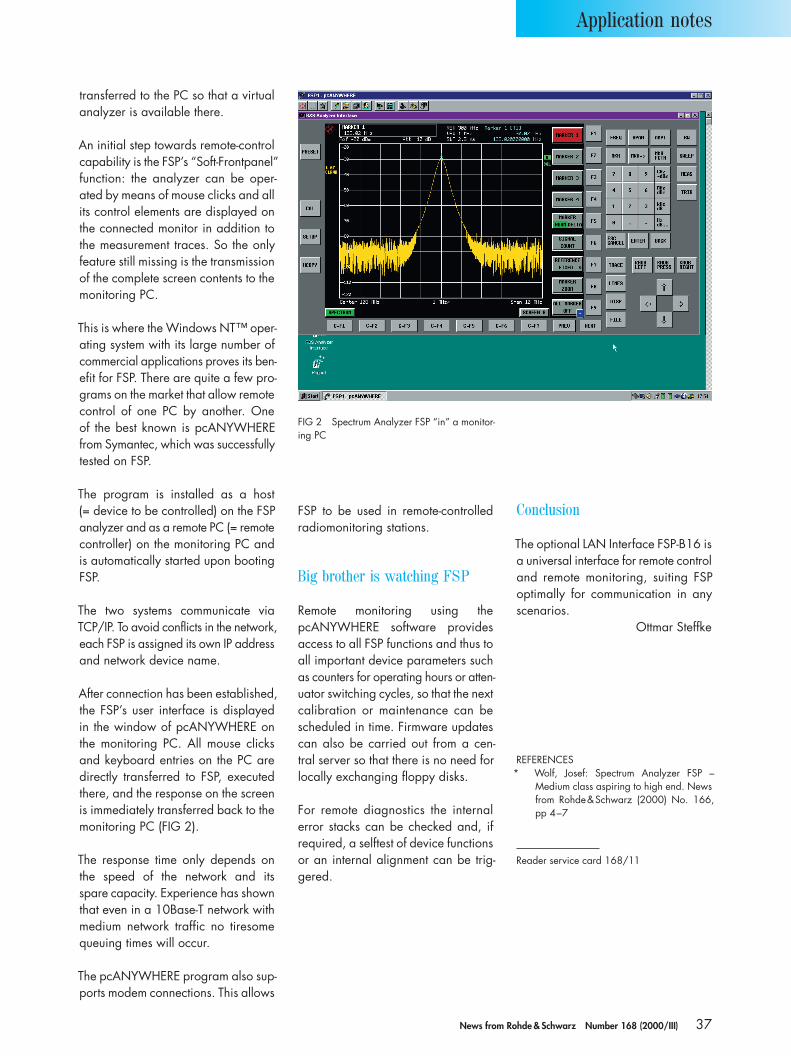
transferred to the PC so that a virtual analyzer is available there.
An initial step towards remote-control capability is the FSP’s “Soft-Frontpanel” function: the analyzer can be oper-ated by means of mouse clicks and all its control elements are displayed on the connected monitor in addition to the measurement traces. So the only feature still missing is the transmission of the complete screen contents to the monitoring PC.
This is where the Windows NT ™ oper-ating system with its large number of commercial applications proves its ben-efit for FSP. There are quite a few pro-grams on the market that allow remote control of one PC by another. One of the best known is pcANYWHERE from Symantec, which was successfully tested on FSP.
The program is installed as a host (= device to be controlled) on the FSP analyzer and as a remote PC (= remote controller) on the monitoring PC and is automatically started upon booting FSP.
The two systems communicate via TCP/IP. To avoid conflicts in the network, each FSP is assigned its own IP address and network device name.
After connection has been established, the FSP’s user interface is displayed in the window of pcANYWHERE on the monitoring PC. All mouse clicks and keyboard entries on the PC are directly transferred to FSP, executed there, and the response on the screen is immediately transferred back to the monitoring PC (FIG 2).
The response time only depends on the speed of the network and its spare capacity. Experience has shown that even in a 10Base-T network with medium network traffic no tiresome queuing times will occur.
The pcANYWHERE program also sup-ports modem connections. This allows
FSP to be used in remote-controlled radiomonitoring stations.
Big brother is watching FSP
Remote monitoring using the pcANYWHERE software provides access to all FSP functions and thus to all important device parameters such as counters for operating hours or atten-uator switching cycles, so that the next calibration or maintenance can be scheduled in time. Firmware updates can also be carried out from a cen-tral server so that there is no need for locally exchanging floppy disks.
For remote diagnostics the internal error stacks can be checked and, if required, a selftest of device functions or an internal alignment can be trig-gered.
REFERENCES* Wolf, Josef: Spectrum Analyzer FSP –
Medium class aspiring to high end. News from Rohde & Schwarz (2000) No. 166, pp 4–7
Conclusion
The optional LAN Interface FSP-B16 is a universal interface for remote control and remote monitoring, suiting FSP optimally for communication in any scenarios.
Ottmar Steffke
FIG 2 Spectrum Analyzer FSP “in” a monitor-ing PC
Reader service card 168/11
News from Rohde & Schwarz Number 168 (2000/III) 37
Application notes

Fast and precise measurement of low RF levels
Certain digitally modulated signals, such as IS-95 or WCDMA, exhibit a high crest factor. A power meter with a thermal sensor is best suited for determining their levels. For this purpose, Rohde & Schwarz offers Dual-Channel Power Meter NRVD with Thermal Power Sensor NRV-Z51 or NRV-Z52. Due to the limited sensitivity of thermal power sensors, only rela-tively high levels can be measured (typ. >–30 dBm).
Diode sensors provide comparable measurement accuracy for RF levels down to about –50 dBm due to higher sensitivity. Care should be taken, how-ever, that they are only used in the square law region. Extra measurement uncertainties can otherwise occur in the case of signals with high crest factor or with harmonics. For High-Sensitivity Diode Sensor NRV-Z4 such effects are negligible in the level range –40 dBm ±10 dB.
The significantly lower RF levels neces-sary for BER mea surements can only be
measured with a selective RF receiver or a spectrum analyzer. But their abso-lute measurement uncertainty – even that of a state-of-the art spectrum ana-lyzer like FSP – is higher (0.5 dB) com-pared to high-quality power meters.
The point of this test hint is to eliminate the absolute error of FSP by calibrat-ing Spectrum Analyzer FSP to Dual-Channel Power Meter NRVD with High-Sensitivity Diode Sensor NRV-Z4 for a reference level of approx. –40 dBm (FIG 1). When measuring tiny levels,
only the very small linearity error of FSP that occurs with digital bandwidths adds to the measurement uncertainty of the power meter (FIG 2). Thus a total measurement uncertainty of 0.26 dB can be achieved when measuring a level of –110 dBm.
If necessary, the measurement range can be extended to approx. –130 dBm by means of a low-noise preamplifier. Using the zero span measurement and integration in the time domain (time domain power rms) of FSP, the maxi-mum possible measurement speed can be obtained for a given S/N ratio.
Application Note 1MA21 provides a detailed description of this proce-dure and can be downloaded from the Rohde & Schwarz Internet pages.
Roland Minihold
0.5
0.4
0.3
0.2
0.1
0
–0.1
–0.2
–0.3
–0.4
–0.50 10 20 30 40 50 60 70 80 90
Linea
rity
erro
r /dB
Relative level /dB
FIG 1 Suggested test setup to determine small RF levels
High-Sensitivity Diode Sensor
(for level <–15 dBm to >–40 dBm)
Z51
A B
Dual-ChannelPower Meter
NRVD
+20 dBm to –110 dBm (–130 dBm)
1 MHz to 3.5/7 GHz
Thermal Power Sensor(for level >–15 dBm)
Spectrum Analyzer FSP(for level <–40 dBm to –110 dBm;to –130 dBm with low-noise preamplifier)
SpectrumAnalyzer
FSP3 dB6 dB
Z4
DUT(signal generatoror communication
tester)
FIG 2 Linearity error of Spectrum Analyzer FSP, mea-sured on eight differ-ent units (resolution bandwidth 300 Hz)
Some mea surements require very low and highly accurate RF levels (typically –100 dBm to –110 dBm), eg for the BER (bit error rate) of digital communication receivers. This test hint summarizes how to calibrate extremely precisely the levels of signal generators and communication testers used for BER mea surements.
Reader service card 168/12
38 News from Rohde & Schwarz Number 168 (2000/III)
Test hint
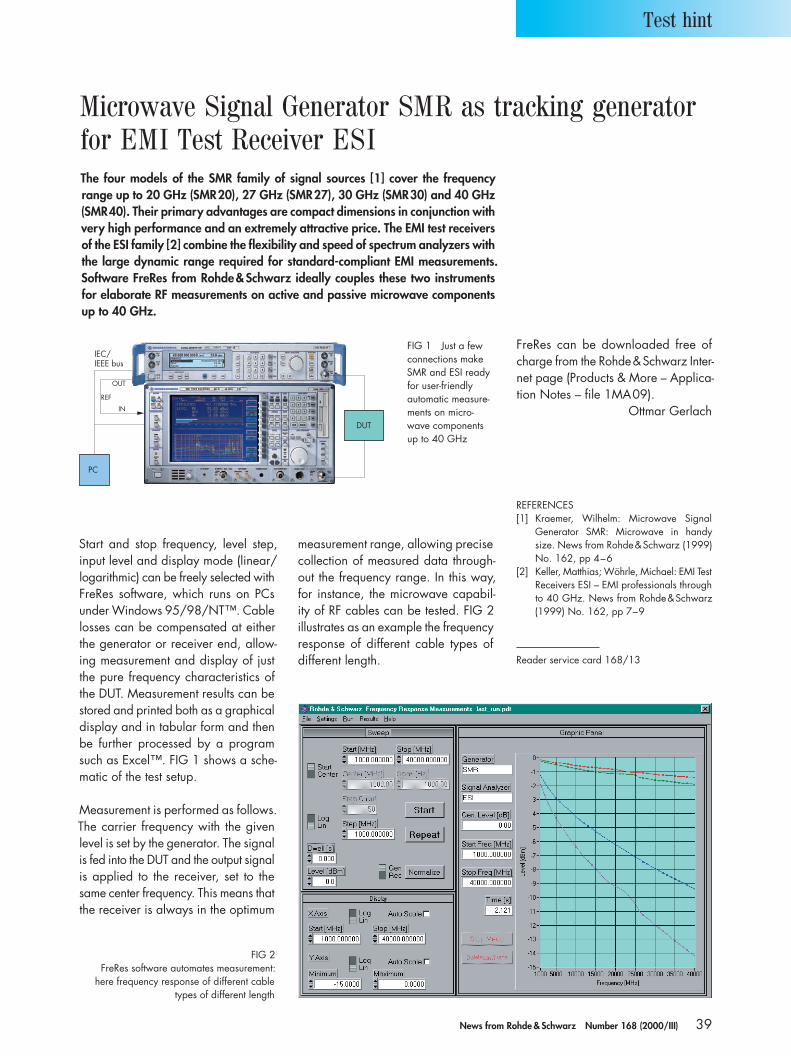
Microwave Signal Generator SMR as tracking generator for EMI Test Receiver ESI
Start and stop frequency, level step, input level and display mode (linear/logarithmic) can be freely selected with FreRes software, which runs on PCs under Windows 95/98/NT ™. Cable losses can be compensated at either the generator or receiver end, allow-ing measurement and display of just the pure frequency characteristics of the DUT. Measurement results can be stored and printed both as a graphical display and in tabular form and then be further processed by a program such as Excel ™. FIG 1 shows a sche-matic of the test setup.
Measurement is performed as follows. The carrier frequency with the given level is set by the generator. The signal is fed into the DUT and the output signal is applied to the receiver, set to the same center frequency. This means that the receiver is always in the optimum
IEC/IEEE bus
DUT
PC
OUT
IN
REF
The four models of the SMR family of signal sources [1] cover the frequency range up to 20 GHz (SMR20), 27 GHz (SMR27), 30 GHz (SMR30) and 40 GHz (SMR40). Their primary advantages are compact dimensions in conjunction with very high performance and an extremely attractive price. The EMI test receivers of the ESI family [2] combine the flexibility and speed of spectrum analyzers with the large dynamic range required for standard-compliant EMI mea surements. Software FreRes from Rohde & Schwarz ideally couples these two instruments for elaborate RF mea surements on active and passive microwave components up to 40 GHz.
REFERENCES[1] Kraemer, Wilhelm: Microwave Signal
Generator SMR: Microwave in handy size. News from Rohde & Schwarz (1999) No. 162, pp 4–6
[2] Keller, Matthias; Wöhrle, Michael: EMI Test Receivers ESI – EMI professionals through to 40 GHz. News from Rohde & Schwarz (1999) No. 162, pp 7–9
measurement range, allowing precise collection of measured data through-out the frequency range. In this way, for instance, the microwave capabil-ity of RF cables can be tested. FIG 2 illustrates as an example the frequency response of different cable types of different length.
FIG 1 Just a few connections make SMR and ESI ready for user-friendly automatic measure-ments on micro-wave components up to 40 GHz
FIG 2 FreRes software automates measurement:
here frequency response of different cable types of different length
Reader service card 168/13
FreRes can be downloaded free of charge from the Rohde & Schwarz Inter-net page (Products & More – Applica-tion Notes – file 1MA09).
Ottmar Gerlach
News from Rohde & Schwarz Number 168 (2000/III) 39
Test hint

It is always interesting to watch TV or listen to radio programs from across the border. If a transmitter in a neighbouring country broadcasts at the same frequency as one in your country however, the pleasure may be short-lived, since reception will be disturbed by interference. So it is indispensable to coordinate allocation of transmitter frequencies – a job for national regulatory authorities. In Sri Lanka, for instance, Rohde & Schwarz has installed a nationwide Spectrum Monitoring and Management System ARGUS-IT that is described here. This system is suitable for the mission of regulatory authorities.
Spectrum monitoring – a task for national regulatory authorities
International coordination of frequency allocations is ensured by the individ-ual countries cooperating within the ITU (International Telecommunication Union). To do their job, national regula-tory authorities need the appropriate equipment in sufficient numbers to work within their borders. The installation of a nationwide system inevitably involves considerable costs. The reason why many countries decide in favour of such systems despite the costs involved is
quite simple: the frequency monopoly and the right to allocate frequencies are a lucrative source of revenue for the governments selling the licenses.
The nationwide ARGUS-IT system installed by Rohde & Schwarz in Sri Lanka is a typical spectrum monitor-ing and management system of the kind already installed by the com-pany many times all over the world. Rohde & Schwarz not only supplies the necessary equipment but also provides the required services to offer the cus-tomer a complete turnkey solution to the tasks at hand.
Tasks and setup
First of all the system must be able to cover the complete frequency range that is used in the country and has to be monitored. In the case of Sri Lanka this means a range extending from 10 kHz (radionavigation) through several bands for very different appli-cations (terrestrial/maritime/airborne radio; sound and TV broadcasting, etc) to 3 GHz. The system must be able to • investigate interference in the elec-
tromagnetic spectrum,
Photo 43582/2
Spectrum monitoring and management system for Sri Lanka
Electromagnetic waves do not stop at frontiers
40 News from Rohde & Schwarz Number 168 (2000/III)
Panorama

• measure technical parameters of transmitters to ensure compliance with license agreements,
• perform frequency occupancy measurements,
• locate transmitter sources so that authorities can take action in the case of unauthorized activities,
• administer frequency licenses.
Since many transmitters operate with limited power and consequently limited coverage, the same frequencies can be reoccupied at distant sites without causing any mutual interference. As a result however, a single central monitor-ing station is not sufficient for a large area with several local transmitters, so that several stations are required for complete coverage of that area.
The system installed by Rohde &Schwarz in Sri Lanka comprises a monitoring center that is also respon-sible for administration (Control Center Colombo and National Frequency Management Center), three attended and six unattended stations (FIG 1), four vehicles (FIG 2) and two portable systems. The range up to 30 MHz is covered by a separate HF station.
Because of the high population density, all fixed stations except for one are located in the Colombo area. Another is sited in Kandy, a large city in the interior of Sri Lanka. The four vehicles featuring almost the complete function-ality of unattended stations enable the authority to monitor those parts of the country not covered by fixed stations. In this way regions can be worked on for which a dedicated station would not be practical.
Commissioning and system components
One of the first steps is to enter the existing frequency allocation tables in the database of the frequency manage-ment system. Based on these data, the spectrum can then be verified with appropriate receivers. The results are
compared with allocated licenses to find out whether there are any unauthor-ized transmitters and to ensure that licensed transmitters do not exceed their approved output power. With the aid of frequency occupancy statistics, ranges with different utilization can be determined and better utilization of the spectrum achieved by regrouping the allocations.
Broadband Active Antennas HE309 and HF902 are used to monitor the spectrum from 10 kHz to 3 GHz with Rohde & Schwarz Monitoring Receiv-ers ESMB. The attended stations can directly record and store the received AF signal.
Any illegal deviations – these may be unauthorized transmitters or unin-tentional jammers – have to be local-ized. This is done by direction find-ers using special antenna systems to determine the direction the signals come from. The system described here uses Digital Direction Finder DDF01M with DF Antenna ADD010 for the HF range and Digital Direction Finder DDF190 with DF Antennas ADD190 and ADD071 for the VHF-UHF range. All units are controlled from process controllers working with ARGUS Spec-trum Monitoring Software* (FIG 3). If necessary, individual units can also be operated manually.
The frequency spectrum is monitored in the unattended stations, which also provide direction finding. Interconnec-tion of a number of stations enables pinpointing of transmitter locations by triangulation.
Networked systems
Within a station, equipment and con-trol computers are networked on a LAN, while the individual stations are interconnected by a WAN set up on switched telephone lines. The vehicles are integrated via the GSM network cur-rently emerging in Sri Lanka. Through the WAN, all unattended stations can be drawn into the measurements by the attended stations.
FIG 1One of the fixed
monitoring stations in Sri Lanka
Phot
o A
utho
rs
FIG 2 A mobile monitoring station as used in Sri Lanka
Phot
o 43
127/
1
News from Rohde & Schwarz Number 168 (2000/III) 41
Panorama

Spectrum management
The strong increase in electronic com-munications inevitably increases occu-pancy of the electromagnetic spectrum. By granting licenses to broadcasters and service providers, the authority is able to control this occupancy and achieve more balanced utilization of individual frequency bands by real-location. With the granting of a license the user must undertake to observe prescribed technical parameters. These may change due to technical progress and narrowing channels.
A management database in line with ITU specifications and recommenda-tions is used for frequency manage-ment and administration of licenses. Since this software considerably influ-ences the customer’s administration, eg the organization of licenses, accounts receivable accounting, the special workflows are mapped in the software. Granting a license to a radio ama-teur, for instance, requires a different procedure to a license issued to a TV broadcaster or GSM network operator. There are also different regulations for charging the various customers. An
REFERENCES* Pfitzner, Jörg: Spectrum Monitoring Soft-
ware ARGUS 4.0 – New software genera-tion for spectrum monitoring systems. News from Rohde & Schwarz (2000) No. 167, pp 18–20
Reader service card 168/14
authority may not pay any license fees at all for instance, while a big customer like a TV broadcaster may have other conditions of payment than a radio taxi enterprise.
In addition to the above components forming the core of the system, the equipment supplied includes a number of further components as well as ser-vices provided by Rohde & Schwarz, for instance:• consulting for optimally adapting
the system design to the specific needs of the customer,
• selection of suitable sites for the fixed stations,
• procurement, delivery and erec-tion of antenna masts,
• provision of vehicles and fitting with air conditioning, racks and masts,
• procurement and integration of equipment from subcontractors,
• system installation and integration test on site,
• training for system operation,• special training on the operating
system or database applications,• customer-specific maintenance con-
cept.
Turnkey suppliers in great demand
The demand today is for providers of complete turnkey solutions rather than for suppliers of the individual items of equipment. Rohde & Schwarz sees its role as a competent supplier of com-plex systems configured and tailored to the customer’s requirements.
Jörg Pfitzner; Georg Schuberth
FIG 3ARGUS software for convenient control of Moni-toring Receivers ESMB and Digital Direction Find-ers DDF190
42 News from Rohde & Schwarz Number 168 (2000/III)
Panorama

Application Firmware FSIQ-K71 enables power measurements on cdmaOne signals with FSIQ on as many as 64 Walsh code channels (for-ward channel) of base stations simultaneously.
Data sheet PD 757.5572.21 enter 168/17
Audio Analyzer UPL Model UPL16 for type-approval measurements on GSM mobile phones plus the options Digital Audio I/O 96 kHz, Mobile Phone Test Set (GSM measurements with-out DAI interface) and Automatic Measurements on Sound-Program Circuits were the main rea-sons for revising the data sheet.
Data sheet PD 757.2238.23 enter 168/18
DVB-T Inhouse Repeater SDR01 (470 MHz to 862 MHz) ensures terrestrial coverage in shielded areas; gain 60 dB to 80 dB (max. 100 mW); AC supply.
Data sheet PD 757.5914.21 enter 168/19
UHF Transmitter Family NH/NV7000 of medium power (NH (analog): 250 W to 2 kW; NV: DVB-T 100 W to 800 W, ATSC 125 W to 1 kW) uses LDMOS technology and is air-cooled (internal fans); digital exciter (all usual operating modes), optionally eg SNMP or WEB server interface.
Data sheet PD 757.5795.21 enter 168/20
DTV Recorder Generator DVRG records digital video streams and reproduces them as well as ATSC/DVB signals; optional supplementary hard disk (18 Gbyte), SDI signal write/read, CD-R write/read and DVD read.
Data sheet PD 757.5708.21 enter 168/21
DTV Web Carousel is a service for cyclically sending Internet data to stationary or mobile subscriber groups; easy compilation of contents; optional test software.
Data sheet PD 757.5620.21 enter 168/22
Vector Network Analyzer Family ZVR The new models ZVCE (3 channels) and ZVC (4 chan-nels) – each bidirectional and with bridges – for 20 kHz to 8 GHz (passive) and 300 kHz to 8 GHz (active) plus the new time domain, nonlinear measurements and virtual embedding networks options as well as the updating of the data sheet specifications made the new issue necessary.
Data sheet PD 757.1802.24 enter 168/23
Monitoring Receiver ESMB (20 MHz to 3 GHz; optionally from 9 kHz) complies with ITU specifi-cations and can handle all monitoring and analy-sis tasks (including coverage measurements); remote-control capability, various interfaces (eg digital AF output), optional RF spectrum display; 10 V to 32 V DC (AC supply as an option), weight 8 kg.
Data sheet PD 757.5808.21 enter 168/24
Test Receiver ESVN40 (9 kHz to 2.75 GHz) of the ESN/ESVN series is being phased out of production.
Data sheet PD 757.0129.23 enter 168/25
Application Firmware FSE-K10, FSE-K11 New features are the extended frequency range (together with Signal Analyzers FSIQ), an improved menu structure as well as greater flex-ibility and higher measurement speed.
Data sheet PD 757.3592.22 enter 168/26
Digital Monitoring Direction Finders DDF0xM (0.3 MHz to 3 GHz) New antennas (HF: eg U-Adcock with 1x8/2x8 elements; VHF/UHF: additional light-weight model and model for GSM), DF set DDFGSM and an electronic
compass for some models made the issue of a revised data sheet necessary.
Data sheet PD 757.1854.23 enter 168/27
Millivoltmeter URV55 The data sheet has been given a new design and updated as regards characteristics and range of sensors.
Data sheet PD 756.3453.22 enter 168/28
ATC Newsletter 05/2000 contains current refer-ences on installed R & S systems from all over the world.
Info PD 757.5589.21 enter /29
TACAN Bearing Simulator STS100 from the R & S Cologne Plant generates high-precision azimuth test signals and MRB/ARB synchronization sig-nals.
Data sheet PD 757.5872.21 enter 168/30
Automotive Verification Test Systems AVTS from the R & S Cologne Plant serve for installing enter-tainment and communication equipment (radio, TV, mobile radio, navigation aids, etc) in motor vehicles.
Info PD 757.5595.21 enter 168/31
New application notes
GPIBShot-Taking Screenshots via IEC/IEEE Bus
Appl. 1MA25_0E enter 168/32
Production Tests on ICO User Terminals with SMIQ and FSE/FSIQ
Appl. 1MA23_0E enter 168/33
Schz
Universal Radio Communication Tester CMU200 Revised data sheet with a new chapter on solu-tions for production as well as layout classified according to GSM, TDMA, AMPS and CDMA; new optional CDMA signalling unit and test soft-ware for IS-136/cellular (800 and 1900 MHz), AMPS, CDMA (800 and 1700/1900 MHz).
Data sheet PD 757.4318.22 enter 168/15
Production Test Platform TS7100 for testing mobile phones (with CMU200) checks all device functions in line with all current and future stan-dards; faster throughput due to real parallel tests, extensive test library (customizable), modular structure (compact PCI/PXI).
Info PD 757.5737.21 enter 168/16
Basic systems for:• Radio: AM, FM• Television: PAL, NTSC, SECAM• Mobile radio: GSM, TDMA, CDMA• Navigation: GPS• Customer applications
Automotive Verification Test Systems AVTSInstallation test systems for the automobile industry
• One basic system platform
– for all customary radio standards– for all production steps
board testsfunctional testsRF calibrationfinal tests incl. RF tests, acoustic tests, display tests and keyboard/pad tests
– for multi-protocol and multiband testing with Radio Communica-tion Tester CMU200, migration from CMD to CMU included
• One simple concept
– Comprehensive modular test library for immediate use or easy customization
– Generic system using versatile configuration based on Compact-PCI/PXI
– Easy upgrade to 3rd generation products
• One cost effective tool
– High throughput by real parallel testing using independent IEC/IEEE-bus systems
– Flexible core system for either functional, final or other tests
– Modular and versatile hardware and software, standard fixture in-terfaces
– All hardware and software compo-nents based on industry standards
Cellular Phone Production Test Platform TS7100The new "ready to go" production tool
News from Rohde & Schwarz Number 168 (2000/III) 43
Information in print

Spain goes all the way with terrestrial digital TVIt is hardly an exaggeration to say that this was the most ambi-tious project to date in the his-tory of television broadcasting. Including the invitation-to-bid phase, the Onda Digital group did not even have nine months after being awarded its license to demonstrate coverage of 50% of Spain’s population with DVB-T.
New member in family of spectrum analyzersAs the title spread for its second issue of the year, China’s Foreign Electronic Measurement Technology chose Rohde & Schwarz’s family of spectrum analyzers including the instru-ments FSE, FSIQ and – the latest member – FSP:
FSP sets new standards worldwide with func-tionality that has never been offered before plus extremely high measuring speed and accuracy. In addition to conventional func-tions, you find a whole number of extra fea-tures included in the basic model as standard. With measurement uncertainty of only 0.5 dB, minimum sweep time of 2.5 ms and up to 30 mea surements per second on the IEC (GPIB) bus, FSP is the one to beat in the middle price segment.
Spectral purity of signal sourcesThe German technical journal Elektronik Informationen devoted the cover spot of its summer edition to the new Signal Generator SML, of which it said:
An ideal signal generator should produce a perfectly sinusoidal output signal. In real-ity however, there are greater and lesser degrees of difference from the sinusoidal form because of various influences in the generator, so the spectral purity of the output signal degrades accordingly … You have to think of this when choosing the right source for your measurement chore. The new analog modulated Signal Generator SML01 from Rohde & Schwarz is a general-purpose instru-ment that is ahead of the state of the art in this respect.
CMU200 – best in testThe worldwide circulated magazine Test& Measurement World selected Radiocommuni-cation Tester CMU200 from Rohde & Schwarz as one of the world’s ten best measuring instruments for 1999. The choice was based on a survey among all the magazine’s read-ers.
Newsgrams
And barely half a year later, cov-erage was to have grown to 80% of the nation. Retevision, operator of the existing analog TV network and Onda Digital partner, was commissioned to operate the new transmitter net-work.
The Spanish project set new standards in technical terms too: four nationwide multiplexes
were to be operated in single-frequency mode on the highest channels available, ie 66, 67, 68 and 69, in other words all adjacent. Something like this had never been tried in a pilot project, and there were many who said it could not work. A fifth channel is also to be added, with a different regional focus.
Another major aspect was the political intention of Spain’s gov-ernment, which not only wanted to shift the country into high tech-nical gear through the sophis-ticated project but also create jobs through the accompany-ing investment. That is why the licensee had to prove the value-added component of the project for Spain, and transmitter pro-ducers wishing to participate
Phot
o 43
238/
1
First test system for BluetoothThe US journal Wireless Systems Design reported fully in its May issue under the headline “System Qualifies Bluetooth Prod-ucts and Components” on Rohde & Schwarz’s new TS8960:
TS8960, fully compliant with current Blue-tooth core specifications 1.0 and RF test speci-fications 0.7, can be used for conformance tests as well as mea surements during the design phase or in quality assurance. All the Bluetooth test cases you need come ready set, and you can alter and adapt their parameters as required. With its signalling test mode the system can also put a device into test mode direct and over the air interface, which saves a lot of effort and time.
Stefan Böttinger
44 News from Rohde & Schwarz Number 168 (2000/III)
Press comments
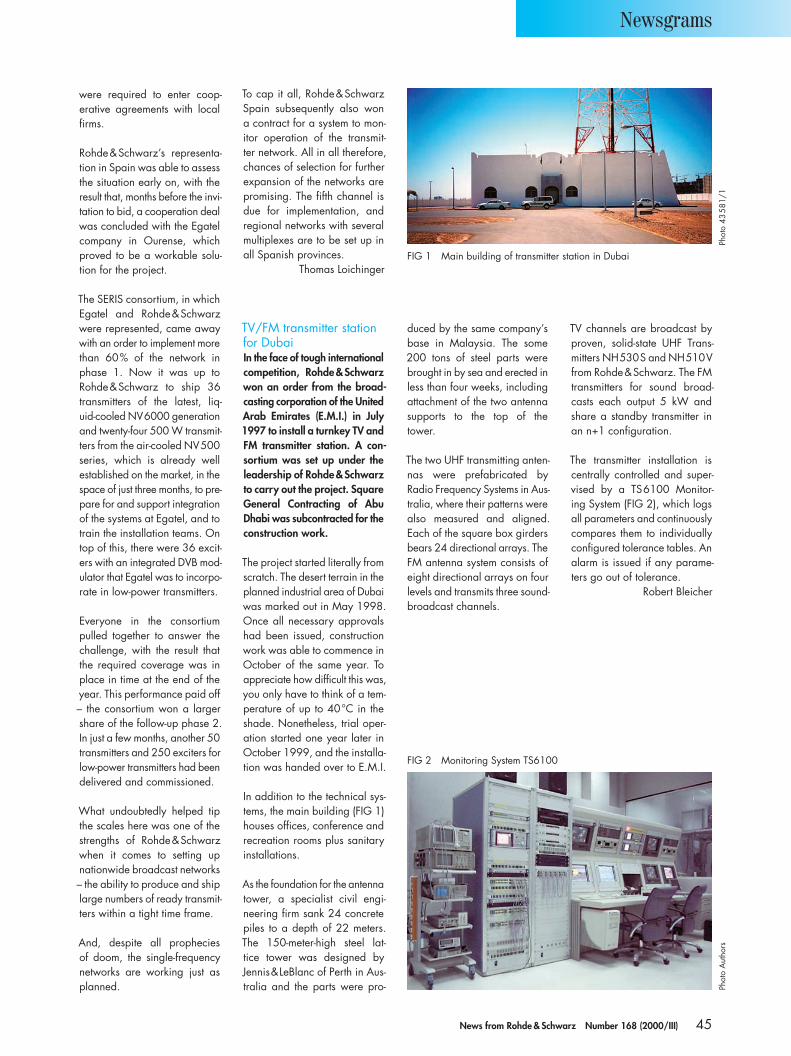
were required to enter coop-erative agreements with local firms.
Rohde & Schwarz’s representa-tion in Spain was able to assess the situation early on, with the result that, months before the invi-tation to bid, a cooperation deal was concluded with the Egatel company in Ourense, which proved to be a workable solu-tion for the project.
The SERIS consortium, in which Egatel and Rohde & Schwarz were represented, came away with an order to implement more than 60% of the network in phase 1. Now it was up to Rohde & Schwarz to ship 36 transmitters of the latest, liq-uid-cooled NV6000 generation and twenty-four 500 W transmit-ters from the air-cooled NV500 series, which is already well established on the market, in the space of just three months, to pre-pare for and support integration of the systems at Egatel, and to train the installation teams. On top of this, there were 36 excit-ers with an integrated DVB mod-ulator that Egatel was to incorpo-rate in low-power transmitters.
Everyone in the consortium pulled together to answer the challenge, with the result that the required coverage was in place in time at the end of the year. This performance paid off – the consortium won a larger share of the follow-up phase 2. In just a few months, another 50 transmitters and 250 exciters for low-power transmitters had been delivered and commissioned.
What undoubtedly helped tip the scales here was one of the strengths of Rohde & Schwarz when it comes to setting up nationwide broadcast networks – the ability to produce and ship large numbers of ready transmit-ters within a tight time frame.
And, despite all prophecies of doom, the single-frequency networks are working just as planned.
To cap it all, Rohde & Schwarz Spain subsequently also won a contract for a system to mon-itor operation of the transmit-ter network. All in all therefore, chances of selection for further expansion of the networks are promising. The fifth channel is due for implementation, and regional networks with several multiplexes are to be set up in all Spanish provinces.
Thomas Loichinger
TV/FM transmitter station for DubaiIn the face of tough international competition, Rohde & Schwarz won an order from the broad-casting corporation of the United Arab Emirates (E.M.I.) in July 1997 to install a turnkey TV and FM transmitter station. A con-sortium was set up under the leadership of Rohde & Schwarz to carry out the project. Square General Contracting of Abu Dhabi was subcontracted for the construction work.
The project started literally from scratch. The desert terrain in the planned industrial area of Dubai was marked out in May 1998. Once all necessary approvals had been issued, construction work was able to commence in October of the same year. To appreciate how difficult this was, you only have to think of a tem-perature of up to 40°C in the shade. Nonetheless, trial oper-ation started one year later in October 1999, and the installa-tion was handed over to E.M.I.
In addition to the technical sys-tems, the main building (FIG 1) houses offices, conference and recreation rooms plus sanitary installations.
As the foundation for the antenna tower, a specialist civil engi-neering firm sank 24 concrete piles to a depth of 22 meters. The 150-meter-high steel lat-tice tower was designed by Jennis&LeBlanc of Perth in Aus-tralia and the parts were pro-
duced by the same company’s base in Malaysia. The some 200 tons of steel parts were brought in by sea and erected in less than four weeks, including attachment of the two antenna supports to the top of the tower.
The two UHF transmitting anten-nas were prefabricated by Radio Frequency Systems in Aus-tralia, where their patterns were also measured and aligned. Each of the square box girders bears 24 directional arrays. The FM antenna system consists of eight directional arrays on four levels and transmits three sound-broadcast channels.
TV channels are broadcast by proven, solid-state UHF Trans-mitters NH530S and NH510V from Rohde & Schwarz. The FM transmitters for sound broad-casts each output 5 kW and share a standby transmitter in an n+1 configuration.
The transmitter installation is centrally controlled and super-vised by a TS6100 Monitor-ing System (FIG 2), which logs all parameters and continuously compares them to individually configured tolerance tables. An alarm is issued if any parame-ters go out of tolerance.
Robert Bleicher
FIG 1 Main building of transmitter station in Dubai
Phot
o 43
581/
1
FIG 2 Monitoring System TS6100
Phot
o A
utho
rs
Newsgrams
News from Rohde & Schwarz Number 168 (2000/III) 45
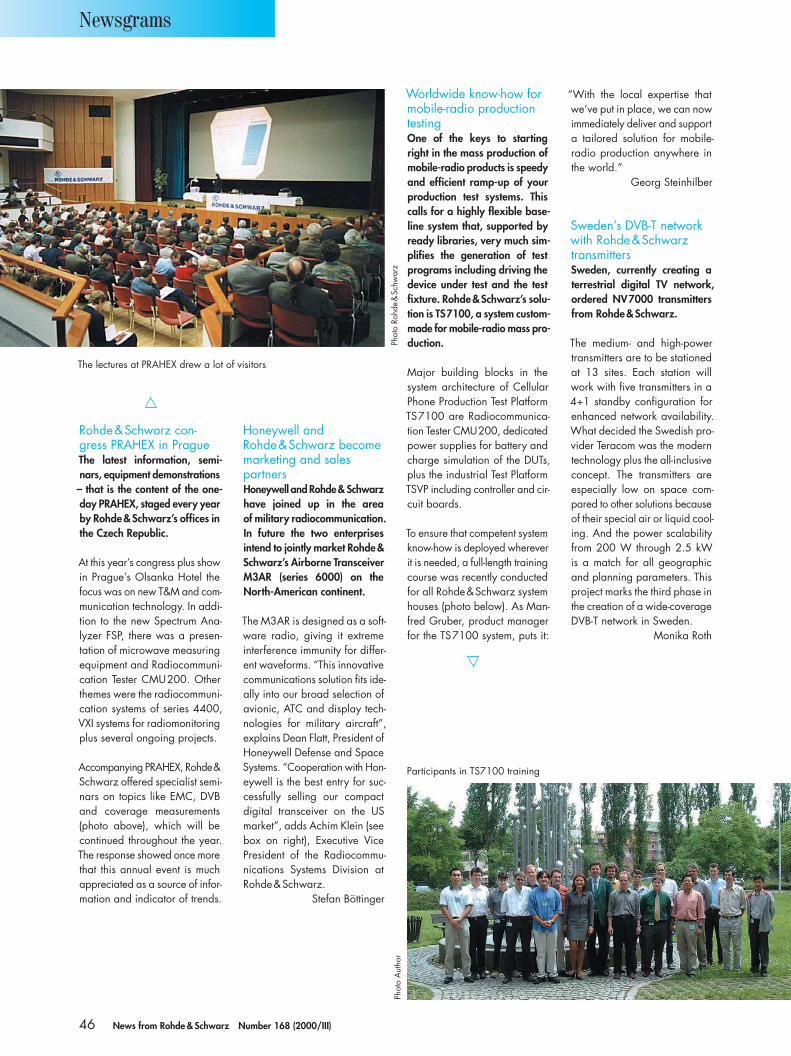
Worldwide know-how for mobile-radio production testingOne of the keys to starting right in the mass production of mobile-radio products is speedy and efficient ramp-up of your production test systems. This calls for a highly flexible base-line system that, supported by ready libraries, very much sim-plifies the generation of test programs including driving the device under test and the test fixture. Rohde & Schwarz’s solu-tion is TS7100, a system custom-made for mobile-radio mass pro-duction.
Major building blocks in the system architecture of Cellular Phone Production Test Platform TS7100 are Radiocommunica-tion Tester CMU200, dedicated power supplies for battery and charge simulation of the DUTs, plus the industrial Test Platform TSVP including controller and cir-cuit boards.
To ensure that competent system know-how is deployed wherever it is needed, a full-length training course was recently conducted for all Rohde & Schwarz system houses (photo below). As Man-fred Gruber, product manager for the TS7100 system, puts it:
Rohde & Schwarz con-gress PRAHEX in PragueThe latest information, semi-nars, equipment demonstrations – that is the content of the one-day PRAHEX, staged every year by Rohde & Schwarz’s offices in the Czech Republic.
At this year’s congress plus show in Prague’s Olsanka Hotel the focus was on new T&M and com-munication technology. In addi-tion to the new Spectrum Ana-lyzer FSP, there was a presen-tation of microwave measuring equipment and Radiocommuni-cation Tester CMU200. Other themes were the radiocommuni-cation systems of series 4400, VXI systems for radiomonitoring plus several ongoing projects.
Accompanying PRAHEX, Rohde & Schwarz offered specialist semi-nars on topics like EMC, DVB and coverage mea surements (photo above), which will be continued throughout the year. The response showed once more that this annual event is much appreciated as a source of infor-mation and indicator of trends.
Honeywell and Rohde & Schwarz become marketing and sales partnersHoneywell and Rohde & Schwarz have joined up in the area of military radiocommunication. In future the two enterprises intend to jointly market Rohde & Schwarz’s Airborne Transceiver M3AR (series 6000) on the North-American continent.
The M3AR is designed as a soft-ware radio, giving it extreme interference immunity for differ-ent waveforms. “This innovative communications solution fits ide-ally into our broad selection of avionic, ATC and display tech-nologies for military aircraft”, explains Dean Flatt, President of Honeywell Defense and Space Systems. “Cooperation with Hon-eywell is the best entry for suc-cessfully selling our compact digital transceiver on the US market”, adds Achim Klein (see box on right), Executive Vice President of the Radiocommu-nications Systems Division at Rohde & Schwarz.
Stefan Böttinger
“With the local expertise that we’ve put in place, we can now immediately deliver and support a tailored solution for mobile-radio production anywhere in the world.”
Georg Steinhilber
Sweden’s DVB-T network with Rohde & Schwarz transmittersSweden, currently creating a terrestrial digital TV network, ordered NV7000 transmitters from Rohde & Schwarz.
The medium- and high-power transmitters are to be stationed at 13 sites. Each station will work with five transmitters in a 4+1 standby configuration for enhanced network availability. What decided the Swedish pro-vider Teracom was the modern technology plus the all-inclusive concept. The transmitters are especially low on space com-pared to other solutions because of their special air or liquid cool-ing. And the power scalability from 200 W through 2.5 kW is a match for all geographic and planning parameters. This project marks the third phase in the creation of a wide-coverage DVB-T network in Sweden.
Monika Roth
The lectures at PRAHEX drew a lot of visitors
Participants in TS7100 training
Phot
o A
utho
rPh
oto
Rohd
e&Sc
hwar
z
Newsgrams
46 News from Rohde & Schwarz Number 168 (2000/III)

Focus on modern radiocommunicationAt this year’s International Air Show ILA in Berlin, Rohde & Schwarz pre-sented an innovative range of equipment for modern radiocom-munication, radiomonitoring and air traffic control.
Center stage was the new gen-eration of M3xR software radios (multiband, multimode, multi-role). These digital, modular radio sets introduce a concept that is leading worldwide – they can be matched by software to future requirements. That makes it easy to adapt waveforms, mod-ulation, interfaces and even fre-quency bands.
In addition to numerous other prominent visitors from the world of politics and business, Bavar-ia’s Minister of Economic Affairs, Otto Wiesheu, showed a lot of interest in the new radiocom-munication equipment on show (photo top right).
The ILA was marked by a special event – the signing of a govern-ment agreement between Ger-many, France, Italy and the Neth-erlands concerning series pro-duction of the NH90 helicopter, for which Rohde & Schwarz is supplying radiocommunication systems.
Siemens and R & S Bick Mobilfunk cooperate on TETRA mobile-radio sys-temsSiemens AG of Austria and the Rohde & Schwarz subsidiary R & S Bick Mobilfunk GmbH will cooperate on marketing TETRA mobile-radio networks.
R & S Bick Mobilfunk and the Sie-mens TETRA Center of Compe-tence will join forces to market the TETRA mobile-radio system
ACCESSNET ®-T worldwide. In addition to its global presence and matching range of solutions for digital trunked radio, Sie-mens will be able to contrib-ute many years of experience in the planning and installation of mobile-radio networks to this joint venture. R & S Bick Mobil-funk, with switching equipment, base stations plus network man-agement, adds both products and expertise for the new TETRA mobile-radio system.
During the next few years, Ger-many, as a result of the Schen-gen Agreement, will be setting up a nationwide, digital trunked-radio network to replace the present radio networks of its security forces. This will mean investment estimated at about DM 4 billion. The cooperation between the two enterprises is intended to stimulate growth in professional, digital mobile radio.
Stefan Böttinger
Rohde & Schwarz’s President and COO Hans Wagner with Bavaria’s Minister of Economic Affairs, Otto Wiesheu, at this year’s ILA
Phot
o Sc
hmal
feld
t
Phot
o Ro
hde&
Schw
arz
New management for Division 2Achim Klein (45) is the new Executive Vice President of the Radiocommunications Systems Division at Rohde & Schwarz.
In this position he will be respon-sible for corporate activities worldwide in the sector of radio communications for secu-rity and defense. At the same time he joins the corporate management. His predecessor
Ludwig Lohner had success-fully adapted the Division to the requirements of the world market.
“Thanks to its innovation and drive, Rohde & Schwarz, as a European provider of radiocom-munications systems for secu-rity and defense, is now also set to play a leading role in a fast changing, global industrial landscape”, declared Achim Klein.
Newsgrams
News from Rohde & Schwarz Number 168 (2000/III) 47

ROHDE & SCHWARZ GmbH & Co. KG · Muehldorfstrasse 15 · 81671 Muenchen, Germany · P.O.B. 80 14 69 · 81614 MuenchenSupport Center: Tel. (+49) 018 05 12 42 42 · E-Mail: [email protected] · Fax (+49 89) 41 29-137 77
New
s fro
m R
ohde
&Sc
hwar
z 16
8 (2
000/
III) ·
PD
757
.604
0.21
· B4
2622
Visit us on Internet at www.rohde-schwarz.com