Embed Size (px)
Citation preview

Newport Local Development Plan 2011-2026
Annual Monitoring Report October 2017
www.newport.gov.uk

Front Cover Images
1
3 42
1 City Vizion H1(37)
2 Glan Llyn - Site H1(47)
3 Wales International Convention Centre – Site CF9, Celtic Manor
4 Primary School at Jubilee Park – Site H1(54)

CONTENTS
Contents..................................................................................................................................................................................... 2
List of Tables........................................................................................................................................................................... 4
List of Figures.......................................................................................................................................................................... 5
1. Executive Summary............................................................................................................................................................ 6
Key Findings ........................................................................................................................................................................... 6
Assessment and Conclusion.................................................................................................................................................... 9
2. Introduction..................................................................................................................................................................... 10
LDP Vision, Strategy and Objectives ..................................................................................................................................... 10
AMR Format ......................................................................................................................................................................... 11
3. Contextual Changes ......................................................................................................................................................... 12
Global and National Influences............................................................................................................................................. 12
Legislation and National Policy ............................................................................................................................................. 14
Regional, Local Policy and Guidance ..................................................................................................................................... 15
4. LDP Monitoring................................................................................................................................................................ 19
Monitoring Process............................................................................................................................................................... 19
Contextual Indicators ........................................................................................................................................................... 19
Core and Local Indicators...................................................................................................................................................... 25
Objective 1 – Sustainable Use of Land .................................................................................................................................. 26
Objective 2 – Climate Change ............................................................................................................................................... 29
Objective 3 – Economic Growth............................................................................................................................................ 31
Objective 4 – Housing Provision............................................................................................................................................ 39
Objective 5 – Conservation of the Built Environment ........................................................................................................... 54
Objective 6 – Conservation of the Natural Environment....................................................................................................... 55
Objectives 7, 8 & 9 – Community Facilities and Infrastructure (7) Culture and Accessibility (8) Health and Well-being (9) ... 57
Objective 10 – Waste............................................................................................................................................................ 59
5. Sustainability Appraisal Monitoring ................................................................................................................................. 60
SA Objective 1 - Protect or enhance existing protected or important landscapes and open spaces and encourage their sustainable use, enjoyment and management ..................................................................................................................... 61
SA Objective 2 – Protect, manage and enhance biodiversity ................................................................................................ 62
SA Objective 3 – Land is used efficiently and geodiversity, soil quality and mineral resources are protected ....................... 63
SA Objective 4 – Improvement in air quality......................................................................................................................... 64
SA Objective 5 – Reduction in emissions of greenhouse gases.............................................................................................. 64
SA Objective 6 – Minimisation of the effects of noise pollution............................................................................................ 65
SA Objective 7 – Maintenance or enhancement of water quality, quantity and flow ........................................................... 65
SA Objective 8 – Reduction in water consumption ............................................................................................................... 66
SA Objective 9 – Minimise the risk of and from flooding and coastal erosion in the short and long term............................. 67
SA Objective 10 –Increase in energy efficiency ..................................................................................................................... 68
SA Objective 11 – Increase in renewable energy................................................................................................................... 69

Newport City Council | Annual Monitoring Report 2016-173
SA Objective 12 – Achievement of waste reduction and decrease in waste sent to landfill, and increase in levels of recycling to achieve more sustainable waste management................................................................................................................. 69
SA Objective 13 – Promotion and achievement of sustainable, high quality design in all development to a higher quality built and natural environment whilst adapting to the potential impacts of climate change ................................................. 70
SA Objective 14 – Improvement to equality of opportunity amongst all social groups and improvement in health and wellbeing.............................................................................................................................................................................. 71
SA Objective 15 – Protection and provision of improved local, social, recreational and leisure facilities for all sectors of the community, and improvement to their accessibility............................................................................................................. 72
SA Objective 16 – Improvement to the quantity, quality, variety and affordability of housing............................................. 73
SA Objective 17 – Reduction in crime and social disorder and the fear of crime and promotion of safer neighbourhoods ... 75
SA Objective 18 – Conservation and enhancement of the historic environment of Newport................................................ 76
SA Objective 19 – Promotion and strengthening and enhancement of the cultural identity................................................. 77
SA Objective 20 – Enabling of high and stable levels of local employment in Newport......................................................... 78
SA Objective 21 – Improvement in diverse and viable business growth and increase in economic growth........................... 79
SA Objective 22 – Enhancement to the profile of Newport and strengthening of the tourist economy, sensitively capitalising on environmental, heritage and leisure assets and ensuring that the benefits are experienced locally................................ 80
SA Objective 23 – Improvement in educational attainment and increase skill levels to promote/develop a greener, knowledge based economy .................................................................................................................................................. 81
SA Objective 24 – Reduction in the need to travel and achievement of resource-efficient and climate resilient settlement patterns................................................................................................................................................................................ 82
SA Objective 25 – Achievement of a modal shift to more sustainable modes of transport, including walking and cycling.... 83
SA Objective 26 – Improvement in the vitality and viability of the district centre and city centre ........................................ 85
6. Conclusions and Recommendations................................................................................................................................. 88
Recommendations.............................................................................................................................................................. 101
Glossary ................................................................................................................................................................................. 102
Appendix 1 – Delivery and Implementation of LDP Allocations .............................................................................................. 105
Housing Allocations ............................................................................................................................................................ 105
Gypsy and Traveller Accommodation ................................................................................................................................. 108
Employment Land Allocations ............................................................................................................................................ 108
Education Allocations ......................................................................................................................................................... 109
Appendix 2 – Newport City Centre Local Development Order Progress .................................................................................. 110
Background ........................................................................................................................................................................ 110
LDO Progress ...................................................................................................................................................................... 110
Conclusion .......................................................................................................................................................................... 110
Appendix 3 – Deleted and Amended Monitoring Indicators and Targets................................................................................ 111

Newport City Council | Annual Monitoring Report 2016-174
LIST OF TABLES
TABLE 1: CONTEXTUAL INDICATOR 1, MOST DEPRIVED AREAS IN NEWPORT COMPARED TO WALES AS A WHOLE ..................... 20TABLE 2: CONTEXTUAL INDICATOR 2, NUMBER OF REPORTED CRIME INCIDENTS BY TYPE AS A TOTAL....................................... 21TABLE 3: CONTEXTUAL INDICATOR 3, ECONOMIC ACTIVITY RATES OF NEWPORT RESIDENTS..................................................... 22TABLE 4: CONTEXTUAL INDICATOR 4, NEWPORT RESIDENTS OUT-COMMUTING TO WORK IN LOCATIONS OUTSIDE OF THE CITY23TABLE 5: OB1 MT1, AMOUNT OF GREENFIELD LOST TO DEVELOPMENT NOT ALLOCATED IN THE LDP ........................................ 26TABLE 6: OB1 MT2, AMOUNT OF ENVIRONMENTAL SPACE LOST TO DEVELOPMENT.................................................................. 26TABLE 7: OB1 MT3, AMOUNT OF DEVELOPMENT PREMITTED IN C1 AND C2 FLOODPLAIN AREAS .............................................. 27TABLE 8: OB1 MT4, AMOUNT OF DEVELOPMENT WITHIN A MINERAL SAFEGUARDING AREA..................................................... 28TABLE 9: OB2 MT1, NUMBER AND CAPACITY OF RENEWABLE ENERGY DEVELOPMENTS PERMITTED ......................................... 29TABLE 10: OB2 MT2, NUMBER OF PERMISSIONS GRANTED CONTRARY TO ADVICE FROM NRW................................................. 30TABLE 11: OB2 MT3, NUMBER OF PERMISSIONS GRANTED CONTRARY TO ADVICE FROM THE WATER SUPPLIER ....................... 30TABLE 12: OB3 MT1, ADDITIONAL NET EMPLOYMENT LAND...................................................................................................... 31TABLE 13: OB3 MT2, EMPLOYMENT LAND SUPPLY .................................................................................................................... 33TABLE 14: OB3 MT3, JOB CREATION OVER THE PLAN PERIOD .................................................................................................... 33TABLE 15:OB3 MT4, EXISTING B CLASS EMPLOYMENT LAND LOST TO OTHER USES.................................................................... 34TABLE 16: OB3 MT5, VACANT COMMERCIAL UNITS IN THE CITY CENTRE ................................................................................... 35TABLE 17: OB3 MT6, APPLICATIONS APPROVED FOR NON-RETAIL USES IN PRIMARY AND SECONDARY FRONTAGE.................... 36TABLE 18: OB3 MT7, RETAIL DEVELOPMENTS OUTSIDE OF THE CITY CENTRE............................................................................. 37TABLE 19: OB4 MT1, NEW HOUSING ON PREVIOUSLY DEVELOPED LAND................................................................................... 39TABLE 20: OB4 MT2, HOUSING LAND SUPPLY FOR THE CURRENT HOUSING LAND AVAILABILITY STUDY..................................... 39TABLE 21: OB4 MT3, LDP ANNUAL COMPLETIONS..................................................................................................................... 40TABLE 22: OB4 MT4, ANNUAL COMPLETION RATES AT LLANWERN VILLAGE .............................................................................. 43TABLE 23: OB4 MT5, ANNUAL COMPLETION RATES AT GLAN LLYN ............................................................................................ 43TABLE 24: OB4 MT6, NET ADDITIONAL AFFORDABLE DWELLINGS BUILT .................................................................................... 46TABLE 25: OB4 MT7, RESIDUAL VALUES ACROSS HOUSING SUBMARKET AREAS......................................................................... 47TABLE 26: OB4 MT8, HOUSING COMPLETED ON H1 SITES.......................................................................................................... 49TABLE 27: OB4 MT9, AVERAGE DENSITY OF PERMITTED HOUSING DEVELOPMENT.................................................................... 49TABLE 28: OB4 MT10, DWELLINGS PERMITTED OUTSIDE OF THE SETTLEMENT BOUNDARY ....................................................... 50TABLE 29: OB4 MT11, DELIVERY OF HARTRIDGE FARM ROAD AS A GYPSY/TRAVELLER SITE........................................................ 51TABLE 30: OB4 MT12, ACCOMMODATION PROVISION FOR GYPSY/TRAVELLERS ........................................................................ 51TABLE 31: OB4 MT13, PROVISION OF A GYPSY/TRAVELLER TRANSIT SITE................................................................................... 52TABLE 32:OB4 MT14, NUMBER OF GYPSY/TRAVELLER SITES FOR TRANSIT ACCOMMODATION .................................................. 53TABLE 33: OB5 MT1, APPLICATIONS PERMITTED ADVERSELY AFFECTING SITES WITH HISTORICAL VALUE .................................. 54TABLE 34: OB6 MT1, DEVELOPMENT WHICH RESULTS IN THE LOSS OF SSSI OR SINC.................................................................. 55TABLE 35: OB6 MT2, PROTECTED WOODLAND AND TREES LOST TO DEVELOPMENT.................................................................. 55TABLE 36: OB6 MT3, NUMBER OF DEVELOPMENTS PERMITTED WITHIN THE GREEN BELT OR GREEN WEDGE............................ 56TABLE 37: OB7 MT1, COMMUNITY FACILITIES LOST TO ALTERNATIVE FORMS OF DEVELOPMENT .............................................. 57TABLE 38: OB7 MT2, INCREASE SUSTAINABLE FORMS OF TRANSPORT....................................................................................... 57TABLE 39: OB10 MT1, NEWPORT'S WASTE CAPACITY ................................................................................................................ 59TABLE 40: SA OBJECTIVE 1......................................................................................................................................................... 61TABLE 41: SA OBJECTIVE 2......................................................................................................................................................... 62TABLE 42: SA OBJECTIVE 3......................................................................................................................................................... 63TABLE 43: SA OBJECTIVE 4......................................................................................................................................................... 64TABLE 44: SA OBJECTIVE 5......................................................................................................................................................... 64TABLE 45: SA OBJECTIVE 6......................................................................................................................................................... 65TABLE 46: SA OBJECTIVE 7......................................................................................................................................................... 65TABLE 47: SA OBJECTIVE 8......................................................................................................................................................... 66TABLE 48: SA OBJECTIVE 9......................................................................................................................................................... 67TABLE 49: SA OBJECTIVE 10....................................................................................................................................................... 68TABLE 50: SA OBJECTIVE 11....................................................................................................................................................... 69TABLE 51: SA OBJECTIVE 12....................................................................................................................................................... 69

Newport City Council | Annual Monitoring Report 2016-175
TABLE 52: SA OBJECTIVE 13....................................................................................................................................................... 70TABLE 53: SA OBJECTIVE 14....................................................................................................................................................... 71TABLE 54: SA OBJECTIVE 15....................................................................................................................................................... 72TABLE 55: SA OBJECTIVE 16....................................................................................................................................................... 73TABLE 56: SA OBJECTIVE 17....................................................................................................................................................... 75TABLE 57: SA OBJECTIVE 18....................................................................................................................................................... 76TABLE 58: SA OBJECTIVE 19....................................................................................................................................................... 77TABLE 59: SA OBJECTIVE 20....................................................................................................................................................... 78TABLE 60: SA OBJECTIVE 21....................................................................................................................................................... 79TABLE 61: SA OBJECTIVE 22....................................................................................................................................................... 80TABLE 62: SA OBJECTIVE 23....................................................................................................................................................... 81TABLE 63: SA OBJECTIVE 24....................................................................................................................................................... 82TABLE 64: SA OBJECTIVE 25....................................................................................................................................................... 83TABLE 65: SA OBJECTIVE 26....................................................................................................................................................... 85TABLE 66: CONTEXTUAL INDICATORS ........................................................................................................................................ 91TABLE 67: CORE AND LOCAL INDICATORS.................................................................................................................................. 92TABLE 68: SUSTAINABILITY APPRAISAL INDICATORS .................................................................................................................. 96TABLE 69: PROGRESS MADE ON LDP HOUSING ALLOCATIONS AS OF 1 APRIL 2017................................................................... 105TABLE 70: PROGRESS MADE ON DELIVERY OF GYPSY/TRAVELLER ALLOCATION........................................................................ 108TABLE 71: PROGRESS MADE ON DELIVERY OF EMPLOYMENT LAND ALLOCATIONS................................................................... 108TABLE 72: PROGRESS MADE ON DELIVERY OF EDUCATION ALLOCATIONS................................................................................ 109TABLE 73: CHANGES TO MONITORING INDICATORS................................................................................................................. 111
LIST OF FIGURES
FIGURE 1: NEWPORT FOOTBRIDGE.............................................................................................................................................. 9FIGURE 2: AVERAGE HOUSE PRICES IN NEWPORT AND WALES .................................................................................................. 13FIGURE 3: AVERAGE HOUSE PRICE BY LOCAL AUTHORITY (FEBRUARY 2017) .............................................................................. 13FIGURE 4: PAST HOUSING COMPLETION RATES IN NEWPORT.................................................................................................... 17FIGURE 5: CYCLOTRON ACCELERATOR BEING LIFTED INTO PLACE AT THE PROTON BEAM THERAPY CENTRE .............................. 18FIGURE 6: TOTAL REPORTED CRIME NUMBERS IN NEWPORT..................................................................................................... 22FIGURE 7: ECONOMIC ACTIVITY RATES IN NEWPORT................................................................................................................. 23FIGURE 8: COMMUTING PATTERNS IN NEWPORT...................................................................................................................... 24FIGURE 9: WHERE PEOPLE LIVING IN NEWPORT WORK (2016)................................................................................................... 24FIGURE 10: FLOOD DEFENCE WALL AT JUBILEE PARK, SITE H1 (54)............................................................................................. 28FIGURE 11: SOLAR ROOF AT NEWPORT FACTORY ...................................................................................................................... 29FIGURE 12: AMAZON WAREHOUSE, CELTIC BUSINESS PARK – SITE EM1 (VII) ............................................................................. 32FIGURE 13: JOB NUMBERS IN NEWPORT ................................................................................................................................... 34FIGURE 14: ENTRANCE TO THE NEWPORT KINGSWAY CENTRE................................................................................................... 36FIGURE 15: FRIARS WALK .......................................................................................................................................................... 38FIGURE 16: HOUSES AT JUBILEE PARK - SITE H1(54) ................................................................................................................... 41FIGURE 17: LDP HOUSING COMPLETIONS.................................................................................................................................. 42FIGURE 18: HOUSING DELIVERY RATES AT GLAN LLYN ............................................................................................................... 45FIGURE 19: MANDRAKE HOUSE, JUBILEE PARK - 28 AFFORDABLE UNITS .................................................................................... 48FIGURE 20: 123-129 COMMERCIAL RD, HORNBLOWER SITE....................................................................................................... 50FIGURE 21: PITCH AND AMENITY BLOCK DESIGN AT HARTRIDGE FARM ROAD ........................................................................... 52FIGURE 22: GREEN BELT BETWEEN NEWPORT AND CARDIFF ..................................................................................................... 56FIGURE 23: CARDIFF CAPITAL REGION METRO........................................................................................................................... 58FIGURE 24: NEWPORT EMPLOYMENT SECTORS 2015................................................................................................................. 80FIGURE 25: NEWPORT CITY CENTRE, COMMERCIAL ST. FOOTFALL............................................................................................. 86FIGURE 26: RESIDENT SATISFACTION IN NEWPORT.................................................................................................................... 87

Newport City Council | Annual Monitoring Report 2016-176
1. EXECUTIVE SUMMARY1.1. The Newport LDP was adopted on 27 January 2015 and sets out the land use policies which form the basis on
which planning decisions about future development in Newport are based. As part of the statutory development plan process, the Council is required to prepare an Annual Monitoring Report (AMR).
1.2. This is the second AMR to be prepared since the adoption of the LDP. It provides the basis for monitoring the effectiveness of the policies within the LDP and is the main mechanism for reviewing the relevance and performance of the LDP. It also identifies whether any changes are necessary.
1.3. This AMR will primarily focus on the period 1 April 2016 to 31 March 2017, and will build on the baseline formed by last year’s AMR.
KEY FINDINGS
1.4. The following section will summarise the key findings that have emerged throughout the AMR process.
Contextual Changes
1.5. Section 3 of the AMR contains a detailed analysis of the global, national, regional and local changes that have occurred since the adoption of the LDP. The most noteworthy relates to the 2017 General Election, Brexit and the economy.
1.6. The consequences of the Brexit vote in June 2016 remain uncertain as the British Government and European Union attempt to negotiate a deal. It is probably fair to say that the major economic downturn that some commentators predicted following the ‘leave’ vote has not materialised, however, the consequences of the weak pound have had a negative impact on imports, causing clothing and food prices to increase, consequently keeping UK inflation at its highest level for more than three years. There are signs that house prices are falling in areas of the UK, but evidence suggests that house prices in Newport are still increasing, and with record housing completion figures this year, Brexit does not seem to have had a negative impact on the Newport housing market at this stage.
1.7. Nevertheless, the effects of Brexit are still very much unknown. The General Election held in June 2017 was called in an attempt to bolster the Conservative Party’s Government majority and potentially offer more stability in negotiations on Europe. However, the Conservative Party lost seats and lost its overall majority. Consequently, they formed an alliance with the Northern Irish Democratic Unionist Party in order to govern with an effective majority. It is a well-known fact that markets do not react well to uncertainty and next year’s AMR may give more of a clue as to whether Brexit is going to impact on Newport’s housing market.
1.8. The AMR records fours contextual indicators which help to provide the broader environmental, social and economic picture of Newport. The key findings are summarised below:
Contextual Indicators
Positive outcome 1Mixed outcome 0Negative outcome 3

Newport City Council | Annual Monitoring Report 2016-177
The number of Newport Lower Super Output Areas in the most deprived parts of Wales has remained the same, with a slight improvement recorded from the 2011 Wales Index of Multiple Deprivation.
Disappointingly, reported crime rates have risen for the fourth consecutive year; this is a national trend and not exclusive to Newport.
The economic activity rate in Newport has fallen and is below the Wales average and well below the UK average.
The percentage of residents commuting out of Newport has risen for the second year, which is a concern in the quest to create a sustainable city, but understandable given the juxtaposition between Cardiff and Bristol.
1.9. The above contextual indicators paint a slightly gloomy picture of the City, but there appears to be limited evidence of this actually on the ground, as the record housing completions and other core and local indicators demonstrate below.
Core and Local Indicators
1.10. The AMR records 35 core and local indicators which are essential to monitoring the effectiveness of the LDP and ensuring the LDP Strategy is being delivered. A summary of the outcomes are shown below:
Core and Local Indicators
Positive outcome 16
Training required 7
SPG required 0
Further research 12
Policy review 0
Plan review 0
99.9% of housing developed on brownfield land A 5 year housing land supply has been maintained 3,649 new homes delivered in the Plan period so far (only 124 units short of the LDP target) 575 affordable homes delivered in the Plan period so far (149 units short of the LDP target) Over 11ha of new employment land has been created in the Plan period so far, 4.46ha is on EM1
allocations No greenfield land or protected woodland has been lost contrary to policy Commercial vacancy rates in the City Centre are down Jobs growth has fallen below the predicted level for the first time during the Plan period Waste and recycling figures are positive

Newport City Council | Annual Monitoring Report 2016-178
Number of indicators identified as ‘blue’ (training required) for second year running – Mineral safeguarding, employment land lost, community facilities lost and development permitted on the Green Wedge
Further training required with regard to environmental space, permissions affecting SSSIs and SINCs and permissions affecting historical assets
Progress has been made with the strategic housing site at Llanwern Village, with commencement expected later this year
Further research required with regard to the City Centre retail policies, development on floodplains and delivery of Gypsy/Traveller accommodation
Sustainability Appraisal Indicators
1.11. The sustainability appraisal indicators are designed to monitor and measure the social, environmental and economic effects of the LDP. There are 83 indicators and the key findings are summarised below:
Sustainability Appraisal Indicators
Significant positive effects predicted 44
Mix of positive and negative effects predicted 30
Significant negative effects predicted 4
Baseline set - No data available for comparison 6
Determined applications helped to protect and enhance biodiversity Land is used efficiently and agricultural land is protected Carbon dioxide emissions have fallen Numbers of applications contributing to affordable housing has increased slightly Percentage of people feeling safe in Newport has increased Newport’s unemployment rate continues to fall Gross weekly earnings are increasing Community services in Newport are increasing Average annual electricity consumption has decreased since 2011 Increase in independent retailers in the City Centre There are fewer vacant commercial units in the City Centre Targets for energy from waste and waste sent to landfill are on track Residents’ satisfaction with living in Newport is increasing Pupils in Welsh medium education is increasing Railway usage in Newport has increased City Centre footfall has decreased Development affecting Special Landscape Areas is still not being picked up fully Air Quality Management Areas are increasing Loss of community facilities contrary to policy remains a concern Number of people on the housing waiting list is increasing Tourism statistics for Newport remain positive
Newport City Council | Annual Monitoring Report 2016-179
Number of students staying in Newport following study has fallen
ASSESSMENT AND CONCLUSION
1.12. The overall conclusion is that significant progress is being made in Newport, especially with regard to housing growth. The LDP has been in place since January 2015, and its Strategy, key aims and objectives are all being realised. Following a consideration of the evidence gathered, there is no indication that there is a need for a full or partial review of the LDP at this stage.
FIGURE 1: NEWPORT FOOTBRIDGE

Newport City Council | Annual Monitoring Report 2016-1710
2. INTRODUCTION2.1. The Newport Local Development Plan (2011 to 2026) was formally adopted on 27 January 2015. The LDP
sets out the land use policies which form the basis on which planning decisions about future development in Newport are based.
2.2. As part of the statutory development plan process, following the adoption of a LDP, an Annual Monitoring Report (AMR) is required. The AMR is fundamental in assessing the progress and effectiveness of the LDP. This is the second AMR to be prepared since the adoption of the Newport LDP. Therefore the AMR continues to provide an important opportunity for the Council to assess the impact the LDP is having in its infancy period. This AMR will primarily focus on the period 1 April 2016 to 31 March 2017, but the baseline provided in last year’s AMR has meant that certain trends have started to emerge, which will be discussed and analysed in more detail throughout the document.
LDP VISION, STRATEGY AND OBJECTIVES
2.3. The LDP vision is:
As a gateway to Wales, Newport will be a centre of regeneration that celebrates its culture and heritage, while being a focus for varied economic growth that will strengthen its contribution to the region. It will be a place that people recognise as a lively, dynamic, growing city, with communities living in harmony in a unique natural environment.
2.4. In order to achieve this vision, the LDP focuses on a sustainable development strategy with particular emphasis on regeneration, building on the culture and heritage of the City, seeking to maximise the use of previously developed (brownfield) land. To achieve the aim of the overall vision, the LDP defines 10 individual objectives which seek to address key issues. The objectives are:
1. Sustainable Use of Land2. Climate Change3. Economic Growth4. Housing Provision5. Conservation of the Built Environment6. Conservation of the Natural Environment7. Community Facilities and Infrastructure8. Culture and Accessibility9. Health and Well-being10. Waste
2.5. These objectives and the performances recorded against them form the main section of the AMR.

Newport City Council | Annual Monitoring Report 2016-1711
AMR FORMAT
2.6. The AMR is designed to be a concise and accessible document. The format of the AMR is as follows:
Chapter 1 – Executive Summary – Provides an overall summary of the key monitoring findings of the AMR.
Chapter 2 – Introduction – Introduces the report and summaries the purpose, along with the overall structure of the AMR.
Chapter 3 – Contextual Changes – Provides a strategic overview of a variety of factors that potentially may influence the performance of the LDP, such as global economic implications as well as national legislation or local policy changes.
Chapter 4 – LDP Monitoring – Describes how the LDP objectives were monitored and provides a detailed analysis of the LDP policy framework in delivering identified targets.
Chapter 5 – Sustainability Appraisal Monitoring – Provides a commentary and assessment of the LDPs performance against the Sustainability Appraisal (including Strategic Environmental Assessment) monitoring objectives.
Chapter 6 – Conclusions and Recommendations – Gives an overview of the AMR findings and makes recommendations about issues which may require further consideration.
2.7. The AMR has been produced in accordance with the requirements of the relevant Regulations and the LDP Manual. This document will be submitted to the Welsh Government and also be made available on the Council’s website.
2.8. Appendix 3 identifies where minor changes have been made to the indicators and explains the reasoning.

Newport City Council | Annual Monitoring Report 2016-1712
3. CONTEXTUAL CHANGES3.1. This section sets out significant contextual changes that have occurred since last year’s AMR. It is important
to understand the numerous factors that may impact on the performance of the LDP, from the global and national levels, down to the Council’s own local policies and guidance. Some changes are obviously completely out of the control of the Council, but nevertheless, it is important to set out what they are and how they may influence the LDP, in order for the local planning authority to prepare accordingly and consider whether changes might be necessary to the LDP.
3.2. In addition to this section, the AMR contains four contextual indicators based on the Welsh Index of Multiple Deprivation, crime rates, economic activity and commuting patterns, which are discussed in more detail in Section 4.
GLOBAL AND NATIONAL INFLUENCES
Brexit and the Economy
3.3. Concern about the UK’s economy following the Brexit vote in June 2016 sent the pound tumbling to a 30 year low against the dollar. The talk of a potential ‘hard’ Brexit sent it down further in October 2016, before making a slight recovery following the announcement of the June 2017 general election.
3.4. The weak pound has consequently had a negative impact on imports, causing food and clothing prices to increase, which consequently has kept the UK’s inflation rate at its highest level for more than three years. There are signs that house prices are steadying and even falling in certain areas of the UK, but this is not the case in Newport (as evidenced below).
3.5. The effects of Brexit are still very much unknown as the British Government and European Union attempt to negotiate a deal. The general election on 8 June 2017 resulted in an unexpected hung parliament with the Conservative Party gaining the largest number of seats, but forming an alliance with the Northern Irish Democratic Unionist Party in an attempt to form a more stable government.
3.6. Markets generally do not react positively to uncertainty, and it is likely this period of uncertainty will last for some time as the UK seeks to negotiate its breakaway from the European Union.
Housing Market
3.7. As demonstrated in Figure 2, the average house price in Newport (as of February 2017) was �153,338, compared to the Wales average of �145,293. Over the last year, average house prices in Newport have increased by 6.6%, whilst the Wales average has only increased by 1.8%. The Figure 2 graph demonstrates that the gap is widening between house prices in Wales and Newport. The gap is the largest it has been since the introduction on the LDP.
3.8. Figure 3 shows how the Newport average house price compares to the other local authorities in Wales.Newport is identified as light green in the �150k to �170k band. The Newport average house price is still above the Valley Authorities, but below the more affluent areas of Monmouthshire, Cardiff and The Vale of Glamorgan. However, in last year’s AMR, it was reported that Newport was comparable to Swansea and Bridgend, but this year, average house prices in Newport have moved into the band above Swansea and Bridgend. There does seem to be evidence emerging in Figures 2 and 3 which suggest that Newport house

Newport City Council | Annual Monitoring Report 2016-1713
prices are increasing at a faster rate than other parts of Wales. There is an evidenced link between house prices and general prosperity, and this emerging evidence is arguably suggesting that Newport is becoming more prosperous.
FIGURE 2: AVERAGE HOUSE PRICES IN NEWPORT AND WALES
Source: UK House Price Index, Land Registry
FIGURE 3: AVERAGE HOUSE PRICE BY LOCAL AUTHORITY (FEBRUARY 2017)
Source: UK House Price Index (Wales), Land Registry
120000
125000
130000
135000
140000
145000
150000
155000
160000
2011 2012 2013 2014 2015 2016 2017
Newport
Wales

Newport City Council | Annual Monitoring Report 2016-1714
LEGISLATION AND NATIONAL POLICY
3.9. The Council has to consider whether changes to national planning policy and legislation will have any implications for the LDP. If the implications are significant, the Council will need to determine how it addresses these issues. Since the 2016 AMR was published, no new legislation of relevance to the planning system has been introduced in Wales. However, there has been an update to Planning Policy Wales and some Technical Advice Notes.
National Planning Policy Amendments
Planning Policy Wales (Edition 9, November 2016)
3.10. On 17 November 2016, Edition 9 of Planning Policy Wales (PPW) was published which incorporates changes to describe the provisions of the Planning (Wales) Act 2015 and Well-being of Future Generations (Wales) Act 2015. It also updated and incorporated Welsh Government’s planning policy for retail and commercial development and the historic environment.
3.11. Chapter 1 of PPW has been updated to reflect the introduction of both the ‘Planning Performance Framework’ and the validation appeals policy expectations.
3.12. Chapter 2, on the Local Development Plan (LDP) process, has been updated to take account of changes in legislation. Some procedural elements that are now covered in the LDP Manual (Edition 2, 2015) have also been removed.
3.13. The procedural content of Chapter 3 concerning Development Management has been streamlined as a result of the publication of the Development Management Manual. The revised chapter also now includes reference to ‘Developments of National Significance’ following the implementation of the relevant Regulations related to the Planning (Wales) Act 2015.
3.14. Chapter 4 has been updated to include the statutory purpose of the planning system which was introduced by the Planning (Wales) Act 2015. There have also been amendments to take account of the implementation of the Well-being of Future Generations (Wales) Act 2015 and Design and Access Statements linked to the Planning (Wales) Act.
3.15. Chapter 6 covering the historic environment has been fully revised in conjunction with Cadw following Royal Assent of the Historic Environment (Wales) Act 2016.
3.16. Chapter 10 has been refreshed to update the Welsh Government’s planning policy for retail and commercial development. The requirement remains to consider retail and commercial centres first and complementary uses, as well as the requirements for retail need and sequential tests and the undertaking of impact assessments where appropriate.
3.17. The above changes to PPW have not resulted in a need to review the LDP or change it in any way.

Newport City Council | Annual Monitoring Report 2016-1715
Technical Advice Note (TAN) 4 – Retail and Commercial Development (2016)
3.18. The previous TAN4 was published in 1996 and has been amended to reflect a more up to date position on planning retail and commercial development. The requirement remains to consider retail and commercial centres first and complementary uses, as well as the requirements for retail need and sequential tests and the undertaking of impact assessments where appropriate. The TAN introduces aspects such as Local Development Orders and retail planning conditions.
Technical Advice Note (TAN) 24- The Historic Environment (2017)
3.19. To complement the provisions contained in the Historic Environment (Wales) Act 2016 and Planning Policy Wales Chapter 6: The Historic Environment, a new Technical Advice Note 24: The Historic Environment Acthas been published (31 May 2017). It provides further information and detailed planning guidance to fully reflect how the historic environment should be considered through the planning process.
3.20. Again, the changes to the TANs have not resulted in any major consequences which might warrant a review or changes to the LDP.
REGIONAL, LOCAL POLICY AND GUIDANCE
Regional Context
Cardiff Capital Region City Deal
3.21. The UK Government has agreed to a �1.28bn City Deal for the Cardiff Capital Region in partnership with the Welsh Government and ten Local Authorities, including Newport City Council. The agreement includes investment in the regions infrastructure, creation of a non-statutory Regional Transport Authority, development of capabilities in compound semiconductor applications, creation of Skills and Employment Board, future employment support, Regional Business organisation and commitment to a partnership approach to housing and regeneration.
3.22. Various meetings are being held at present to discuss how best to proceed with the City Deal. A housing theme group has been established with the aim of increasing house building across the South East Wales region. Initiatives are still at an early stage, but are likely to focus on attempting to assist current stalled LDP sites as opposed to introducing new land. The LDP will need to respond to the City Deal; however it is too early in the process for there to have been an impact on the LDP, and it’s likely it will be more of an issue at Plan review stage when new sites are introduced.
3.23. In terms of investment to date, the Cardiff Capital Regional Cabinet has agreed to invest �37.9m to support the development of a Compound Semiconductor industry cluster, this will be located in West Newport at the empty former LG unit. This project is expected to leverage up to �375m of private sector investment over the next five years and create up to 2,000 high value and high-tech jobs. There is also potential for hundreds more jobs in the wider supply chain and cluster development in Newport and surrounding areas. The LDP

Newport City Council | Annual Monitoring Report 2016-1716
has already allocated 38.5ha of employment land in this location, which would be ideal for further expansion, along with supporting or compatible businesses.
Local Context
Community Infrastructure Levy
3.24. The Community Infrastructure Levy (CIL) is a new charging mechanism for securing financial contributions from developers. The Council consulted on preliminary draft CIL rates during summer 2015 and in February and March 2016 consulted on a CIL Draft Charging Schedule with the proposed CIL rates. The Council submitted its CIL proposals to the Planning Inspectorate for independent examination who subsequently recommended the CIL Draft Charging Schedule is implemented. It was the Council’s intention to introduce the CIL to Newport on 1 April 2017, however, in the run-up to this date, a report was released entitled ‘A New Approach to Developer Contributions’. This report was written by a purposely appointed CIL Review Team who were tasked with ‘assessing the extent to which CIL does or can provide an effective mechanism for funding infrastructure, and to recommend changes that would improve its operation in support of the UK Government’s wider housing and growth objectives’.
3.25. The key recommendation in the report suggests that the UK Government should replace the CIL with a hybrid system of a broad and low level Local Infrastructure Tariff (LIT) and Section 106 for larger developments. The report also includes 37 supplementary recommendations. In addition to this, CIL was a late addition to the Wales Bill which received Royal Assent on 31 January 2017. As a result, CIL will be devolved to Wales in the near future. New CIL regulations for Wales are expected to be introduced next year.
3.26. As a result of the recommendations being proposed at the UK Government level, and the pending devolution of CIL to the Welsh Government, there are major changes on the horizon. It was therefore decided that the Council does not progress any further with CIL and wait for the changes to take effect before making a decision on how to progress. In the meantime, justified developer contributions will continue to be sought through Section 106.
Joint Housing Land Availability Study 2017
3.27. Newport has maintained a five year housing land supply since the adoption of the LDP.
2015 – 6.3 years 2016 – 5.9 years 2017 – 6.1 years
3.28. As noted above, the 2017 published Joint Housing Land Availability Study recorded a 6.1 year housing supply. The housing completions for Newport in 2015/16 were 908, which was the highest completion figure in over 25 years, however, these were exceeded in 2016/17 with completions of 952. The high completion figuresclearly demonstrate confidence in the Newport housing market at present and shows that the LDP Strategy is going in the right direction.

Newport City Council | Annual Monitoring Report 2016-1717
FIGURE 4: PAST HOUSING COMPLETION RATES IN NEWPORT
Vibrant and Viable Places
3.29. The Vibrant and Viable Places programme was completed in March 2017. It has provided 204 new city homes across a range of tenures, and created or refurbished 7,891 square metres of commercial space. The core investment of just over �14m has resulted in an additional �7m of investment being leveraged into the city centre to date, with several projects on-going. This activity has created over 600 jobs and engaged a further 700 economically inactive people in work or training opportunities. In particular, the local construction industry has been a major beneficiary of the scheme, with more than 40 contractors engaged in the delivery of capital projects with a total value of almost �5m.
Planning applications of significance
3.30. The Council has continued to receive hundreds of planning applications, including significant housing projects, such as further phases on Glan Llyn and Jubilee Park, however, there have not been any significant planning applications approved this year on the same scale as last year. Worthy of note is the conversion of the vacant former Carcraft site from a showroom to 5,000 sqm of B1/B2 and B8 space. This demonstrates confidence in providing significant employment land in Newport. However, as noted above, there have notbeen any approved applications of meaningful significance since last year.
3.31. Of the significant applications listed in last year’s AMR, the Wales International Convention Centre (at Celtic Manor) is under construction with opening estimated for 2019. The Proton Beam Therapy Centre at Celtic Springs is expected to be operational later this year. Construction is close to completion and the hi-tech machines which are expected to treat over 500 patients a year are understood to be in place. Construction of the Duffryn Welsh Medium Secondary School is also well advanced with elements of the school building opening to pupils at the start of term in September 2017.
0
100
200
300
400
500
600
700
800
900
1000
1991
/92
1992
/93
1993
/94
1994
/95
1995
/96
1996
/97
1997
/98
1998
/99
1999
/00
2000
/01
2001
/02
2002
/03
2003
/04
2004
/05
2005
/06
2006
/07
2007
/08
2008
/09
2009
/10
2010
/11
2011
/12
2012
/13
2013
/14
2014
/15
2015
/16
2016
/17

Newport City Council | Annual Monitoring Report 2016-1718
FIGURE 5: CYCLOTRON ACCELERATOR BEING LIFTED INTO PLACE AT THE PROTON BEAM THERAPY CENTRE
Supplementary Planning Guidance (SPG)
3.32. In the 2016/17, the following SPGs have been adopted.
Mineral Safeguarding Outdoor Play Space Provision Trees, Woodland, Hedgerows and Development Sites Housing in Multiple Occupation (update)
3.33. The SPGs are key in supporting the delivery of the LDP. The Mineral Safeguarding SPG provides information to assist with the consideration of planning applications on minerals safeguarding areas for hard rock, and sand & gravel within Newport. This SPG was created to help support the introduction of a new LDP policy which planning officers had limited familiarity with.
3.34. The Outdoor Play Space Provision SPG provides additional guidance on the Council’s approach to public recreation space provision for new residential development. The Trees, Woodland, Hedgerows and Development Sites SPG is designed to help create high quality sustainable urban and rural landscapes where trees, woodlands and hedges are a key element and important design feature. Finally, the Housing in Multiple Occupation SPG is an updated version of the previously adopted document. The update was necessary in order to reflect the changes in the planning use class order and the introduction of the new C4 use class (houses in multiple occupation).

Newport City Council | Annual Monitoring Report 2016-1719
4. LDP MONITORING
4.1. This is the second AMR to be prepared since the LDP was adopted in January 2015. The 2016 AMR provided an opportunity to assess the initial impacts that the LDP was having on the social, economic and environmental well-being of the City. Where these impacts could not be fully analysed, baselines were set. This 2017 AMR now provides the opportunity to further explore the impacts and to build upon the baselines which were set last year in order to discover whether any trends are starting to emerge.
MONITORING PROCESS
4.2. In terms of how the LDP is monitored, all planning applications determined in 2016/17 by the Council are initially considered. These are then refined to exclude all householder applications and most applications for discharge/renewal of conditions. This left a list of 169 relevant planning applications which planning policy officers could gather information from in order to assess the LDP and to compile evidence for this AMR. Refusals and successful appeal outcomes were also recorded.
4.3. Information on the 169 planning applications was collected and stored in a purposely constructed spreadsheet with 88 column headings. The 88 column headings were based on the information necessary to complete the indicators throughout the AMR. The AMR has four sets of indicators; Contextual, Core, Local and the Sustainability Appraisal indicators. The commentary and analysis of these indicators is set out in this section and section 5.
CONTEXTUAL INDICATORS
4.4. The Welsh Government has deemed it appropriate for an authority to include some contextual indicators in the monitoring framework in order to describe the background against which the LDP policy operates. The contextual indicators will be colour coded and assessed depending on their outcome as per the table below.
Colour OutcomeGreen Positive outcome – on targetOrange Mixed outcomeRed Negative outcome – not on target
4.5. The following contextual indicators have been monitored in order to provide a broader environmental, social and economic picture of Newport and the LDP.

Newport City Council | Annual Monitoring Report 2016-1720
TABLE 1: CONTEXTUAL INDICATOR 1, MOST DEPRIVED AREAS IN NEWPORT COMPARED TO WALES AS A WHOLE
CONTEXTUAL INDICATORS SOURCE OF INFORMATION MONITORING TARGET TRIGGER POINT
Number of Lower Super Output Areas (LSOA) in the 10% most deprived LSOAs in Wales.
Welsh Index of Multiple Deprivation
The number of Newport LSOAs in the 10% most deprived LSOAs in Wales decreases.
The number of Newport LSOAs in the 10% most deprived LSOAs in Wales increases.
OUTCOME: 14 Newport LSOAs in the 10% most deprived LSOAs in Wales. A reduction of 1 from the 2011 Welsh Index of Multiple Deprivation.
COLOUR LAST YEAR: GREENCOMMENTARY AND ANALYSIS OF OUTCOME:
A Lower Super Output Area (LSOA) is a geographic area which is primarily referred to when collecting statistics. There are 1,909 LSOAs in Wales. The LSOAs ranked between 1 and 190 are the 10% most deprived LSOAs in Wales.The below table identifies the Newport LSOAs in the 10% most deprived LSOAs in the 2011 and 2014 Welsh Index of Multiple Deprivation (WIMD).
LSOAs 2011 WIMD Wales Rank LSOAs 2014 WIMD Wales Rank
1. Pillgwenlly 32. Pillgwenlly 43. Pillgwenlly 14. Tredegar Park 25. Alway 26. Alway 47. Ringland 58. Bettws 19. Lliswerry 510. Bettws 311. Malpas 212. Ringland 413. Ringland 614. Lliswerry 215. Victoria 4
202728406574
100126127139142158159177179
1. Pillgwenlly 42. Pillgwenlly 13. Alway 24. Tredegar Park 25. Alway 46. Ringland 57. Bettws 18. Pillgwenlly 39. Malpas 210. Bettws 311. Ringland 412. Stow Hill 313. Bettws 514. Lliswerry 2
1115384169757697
112121127161164187
There were 15 Newport LSOAs in the 10% most deprived LSOAs in Wales in 2011; in the most recent 2014 WIMD, there are 14. This shift represents a modest improvement and demonstrates Newport is moving in the right direction. Lliswery 5, Victoria 4 and Ringland 6 have all moved out of the 10% most deprived. Lliswery 5 hasimproved from rank 127 to 223, Ringland 6 has improved from rank 159 to 202, and Victoria 4 has improved from rank 179 to 254. However, Stow Hill 3 and Bettws 5 (shown in bold) are now within the 10% most deprived, whereas they were previously ranked 224 and 266 respectively.
The WIMD looks at 8 factors: Income; Employment; Health; Education; Access to Services; Community Safety; Physical Environment; and Housing. Lliswery 5, Ringland 6 and Victoria 4 have all experienced significant increases in income and employment which have helped them move out of the 10% most deprived area. Lliswery 5 has also experienced a significant increase in ‘Access to Services’. This LSOA contains Newport Retail Park and the progress in this factor underlines the increased services being offered at the Retail Park District Centre. Ringland 6 has also had
Source: www.statswales.wales.gov.uk

Newport City Council | Annual Monitoring Report 2016-1721
increases with respect to its health and education rankings as well.
Stow Hill 3 and Bettws 5 have experienced falls in income and employment which has resulted in them falling into the 10% most deprived areas in Wales. Stow Hill 3 covers a significant area of Newport City Centre and although it scores reasonably well in terms of ‘Access to Services’, its ranking has fallen significantly between 2011 and 2014.This represented the impacts of the recession and the negative consequences it had on City Centre services, especially retail. It is expected that the opening of Friars Walk and other regeneration initiatives in the City Centre will restore and improve Stow Hill 3’s rank in this factor, which should consequently bring it out of the 10% most deprived in the near future.
There has been little change amongst the remaining LSOAs. Regeneration projects currently underway in the Pillgwenlly areas will hopefully help to improve these parts of Newport and help them to move upwards in the overall rankings.
The WIMD is only updated every 3 years; therefore it is not possible to monitor this indicator on an annual basis. The next WIMD should be released in 2017.
TABLE 2: CONTEXTUAL INDICATOR 2, NUMBER OF REPORTED CRIME INCIDENTS BY TYPE AS A TOTAL
CONTEXTUAL INDICATORS SOURCE OF INFORMATION MONITORING TARGET TRIGGER POINT
The number of reported crime incidents by type as a total.
UK Crime Statistics, Home Office
The number of reported crime incidents decreases.
The number of reported crime incidents increases for 2 or more consecutive years.
OUTCOME: 23,252 crimes reported in Newport between April 2016 and March 2017. An increase of 1,871 from the previous year. 4 consecutive years where reported crime has increased.
COLOUR LAST YEAR: REDCOMMENTARY AND ANALYSIS OF OUTCOME:
The fall in reported crime from 2011/12 to 2012/13 at the start of the Plan period is significant and positive, but the steady increase from April 2013 to March 2017 is a concern. The UK national trend for the last four years also indicates an increase in total reported crime; therefore Newport’s figures mirror the UK national picture.
This contextual indicator has been marked as red because reported crime is increasing. It does not necessarily mean that the LDP Strategy is failing. The contextual indicators simply provide a broader picture of how Newport is performing. The LDP itself is unlikely to have a significant impact on crime rates in Newport.
Please see Figure 6 for total report crimes in Newport:

Newport City Council | Annual Monitoring Report 2016-1722
FIGURE 6: TOTAL REPORTED CRIME NUMBERS IN NEWPORT
Source: www.ukcrimestats.com
TABLE 3: CONTEXTUAL INDICATOR 3, ECONOMIC ACTIVITY RATES OF NEWPORT RESIDENTS
CONTEXTUAL INDICATORS SOURCE OF INFORMATION MONITORING TARGET TRIGGER POINT
Economic activity rates of Newport residents
Regional Labour Market Statistics (ONS) and Stats Wales
The percentage of the economically active population increases.
The percentage of population economically active decreases for 2 consecutive years.
OUTCOME: The economic activity rate in Newport is recorded at 73.6. A decrease of 0.3 from the previous year and 1.7 from 2014.
COLOUR LAST YEAR: GREENCOMMENTARY AND ANALYSIS OF OUTCOME:
The economic activity rate is a percentage of those aged 16-64 years compared to the total population. The rate in Newport between 2011 and 2016 appears quite erratic, particularly due to a significant spike in 2012 when the Newport rate increased above the UK average. The economic activity rates between 2011 and 2015 have been updated by Welsh Government since the publication of last year’s AMR. It is understood that statistics, particularly relating to population, can be fluid for a number of years before finally being fixed. As a result, last year’s indicator was recorded as green based on data which has now been superseded. Therefore caution should be applied when interpreting this indicator.
The downward trend in Newport’s economic activity rate, compared to the upward trend in the UK rate and more
Apr 11-Mar12
Apr 12-Mar13
Apr 13-Mar14
Apr 14-Mar15
Apr 15-Mar16
Apr 16-Mar17
Total Crimes 29,913 17,121 16,782 19,631 21,381 23,252
0
5,000
10,000
15,000
20,000
25,000
30,000
35,000
No.
of C
rimes
Total Reported Crimes in Newport

Newport City Council | Annual Monitoring Report 2016-1723
stable Wales rate is something that may raise concern if the trend continues. As noted above, this indicator should be viewed with caution, but a more stable or upward rate is something that Newport should be aiming to achieve in order to sustain economic growth.
FIGURE 7: ECONOMIC ACTIVITY RATES IN NEWPORT
TABLE 4: CONTEXTUAL INDICATOR 4, NEWPORT RESIDENTS OUT-COMMUTING TO WORK IN LOCATIONS OUTSIDE OF THE CITY
CONTEXTUAL INDICATORS SOURCE OF INFORMATION MONITORING TARGET TRIGGER POINT
Number of Newport residents out-commuting to work in locations outside of the City boundaries
WG: Statistics on commuting in Wales – Statistical Directorate
The number of residents out-commuting decreases.
The percentage of residents out-commuting increases for 2 or more consecutive years.
OUTCOME: The percentage of residents commuting out of Newport stands at 38.6%. This is an increase from 2015 and 2014.
COLOUR LAST YEAR: ORANGECOMMENTARY AND ANALYSIS OF OUTCOME:
The overall number of Newport residents working within Newport has risen, but the total percentage of people working outside of Newport has also risen. As a result, the indicator is red.
Figure 8 below identifies the commuting patterns of Newport residents and Figure 9 demonstrates where people in Newport go to work. Newport’s location, along with the M4 corridor, between Cardiff and Bristol, make the City attractive to commuters. This may increase further once the Severn Bridge tolls are removed from 2019.
70
71
72
73
74
75
76
77
78
79
2011 2012 2013 2014 2015 2016
Econ
omic
Act
ivity
Rat
e
Year ending 31 December
UK
Wales
Newport
Source: www.statswales.wales.gov.uk

Newport City Council | Annual Monitoring Report 2016-1724
FIGURE 8: COMMUTING PATTERNS IN NEWPORT
2011 2012 2013 2014 2015 2016% of Newport population working within Newport 66.8 67.4 61.9 63.7 62.0 61.4% of Newport population working outside Newport 33.2 32.4 38.1 36.3 38.0 38.6
FIGURE 9: WHERE PEOPLE LIVING IN NEWPORT WORK (2016)
0
10000
20000
30000
40000
50000
60000
70000
2011 2012 2013 2014 2015 2016
No.
of P
eopl
e
No. of working residents
No. working within Newport
No. working outside Newport
Cardiff12%
Caerphilly2%
Torfaen6%
Monmouthshire6%
Newport62%
Bristol5%
Other Wales4%
Other Outside Wales
3%
Source: www.statswales.wales.gov.uk
Source: www.statswales.wales.gov.uk

Newport City Council | Annual Monitoring Report 2016-1725
CORE AND LOCAL INDICATORS
4.6. The LDP Manual sets out a number of core output indicators which are considered to be essential for assessing implementation of national policy.
4.7. The Council has also identified local indicators which are more specific to Newport and considered important in monitoring the effectiveness of the LDP.
4.8. All indicators are linked to monitoring targets which set out the position that needs to be achieved in order to help deliver the LDP Strategy. If monitoring targets are not being met, trigger points are included to assess the extent to which circumstances have diverged from the target. The trigger points will indicate if certain parts of the Plan are not achieving their desired outcomes. If these triggers points are activated, then the AMR will consider the necessary action which is required.
4.9. Options are available to the Council with respect to each indicator, monitoring target and trigger point. The AMR assesses the severity of the situation associated with each indicator and will recommend an appropriate response in accordance with the table below:
Continue Monitoring (Green)Where indicators are suggesting the LDP Policies are being implemented effectively and there is no cause for review.Training Required (Blue)Where indicators are suggesting that LDP Policies are not being implemented as intended and further officeror member training is required.Supplementary Planning Guidance Required (Purple)Indicators may suggest the need for further guidance to be provided in addition to those already identified in the Plan.Further Research (Yellow)Where indicators are suggesting the LDP Policies are not being effective as they should and further research and investigation is required.Policy Review (Orange)Where indicators are suggesting the LDP Policies are failing to implement the Strategy a formal review of the Policy is required. Further investigation and research may be required before a decision to formally review is confirmed.Plan Review (Red)Where indicators are suggesting the LDP strategy is failing and a formal review of the Plan is required. This option to fully review the Plan will need to be fully investigated and undertaken following serious consideration.
Newport City Council | Annual Monitoring Report 2016-1726
OBJECTIVE 1 – SUSTAINABLE USE OF LAND
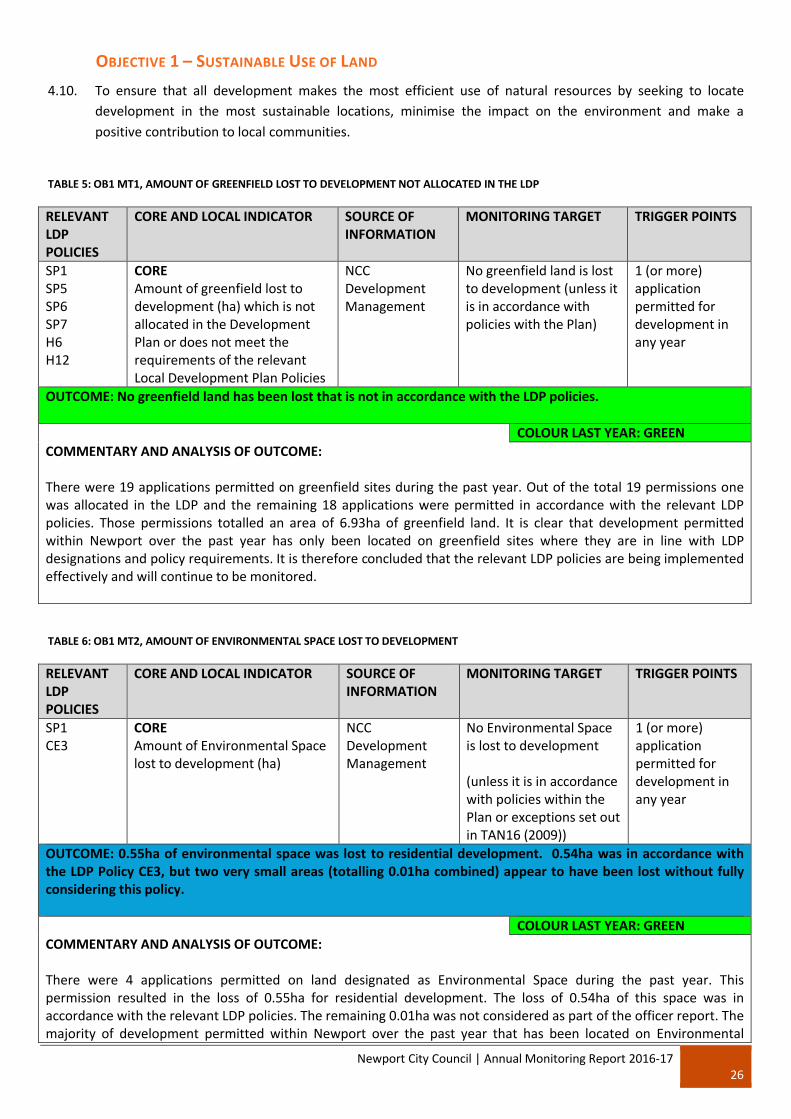
4.10. To ensure that all development makes the most efficient use of natural resources by seeking to locate development in the most sustainable locations, minimise the impact on the environment and make a positive contribution to local communities.
TABLE 5: OB1 MT1, AMOUNT OF GREENFIELD LOST TO DEVELOPMENT NOT ALLOCATED IN THE LDP
RELEVANT LDP POLICIES
CORE AND LOCAL INDICATOR SOURCE OF INFORMATION
MONITORING TARGET TRIGGER POINTS
SP1SP5SP6SP7H6H12
COREAmount of greenfield lost to development (ha) which is not allocated in the Development Plan or does not meet the requirements of the relevant Local Development Plan Policies
NCCDevelopment Management
No greenfield land is lost to development (unless it is in accordance with policies with the Plan)
1 (or more) application permitted for development in any year
OUTCOME: No greenfield land has been lost that is not in accordance with the LDP policies.
COLOUR LAST YEAR: GREENCOMMENTARY AND ANALYSIS OF OUTCOME:
There were 19 applications permitted on greenfield sites during the past year. Out of the total 19 permissions one was allocated in the LDP and the remaining 18 applications were permitted in accordance with the relevant LDP policies. Those permissions totalled an area of 6.93ha of greenfield land. It is clear that development permitted within Newport over the past year has only been located on greenfield sites where they are in line with LDP designations and policy requirements. It is therefore concluded that the relevant LDP policies are being implemented effectively and will continue to be monitored.
TABLE 6: OB1 MT2, AMOUNT OF ENVIRONMENTAL SPACE LOST TO DEVELOPMENT
RELEVANT LDP POLICIES
CORE AND LOCAL INDICATOR SOURCE OF INFORMATION
MONITORING TARGET TRIGGER POINTS
SP1CE3
COREAmount of Environmental Space lost to development (ha)
NCC Development Management
No Environmental Space is lost to development
(unless it is in accordancewith policies within the Plan or exceptions set out in TAN16 (2009))
1 (or more) application permitted for development in any year
OUTCOME: 0.55ha of environmental space was lost to residential development. 0.54ha was in accordance with the LDP Policy CE3, but two very small areas (totalling 0.01ha combined) appear to have been lost without fully considering this policy.
COLOUR LAST YEAR: GREENCOMMENTARY AND ANALYSIS OF OUTCOME:
There were 4 applications permitted on land designated as Environmental Space during the past year. This permission resulted in the loss of 0.55ha for residential development. The loss of 0.54ha of this space was in accordance with the relevant LDP policies. The remaining 0.01ha was not considered as part of the officer report. The majority of development permitted within Newport over the past year that has been located on Environmental

Newport City Council | Annual Monitoring Report 2016-1727
Space has been in line with policy requirements. A very small amount of environmental space has been lost without consideration of its impact. It is therefore concluded that this policy requires some further officer training.
TABLE 7: OB1 MT3, AMOUNT OF DEVELOPMENT PREMITTED IN C1 AND C2 FLOODPLAIN AREAS
RELEVANT LDP POLICIES
CORE AND LOCAL INDICATOR SOURCE OF INFORMATION
MONITORING TARGET TRIGGER POINTS
SP1SP3GP1
COREAmount of development (by TAN 15 paragraph 5.1 development category) permitted in C1 and C2 floodplain areas not meeting all TAN 15 (2004) tests (paragraph 6.2 i-v)
Natural Resources Wales
No permissions granted for highly vulnerable development within C1 and C2 floodplain area that does not meet all TAN 15 tests
(unless it is in accordance with TAN 15)
1 (or more) permission is given which does not meet the requirements of TAN15 in any year
OUTCOME: Further research is recommended. There are several examples of applications being approved which do not meet all of the TAN 15 tests and one was approved with an outstanding objection from NRW. Much of Newport is on the floodplain, and consequently Newport deals with a significant number of applications affected by flood risk. Discussions between NRW, Welsh Government and the Council are desirable (as well as other Councils), in order to ensure and devise consist approaches to applications in flood risk areas.
COLOUR LAST YEAR: BLUECOMMENTARY AND ANALYSIS OF OUTCOME:
There were 56 applications permitted on land within flood risk zones C1 and C2 during the past year. Five of the 56 permissions were located in flood risk zone C2, of which two permissions were considered highly vulnerable. The remaining 51 permissions were located in flood risk zone C1, of which 18 were considered highly vulnerable.
The two applications for highly vulnerable development were permitted in flood risk zone C2. One was permitted because none of the residential development was within the C2 flood zone and the applicant was made aware of therisks and access and egress was possible from the site. The other application was permitted as reserved matters for a residential scheme permitted at Outline in 2012, the flood issues were dealt with at that stage by Welsh Ministers.
Seven of the 18 highly vulnerable developments permitted in flood risk zone C1 did not meet test 4 of the TAN15 tests; i.e. the potential consequences of a flooding event for the particular type of development have been considered, and found to be acceptable. They were permitted for the following reasons:
There was no response from NRW and no mention of flood risk within the officer report, for the development of a pumping station, gas governor and electric substation.
The majority of the applications could not satisfy Tests 6 and 12 of TAN 15; that is access/egress and flood depths and velocities on the site would not comply with the standards set out in the TAN. However the assessment of the applications concluded that on balance the proposal was considered acceptable. This was due either to the regeneration benefits, the residential accommodation itself being flood free, or the flood risk was tidal and therefore more predictable nature of the rise and fall of the water.
One of the seven applications also had an objection from NRW on the basis that the evidence provided did not demonstrate that the risks and consequences of flooding could be managed in line with national planning guidance for new development. The permission was granted by a special Full Council Meeting with an outstanding objectionfrom NRW on the basis that the educational need for this development outweighs the planning policy objections made.
It is clear that around a third of development permitted within Newport over the past year has been located within a Flood Risk Zone. Of those at risk, 65% of those permitted for a highly vulnerable use could meet the tests set out in
Newport City Council | Annual Monitoring Report 2016-1728
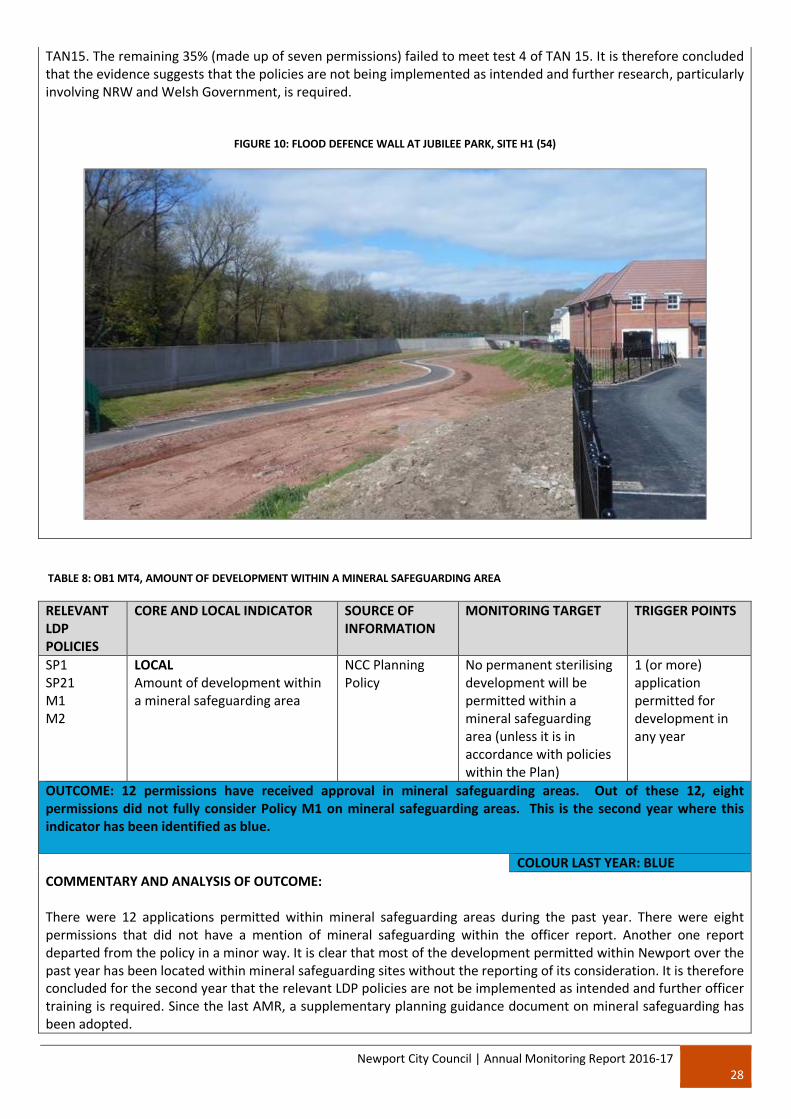
TAN15. The remaining 35% (made up of seven permissions) failed to meet test 4 of TAN 15. It is therefore concluded that the evidence suggests that the policies are not being implemented as intended and further research, particularly involving NRW and Welsh Government, is required.
FIGURE 10: FLOOD DEFENCE WALL AT JUBILEE PARK, SITE H1 (54)
TABLE 8: OB1 MT4, AMOUNT OF DEVELOPMENT WITHIN A MINERAL SAFEGUARDING AREA
RELEVANT LDP POLICIES
CORE AND LOCAL INDICATOR SOURCE OF INFORMATION
MONITORING TARGET TRIGGER POINTS
SP1SP21M1M2
LOCALAmount of development within a mineral safeguarding area
NCC Planning Policy
No permanent sterilising development will be permitted within a mineral safeguarding area (unless it is in accordance with policies within the Plan)
1 (or more) application permitted for development in any year
OUTCOME: 12 permissions have received approval in mineral safeguarding areas. Out of these 12, eight permissions did not fully consider Policy M1 on mineral safeguarding areas. This is the second year where this indicator has been identified as blue.
COLOUR LAST YEAR: BLUECOMMENTARY AND ANALYSIS OF OUTCOME:
There were 12 applications permitted within mineral safeguarding areas during the past year. There were eight permissions that did not have a mention of mineral safeguarding within the officer report. Another one report departed from the policy in a minor way. It is clear that most of the development permitted within Newport over the past year has been located within mineral safeguarding sites without the reporting of its consideration. It is therefore concluded for the second year that the relevant LDP policies are not be implemented as intended and further officer training is required. Since the last AMR, a supplementary planning guidance document on mineral safeguarding has been adopted.

Newport City Council | Annual Monitoring Report 2016-1729
OBJECTIVE 2 – CLIMATE CHANGE
4.11. To ensure that development and land uses in Newport make a positive contribution to minimising, adapting to or mitigating against the causes and impacts of climate change, by incorporating the principles or sustainable design, changes to travel behaviour, managing the risks and consequences of flooding, and improving efficiency in the use of energy, waste and water.
TABLE 9: OB2 MT1, NUMBER AND CAPACITY OF RENEWABLE ENERGY DEVELOPMENTS PERMITTED
RELEVANT LDP POLICIES
CORE AND LOCAL INDICATOR SOURCE OF INFORMATION
MONITORING TARGET TRIGGER POINTS
GP1CE10
LOCALNumber and capacity of renewable energy developments permitted
NCC Development Management
An increase in the number of renewable energy schemes permitted
No trigger identified
OUTCOME: 1 renewable energy scheme has been approved with a total capacity of 0.998MW.
COLOUR LAST YEAR: GREENCOMMENTARY AND ANALYSIS OF OUTCOME:
One planning application was approved for a renewable energy development (biomass heater) during 2016/17compared to 4 during 2015/16. It is expected that this is partly attributed to the ceasing of the Government funded subsidy available for such developments. No trigger point has been identified for this indicator, but it has been recorded as green as the granting of one scheme is considered a positive result.
Year No. of Applications Total Energy Capacity (MW)2015/16 4 21.062016/17 1 0.998
FIGURE 11: SOLAR ROOF AT NEWPORT FACTORY
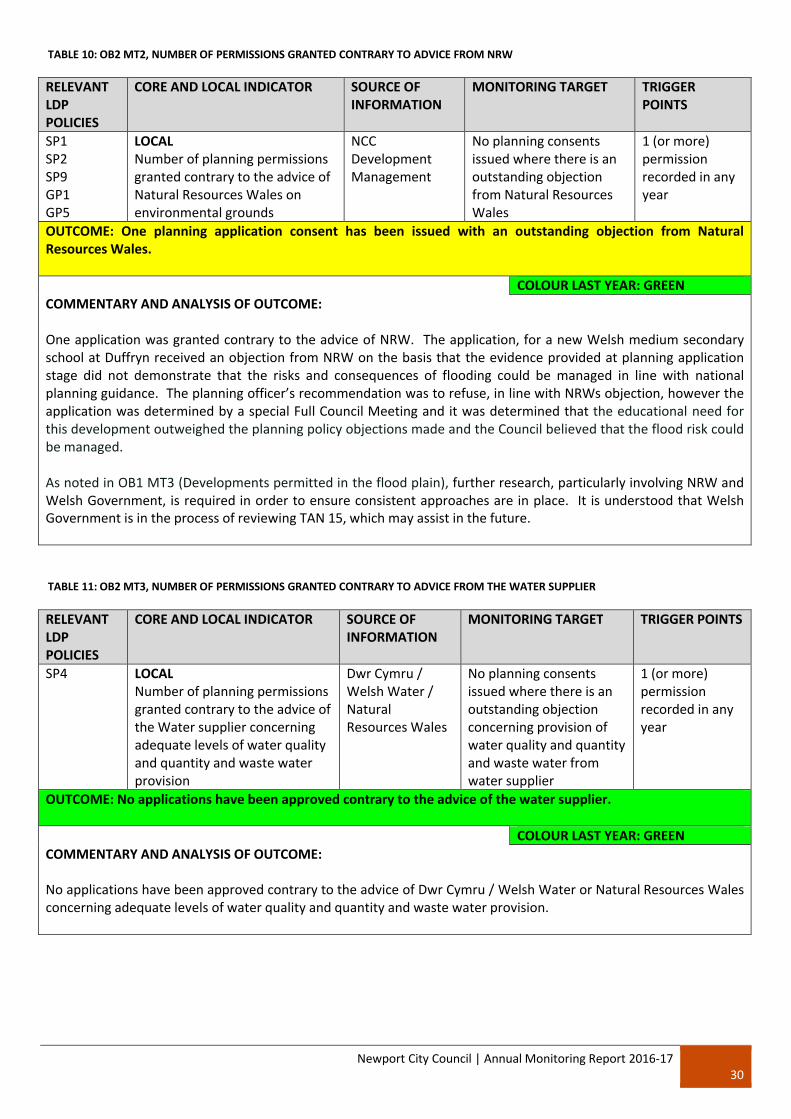
Newport City Council | Annual Monitoring Report 2016-1730
TABLE 10: OB2 MT2, NUMBER OF PERMISSIONS GRANTED CONTRARY TO ADVICE FROM NRW
RELEVANT LDP POLICIES
CORE AND LOCAL INDICATOR SOURCE OF INFORMATION
MONITORING TARGET TRIGGER POINTS
SP1SP2SP9GP1GP5
LOCALNumber of planning permissions granted contrary to the advice of Natural Resources Wales on environmental grounds
NCC Development Management
No planning consents issued where there is an outstanding objection from Natural Resources Wales
1 (or more) permission recorded in any year
OUTCOME: One planning application consent has been issued with an outstanding objection from NaturalResources Wales.
COLOUR LAST YEAR: GREENCOMMENTARY AND ANALYSIS OF OUTCOME:
One application was granted contrary to the advice of NRW. The application, for a new Welsh medium secondary school at Duffryn received an objection from NRW on the basis that the evidence provided at planning application stage did not demonstrate that the risks and consequences of flooding could be managed in line with national planning guidance. The planning officer’s recommendation was to refuse, in line with NRWs objection, however the application was determined by a special Full Council Meeting and it was determined that the educational need for this development outweighed the planning policy objections made and the Council believed that the flood risk could be managed.
As noted in OB1 MT3 (Developments permitted in the flood plain), further research, particularly involving NRW and Welsh Government, is required in order to ensure consistent approaches are in place. It is understood that Welsh Government is in the process of reviewing TAN 15, which may assist in the future.
TABLE 11: OB2 MT3, NUMBER OF PERMISSIONS GRANTED CONTRARY TO ADVICE FROM THE WATER SUPPLIER
RELEVANT LDP POLICIES
CORE AND LOCAL INDICATOR SOURCE OF INFORMATION
MONITORING TARGET TRIGGER POINTS
SP4 LOCALNumber of planning permissions granted contrary to the advice of the Water supplier concerning adequate levels of water quality and quantity and waste water provision
Dwr Cymru / Welsh Water / Natural Resources Wales
No planning consents issued where there is an outstanding objection concerning provision of water quality and quantity and waste water from water supplier
1 (or more) permission recorded in any year
OUTCOME: No applications have been approved contrary to the advice of the water supplier.
COLOUR LAST YEAR: GREENCOMMENTARY AND ANALYSIS OF OUTCOME:
No applications have been approved contrary to the advice of Dwr Cymru / Welsh Water or Natural Resources Wales concerning adequate levels of water quality and quantity and waste water provision.

Newport City Council | Annual Monitoring Report 2016-1731
OBJECTIVE 3 – ECONOMIC GROWTH
4.12. To enable a diverse economy that meets the needs of the people of Newport and those of the wider South East Wales economic region.
TABLE 12: OB3 MT1, ADDITIONAL NET EMPLOYMENT LAND
RELEVANT LDP POLICIES
CORE AND LOCAL INDICATOR SOURCE OF INFORMATION
MONITORING TARGET TRIGGER POINTS
SP17EM1
CORENet employment land development (ha) i.e. amount of land in hectares taken up annually for employment purposes in Newport
NCC Business ServicesNCC Development Management
Annual take up of a minimum of 2.3 ha of land on EM1 allocations
Less than 1.4ha of land on EM1 allocations is developed in any year.
OUTCOME: Newport has granted a net increase of 2.56ha of employment land this year.
Since the start of the Plan period, 11.08ha of new employment land has been created. Out of this 11.08ha, 4.46ha is on EM1 allocations. This equates to 0.74ha a year, which is below the 1.4ha predicated by the Employment Land Review and LDP.
COLOUR LAST YEAR: YELLOWCOMMENTARY AND ANALYSIS OF OUTCOME:
The Council approved 4.01ha of additional employment land this year, but granted permission for non-employment uses on 1.44ha of existing employment land. Therefore, the net employment land increase in Newport for this year, in terms of granted planning applications only, is 2.56ha.
The largest planning application for employment land this year was for the change of use of a former car showroom to B1/B2/B8 use (1.15ha). This development has actually been completed.
In terms of employment land lost, the largest application was for the conversion of a former office block (Olympia House) to 62 residential apartments. This application meant the loss of 0.53ha of employment land, however, the application was approved in accordance with Policy EM3. Olympia House offered dated office accommodation which attracted little interest. The reuse of older office stock to alternative uses is completely in accordance with the Employment Land Review and Policy EM3. Other losses of employment land are on a smaller scale. Even though the applications are on a smaller scale, Policy EM3 still needs to be considered. Unfortunately this has not always been the case and further analysis can be read in OB3 MT4.
With regard to EM1 employment land allocations in Newport, the Therminol 3 Plant at the EM1 (iv) Solutia site has now been completed, however there have been no new EM1 applications approved. The speculative Phase 1 of the Celtic Business Park at the eastern end of the Glan Llyn regeneration site has now been occupied by Amazon. The prestige of a global company such as Amazon, located in Newport, is a big vote of confidence for the city. It is hoped that Phase 2 (which received permission last year) will commence soon. Officers have also been in confidential pre-application discussions involving major proposals on employment land which are expected to come to fruition in the near future.
The below table provides a useful summary of schemes which have permission and what has actually been developed since the start of the Plan period. The table also includes the EM2 Newport Docks site.

Newport City Council | Annual Monitoring Report 2016-1732
Allocation Proposal Area (ha) StatusEM1 (iv) Solutia Change of use to B8 Storage and Distribution. 1.46 Completed 2011/12EM1 (iv) Solutia Erection of combined Heat and Power Plant
together with 15m high chimney stack.0.10 Completed 2012/13
EM1 (iv) Solutia Expansion of Therminol production by construction of Therminol 3 plant.
1.00 Completed 2016/17
EM1 (vii) Celtic Business Park
Phase 1 of the Celtic Business Park at the easternend of the Glan Llyn regeneration site. Occupied by Amazon.
1.90 Completed 2015/16
EM1 (vii) Celtic Business Park
Phase 2 of the Celtic Business Park at the eastern end of the Glan Llyn regeneration site.
2.50 Permission granted. Not implemented.
EM2 Newport Docks
Change of use of site to Speedy Hire multi-service centre (Storage, maintenance and distribution facility B1/B2/B8).
5.00 Completed 2015/16
EM2 Newport Docks
Extension to existing steel production/process facility
1.15 Permission granted. Not implemented.
EM2 Newport Docks
Completion of 1 steel storage shed and biomass heater
0.08 Completed 2016/17
Therefore 4.46ha of EM1 employment land has been developed since the start of the Plan period (9.54ha with the inclusion of EM2 Newport Docks). On average, this equates to 0.74ha a year which is below the 1.4ha predicted by the Employment Land Review and LDP, although with the inclusion of Newport Docks, the average is 1.59ha a year.
FIGURE 12: AMAZON WAREHOUSE, CELTIC BUSINESS PARK – SITE EM1 (VII)

Newport City Council | Annual Monitoring Report 2016-1733
TABLE 13: OB3 MT2, EMPLOYMENT LAND SUPPLY
RELEVANT LDP POLICIES
CORE AND LOCAL INDICATOR SOURCE OF INFORMATION
MONITORING TARGET TRIGGER POINTS
SP17EM1EM2EM3
CORENet employment land supply (ha) i.e. amount of land in hectares available for employment purposes in Newport.
NCC Business ServicesNCC Development Management
A 5 year supply of land for employment purposes is maintained throughout the Plan period
The available employment land supply falls below 5 years (53 ha)
OUTCOME: The available employment land supply is over 15 years.
COLOUR LAST YEAR: GREENCOMMENTARY AND ANALYSIS OF OUTCOME:
The amount of EM1 land that has been developed or has full planning permission stands at 6.96ha. Therefore there is over 165ha of EM1 employment land still available to develop. The employment land supply remains at 15.5 years.
TABLE 14: OB3 MT3, JOB CREATION OVER THE PLAN PERIOD
RELEVANT LDP POLICIES
CORE AND LOCAL INDICATOR SOURCE OF INFORMATION
MONITORING TARGET TRIGGER POINTS
SP17EM1EM3
LOCALJob creation over the Plan period.
Regional Labour Market Statistics (ONS) and Stats Wales
7,400 jobs created within Newport over the Plan period
Base of 74,400 jobs (Stats Wales 2011)
2012 +272 jobs (74,672)2013 - 470 jobs (74,202)2014 +460 jobs (74,662)2015 +621 jobs (75,283)2016 +670 jobs (75,953)2017 +650 jobs (76,603)2018 +580 jobs (77,183)2019 +710 jobs (77,893)2020 +661 jobs (78,554)2021 +501 jobs (79,055)2022 +501 jobs (79,556)2023 +501 jobs (80,057)2024 +511 jobs (80,568)2025 +591 jobs (81,159)2026 +641 jobs (81,800)
Job creation rates fall below the cumulative expected levels for 2 consecutive years.
OUTCOME: The job creation figure has fallen below the forecast rate, but not for two consecutive years.
COLOUR LAST YEAR: GREENCOMMENTARY AND ANALYSIS OF OUTCOME:
The actual number of jobs in Newport has been estimated at 75,100, which is slightly below the forecast rate. There

Newport City Council | Annual Monitoring Report 2016-1734
is still a very erratic pattern between the start of the Plan period and the most recent figures. Further analysis of the Stats Wales figures reveals that job sectors where losses occurred. Between 2012 and 2013, over 2,000 jobs were lost in the wholesale, retail, transport, hotels and food category. With the construction of the Friars Walk shopping and leisure complex being completed in 2015, there has now been an increase of 2,100 jobs in this sector between 2014 and 2015, which is positive.
However, the statistics reveal job losses in the public administration, defence, education and health sector, plus also the production industry. The production industry jobs have been falling since 2011, which is probably still linked to the recession and the national trend of the UK moving away from traditional heavier production industries as it struggles to compete of the world stage.
Job statistics are published every October by Welsh Government. The 2016 figures will not be available until October 2017 and will therefore appear in the 2018 AMR.
FIGURE 13: JOB NUMBERS IN NEWPORT
TABLE 15:OB3 MT4, EXISTING B CLASS EMPLOYMENT LAND LOST TO OTHER USES
RELEVANT LDP POLICIES
CORE AND LOCAL INDICATOR SOURCE OF INFORMATION
MONITORING TARGET TRIGGER POINTS
EM1EM3
LOCALAmount of existing B class employment land or EM1 allocation land lost to other uses
NCC Development Management
No existing B class Employment Sites or EM1 allocations are lost to non-employment use unless in accordance with Policy EM3
1 (or more) permission recorded in any year
68,000
70,000
72,000
74,000
76,000
78,000
80,000
82,000
84,000
2011 2012 2013 2014 2015 2016 2017 2018 2019 2020 2021 2022 2023 2024 2025 2026
Job
Num
bers
Actual
Forecast
Source: www.statswales.wales.gov.uk

Newport City Council | Annual Monitoring Report 2016-1735
OUTCOME: No EM1 sites have been permanently lost to non-employment sites. Phoenix Park (EM1 viii) has been granted temporary planning permission for a car park which would serve the existing offices adjacent to the site. 25 applications were permitted which involve granting alternative uses on existing employment land, which equates to 1.44ha. Out of the 25 applications, 5 applications were considered without appropriate consideration of Policy EM3.
It is considered further training is required to ensure a more consistent approach in the future.COLOUR LAST YEAR: BLUE
COMMENTARY AND ANALYSIS OF OUTCOME:
An application for a temporary car park which would serve existing offices has been permitted on Phoenix Park (EM1 viii). The permission expires in December 2019, and is an ancillary use to existing employment land. Given the temporary nature of the permission and the use, the application is not considered to jeopardise the delivery of the EM1 site.
As noted above, there have been 25 applications permitted which involve the loss of employment land. This is a significant increase from the six applications permitted last year and perhaps gives a clue as to the situation of the employment land situation in Newport, with older stock being released. Out of the 25 applications, five appear not to have fully considered Policy EM3 (Alternative uses of Employment Land).
This indicator was identified as blue (further training required) in last year’s AMR. This further training was carried out in October 2016, in conjunction with the publication of the AMR. The five applications which did not consider Policy EM3 were all determined prior to October. All relevant applications determined after this date considered EM3 correctly. Therefore, it is hoped that next year’s AMR will include better results on this indicator.
The five applications concerned were all small scale and primarily involved the conversion of older offices to residential units.
TABLE 16: OB3 MT5, VACANT COMMERCIAL UNITS IN THE CITY CENTRE
RELEVANT LDP POLICIES
CORE AND LOCAL INDICATOR SOURCE OF INFORMATION
MONITORING TARGET TRIGGER POINTS
R1R2R3
LOCALTotal vacant commercial units in the City Centre (recorded April every year)
Regeneration City Centre survey
Economic Development
Vacancy rates in the City Centre decrease
(Base rate April 2014: 25% of commercial units within City Centre are vacant)
An increase in the vacancy rates is recorded for 2 consecutive years
OUTCOME: Survey records for 2017 indicate that vacancy rates have reduced slightly compared to 2016 figures.
COLOUR LAST YEAR: GREENCOMMENTARY AND ANALYSIS OF OUTCOME:
The vacancy rates for the City Centre are as follows:
2014 (Base Year)
2015 2016 2017
Percentage of empty units within the City Centre Shopping Area
25% 22% 25% 24%

Newport City Council | Annual Monitoring Report 2016-1736
The vacancy rates recorded for the City Centre in 2017 show that there has been a slight improvement from the 2016 level. This is positive news as Newport attempts to rejuvenate its City Centre.
FIGURE 14: ENTRANCE TO THE NEWPORT KINGSWAY CENTRE
TABLE 17: OB3 MT6, APPLICATIONS APPROVED FOR NON-RETAIL USES IN PRIMARY AND SECONDARY FRONTAGE
RELEVANT LDP POLICIES
CORE AND LOCAL INDICATOR SOURCE OF INFORMATION
MONITORING TARGET TRIGGER POINTS
R1R2R3R4
LOCALNumber of applicationsapproved for non-retail use in primary and secondary frontage without meeting the requirements outlined in the relevant LDP Policies
NCC Development Management
No permissions granted for non-retail use in primary and secondary frontage without meeting therequirements outlined in the relevant LDP Policies.
1 retail application permitted for non-retail use in primary and secondary frontage without meeting the requirements of the relevant LDP Policies.
OUTCOME: Three applications for non-retail uses have been approved in either the primary or secondary retail frontages. The City Centre is in a period of change and it is considered further research into the LDP retail policies will be required at plan review stage. There is no immediate need to change the policies at this stage.
COLOUR LAST YEAR: YELLOWCOMMENTARY AND ANALYSIS OF OUTCOME:
The following non-A1 retail applications have been determined in primary and secondary frontages.
App Site Proposal Frontage Policy Compliant?16/0752 137 Commercial
StA1 to A3 Primary Fails to completely comply with Policy
R2. Report concludes the benefits of the scheme outweigh the failings against the policy.
16/0043 38B High St D1 to A3 Secondary Optician to restaurant. Would not represent a loss of an A1 unit as the unit is not currently in A1 use. No change in
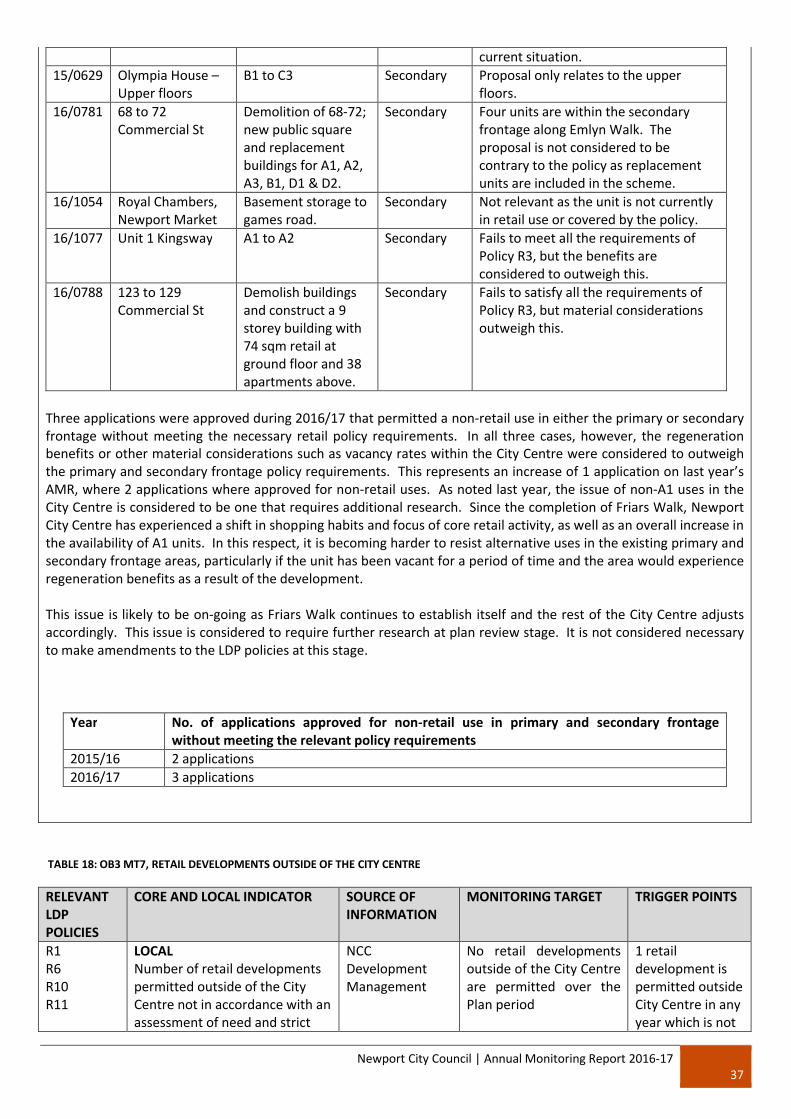
Newport City Council | Annual Monitoring Report 2016-1737
current situation.15/0629 Olympia House –
Upper floorsB1 to C3 Secondary Proposal only relates to the upper
floors.16/0781 68 to 72
Commercial StDemolition of 68-72; new public square and replacement buildings for A1, A2,A3, B1, D1 & D2.
Secondary Four units are within the secondary frontage along Emlyn Walk. The proposal is not considered to be contrary to the policy as replacement units are included in the scheme.
16/1054 Royal Chambers, Newport Market
Basement storage to games road.
Secondary Not relevant as the unit is not currently in retail use or covered by the policy.
16/1077 Unit 1 Kingsway A1 to A2 Secondary Fails to meet all the requirements of Policy R3, but the benefits are considered to outweigh this.
16/0788 123 to 129 Commercial St
Demolish buildings and construct a 9 storey building with 74 sqm retail at ground floor and 38 apartments above.
Secondary Fails to satisfy all the requirements of Policy R3, but material considerations outweigh this.
Three applications were approved during 2016/17 that permitted a non-retail use in either the primary or secondary frontage without meeting the necessary retail policy requirements. In all three cases, however, the regeneration benefits or other material considerations such as vacancy rates within the City Centre were considered to outweigh the primary and secondary frontage policy requirements. This represents an increase of 1 application on last year’s AMR, where 2 applications where approved for non-retail uses. As noted last year, the issue of non-A1 uses in the City Centre is considered to be one that requires additional research. Since the completion of Friars Walk, Newport City Centre has experienced a shift in shopping habits and focus of core retail activity, as well as an overall increase in the availability of A1 units. In this respect, it is becoming harder to resist alternative uses in the existing primary and secondary frontage areas, particularly if the unit has been vacant for a period of time and the area would experience regeneration benefits as a result of the development.
This issue is likely to be on-going as Friars Walk continues to establish itself and the rest of the City Centre adjusts accordingly. This issue is considered to require further research at plan review stage. It is not considered necessary to make amendments to the LDP policies at this stage.
Year No. of applications approved for non-retail use in primary and secondary frontage without meeting the relevant policy requirements
2015/16 2 applications2016/17 3 applications
TABLE 18: OB3 MT7, RETAIL DEVELOPMENTS OUTSIDE OF THE CITY CENTRE
RELEVANT LDP POLICIES
CORE AND LOCAL INDICATOR SOURCE OF INFORMATION
MONITORING TARGET TRIGGER POINTS
R1R6R10R11
LOCALNumber of retail developments permitted outside of the City Centre not in accordance with an assessment of need and strict
NCC Development Management
No retail developments outside of the City Centre are permitted over the Plan period
1 retail development is permitted outside City Centre in any year which is not
Newport City Council | Annual Monitoring Report 2016-1738
application of the sequential test.
(unless in accordance with an assessment of need and strict application of the sequential test)
in accordance with an assessment of need and strict application of the sequential test.
OUTCOME: No new retail developments outside of the City Centre have been approved which are not in accordance with an assessment of need and sequential test – however one application did not make this completely clear in the officer report.
COLOUR LAST YEAR: GREENCOMMENTARY AND ANALYSIS OF OUTCOME:
Records show that one planning application was approved for a use best located in a defined centre that didn’t demonstrate it accorded with the LDP’s retail policies. The application relates to an extension of 54sqm to an existing football clubhouse to be used as a daytime caf�. Whilst internally an assessment of the proposal was undertaken and concluded it satisfied the relevant retail policies, this was not apparent from the report. In this respect, the Council had demonstrated to itself that the proposal was policy compliant, but did not make this clear in the public officer report.
FIGURE 15: FRIARS WALK
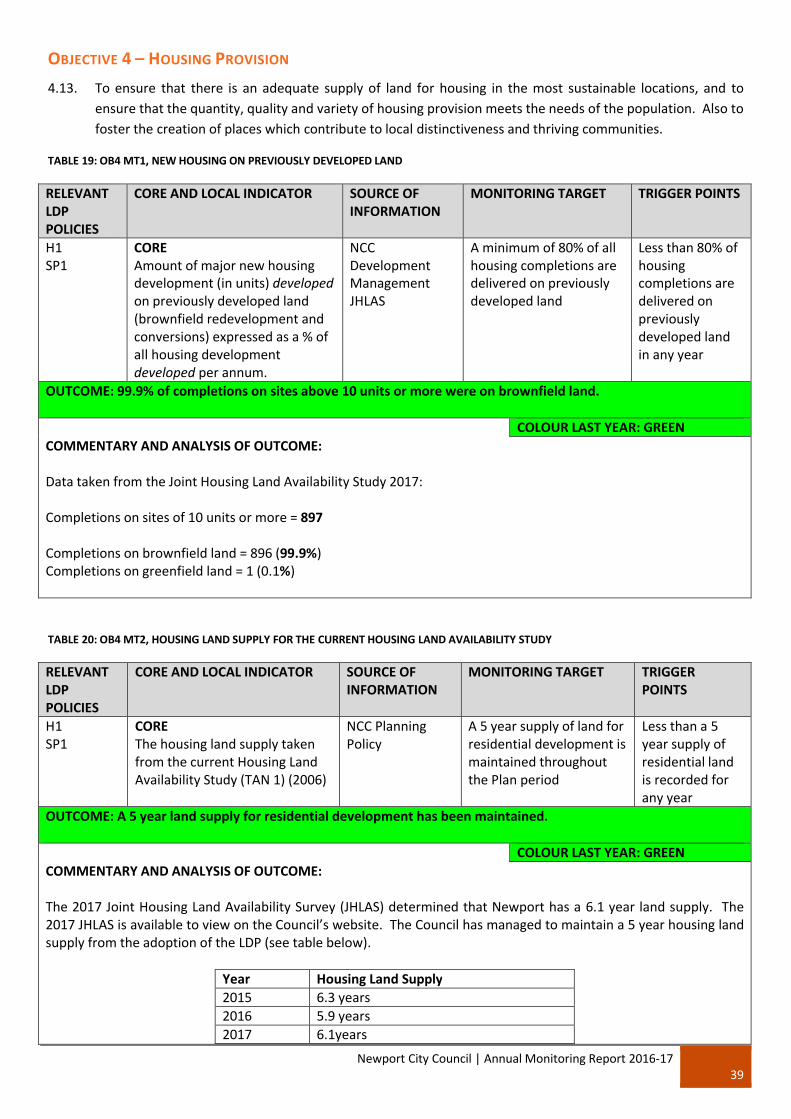
Newport City Council | Annual Monitoring Report 2016-1739
OBJECTIVE 4 – HOUSING PROVISION
4.13. To ensure that there is an adequate supply of land for housing in the most sustainable locations, and to ensure that the quantity, quality and variety of housing provision meets the needs of the population. Also to foster the creation of places which contribute to local distinctiveness and thriving communities.
TABLE 19: OB4 MT1, NEW HOUSING ON PREVIOUSLY DEVELOPED LAND
RELEVANT LDP POLICIES
CORE AND LOCAL INDICATOR SOURCE OF INFORMATION
MONITORING TARGET TRIGGER POINTS
H1SP1
COREAmount of major new housing development (in units) developed on previously developed land (brownfield redevelopment and conversions) expressed as a % of all housing development developed per annum.
NCC Development ManagementJHLAS
A minimum of 80% of all housing completions are delivered on previously developed land
Less than 80% of housing completions are delivered on previously developed land in any year
OUTCOME: 99.9% of completions on sites above 10 units or more were on brownfield land.
COLOUR LAST YEAR: GREENCOMMENTARY AND ANALYSIS OF OUTCOME:
Data taken from the Joint Housing Land Availability Study 2017:
Completions on sites of 10 units or more = 897
Completions on brownfield land = 896 (99.9%)Completions on greenfield land = 1 (0.1%)
TABLE 20: OB4 MT2, HOUSING LAND SUPPLY FOR THE CURRENT HOUSING LAND AVAILABILITY STUDY
RELEVANT LDP POLICIES
CORE AND LOCAL INDICATOR SOURCE OF INFORMATION
MONITORING TARGET TRIGGER POINTS
H1SP1
COREThe housing land supply taken from the current Housing Land Availability Study (TAN 1) (2006)
NCC Planning Policy
A 5 year supply of land for residential development is maintained throughout the Plan period
Less than a 5 year supply of residential land is recorded for any year
OUTCOME: A 5 year land supply for residential development has been maintained.
COLOUR LAST YEAR: GREENCOMMENTARY AND ANALYSIS OF OUTCOME:
The 2017 Joint Housing Land Availability Survey (JHLAS) determined that Newport has a 6.1 year land supply. The 2017 JHLAS is available to view on the Council’s website. The Council has managed to maintain a 5 year housing land supply from the adoption of the LDP (see table below).
Year Housing Land Supply2015 6.3 years2016 5.9 years2017 6.1years

Newport City Council | Annual Monitoring Report 2016-1740
TABLE 21: OB4 MT3, LDP ANNUAL COMPLETIONS
RELEVANT LDP POLICIES
CORE AND LOCAL INDICATOR
SOURCE OF INFORMATION
MONITORING TARGET TRIGGER POINTS
H1SP1
LOCALAnnual Dwelling Completions – LDP Strategy
NCC PlanningPolicy
Deliver a total of 10,350 units over the Plan period. Dwellings will be delivered in accordance with the breakdown identified below. The delivery rates are based on the economic/growth forecasts which underpin the strategy of the Plan, but have been realigned to factor in expected delivery rates. Expected delivery rates are based on the JHLAS 2013 and developer intentions.
2011 – 358 2012 – 717 (+359)2013 – 1,290 (+573)2014 – 1,955 (+665)2015 – 2,837 (+882)2016 – 3,773 (+936)2017 – 4,678 (+905)2018 – 5,641 (+963)2019 – 6,553 (+912)2020 – 7,325 (+772)2021 – 8,008 (+683)2022 – 8,687 (+679)2023 – 9,307 (+620)2024 – 9,881 (+574)2025 – 10,350 (+469)
The total number of dwellings delivered falls below the cumulative number identified for 2 consecutive years.
OUTCOME: The actual delivery rate is marginally below the required delivery but delivery rates continue to be high.
COLOUR LAST YEAR: YELLOWCOMMENTARY AND ANALYSIS OF OUTCOME:
The required build rate against the actual build rate to date is as follows:

Newport City Council | Annual Monitoring Report 2016-1741
Year Required Rates
Actual Annual Delivery
Delivery Against Annual Required Rates
Running Total Delivery Against Cumulative Required Rates
2011 358 402 +44 402 +442012 717 (+359) 403 +44 805 +882013 1290 (+573) 389 -184 1194 -962014 1955 (+665) 595 -70 1789 -1662015 2837 (+882)1 908 +26 2697 -1402016 3773 (+936) 952 +16 3649 -1242017 4678 (+905)2018 5641 (+963)2019 6553 (+912)2020 7325 (+772)2021 8008 (+683)2022 8687 (+679)2023 9307 (+620)2024 9881 (+574)2025 10,350 (+469)
Housing completions have fallen below the anticipated cumulative number for 4 consecutive years; however, there is reason to be positive. The completions achieved for the first 6 years of the Plan are largely on track, slipping only by 3% from the anticipated rate. It is also worth noting that completions achieved during both 2015 and 2016 were greater than the LDP required target rates, consequently reducing the cumulative shortfall to only 124 units.Completions in 2015 were also the highest of any authority in Wales. Over six years of house building, to be only 124 units off the target is considered to be a strong performance. 952 units have been completed this year, which is another record high. In the main, the housing completions delivered are following the anticipated trajectory of anticipated rates (see below graph). This looks set to continue with the 2017 JHLAS anticipating delivery of over a 1,000 units, which if achieved will exceed the 905 required for 2017 and reduce the shortfall further, possibly even cancelling out the deficit.
FIGURE 16: HOUSES AT JUBILEE PARK - SITE H1(54)
Jubilee Park completed 223 units in 2016/17. The highest completion rates in Newport.
1 Please note that a minor correction has been made in this AMR to the 2015 required rate. 2,832 has been corrected to 2,837.

Newport City Council | Annual Monitoring Report 2016-1742
FIGURE 17: LDP HOUSING COMPLETIONS
0
2000
4000
6000
8000
10000
12000
2011/12 2012/13 2013/14 2014/15 2015/16 2016/17 2017/18 2018/19 2019/20 2020/21 2021/22 2022/23 2023/24 2024/25 2025/26
Uni
t Com
plet
ions
Year
Required Delivery Rate
Actual Delivery Rate

Newport City Council | Annual Monitoring Report 2016-1743
TABLE 22: OB4 MT4, ANNUAL COMPLETION RATES AT LLANWERN VILLAGE
RELEVANT LDP POLICIES
CORE AND LOCAL INDICATOR SOURCE OF INFORMATION
MONITORING TARGET TRIGGER POINTS
H1 (H3) LOCALAnnual Dwelling Completions of a Strategic Housing Site –Llanwern Village
NCC Planning Policy
Deliver a total of 1,100 units over the Plan period. Dwellings will be delivered in accordance with the breakdown identified below:
2011 – 02012 – 02013 – 02014 – 0 2015 – 40 (+40)2016 – 120 (+80)2017 – 240 (+120)2018 – 360 (+120)2019 – 480 (+120)2020 – 600 (+120)2021 – 720 (+120)2022 – 840 (+120)2023 – 960 (+120)2024 – 1,080 (+120)2025 – 1,100 (+20)
The total number of dwellings delivered falls below the cumulative number identified for 2 consecutive years. If this trigger is missed, the severity of the action will depend on the performance against the overall housing delivery indicator OB4 MT3.
OUTCOME: Housing allocation H1 (3) – Llanwern Village has not delivered the anticipated units, but there is a renewed confidence in the scheme following the approval of an amended planning application and S106 agreement. The site is expected to commence this autumn and completions are expected during 2018.
COLOUR LAST YEAR: ORANGECOMMENTARY AND ANALYSIS OF OUTCOME:
Housing allocation H1 (3) – Llanwern Village has not delivered the anticipated units during 2015 and 2016. However, the Council has been working closely with Gallagher Estates to agree a revised planning permission with S106 contributions which were approved in June 2017. Gallagher Estates has indicated that they intend to be on site autumn 2017 with the first completions expected during 2018. Whilst the site’s delivery has fallen behind schedule, the recent planning permission amendments indicate a commitment to delivering the site.
TABLE 23: OB4 MT5, ANNUAL COMPLETION RATES AT GLAN LLYN
RELEVANT LDP POLICIES
CORE AND LOCAL INDICATOR SOURCE OF INFORMATION
MONITORING TARGET TRIGGER POINTS
H1 (H47) LOCALAnnual Dwelling Completions of a Strategic Housing Site – Glan Llyn (Former Llanwern Steelworks)
NCC Planning Policy
Deliver a total of 2,262 units over the Plan period. Dwellings will be delivered in accordance with the breakdown identified below:
2011 – 10
The total number of dwellings delivered falls below the cumulative number identified for 2 consecutive years. If this

Newport City Council | Annual Monitoring Report 2016-1744
2012 – 45 (+35) 2013 – 115 (+70) 2014 – 225 (+110) 2015 – 410 (+185) 2016 – 598 (+188)2017 – 782 (+184)2018 – 967 (+185)2019 – 1,152 (+185)2020 – 1,337 (+185)2021 – 1,522 (+185)2022 – 1,707 (+185)2023 – 1,892 (+185)2024 – 2,077 (+185)2025 – 2,262 (+185)
trigger is missed, the severity of the action will depend on the performance against the overall housing delivery indicator OB4 MT3.
OUTCOME: The delivery rate is slipping further from the required rate, however, the cumulative overall total across Newport is broadly in line with targets. The opening of the primary school in September 2018 is expected to be a major selling point for the site, which will hopefully boost sales and delivery rates.
COLOUR LAST YEAR: GREENCOMMENTARY AND ANALYSIS OF OUTCOME:
The required build rate against the actual build rate for Glan Llyn is as follows:
Year Required Rates
Actual Annual Delivery
Delivery Against Annual Required Rates
TotalCompletions on site
Delivery Against Cumulative Required Rates
2011 10 10 0 10 02012 45 (+35) 35 0 45 02013 115 (+70) 112 +42 157 +422014 225 (+110) 76 -36 233 +82015 410 (+185) 127 -58 360 -502016 598 (+188) 75 -113 435 -1632017 782 (+184)2018 967 (+185)2019 1,152 (+185)2020 1,337 (+185)2021 1,522 (+185)2022 1,707 (+185)2023 1,892 (+185)2024 2,077 (+185)2025 2,262 (+185)
The number of completions achieved to date on the Glan Llyn site has fallen below the cumulative number identified in the AMR for 2 consecutive years. Whilst delivery is not as fast as originally anticipated, the site is contributing a steady number year on year to Newport’s housing supply. Reserved matters was recently approved (April 2017) for a further phase of 146 units, showing continued commitment to site delivery, albeit at a slower rate than first anticipated. The primary school is expected to be completed and opened by September 2018, which is expected to be a significant selling point for the site, which will hopefully increase sales and delivery rates. Overall, Newporthousing completion figures are broadly on track with the LDP delivery rates set out on OB4 MT3, therefore further monitoring of the situation is considered to be the most appropriate course of action at this point.

Newport City Council | Annual Monitoring Report 2016-1745
FIGURE 18: HOUSING DELIVERY RATES AT GLAN LLYN
0
500
1000
1500
2000
2500
2011/12 2012/13 2013/14 2014/15 2015/16 2016/17 2017/18 2018/19 2019/20 2020/21 2021/22 2022/23 2023/24 2024/25 2025/26
Uni
t Com
plet
ions
Required Delivery Rate
Actual Delivery Rate

Newport City Council | Annual Monitoring Report 2016-1746
TABLE 24: OB4 MT6, NET ADDITIONAL AFFORDABLE DWELLINGS BUILT
RELEVANT LDP POLICIES
CORE AND LOCAL INDICATOR SOURCE OF INFORMATION
MONITORING TARGET TRIGGER POINTS
H1H4H5SP10
COREThe number of net additional affordable dwellings built in the LPA’s area (TAN 2) (2006)
NCC Planning Policy
Provision of 2,061 affordable units over the Plan period, based on:
2011-2016 = 5312016-2021 = 963 2021-2026 = 567
Delivering fewer affordable homes than:
531 by 2016963 by 2021567 by 2026
OUTCOME: 575 affordable units have been completed in the first 6-year period of the LDP. This is 149 short of the target figure, however, 2016/17 saw the highest affordable unit completions since the start of the Plan.
COLOUR LAST YEAR: YELLOWCOMMENTARY AND ANALYSIS OF OUTCOME:
The provision of affordable housing is as follows:
Year Affordable Housing(10+ units sites)
Small Site allowance
Total
2011 – 12 75 1 762012 – 13 56 1 572013 – 14 16 1 172014 – 15 96 1 972015 – 16 149 1 1502016 – 17 170 5 175Total 565 10 575
The Council’s records of housing completions show 575 affordable housing units have been completed during the sixyear period of 2011 – 17. This includes affordable units built by Registered Social Landlords and those completed by developers are part of a S106 legal agreement. This result is a shortfall of 149 units when compared against the target of 724 units for the same period. This could be a reflection of the majority of H1 sites contributing to this figure received planning permission under the UDP affordable housing policy.
The affordable housing target of 724 is 19% of the overall completion figures anticipated for the 6 year period 2011 –2017 (3773). The delivered affordable housing completions of 575 are approximately 16% of the actual completions achieved for the same period (3649).
It is also worth noting that 170 affordable units is also the highest achieved completion rate during the Plan period. Open market units have, however, also been at a record rate. Consequently, the high market dwelling completions impact on the affordable housing percentage. Further monitoring and investigation is required in order to understand the impact and success of Policy H4, Affordable Housing.

Newport City Council | Annual Monitoring Report 2016-1747
TABLE 25: OB4 MT7, RESIDUAL VALUES ACROSS HOUSING SUBMARKET AREAS
RELEVANT LDP POLICIES
CORE AND LOCAL INDICATOR SOURCE OF INFORMATION
MONITORING TARGET TRIGGER POINTS
H4SP10
LOCALChanges in residual values across housing submarket areas of:
Caerleon & Rural Newport Rogerstone & West
Newport East Newport Malpas & Bettws
HM Land Registry House Price Index.
RICS Building Cost Information Service (BCIS) Tender Prices.
Development Appraisal Toolkit
Deliver the maximum level of Affordable Housing considered viable.
An increase or decrease of 5% of residual value in any submarket area in one year.
OUTCOME: The estimated residual values of new properties in the Newport submarket areas have increased by more than the 5% target; however, evidence on actual levels and amounts of affordable housing secured suggests that there is no need for a policy review at this stage.
COLOUR LAST YEAR: GREENCOMMENTARY AND ANALYSIS OF OUTCOME:
This indicator seeks to explore the relationship between average house prices within each submarket area and building costs. The inter-relationship between the two impacts on viability levels and in turn the level of affordable housing that can potentially be achieved. If the residual value (the difference between building the property and the end sale price) has increased by more than 5% in any one year, it could suggest that schemes are more viable and could potentially deliver more affordable housing, or vice versa if there has been a reduction in residual value.
The below table indicates that there has been a slight increase in build costs based on the BCIS index. House prices have, however, increased across all sub-market areas. The Newport West sub-market area experienced the largest house price increase of 7.68% and Malpas and Bettws the lowest at 2.72%. This trend is followed through into the % change of residual value. All sub-market areas experienced an increase in residual value, ranging from 6.76% to 15.10% and all exceed the indicator trigger point of an increase of 5% when compared against the April 2015 base date figures. Whilst the trigger has been reached, and might suggest schemes are more viable and could therefore potentially deliver a higher rate of affordable housing, the Council’s records would suggest this is not the case in reality. SA Objective 16B establishes that 66% of residential applications approved during 2016/17 did not contribute to affordable housing as they were considered to be unviable (full details are set out in page 73). In this respect, a policy review of the affordable housing policy is not considered appropriate at this time. Further monitoring of the situation is considered necessary to gain a better understanding of the relationship between viability and residual value. It is also known that the BCIS does not take account of sprinklers which will be an additional build cost that will have to be considered over the next few years.

Newport City Council | Annual Monitoring Report 2016-1748
Sub Market BASELINE - APRIL 2015 (Av Semi-Detached Property)
INCREASE FROM BASELINE
UPDATE - APRIL 2017
Prices Est. Cost Residual % Change Prices
% Change Costs
Updated Prices
Updated Costs
Updated Residual
% Change
Caerleon �189,011 �78,000 �111,011 6.62 0.02826855 �201,522 �78,022 �123,500 11.25
Rural Newport
�187,000 �78,000 �109,000 7.45 0.02826855 �200,932. �78,022 �122,910 12.76
Rogerstone �176,261 �78,000 �98,261 4.84 0.02826855 �184,793 �78,022 �106,771 8.66
Newport West
�158,383 �78,000 �80,383 7.68 0.02826855 �170,539 �78,022 �92,517 15.10
Newport East
�142,181 �78,000 �64,181 6.45 0.02826855 �151,347 �78,022 �73,325 14.25
Malpas & Bettws
�129,950 �78,000 �51,950 2.72 0.02826855 �133,482 �78,022 �55,460 6.76
Source: Average house prices changes (%) – Zoopla for various postcodes within each submarket area% change in building costs – BCIS Index (2Q 2017)
FIGURE 19: MANDRAKE HOUSE, JUBILEE PARK - 28 AFFORDABLE UNITS

Newport City Council | Annual Monitoring Report 2016-1749
TABLE 26: OB4 MT8, HOUSING COMPLETED ON H1 SITES
RELEVANT LDP POLICIES
CORE AND LOCAL INDICATOR SOURCE OF INFORMATION
MONITORING TARGET TRIGGER POINTS
H1 COREPercentage of housing development completed on H1 housing sites.
NCC Planning Policy
H1 Housing sites account for 85% of large housing site delivery. Windfall sites (10 or more units) account for 15% of large site delivery.
Less than 85% of large housing sites are developed on H1 housing sites over 2 consecutive years.
OUTCOME: The target of 85% of large housing sites being developed from the H1 allocations has been achieved over 2 consecutive years.
COLOUR LAST YEAR: GREENCOMMENTARY AND ANALYSIS OF OUTCOME:
In order to offer a meaningful review of the percentage of housing completions on H1 allocation sites, a base date of 2014/15 has been used to correspond with the LDP’s adoption year. Prior to this date, the H1 table was updated and changed on a regular basis to reflect views and issues raised as part of plan process and examination. The H1 table was last updated during the Matters Arising Stage, including the addition of new sites with recent planning permission. For this reason, the monitoring of this target has started at 2014/15 reflecting the LDP adoption date.
Year Total Large site completions
H1 Allocation completions
H1 allocation completions %
Windfall Completions
Windfall completions%
2014 – 15 540 536 99.3% 4 0.7%2015 – 16 871 747 86% 124 14%2016 – 17 897 798 89% 99 11%Running Total
2308 2081 90% 227 10%
TABLE 27: OB4 MT9, AVERAGE DENSITY OF PERMITTED HOUSING DEVELOPMENT
RELEVANT LDP POLICIES
CORE AND LOCAL INDICATOR SOURCE OF INFORMATION
MONITORING TARGET TRIGGER POINTS
H3 COREAverage density of permitted housing developments of 10 or more dwellings.
NCC Development Management
Developments of 10 dwellings or more will have a minimum density of 30 per hectare
(unless in accordance with criteria set in Policy H3)
1 (or more) permission is given with an average density of <30 dwellings per hectare
OUTCOME: All developments permitted with 10 or more dwellings have a density of at least 30 dwellings per hectare (dph).
COLOUR LAST YEAR: GREEN

Newport City Council | Annual Monitoring Report 2016-1750
COMMENTARY AND ANALYSIS OF OUTCOME:
10 planning applications for new schemes were granted during 2016/17 for developments of 10 or more dwellings. All 10 developments achieved a density of at least 30 dwellings per hectare.
FIGURE 20: 123-129 COMMERCIAL RD, HORNBLOWER SITE
(Density of approximately 316 dph – scheme approved March 2017)
TABLE 28: OB4 MT10, DWELLINGS PERMITTED OUTSIDE OF THE SETTLEMENT BOUNDARY
RELEVANT LDP POLICIES
CORE AND LOCAL INDICATOR SOURCE OF INFORMATION
MONITORING TARGET TRIGGER POINTS
H5SP10
LOCALNumber of dwellings permitted annually outside the defined settlement boundaries that do not meet the requirements of the LDP Policies.
This excludes replacement dwellings and conversions
NCC Development Management
No dwellings permitted outside the defined settlement boundaries that do not meet the requirements of the Plan
1 (or more) permission outside the defined settlement boundary that does not meet the requirements of the Plan is recorded in any year
OUTCOME: No new dwellings were approved beyond the settlement or village boundaries.
COLOUR LAST YEAR: BLUECOMMENTARY AND ANALYSIS OF OUTCOME:
Four applications involving C3 uses were permitted outside the settlement or village boundaries. Two were for barn conversions, one for a replacement dwelling and considered policy compliant, whilst the remaining application involved the extension of the residential curtilage, so did not actually involve the construction of any new dwellings.

Newport City Council | Annual Monitoring Report 2016-1751
As a result, no dwellings have been permitted outside the defined settlement boundaries that do not met the requirements of the LDP.
TABLE 29: OB4 MT11, DELIVERY OF HARTRIDGE FARM ROAD AS A GYPSY/TRAVELLER SITE
RELEVANT LDP POLICIES
CORE AND LOCAL INDICATOR SOURCE OF INFORMATION
MONITORING TARGET TRIGGER POINTS
H16 LOCALDelivery of Hartridge Farm Road (H16) as a permanent residential site for Gypsies and Travellers.
NCC Planning PolicyNCC Housing Service
Delivery of 23 pitches by 2016 to meet immediate need.
Then approximately:
10 pitches by 2021 &10 pitches by 2026.
Less than 23 pitches have been developed at Hartridge Farm Road by 2016.
OUTCOME: No pitches have been delivered yet, but a full planning application for the site received permission in August 2016 and progress with regard to construction is now expected to be made.
COLOUR LAST YEAR: YELLOWCOMMENTARY AND ANALYSIS OF OUTCOME:
A full planning application for 35 pitches on the Hartridge Farm Road site has been prepared by the Council’s Housing Section and was submitted to the Council’s Development Management Section in March 2016. The application is for the creation of 35 pitches; however delivery will be phased to ensure the supply meets the demand. The planning application was approved on 11 August 2016.
The archaeological investigation of the site has been completed and conditions are in the process of being discharged. The existing building on site is being refurbished and will become the community centre for the site. The development of the first 9 pitches is about to begin.
The indicator has been identified as yellow as requiring further research and monitoring. There is no indication to suggest that the policy is failing. Progress is being made, planning process is now complete, the Council successfully bid and has received some Welsh Government money to fund the site.
TABLE 30: OB4 MT12, ACCOMMODATION PROVISION FOR GYPSY/TRAVELLERS
RELEVANT LDP POLICIES
CORE AND LOCAL INDICATOR
SOURCE OF INFORMATION
MONITORING TARGET TRIGGER POINTS
H16H17
LOCALNumber of Gypsy/Traveller Sites for residential accommodation
NCC Planning PolicyNCC Housing Service
Appropriate provision is made for Gypsy/Travellers that the Council has a statutory duty to accommodate.
Gypsy/Travellers registered as homeless will be assessed and added to the Council’s Housing Waiting List
OUTCOME: No pitches have been delivered at Hartridge Farm Road as of yet, but the need reported in the Gypsy Traveller Accommodation Assessment has not increased from that quoted in the LDP.
COLOUR LAST YEAR: YELLOWCOMMENTARY AND ANALYSIS OF OUTCOME:
The Gypsy Traveller Accommodation Assessment (GTAA) 2015-2020 predicts a need of 27 pitches by 2026. The LDP makes provisions for up to 43 pitches by 2026 at the Hartridge Farm Road Site, therefore, the LDP will ensure sufficient provision is made. There is no need to allocate additional sites for Gypsy Travellers at present. The

Newport City Council | Annual Monitoring Report 2016-1752
indicator has been identified as yellow as the pitches at Hartridge Farm Road have not yet been provided, but the site is in the process of being developed. There is no indication to suggest that the policy is failing. Progress iscontinuing to be made.
FIGURE 21: PITCH AND AMENITY BLOCK DESIGN AT HARTRIDGE FARM ROAD
TABLE 31: OB4 MT13, PROVISION OF A GYPSY/TRAVELLER TRANSIT SITE
RELEVANT LDP POLICIES
CORE AND LOCAL INDICATOR SOURCE OF INFORMATION
MONITORING TARGET TRIGGER POINTS
H15 LOCALNeed for Gypsy/Traveller transit site
NCC Planning Policy
Provide a site capable of accommodating Newport’s need of up to 7 pitches by the end of 2019.
Failure to identify a site by the start of 2018. Failure to obtain planning permission by the start of 2019.
OUTCOME: A site has not yet been identified, however, initial discussions have taken place with Cardiff Council and neighbouring authorities.
COLOUR LAST YEAR: GREENCOMMENTARY AND ANALYSIS OF OUTCOME:
The Council has not yet started to look for a site suitable of accommodating a transit site within Newport. However, we have engaged with Cardiff Council and neighbouring authorities to discuss the possibility of a regional transit site. Further discussions are taking place with regard to regional planning and the possibility of creating a Strategic Development Plan in the future. Any regional transit site is likely to be a part of these discussions.

Newport City Council | Annual Monitoring Report 2016-1753
TABLE 32:OB4 MT14, NUMBER OF GYPSY/TRAVELLER SITES FOR TRANSIT ACCOMMODATION
RELEVANT LDP POLICIES
CORE AND LOCAL INDICATOR SOURCE OF INFORMATION
MONITORING TARGET TRIGGER POINTS
H15H17
LOCALNumber of Gypsy/Traveller Sites for transit accommodation
NCC Planning PolicyNCC Housing Service
Appropriate provision is made for Gypsy/Traveller transit need
An increase in unauthorised sites (that cannot be accommodated on the transit site) is recorded by the biannual Gypsy/Traveller Count on a year on year basis over a 2 year period
OUTCOME: The number of unauthorised sites has increased by 4 from the January 2013 survey. The transit site has not yet been provided.
COLOUR LAST YEAR: YELLOWCOMMENTARY AND ANALYSIS OF OUTCOME:
The number of unauthorised Gypsy/Travellers sites in Newport has fluctuated from January 2013 to January 2017. In July 2016 there was a spike in recorded unauthorised sites at 10, but this has fallen back to 8 as on January 2017. An additional site also received planning permission, therefore the number of authorised sites now stands at 6.
Authorised Sites Unauthorised SitesJan 13 6 4Jul 13 5 5Jan 14 6 4Jul 14 6 4Jan 15 5 5Jul 15 5 6Jan 16 5 5Jul 16 5 10Jan 17 6 8
Source: Gypsy and Traveller Caravan Count January 2017
The transit site has not yet been provided and consequently the indicator has been identified as yellow.

Newport City Council | Annual Monitoring Report 2016-1754
OBJECTIVE 5 – CONSERVATION OF THE BUILT ENVIRONMENT
4.14. To ensure that all development or use of land does not adversely affect, and seeks to preserve or enhance, the quality of the historic and built environment.
TABLE 33: OB5 MT1, APPLICATIONS PERMITTED ADVERSELY AFFECTING SITES WITH HISTORICAL VALUE
RELEVANT LDP POLICIES
CORE AND LOCAL INDICATOR SOURCE OF INFORMATION
MONITORING TARGET TRIGGER POINTS
SP9 LOCALNumber of applications permitted that will adversely affect Scheduled Ancient Monuments, registered historic parks and gardens, Listed Buildings or conservation areas.
NCC Development ManagementCADWNCC Conservation OfficerGGAT
No development permitted over the course of the Plan when there is an outstanding objection from statutory heritage advisors.
Further investigation of 1 (or more) planning permissions aregiven where there is an outstanding objection from statutory heritage advisors over any year.
OUTCOME: Four applications were approved contrary to the advice of the Conservation Officer.
COLOUR LAST YEAR: GREENCOMMENTARY AND ANALYSIS OF OUTCOME:
There were four applications permitted which were considered to adversely affect a heritage asset during the past year according to the Council’s Conservation Officer. Out of the total four permissions, one affected a Listed Building (LB) and three affected a Conservation Area (CA). No permissions adversely affected a Registered Historic Park and Garden or Scheduled Ancient Monuments.
The permission which was considered to affect the LB, was objected to due to the proposed extension failing to relate sensitively to the original building, and considered to adversely affect the character and historic interest of the listed building. As a result, the same scheme was also considered to fail to preserve the character and appearance of the Conservation Area. The remaining two permissions affecting the Conservation Area were objected to by the Conservation Officer because of unsympathetic and inappropriate materials proposed and failure to maintain a commercial character to the property.
It is clear that there has been a difference of opinion between the Conservation Officer and Planning Officers with regard to the impact on Heritage Assets for four applications this year. Differences in opinion might be down to various reasons, but it is considered that officer training is likely to be the best outcome in this situation to try and reduce potential disagreements in future.

Newport City Council | Annual Monitoring Report 2016-1755
OBJECTIVE 6 – CONSERVATION OF THE NATURAL ENVIRONMENT
4.15. To protect and enhance the quality of the natural environment, including landscape, protected habitats and species of principal importance for biodiversity in Wales (regardless of greenfield or brownfield status) and the protection of controlled waters.
TABLE 34: OB6 MT1, DEVELOPMENT WHICH RESULTS IN THE LOSS OF SSSI OR SINC
RELEVANT LDP POLICIES
CORE AND LOCAL INDICATOR SOURCE OF INFORMATION
MONITORING TARGET TRIGGER POINTS
SP9GP5
LOCALDevelopment granted permission that leads to the loss of SSSI or SINC that does not meet the requirements of the LDP Policies.
NCC Green Services / NCC Development Management
No net loss of area of SINC to development
(unless it is in accordance with policies within the Plan)
Any net loss of SSSI or SINC to development which does not meet the requirements of the Plan recorded over any year
OUTCOME: Two permissions were granted permission that led to the loss of SSSI or SINC.
COLOUR LAST YEAR: GREENCOMMENTARY AND ANALYSIS OF OUTCOME:
There were two applications permitted that led to the loss of 0.5 hectares of a Site of Special Scientific Interest (SSSI) and 0.01hectares of a Site of Importance for Nature Conservation (SINC) during the past year. The application which involved the loss of SSSI was originally refused, but later approved through appeal. NRW raised the issue that the application is likely to cause damage to the semi-natural broadleaf woodland feature and requested that a minimum 2m distance is maintained between the development and woodland edge, which appeared to be acceptable to the Planning Inspector. The second application involved the erection of a replacement telecommunications mask; however it appears that the site formed part of a SINC which appears to have been missed. It is therefore concluded that further officer training is required.
TABLE 35: OB6 MT2, PROTECTED WOODLAND AND TREES LOST TO DEVELOPMENT
RELEVANT LDP POLICIES
CORE AND LOCAL INDICATOR SOURCE OF INFORMATION
MONITORING TARGET TRIGGER POINTS
SP9GP5
LOCALThe amount of protected woodland and trees lost to development per annum (ha).
NCC Green Services
No net loss of protected woodland and trees
(unless it is in accordance with policies within the Plan)
Loss of any protected woodlands and TPOs recorded in any year
OUTCOME: No protected woodland or trees have been lost to development
COLOUR LAST YEAR: GREENCOMMENTARY AND ANALYSIS OF OUTCOME:
There were no applications permitted that led to the loss of protected woodland and trees during the past year. It is clear that those developments permitted within areas which could affect protected woodland or trees over the past year have only been permitted where they are in line with LDP designations and policy requirements. It is therefore concluded that the relevant LDP policies are being implemented effectively and will continue to be monitored.

Newport City Council | Annual Monitoring Report 2016-1756
TABLE 36: OB6 MT3, NUMBER OF DEVELOPMENTS PERMITTED WITHIN THE GREEN BELT OR GREEN WEDGE
RELEVANT LDP POLICIES
CORE AND LOCAL INDICATOR SOURCE OF INFORMATION
MONITORING TARGET TRIGGER POINTS
SP5SP6SP7
LOCALThe number of developments permitted within the Green Belt or Green Wedge that do not accord with the relevant Policies of the Local Development Plan.
NCC Development Management
No developments permitted
(unless it is in accordance with policies within the Plan)
1 (or more) development permitted in any year
OUTCOME: One application has been permitted in the Green Wedge, but Policy SP7 does not appear to have been fully considered.
COLOUR LAST YEAR: BLUECOMMENTARY AND ANALYSIS OF OUTCOME:
There were 6 applications permitted within the Green Belt and Green Wedge during the past year. Two of the six permissions were located within the Green Belt, both of which were permitted in accordance with LDP policies. The remaining four permissions were located within the Green Wedge of which one application did not consider the proposals impact upon the Green Wedge within the officer report. It is therefore concluded that the evidence suggests that the policies are not be implemented as intended for the second year and further training is required.
FIGURE 22: GREEN BELT BETWEEN NEWPORT AND CARDIFF

Newport City Council | Annual Monitoring Report 2016-1757
OBJECTIVES 7, 8 & 9 – COMMUNITY FACILITIES AND INFRASTRUCTURE (7) CULTURE AND
ACCESSIBILITY (8) HEALTH AND WELL-BEING (9)4.16. Objectives 7, 8 and 9 help to ensure the provision of appropriate new, and/or enhanced existing community
facilities which will provide cultural benefits. The merged objectives also aim to enhance accessibility to key services, particularly through walking and cycling which consequently help to enhance health and well-being.
TABLE 37: OB7 MT1, COMMUNITY FACILITIES LOST TO ALTERNATIVE FORMS OF DEVELOPMENT
RELEVANT LDP POLICIES
CORE AND LOCAL INDICATOR SOURCE OF INFORMATION
MONITORING TARGET TRIGGER POINTS
SP12SP13
LOCALNumber of community facilities lost to alternative forms of development that do not meet the requirements of the relevant LDP Policies.
NCC Planning Policy
No community facilities lost over the course of the Plan period unless justified by the policy framework.
1 community facility lost is recorded in any year
OUTCOME: There have been five applications involving the loss of a community facility where Policy CF12 has not been considered.
COLOUR LAST YEAR: BLUECOMMENTARY AND ANALYSIS OF OUTCOME:
There have been six planning applications in total which have involved the loss of a community facility. One application involved the demolition of a children’s nursery, and Policy CF12 was fully considered. However, five other applications also involved the loss of a community facility and Policy CF12 does not appear to have been considered. The facilities lost are:
Doctors’ Surgery Post Office Church Chapel Public House
It is likely that the applications would have complied with Policy CF12; however it is unfortunate that there is no evidence in the delegated reports that the policy was considered. This is the second AMR where this indicator has been identified as blue (further training required).
TABLE 38: OB7 MT2, INCREASE SUSTAINABLE FORMS OF TRANSPORT
RELEVANT LDP POLICIES
CORE AND LOCAL INDICATOR
SOURCE OF INFORMATION
MONITORING TARGET TRIGGER POINTS
SP1SP13SP14SP15T5T6T7T8
LOCALTo increase sustainable forms of transport by encouraging walking and cycling
NCC PlanningHighwaysPolicy
No development will be permitted where there is an outstanding objection from Highways with regard to an over reliance on the private motor carand/or lack of
1 (or more) planning permission is given where there is an outstanding objection from Highways on grounds of a development being

Newport City Council | Annual Monitoring Report 2016-1758
sustainable transport initiatives.
unsustainable.
OUTCOME: No applications were approved with an outstanding objection from Highways on grounds of the development being unsustainable.
COLOUR LAST YEAR: GREEN
COMMENTARY AND ANALYSIS OF OUTCOME:
No planning applications were approved with an outstanding objection on sustainability grounds from Highways in 2016/17. There were five applications which were approved with an outstanding objection from Highways, but these objections were related to parking provision, and the case officers/committee members felt the issues were not strong enough to warrant a refusal.
FIGURE 23: CARDIFF CAPITAL REGION METRO
The above South East Wales Metro scheme is expected to cost �734m and will be rolled out in the near future. It will provide faster, more frequent and joined-services using trains, buses and light rail. It is the flagship project of the Cardiff Capital Region City Deal and will be a major boost in increasing sustainable forms of transport in Newport and across the region.

Newport City Council | Annual Monitoring Report 2016-1759
OBJECTIVE 10 – WASTE
4.17. To ensure that waste management choices are based on the proximity principle, where appropriate, and a hierarchy of reduce, reuse, recovery and safe disposal, and that there is adequate provision for facilities to enable this to happen.
TABLE 39: OB10 MT1, NEWPORT'S WASTE CAPACITY
RELEVANT LDP POLICIES
CORE AND LOCAL INDICATOR SOURCE OF INFORMATION
MONITORING TARGET TRIGGER POINTS
SP20W1
Maintain sufficient land and facilities to cater for Newport’s waste capacity
NCC Waste Section
Maintain a sufficient capacity to cater for Newport’s waste (to be confirmed at a regional level in accordance with TAN 21)
No Trigger
OUTCOME: No trigger identified.
COLOUR LAST YEAR: GREENCOMMENTARY AND ANALYSIS OF OUTCOME:
TAN 21 notes that waste capacity and targets will be set at a regional level. The first South East Wales Waste Monitoring Report was published April 2016. The report concludes that there is no further need for landfill capacity within the South East region. It goes on to state that any proposals for further residual waste treatment should be carefully assessed to ensure that the facility would not result in overprovision.
With regards to Newport’s municipal waste arrangements, the Council offers different waste services to residents and businesses to deal with the different waste streams:
Recyclable materials: recycling collections are carried out in partnership with Wastesavers, a community not for profit local organisation, and source-segregated materials are sent directly to re-processors to be recycled.
Food waste: food collections are also carried out by Wastesavers, and food waste is sent to the new anaerobic digestion plant located in Bryn Pica, Aberdare. The project is managed in collaboration with neighbouring Local Authorities Rhondda Cynon Taff and Merthyr Tydfil, with a 15 year contract that started in July 2015. Collections are conducted weekly.
Green waste: the Council operates in-house separate collections and all the green waste collected is sent to a composting facility. A new contract with Viridor for composting of green waste has been recently awarded with the contract running until March 2021. Collections are scheduled on a fortnightly basis and stop for 3 months during the winter period.
Residual waste: traditionally all the municipal residual waste was sent to the Council landfill site located at Docksway; however the Council is always looking for alternatives to divert waste from landfill in application of the waste hierarchy set by the waste legislation, and joined Cardiff, Caerphilly, Vale of Glamorgan and Monmouthshire in an ambitious 25 year contract to build and operate an Energy from Waste facility. The plant, located at Trident Park, Cardiff, started operations on an interim basis in 2014 and the contract started on 1 April 2016. The Council now sends most of its residual waste to the incineration plant. Docksway landfill site is still in operation, mainly for commercial clients but also as an alternative disposal site for the residual waste that is not sent to the EfW facility. Collections are scheduled on a fortnightly basis.
Other collections: the Council also provides other services such as special collections for bulky items that can be booked by residents through the Council’s website or by contacting the Contact Centre or Information Station.
Household waste recycling centre: the recycling facility located at Docksway site is also available for residents to bring in a wide range of recyclable and reusable materials.

Newport City Council | Annual Monitoring Report 2016-1760
5. SUSTAINABILITY APPRAISAL MONITORING
5.1. A Sustainability Appraisal (SA) and Strategic Environmental Assessment (SEA) have been undertaken as part of the LDP process. The purpose of the SA/SEA is to appraise the social, environmental and economic effects of the LDP proposals and policies to ensure that they accord with the principle of sustainable development.
5.2. The SA/SEA identified 26 objectives and 84 indicators which are designed to monitor and measure the social, environmental and economic effects of the LDP. They will be assessed using the colours identified in the table below.
5.3. The first year of collation (2015-2016) was primarily used to set the baseline for monitoring. This year has allowed the Council to add a second year of data which will help to start identifying trends.
Colour IndicationGreen Significant positive effects are predictedOrange Mix of positive and negative effects predictedRed Significant negative effects are predictedWhite Baseline set - No data available for comparison

Newport City Council | Annual Monitoring Report 2016-1761
SA OBJECTIVE 1 - PROTECT OR ENHANCE EXISTING PROTECTED OR IMPORTANT LANDSCAPES AND OPEN
SPACES AND ENCOURAGE THEIR SUSTAINABLE USE, ENJOYMENT AND MANAGEMENT
TABLE 40: SA OBJECTIVE 1
Monitoring Indicator
Target Source Baseline/PreviousData
Colour last year
Most Recent Data
Outcome
A % of applications for new residential applications on sites within 3km of an Accessible Natural Greenspace
100% NCC Green Team & Development Management
2015/16 = 98% 2016/17 = 100%
100%
B Applications approved with outstanding objection due to the loss of a Public Right of Way.
Zero NCC Green Team & Development Management
2015/16 = 0 2016/17 = 0 0
C Amount Environmental Space lost to new development not in accordance with LDP policies
Minimise -target of nil
NCC Leisure & Development Management
2015/16 = 0.15ha 2016/17 = 0.01ha
0.01ha
D Number of major applications with landscape strategies approved as part of the permission
Increase NCC Green Team & Development Management
2015/16 = 19 2016/17 = 12 12 applications
E Number of new developments that will affect a SLA
Decrease NCC Green Team & Development Management
2015/16 = 6 2016/17 = 3 3 applications
A
B
C
D
E
COMMENTARY AND ANALYSIS OF OUTCOME:
All developments involving new residential dwellings approved during 2016/17 are located within 3km of identified Accessible Natural Greenspace.
No applications were approved with an outstanding objection due to the loss of a Public Right of Way.
Please see commentary and analysis of OB1 MT2 (page 26).
Out of the total 26 major applications permitted during the past year, 14 did not have a landscaping scheme and 12 did. Of the 14 permissions without landscaping schemes, seven were agreed because they were for the conversion of existing buildings, the remaining seven did not have mention of a landscaping scheme within the Officer Report. It is therefore concluded that there is a mix of positive and negative effects.
There were seven applications permitted on land designated as a Special Landscape Area during the past year. Of the seven permissions, three did not have mention of Special Landscape Areas within the Officer Report. Two applications concluded that the development does not detract from the SLA. The remaining two applications noted an impact but that the impact was either reduced or would not amount to a worsening of the existing situation. Due to the three applications which failed to mention the SLA, it is concluded that the evidence suggests that there are a mix of positive and negative effects predicted, however this is an improvement on last year, where 6 applications failed to consider the SLA.

Newport City Council | Annual Monitoring Report 2016-1762
SA OBJECTIVE 2 – PROTECT, MANAGE AND ENHANCE BIODIVERSITY
TABLE 41: SA OBJECTIVE 2
Monitoring Indicator Target Source Baseline/PreviousData
Colour last year
Most Recent Data
Outcome
A The amount of protected woodland and trees lost to development per annum (ha)
No net loss of protected woodland and trees
NCC Green Team &Development Management
2015/16 = 0 2016/17 = 0 0
B Number of new developments negatively impacting on SINC designations
Zero NCC Green Team & Development Management
2015/16 = 0 2016/17 = 0.01ha
0.01ha
C Area of important wildlife habitat lost to other uses
Zero NCC Green Team & Development Management
2015/16 = 0ha 2016/17 = 0ha 0ha
D Number of ecological management schemes associated with new development
Increase NCC Green Team &Development Management
2015/16 = 10 2016/17 = 6 6
E Area of land enhanced for biodiversity value through the use of s106 agreement
Increase NCC Green Team & Development Management
2015/16 = 2ha 2016/17 = 0.91ha
0.91ha created
A
B
C
D
E
COMMENTARY AND ANALYSIS OF OUTCOME:
Please see commentary and analysis of OB6 MT2 (page 55).
Please see commentary and analysis of OB6 MT1 (page 55).
There was one application permitted that led to the loss of a Site of Special Scientific Interest (SSSI) in the past year. No applications were permitted that led to the loss of a National Nature Reserve (NNR) or Local Nature Reserve (LNR) during the past year. The loss of 0.5hecatres of a SSSI was accepted by a Planning Inspector and NRW appeared to be accepting providing a suitable buffer to development was imposed.
There were six applications permitted with an ecological management scheme during the past year. This is a decrease of four applications compared to last year.
There was one application permitted that led to the creation of an area enhanced for biodiversity value through the use of section 106 agreement during the past year. This is a reduction on the two sites agreed last year. This resulted in the creation of 0.91ha of ecological area of enhancement. The reduction from last year means the indicator will be highlighted orange.

Newport City Council | Annual Monitoring Report 2016-1763
SA OBJECTIVE 3 – LAND IS USED EFFICIENTLY AND GEODIVERSITY, SOIL QUALITY AND MINERAL
RESOURCES ARE PROTECTED
TABLE 42: SA OBJECTIVE 3
Monitoring Indicator
Target Source Baseline/PreviousData
Last year colour
Most Recent Data
Outcome
A Amount of Greenfield land lost to development (ha) which is not allocated in the LDP or does not meet the requirements of the relevant LDP policies by way of a departure application from the plan
Greater than 0 hectares permitted over a 1 year period
LDP AMR 2015/16 = 0ha 2016/17 = 0ha 0ha
B Average density of housing development permitted on allocated development plan sites of 10 or more dwellings
30 per hectare
LDP AMR 2015/16 = 62dph 2016/17 = 60 dph
60 dph
C Applications approved with outstanding objection from Environmental Health related to water pollution
0 LDP AMR 2015/16 = 0 2016/17 = 0 0
D % of planning permissions granted resulting in loss of grades 1, 2 and 3a land
Decrease Development Management
2015/16 = 0 2016/17 = 0 0
A
B
C
D
COMMENTARY AND ANALYSIS OF OUTCOME:
Please see commentary and analysis for OB1 MT1 (page 26).
10 planning applications were granted during 2016/17 for developments of 10 or more dwellings. An average density of 60 dph was achieved.
No applications were approved with an outstanding objection from Environmental Health on water pollution grounds.
23 planning applications involved development beyond the settlement or village boundaries and therefore within land designated as countryside and potentially agricultural land. All the applications are considered to involve developments that are either change of use/conversions, contained within the existing curtilage of a cluster of buildings or temporary in nature. In this respect there has not been any planning permissions resulting in the loss of grades 1, 2 & 3a agricultural land.

Newport City Council | Annual Monitoring Report 2016-1764
SA OBJECTIVE 4 – IMPROVEMENT IN AIR QUALITY
TABLE 43: SA OBJECTIVE 4
Monitoring Indicator Target Source Baseline/PreviousData
Last year colour
Most Recent Data
Outcome
A Number and status of Air Quality Management Areas (AQMA) within Newport
Decrease 2015 Updating and Screening Assessment for NCC – Feb 2016
2015/16 = 9 AQMAs
Baseline Set
2016/17 = 9 AQMAs
9 AQMAs
A
COMMENTARY AND ANALYSIS OF OUTCOME:
There has been no change with regard to the number of AQMAs in Newport. Therefore the indicator will remain orange.
SA OBJECTIVE 5 – REDUCTION IN EMISSIONS OF GREENHOUSE GASES
TABLE 44: SA OBJECTIVE 5
Monitoring Indicator Target Source Baseline/PreviousData
Last year colour
Most Recent Data
Outcome
A Carbon dioxide (CO�) emissions per capita
Decrease 3% per annum
Department for Energy and Climate Change
9.8 tonnes (2011)9.3 tonnes (2012)9.7 tonnes (2013)
8.6 tonnes (2014)
A decrease of 3% per annum from 2011 would be 8.7 tonnes. Newporthas donebetter at 8.6 tonnes.
A
COMMENTARY AND ANALYSIS OF OUTCOME:
Since 2011, according to the data available from the Department for Energy and Climate Change (DECC), CO�emissions in Newport have fallen significantly. The target of 3% per annum from 2011 would mean Newport needed to be at 8.7 tonnes per capita in 2014. Newport has surpassed this target at 8.6 tonnes per capita as of 2014.
Both domestic and industrial emissions have fallen since 2012, but transport emissions initially fell, but have risen in 2014 to a level greater than 2011. This is reflective of an increase in the number of vehicles on the road.
In 2005, CO� emissions in Newport were 14.2 tonnes per capita. Therefore there has been a significant positive downward trend between 2005 and 2014.

Newport City Council | Annual Monitoring Report 2016-1765
SA OBJECTIVE 6 – MINIMISATION OF THE EFFECTS OF NOISE POLLUTION
TABLE 45: SA OBJECTIVE 6
Monitoring Indicator
Target Source Baseline/PreviousData
Last year colour
Most Recent Data
Outcome
A The number ofapplications refused on noise issues.
Monitor –No applications approved with outstanding noise issues
DM & Env Health
2015/16 – 13 refused, 0 with outstanding issue.
2016/17 – 1 refused, 0 with outstanding issue.
0 apps approved with outstanding noise issues
B The number of applications permitted with noise mitigation measures.
Monitor DM & Env Health
2015/16 – 53 app approved with noise mitigation schemes agreed.
No target
42 apps approved with noise mitigation schemes agreed.
42 apps
A
B
COMMENTARY AND ANALYSIS OF OUTCOME:
There was one application refused during the past year which had at least one reason for refusal concerning noise.
There were 42 applications permitted during the past year which had noise mitigation agreed as part of the permission. Both this result and sustainability target SA6A results in a high level of confidence that those developments within noisy locations are either conditioned or refused as necessary. It is therefore concluded that positive significant effects are predicted.
SA OBJECTIVE 7 – MAINTENANCE OR ENHANCEMENT OF WATER QUALITY, QUANTITY AND FLOW
TABLE 46: SA OBJECTIVE 7
Monitoring Indicator
Target Source Baseline/PreviousData
Last year colour
Most Recent Data
Outcome
A Number of planning permission granted contrary to the advice of the water supplier concerning adequate levels of water quality and quantity and waste water provision
No planning consents issued where there is an objection concerning provision of water quality and quantity and waste water from water
LDP AMR 2015/16 = 0 2016/17 = 0 No applications approved contrary to advice of water supplier.

Newport City Council | Annual Monitoring Report 2016-1766
supplierB Number of new
developments which include improvements to local sewerage, water supply and waste water treatment infrastructure to cope with increased demand through planning obligations
Increase Planning Obligations Manager
2015/16 = 0 Baseline Set
2016/17 = 0 No applications approved with a S106 which secures improvements to sewerage, water supply or waste water.
A
B
COMMENTARY AND ANALYSIS OF OUTCOME:
No planning applications have been approved which were contrary to the advice of the water supplier with respect to water quality or waste water.
No applications have been approved with a S106 which secures improvements to sewerage, water supply or waste water.
SA OBJECTIVE 8 – REDUCTION IN WATER CONSUMPTION
TABLE 47: SA OBJECTIVE 8
Monitoring Indicator Target Source Baseline/PreviousData
Last year colour
Most Recent Data
Outcome
A Number of houses built meeting the building regulation part G2.31(1) to meet the water efficiency threshold set by government.
Increase NCC Building Control and NHBC
2015/16 = 787 completions
Baseline Set
2016/17 = 884 completions
884 completions
B Number of households who have ordered water efficiency products for their home
Increase Dwr Cymru / Welsh Water
2015/16 = 1,518 households
Baseline Set
2016/17 = 3,439 households
3,439 households
C Installation of water efficient fixtures in new developments
Increase NCC Building Control and NHBC
2015/16 = 787 completions
Baseline Set
2016/17 = 884 completions
884 completions
A
COMMENTARY AND ANALYSIS OF OUTCOME:
There are no requirements for installing grey water systems in new developments. However, it is useful to note that Building Regulations Part G2. 31 (1) required a water efficient calculation for all new dwellings, including change of use to a residential unit. A statistic can be supplied as to all the new housing units signed off within the Building Regulation Process, i.e. given completion certification.
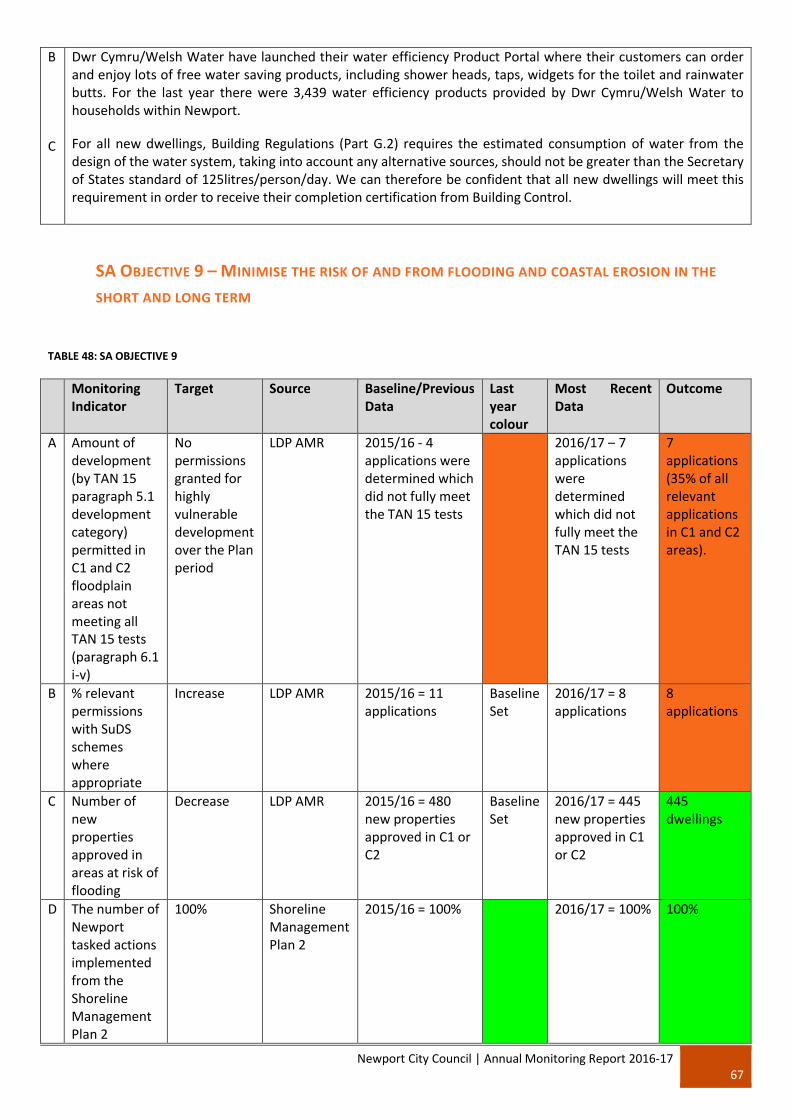
Newport City Council | Annual Monitoring Report 2016-1767
B
C
Dwr Cymru/Welsh Water have launched their water efficiency Product Portal where their customers can order and enjoy lots of free water saving products, including shower heads, taps, widgets for the toilet and rainwater butts. For the last year there were 3,439 water efficiency products provided by Dwr Cymru/Welsh Water to households within Newport.
For all new dwellings, Building Regulations (Part G.2) requires the estimated consumption of water from the design of the water system, taking into account any alternative sources, should not be greater than the Secretary of States standard of 125litres/person/day. We can therefore be confident that all new dwellings will meet this requirement in order to receive their completion certification from Building Control.
SA OBJECTIVE 9 – MINIMISE THE RISK OF AND FROM FLOODING AND COASTAL EROSION IN THE
SHORT AND LONG TERM
TABLE 48: SA OBJECTIVE 9
Monitoring Indicator
Target Source Baseline/PreviousData
Last year colour
Most Recent Data
Outcome
A Amount of development (by TAN 15 paragraph 5.1 development category) permitted in C1 and C2 floodplain areas not meeting all TAN 15 tests (paragraph 6.1 i-v)
No permissions granted for highly vulnerable development over the Plan period
LDP AMR 2015/16 - 4 applications were determined which did not fully meet the TAN 15 tests
2016/17 – 7 applications were determined which did not fully meet the TAN 15 tests
7 applications (35% of all relevant applications in C1 and C2 areas).
B % relevant permissions with SuDS schemes where appropriate
Increase LDP AMR 2015/16 = 11 applications
Baseline Set
2016/17 = 8 applications
8 applications
C Number of new properties approved in areas at risk of flooding
Decrease LDP AMR 2015/16 = 480 new properties approved in C1 or C2
Baseline Set
2016/17 = 445 new properties approved in C1 or C2
445 dwellings
D The number of Newport tasked actions implemented from the Shoreline Management Plan 2
100% Shoreline Management Plan 2
2015/16 = 100% 2016/17 = 100% 100%

Newport City Council | Annual Monitoring Report 2016-1768
process.
A
B
C
D
COMMENTARY AND ANALYSIS OF OUTCOME:
Please see commentary and analysis from OB1 MT3 (page 27).
There were eight applications permitted with Sustainable Drainage Systems (SuDS) during the past year. This is a reduction of three applications since last year. It is therefore concluded that a mix of positive and negative effects are predicted.
There were 445 new properties permitted within flood risk zones C1 and C2 during the past year, of which 341 were from a reserved matters or variation of condition application. This is a decrease of 35 units from last year’s figures.
Newport City Council is tasked with four actions within the Shoreline Management Plan 2 (SMP2) process. Three of the four actions are identical in wording yet each covers a different portion of the shoreline. The action is for the Local Development Plan (LDP) to have taken the SMP2 into account within the Strategic Flood Consequence Assessment (SFCA) of the LDP. It can be confirmed that the SMP2 was taken into account within the SFCA undertaken for the adopted LDP. The fourth action for Newport is to identify how the Wales Coastal Path may be re-routed under a managed retreat scenario, within area Caldicot 1 (i.e. the eastern levels). The policy option for CALD 1 is to hold the line for all epochs of the SMP2 (i.e. 0-100 years) therefore there is no need to re-route the coastal path because there is no managed retreat within the Newport portion of CALD 1. It is therefore concluded that positive significant effects are predicted.
SA OBJECTIVE 10 –INCREASE IN ENERGY EFFICIENCY
TABLE 49: SA OBJECTIVE 10
Monitoring Indicator Target Source Baseline/PreviousData
Last year colour
Most Recent Data
Outcome
A Average annual electricity consumption per household (kWh)
Decrease Dept for Energy and Climate Change
3,739 (2011)3,675 (2013)3,689 (2014)
3,449 (2015)
Decrease of 240kWh per household from 2014
B Number of owner occupiers signing up to NCCs energy performance and generation programme for existing dwellings
Increase South East Energy Advice Centre
2015/16 = 80 households
Baseline Set
Unknown Unknown
C % of development which includes improvements to local energy supply and telecommunications to cope with residual demand through planning obligations
Increase Planning Obligations Manager
2015/16 = 0 Baseline Set
2016/17 = 0
0
A
COMMENTARY AND ANALYSIS OF OUTCOME:
The average annual electricity consumption per Newport household has decreased by 240kWh per household between 2014 and 2015. It has fallen by 290kWh per household from the start of the Plan period to 2015.

Newport City Council | Annual Monitoring Report 2016-1769
B
C
It has not been possible to provide data on this target due to the lack of funding over the past year. It is hoped that funding will be sought in the future and this indicator will be monitored next year.
No such schemes have been agreed through planning obligations.
SA OBJECTIVE 11 – INCREASE IN RENEWABLE ENERGY
TABLE 50: SA OBJECTIVE 11
Monitoring Indicator Target Source Baseline/PreviousData
Last year colour
Most Recent Data
Outcome
A Number and capacity of renewable energy developments permitted
An increase in the number of renewable energy developments permitted
LDP AMR
2015/16 = 4 schemes @ 21.06MW
Baseline Set
1 scheme = 0.998MW
1 scheme = 0.998MW
A
COMMENTARY AND ANALYSIS OF OUTCOME:
Please see commentary and analysis for OB2 MT1 (page 29).
SA OBJECTIVE 12 – ACHIEVEMENT OF WASTE REDUCTION AND DECREASE IN WASTE SENT TO
LANDFILL, AND INCREASE IN LEVELS OF RECYCLING TO ACHIEVE MORE SUSTAINABLE WASTE
MANAGEMENT
TABLE 51: SA OBJECTIVE 12
Monitoring Indicator
Target Source Baseline/PreviousData
Last year colour
Most Recent Data
Outcome
A % of new development which includes improvements to waste management infrastructure to cope with increased demand through planning obligations
Increase Planning Obligations Manager
2015/16 = 0 Baseline Set
2016/17 = 0
0
B % municipal waste reused, recycled and composted
58 % in 2015/1664% in 2019/2070% in2024/25
Streetscene Waste Section
2014/15 = 52.03%2015/16 = 57.14%
2016/17 = 61.4%
61.4%
C % energy from waste
maximum 42% by 2015/16.
Streetscene Waste Section
2015/16 = 25.2% 2016/17 = 36.9%
36.9%

Newport City Council | Annual Monitoring Report 2016-1770
Maximum 36% by 2019/20. Maximum 30% by 2024/25
D % level of waste sent to landfill
Phased out by 2025
Streetscene Waste Section
2014/15 = 36.65%2015/16 = 23.64%
2016/17 = 7.8%
7.8%
A
B
C
D
COMMENTARY AND ANALYSIS OF OUTCOME:
There have been no improvements to waste management infrastructure through planning obligations.
The rates provided by the Council’s Waste Section indicate that there was an improvement on the percentage of municipal waste reused, recycled and composted compared to last year. It is also on course to achieving the 2019/20 target rate of 64%.
Data reported to NRW concludes that waste levels sent to energy from waste facilities (EfW) in 2016/17 was 36.9%. This is below the maximum level of 42% for 2015/16, but slightly above the maximum rate of 36% allowed by 2019/2020. The contract for sending residual waste to the EfW facility at Trident Park commenced formally on 1st April 2016. The Council will continue to monitor rates to assess progress and consistency with the 2019/20 target percentage.
The Council’s monitoring for the preparation of the Service Plan Review indicates that 7.8% of municipal waste was sent to landfill. This is a significant reduction on the previous year’s rate of 23.64% in 15/16 and 36.65% in 14/15. The decrease is largely attributed to the commencement of the Project Gwyrdd energy from waste facility at Trident Park.
SA OBJECTIVE 13 – PROMOTION AND ACHIEVEMENT OF SUSTAINABLE, HIGH QUALITY DESIGN IN
ALL DEVELOPMENT TO A HIGHER QUALITY BUILT AND NATURAL ENVIRONMENT WHILST ADAPTING
TO THE POTENTIAL IMPACTS OF CLIMATE CHANGE
TABLE 52: SA OBJECTIVE 13
Monitoring Indicator
Target Source Baseline/PreviousData
Last year colour
Most Recent Data
Outcome
A Number of applications where a required design and access statement is not submitted
Zero LDP AMR
2015/16 = 0 applications
2016/17 = 0 applications
0 apps
B % of major schemes where Design Council for Wales (DCfW) have been consulted
Increase LDP AMR
2015/16 = 2 applications
Baseline Set
2016/17 = 0 applications
0 apps
COMMENTARY AND ANALYSIS OF OUTCOME:
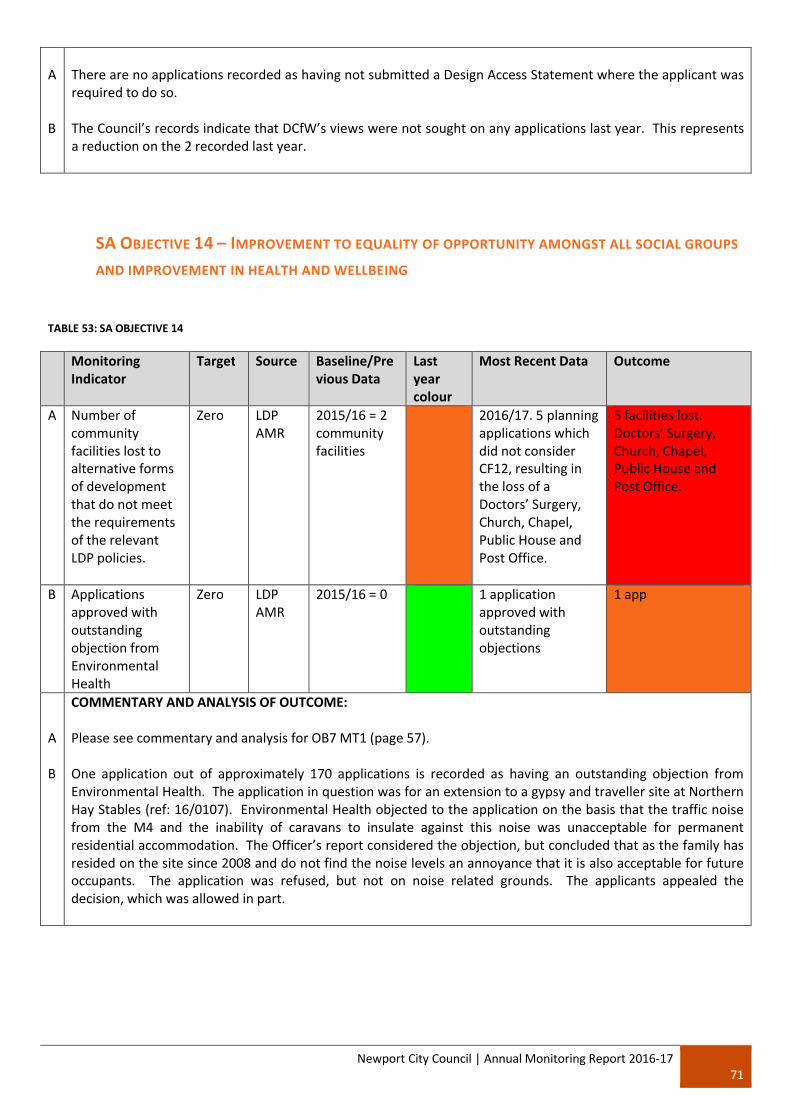
Newport City Council | Annual Monitoring Report 2016-1771
A
B
There are no applications recorded as having not submitted a Design Access Statement where the applicant was required to do so.
The Council’s records indicate that DCfW’s views were not sought on any applications last year. This represents a reduction on the 2 recorded last year.
SA OBJECTIVE 14 – IMPROVEMENT TO EQUALITY OF OPPORTUNITY AMONGST ALL SOCIAL GROUPS
AND IMPROVEMENT IN HEALTH AND WELLBEING
TABLE 53: SA OBJECTIVE 14
Monitoring Indicator
Target Source Baseline/Previous Data
Last year colour
Most Recent Data Outcome
A Number of community facilities lost to alternative forms of development that do not meet the requirements of the relevant LDP policies.
Zero LDP AMR
2015/16 = 2 community facilities
2016/17. 5 planning applications which did not consider CF12, resulting in the loss of a Doctors’ Surgery, Church, Chapel, Public House and Post Office.
5 facilities lost. Doctors’ Surgery, Church, Chapel, Public House and Post Office.
B Applications approved with outstanding objection from Environmental Health
Zero LDP AMR
2015/16 = 0 1 application approved with outstanding objections
1 app
A
B
COMMENTARY AND ANALYSIS OF OUTCOME:
Please see commentary and analysis for OB7 MT1 (page 57).
One application out of approximately 170 applications is recorded as having an outstanding objection from Environmental Health. The application in question was for an extension to a gypsy and traveller site at Northern Hay Stables (ref: 16/0107). Environmental Health objected to the application on the basis that the traffic noise from the M4 and the inability of caravans to insulate against this noise was unacceptable for permanent residential accommodation. The Officer’s report considered the objection, but concluded that as the family has resided on the site since 2008 and do not find the noise levels an annoyance that it is also acceptable for future occupants. The application was refused, but not on noise related grounds. The applicants appealed the decision, which was allowed in part.

Newport City Council | Annual Monitoring Report 2016-1772
SA OBJECTIVE 15 – PROTECTION AND PROVISION OF IMPROVED LOCAL, SOCIAL, RECREATIONAL
AND LEISURE FACILITIES FOR ALL SECTORS OF THE COMMUNITY, AND IMPROVEMENT TO THEIR
ACCESSIBILITY
TABLE 54: SA OBJECTIVE 15
Monitoring Indicator
Target Source Baseline/PreviousData
Last year colour
Most Recent Data
Outcome
A Amount of Environmental Space lost to development (ha) which is not allocated in the LDP and does not meet the requirement of the LDP policies set out in TAN 16
0 hectares permitted over a year period
LDP AMR
2015/16 = 0.15ha 2016/17 = 0.01ha
0.01ha
B Loss of local community facilities
Decrease DM 2015/16 – 2 facilities lost.
2016/17. 5 planning applications which did not consider CF12, resulting in the loss of a Doctors’ Surgery, Church, Chapel, Public House and Post Office.
5 facilities lost. Doctors’ Surgery, Church, Chapel, Public House and Post Office.
A
B
COMMENTARY AND ANALYSIS OF OUTCOME:
Please see commentary and analysis of OB1 MT2 (page 26).
Please see analysis for OB7 MT1 (page 57).
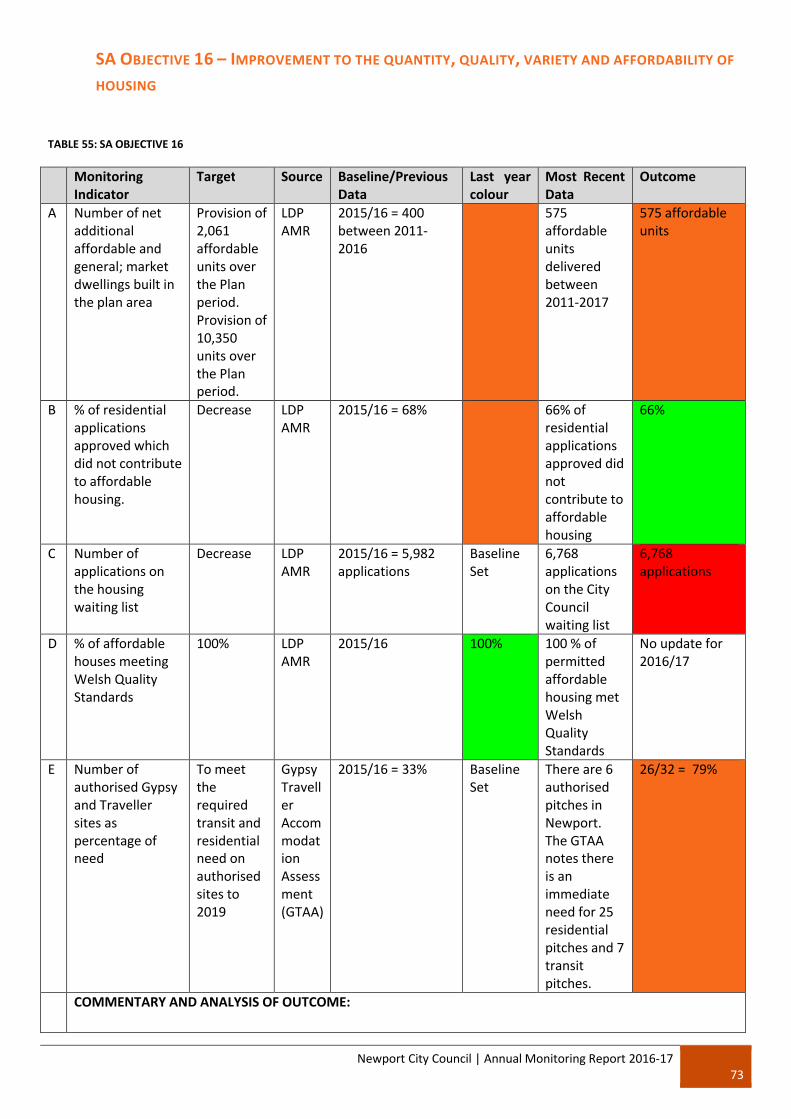
Newport City Council | Annual Monitoring Report 2016-1773
SA OBJECTIVE 16 – IMPROVEMENT TO THE QUANTITY, QUALITY, VARIETY AND AFFORDABILITY OF
HOUSING
TABLE 55: SA OBJECTIVE 16
Monitoring Indicator
Target Source Baseline/PreviousData
Last year colour
Most Recent Data
Outcome
A Number of net additional affordable and general; market dwellings built in the plan area
Provision of 2,061 affordable units over the Plan period. Provision of 10,350 units over the Plan period.
LDP AMR
2015/16 = 400 between 2011-2016
575 affordable units delivered between 2011-2017
575 affordable units
B % of residential applications approved which did not contribute to affordable housing.
Decrease LDP AMR
2015/16 = 68% 66% of residential applications approved did not contribute to affordable housing
66%
C Number of applications on the housing waiting list
Decrease LDP AMR
2015/16 = 5,982 applications
Baseline Set
6,768 applications on the City Council waiting list
6,768 applications
D % of affordable houses meeting Welsh Quality Standards
100% LDP AMR
2015/16 100% 100 % of permitted affordable housing met Welsh Quality Standards
No update for 2016/17
E Number of authorised Gypsy and Traveller sites as percentage of need
To meet the required transit and residential need on authorised sites to 2019
Gypsy Traveller Accommodation Assessment (GTAA)
2015/16 = 33% Baseline Set
There are 6 authorised pitches in Newport. The GTAA notes there is an immediate need for 25 residential pitches and 7 transit pitches.
26/32 = 79%
COMMENTARY AND ANALYSIS OF OUTCOME:

Newport City Council | Annual Monitoring Report 2016-1774
A
B
C
D
E
3649 units have been delivered over the six year period 2011 – 2017. Of these, 575 units are affordable. There is a slight shortfall in anticipated rates; however the general trend is on course with the LDP’s objectives. Further analysis on this indicator can be found in relation to LDP OB4 – MT3 and OB4 – MT6.
Analysis of the spreadsheet shows that 44 applications were approved that resulted in a net gain of residential units (<10 & >10) and were therefore subject to the requirements of Policy H4 of the LDP. Overall, 34% (15 applications) made a contribution to affordable housing (including 100% affordable schemes), via onsite or commuted sums, and 66% (29 applications) did not make a contribution towards affordable housing. Further analysis of all 44 applications shows:
44 applications resulting in a net gain in residential units and therefore trigger Policy H4 Number of applications
%
100% affordable scheme 6 14%Unviable – (includes on-site and contributions) 29 66%On-site affordable housing contribution agreed 4 9%Commuted sum agreed 5 11%
% of residential applications approved which: 2015/16 2016/17Did make a contribution towards affordable housing provision 32% 34%Did not make a contribution towards affordable housing provision 68% 66%
A small improvement in the percentage of schemes contributing to affordable housing has been achieved during the last 12 months. Further measures have also been taken in relation to commuted sums negotiated on small sites to help increase the number of schemes that can provide a commuted sum on small residential schemes. A reduction in the commuted sums contributions requested has been in place since October 2016, with the aim that this will have less of an impact of viability. Over the last 12 months, 32 of the applications captured by Policy H4’s requirements were on small sites and therefore involved a commuted sum formula rather than on-site provision. Of the 32 applications, 27 were determined prior to the rate reduction, with 3 commuted sums agreed. 5 applications were determined after the reduction and resulted in 1 commuted sum being agreed. A full year of monitoring is considered necessary to fully assess the impact of the rate reduction.
There are currently 6,768 applications on Newport City Councils Housing Waiting List. This is an increase of 786 applications from last year
The figure for the % of affordable houses meeting Welsh Quality Standards has not been updated for this year.
The 2015 Gypsy and Traveller Accommodation Assessment notes a current demand for 25 pitches for residential accommodation and a demand for seven transit pitches. A planning permission has been granted for the siting of 35 pitches which will satisfy the current demand. There is no current site for transit accommodation. Although this indicator has been identified as ‘orange’, the Council is taking significant steps to resolving this issue.

Newport City Council | Annual Monitoring Report 2016-1775
SA OBJECTIVE 17 – REDUCTION IN CRIME AND SOCIAL DISORDER AND THE FEAR OF CRIME AND
PROMOTION OF SAFER NEIGHBOURHOODS
TABLE 56: SA OBJECTIVE 17
Monitoring Indicator
Target Source Baseline/PreviousData
Last year colour
Most Recent Data
Outcome
A % of people who feel safe in their local area – day and night
Increase Newport Community Well-being Profile 2017
2011 – Day = 88.62011 – Night = 63.8
2012 – Day = 93.62012 – Night = 66.8
2013 – Day = 90.72013 – Night = 71.0
2014 – Day = 90.32014 – Night = 68.9
2015 – Day = 87.62015 – Night = 70.4
2016
Day – 89.2
Night –71.2
Both day and night have increased from 2015 levels
B Applications approved with an outstanding objection from the Police Architectural Liaison Officer
0 Planning Policy Team/DM
2015/16 = 0 2016/17 = 0 0 applications approved with outstanding objection.
A
B
COMMENTARY AND ANALYSIS OF OUTCOME:
The % of people who feel safe during the day has remained around the 90% mark from the start of the Plan period to 2016. It has risen between 2015 and 2016. There are no significant fluctuations that require further investigation that could cause concern. In terms of people who feel safe at night, the trend appears to have gradually increased over the Plan period, from 63.8% in 2011 to 71.2% in 2015. This increase is a very positive outcome for Newport.
No applications have been approved with an outstanding objection from the Police Architectural Liaison Officer.

Newport City Council | Annual Monitoring Report 2016-1776
SA OBJECTIVE 18 – CONSERVATION AND ENHANCEMENT OF THE HISTORIC ENVIRONMENT OF
NEWPORT
TABLE 57: SA OBJECTIVE 18
Monitoring Indicator
Target Source Baseline/PreviousData
Last year colour
Most Recent Data
Outcome
A Amount of developments permitted which adversely affect Scheduled Ancient Monuments, registered historic parks and gardens, listed buildings or conservation areas
No developments permitted over the course of the Plan when there is anoutstanding objection from heritage advisors
LDP AMR 2015/16 = 0 Apps 2016/17 = 4 Apps
4 applications
B Number of conservation area appraisals undertaken during the Plan period
Increase to full coverage
Planning Policy Team
2015/16 = 0 2016/17 = 0 0conservation area appraisals
C Applications approved despite negative outcomes of ASIDOHL
0 LDP AMR
2015/16 = 0 2016/17 = 0 0 applications approved despite negative ASIDOHL
D Loss of ancient woodland
0 LDP AMR
2015/16 = 0 2016/17 = 0 0 applications that led to a loss of ancient woodland
E No. Scheduled Ancient Monuments adversely affected by new development
Nil LDP AMR 2015/16 = 0 2016/17 = 0 0 SAMS adversely affected.
A
B
C
COMMENTARY AND ANALYSIS OF OUTCOME:
Please see commentary and analysis of OB5 MT1 (page 54).
No Conservation Area Appraisals have been undertaken to date. However, much work has been done with Caerleon Civic Society on a Characterisation Study which will form the basis of the Conservation Area Appraisal. In addition, a Characterisation study and part Conservation Area Assessment for the Town Centre has been commissioned and due at the end of 2017.
There have been four applications permitted within the Landscapes of Outstanding Historic Interest designated within Newport. Where an application is located within the Landscape of Outstanding Historic Interest and the outcome of the development is deemed to have more than a local impact then an Assessment of the

Newport City Council | Annual Monitoring Report 2016-1777
D
E
Significance of the Impact of Development on Historic Landscape (ADISHOL) is required. During the past year none of the applications permitted within the Landscape of Outstanding historic Impact have required an ADISHOL. It is therefore concluded that positive significant effects are predicted.
Please see commentary and analysis of OB6 MT2 (page 55).
Please see commentary and analysis of OB5 MT1 (page 54).
SA OBJECTIVE 19 – PROMOTION AND STRENGTHENING AND ENHANCEMENT OF THE CULTURAL
IDENTITY
TABLE 58: SA OBJECTIVE 19
Monitoring Indicator Target Source Baseline/Previous Data
Last year colour
Most Recent Data
Outcome
A % change in the number of community services located within Newport
Increase overall number
Gwent Association of Voluntary Organisations
2015/16 = 214 community services delivered
Baseline Set
2016/17 -222 community services delivered
Increase of 8 services
B % of pupils in Welsh medium education
Increase Education Section
2015/16 = 3.8% Baseline Set
2016/17 = 4%
4% of pupils from Newport attend a Welsh medium primary or secondary school
A
B
COMMENTARY AND ANALYSIS OF OUTCOME:
There are 222 community services delivered within Newport as of 2017. This is an increase of 8 services compared to the previous year and represents a positive outcome.
4% of all pupils from Newport in 2016/17 have a primary or secondary welsh medium education. This is an increase from last year’s figure of 3.8% (+71 pupils).

Newport City Council | Annual Monitoring Report 2016-1778
SA OBJECTIVE 20 – ENABLING OF HIGH AND STABLE LEVELS OF LOCAL EMPLOYMENT IN NEWPORT
TABLE 59: SA OBJECTIVE 20
Monitoring Indicator
Target Source Baseline/PreviousData
Last year colour
Most Recent Data
Outcome
A % change in economically active population
Increase Stats Wales
2011 – 74.32012 – 76.82013 – 73.82014 – 75.32015 – 73.9
2016 =73.6
Decrease of -0.3%
B Unemployment Rate
Decrease Stats Wales
2011 – 10.12012 – 9.52013 – 7.82014 – 7.22015 – 6.6
2016 = 3.8 Decrease of -2.8
C Increase in net job creation of the Plan period
7,400 jobs created within Newport over the Plan period 2011-2016=1600 jobs; 2016-2021=3100 jobs; 2012-2026=2700 jobs
LDP AMR
2011 74,400 baseline
2012 +3,3002013 -4,6002014 +3,8002015 -1,800
2015 = 75,100 jobs. Increase of 1,100 from base, but loss of 1,800 from 2014
Total job creation is up from the baseline, but fluctuating every year.
D Average grossweekly earning (�)
Increase Stats Wales
�534 (2011)�519 (2012)�552 (2013)�521 (2014)�538 (2015)
2016 = �553
Increase in gross weekly wages
A
B
C
D
COMMENTARY AND ANALYSIS OF OUTCOME:
73.6% of the population of Newport is economically active. This is a 0.3% decrease on the 2015 figure.
Unemployment rates in Newport have been consistently falling since the start of the Plan period which is a strong sign that the City is firmly on the road to recovery following recession. The 3.8% recorded for 2016 appears very low and the Stats Wales website acknowledges that this figure could be of limited quality due to the limited number of responses their survey received for this particular subject. Therefore, caution should be applied.
The pattern with regard to the number of jobs created over the Plan period can be described as erratic. There was a significant fall in job numbers in 2013, but the figures increased in 2014. Overall, 1,100 new jobs have been created since the 2011 baseline. The aim must now be for a steady growth pattern as opposed to irregular shifts.
The average gross weekly wage has increased from last year, however, similar to job numbers, the figures have gone up as well as down since the start of the Plan period. The aim is now for a steady increase.

Newport City Council | Annual Monitoring Report 2016-1779
SA OBJECTIVE 21 – IMPROVEMENT IN DIVERSE AND VIABLE BUSINESS GROWTH AND INCREASE IN
ECONOMIC GROWTH
TABLE 60: SA OBJECTIVE 21
Monitoring Indicator Target Source Baseline/PreviousData
Last year colour
Most Recent Data
Outcome
A Mix of employment by sector (%)
Achieve more equitable balance
Stats Wales
2014 2015 See Figure 23 below:
Newport employment sectors are not particularly equitable
B Amount of existing employment land lost to other uses, contrary to policy EM3
Nil LDP AMR
2015/16 – 0.79ha 2016/171.44ha
25 applications determined. 20 were in accordance with EM3, 5 made no reference to EM3.
C Net employment land supply/development (ha/sq.m) (i.e. amount of land in hectares taken up annually for employment purposes in Newport)
An average of 2.3ha of employment land taken up annually over the Plan period
LDP AMR
2015/16 = 6.9ha 2016/17 = 2.59ha
2.59ha of new employment land has been completed this year
A
B
C
COMMENTARY AND ANALYSIS OF OUTCOME:
The employment sector split for Newport demonstrates a reasonable split of job sectors, but it cannot be described as equitable. There is not necessarily a worrying over-reliance for one particular sector.
In relation to SA Objective 21B, please see commentary for OB3 MT4 (page 34).
With regard to SA Objective 21C, the net employment land take-up for this year is 2.59ha. This is above the 2.3ha of employment land predicated. The completions this year have been the conversion of a car showroom to B1/B2/B8 space, expansion of the Therminol production plant at Solutia, temporary use of a farmhouse and surrounding land for B1 offices related to the Junction 28 road works, and the expansion of a steel shed at Newport Docks.
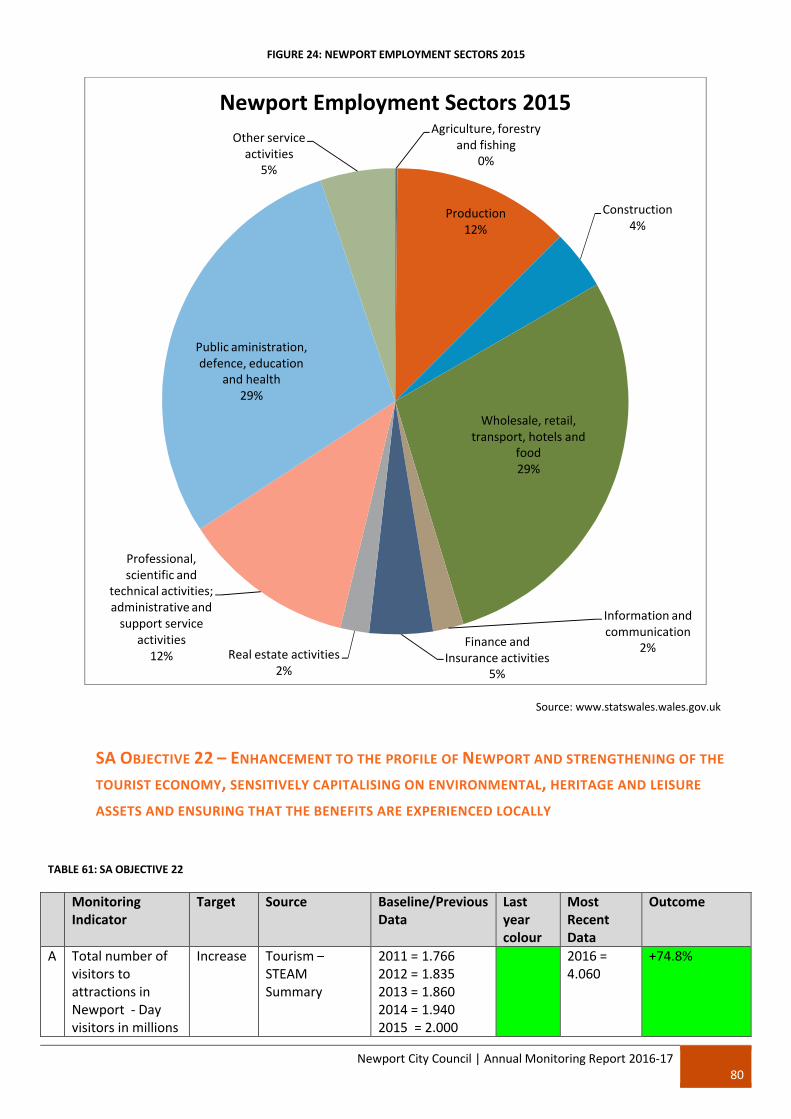
Newport City Council | Annual Monitoring Report 2016-1780
FIGURE 24: NEWPORT EMPLOYMENT SECTORS 2015
SA OBJECTIVE 22 – ENHANCEMENT TO THE PROFILE OF NEWPORT AND STRENGTHENING OF THE
TOURIST ECONOMY, SENSITIVELY CAPITALISING ON ENVIRONMENTAL, HERITAGE AND LEISURE
ASSETS AND ENSURING THAT THE BENEFITS ARE EXPERIENCED LOCALLY
TABLE 61: SA OBJECTIVE 22
Monitoring Indicator
Target Source Baseline/PreviousData
Last year colour
Most Recent Data
Outcome
A Total number of visitors to attractions in Newport - Day visitors in millions
Increase Tourism –STEAM Summary
2011 = 1.7662012 = 1.8352013 = 1.8602014 = 1.9402015 = 2.000
2016 = 4.060
+74.8%
Agriculture, forestry and fishing
0%
Production12%
Construction4%
Wholesale, retail, transport, hotels and
food29%
Information and communication
2%Finance and Insurance activities
5%Real estate activities
2%
Professional, scientific and
technical activities; administrative and
support service activities
12%
Public aministration, defence, education
and health29%
Other service activities
5%
Newport Employment Sectors 2015
Source: www.statswales.wales.gov.uk

Newport City Council | Annual Monitoring Report 2016-1781
B Number of jobs created in the tourism sector
A net increase of 250 full-time jobs within the Plan period.
Tourism –STEAM Summary
2011 = 2,914 2012 = 2,784 2013 = 3,053 2014 = 3,1182015 = 3,124
2016 = 4,102
+23.3%
C Total economic impact of tourism (� millions)
Increase Tourism –STEAM Summary
2011 = �210.25m2012 = �207.11m2013 = �248.04m2014 = �261.76m2015 = �286.62m
2016 = �373.59m
+19.4%
D Number of visitors to the Wetland Reserve
Increase with carrying capacity
RSPB 2015 = 115,564 Baseline Set
2016 = 111,439
Decrease of 4,125.
E Visitors to the Fourteen Locks Visitor Centre
Increase Monmouthshire and Brecon Canal Visitor Centre
2015 = 45,490 Baseline Set
2016 = 42,990
Decrease of 2,500
A
B
C
D
E
COMMENTARY AND ANALYSIS OF OUTCOME:
The number of visitors coming to attractions in Newport continues to increase year on year. Figures from Friars Walk have been factored in to the day visitor statistics for Newport for the first time, therefore the increase of 74.8% should be treated with some caution.
The target to increase the number of tourism related full-time jobs in Newport by 250 over the Plan period has almost been achieved already. Since 2011, 1,188 new tourism jobs have been created. The job figures have increased every year so far and tourism in general appears to be performing well in Newport.
The figures clearly demonstrate that tourism is very important to the Newport economy, generating over �373million. The economic impact of tourism in Newport has increased every year since the start of the Plan period.
The number of visitors to the National Nature Reserve at the Newport Wetlands totalled 111,439 in 2016. This is a decrease of 4,125.
The number of visitors to the Fourteen Locks Visitor Centre during 2016 was 42,990. This is a decrease of 2,500 from the previous year.
SA OBJECTIVE 23 – IMPROVEMENT IN EDUCATIONAL ATTAINMENT AND INCREASE SKILL LEVELS TO
PROMOTE/DEVELOP A GREENER, KNOWLEDGE BASED ECONOMY
TABLE 62: SA OBJECTIVE 23
Monitoring Indicator
Target Source Baseline/PreviousData
Last year colour
Most Recent Data
Outcome
A % increase in Increase Education 2015/16 = 3.8% Baseline 2016/17 = 4% of pupils from

Newport City Council | Annual Monitoring Report 2016-1782
Welsh medium education
Section Set 4% Newport attend a Welsh medium primary or secondary school
B Proportion of people with skills levels above the Welsh average
Improve Newport Spatial Data Unit
2015/16 = 2.2% Baseline Set
2% 2% of the Newport population have a skill level better than the Welsh average
C Number of students staying in Newport following study
Increase University of South Wales
2015 = 697 Baseline Set
2016 = 640 640 students remained in Newport after graduating from the University of South Wales
D S106 agreements that provide educational facilities in accordance with local needs
Increase Planning Obligations Manager
2015/16 – 8 signed agreements totalling �957,767.
Baseline Set
2016/17 – 1 agreement signed totalling �187,155.
1 S106 signed -�187,155
A
B
C
COMMENTARY AND ANALYSIS OF OUTCOME:
Please see commentary and analysis for SA19 B (page 77).
The proportion of people in Newport with skill levels above that of the Welsh Average stands at 2%. This is a small decrease from the 2.2% of last year.
The number of individuals who have graduated from the University of South East Wales who have stayed in Newport following their studies totals 640 individuals. This is a slight decrease on last year.
D One S106 agreement has been signed in 2016/17 which includes an education contribution of �187,155. This is significantly lower than what was secured last year, but this is simply a result of the number and type of schemes that have come forward, rather than signifying any major problems with S106 viability and securing money.
SA OBJECTIVE 24 – REDUCTION IN THE NEED TO TRAVEL AND ACHIEVEMENT OF RESOURCE-EFFICIENT AND CLIMATE RESILIENT SETTLEMENT PATTERNS
TABLE 63: SA OBJECTIVE 24
Monitoring Indicator
Target Source Baseline/PreviousData
Last year colour
Most Recent Data
Outcome
A Proportion of people that travel out of Newport for work
Decrease Stats Wales 2011 – 33.2%2012 – 32.4%2013 – 38.1%2014 – 36.3%2015 – 38.0%
2016 –38.6%
Increase of 0.6%
B Improved levels Improve Welsh 2014 Baseline 36 No update

Newport City Council | Annual Monitoring Report 2016-1783
of good access to local facilities according to the Welsh Index of Multiple Deprivation
Index of Multiple Deprivation 2014
Set Newport LSOAs in 25% least deprived in Wales
12 Newport LSOAs in 25% most deprived in Wales
A
B
COMMENTARY AND ANALYSIS OF OUTCOME:
Since the start of the Plan period, the proportion of people travelling to work outside of Newport has increased by 5.4% which is a negative outcome and contrary to the principles of sustainable development. The increase is not substantial, but there is a general trend which is increasing. Consequently the indicator has been marked as red. With Newport uniquely placed between Cardiff and Bristol, but still significantly cheaper in terms of house prices, there appears to be a growing trend of people from Cardiff and Bristol, purchasing homes in Newport, but continuing to work in Cardiff and Bristol. Further analysis is necessary, but this scenario could explain why the proportion of people travelling out of Newport for work is gradually increasing. [Please note that the 2016AMR incorrectly recorded this indicator. The proportion of people that live and work within Newport was recorded instead of the proportion that live within Newport but work elsewhere].
Out of the 96 Lower Super Output Areas (LSAO) within Newport, there are over 60% within the 50% least deprived LSAOs in Wales with good access to services. There are only 12 Newport LSOAs within the most deprived 25% of all LSOAs in Wales, and 36 Newport LSOAs within the 25% least deprived in Wales. The lowest (worst) ranked LSAO within Newport is in 148th place (Llanwern 1) in Wales, and the highest is at 1898th place(Victoria 2) out of a total of 1909 LSAO in Wales. This is a baseline figure which will be used to judge the ranked increase or decrease in provision of good access to services in Newport in future years. The Welsh Index of Multiple Deprivation is not updated annually and therefore the figure from the 2016 AMR remains.
SA OBJECTIVE 25 – ACHIEVEMENT OF A MODAL SHIFT TO MORE SUSTAINABLE MODES OF
TRANSPORT, INCLUDING WALKING AND CYCLING
TABLE 64: SA OBJECTIVE 25
Monitoring Indicator
Target Source Baseline/PreviousData
Last year colour
Most Recent Data
Outcome
A Newport Railway Station Usage (Counted Entries and Exits).
Increase Office of Rail and Road (ORR)
Newport 13/14 = 2.291m14/15 = 2.389m
Rogerstone 13/14 = 115,11014/15 = 105,938
Pye Corner
Newport 15/16 = 2.561m
Rogerstone 15/16 = 85,658
Pye Corner
Increase of 0.172m
Decrease of 20,280
Increase of

Newport City Council | Annual Monitoring Report 2016-1784
13/14 = N/A14/15 = 15,052
15/16 = 63,332
48,280
B Planning applications granted where there is an outstanding objection from Highways on grounds of the development being unsustainable.
0 DM –Planning Policy Team
2015/16 = 0 2016/17 = 0 0
C Number of business travel plans agreed
Increase Regional Travel Plan Coordinator
2015/16 –baseline of 13
Baseline Set
2016/17 – 14 14 – Lloyds Banking Group now have an agreed travel plan
D % of pupils travelling more than a mile to their primary school
Reduce National Survey for Wales
2014/15 = 30 Baseline Set
2014/15 = 30%
30% - No update available
E % of pupils travelling more than a mile to their secondary school
Reduce National Survey for Wales
2014/15 = 76 Baseline Set
2014/15 = 76%
76% - No update available
F Number and value of S106 agreement secured for improvements in public transport, cycling and walking where appropriate
Increase (Transport Strategy2011)
Planning Obligations Manager Spreadsheet
2015/16 = 4 agreements totalling �102,500
Baseline Set
2016/17 = 1 agreement totalling �105,000
1 agreement signed totalling �105,000.
A
B
C
D
COMMENTARY AND ANALYSIS OF OUTCOME:
Overall, railway station usage in Newport has increased. The number of entries and exits estimated at Newport’s three railway stations combined has increased by almost 304,000. Usage of Rogerstone Station has fallen since 2013, but this is down to the fact that Pye Corner Station is now open and passengers who previously used Rogerstone are now using Pye Corner. As overall usage has increased significantly across the cumulative total of the three stations, it is considered that green is an appropriate colour for this indicator.
No planning applications were approved with an outstanding objection from Highways in 2016/17.
14 Newport companies either have a travel plan in place or have worked with the South East Wales Regional Travel Plan Coordinator to devise initiatives to achieve a modal shift to more sustainable modes of transport. Lloyds Banking Group is the most recent company to create a business travel plan in Newport.
The National Survey for Wales for 2014-15 has not been updated. An estimated 30% of pupils travelled more

Newport City Council | Annual Monitoring Report 2016-1785
E
F
than a mile to their primary school. This figure will be used to set a baseline and will be monitoring in the future.
The National Survey for Wales for 2015-15 has not been updated. An estimated 76% of pupils travelled more than a mile to their secondary school. This figure will be used to set a baseline for future annual monitoring.
�105,000 was secured through the S106 agreement for the Former Sainsbury’s site. �100,000 is a contribution towards pedestrian and cycle route improvements, whilst the remaining �5000 if for a Traffic Regulation Order. Only 1 transport related S106 agreement has been signed this year, but the amount expected is greater than that secured in 2015/16.
SA OBJECTIVE 26 – IMPROVEMENT IN THE VITALITY AND VIABILITY OF THE DISTRICT CENTRE AND
CITY CENTRE
TABLE 65: SA OBJECTIVE 26
Monitoring Indicator
Target Source Baseline/PreviousData
Last year colour
Most Recent Data
Outcome
A City Centre Footfall
Increase (Transport Strategy 2011)
Planning Policy
2014: 8,546,5192015: 8,239,924
2016: 8,084,709 Fall of 155,215
B Independent retailer representation
Increase Regeneration Section
2015: 494 units within the City Centre; 79 units recorded as independent (16%)
2016: 543 units within the City Centre; 188 units recorded as independent(34.6%)
2017: 531 units within the City Centre; 187units recorded as independent (35.2%)
Increase of 0.6%
C Mix of uses in the City Centre
No target Identified
Regeneration Section
2016A1 – 37.0%A2 – 16.0%A3 – 16.0%B1 – 0% C1 – 0%C2 – 0.4%D – 3.0%Sui – 1.0%Vacant = 25%
Baseline Set
2017A1 – 38.0%A2 – 13.0%A3 – 18.0%B1 – 1.0%C1 – 0.5%C2 – 0%D1 – 2.5%Sui – 3.0%Vacant = 24%
A1 – 38.0%A2 – 13.0%A3 – 18.0%B1 – 1.0%C1 – 0.5%C2 – 0%D1 – 2.5%Sui – 3.0%Vacant =24%
D Total annual vacant commercial units in City Centre
Vacancy rate decreasing over the Plan period
Regeneration Section
2015 = 110 vacant units = (22%)
2016 = 138 vacant units (25%)
2017 = 128 vacant units (24%)
The number of vacant units has decreased by 10
E Residents’ satisfaction
Improve Newport Citizen Panel
Please see figure 26below.
Please see figure 26 below.
Figure 26shows an

Newport City Council | Annual Monitoring Report 2016-1786
with living in Newport
increase in the satisfaction levels of people living in Newport.
A
B
C
D
E
COMMENTARY AND ANALYSIS OF OUTCOME:
Footfall figures for 2016 are down by 155,215 on the 2015 figures, which is a further drop on the figures recorded for 2014. This reduction could be a reflection of a shift in retail focus from Commercial Street (where the counter is located) to Friars Walk. Unfortunately the Council does not have access to the footfall figures for Friars Walk to confirm that this is the case. Further, continued analysis of the Commercial Road records should help establish trends and an appropriate policy response if required. The Council is currently exploring the relocation of one counter in order to be closer to Friars Walk.
FIGURE 25: NEWPORT CITY CENTRE, COMMERCIAL ST. FOOTFALL
The Council’s records show that there has been a small increase in the percentage of independent retailers present in the City Centre. The overall number of independent retails has fallen by one unit, but in terms of the overall percentage, this has increased by 0.6%.
Use class A1 is still the dominant use class in the City Centre which is an encouraging sign. There is also a strong presence of complementary uses in the service sector and food and drink venue, but without outperforming the primary retail focus of the City Centre. Overall, the level and variety of uses present in the City Centre is very similar to last year’s levels.
Please see commentary and analysis of OB3 MT5 (page 35).
Newport City Council undertakes research via a Citizen Panel to gauge satisfaction and views on issues relevant to Newport, the Council and its residents. The following data outlines the panel’s views when asked to what extent do you agree with the following statement?
0
100,000
200,000
300,000
400,000
500,000
600,000
700,000
800,000
900,000
1,000,000
Jan Feb Mar Apr May Jun Jul Aug Sep Oct Nov Dec
2015
2016
2017

Newport City Council | Annual Monitoring Report 2016-1787
Newport is a good place to live. Newport is becoming a better place to live. I am proud to say I come from Newport
Review of data from the base date of April 2013 indicates that generally Newport’s residents think that Newport is a good place to live, that it is becoming a better place to live and they are proud to say they come from Newport. There are slight fluctuations between the 6 monthly surveys taken in the last 18 months, but generally responses have remained stable, but greatly improved on the April 2013 position.
Apr2013
Oct2013
Apr2014
Jan2015
July2015
Jan2016
July2016
Jan2017
Newport is a good place to live 42.58% 43.99% 46.85% 43.83% 50.00% 60.81% 55.69% 58.30%Newport is becoming a better place
to live 24.80% 33.04% 41.57% 52.92% 57.86% 70.95% 65.48% 67.33%
I am proud to say I come fromNewport 33.20% 32.94% 37.04% 36.81% 39.60% 43.99% 46.96% 45.04%
0%
10%
20%
30%
40%
50%
60%
70%
80%
To what extent do you agree with the following statements?Source: Involve Newport Citizens Panel
FIGURE 26: RESIDENT SATISFACTION IN NEWPORT

Newport City Council | Annual Monitoring Report 2016-1788
6. CONCLUSIONS AND RECOMMENDATIONS
6.1. The 2017 AMR is the second monitoring report to be prepared since the adoption of the LDP in January 2015. The findings of the AMR provide an important opportunity for the Council to assess the effectiveness of the LDP and to determine whether changes are necessary.
6.2. In accordance with LDP Regulation 37 (2005), the AMR must include an assessment against seven questions. These questions are addressed below:
i. Does the basic LDP Strategy remain sound?
6.3. The LDP focuses on a sustainable development strategy with particular emphasis on regeneration, building on the culture and heritage of the City, and seeking to maximise the use of previously developed (brownfield) land. The evidence collected throughout this AMR demonstrates that the LDP Strategy is working. Significant house building is taking place with over 99% being achieved on previously developed land, which is a major part of the LDP Strategy.
ii. What impacts are policies having globally, nationally, regionally and locally?
Globally
6.4. On a global scale, the LDP is having a positive impact with regard to environmental factors. There has been one renewable energy scheme for a biomass heater at Newport Docks, plus positive indicators have been recorded against a number of the sustainability appraisal indicators. For example:
SA Obj 5 - Significant reduction in emissions of greenhouse gases SA Obj 8 - Reduction in water consumption SA Obj 10A - Reduction in average electrical consumption SA Obj 12 – Waste reduction
6.5. The above sustainability indicators were recorded as positive in last year’s AMR as well, therefore demonstrating a positive trend is starting to occur with regard to the environmental factors. The number of approved renewable energy schemes this year only stands at one, whereas four were approved last year, but it is expected that this might be down to the UK Government cessation of their subsidy programme.
6.6. The granting of the Wales International Convention Centre (WICC) at the Celtic Manor in line with Policy CF9of the LDP was reported last year. The construction of this major development has now commenced, and once completed, is expected to attract events from across the UK and rest of the world.
Nationally
6.7. On a national scale, Newport is delivering a significant amount of housing in accordance with the LDP. Last year, it was reported that housing completions in Newport were the highest they have ever been. This year, the record figure from last year has been surpassed, with Newport recording completions of 952 homes in 2016/17. Last year’s 908 new homes turned out to be the highest of any authority in Wales. Newport

Newport City Council | Annual Monitoring Report 2016-1789
provided over 11% of the total housing built in Wales in 2015/16. Considering Newport is only the seventhlargest authority in term of population out of the 25 local planning authorities in Wales, to be the highest provider of housing is a strong achievement. It is very much expected that this year’s 952 completions will be one of the highest in Wales, if not the actual highest again. This activity is significantly helping to address the national housing shortage in the UK and Wales more specifically.
6.8. In addition, the LDP employment land allocations are also helping with national economic growth. Objective 3 (Economic Growth) details the amount of employment land that has been granted this year, plus it also provides commentary on the delivery of the EM1 sites. Objective 3 MT3 unfortunately identifies a fall in job numbers from the figure previously recorded, and the actual number has slightly dipped below the LDP forecast rate for the first time. It is hoped that this trend can be reserved in the near future with the expectation that the Cardiff Capital Region City Deal will start to take effect, for example, the announcement of the �37.9m to support the development of a Compound Semiconductor industry cluster, most likely to be in West Newport, is anticipated to create up to 2,000 new high value and high-tech jobs.
6.9. The Proton Beam Therapy Centre at Celtic Springs is also expected to be operational later this year. The facility is expected to treat over 500 patients a year and the high tech nature of the therapy on offer means it will be a centre of national importance.
Regionally
6.10. At a regional level, the Cardiff Capital Region City Deal is gathering pace and Newport is likely to play a key role in helping to drive this forward. Initiatives are currently being explored across the region with regard to increasing house building rates. This is something which Newport is currently excelling at, and in particular, the Newport LDP has been instrumental in facilitating this growth. The possibility of a Compound Semiconductor industry cluster in West Newport is also something that will benefit the region enormously.
Locally
6.11. On the local scale, 175 affordable units were completed this year, which increases the total to 575 affordable units since the start of the Plan period. These are significant numbers and the provision of affordable housing is vitally important in trying to reduce the housing waiting list, which has unfortunately increased since last year.
6.12. Almost 100% of the units delivered, both market and affordable, were delivered on brownfield land. Therefore helping to regenerate sites which are often derelict and unsightly, and consequently continuing to protect the majority Newport greenfield land. Other indicators with a positive local outcome include:
Obj 3 MT7 – Protecting the City Centre by limiting retail development outside of the City Centre Obj 4 MT2 – Healthy local housing land supply Obj 6 MT2 – No loss of protected ancient woodland or trees Obj 7 MT2 – Increasing sustainable forms of transport SA Obj 17A – High percentage of people feeling safe in their local areas.

Newport City Council | Annual Monitoring Report 2016-1790
iii. Do the policies need changes to reflect changes in national policy?
6.13. Section 3 of the AMR contains information which details the changes that have been implemented to planning policy at a national level. Whilst changes to national policy have taken place which will have implications for any future review of the LDP, the conclusion was made that no significant changes have occurred that would impact on policies in the current LDP.
iv. Have policies and related targets been met or progress is being made towards meeting them, including publication of relevant supplementary planning guidance (SPG)?
6.14. Sections 4 and 5 go into detail with regard to whether the indicator targets are being met, not being met, or whether mixed results are being produced. An overall summary of the targets and the recorded outcomes is shown in the three tables below. In the majority of cases, positive outcomes have been recorded. Therefore the majority of targets are being met.
6.15. With regard to SPGs, three new SPGs have been adopted this year. They are:
Mineral Safeguarding Outdoor Play Space Provision Trees, Woodland, Hedgerows and Development Sites
6.16. An updated version of the ‘Housing in Multiple Occupation’ SPG was also adopted. In terms of SPGs currently being worked on, an Air Quality SPG is expected to be consulted upon shortly and adopted later in the year. Work is also progressing on a Special Landscape Areas SPG.
v. Where progress has not been made, the reasons for this and what knock on effects it may have?
6.17. The three tables below summarise all AMR indicators and identify their outcomes. As noted above, the majority of indicators have been recorded as green. Where indicators are not recorded as green, further commentary is offered below the respective tables.

Newport City Council | Annual Monitoring Report 2016-1791
TABLE 66: CONTEXTUAL INDICATORS
Total Summary of Indicator Ref 2016AMR
Positive outcome 1 Most deprived areas of Newport compared to Wales as a whole CON 1
Mixed outcome 0
Negative outcome
3 Reported crime incidents in Newport CON 2
Economic activity rates in Newport CON 3
Residents commuting out of Newport CON 4
Positive Outcome
6.18. One core indicator has been recorded as positive. The Welsh Index of Multiple Deprivation has not been updated since 2014, therefore there has been no change.
Negative Outcome
6.19. Three out of the four contextual indicators have been recorded as having a negative outcome. Reported crime in Newport continues to increase. This trend mirrors the national trend and the negative results may be partly down to how crime is now recorded compared to the past. Nevertheless, continued increases in reported crime across the City is a worrying situation.
6.20. Economic activity rates across Newport have fallen for the third year in a row. In last year’s AMR, it was actually reported that rates had increased between 2014 and 2015, however, Welsh Government has subsequently amended the figures and a decline has now been recorded. As noted in the main analysis of the contextual indicator, statistics relating to population and jobs are often updated following publication. Therefore a degree of caution should be applied when considering this indicator as economic activity rates for previous years can remain fluid for some time before becoming fixed. What is perhaps particularly concerning is that the Wales economic activity rate is higher than Newport, and the UK’s is significantly higher.
6.21. Finally, there has been an increase in the number of people working in Newport, which is good news; however, the percentage of people who work outside of Newport has also increased slightly. As a result, this contextual indicator has been recorded as red. It is only a small increase of 0.6%, but there has now been an increase recorded for the last three years. People working outside of Newport is not ideal for sustainability purposes, however, due to the compact nature of local authorities in South East Wales and the proximity of Bristol and Cardiff, it is likely that this out-migration pattern is likely to continue in the near future. With the possibility of the Severn Bridge Tolls being reduced, or even scrapped, there is a further risk that Newport will be seen as a cheaper alternative to reside for those who work in Bristol and surrounding areas, consequently having further negative implications for sustainability and the objective of reducing travel.

Newport City Council | Annual Monitoring Report 2016-1792
TABLE 67: CORE AND LOCAL INDICATORS
Total Summary of Indicator Ref 2016AMR
Positive Outcome
16 Greenfield land lost OB1 MT1Renewable energy schemes permitted OB2 MT1Permissions granted contrary to water supplier advice OB2 MT3Maintaining an employment land supply OB3 MT2Job creation OB3 MT3Commercial vacancy rates in the City Centre OB3 MT5Retail development outside of the City Centre OB3 MT7Housing completions on brownfield land OB4 MT1Maintaining a 5 year housing land supply OB4 MT2Housing completions on H1 LDP housing sites OB4 MT8Development density OB4 MT9Development permitted outside the settlement boundary OB4 MT10Provision of a Gypsy/Traveller Site OB4 MT13Protected woodland and trees lost to development OB6 MT2Permissions granted contrary to Highways advice OB7 MT2Maintain sufficient waste capacity OB10 MT1
Training Required
7 Environmental space lost contrary to policy OB1 MT2Development within a mineral safeguarding area OB1 MT4Employment land lost to other uses OB3 MT4Permissions affecting sites of historical value OB5 MT1Permissions affecting SSSI or SINC OB6 MT1Development permitted within Green Belt/Green Wedge OB6 MT3Loss of community facilities OB7 MT1
SPG Required
0
Further Research
12 Development permitted in C1 and C2 floodplains OB1 MT3Permissions granted contrary to NRW advice OB2 MT2Take up of net additional employment land OB3 MT1Non-retail uses in primary and secondary frontages OB3 MT6Annual housing completions OB4 MT3Completions at Llanwern Village Strategic Housing Site OB4 MT4Completions at Glan Llyn Strategic Housing Site OB4 MT5Completion of affordable housing units OB4 MT6Residual values across housing submarket areas OB4 MT7Delivery of Hartridge Farm Rd Gypsy/Traveller Site OB4 MT11Accommodation provision for Gypsy/Travellers OB4 MT12Number of Gypsy/Traveller unauthorised sites OB4 MT14
Policy Review
0
Plan Review
0

Newport City Council | Annual Monitoring Report 2016-1793
Positive Outcome
6.22. 16 indicators have been recorded as positive. This is unfortunately a reduction on the 21 that were recorded as positive in the 2016 AMR. There was one indicator, ‘Development permitted outside the settlement boundary’, which was recorded as ‘blue’ last year, but is ‘green’ this year. This demonstrates a good result and improvements have been made.
Training Required
6.23. Seven indicators have been identified as ‘blue’ (training required). This is one more than last year. More disappointingly, four indicators recorded as blue last year have also been recorded as blue this year, meaning that the training and information provided last year has not been as successful as it could have been.
6.24. In October 2016, following the publication of the AMR, a briefing and training session was provided to planning officers from across the Council. Policy Officers provided a presentation on the AMR, and part of this presentation involved identifying the policies which should have been considered for certain applications which were not. There was a definite trend exposed in that ‘newly introduced’ 2015 LDP policies were not being considered fully by officers. Many of the LDP policies have similar wording to theformer UDP policies, but there are several ‘newly introduced’ policies, such as mineral safeguarding areas, which were not part of the former UDP and it is these ‘newly introduced’ policies which still appear to be being overlooked.
6.25. As the AMR presentation was held in October 2016, this AMR reports on planning applications determined between 1 April 2016 and 31 March 2017. Therefore there were six months of applications in 2016 which had already been determined before the presentation was given. This is likely to explain the reasons why certain indicators have been recorded as blue for two years running. Certainly, with regard to ‘employment land lost to other uses’, the analysis demonstrates that out of 25 relevant applications, five appear not the have fully considered Policy EM3 (Alternative uses of Employment Land). However, when analysed further, the five applications which failed to consider Policy EM3 were actually determined prior to October 2016. Therefore they were determined prior to the presentation and training and subsequently all relevant applications determined after the presentation and training was given, considered Policy EM3 accordingly. This is a more positive result than initially perceived.
6.26. However, with respect to the other indicators being recorded as blue for two years running, there is no similar reasoning. There were 12 applications permitted within mineral safeguarding areas over the past year. Out of the 12, eight did not consider the mineral safeguarding area and Policy M1 in the officer report. Whereas this is a slight improvement on the performance records in the 2016 AMR, this is clearly not acceptable. The eight applications were determined across the year, and therefore this situation cannot be down to the timing of the training. Further analysis into this has revealed potential issues with the mineral safeguarding GIS layer not appearing on one of the Council’s planning IT systems. This situation will be explored further and rectified, and training and reminders will again be provided.
6.27. There were six applications permitted within the Green Belt or Green Wedge this year. On five out of the six occasions, the correct policies were considered. There was one occasion where a conversion and extension was approved in the Green Wedge without considering Policy SP7. It is unlikely the consideration of SP7 would have changed the outcome, however it is still the case that the policy should have been considered

Newport City Council | Annual Monitoring Report 2016-1794
and referred to the officer report. As this situation only relates to one application, it appears that this was simply an accidental omission rather than anything more widespread.
6.28. The loss of community facilities is more concerning. The indicator was identified as blue last year and remains blue this year. In total, five community facilities have been lost this year without appropriate consideration of Policy CF12. It is highly unlikely the facilities would have been saved if the policy was considered, but the purpose of the policy is to check that the facility is surplus to requirements and is no longer necessary. Unfortunately, as there was no mention of Policy CF12 in the officers’ reports, there is no evidence to confirm that this has been done. Further training and reminders are needed to make sure officers consider Policy CF12 for future planning applications involving the potential loss of a community facility.
Further Research
6.29. There were 12 indicators recorded as needing further research this year, compared to 7 indicators in the 2016 AMR. The 7 indicators which were recorded as yellow last year have remained yellow this year. These are:
Take up of additional employment land Non-retail uses in primary and secondary frontages Annual housing completions Completion of affordable housing units Delivery of Hartridge Farm Rd Gypsy/Traveller site Accommodation provision for Gypsy/Travellers Number of Gypsy/Traveller unauthorised sites
6.30. Last year’s AMR concluded by pledging to research employment land delivery rates across the rest of South East Wales. This has occurred, and Newport is the only authority which has actually delivered new employment land on its LDP allocations. The Celtic Business Park EM1 (vii) and Solutia (iv) have both seen development, with the Celtic Business Park attracting the global company ‘Amazon’. The fact that Newport is developing employment land demonstrates confidence in the City. The rate at which it is being delivered is slower than that anticipated in the Employment Land Review and LDP, but coming out of a recession; it was difficult to predict anything meaningful. The authority will continue to monitor progress , but in comparison to other authorities, early indications suggests that Newport is actually performing very well in terms of employment land delivery.
6.31. In terms of non-retail uses in primary and secondary frontages, the authority continues to gather data in preparation for a possible policy review for LDP 2. As previously reported, with the introduction of Friars Walk, the City Centre is in a state of flux. The retail policies currently in the LDP are considered too restrictive and there have been examples this year and last year where material considerations such as vacancy rates were considered to outweigh the primary and secondary frontage policy requirements. As such, the policies are restrictive, but they are not preventing appropriate development, and consequently it has been determined there is no need for an immediate review, but rather wait until the preparation of LDP 2.
6.32. Total housing completions and completion of affordable housing units remain at a high level. Unfortunately, the delivery rates are slightly below the required delivery rates contained in the LDP, however, they are still

Newport City Council | Annual Monitoring Report 2016-1795
the highest rates the authority has ever recorded. The rates being recorded are very close to the adopted LDP required rates, and with a healthy housing land supply, there is no need to be alarmed. Newport is currently delivering on its housing numbers.
6.33. With respect to the indicators recorded on Gypsy/Traveller accommodation, the Council is in the process of building the site at Hartridge Farm Road. The delivery has slipped slightly, as the site should have been ready in 2016. This has obviously not happened, but planning permission has been granted, archaeological investigations have been completed, and development of the community block and onsite pitches have commenced. Therefore, in the near future, residents should be moving in, which should then hopefully have positive consequences for the indicators relating to Gypsy/Traveller provision in this AMR.
6.34. The above six indicators which were recorded as yellow last year and yellow again this year, do not really require much further investigation. In the majority of cases, we know the reasons why they have not hit their LDP target. This has been analysed and no further research is considered really necessary. However, the indicators which have been recorded yellow this year which were not yellow last year, may require further analysis and research. Development on the C1 or C2 floodplain being a prime example.
6.35. A large proportion of Newport is situated on the floodplain. Therefore flood risk is often a factor when determining planning applications. However, this year, there have been several examples of applications being approved which did not meet all of the TAN 15 tests and one was approved by a special planning committee despite a refusal officer recommendation and an outstanding objection from NRW, but was not then subsequently called in by Welsh Government. It appears there is a need to establish a more consistent approach between Newport, NRW and Welsh Government. Work is already underway on revising TAN 15, and this might be enough in order to ensure a consistent approach is taken, but as climate change continues to appear in the news headlines, and as pressure for development continues, flood risk issues are likely to become more and more frequent.
6.36. Completions on two of Newport’s strategic housing sites have also been recorded as yellow. However, last year, Llanwern Village was recorded as orange, and in need of a policy review, so to be recorded as yellow this year represents an improvement. Over the last year, the Council has been working closely with Gallagher Estates agreeing a revised planning application with an amended S106 agreement which was approved in June 2017. There has been a recent surge in activity, and Gallaghers state that they intend to commence on site in the Autumn 2017 with first completions expected in 2018. This is good news as the delivery of this strategic site is key to the success of the LDP. The LDP predicted first completions in 2015, but with various setbacks, the delivery rates have not been hit. However it is very much hoped that recent activities will mean that Llanwern Village will begin building very soon.
6.37. Glan Llyn is the other of Newport’s strategic housing sites which has fallen behind with targets, however, the first primary school is expected to be open in September 2018, and the authority understand other developers are interesting in acquiring parcels for development. The presence of a school is likely to be a major attraction, which will hopefully accelerate building rates, and delivery rates will start to pick up again.
6.38. Finally, the remaining indicator recorded as yellow is focussed on residual values across housing submarket areas. This indicator was established to monitor the fluctuations of property selling prices against the actual amount it costs to build the property. If the gap between build costs and selling prices (the residual value) exceeds the 5% target, then this triggers a response. Evidence collected highlights that residual value changes across the six submarket areas have increased by more than 5%. Newport West has seen the largest percentage change of 15.1%, whilst Malpas and Bettws saw the smallest change of 6.76% (but still

Newport City Council | Annual Monitoring Report 2016-1796
above the 5% target). Therefore in theory, all areas of Newport should be able to afford to provide more affordable housing, either through physical provision or commuted sums. As demonstrated in the analysis of OB4 MT7 and SA Obj 6B, it is clearly not the case that developers should be able to afford to provide more affordable housing as they appear to be struggling to meet the current requirements. Further research and analysis is required with this indicator as the Council continues in its quest to establish a fair and reasonable affordable housing target and commuted sums which are affordable for developers and do not stifle growth.
TABLE 68: SUSTAINABILITY APPRAISAL INDICATORS
Total Summary of Indicator Ref 2016AMR
Significant positive effects are predicted
43 Applications within 3km of Accessible Natural Greenspace SA1 APermissions granted with the loss of a Public Right of Way SA1 BProtected woodland lost to development SA2 AImportant wildlife habitat lost to other uses SA2 CGreenfield land lost to development SA3 AAverage density of developments SA3 BWater quality objection from Environmental Health SA3 CLoss of agricultural land SA3 DCarbon dioxide emissions SA5 AApplications refused on noise issues SA6 APermissions granted contrary to water supplier advice SA7 ADevelopments meeting water efficiency standards SA8 AHouseholds ordering water efficiency products SA8 BInstallation of water efficient fixtures SA8 CProperties approved in flood risk areas SA9 CActions implemented in Shoreline Managements Plan 2 SA9 DAnnual electricity consumption per household SA10 AMunicipal waste reused, recycled and composted SA12 BEnergy from waste SA12 CWaste sent to landfill SA12 DApplications where DAS is not submitted SA13 AResidential applications not contributing to affordable housing SA16 BPeople feeling safe in Newport SA17 APermissions with objection from Police SA17 BApplications approved despite negative ASIDOHL comments SA18 CLoss of ancient woodland SA18 DScheduled Ancient Monuments affected by development SA18 ECommunity services within Newport SA19 APupils in Welsh medium education SA19 BUnemployment rate SA20 BGross weekly earnings SA20 DNet employment land developed SA21 CVisitors to attractions in Newport SA22 AJobs created in tourism sector SA22 BEconomic impact of tourism SA22 CIncrease in Welsh medium education SA23 ANewport railway station usage SA25 APermissions with an outstanding objection from Highways SA25 B

Newport City Council | Annual Monitoring Report 2016-1797
Business travel plans agreed SA25 CValue of transport related S106 agreements SA25 FIndependent retailer representation SA26 BVacant commercial units in the City Centre SA26 DResidents’ satisfaction living in Newport SA26 E
Mix of positive and negative predicted
30 Environmental space lost in total SA1 CMajor applications with landscape strategies SA1 DDevelopments affecting a SLA SA1 EDevelopments negatively affecting a SINC SA2 BNew developments with ecological management schemes SA2 DLand enhanced through use of S106 agreement SA2 EAir Quality Management Areas SA4 AImprovements to sewerage/water through S106 SA7 BDevelopment permitted in flood zones C1 and C2 SA9 APermissions with SuDS schemes SA9 BImprovements to energy/telecommunication through S106 SA10 CRenewable energy developments permitted SA11 AImprovements to waste infrastructure through S106 SA12 A% of major schemes where DCfW have been consulted SA13 BPermissions with objection from Environmental Health SA14 BEnvironmental space lost contrary to policy SA15 AAffordable housing delivery SA16 AGypsy/Traveller sites as percentage of need SA16 EPermissions which affect historical assets SA18 AConservation appraisal undertaken during Plan period SA18 BEconomically active population SA20 AJob creation SA20 CMix of employment by sector SA21 AEmployment land lost to other uses SA21 BVisitors to the Wetlands Reserve SA22 DVisitors to the Fourteen Locks Visitor Centre SA22 EPeople with skills above Welsh average SA23 BStudents staying in Newport following study SA23 CS106 agreements providing education facilities SA23 DCity Centre Footfall SA26 A
Significant negative effects are predicted
4 Community facilities lost contrary to policy SA14 A
Loss of community facilities in total SA15 B
Applications on housing waiting list SA16 C
People travelling outside of Newport for work SA24 A
Baseline set – No data available or no target set
7 Applications permitted with noise mitigation measures SA6 BOwners signing up to NCCs energy performance programme SA10 BAffordable housing meeting Welsh Quality Standards SA16 DLevel of access to local facilities SA24 BPupils travelling more than a mile to primary school SA25 DPupils travelling more than a mile to secondary school SA25 EMix of uses in the City Centre SA26 C

Newport City Council | Annual Monitoring Report 2016-1798
6.39. The above table summarises the outcomes of all sustainability appraisal indicators. The majority recorded positive effects. 43 indicators have been recorded as green, which is an increase on 37 from the 2016 AMR.More concerning, is that 30 have been recorded as orange (compared to 18 last year) and four have been recorded as red (compared to none last year). It is worth noting that 29 indicators were recorded as white in the 2016 AMR, the majority of which were setting a baseline. Therefore this needs to be considered when analysing the information as this is obviously a factor in the sharp increase in orange indicators. Further analysis is offered below.
Significant positive effects predicted
6.40. There have been 15 indicators recorded as green this year which were either orange or white in last year’s AMR. This demonstrates that improvements have been recorded. The improved sustainability indicators are:
Applications within 3km of Accessible Natural Greenspace Carbon Dioxide Emissions Developments meeting water efficiency standards Households ordering water efficiency products Installation of water efficient fixtures Properties approved in flood risk areas Municipal waste reused, recycled and composted Residential applications not contributing to affordable housing People feeling safe in Newport Community services within Newport Pupils in Welsh medium education Increase in Welsh medium education Newport railway station usage Business travel plans agreed Value of transport related S106 agreements Vacant commercial units in the City Centre
6.41. The LDP will have had an indirect role in helping to improve all of the indicators. The reduction of vacant commercial units in the City Centre is positive news and worthy of note. Similarly, more people are saying that they are feeling safer within Newport, which is probably down to the vastly improved night time economy in the City Centre following the opening of Friars Walk. 27 indicators have been recorded as green for the second year running, maintaining high or improved standards.
Mix of Positive and Negative Effects Predicted
6.42. There have been 22 sustainability indicators which have seen a fall in performance compared to last year and have been recorded as orange. These are:
Major applications with landscape strategies Developments negatively affectively a SINC New developments with ecological management schemes Land enhanced through use of S106 agreement

Newport City Council | Annual Monitoring Report 2016-1799
Air Quality Management Areas Improvements to sewerage/water through S106 Permissions with SuDS schemes Improvements to energy/telecommunication through S106 Renewable energy developments permitted Improvements to waste infrastructure through S106 % of major schemes where DCfW have been consulted Permissions with objection from Environmental Health Environmental space lost contract to policy Gypsy/Traveller sites as percentage of need Permissions which affect historical assets Economically active population Job creation Visitors to the Wetlands Reserve Visitors to the Fourteen Locks Visitor Centre People with skills above Welsh average Students staying in Newport following study S106 agreements providing education facilities
6.43. Several of these indicators have fallen in performance due to the fact that fewer applications have been received. Therefore, for example, major applications with landscape strategies has been recorded as orange, not because the Council is failing to seek landscape strategies, but because 275 relevant planning applications were considered last year, compared to the 169 applications considered and assessed this year.The monitoring indicator target is to increase the number of major applications with landscape strategies. Last year, 19 out of 275 planning applications were recorded, but this year, 12 out of 169 planning applications were recorded. This is a reduction of seven applications, but due to the nature of how the indicator is recorded, it is recorded as orange. Therefore, many of the indicators that are based on application numbers are entirely dependent on the number and types of applications received by the Council throughout the year. How these types of indicator are recorded will be reviewed in the next LDP.
6.44. The sustainability indicators listed above which are not related to application numbers have generally been covered in the analysis of the core indicators. Of concern is environmental space lost contrary to policy, gypsy/traveller need, economically active population and job creation, however all these have been addressed as part of the core indicator analysis. People with skills below the Welsh average and students staying in Newport following study have both fallen, which is a worrying trend and helps to give an overall picture of the City, but it is difficult to see how it can attributed to any failings of the LDP.
6.45. Developments affecting Special Landscape Areas has been identified as orange for the second year running. Three applications were determined where the SLA was not considered. This is an improvement on last year, but nevertheless, they still appears to be a training requirement to remind officers of the SLAs. The Council is in the process of devising a SPG which will help guide development proposals in SLAs.
Significant negative effects are predicted
6.46. There were four sustainability indicators recorded as red this year compared to none last year. Two relate to the loss of community facilities which has already been covered in some detail in the core indicator section of this AMR.
Newport City Council | Annual Monitoring Report 2016-17100
6.47. Applications for accommodation on the housing waiting list have increased from last year, resulting in this indicator being recorded as red. Despite building a record number of market and affordable houses this year, more and more people are registering for accommodation on the Council’s housing waiting list. This fact simply demonstrates the importance of creating affordable housing, and despite the 175 affordable units delivered this year, more is needed due to the growing demand.
6.48. Finally, there is a trend emerging with regard to people travelling outside of Newport to work. As previously mentioned, with Newport’s proximity to Cardiff and Bristol, as well as multiple local authorities being in very close proximity, Newport is an ideal place to live and would only be a short commute to work outside of the authority. There is a danger, if this trend continues, that Newport could effectively become a commuter city, with people choosing to live here but work elsewhere. We are a long way from this scenario, but Newport needs to ensure that it provides the jobs along with the housing in order to enhance its status as a sustainable city.
vi. What aspects, if any, of the LDP need adjusting or replacing because they are not working as intended or are not achieving the objectives of the strategy and/or sustainable development objections?
6.49. Two elements of the LDP might require adjusting in due course, but following consideration of all evidence gathered, there are no specific elements requiring immediate attention.
6.50. In terms of the two elements which might require attention in the future, one relates to primary and secondary frontages in the City Centre, however, it is recommended that the Council allows the Friars Walk development to properly ‘bed-in’ first and allow retail patterns to settle, before determining whether action might be required. The second relates to Policy H4 and the seeking of affordable housing contributions from smaller sites. Viability of small sites continues to be an issue. The Council has already temporarily reduced the levels sought from smaller sites in an attempt to make more smaller developments more viable. This trial period will continue until the Autumn 2017, when the Council will determine whether or not to formally change and review the Affordable Housing SPG, try a further alteration to the commuted sums, or possibly revert back to the original adopted SPG figures.
vii. If policies or proposals need changing, what suggested actions are required to achieve this?
6.51. The Council does not consider that any aspects of the LDP need adjusting or replacing at this time. As discussed above, a review of the Affordable Housing SPG and the commuting sums sought might be necessary, but this will not impact on the overall H4 Policy at this stage.

Newport City Council | Annual Monitoring Report 2016-17101
RECOMMENDATIONS
6.52. This second AMR has recorded significant progress. Housing delivery rates are the highest they have ever been, and are broadly in line with the required delivery rates set out in the adopted LDP. The Council continues to have a healthy housing land supply, and especially when compared to other authorities in Wales, Newport appears to be doing exceptionally well. The City is also starting to deliver more employment land, with numerous exciting projects in the pipeline which can hopefully be reported next year.
6.53. Following consideration of all evidence gathered as part of the AMR progress, the recommendations are:
1. Ensure further training, guidance and clarification is provided in relation to:o Environmental space lost to developmento Development within a mineral safeguarding areao Employment land lost to other useso Development affecting sites with historical valueo Development resulting in the loss of SSSI or SINCo Development within the green wedgeo Loss of community facilitieso Special Landscape Areas
2. Further research into:o Development permitted in flood zones C1 and C2. Interpretation of TAN 15 and working with
NRW and Welsh Government to ensure consistency.
3. Continue to assist and encourage as best as possible the delivery of:o Hartridge Farm Road Gypsy/Traveller Siteo Llanwern Village and Glan Llyn Strategic Housing Sites
4. Consider a review of the Affordable Housing SPG and commuted sums sought in relation to Policy H4
5. Keep a watching brief of activity in the City Centre and acquire any relevant evidence in preparation for a policy review of the primary and secondary retail frontages for the future
6. Continue to monitor indicators and capture data in preparation for the 2018 AMR
6.54. The Council is of the view that the LDP is performing well and enabling growth in sustainable locations. Following a consideration of the evidence gathered, there is no indication that there is a need for a full or partial review of the LDP at this stage.

Newport City Council | Annual Monitoring Report 2016-17102
GLOSSARY
AMR Annual Monitoring Report
ANG Accessible Natural Greenspace
AQMA Air Quality Management Areas
ASIDOHL The Assessment of the Significance of Impacts of Development on Historic Landscape
BCIS Building Cost Information Service
BREEAM Building Research Establishment’s Environmental Assessment Method
Brexit A term used for the withdrawal of The United Kingdom of Great Britain and Northern Ireland from the European Union
CADW The Welsh Government’s historic environment service working for an accessible and well-protected historic environment for Wales.
CIL Community Infrastructure Levy
CO� Carbon Dioxide
COU Change Of Use
DAS Design and Access Statement
DCfW Design Council for Wales
DECC Department for Energy and Climate Change
DM Development Management
EA Environment Agency
EfW Energy from Waste
Env Health Environmental Health
EU European Union
GGAT The Glamorgan-Gwent Archaeological Trust
GTAA Gypsy and Traveller Accommodation Assessment
G7 The Group of Seven (G7) is an informal bloc of industrialised democracies –The USA, Canada, France, Germany, Italy, Japan, and the UK.
ha Hectare
HECA Home Energy Conservation Act 1995

Newport City Council | Annual Monitoring Report 2016-17103
HMO House in Multiple Occupation
JHLAS Joint Housing Land Availability Study
LBAP Local Biodiversity Action Plan
LDO Local Development Order
LDP Local Development Plan
LG LG is a South Korean multinational conglomerate corporation
LHMA Local Housing Market Assessment
LNR Local Nature Reserve
LPA Local Planning Authority
LSOA Lower Super Output Area
MT Monitoring Target
NCC Newport City Council
NDF National Development Framework
NHBC National House Building Council
NNR National Nature Reserve
NOx Nitrous Oxide
NRW Natural Resources Wales
OB Objective
ONS Office for National Statistics
ORR Office of Rail and Road
PPW Planning Policy Wales
Q Financial Quarter
RICS Royal Institute of Chartered Surveyors
RSL Registered Social Landlord
RSPB Royal Society for the Protection of Birds
SA Sustainability Appraisal
SAM Scheduled Ancient Monument
SA Objective Sustainability Appraisal Objective

Newport City Council | Annual Monitoring Report 2016-17104
SAP Standard Assessment Procedure
SEA Strategic Environmental Assessment
SDP Strategic Development Plan
SFCA Strategic Flood Consequence Assessment
SINC Site of Importance for Nature Conservation
SIP Single Integrated Plan
SLA Special Landscape Area
SMP Shoreline Management Plan
SPG Supplementary Planning Guidance
SSSI Site of Special Scientific Interest
STEAM Scarborough Tourism Economic Activity Model. A tourism economic impact modelling process which approaches the measurement of tourism from the bottom up, through its use of local supply side data and tourism performance and visitor survey data collection. The STEAM process is designed to engage the client and maximise the benefit of local tourism expertise.
SuDS Sustainable urban Drainage Systems
Sui Generis Certain uses do not fall within any use class and are considered 'sui generis'. Such uses include: betting offices/shops, pay day loan shops, theatres, larger houses in multiple occupation, hostels providing no significant element of care, scrap yards. Petrol filling stations and shops selling and/or displaying motor vehicles. Retail warehouse clubs, nightclubs, launderettes, taxi businesses, amusement centres and casinos.
TAN Technical Advice Note
TPO Tree Preservation Order
UDP Unitary Development Plan
VVP Vibrant and Viable Places
WDC Whitehead Development Company Ltd
WG Welsh Government

Newport City Council | Annual Monitoring Report 2016-17105
APPENDIX 1 – DELIVERY AND IMPLEMENTATION OF LDP ALLOCATIONS
HOUSING ALLOCATIONS
A1.1. The following table summarises the progress which has been made with regard to the delivery of housing allocations listed within the LDP. The green rows demonstrate that the site has been completed, blue represents under construction, whilst the white shows that no completions have taken place yet.
TABLE 69: PROGRESS MADE ON LDP HOUSING ALLOCATIONS AS OF 1 APRIL 2017
LDP Reference Units to deliver within LDP
Units complete
% complete
Progress Update
H1(1) McReadys, Ponthir Rd
54 29 54% Enzo Homes on site. 21 units under construction, with completion of the whole site expected by the end of 2019.
H1(3) Llanwern Village
1100 0 0% Planning application 16/0864 – variation of conditions 02 (reserved matters), 03 (masterplan) and 05 (design code) of planning permission 13/0806 for variation of condition (time limits) of planning permission 06/0845 for residential development (up to 1100 dwellings) – approved subject to signing of S106 Agreement at planning committee on 01/03/2017.
Applicant has indicated that they expect to go out to tender for first phase infrastructure in July/August 2017, with a start on site in autumn 2017.
H1(4) Pirelli 250 121 48% Lovells are on site and progressing well with the development. 70 units were under construction at 1st
April 2017, with the whole site expected to be complete during 2018.
H1(5) Glebelands
153 0 0% Site is now owned by Pobl. Work has commenced on the implementation of infrastructure and the first completions are anticipated during 2017.
H1(7) Bethesda Close
22 22 100% Site complete.
H1(8) The Severn Stiles
23 0 0% Planning permission lapsed.
H1(9) Frobisher Road
10 4 100% Site complete.
H1(10) Pencoed Castle
12 0 0% Access road has been implemented and discharge of conditions has started to be agreed.
H1(11) Laburnum Drive
20 20 100% Site complete.
H1(12) Former Tredegar Park Golf Course
150 0 0% Redrow has indicated that construction is anticipated to commence during 2017 and run until 2021.
H1(13) Allt-Yr-Yn Campus
125 90 72% Taylor Wimpey on site and progressing well. Completion of the site is anticipated by the end of 2018.
H1(14) Monmouthshire Bank Sidings
506 360 71% Both Redrow and Llanmoor Homes are on site and progressing well. Completion of the site is anticipated by April 2019.
H1(15) Victoria Wharf, Old
130 0 0% Temporary car park use extended for a further 3 years up to April 2019 (16/0040). Planning permission

Newport City Council | Annual Monitoring Report 2016-17106
Town Dock (16/0789) granted subject to S106 for 93 units. H1(16) Penmaen Wharf
160 0 0% Planning permission has lapsed. The site is within Flood Risk Zone C2.
H1(17) Former Hurrans Garden Centre
60 60 100% Site complete.
H1(19) Land at Hartridge High School
65 0 0% The site is linked to the development of the Jigsaw site. Development of the site is not anticipated to commence in the next 5 years.
H1(21) Former Floors 2 Go
10 0 0% No planning permission in place. No completions expected within the next 5 years.
H1(23) Traston Lane
21 0 0% Planning permission for a revised scheme was granted in late 2012. Limited progress made. Completions are not anticipated within the next 5 years.
H1 (24) 30-33 High Street
16 0 0% Phase 2 of the Griffin Island regeneration scheme. This is a Seren lead scheme, which also forms part of the VVP programme. Site is under construction and completion of the development is anticipated during 2017.
H1(25) Taylors Garage
71 71 100% Site complete.
H1(26) Ty Du Works
26 26 100% Site complete.
H1(30) Rear of South Wales Argus
89 89 100% Site complete.
H1(31) Roman Lodge Hotel
10 0 0% Owner is concentrating on the hotel use. Residential development not anticipated within the next 5 years.
H1(32) Former Sainsburys
140 0 0% Mixed use proposal for 140 residential units; student accommodation; hotel and commercial. Outline planning permission approved subject to S106 on 19/11/2015. The S106 has now been signed and decision notice issued. The outline permission is very detailed with not many outstanding issues to be approved via reserved matters. The agent has indicated that delivery of residential element of the scheme is expected in 2018 and 2019. Two planning applications (17/0141 & 17/0367) relating to the demolition of the existing supermarket building are currently being considered by the Council.
H1(34) Bankside Coverack Road
38 0 0% S106 signed 23/11/2013. Delivery of the site is not anticipated within the next 5 years.
H1(36) Farmwood Close
10 0 0% Extant planning permission which has been implemented by the commencement of 10 units. No known intent for the site.
H1(37) City Vizion
340 238 70% Taylor Wimpey is on site and constructing the final phase of the development. Completion is anticipated during 2017/18.
H1(38) LysaghtsVillage (Orb Works)
559 376 67% Taylor Wimpey is on site and progressing well.
H1(39) Former Bettws
224 218 97% Barratt Homes are on site and near full completion.

Newport City Council | Annual Monitoring Report 2016-17107
ComprehensiveH1(40) Westmark, Old Town Dock
154 64 41% Footings are in place for the remaining 90 units. There is no information as when the last block of flats will be completed.
H1(41) Trinity View
16 11 69% Long standing self-build development. Properties tend to be delivered at a rate of 1 house per annum.
H1(42) Black Clawson (Alexandra Gate)
63 63 100% Site complete.
H1(43) Portskewett Street
25 0 0% Planning application 17/0038 for 92 flats granted subject to S106 05/04/2017 and currently awaiting the signing of the S106.
H1(44) Turner Street
32 32 100% Site complete.
H1(45) Lysaghts Parc
100 0 0% Remaining 100 units of a wider residential scheme. Linc Cymru anticipate commencement of the remaining 100 units around June 2019.
H1(47) Glan Llyn 2262 435 11% 2 developers on site at present – St Modwen and Bellway Homes.
H1(51) Whitehead Works
330 0 0% Whitehead Development Company Ltd (subsidiary of Tai Tition) set up to promote the site. Welsh Government has agreed a �7m commercial loan to WDC. Remediation works are complete on site. Outline planning applications under consideration (15/0775). Commencement of the site is anticipated during 2018.
H1(52) Old Town Dock Remainder
350 0 0% Hybrid application – 89 units full planning application &199 units outline planning application. (14/0355 –19/11/14). 45 of the 89 units are under construction by Seren (24 houses and 21 apartments).
H1(53) Bideford Road
35 0 0% Completions not anticipated within the next 5 years.
H1(54) Jubilee Park Former Alcan Site
931 353 38% 3 open market outlets and 1 registered social landlord on site. Site is progressing well.
H1(55) Jigsaw Site, Ringland
200 0 0% Site to be promoted for development alongside Hartridge High School site. Completions are not anticipated within the next 5 years.
H1(56) Opposite Belmont Lodge
122 0 0% Construction is anticipated to commence during summer of 2020.
H1(57) Treberth Crescent
58 0 0% Construction of this RSL lead site is scheduled to start during 2017 with completions anticipated 2018.
H1(58) Panasonic
250 215 86% Persimmon Homes are on site and progressing well.
H1 (59) 24 Crawford Road
10 0 0% Outline planning permission in place (14/0177).
H1 (60) Parry Drive
15 15 100% Site complete.
H1 (61)Former Postal Exchange, Mill Street
70 0 0% Completions not anticipated within the next 5 years.
H1 (62) Former Queens Hill
92 0 0% Outline planning permission in place. First completions anticipated during 2018/19.
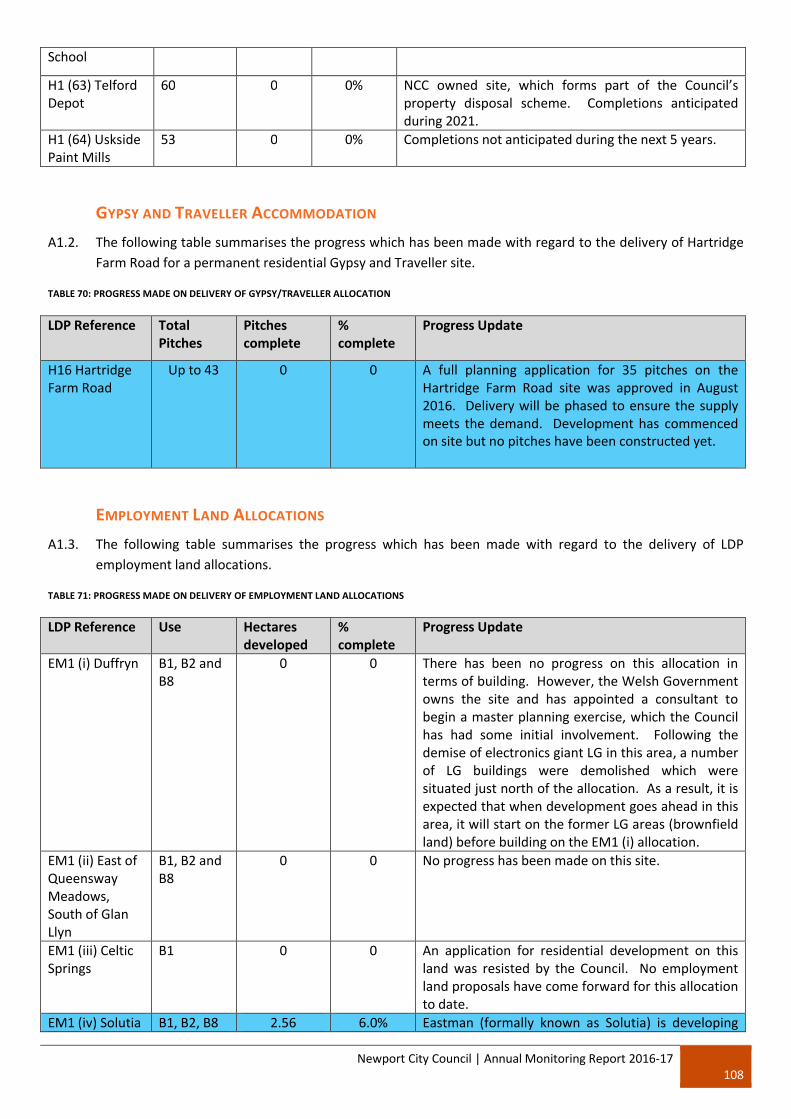
Newport City Council | Annual Monitoring Report 2016-17108
School
H1 (63) Telford Depot
60 0 0% NCC owned site, which forms part of the Council’s property disposal scheme. Completions anticipated during 2021.
H1 (64) Uskside Paint Mills
53 0 0% Completions not anticipated during the next 5 years.
GYPSY AND TRAVELLER ACCOMMODATION
A1.2. The following table summarises the progress which has been made with regard to the delivery of Hartridge Farm Road for a permanent residential Gypsy and Traveller site.
TABLE 70: PROGRESS MADE ON DELIVERY OF GYPSY/TRAVELLER ALLOCATION
LDP Reference Total Pitches
Pitches complete
% complete
Progress Update
H16 Hartridge Farm Road
Up to 43 0 0 A full planning application for 35 pitches on the Hartridge Farm Road site was approved in August 2016. Delivery will be phased to ensure the supply meets the demand. Development has commenced on site but no pitches have been constructed yet.
EMPLOYMENT LAND ALLOCATIONS
A1.3. The following table summarises the progress which has been made with regard to the delivery of LDP employment land allocations.
TABLE 71: PROGRESS MADE ON DELIVERY OF EMPLOYMENT LAND ALLOCATIONS
LDP Reference Use Hectaresdeveloped
% complete
Progress Update
EM1 (i) Duffryn B1, B2 and B8
0 0 There has been no progress on this allocation in terms of building. However, the Welsh Government owns the site and has appointed a consultant to begin a master planning exercise, which the Council has had some initial involvement. Following the demise of electronics giant LG in this area, a number of LG buildings were demolished which were situated just north of the allocation. As a result, it is expected that when development goes ahead in this area, it will start on the former LG areas (brownfield land) before building on the EM1 (i) allocation.
EM1 (ii) East of Queensway Meadows, South of Glan Llyn
B1, B2 and B8
0 0 No progress has been made on this site.
EM1 (iii) Celtic Springs
B1 0 0 An application for residential development on this land was resisted by the Council. No employment land proposals have come forward for this allocation to date.
EM1 (iv) Solutia B1, B2, B8 2.56 6.0% Eastman (formally known as Solutia) is developing

Newport City Council | Annual Monitoring Report 2016-17109
and leisure this site for development that directly benefits their chemicals business. A storage facility and heat and power plant has already been constructed and aTherminol Production plant was completed in 2016/17. (Therminol is a high temperature heat transfer fluid and is used in products such as solar panels).
EM1 (v) Gwent Europark
B8 distribution
0 0 An outline planning permission for B8 distribution centres is in place for this allocation, but there have been no signs of any development progress in recent times.
EM1 (vi) Land off Chartist Drive
B1, B2 and B8
0 0 No progress has been made on this site.
EM1 (vii) Llanwern former steelworks, eastern end
B1, B2 and B8
1.9 5.4% Phase 1 of the Celtic Business Park has been completed. This was the first speculative employment scheme to be completed in Newport since before the recession. Phase 2 of the Business Park has received permission but has not yet been implemented.
EM1 (viii) Phoenix Park (former Pirelli works) Corporation Road
B1, B2 and ancillary use
0 0 No progress has been made on this site.
EM1 (ix) Godfrey Road (Rear of Station)
Business and Commercial uses
0 0 No progress has been made on this site.
EDUCATION ALLOCATIONS
A1.4. The following table summarises the progress which has been made with regard to the delivery of LDP education allocations.
TABLE 72: PROGRESS MADE ON DELIVERY OF EDUCATION ALLOCATIONS
LDP Reference School Progress UpdateCF13 i) Former Whitehead Works, Cardiff Road
Primary School
Outline planning permission for a residential scheme along with a schoolis currently being considered by the Council.
CF13 ii) Jubilee Park (Former Alcan/Novelis Site)
Primary School
The school opened for the first day of term in September 2017.
CF13 iii) Glan Llyn 2 Primary Schools
The first school is expected to open in September 2018.
CF13 iv) Llanwern Village
Primary School
This development has not yet commenced.

Newport City Council | Annual Monitoring Report 2016-17110
APPENDIX 2 – NEWPORT CITY CENTRE LOCAL DEVELOPMENT ORDER PROGRESS
BACKGROUND
A2.1 The Local Development Order (LDO) for the City Centre was adopted on 21 August 2015. It applies to an area of approximately 21 hectares and grants conditional planning permission for specified uses in basements and on ground and upper floor units. The hope is that the LDO, in permitting a wide range of compatible uses, will help to increase occupancy levels and commercial activity in Newport City Centre.
A2.2 The LDO will remain live for a period of three years. It will be considered a success if two or more of the following changes have occurred in the City Centre:
The number of vacant ground floor units has decreased; Average footfall has increased; Ten or more vacant units have been brought back into use; Ten or more new dwellings have been created through the LDO process.
LDO PROGRESS
A2.3 Two developments have been granted a LDO Certificate of Conformity following adoption in August 2015:
8-9 Bridge Street. Change of use of old Post Office to an Anglican Church with community focussed outreach facilities – Granted December 2015.
4-10 Stow Hill. Change of use of first and second floor from vacant commercial premises to residential (five apartments) – Granted February 2016.
A2.4 The former Post Office on Bridge Street has already been converted to St Paul’s Church and is in full use, not just for Sunday services, but also a midweek service, baby and toddler groups, foodbanks and various other clubs and events. Such a facility is undoubtedly helping to bring more people into the City Centre which will hopefully have positive economic consequences.
A2.5 The Stow Hill development has not yet commenced, but is expected to benefit from Vibrant and Viable Places (VVP) funding. Once completed, the development will have converted a disused and vacant space into five high specification apartments.
CONCLUSION
A2.6 The LDO has brought forward two developments to date. No new LDO certificates of conformity were considering in 2016/17. It was hoped that more developers would have taken advantage of the LDO, but this has not been the case. The nature of the City Centre, as a conservation area and the multiple listed buildings has possibly limited the flexibility the LDO has attempted to offer. It is hoped that the LDO may help more VVP schemes come forward in the future, similar to Stow Hill.

Newport City Council | Annual Monitoring Report 2016-17111
APPENDIX 3 – DELETED AND AMENDED MONITORING INDICATORS AND TARGETS
TABLE 73: CHANGES TO MONITORING INDICATORS
OB3 MT6 – APPLICATIONS APPROVED FOR NON-RETAIL USES IN PRIMARY AND SECONDARY FRONTAGES
RELEVANT LDP POLICIES
CORE AND LOCAL INDICATOR SOURCE OF INFORMATION
MONITORING TARGET TRIGGER POINTS
Amended LOCALNumber of applications approved for non-retail use in primary and secondary frontage without meeting the requirements outlined in the relevant LDP Policies
NCC Development Management
80% or more of Primary Shopping Frontage is in A1 use. 60% or more of Secondary Frontage is in A1 use.
No permissions granted for non-retail use in primary and secondary frontage without meeting the requirements outlined in the relevant LDP Policies.
Less than 80% of Primary Shopping Frontage has an A1 use. Lessthan 60% of Secondary Shopping Frontage has an A1 use.
1 retail application permitted for non-retail use in primary and secondary frontage without meeting the requirements of the relevant LDP Policies.
Reason The old indicator relates to the number of applications approved for non-retail use in primary and secondary frontage without meeting the relevant policies. However, the target and trigger points relate to the length of frontage in A1 use. The target and trigger are amended to reflect the number of applications approved to ensure that they relate more closely to the method of measurement noted in the indicator.
OB4 MT3 – LDP ANNUAL COMPLETIONS
RELEVANT LDP POLICIES
CORE AND LOCAL INDICATOR SOURCE OF INFORMATION
MONITORING TARGET TRIGGER POINTS
Amended LOCALAnnual Dwelling Completions –LDP Strategy
NCC PlanningPolicy
Deliver a total of 10,350 units over the Plan period. Dwellings will be delivered in accordance with the breakdown identified below. The delivery rates are based on the economic/growth forecasts which underpin the
The total number of dwellings delivered falls below the cumulative number identified for 2 consecutive

Newport City Council | Annual Monitoring Report 2016-17112
strategy of the Plan, but have been realigned to factor in expected delivery rates. Expected delivery rates are based on the JHLAS 2013 and developer intentions.
2011 – 358 2012 – 717 (+359)2013 – 1,290 (+573)2014 – 1,955 (+665)2015 – 2,832 2,837 (+882)2016 – 3,773 (+936)2017 – 4,678 (+905)2018 – 5,641 (+963)2019 – 6,553 (+912)2020 – 7,325 (+772)2021 – 8,008 (+683)2022 – 8,687 (+679)2023 – 9,307 (+620)2024 – 9,881 (+574)2025 – 10,350 (+469)
years.
Reason To correct a minor error with the figures.
SA OBJECTIVE 22 E
MONITORING INDICATOR TARGET SOURCEAmended Use of the Monmouthshire &
Brecon Canals for recreational use
Visitors to the Fourteen Locks Visitor Centre
Increase Monmouthshire and Brecon Canal Visitor Centre
Reason Visitors using the Canal for leisure is an estimated figure. The number of visitors to the Fourteen Locks Visitor Centre is recorded more accurately.