Embed Size (px)
Citation preview
Newhallville and Dixwell Neighborhood Community Index
A project by neighborhood residents and youth August 2019
Contents
1. Data report Introduction 1 Population 2 Households 5 Education and opportunity 9 Economy 11 Wellbeing 17 Data sources 22 Notes on figures 27 Data tables for figures 28 2. Newhallville Youth Photovoice Project 34 Conclusion 45 Acknowledgements 46
Newhallville and Dixwell Neighborhood Community Index
Introduction
The Newhallville and Dixwell Neighborhood Community Index was born of a desire from neighborhood leaders to create a resource for residents to leverage while seeking grants or other tools for neighborhood development. This report aims to fulfill that desire by providing a review of aspects impacting quality of life in Newhallville and Dixwell while offering relevant historical context.
Another desire for this report was to highlight the experiences and voices of neighborhood youth. The Newhallville Youth Photovoice Project was conducted in the summer of 2019 and the results are the focus of the second section of this document beginning on page 34.
Newhallville and Dixwell Neighborhood Community Index !1

Population
Newhallville and Dixwell, with areas of about 0.6 mi2 and 0.4 mi2 respectively, are two of New Haven’s most culturally rich neighborhoods.
Together, they are home to approximately
11,080 residents. Fewer residents live in these 1
two neighborhoods now compared to the past 3
!2 Newhallville and Dixwell Neighborhood Community Index
Figure 1. Total population
Num
ber o
f peo
ple
010002000300040005000600070008000
Year1990 2000 2010 2017
NewhallvilleDixwell
Figure 2. Newhallville and Dixwell

decades (Figure 1). The majority of Newhallville and Dixwell residents are and have historically been Black. 2
In recent years, the population has become more racially and ethnically diverse as the share
of white and Latino residents has increased
between 2000 and 2017 (Figure 3). Neighborhood demographics have also shifted in regards to age. The share of residents 65 and
Newhallville and Dixwell Neighborhood Community Index !3
Figure 3. Population by race, Newhallville and
Dixwell
Perc
ent o
f pop
ulat
ion
0
20
40
60
80
Year2000 2017
BlackWhiteLatino
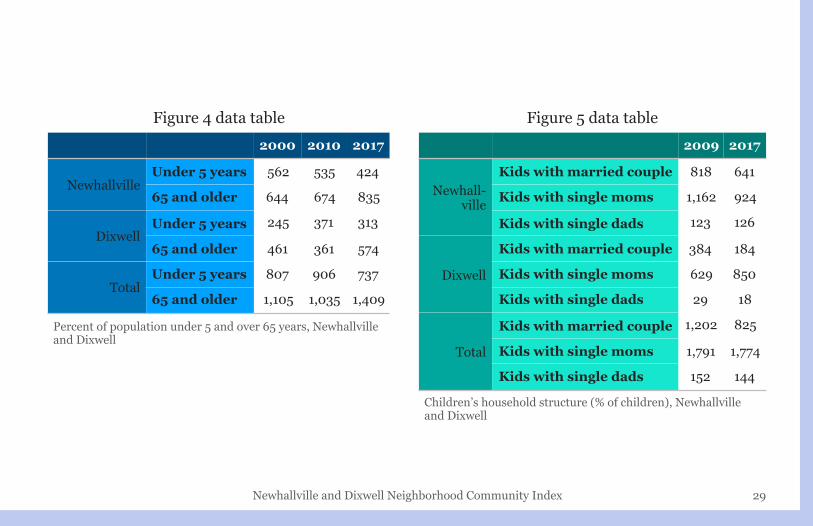
Figure 4. Percent of population under 5 and over 65 years, Newhallville and Dixwell
Perc
ent o
f pop
ulat
ion
0
2
4
6
8
10
12
Year2000 2010 2017
Under 5 years65 and older

older has increased from 10 percent in 2000 to 13 percent in 2017. On the other hand, the population under 5 years old has remained the same at 7 percent (Figure 4). 3
Newhallville is home to 773 immigrants. The foreign-born share makes up 13 percent of the neighborhood’s overall population. In Dixwell, 4
the foreign-born population is 9 percent (about 469 residents). Together, immigrants make up 11 percent of both neighborhoods. About half of this population entered the US in 2010 or later. Among the relatively newer arrivals, 43 percent are naturalized citizens while the remainder are not. 5
In the 1850s, a small Black population emerged in Dixwell, around Dixwell Ave, Goffe, Sperry and Webster Streets. 6
!4 Newhallville and Dixwell Neighborhood Community Index

Households
In Newhallville and Dixwell, there are 4,486 households. Half of them consist of families, as opposed to people living alone (45 percent), and other types of households (5 percent). Table 1 shows the breakdown of households. Most of the family households consist of either a female householder (63 percent) or single parent mother (32 percent). 7
There are 5,177 housing units in Newhallville and Dixwell (Table 2). About 13 percent are vacant. Of the remaining 87 percent, the 8
majority (76 percent) are renter-occupied. 9
Newhallville’s homeownership rate is 30 percent compared to Dixwell’s 15 percent. 10
Newhallville and Dixwell Neighborhood Community Index !5

!6 Newhallville and Dixwell Neighborhood Community Index
Table 1. Household type, 2017Household type Newhallville Dixwell Total
n % n % n %
Total households 2,660 1,826 4,486
Family households 1,425 54 812 45 2,237 50
Adult(s) living alone 1,175 44 848 46 2,023 45
Other household types 60 2 166 9 226 5
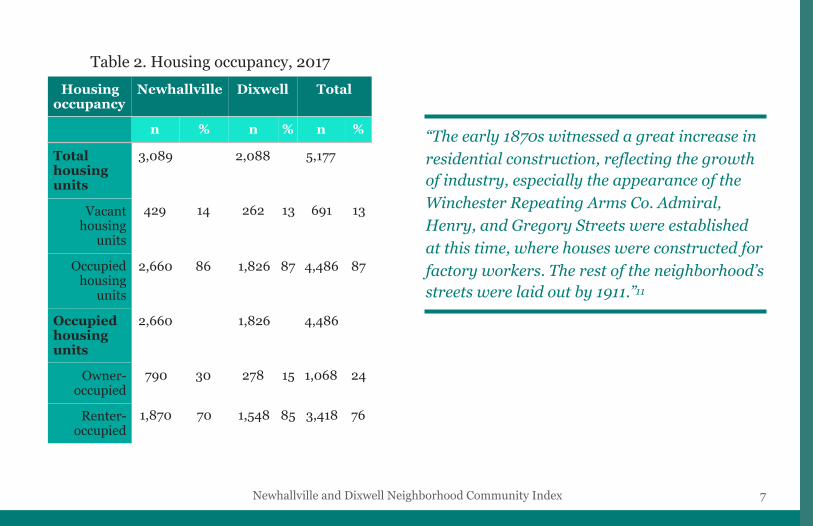
“The early 1870s witnessed a great increase in residential construction, reflecting the growth of industry, especially the appearance of the Winchester Repeating Arms Co. Admiral, Henry, and Gregory Streets were established at this time, where houses were constructed for factory workers. The rest of the neighborhood’s streets were laid out by 1911.” 11
Newhallville and Dixwell Neighborhood Community Index !7
Table 2. Housing occupancy, 2017Housing
occupancyNewhallville Dixwell Total
n % n % n %
Total housing units
3,089 2,088 5,177
Vacant housing
units
429 14 262 13 691 13
Occupied housing
units
2,660 86 1,826 87 4,486 87
Occupied housing units
2,660 1,826 4,486
Owner-occupied
790 30 278 15 1,068 24
Renter-occupied
1,870 70 1,548 85 3,418 76

There are 2,743 youth living in both neighborhoods. More than half (65 percent) live with a single mother, while 30 percent live with a married couple. Single dads make up the remainder. Fewer children live with married couples now compared to 2009 (Figure 5). 12
!8 Newhallville and Dixwell Neighborhood Community Index
Figure 5. Children’s household structure (% of
children), Newhallville and Dixwell
Perc
ent o
f chi
ldre
n
0
20
40
60
80
100
Year2009 2017
Children with married coupleChildren with single dadChildren with single mom

Education and opportunity
Of the 2,743 youth in Newhallville and Dixwell, one in four kids is between the ages of 0 and 5, while 73 percent are between 5 and 17 years old. There are 638 youth between the ages of 16 and 19 years old. Twelve percent of this age group 13
are unemployed and out of school. This group 14
is referred to as “opportunity youth”. There are many ways to engage this group through existing resources in Newhallville and Dixwell, including the Connecticut Center for Arts and Technology (ConnCAT) which is dedicated to creating empowering, arts-based educational environments for at-risk youth and training programs for under- and unemployed adults. ConnCAT has served more than 1,200 children since 2012 and offers after-school programming in a wide variety of topics such as agriculture,
art, cooking, engineering, film and graphic arts. 15
Newhallville and Dixwell Neighborhood Community Index !9
Table 3. Educational attainment, 2017Educational attainment
Newhall-ville
Dixwell Total
n % n % n %
Population 25 years and over
3,686 3,219 6,905
Less than high school diploma
778 21 520 16 1,298 19
High school only 1,419 38 1,310 41 2,729 40
High school degree or higher
2,908 79 2,699 84 5,607 81
Bachelor’s degree or higher
575 15 586 18 1,161 17

In both neighborhoods, 19 percent of adults over 25 years old lack a high school diploma (Table 3). This is more than the share throughout the City of New Haven (15 percent) and the State of Connecticut (10 percent). On the other hand, 17 percent of neighborhood residents have at least a bachelor’s degree compared to 34 percent in the city and 28 percent across the state. 16
The Dixwell Community “Q” House originally built in 1924 was a vital resource that served youth and families by offering “music, drama, and art classes, sponsored trips and organized sports” as well as other enhancing experiences. While the original building no 17
longer stands (demolished in 2003), a remodeled Q House is set to open in a couple years. 18
!10 Newhallville and Dixwell Neighborhood Community Index

Economy
Among Newhallville and Dixwell residents aged 16 years or older, 55 percent are in the labor force. Of those in the labor force, 83 percent are employed while about 17 percent are unemployed compared to 10 percent unemployed across the city. This 19
unemployment rate of 17 percent does not capture residents who may be underemployed, that is, those who are either unemployed but looking for work, or employed part time but preferring full-time work. Underemployment rates in the city as a whole are approximately 28 percent. 20
Newhallville and Dixwell workers are most likely to be employed in service occupations. Of the 3,910 residents that are 16 years or older
Newhallville and Dixwell Neighborhood Community Index !11
Table 4. Occupations for employed civilian population 16 years and over, 2017
Occupations Newhall-ville
Dixwell Total
n % n % n %
Total employed 2,391 1,519 3,910
Management, professional &
related 589 25 519 34 1,108 28
Service 946 40 417 27 1,363 35
Sales & office 471 20 360 24 831 21
Natural resource, construction &
maintenance72 3 64 4 136 3
Production, transportation & material moving
313 13 159 10 472 12

and employed, 35 percent work in the service industry, followed by 28 percent who work in management and related professional occupations (Table 4). 21
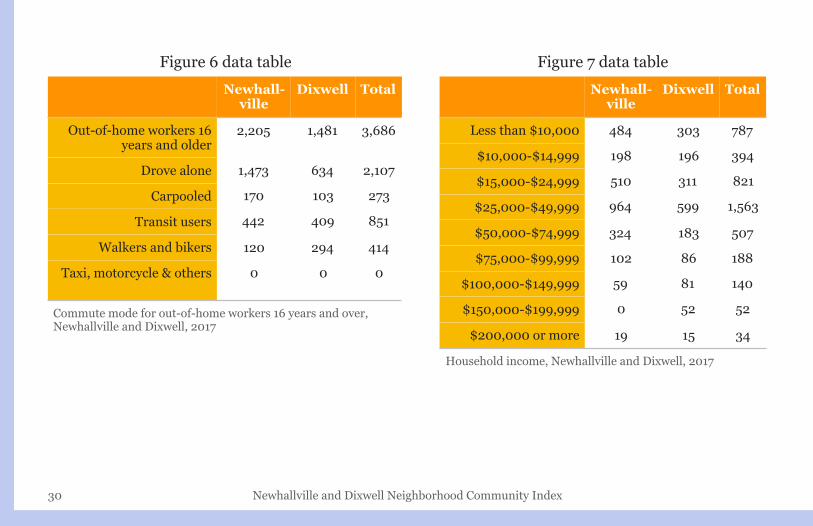
Most workers do not work at home, and of those who commute to work, most do so alone. The second most common commute mode for Newhallville and Dixwell residents is public transit (Figure 6). 22
Sixty-seven percent of children in Newhallville live in a household with all parents in the labor force. In Dixwell, this share is 90 percent. 23
Around the mid-1900s a wide variety of businesses lined Dixwell Ave. including a laundromat, confectionery, jazz clubs, boutiques, and more. 24
!12 Newhallville and Dixwell Neighborhood Community Index
Figure 6. Commute mode for out-of-home workers 16 years and over, Newhallville
and Dixwell, 2017
Drove alone
Carpooled
Transit users
Walkers and bikers
Percent of workers0 10 20 30 40 50 60

In 2017, the average household in Newhallville earned $33,113, compared to $42,091 in Dixwell. The median earnings for both neighborhoods combined was $36,768. This is lower than the median earnings of households across the city ($39,191) and only half of the earnings of residents statewide ($73,781). In 25
Newhallville and Dixwell, 45 percent of households earned less than $25,000, 79 percent earned less than $50,000 and 5 percent earned more than $100,000 in 2017. Almost 20 percent of households earned less than $10,000 (Figure 7). 26
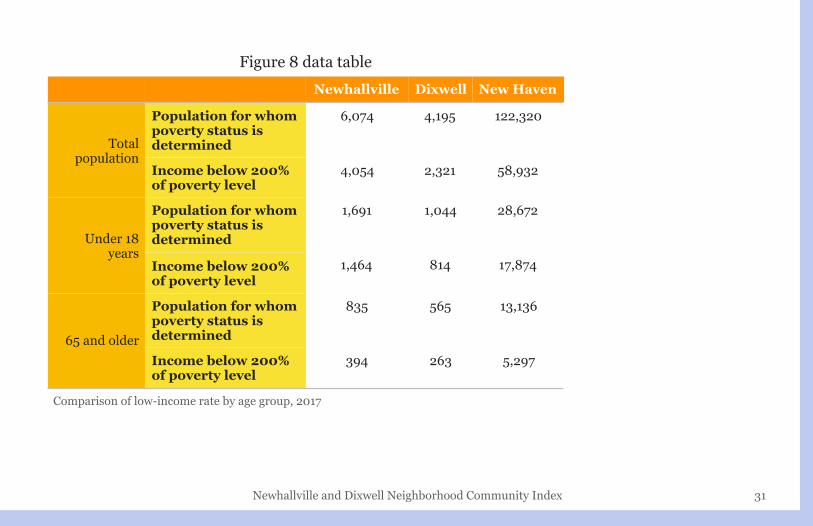
In Newhallville, the low-income rate is 67 percent (1.4 times that of the city and 3 times that of the state). This means there are about 4,054 residents living in households with incomes less than twice the federal poverty level. In Dixwell, 2,321 residents (55 percent) are considered low-income. Together, the low-income rate in both neighborhoods is 62 percent. In Newhallville and Dixwell 27
combined, 83 percent of children under 18 and 47 percent of adults 65 and older are considered low-income (Figure 8). The poverty rate of 28
Newhallville and Dixwell Neighborhood Community Index !13
Figure 7. Household income, Newhallville and
Dixwell, 2017
Hou
seho
ld in
com
e <$10k$10k-$14,999$15k-$24,999$25k-$49,999$50k-$74,999$75k-$99,999
$100k+
Percent of population0 5 10 15 20 25 30 35 40

both neighborhoods is 29 percent (30 percent in Dixwell and 28 percent in Newhallville). This means there are about 3,000 residents earning less than the federal poverty level (Figure 9). 29
Almost half of all children under the age of 5 live in poverty (43 percent) in Newhallville. In Dixwell, the poverty rate for children under 5 is 27 percent. In both neighborhoods combined, this rate is 37 percent, slightly higher than the 34 percent of children under 5 across the city living in poverty. 30
!14 Newhallville and Dixwell Neighborhood Community Index
Figure 8. Comparison of low-income rate by age group, 2017
Percent of population
47%
78%
55%47%
87%
67%
40%
62%
48%
New HavenNewhallvilleDixwell
Total <18 65+
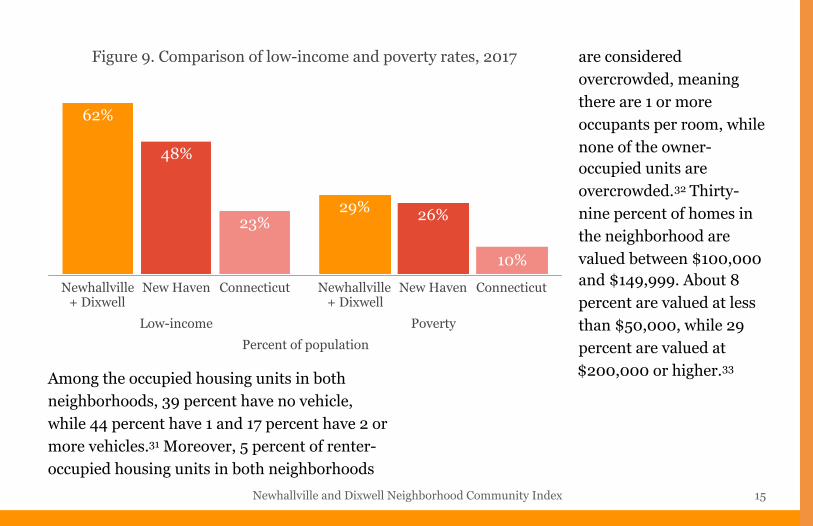
Among the occupied housing units in both neighborhoods, 39 percent have no vehicle, while 44 percent have 1 and 17 percent have 2 or more vehicles. Moreover, 5 percent of renter-31
occupied housing units in both neighborhoods
are considered overcrowded, meaning there are 1 or more occupants per room, while none of the owner-occupied units are overcrowded. Thirty-32
nine percent of homes in the neighborhood are valued between $100,000 and $149,999. About 8 percent are valued at less than $50,000, while 29 percent are valued at $200,000 or higher. 33
Newhallville and Dixwell Neighborhood Community Index !15
Figure 9. Comparison of low-income and poverty rates, 2017
Percent of populationLow-income Poverty
Newhallville + Dixwell
New Haven Connecticut Newhallville + Dixwell
New Haven Connecticut
10%
23% 26%
48%
29%
62%
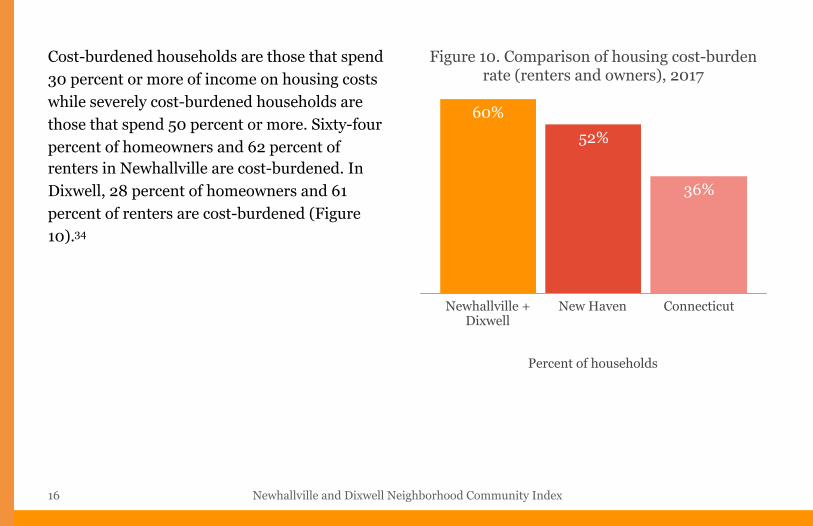
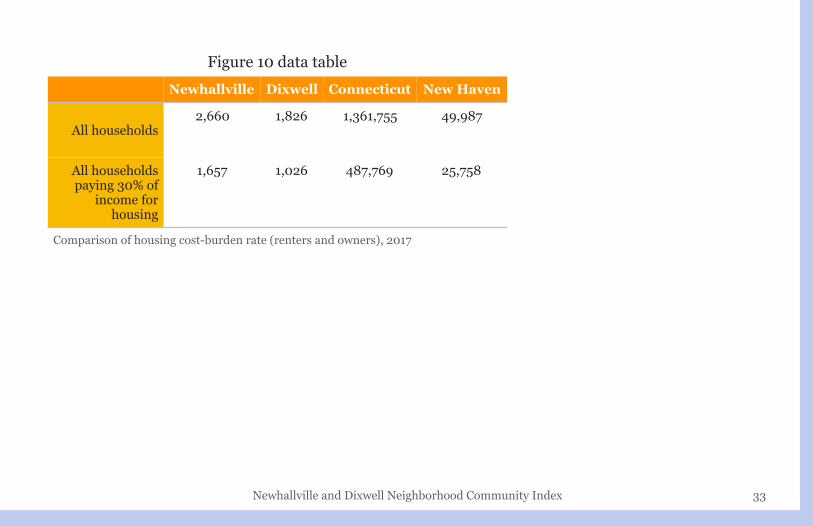
Cost-burdened households are those that spend 30 percent or more of income on housing costs while severely cost-burdened households are those that spend 50 percent or more. Sixty-four percent of homeowners and 62 percent of renters in Newhallville are cost-burdened. In Dixwell, 28 percent of homeowners and 61 percent of renters are cost-burdened (Figure 10). 34
!16 Newhallville and Dixwell Neighborhood Community Index
Figure 10. Comparison of housing cost-burden rate (renters and owners), 2017
Percent of households
Newhallville + Dixwell
New Haven Connecticut
36%
52%60%

Wellbeing
This section uses data from the 2018 DataHaven Community Wellbeing Survey to sketch a picture of individual and community wellbeing for residents in Newhallville and Dixwell compared to residents statewide. The results depicted in Figures 10-13 derive from live interviews of 16,000 residents across the state. Due to the relatively small sample size in Newhallville and Dixwell, a grouping of the six lowest-income neighborhoods in New Haven (Dixwell, Dwight, Fair Haven, Hill, Newhallville and West River) is used for comparison.* Survey respondents were asked to rate how happy and anxious they were. Residents in the lowest-income group were generally more anxious and less happy compared to adults statewide (Figure 11). Residents in the group
were also more likely to report having negative physical health outcomes such as obesity, asthma, heart disease or heart attack, and diabetes. Only 45 percent of adults surveyed from the lowest-income group reported being in excellent or very good health, while 59 percent of statewide adults reported the same (Figure 12).
Newhallville and Dixwell Neighborhood Community Index !17
Figure 11. Mental health comparison, 2018Indicator Place Percent
Not at all/only a little bit happy
CT
Nhvll/Dix*
Mostly/completely
anxious
CT
Nhvll/Dix 18
1412
12

!18 Newhallville and Dixwell Neighborhood Community Index
Figure 12. Physical health comparison, 2018Indicator Place Percent
ObeseCT
Nhvll/Dix
Obese and overweightCT
Nhvll/Dix
Current asthma rateCT
Nhvll/Dix
Heart disease/attack prevalenceCT
Nhvll/Dix
DiabeticCT
Nhvll/Dix
In very good/excellent self-reported health
CT
Nhvll/Dix 45
17
9
11
70
36
59
10
6
10
65
29

Survey respondents also reflected on factors related to community wellbeing such as local government responsiveness and trust among neighbors. In general, Newhallville and Dixwell residents (as part of the lowest-income group) reported feeling less safe and less trustful of neighbors compared to statewide residents. However, Newhallville and Dixwell residents agree just as much as statewide residents that neighbors are involved in trying to improve the neighborhood (Figure 13). The high attendance at the monthly Community Management Team meetings in both neighborhoods is an attestation of residents’ desire to improve community vitality.
Newhallville and Dixwell Neighborhood Community Index !19
Figure 13. Neighborhood safety comparison, 2018
Safety indicator Place Percent who somewhat/
strongly agree
Feel unsafe to go on walks at night
CT
Nhvll/Dix
Trust neighborsCT
Nhvll/Dix
Feel neighbors are involved in trying to
improve neighborhood
CT
Nhvll/Dix 73
67
50
74
83
29

!20 Newhallville and Dixwell Neighborhood Community Index
Figure 14. Neighborhood resource comparison, 2018Neighborhood resource Place Percent who rate good or
excellent
Local government response to resident needs
CT
Nhvll/Dix
The job done by the police to keep residents safe
CT
Nhvll/Dix
The ability of residents to obtain suitable employment
CT
Nhvll/Dix
As a place to raise childrenCT
Nhvll/Dix
The condition of public parks and other recreational facilities
CT
Nhvll/Dix
The availability of affordable, high-quality fruits and
vegetables
CT
Nhvll/Dix 55
57
46
30
56
32
72
72
71
44
75
45

The annual Freddie Fixer Parade, originally conceived by Dr. Fred Smith in 1962 from a desire for residents to take pride and invest in the cleanliness of the community, is now believed to be the largest Black parade in New England. 35
Seventy-four percent of residents in Newhallville and Dixwell (as part of the lowest-income group) reported being satisfied with the area in which they live, slightly less than the 81 percent of statewide residents who reported the same. They were also less likely than adults across Connecticut to rate the ability of neighborhood residents to obtain suitable employment as good or excellent, along with several other neighborhood resources that
contribute to the overall wellbeing of a neighborhood (Figure 14). 36
Newhallville and Dixwell Neighborhood Community Index !21

Data sources! U.S. Census Bureau. (2019). 2017 American Community Survey 5-year estimates, Table B01003, Total 1population. Available at https://factfinder.census.gov/.
U.S. Census Bureau. (2019). 2017 American Community Survey 5-year estimates, Table B03002, Hispanic or 2
Latino origin by race. Available at https://factfinder.census.gov/.
U.S. Census Bureau. (2019). 2017 American Community Survey 5-year estimates, Table B01001, Sex by Age. 3
Available at https://factfinder.census.gov/.
U.S. Census Bureau. (2019). 2017 American Community Survey 5-year estimates, Table B05001, Nativity and 4
citizenship status in the United States. Available at https://factfinder.census.gov/.
U.S. Census Bureau. (2019). 2017 American Community Survey 5-year estimates, Table B05005, Period of 5
entry by nativity and citizenship status in the United States. Available at https://factfinder.census.gov/.
Walk New Haven. (2019). Cultural Heritage Tours, a project of the Ethnic Heritage Center. History of the 6
Dixwell Neighborhood. Available at http://walknewhaven.org/tours/map_sites/lowerdixwell_history.html.
U.S. Census Bureau. (2019). 2017 American Community Survey 5-year estimates, Table B11001, Household 7
type (including living alone). Available at https://factfinder.census.gov/.
U.S. Census Bureau. (2019). 2017 American Community Survey 5-year estimates, Table B25004, Vacancy 8
status. Available at https://factfinder.census.gov/.
!22 Newhallville and Dixwell Neighborhood Community Index
U.S. Census Bureau. (2019). 2017 American Community Survey 5-year estimates, Table B25003, Tenure. 9
Available at https://factfinder.census.gov/.
Ibid.10
Walk New Haven. (2019). Cultural Heritage Tours, a project of the Ethnic Heritage Center. History of the 11
Dixwell Neighborhood. Available at http://walknewhaven.org/tours/map_sites/lowerdixwell_history.html.
U.S. Census Bureau. (2019). 2017 American Community Survey 5-year estimates, Table B09005, Household 12
type for children under 18 years in households (excluding householders, spouses, and unmarried partners). Available at https://factfinder.census.gov/.
U.S. Census Bureau. (2019). 2017 American Community Survey 5-year estimates, Table B01001, Sex by Age. 13
Available at https://factfinder.census.gov/.
U.S. Census Bureau. (2019). 2017 American Community Survey 5-year estimates, Table B14005, Sex by 14
school enrollment by educational attainment by employment status for the population 16 to 19 years. Available at https://factfinder.census.gov/.
ConnCAT. (2019). Facts and Figures. Available at http://conncat.org/life-at-conncat/facts-and-figures/.15
U.S. Census Bureau. (2019). 2017 American Community Survey 5-year estimates, Table B15002. Sex by 16
educational attainment for the population 25 years and over. Available at https://factfinder.census.gov/.
Walk New Haven. (2019). Cultural Heritage Tours, a project of the Ethnic Heritage Center. Lower Dixwell 17
Tour. Available at http://walknewhaven.org/tours/sites/lowerdixwell/lowerdixwell_site10.html.
Newhallville and Dixwell Neighborhood Community Index !23

New Haven Independent. (2019). Q House Design Gets Final Approval, by Thomas Breen, 2018. Available at 18
https://www.newhavenindependent.org/index.php/archives/entry/q_design_gets_final_approval/.
U.S. Census Bureau. (2019). 2017 American Community Survey 5-year estimates, Table B23025, 19
Employment status for the population 16 years and over. Available at https://factfinder.census.gov/.
2018 DataHaven Community Wellbeing Survey. Available at https://ctdatahaven.org.20
U.S. Census Bureau. (2019). 2017 American Community Survey 5-year estimates, Table C24010, Sex by 21
occupation for the civilian employed population 16 years and over. Available at https://factfinder.census.gov/.
U.S. Census Bureau. (2019). 2017 American Community Survey 5-year estimates, Table B08301, Means of 22
transportation to work. Available at https://factfinder.census.gov/.
U.S. Census Bureau. (2019). 2017 American Community Survey 5-year estimates, Table B23008. Age of own 23
children under 18 years in families and subfamilies by living arrangement by employment status of parents. Available at https://factfinder.census.gov/.
Walk New Haven. (2019). Cultural Heritage Tours, a project of the Ethnic Heritage Center. History of the 24
Dixwell Neighborhood. Available at http://walknewhaven.org/tours/map_sites/lowerdixwell_history.html.
U.S. Census Bureau. (2019). 2017 American Community Survey 5-year estimates, Table B19025, Aggregate 25
household income in the past 12 months (in 2017 inflation-adjusted dollars). Available at https://factfinder.census.gov/.
!24 Newhallville and Dixwell Neighborhood Community Index
U.S. Census Bureau. (2019). 2017 American Community Survey 5-year estimates, Table B19001, Household 26
income in the past 12 months (in 2017 inflation-adjusted dollars). Available at https://factfinder.census.gov/.
U.S. Census Bureau. (2019). 2017 American Community Survey 5-year estimates, Table C17002, Ratio of 27
income to poverty level in the past 12 months. Available at https://factfinder.census.gov/.
U.S. Census Bureau. (2019). 2017 American Community Survey 5-year estimates, Table B17024, Age by ratio 28
of income to poverty level in the past 12 months. Available at https://factfinder.census.gov/.
U.S. Census Bureau. (2019). 2017 American Community Survey 5-year estimates, Table C17002, Ratio of 29
income to poverty level in the past 12 months. Available at https://factfinder.census.gov/.
U.S. Census Bureau. (2019). 2017 American Community Survey 5-year estimates, Table B17024, Age by ratio 30
of income to poverty level in the past 12 months. Available at https://factfinder.census.gov/.
U.S. Census Bureau. (2019). 2017 American Community Survey 5-year estimates, Table B25044, Tenure by 31
vehicles available. Available at https://factfinder.census.gov/.
U.S. Census Bureau. (2019). 2017 American Community Survey 5-year estimates, Table B25014, Tenure by 32
occupants per room. Available at https://factfinder.census.gov/.
U.S. Census Bureau. (2019). 2017 American Community Survey 5-year estimates, Table B25075, Value. 33
Available at https://factfinder.census.gov/.
Newhallville and Dixwell Neighborhood Community Index !25

U.S. Census Bureau. (2019). 2017 American Community Survey 5-year estimates, Table B25106, Tenure by 34
housing costs as a percentage of household income in the past 12 months. Available at https://factfinder.census.gov/.
Walk New Haven. (2019). Cultural Heritage Tours, a project of the Ethnic Heritage Center. History of the 35
Dixwell Neighborhood. Available at http://walknewhaven.org/tours/map_sites/lowerdixwell_history.html.
2018 DataHaven Community Wellbeing Survey. (2019). Available at https://ctdatahaven.org.36
!26 Newhallville and Dixwell Neighborhood Community Index

Notes on figures All 2017 data is from the U.S. Census Bureau 2017 American Community Survey 5-year estimate tables. Sources for data from additional years are listed.
• Figure 1. Total population. 1990, 2000, and 2010 figures are from the U.S. Census Bureau Decennial Census, Table P1 Total Population.
• Figure 3. Population by race, Newhallville and Dixwell. 2000 figures are from U.S. Census Bureau Decennial Census, Table P008, Hispanic or Latino by race.
• Figure 4. Share of population under 5 years old & 65 and older, Newhallville. 2000 figures are from U.S. Census Bureau Decennial Census SF3, Table P08, Sex by age. 2010 figures are from U.S. Census Bureau 2010 American Community Survey 5-year estimates, Table B01001, Sex by age.
• Figure 5. Children in households, Newhallville. 2010 figures are from U.S. Census Bureau 2010 American Community Survey 5-year estimates, Table B11003, Family type by presence and age of own children under 18 years.
• Figures 11-14. The “Nhvll/Dix” abbreviation represents Newhallville and Dixwell as a grouping of the six lowest-income neighborhoods in New Haven (Dixwell, Dwight, Fair Haven, Hill, Newhallville and West River).
Newhallville and Dixwell Neighborhood Community Index !27

Data tables for figures
!28 Newhallville and Dixwell Neighborhood Community Index
Figure 1 data table1990 2000 2010 2017
Newhallville 7,722 6,478 6,990 6,074
Dixwell 6,298 5,011 4,902 5,006
Total 14,020 11,489 11,892 11,080
Total population
Figure 3 data table2000 2017
Newhallville
Black 5,873 4,931
White 127 182
Hispanic 304 891
Dixwell
Black 3,600 3,216
White 605 814
Hispanic 616 733
Total
Black 9,473 8,147
White 732 996
Hispanic 920 1,624
Population by race, Newhallville and Dixwell
Newhallville and Dixwell Neighborhood Community Index !29
Figure 4 data table2000 2010 2017
NewhallvilleUnder 5 years 562 535 424
65 and older 644 674 835
DixwellUnder 5 years 245 371 313
65 and older 461 361 574
TotalUnder 5 years 807 906 737
65 and older 1,105 1,035 1,409
Percent of population under 5 and over 65 years, Newhallville and Dixwell
Figure 5 data table2009 2017
Newhall-ville
Kids with married couple 818 641
Kids with single moms 1,162 924
Kids with single dads 123 126
Dixwell
Kids with married couple 384 184
Kids with single moms 629 850
Kids with single dads 29 18
Total
Kids with married couple 1,202 825
Kids with single moms 1,791 1,774
Kids with single dads 152 144
Children’s household structure (% of children), Newhallville and Dixwell
!30 Newhallville and Dixwell Neighborhood Community Index
Figure 6 data tableNewhall-
villeDixwell Total
Out-of-home workers 16 years and older
2,205 1,481 3,686
Drove alone 1,473 634 2,107
Carpooled 170 103 273
Transit users 442 409 851
Walkers and bikers 120 294 414
Taxi, motorcycle & others 0 0 0
Commute mode for out-of-home workers 16 years and over, Newhallville and Dixwell, 2017
Figure 7 data tableNewhall-
villeDixwell Total
Less than $10,000 484 303 787
$10,000-$14,999 198 196 394
$15,000-$24,999 510 311 821
$25,000-$49,999 964 599 1,563
$50,000-$74,999 324 183 507
$75,000-$99,999 102 86 188
$100,000-$149,999 59 81 140
$150,000-$199,999 0 52 52
$200,000 or more 19 15 34
Household income, Newhallville and Dixwell, 2017
Newhallville and Dixwell Neighborhood Community Index !31
Figure 8 data tableNewhallville Dixwell New Haven
Total population
Population for whom poverty status is determined
6,074 4,195 122,320
Income below 200% of poverty level
4,054 2,321 58,932
Under 18 years
Population for whom poverty status is determined
1,691 1,044 28,672
Income below 200% of poverty level
1,464 814 17,874
65 and older
Population for whom poverty status is determined
835 565 13,136
Income below 200% of poverty level
394 263 5,297
Comparison of low-income rate by age group, 2017

!32 Newhallville and Dixwell Neighborhood Community Index
Figure 9 data tableNewhallville Dixwell Connecticut New Haven
Low-income
Population for whom poverty status is determined
6,074 4,195 3,486,033 122,320
Income below 200% of poverty level
4,054 2,321 802,453 58,932
PovertyIncome below 100% of poverty level
1,723 1,276 350,783 31,338
Comparison of low-income and poverty rates, 2017
Newhallville and Dixwell Neighborhood Community Index !33
Figure 10 data tableNewhallville Dixwell Connecticut New Haven
All households2,660 1,826 1,361,755 49,987
All households paying 30% of
income for housing
1,657 1,026 487,769 25,758
Comparison of housing cost-burden rate (renters and owners), 2017