Embed Size (px)
Citation preview

New York State Crime Analysis Centers
Anne Roest, DCJS NYS Division of Criminal Justice Services, 4 Tower Place, Albany, NY 12203

2
New York Crime Analysis Centers
1,144,874
461,731
400,000
600,000
800,000
1,000,000
1,200,000
1990 1991 1992 1993 1994 1995 1996 1997 1998 1999 2000 2001 2002 2003 2004 2005 2006 2007
New York State Crimes Reported (Annual)
Source: FBI, Crime in the United States, 2007
Crime Statistics in Review

3
0
50,000
100,000
150,000
200,000
1990 1994 1998 2002 2007
Regional Trends in Violent Crime
New York City Non-New York City Source: Uniform Crime/Incident Based Reporting system (as of 1/16/09)
New York Crime Analysis Centers Crime Statistics in Review
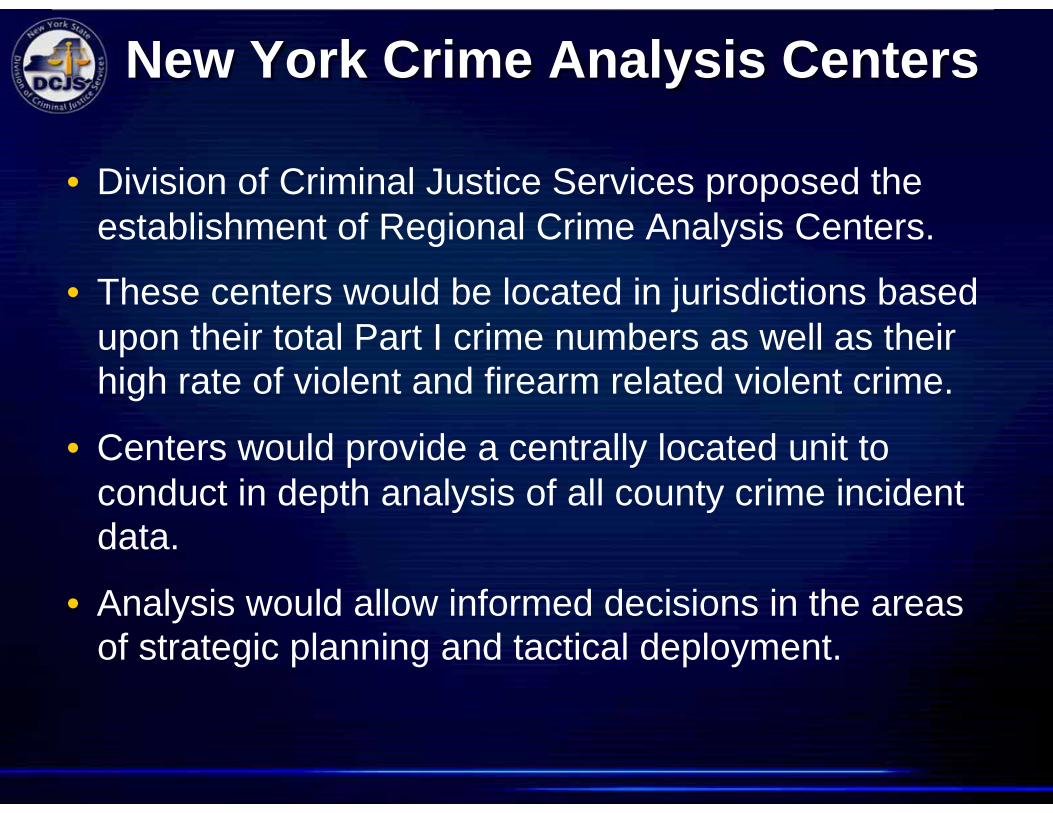
• Division of Criminal Justice Services proposed the establishment of Regional Crime Analysis Centers.
• These centers would be located in jurisdictions based upon their total Part I crime numbers as well as their high rate of violent and firearm related violent crime.
• Centers would provide a centrally located unit to conduct in depth analysis of all county crime incident data.
• Analysis would allow informed decisions in the areas of strategic planning and tactical deployment.
New York Crime Analysis Centers

• $5M allocated to build centers in 2007-2009
• Project leads identified
• First two locations selected
• Solicited local law enforcement buy-in
• Established local boards for governance
• Developed plan for each center
The Start

Governed by a Board of Directors: • Commissioner of DCJS • Chief of the City Police Department • County Sheriff • District Attorney • NYSP Troop Commander • plus locally requested in different locations: • Probation Director • Large suburban town police chief
Daily Operations Overseen by Director of CAC (DCJS)
The Board meets Quarterly. All important decisions are by consensus. No member can be compelled to any action.
New York Crime Analysis Centers Governance

Four new Crime Analysis Centers

New York Crime Analysis Centers The Next Step

PERCENT OF CRIME
City PD County Total STATEWIDE OUTSIDE NYC
Crime Analysis Centers
Erie 19,176 32,653 7% 13% Monroe 13,433 25,717 6% 10% Onondaga 7,531 13,382 3% 5% Albany 5,439 10,389 2% 4% State Police (Statewide) 18,484 4% 7% Nassau 16,449 21,624 5% 8% Suffolk 28,400 31,999 7% 12%
TOTAL INDEX CRIME SHARED 34% 59%
New York Crime Analysis Centers 2009 Total Index Crime Information Shared

Digital Signage – push technology • 42” monitors show programs of ‘Most Wanted’, crime patterns, BOLOs. • Monitors are placed in common areas of local precincts. • Monitors are controlled by the local CAC.
CAC intranet websites – pull technology • Information will be provided to desktops, patrol cars on a private website. • Investigators, detectives, patrol officers will be able to follow-up on own
initiative.
GIS Mapping – visualizing technology • The CACs will use maps to illustrates crime type, time of day and
frequency patterns. • Maps alert investigators, detectives and patrol officers in an
straightforward format. • GIS mapping will be part of intranet websites.
New York Crime Analysis Centers CAC Multiyear Plan

• The desire to share data is strong. • The State can play an important sponsorship role empowering and
supporting the participants. • Governance based on equality engenders trust and cooperation.
• Local governance means that the sponsor must be flexible. • Any hardware solution must respect the embedded agency
installation and the agency IT team.
• Patience is a necessity. Every step forward involves multiple agencies, vendors and distinct networks.
• Producing even small successes will refute sharing concerns and will open the door for greater cooperation.
• The technologies and solutions don’t have to complex and expensive to provide value.
New York Crime Analysis Centers Lessons Learned

• Overlap/conflict with NYDex. • Integration with the fusion center.
• Responsibility for security and auditing.
New York Crime Analysis Centers Conversations

Questions ?

The CACs are integral and continuing partners in reducing victimization, preventing crime and improving law enforcement in a cost-effective manner. Information Sharing Success – county
New York Crime Analysis Centers Information Sharing Strategies