Embed Size (px)
Citation preview

New Science Implementation in CMAQ-Hg: Test over a Continental
United States Domain
Che-Jen Lin1, Pruek Pongprueksa1, Taruna VanjaniThomas C. Ho1, Hsing-wei Chu1 & Carey Jang2
1 College of Engineering, Lamar University, Beaumont, TX2USEPA OAQPS, Research Triangle Park, NC
4th Annual CMAS Models-3 User’s ConferenceResearch Triangle Park, NC
September 26, 2005

Acknowledgements• US Environmental Protection Agency (USEPA)• Texas Commission on Environmental Quality (TCEQ)• Gulf Coast Hazardous Substance Research Center• Simo Pehkonen, National University of Singapore• Steve Lindberg, Oak Ridge National Laboratory (Retired)• Daewon Byun, the University of Houston• Russell Bullock, USEPA ORD• Thomas Braverman, USEPA OAQPS• Christian Seigneur, Atmospheric & Environmental
Research

Atmospheric Mercury Elemental (GEM) Divalent
(RGM, DAM, PHg)
Primary Source Emissions Emission, Products of Hg(0)
Abundance > 95% < 5 %
Phase Gas Gas, aqueous, solid
Water Solubility Low (0.3 μM ) High (a few mM)
Henry’s Constant 0.11 M/atm 104 – 107 M/atm
Lifetime 0.5 - 2 years Days - Weeks
Transport Long Range Relatively short
Background Concentration 1~4 ng/m3 Up to 900 pg/m3 (RGM)
0.025~0.5 nM (DAM)

• Very small concentrations (often in sub-ppt levels) compared to criterion air pollutants
• Its “gaseous” forms have little human health concerns• Has multiple chemical forms with diverse properties• Has “its own” chemistry cycle – does not affect
other air pollutants significantly• Concurrent atmospheric processes involving
multiple pollutants affect its transport and deposition• Transformation occurs in multiple phases in the
atmosphere• Both dry and wet depositions cause problems• Analytically challenging to measure • Cycling in the environment
What makes Hg unique?

Modeling Atmospheric Hg• The Emission
– Anthropogenic sources– Natural sources – Re-emissions?
• The Transformation– Gaseous phase – oxidation & product speciation– Aqueous phase – oxidation, reduction and sorption– Interfacial transfer – scavenging and evaporation
• The Deposition– Dry deposition – GEM, RGM, PHg– Wet deposition – Aqueous Hg(II)
The Transport – as determined by the advection and diffusion treatment in air quality models.

CMAQ-Hg ModelSMOKE
Mercury Emission
Deposition
Mercury Modules

CMAQ-Hg (Bullock & Brehme, 2002) Emission Anthropogenic (Point & Area) Veg./re-emission needed
Gas Chemistry O3, Cl2, H2O2, and OH, PHg as the oxidation product by OH and O3
New kinetics available & speciation need revision
Aq. Chemistry Ox: O3, OH, HOCl, and OCl- Speciation controlled
Red: HgSO3, Hg(OH)2+hv, HO2 Speciation controlled
Aq. Speciation SO32-, Cl-, OH- Major ligands considered
but assume constant Cl-
Aq. Sorption Sorption of Hg(II) to ECA, bi-directional non-eq. kinetics w/ linear sorption isotherm
High sorption constant, no impact based on current formulation
Dry Deposition Vdep of HNO3 for RGM deposition No Hg0 deposition. RGM deposition likely too high
Vdep of I,J modes for PHg deposition As sulfate deposition
Wet Deposition Dissolved and Sorbed Hg(II)aq By precipitation & aqueous concentration

Science Issues in CMAQ-Hg• Impact of emission natural/re-emission unclear.• Widely varied kinetic data reported for same
mechanisms (e.g., gaseous Hg0 oxidation by O3and OH; aqueous reduction of Hg(II) by sulfite).
• Uncertain reaction product distribution of gaseous oxidation (e.g., RGM or PHg?).
• Extrapolation of laboratory results may not be appropriate (e.g., aqueous reduction of Hg(II) by HO2, gaseous oxidation of Hg0 by OH and O3).
• Deposition velocity for both GEM and RGM not treated rigorously.
• Revision needed for sorption scheme in the aqueous phase (cloud water).

Sensitivity Cases
• Case 1: CMAQ-Hg as in Bullock & Brehme (2002)• Case 2: include vegetative/natural emission in
mercury emission inventory• Case 3: incorporate dry deposition schemes for
elemental mercury and RGM (as HgCl2)• Case 4: speciate mercury oxidation products to
reactive gaseous mercury (RGM)• Case 5: incorporate new aqueous sorption scheme
based on new sorption isotherm• Case 6: combine the modifications of Cases 2-5
Parameter of interest: wet/dry deposition of mercury

Simulation Details• Modeling periods: January and July 2001• Meteorology: 2001 USEPA 36-km MM5 fields in
CONUS domain• Vertical structure: model top 10,000 Pa, 25 layers
collapsing into 14 layers• Emission inventory: NEI99 final Version 3, mercury
speciation EI based on Walcek et al. (2003); natural / vegetative emission based on Lin et al. (2005)
• Chemistry: CB4 + updated mercury mechanisms (Lin and Pehkonen, 1999; Lin et al., 2005)
• Dry deposition: based on Wesley scheme (1989) with updated formulation for GEM and RGM
• Initial and boundary conditions: assumed typical background concentrations for GEM, RGM and PHg
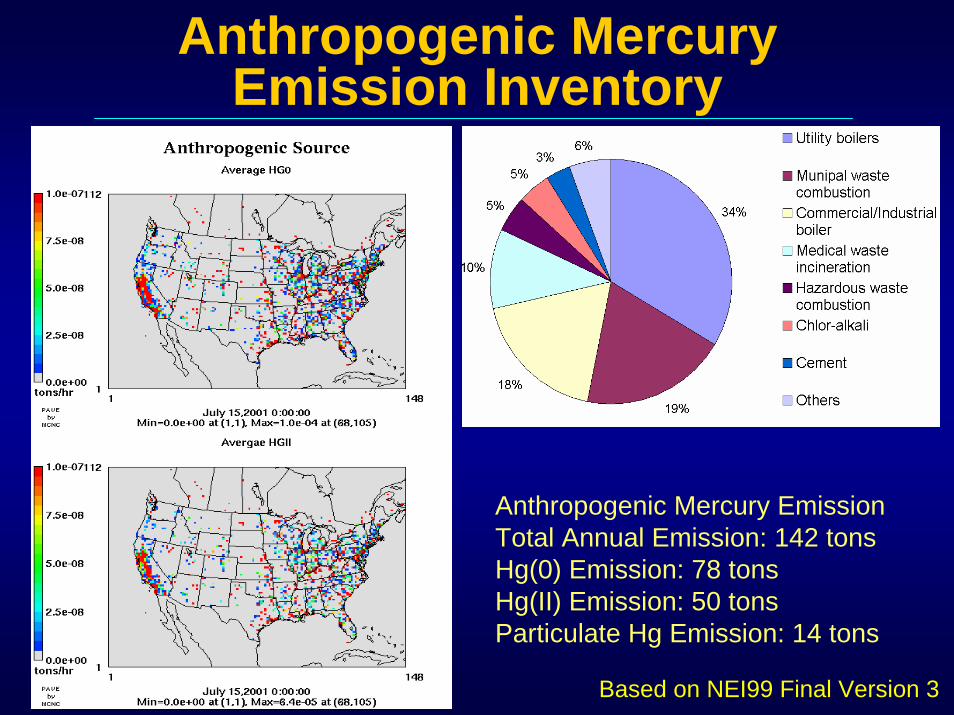
Anthropogenic Mercury Emission Inventory
Anthropogenic Mercury EmissionTotal Annual Emission: 142 tonsHg(0) Emission: 78 tonsHg(II) Emission: 50 tonsParticulate Hg Emission: 14 tons
Based on NEI99 Final Version 3

Natural Mercury Emission Inventory
(Lin et al., 2005)
Ton/grid
Typical Summer Emission
Typical Winter Emission
Annual Natural Emission: Lower Limit = 31 tons “Best” Available Estimate = 44 tonsUpper Limit = 136 tons
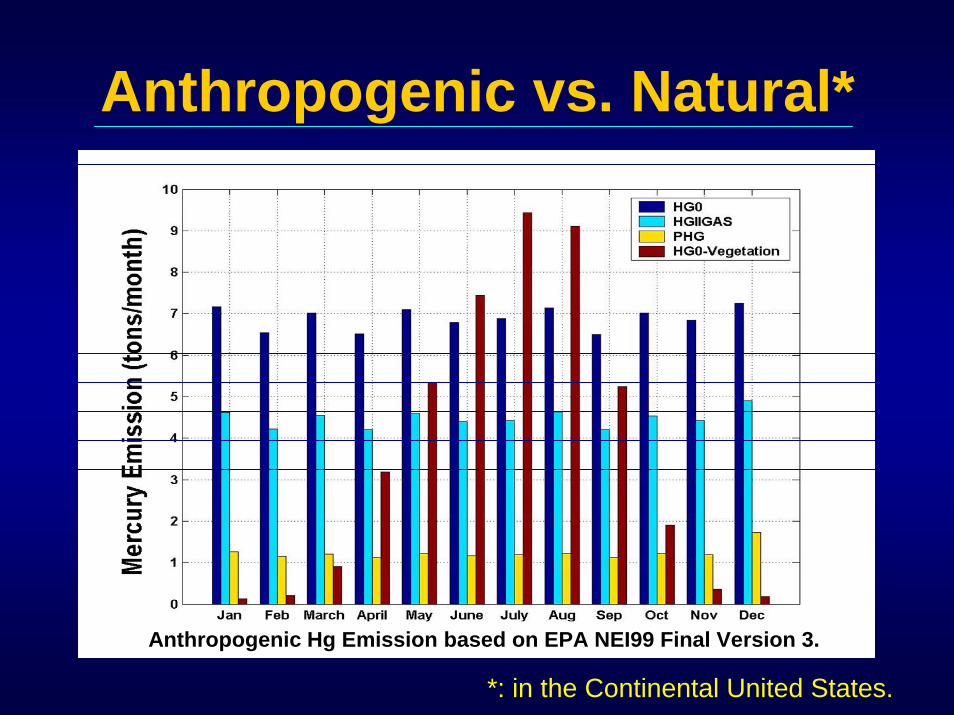
Anthropogenic vs. Natural*
Anthropogenic Hg Emission based on EPA NEI99 Final Version 3.Anthropogenic Hg Emission based on EPA NEI99 Final Version 3.
*: in the Continental United States.

Mercury Deposition• Dry Deposition (Based on Wesley Scheme)
• Wet Deposition
gddry CVF ×=
gddry CVF ×−=
Vd = (Ra + Rb + Rc)-1 + Vg
1-)1111(gsxacclxdcluxmxsx
c rrrrrrrR
++
+++
+=
totalaqwet HgPF ,+2 ][×=

Hg Vdep Implementation - RcTerms Formulation Description Remarks
rdc100[1 + 1000(G + 10)-1](1 + 1000θ)-1
- Buoyant convection resistance
RGM : DRGM = 0.086 cm2/s;DH2O/DRGM = 2.53
GEM : DGEM = 0.1194 cm2/s;DH2O/DGEM = 1.82
rclx [kH/(105rclS) + f0/rclO]-1 - Lower canopy resistance
rgsx [kH/(105rgsS) + f0/rgsO]-1 - Ground surf. resistance
rmx (kH/3000 + 100 f0)-1 - Mesophyll resistance
rlu (10-5 kH + f0)-1 - Leaf cuticular resist. GEM : KH = 0.139 M atm -1,f0(GEM) = 10-5rlux
RGM : KH=2.8x10⁶ M atm–1 (HgCl2)KH=2.7x10¹² M atm–1 (HgO)f0(RGM) = 0.1 or 1.0
[1/(3rlu) + 10-7 kH + f0/rluO]-1 - Dew or rain correction
100 - Leaf cuticular, SO2 (Dew)
[1/5000 + 1/(3rlu)]-1 - Rain correction
[1/3000 + 1/(3rlu)]-1 - Leaf cuticular, O3 (Dew)
[1/1000 + 1/(3rlu)]-1 - Rain correctionrluO
rluS
rsx rsDH2O/Dx, where rs = ri{1 + [200(G + 0.1)-1]2}{400[Ts(40 - Ts)]-1}
- Stomatal resistance for substance x
Note: ri, rlu, rclS, rclO, rac, rgsS, rgsO are parameters depending on land uses and seasons

Hg Dry Deposition VelocityGEM
RGM – as HgCl2
0.0
0.5
1.0
1.5
2.0
2.5
3.0
3.5
4.0
4.5
5.0
1 2 3 4 5 6 7 8 9 10 11 12 13 14 15 16 17 18 19 20 21 22 23 24
Time (Hour of Day)
Vd R
GM
, cm
/s
0.00
0.01
0.02
0.03
0.04
0.05
0.06
0.07
0.08
0.09
Vd G
EM, c
m/s
HgCl2 WinterHgCl2 SummerHgO WinterHgO SummerGEM Summer
V dR
GM
, cm
/s
V dG
EM, c
m/s
Average Vd in Domain

Simplified Hg Chemistry Scheme
Gaseous phase(O3, OH, H2O2,Halogens)
Hg(0)GEM
Hg(II)[RGM/PHg] PHgoxidation
Hg(0) Hg(II)speciation
Hg(p)
PHg
oxidation
reduction Sorption/desorptionin atmospheric water
Aqueous phase(O3, OH, chlorine,SO3
2-, HO2)

Reaction Kinetics
Reaction Rate constant TypeHg0
(g) + O3(g)
⎯→ RGM/PHg + O2(g) 3-75×10-20 cm3molec-1s-1 Ox G Hg0
(aq) + O3(aq) + 2 H + → Hg2+
(aq) + H2O + O2 4.7×10⁷ M-1 s-1 Ox AQ Hg0
(g) + •OH(g) ⎯→ RGM/PHg + Products 8.7×10⁻¹⁴ cm3molec-1s-1 Ox G Hg0
(aq) + •OH(aq) ⎯→ Hg2+(aq) + Products 2.0×10⁹ M-1 s-1 Ox AQ
Hg0(aq) + HOCl(aq) ⎯→ Hg2+
(aq) + Cl- + OH- 2.09×10⁶ M-1s-1 Ox AQ Hg0
(aq) + OCl-(aq) H +
⎯ →⎯ Hg2+(aq) + Cl- + OH- 1.99×10⁶ M-1s-1 Ox AQ
Hg0(g) + H2O2(g) ⎯→ RGM/PHg + products 8.5×10⁻¹⁹ cm3molec-1s-1 Ox G Hg0
(g) + Cl2(g) ⎯→ RGM + products 2.6-4.8×10⁻¹⁸cm3molec-1s-1 Ox G
Hg0(g) + Br2(g) ⎯→ RGM + products 9×10-17 cm3molec-1s-1 Ox G
Hg0(g) + Cl(g) ⎯→ RGM + products 1.0×10⁻¹¹ cm3molec-1s-1 Ox G
Hg0(g) + Br(g) ⎯→ RGM + products 3.2×10⁻¹² cm3molec-1s-1 Ox G
Hg0(g) + BrO(g) ⎯→ RGM + products 1.5×10⁻¹⁴ cm3molec-1s-1 Ox G
HgSO3(aq) ⎯→ Hg0(aq) + products Texp(31.971-(12595/T))s-1 Red AQ
Hg(OH)2(aq) + UV ⎯→ Hg0
(aq) + products 3×10⁻⁷ s-1, midday 60οN Red AQ Hg(II)(aq) + HO2
•(aq) → Hg+
(aq) + O2 + H+ 1.7×10⁴ M-1 s-1 Red AQ

Hg Sorption ImplementationaqDaqatotalaq HgAPMKHg ])[][1(][ 2
,2 ++ +=
Lin et al., 2005

ICONs & BCONs
σ layer 0.98 0.93 0.84 0.60 0.30 0.00HG
(ppmv)1.78E-07
1.77E-07
1.76E-07
1.75E-07
1.74E-07
1.73E-07
HGIIGAS(ppmv)
2.00E-09
3.00E-09
4.00E-09
5.00E-09
6.00E-09
7.00E-09
APHGI(μg/m3)
9.97E-06
9.48E-06
8.98E-06
6.98E-06
4.49E-06
1.49E-06
APHGJ(μg/m3)
9.97E-06
9.48E-06
8.98E-06
6.98E-06
4.49E-06
1.49E-06

Simulation Results (July 2001)
Case 5(Sorption modification)
Case 2(veggie/natural EI)
Case 6(All combined)
Case 3(Dry deposition)
Case 4(Oxidation products)
Case 1(Bullock & Brehme, 2002)
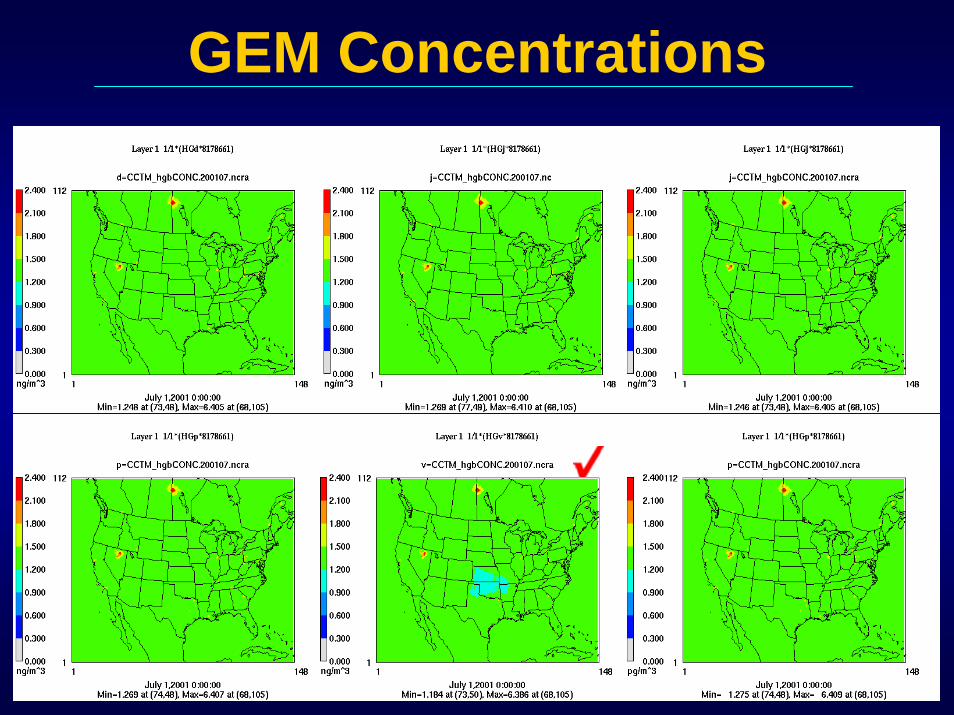
GEM Concentrations

RGM Concentrations
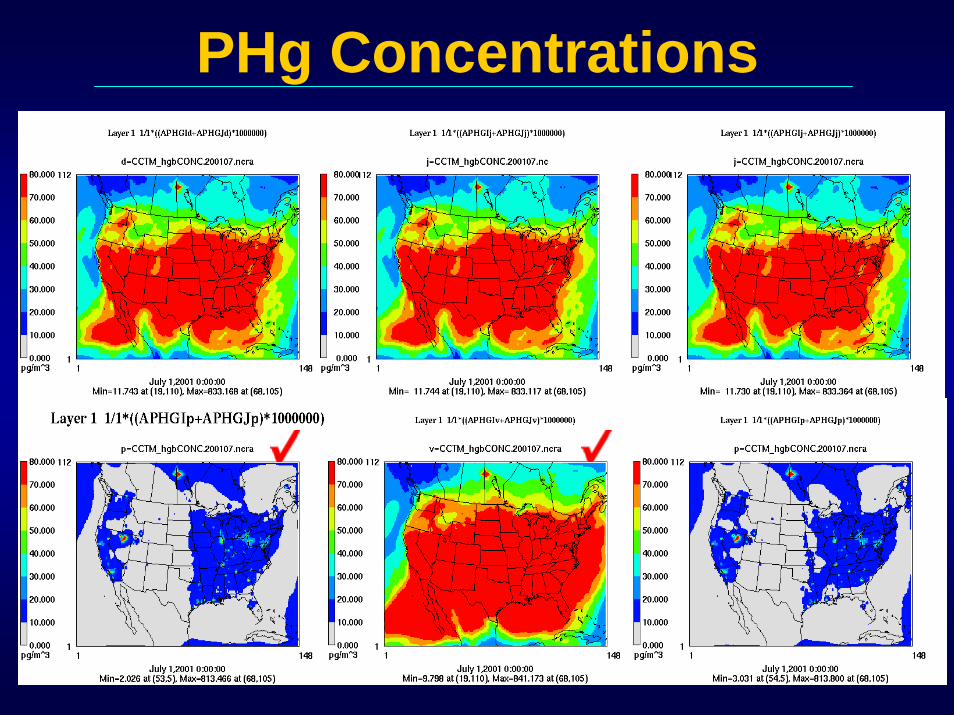
PHg Concentrations

GEM Dry Deposition

RGM Dry Deposition

PHg Dry Deposition
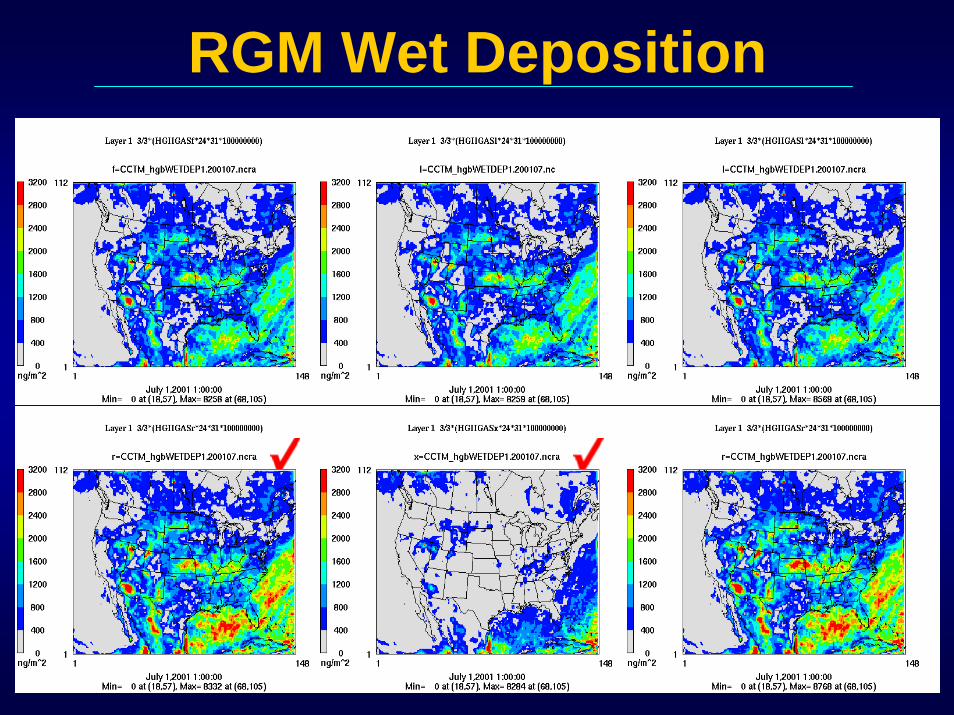
RGM Wet Deposition

PHg Wet Deposition

Mercury Deposition Network
• National network • Started in 1995 at 13
sites• Currently 89 active sites• Monitors wet deposition
of Hg and Me-Hg• Weekly data in
precipitation• Weekly aqueous Hg
concentrations• Operated by Frontier
Geosciences

Interpolated Aqueous Concentration Wet Deposition of Hg from MDN Data
January 2001 July 2001

Model Verification – Aqueous Conc.
January 2001 July 2001
MDN Case1 Case2 Case3 Case4 Case5 Case60
10
20
30
40
50
60
Diss
olved
Hg
Conc
entra
tion,
ng/
L
Box Plot of Dissolved Hg in the Precipitation fromMDN and Model Results: January 2001
MDN Case1 Case2 Case3 Case4 Case5 Case60
10
20
30
40
50
60
Diss
olved
Hg
Conc
entra
tion,
ng/
L
Box Plot of Dissolved Hg in the Precipitation fromMDN and Model Results: July 2001
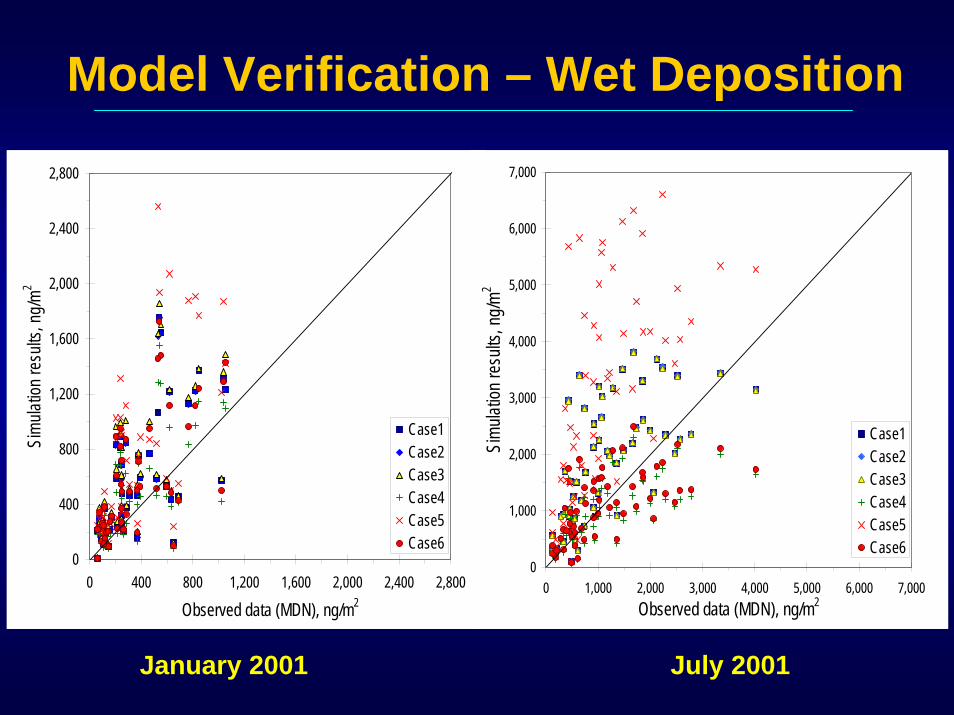
Model Verification – Wet Deposition
January 2001 July 2001
0
400
800
1,200
1,600
2,000
2,400
2,800
0 400 800 1,200 1,600 2,000 2,400 2,800
Observed data (MDN), ng/m2
Simu
lation
resu
lts, n
g/m2
Case1Case2Case3Case4Case5Case6
0
1,000
2,000
3,000
4,000
5,000
6,000
7,000
0 1,000 2,000 3,000 4,000 5,000 6,000 7,000Observed data (MDN), ng/m2
Simu
lation
resu
lts, n
g/m2
Case1Case2Case3Case4Case5Case6

Key Conclusions• Mercury emission does not significantly change total
ambient Hg concentration except near major point sources.• Photochemical activities enhance mercury deposition.• Atmospheric deposition (wet and dry) is forced mainly by
chemistry except near major point sources.• Vegetative Hg emission does not contribute significantly to
Hg deposition, instead, it only slightly increases the concentration of GEM.
• The speciation of oxidized mercury products (RGM vs. PHg) has a strong effect on the relative concentration of RGM and PHg as well as their deposition intensity.
• Sorption/desorption equilibrium strongly affects the composition of deposited mercury in wet deposition. More experimental data are needed for further implementation.
• The science update development in this study shows improvement over the original CMAQ-Hg model.