Embed Size (px)
Citation preview
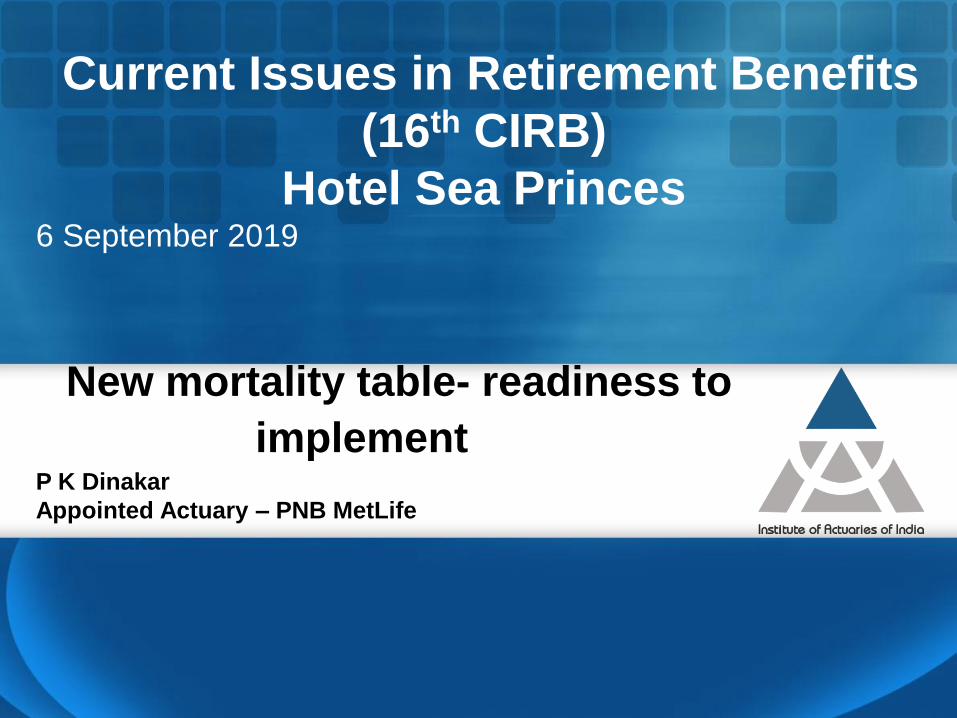
New mortality table- readiness to
implement
P K Dinakar
Appointed Actuary – PNB MetLife
Current Issues in Retirement Benefits
(16th CIRB)
Hotel Sea Princes 6 September 2019

Agenda
• Summary
• Data
• Definition/Methodology
• Crude Mortality Rates
• Graduation of Rates
• Results
• Key Trends
www.actuariesindia.org
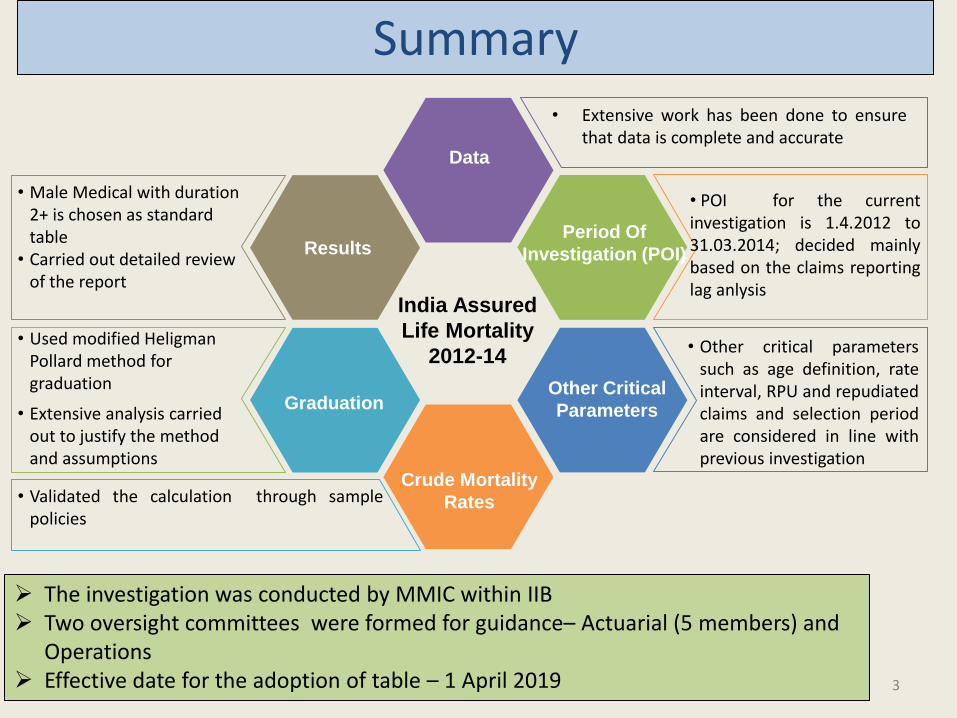
Data
Results Period Of
Investigation (POI)
Other Critical
Parameters
Crude Mortality
Rates
Graduation
• Male Medical with duration 2+ is chosen as standard table
• Carried out detailed review of the report
• Used modified Heligman Pollard method for graduation
• Extensive analysis carried out to justify the method and assumptions
• Validated the calculation through sample policies
• Extensive work has been done to ensure that data is complete and accurate
• POI for the current investigation is 1.4.2012 to 31.03.2014; decided mainly based on the claims reporting lag anlysis
India Assured
Life Mortality
2012-14 • Other critical parameters
such as age definition, rate interval, RPU and repudiated claims and selection period are considered in line with previous investigation
Summary
The investigation was conducted by MMIC within IIB Two oversight committees were formed for guidance– Actuarial (5 members) and
Operations Effective date for the adoption of table – 1 April 2019 3
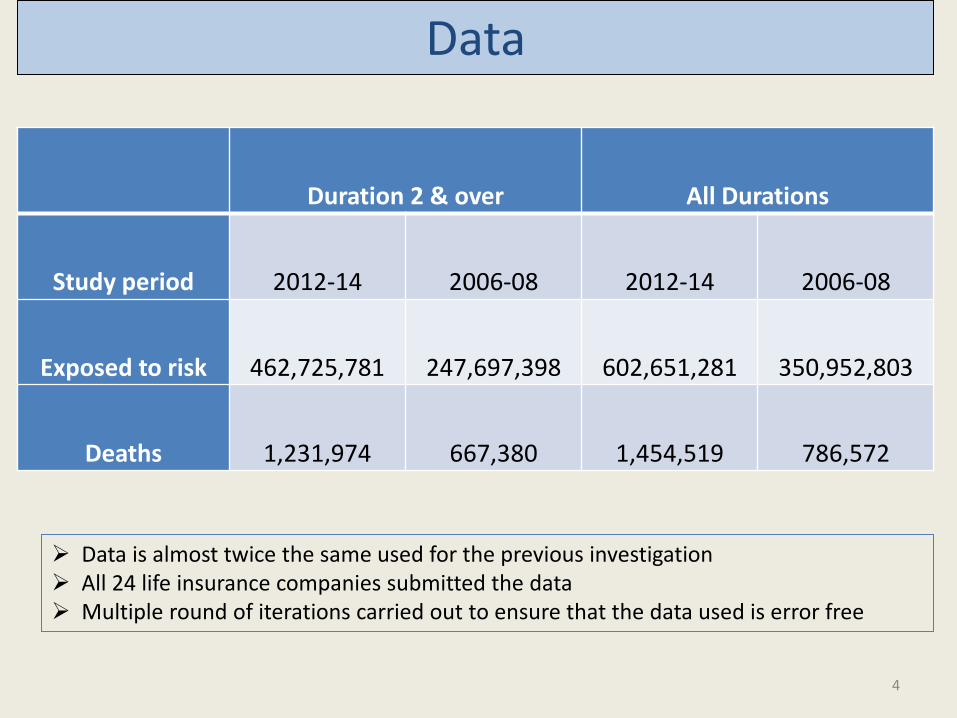
Data
Duration 2 & over All Durations
Study period 2012-14 2006-08 2012-14 2006-08
Exposed to risk 462,725,781 247,697,398 602,651,281 350,952,803
Deaths 1,231,974 667,380 1,454,519 786,572
Data is almost twice the same used for the previous investigation All 24 life insurance companies submitted the data Multiple round of iterations carried out to ensure that the data used is error free
4
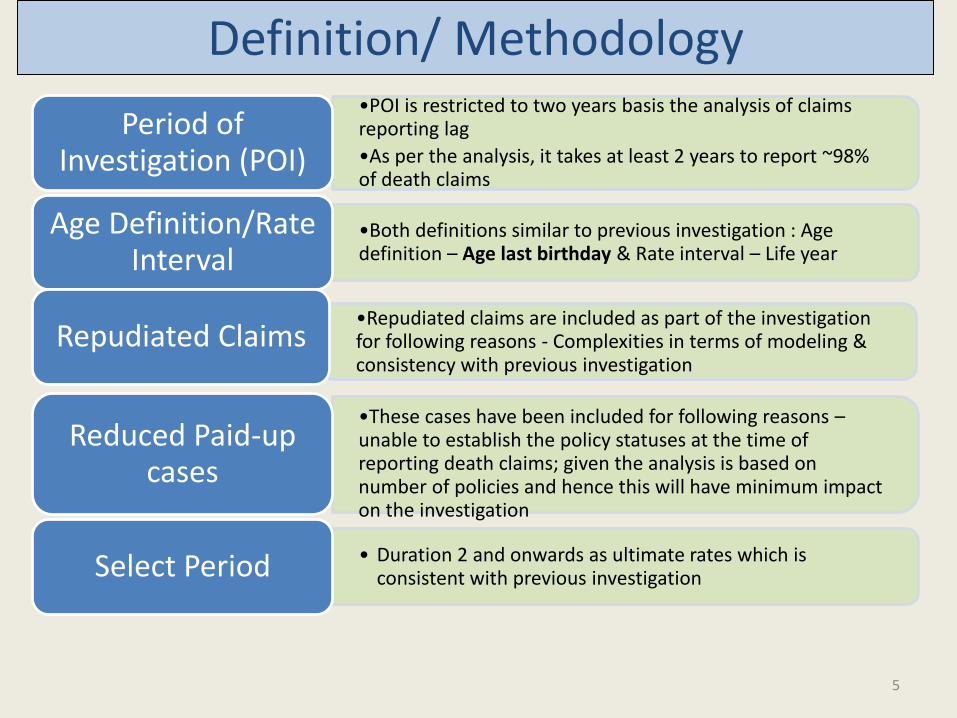
Definition/ Methodology •POI is restricted to two years basis the analysis of claims reporting lag
•As per the analysis, it takes at least 2 years to report ~98% of death claims
Period of Investigation (POI)
•Both definitions similar to previous investigation : Age definition – Age last birthday & Rate interval – Life year
Age Definition/Rate Interval
•Repudiated claims are included as part of the investigation for following reasons - Complexities in terms of modeling & consistency with previous investigation
Repudiated Claims
•These cases have been included for following reasons – unable to establish the policy statuses at the time of reporting death claims; given the analysis is based on number of policies and hence this will have minimum impact on the investigation
Reduced Paid-up cases
• Duration 2 and onwards as ultimate rates which is consistent with previous investigation Select Period
5

Crude Mortality Rates
•Checked the calculation of Crude Mortality Rates (CMR) at industry level for overall reasonableness (through sample policies)
•Checked the progression of exposure and deaths to ensure that there are no anomalies
Calculation
• CMR compared with same that was calculated for previous investigation (2006-08)
• Rates were calculated separately for medical/non medical/different sum assured groups/products groups
Trends
6
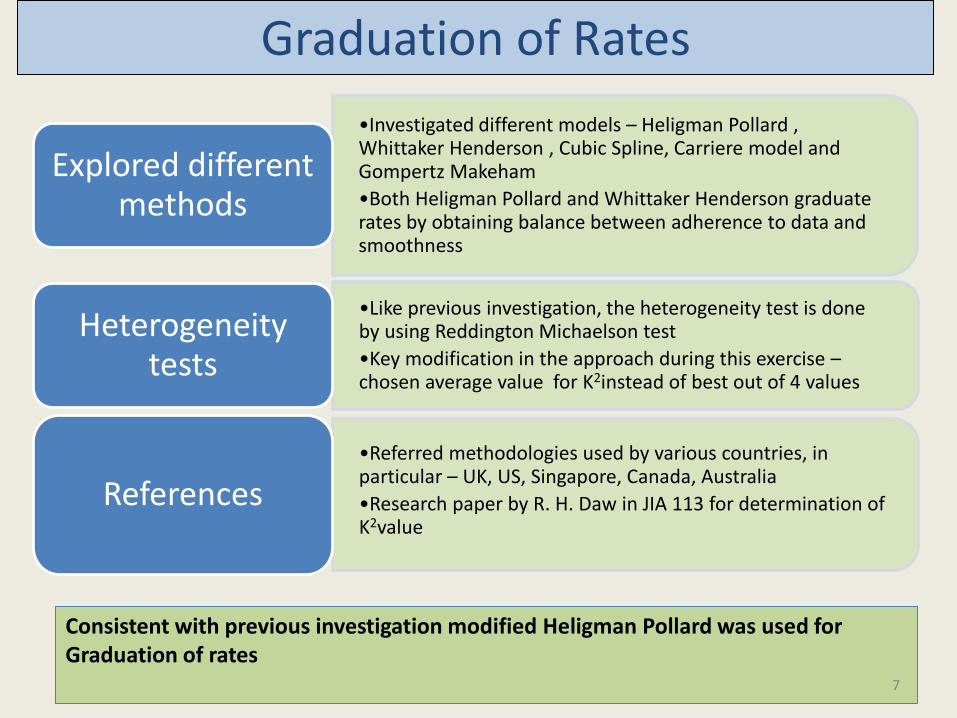
Graduation of Rates
•Investigated different models – Heligman Pollard , Whittaker Henderson , Cubic Spline, Carriere model and Gompertz Makeham
•Both Heligman Pollard and Whittaker Henderson graduate rates by obtaining balance between adherence to data and smoothness
Explored different methods
•Like previous investigation, the heterogeneity test is done by using Reddington Michaelson test
•Key modification in the approach during this exercise – chosen average value for K2instead of best out of 4 values
Heterogeneity tests
•Referred methodologies used by various countries, in particular – UK, US, Singapore, Canada, Australia
•Research paper by R. H. Daw in JIA 113 for determination of K2value
References
Consistent with previous investigation modified Heligman Pollard was used for Graduation of rates
7

Results – Standard Mortality Rates
Male Medical with duration 2 and over is chosen as standard mortality table; consistent with previous two investigations IALM 2012-14 are lighter than the Standard Rates of IALM 2006-08 across all ages up to 75 except at age range 12-21 due to shift of accident hump to younger ages.
8
0
0.05
0.1
0.15
0.2
0.25
0.3
0.35
0.4
0.45
0 20 40 60 80 100 120
IALM12-14
IALM06-08

-20.00%
0.00%
20.00%
40.00%
60.00%
80.00%
100.00%
2 5 8 11 14 17 20 23 26 29 32 35 38 41 44 47 50 53 56 59 62 65 68
% Im
pro
vem
en
t
Age
IALM 2012-14 to IALM 2006-08
IALM 2012-14 to IALM 2006-08
-60.00%
-40.00%
-20.00%
0.00%
20.00%
40.00%
60.00%
80.00%
2 5 8 1114172023262932353841444750535659626568
% Im
pro
vem
en
t
Age
IALM 2012-14 to LIC 1994-96
IALM 2012-14 to LIC 1994-96
Improvement in Standard Rates over 2006-08 & 1994-96 Rates

0%
10%
20%
30%
40%
50%
60%
70%
80%
0-4 5-9 10-14 15-19 20-24 25-29 30-34 35-39 40-44 45-49 50-54 55-59 60-64 65-69
%
Age Range
IALM to India (% to India)
IALM to India - MaleIALM to India - Female
IALM 2012-14 Vs Census 2013

0%
20%
40%
60%
80%
100%
120%
0 20 40 60 80 100 120
% IALM to IALM
% Aus to IALM
% UK to IALM
% USA to IALM
% Jap to IALM
Country wise Mortality Study

Thank You