Embed Size (px)
Citation preview


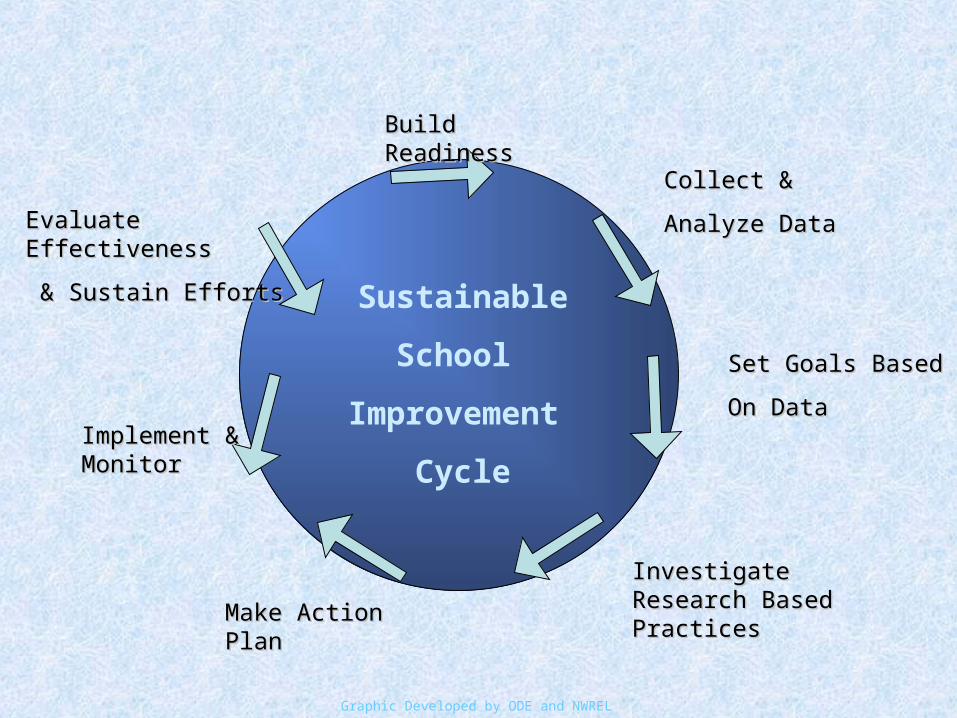
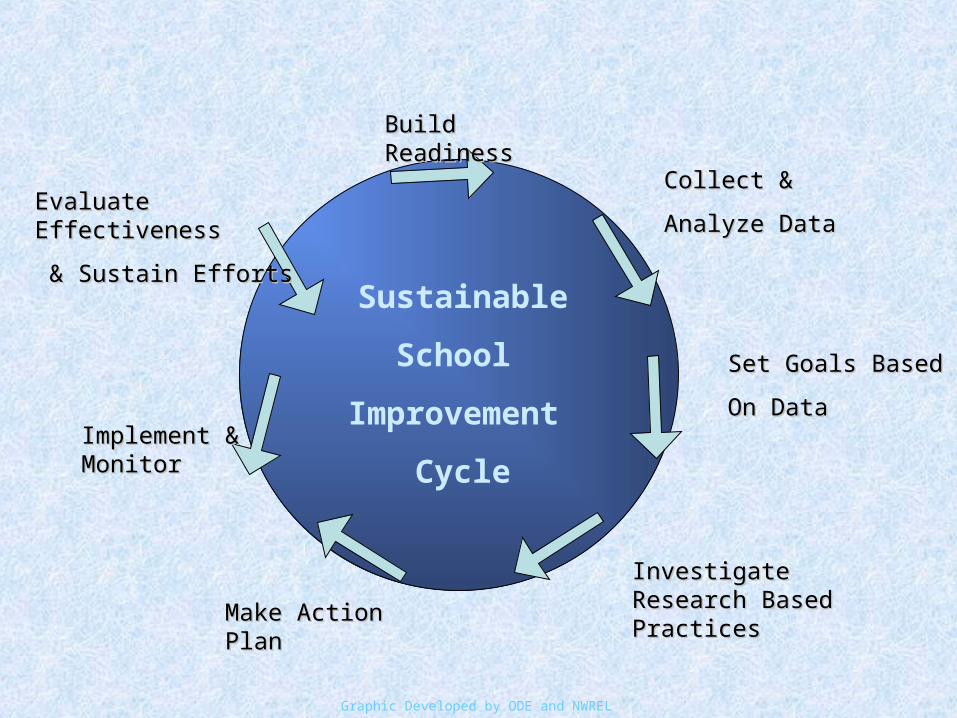
Build Readiness
Collect &
Analyze Data
Set Goals Based
On Data
Investigate Research Based PracticesMake Action Plan
Implement & Monitor
Evaluate Effectiveness
& Sustain Efforts
Sustainable
School
Improvement
Cycle*
Graphic Developed by ODE and NWREL

Something To Ponder
In the real world of the classroom, it’s CRITICAL MASS that matters.
DEEP implementation of a FEW things beats superficial implementation of many things.
Doug Reeves, April 27, 2007

The Leadership and Learning The Leadership and Learning MatrixMatrix
LuckyHigh results, low under-standing of antecedents.
Replication of success unlikely.
LeadingHigh results, high under-standing of antecedents.
Replication of success
likely.
LosingLow results, low under-standing of antecedents.
Doh!
LearningLow results, high under-standing of antecedents.
Replication of mistakes unlikely.
Eff
ects
/ R
esul
ts D
ata
– S
tude
nts
Antecedents / Cause Data - Adults
What’s Needed To Be A Learning or a Leading What’s Needed To Be A Learning or a Leading Organization? Organization?
Lucky1. No Accountability Plan
2. Not Using Data to Make Resource & Instructional Decisions, and to Revise/Renew/Modify all SMART Goals
3. No Guaranteed and Viable Curriculum
Leading1. An Accountability Plan
2. Uses Data to Make Resource & Instructional Decisions, and to Revise/Renew/Modify all SMART Goals
3. Identifies Guaranteed and Viable Curriculum
Losing1. No Accountability Plan
2. Not Using Data to Make Resource & Instructional Decisions, and to Revise/Renew/Modify all SMART Goals
3. No Guaranteed and Viable Curriculum
Learning1. An Accountability Plan
2. Uses Data to Make Resource & Instructional Decisions, and to Revise/Renew/Modify all SMART Goals
3. Identifies Guaranteed and Viable Curriculum
What’s Needed to be A Lucky or a Losing Organization?
Build ReadinessBuild Readiness
Collect & Collect &
Analyze DataAnalyze Data
Set Goals BasedSet Goals Based
On DataOn Data
Investigate Research Investigate Research Based PracticesBased Practices
Make Action PlanMake Action Plan
Implement & Implement & MonitorMonitor
Evaluate EffectivenessEvaluate Effectiveness
& Sustain Efforts& Sustain Efforts
Sustainable
School
Improvement
Cycle
Graphic Developed by ODE and NWREL
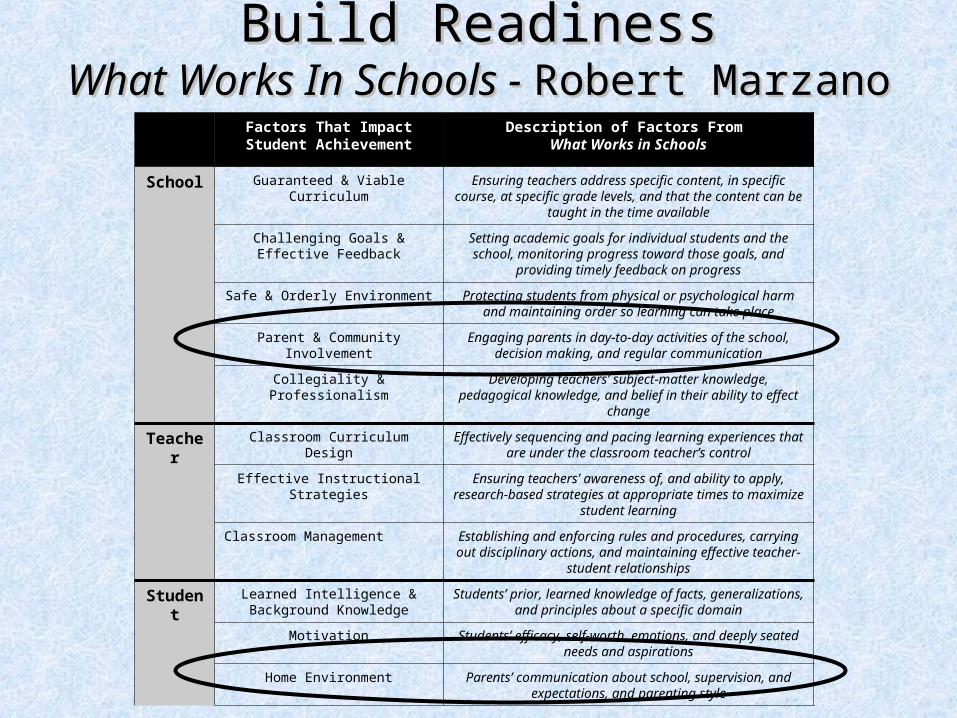
Build ReadinessBuild ReadinessWhat Works In Schools - What Works In Schools - Robert MarzanoRobert Marzano
Factors That Impact Student Achievement
Description of Factors From What Works in Schools
School Guaranteed & Viable Curriculum Ensuring teachers address specific content, in specific course, at specific grade levels, and that the content can be taught in the
time available
Challenging Goals & Effective Feedback
Setting academic goals for individual students and the school, monitoring progress toward those goals, and providing timely
feedback on progress
Safe & Orderly Environment Protecting students from physical or psychological harm and maintaining order so learning can take place
Parent & Community Involvement Engaging parents in day-to-day activities of the school, decision making, and regular communication
Collegiality & Professionalism Developing teachers’ subject-matter knowledge, pedagogical knowledge, and belief in their ability to effect change
Teacher Classroom Curriculum Design Effectively sequencing and pacing learning experiences that are under the classroom teacher’s control
Effective Instructional Strategies Ensuring teachers’ awareness of, and ability to apply, research-based strategies at appropriate times to maximize student
learning
Classroom Management Establishing and enforcing rules and procedures, carrying out disciplinary actions, and maintaining effective teacher-student
relationships
Student Learned Intelligence & Background Knowledge
Students’ prior, learned knowledge of facts, generalizations, and principles about a specific domain
Motivation Students’ efficacy, self-worth, emotions, and deeply seated needs and aspirations
Home Environment Parents’ communication about school, supervision, and expectations, and parenting style
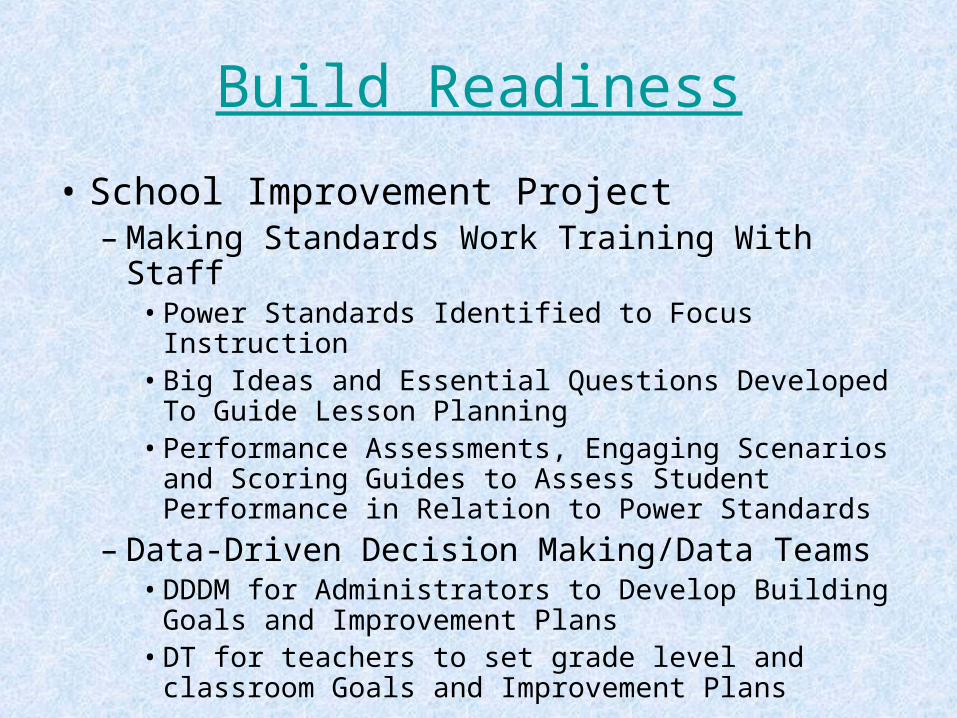
Build Readiness
• School Improvement Project– Making Standards Work Training With Staff
• Power Standards Identified to Focus Instruction• Big Ideas and Essential Questions Developed To
Guide Lesson Planning• Performance Assessments, Engaging Scenarios
and Scoring Guides to Assess Student Performance in Relation to Power Standards
– Data-Driven Decision Making/Data Teams• DDDM for Administrators to Develop Building
Goals and Improvement Plans• DT for teachers to set grade level and classroom
Goals and Improvement Plans

Build ReadinessBuild Readiness
Collect & Collect &
Analyze DataAnalyze Data
Set Goals BasedSet Goals Based
On DataOn Data
Investigate Research Investigate Research Based PracticesBased Practices
Make Action PlanMake Action Plan
Implement & Implement & MonitorMonitor
Evaluate EffectivenessEvaluate Effectiveness
& Sustain Efforts& Sustain Efforts
Sustainable
School
Improvement
Cycle
Graphic Developed by ODE and NWREL

Collect and Analyze DataCollect and Analyze Data
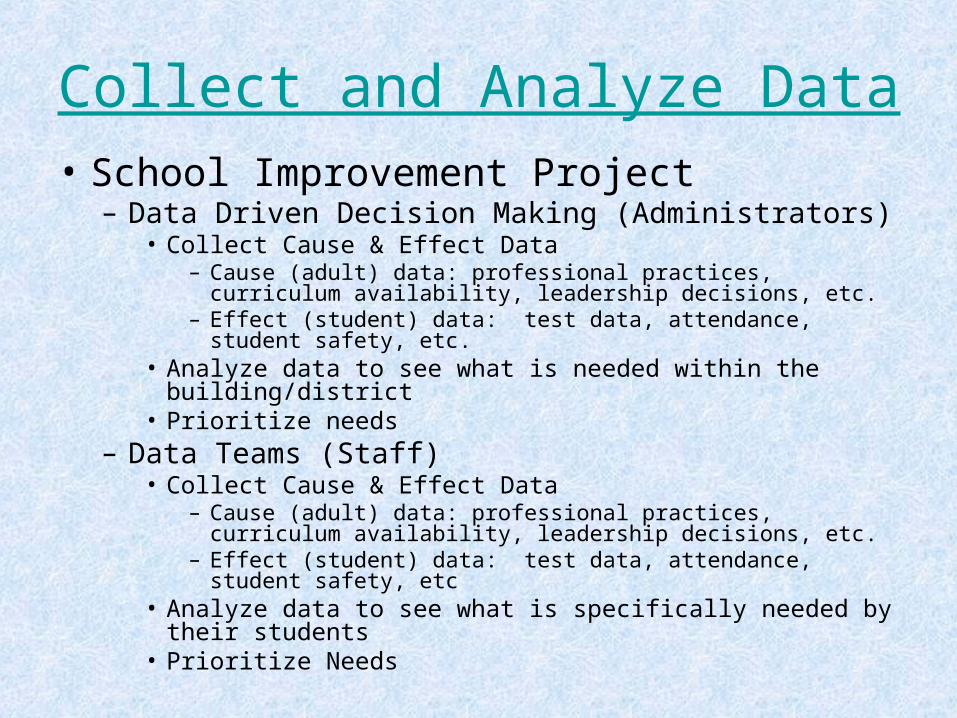
Collect and Analyze Data• School Improvement Project
– Data Driven Decision Making (Administrators)• Collect Cause & Effect Data
– Cause (adult) data: professional practices, curriculum availability, leadership decisions, etc.
– Effect (student) data: test data, attendance, student safety, etc.• Analyze data to see what is needed within the
building/district• Prioritize needs
– Data Teams (Staff)• Collect Cause & Effect Data
– Cause (adult) data: professional practices, curriculum availability, leadership decisions, etc.
– Effect (student) data: test data, attendance, student safety, etc• Analyze data to see what is specifically needed by their
students• Prioritize Needs

Why Collect & Analyze Data?
“Until you have data as a backup, you’re just another person with an opinion.”
Dr. Perry Gluckman

Build ReadinessBuild Readiness
Collect & Collect &
Analyze DataAnalyze Data
Set Goals BasedSet Goals Based
On DataOn Data
Investigate Research Investigate Research Based PracticesBased Practices
Make Action PlanMake Action Plan
Implement & Implement & MonitorMonitor
Evaluate EffectivenessEvaluate Effectiveness
& Sustain Efforts& Sustain Efforts
Sustainable
School
Improvement
Cycle
Graphic Developed by ODE and NWREL
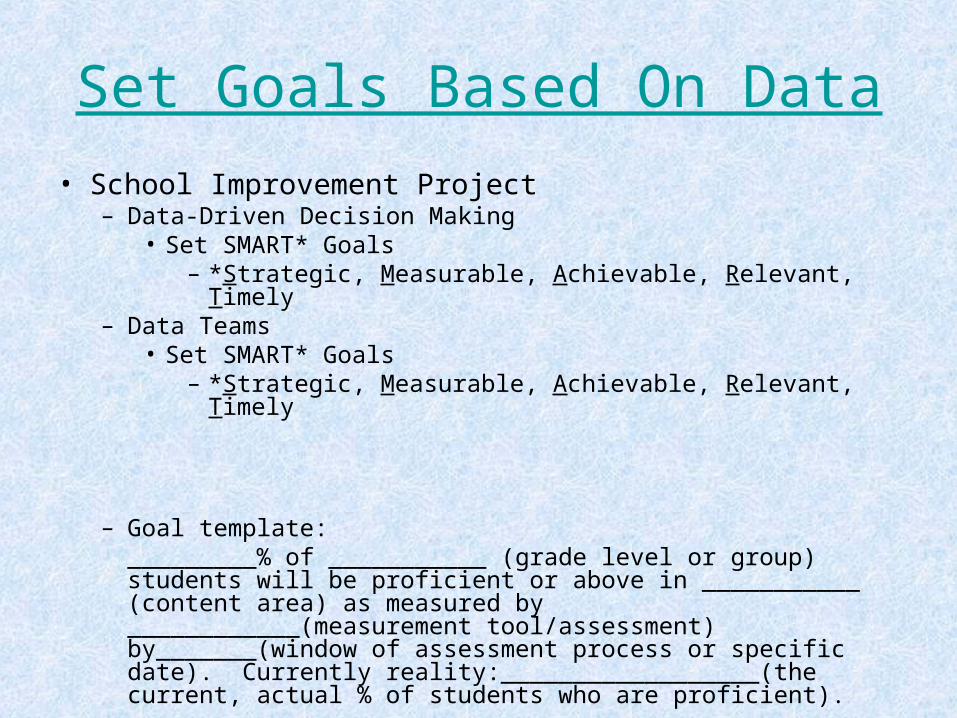
Set Goals Based On Data
• School Improvement Project– Data-Driven Decision Making
• Set SMART* Goals – *Strategic, Measurable, Achievable, Relevant, Timely
– Data Teams• Set SMART* Goals
– *Strategic, Measurable, Achievable, Relevant, Timely
– Goal template:_________% of ___________ (grade level or group) students will be proficient or above in ___________ (content area) as measured by ____________(measurement tool/assessment) by_______(window of assessment process or specific date). Currently reality:__________________(the current, actual % of students who are proficient).

Build ReadinessBuild Readiness
Collect & Collect &
Analyze DataAnalyze Data
Set Goals BasedSet Goals Based
On DataOn Data
Investigate Research Investigate Research Based PracticesBased Practices
Make Action PlanMake Action Plan
Implement & Implement & MonitorMonitor
Evaluate EffectivenessEvaluate Effectiveness
& Sustain Efforts& Sustain Efforts
Sustainable
School
Improvement
Cycle
Graphic Developed by ODE and NWREL

Investigate Research-based Practices• School Improvement Project
– Data-Driven Decision Making• Create a menu of research-based strategies• Identify indicators that will measure the impact of
the use of strategies
– Data Teams• Create a menu of research-based strategies• Identify indicators that will measure the impact of
the use of strategies

Build ReadinessBuild Readiness
Collect & Collect &
Analyze DataAnalyze Data
Set Goals BasedSet Goals Based
On DataOn Data
Investigate Research Investigate Research Based PracticesBased Practices
Make Action PlanMake Action Plan
Implement & Implement & MonitorMonitor
Evaluate EffectivenessEvaluate Effectiveness
& Sustain Efforts& Sustain Efforts
Sustainable
School
Improvement
Cycle
Graphic Developed by ODE and NWREL

Make An Action Plan• School Improvement Project
– Data-Driven Decision Making• Strategies are classroom actions that lead to the attainment of
the goal• Strategies need to be:
– Action-Oriented– Measurable/Accountable– Specific– What the teacher, principal, parents will do– What training is needed and indicators of its implementation
– Data Teams• Strategies are classroom actions that lead to the attainment of
the goal• Strategies need to be:
– Action-Oriented– Measurable/Accountable– Specific– What the teachers/team will do– What training is needed and indicators of its implementation

Build ReadinessBuild Readiness
Collect & Collect &
Analyze DataAnalyze Data
Set Goals BasedSet Goals Based
On DataOn Data
Investigate Research Investigate Research Based PracticesBased Practices
Make Action PlanMake Action Plan
Implement & Implement & MonitorMonitor
Evaluate EffectivenessEvaluate Effectiveness
& Sustain Efforts& Sustain Efforts
Sustainable
School
Improvement
Cycle
Graphic Developed by ODE and NWREL
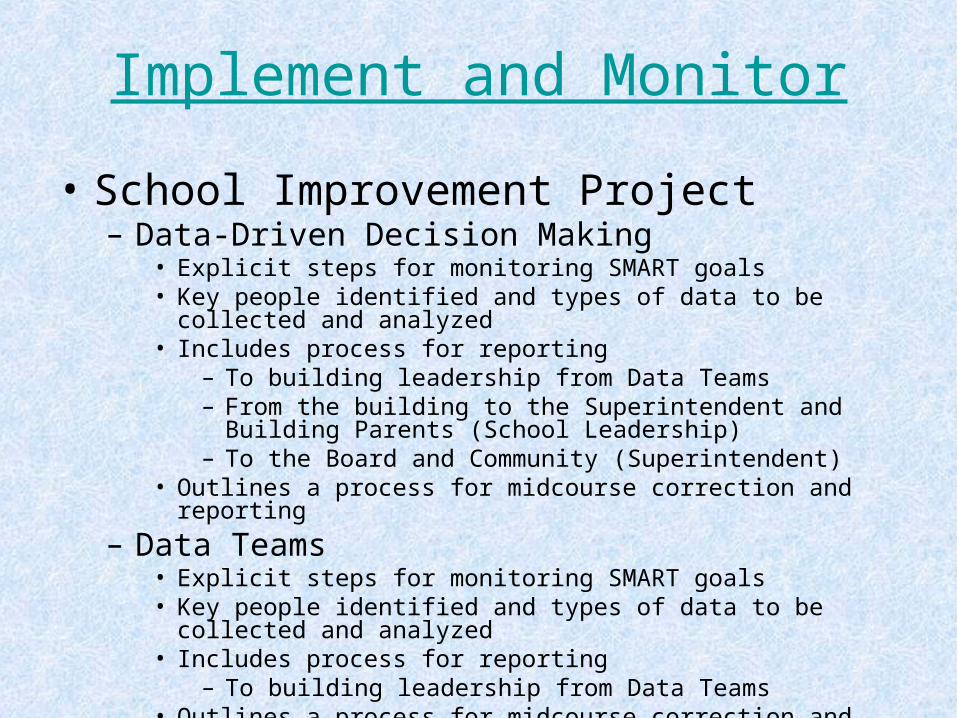
Implement and Monitor
• School Improvement Project– Data-Driven Decision Making
• Explicit steps for monitoring SMART goals• Key people identified and types of data to be collected and analyzed• Includes process for reporting
– To building leadership from Data Teams– From the building to the Superintendent and Building Parents
(School Leadership)– To the Board and Community (Superintendent)
• Outlines a process for midcourse correction and reporting
– Data Teams• Explicit steps for monitoring SMART goals• Key people identified and types of data to be collected and analyzed• Includes process for reporting
– To building leadership from Data Teams• Outlines a process for midcourse correction and reporting
Build ReadinessBuild Readiness
Collect & Collect &
Analyze DataAnalyze Data
Set Goals BasedSet Goals Based
On DataOn Data
Investigate Research Investigate Research Based PracticesBased Practices
Make Action PlanMake Action Plan
Implement & Implement & MonitorMonitor
Evaluate EffectivenessEvaluate Effectiveness
& Sustain Efforts& Sustain Efforts
Sustainable
School
Improvement
Cycle
Graphic Developed by ODE and NWREL
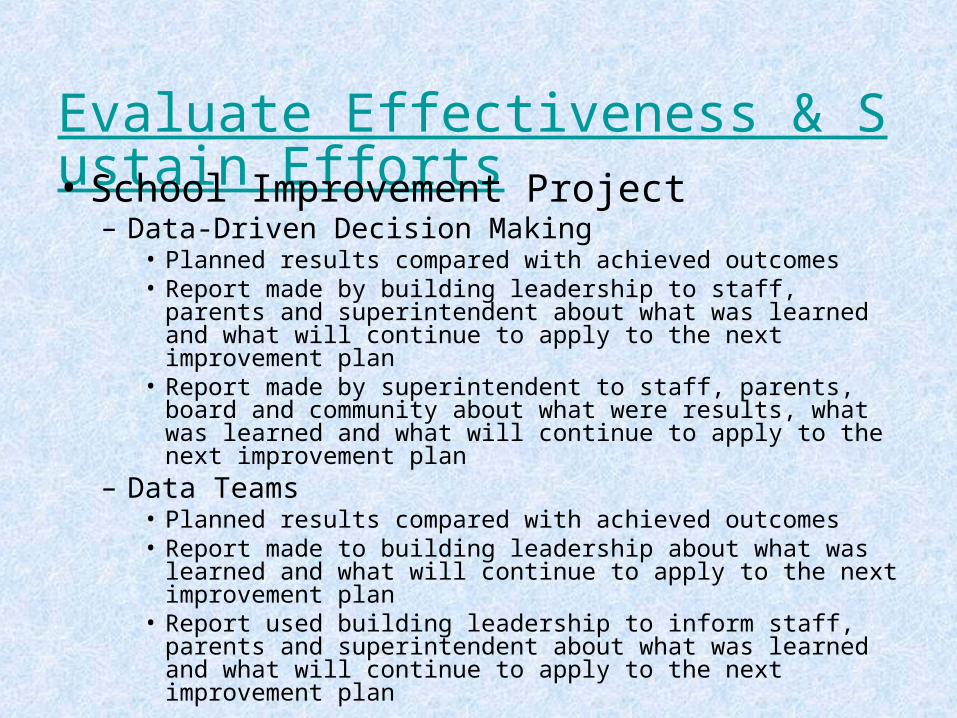
Evaluate Effectiveness & Sustain Efforts• School Improvement Project
– Data-Driven Decision Making• Planned results compared with achieved outcomes• Report made by building leadership to staff, parents and
superintendent about what was learned and what will continue to apply to the next improvement plan
• Report made by superintendent to staff, parents, board and community about what were results, what was learned and what will continue to apply to the next improvement plan
– Data Teams• Planned results compared with achieved outcomes• Report made to building leadership about what was learned
and what will continue to apply to the next improvement plan• Report used building leadership to inform staff, parents and
superintendent about what was learned and what will continue to apply to the next improvement plan