Embed Size (px)
Citation preview
Paper
New Metric for World Wide Web
Service Quality
Tadeus Uhl1, Janusz Klink2, and Paweł Bardowski2
1 Maritime University of Szczecin, Szczecin, Poland2 Wrocław University of Technology, Wrocław, Poland
Abstract—The main topic of this paper is the quality of the
WWW service evaluation. The authors present well-known
measurement methods, and present the new “Power” metric
for quality, advocating it as a method of assessing the quality
of such service. This metric is based on the most important
network parameters that affect any assessment of the WWW
service, i.e. Web page opening time and download data trans-
fer rate. The new method is easy to implement, fast in oper-
ation, and provides stable and repeatable results.
Keywords—Apdex, G.1030, QoE, QoS, quality metrics, service
quality assessment, WWW service quality.
1. Introduction
The vigorous development of the Internet has meant that the
worldwide web has become the most widely and frequently
used communication platform of all, offering a steadily in-
creasing range of applications and services. The volume
of data transfer is increasing rapidly as well. According to
the latest estimates from Cisco [1], the volume of data that
is transferred over the Web will reach the zetabyte (1021)
mark in the course of 2015.
Because the Web works on the packet switching princi-
ple without resource reservation, it can very quickly come
to deterioration in quality of service (QoS) – one of the
chief issues in this paper [2]–[4]. Even the European Par-
liament has become very concerned with the issue in re-
cent years. In 2009, for instance, European Union Di-
rectives were published that directly affect neutrality and
transparency within the telecommunications market [5], [6].
With the publication of these documents all EU member
states became compelled to put the Directives into practice.
In November 2012 the Polish national regulator, UKE, is-
sued the so-called “Memorandum on QoS” with the aim
of formulating regulations on QoS in networks designed
to transport electronic services [7]. The German regula-
tor, BNetzA, undertook similar initiatives in April 2013,
establishing a so-called “Discussion Forum” which was to
pursue goals similar to those mentioned above [8] and be
generally accessible over the Web. Workgroups of both
regulators are endeavouring to complete their deliberations
and publish their reports before the end of 2013. It will then
become clear whether a policy of self-regulation or a cor-
pus of regulation laws will govern the telecommunications
market.
Internet services can be divided into two groups: real-time
and non-real-time services. The first group contains such
services as VoIP, VToIP, IPTV, and video-conferencing.
These services are extremely susceptible to the network pa-
rameters as: network delays, jitter and packet losses. The
second group contains such services as FTP, TFTP, mail,
video on demand, and WWW. The most important factor
here is the reliability of transfer. That is why the reliable
protocol TCP is used for these services.
The WWW service is one of the non-real-time services.
Network delay is an insignificant impairment parameter.
Whilst efficiency of data transfer is the most decisive at-
tribute, the time factor cannot be ignored entirely. From
the end user’s point of view it is important that Web pages
should be loaded within an acceptable time span. Obvi-
ously, the web page opening time, which is sum of different
delays in the server, network and user equipment, impacts
on the WWW service quality perceived by the user. It
should be underlined that the point of measurement, i.e., the
specific operator’s network or Internet access, can influence
the quality evaluation results. Therefore, it is extremely
important, for the objective quality evaluation, to fulfil by
the network operators all the EU requirements mentioned
above, concerning net neutrality. So the question here is
how can the quality of the WWW service can be described,
and which metrics should be used to quantify it?
Having analysed existing documentation from the ITU-T
[9], [10] and ETSI [11]–[15], the authors propose a new,
objective metric for determining QoS in the WWW ser-
vice, based on the well-known Mean Opinion Score (MOS)
scale [16]. The new metric takes into account measure-
ment circumstances, i.e. network delay, therefore allows to
achieve more objective results of the service quality offered
by the service provider. Such an approach hasn’t been pre-
sented in the literature by now.
2. The Well-Known QoS Techniques for
Evaluating the WWW Service
Many approaches to evaluating IP-based services and
methods to evaluate the quality of the WWW service are
described in the relevant literature. In all these methods,
the time period between the user’s issuing a request and
the page loading time is used as a criterion of quality.
50

New Metric for World Wide Web Service Quality
A good example of such approach to quality assessment is
the Application Performance Index (Apdex) method [17].
It is an open standard, that allows measurable parameters of
the network, the services or the application’s performance
to be converted into one commonly understood factor.
The magnitude of this factor can be described as a value
on a scale of user satisfaction. The evaluation result, which
can have values between 0 and 1, can be calculated from:
AT =
Lz+Lt
2
Lw, (1)
where: AT – evaluation score according to Apdex, T –
maximum time of service “realization” (e.g. WWW page
opening time) which permits a service classification, in the
user’s opinion, as very good, Lz – number of users who are
satisfied with the service quality, Lt – number of users who
tolerate the service quality, Lw – total number of users in
the test.
The final result that is obtained using Eq. (1) depends
heavily on the threshold time T . It is the value of the de-
lay which, in the user’s opinion, represents only a neg-
ligible reduction of service quality (Fig. 1). Thus, it can
be assumed that a Web page loading time of no longer
than T guarantees high user satisfaction of WWW service
operation.
Satisfactionzone
Tolerancezone
Frustrationzone
0 T F = 4T Time
Fig. 1. Threshold values for the Apdex method.
It is assumed that 4T is the upper limit of delay tolerated
by the user. In practice, this problem consists in fixing the
maximum value of T that will guarantee, in the user’s opin-
ion, a very good quality of service. When setting the value
of T for a specific service, observation of users’ behavior
can be very helpful. In other words, it can be assumed that
for the WWW service T is the maximum time which does
not distract the user’s attention from the service as a re-
sult of his waiting for an application response. For delays
longer than T that do not exceed F = 4T , users will notice
a deterioration in the service quality, but they will toler-
ate it. Users’ evaluation is expressed on the five-degree
MOS scale and is inversely proportionate to the value of
delay. When delays exceed F = 4T , users no longer accept
the service quality.
In Recommendation G.1030 [10] the International Tele-
communication Union proposes a methodology of service
quality assessment in IP networks and presents a pre-
cise evaluation model which reveals the relationship be-
tween network performance measurement results and Web-
browsing user satisfaction.
User appraisal depends on several factors connected with,
among other things, the network itself, customer end-point
equipment performance, the software used and the degree
of user-application interaction.
A WWW service quality evaluation model, based on user
opinion, was presented in an appendix to Rec. G.1030.
This model takes into account relationships between mea-
surable, i.e., objective, service operation factors such as
page response time and data download time and the user’s,
i.e. subjective, opinion.
The authors must stress the fact that Web page response
time is the dominant and objective quality factor for the
WWW service. On the other hand, the user’s evaluation
score is very subjective, and depends on different factors,
not least their experiences and expectations. Three time
scales (thresholds) have been specified which are connected
with the perceptual quality evaluation of the service that is
provided to the user:
• first threshold (0.1 s) – describes the optimum value
of interaction time between user and service. Within
this time period the user has the impression that the
service reacts immediately, i.e. without any delays.
This is very important for real-time services (conver-
sations, etc.);
• second threshold (1 s) – denotes the maximum ser-
vice reaction time that, although noticeable by the
user, does not lead to problems in service utilization.
This time does not interrupt service continuity;
• third threshold (10 s) – the maximum time that al-
lows a user to work with the application without any
distractions. Longer times are considered to be un-
acceptable. In such cases it is recommended that the
user be informed that additional delay is possible and
when an ongoing operation is expected to be com-
pleted.
It has been noticed that users who have been informed about
expected waiting time (e.g., for opening the web page) will
accept it more readily and even award a better mark for the
service operation.
An experiment was done which consisted of starting
a search engine, typing a given phrase and finding and
opening a suitable page (Fig. 2).
Search engineopeningrequest
Searchbeginning
Firstresponse
Firstresponse
Pageopen
Requestpage open
T1 T3T2 T4
Time
Fig. 2. Web page opening experiment times.
Users evaluating quality of the WWW service have been
divided into two categories: the first consists of profes-
51
Tadeus Uhl, Janusz Klink, and Paweł Bardowski
sionals, the second includes non-professionals, i.e., people
with little computer experience.
Evaluation results presented by the two categories have
similar trends though – the marks they awarded were in-
versely proportionate to the page opening delays. In long-
period observations, however, a significant difference be-
tween these groups has been observed. Non-professionals
tended to be more radical in their evaluations than profes-
sionals, who were relatively moderate. Non-professionals
gave much higher marks for short opening times of the Web
pages and very low marks for long delays. This WWW ser-
vice evaluation was conducted in three sessions, lasting 6 s,
15 s and 60 s, respectively. It was observed that the dif-
ference between the evaluation marks of the two groups
decreased as the delays became longer. For 60-second
sessions the correlation between page opening times and
users’ subjective evaluation marks exceeded 0.95 in both
groups.
In both methods mentioned above quality of service evalu-
ation consists of determining suitable metrics. This will re-
veal a relationship between network performance, customer
end-point equipment and applications parameters described
by so-called intrinsic QoS with the quality that is experi-
enced by the customer i.e. Quality of Experience (QoE).
In both cases the Web page opening time was the main
parameter that was measured and assessed. Such metrics
permit an evaluation of quality of the service which is de-
livered within a given time and environment. They rather
describe facts (QoS/QoE) without searching for the rea-
sons. That is why these methods are not suitable for the
benchmarking of different ISP WWW services made by
measurement staff located at various network destinations.
Final evaluation marks are strongly influenced, among other
things, by data transfer delay which depends on the through-
put of the Internet access line which is used in a specific
locality. Measurements performed at different destinations
can therefore yield conflicting results. That is why the au-
thors of this paper decided to introduce a new metric, called
“Power”, which can extract each element responsible for the
delays caused by Internet user access.
3. The Real Environment
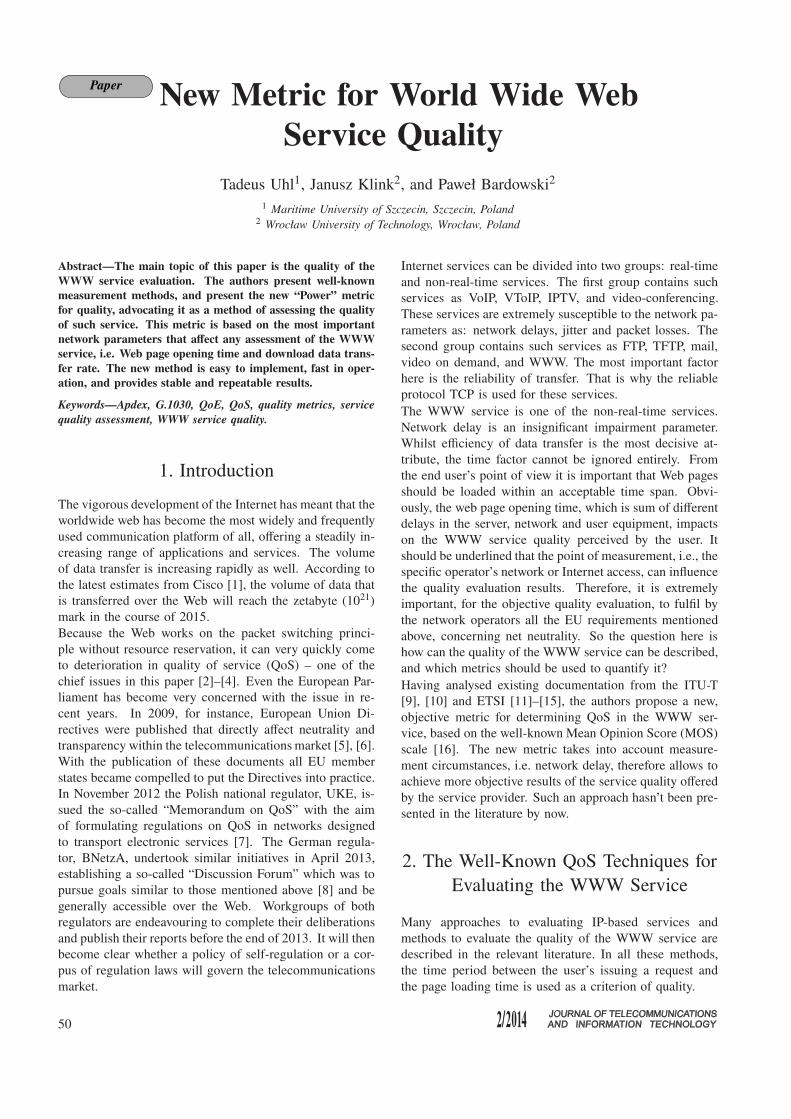
Figure 3 shows the real environment used in the analysis of
QoS in WWW services. This environment consists of two
end systems that are capable of establishing connections
either to the WWW test server or to other WWW servers
in the Internet and then measuring delays that occur in the
course of the communication using the protocol analyser
Wireshark. The used in this analysis environment is capable
of emulating impairment parameters such as network delay,
jitter, and packet losses. So it is quite easy to pick out
each parameter and analyse its effect on QoS and QoE.
The WWW test server is supplied with several, statically
composed pages that contain different types of information.
The time that elapses between the initiation of the call-
up and the actual appearance of the pages on the screen
is measured discretely. These time lapses are then used
to determine objectively the quality of the WWW service.
End users will appraise quality subjectively as QoE.
Internet
WWW server(in the Internet)
Wanulator WWW test server
WWW clientWWW clientwith measuring tool
Fig. 3. The real environment.
The first measurements were designed to shed light on
processes in operation during communication using the
WWW service. To that end the cache of the client’s
Internet browser was erased and then the Web page
www.facebook.com was called up. The packets, logged by
the protocol analyser Wireshark, were then analysed. In the
recorded sessions there were two distinct phases: (1) con-
nection establishment and (2) data transfer. The time span
in phase 1 contains, among other things, the additional de-
lay which the server itself causes. It can be defined as
the difference between the point in time at which the Web
page was called and the point in time at which the first data
packet called from the server actually arrives at the client.
The second time span corresponds to the transfer time for
all data needed for the display of the Web page. It is called
“data delay” and can be defined as the difference between
the point in time at which the first data packet arrives and
the point in time at which the Web page is completely
built up.
It can be seen from Fig. 4 that in phase 1 of communication
to the server 176 frames with a total volume of 17,899 bytes
were transferred. This phase lasted about 2 seconds. So
the transmission rate must have been around 71 kb/s, as
confirmed by the information in Fig. 4.
Figure 5 shows that in phase 2 of the communication
283 frames with a total volume of 369,504 bytes were re-
ceived from the server. This phase lasted about 1.8 s. So the
transmission rate here must have been around 1.69 Mb/s,
which is also confirmed by the information contained in
Fig. 5.
It is already clear that the relationship between the time
spans in phases 1 and 2 will have a decisive influence on
52

New Metric for World Wide Web Service Quality
Fig. 4. Statistics from phase 1 during a WWW session.
Fig. 5. The real environment.
QoS values for the WWW service. It is to be expected
that increases in additional delay and data delay will lead
to a deterioration of QoS and QoE values. For this reason
any new model for measuring QoS in the WWW service
must take these times into consideration at all costs. One
approach will be described in the following chapter.
4. Power – a New Metric for QoS in the
WWW Service
In Section 3 it was shown that delay and throughput are two
of the most significant impairment parameters in a network.
Consequently, any new metric must take them into consid-
eration. With that in mind, the new metric, called Power,
that is defined in terms of Eq. (2), was created.
P =1
1 +α
ddr
·100% , (2)
where: α – delay coefficient defined by
α =
{
0 for td ≤ th
td − th for td > th,
ddr – download data rate [Mb/s], td – total delay [s],
th – threshold of delay [s].
It is obvious that both the download data rate and the total
delay, defined by the time lapse between the point in time at
which the session begins and the point in time at which the
Web page is completely built up, depend on the throughput
of the transmission channel used. But they also depend on
the locality of the WWW server, its level of activity, on the
content of the Web pages being accessed, and whether that
content is static or dynamic. Total delay can therefore vary
within a considerable range. The new metric Power takes
that into account.
In order to use the values defined in Eq. (2) in practice,
it is necessary to measure each of those values properly.
“Threshold” is a subjective value dependent on the judg-
ment of the end user. It represents the time span which he
considers acceptable for the building up of the Web page.
Analyses have shown that this value is a matter of seconds
in practice. The first calculations demonstrate clearly how
the new metric works. Figures 6–9 present the results.
100
80
60
40
20
0
Pow
er [
%]
0 0.5 1.0 1.5 2.0 2.5 3.0 3.5
Total delay [s]
th
= 0.25 s th
= 0.5 s th
= 0.75 s
Fig. 6. Power as a function of total delay and a download data
rate of 1 Mb/s.
Figures 6 and 7 show that – at a constant threshold of
delay – increases in the download data rate lead to a gradual
53

Tadeus Uhl, Janusz Klink, and Paweł Bardowski
100
80
60
40
20
0
Pow
er [
%]
0 0.5 1.0 1.5 2.0 2.5 3.0 3.5
Total delay [s]
th
= 0.25 s th
= 0.5 s th
= 0.75 s
Fig. 7. Power as a function of total delay and a download data
rate of 5 Mb/s.
deterioration in the values delivered by the Power metric,
which is, after all, only understandable. It shows that values
from the Power metric must be interpreted in tandem with
download data rate values. This is because performance
levels depend not only on the volume of traffic that the
Internet provider is having to handle but also on the so-
called last-mile bandwidth availability. This means that
the new metric stands a good chance of being accepted by
Internet providers and end users alike.
100
80
60
40
20
0
Pow
er [
%]
0 0.5 1.0 1.5 2.0 2.5 3.0 3.5
Total delay [s]
DLR = 1 Mb/s DLR = 3 Mb/s DLR = 5 Mb/s
Fig. 8. Power as a function of total delay and various download
data rates for a threshold of 0.25 s.
100
80
60
40
20
0
Pow
er [
%]
0 0.5 1.0 1.5 2.0 2.5 3.0 3.5
Total delay [s]
DLR = 1 Mb/s DLR = 3 Mb/s DLR = 5 Mb/s
Fig. 9. Power as a function of total delay and various download
data rates for a threshold of 0.75 s.
Figures 8 and 9 show that the curves progress quite simi-
larly, the only difference being that the drop in the curves
occurs later as a function of the increasing values of
threshold. This fact confirms that the new metric, though
a function of the subjective entity threshold, can justifiably
be considered to be objective. So the practical spin-offs of
the new metric can be appreciated here, too.
To demonstrate the effect of the new metric in a practical
environment, Eq. (2) was integrated into a suitable mea-
surement tool. The tool was implemented in the clients
from Fig. 3. Pages from www.facebook.com were called
up in this real environment. The chief impairment param-
eters of the network were emulated using Wanulator from
Fig. 3. Examples of measurements series of the WWW
service QoS are presented in Figs. 10–12.
Figures 10 and 11 show that as jitter increases, the total
delay increases as well whilst the download data rate de-
creases. This was perhaps to be expected. The steadily
increasing variations in packet arrival times are the cause.
It is also evident from Fig. 12 that the metric Apdex falls
1600
1400
1200
1000
800
600
400
200
0
0 50 100 150 200 250 300 350
Jitter [ms]
Tota
l del
ay [
ms]
Fig. 10. Total delay as a function of jitter.
0 50 100 150 200 250 300 350
Jitter [ms]
1.8
1.6
1.4
1.2
1.0
0.8
0.6
0.4
0.2
0Dow
nlo
ad d
ata
rate
[M
b/s
]
Fig. 11. Download data rate as a function of jitter.
0 50 100 150 200 250 300 350
Jitter [ms]
1.2
1.0
0.8
0.6
0.4
0.2
0
Pow
er/A
pdex
Power Apdex
Fig. 12. Power values and Apdex values as a function of jitter
for a threshold of 1 s.
54
New Metric for World Wide Web Service Quality
abruptly as soon as the threshold is exceeded. The curve
of the metric Power, on the other hand, is, if anything, ex-
ponential and therefore flatter, and reflects subjective judg-
ments more faithfully (see too Section 5). Now this really
does speak in favor of the new QoS measuring technique
Power.
5. Subjective QoS Measurement
in a Real Environment
After introducing the Power metric, as an objective measure
of WWW service quality, a series of Web page opening
time measurements was performed in order to verify the
usefulness of the metric in real network situations. Mea-
surements were conducted in the LAN shown in the con-
figuration in Fig. 13.
Wanulator WWW test serverWWW clientwith measuring tool
Fig. 13. Test bed for WWW service evaluation in experimental
LAN.
A static Web page was launched on the test server. The
content of this page was prepared according to ETSI ref-
erence page requirements [18]. The page was opened on
a user PC (WWW client with special measurement tool).
Additionally, Wireshark software installed on the client
was used to capture IP packet streams and to register
the times required by the Power metric for its calcula-
tions (Fig. 14).
Page openingrequest
Firstdata received
T1 T2
Finish of pageloading process
Time0
Fig. 14. Times captured during the experiment.
T1 is the time needed by the server to respond to a re-
quest sent by the user who wishes to open the web page.
T2 denotes the time at which page opening is complete.
Both times are random variables which can have quite dif-
ferent values for individual specific reference page opening
attempts due to variations in test server activity and net-
work load. As mentioned above, network delay was varied
throughout the course of the experiment using an emulator
called Wanulator.
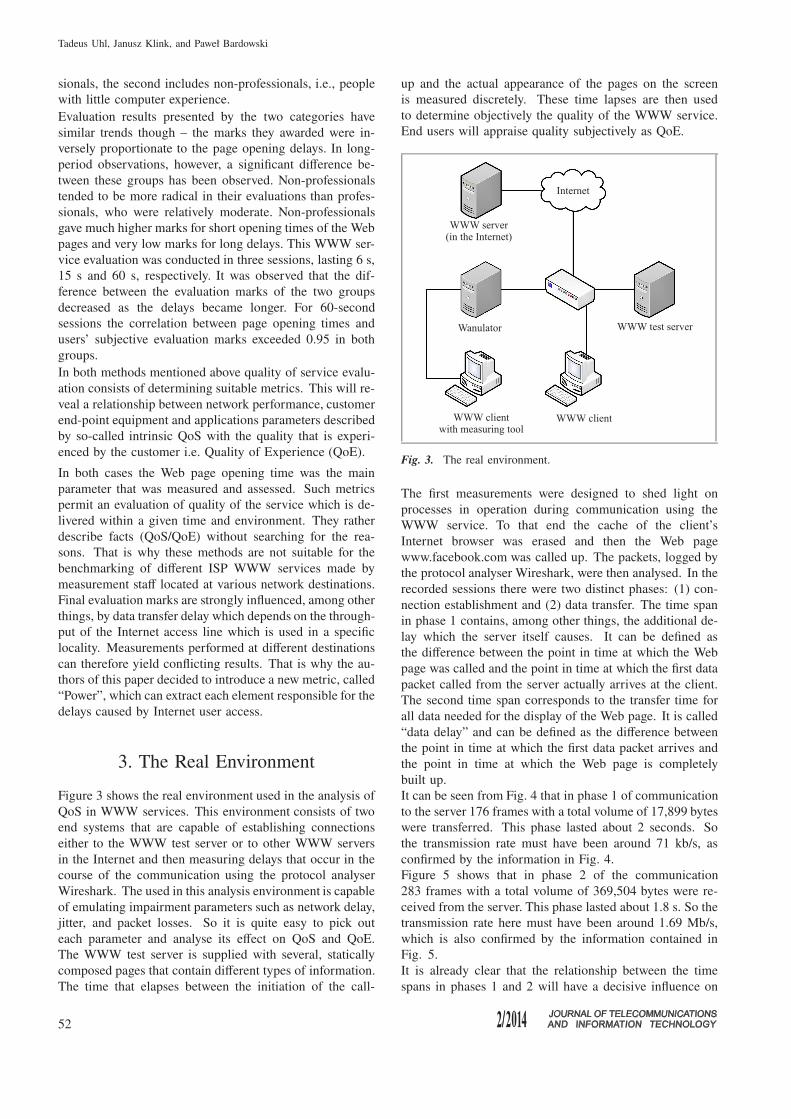
The total Web page opening time, which is registered at
the user side and denoted as T2, plays a crucial role in the
subjective evaluation of WWW service quality (QoE). It
is the value td in the Power metric. Figure 15 shows the
page opening time distribution.
0.8
0.7
0.6
0.5
0.4
0.3
0.2
0.1
00 5 10 15 20 25 30
Page opening time [s]
Pro
bab
ilit
yFig. 15. WWW page opening time distribution.
Users taking part in the experiment gave their subjective
mark (QoE) for the WWW service quality in the range from
1 to 5 on the MOS scale. Registered T2 values were used
to calculate objective marks (QoS) on the scale between 0
and 1. The test group consisted of over 30 persons with
whom more than 1000 test measurements were conducted.
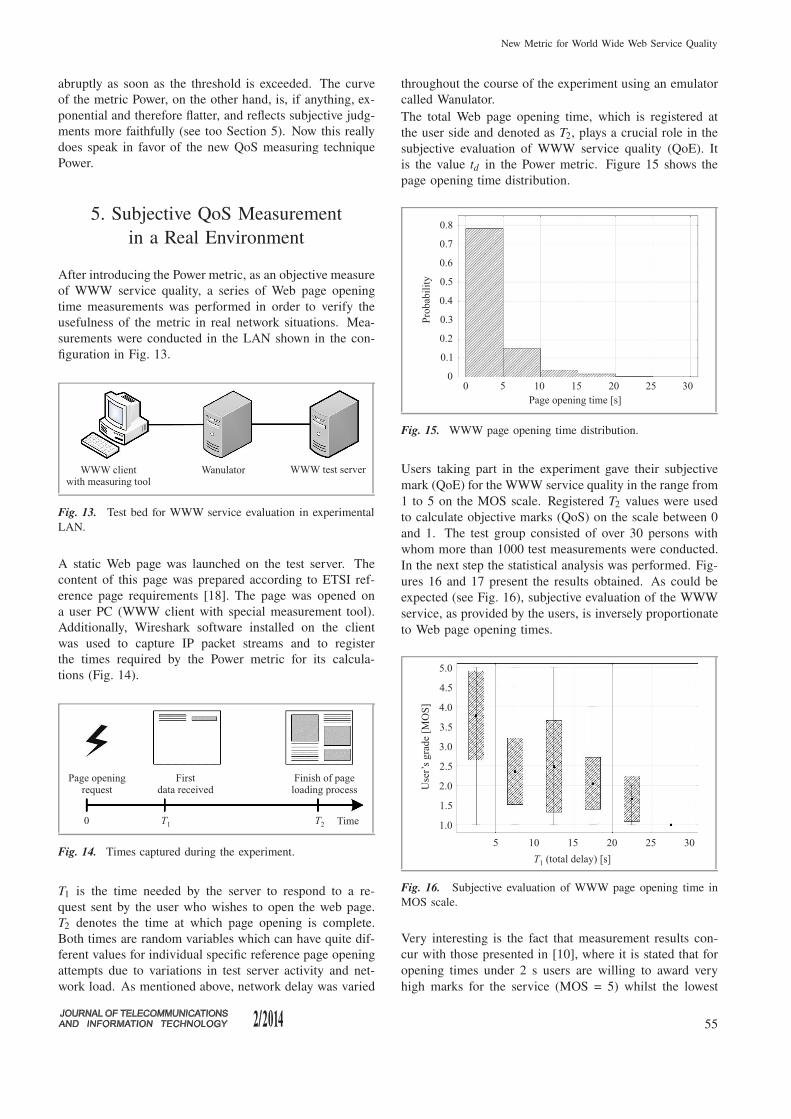
In the next step the statistical analysis was performed. Fig-
ures 16 and 17 present the results obtained. As could be
expected (see Fig. 16), subjective evaluation of the WWW
service, as provided by the users, is inversely proportionate
to Web page opening times.
5.0
4.5
4.0
3.5
3.0
2.5
2.0
1.5
1.0
5 10 15 20 25 30
Use
r’s
gra
de
[MO
S]
T1 (total delay) [s]
Fig. 16. Subjective evaluation of WWW page opening time in
MOS scale.
Very interesting is the fact that measurement results con-
cur with those presented in [10], where it is stated that for
opening times under 2 s users are willing to award very
high marks for the service (MOS = 5) whilst the lowest
55

Tadeus Uhl, Janusz Klink, and Paweł Bardowski
marks (MOS = 1) are given when opening times are 8 s
and more. Obviously, it should be noted that in individual
cases this evaluation mark may differ widely. It is there-
fore recommendable to involve large number of users and
repetitions in such measurements. Careful statistical anal-
ysis of the collected data enhances the evaluation process
accuracy. Figure 16 shows that people taking part in the
evaluation test were quite critical with regard to the ser-
vice under analysis. A rapid decrease in the quality can be
observed for the Web page opening times exceeding 5 s.
Confirmation of such user behavior can be found in the
analysis results presented by ITU-T in Rec. G.1030 [10]
mentioned above for which tests also involved non-pro-
fessional users. The experiments conducted by the authors
of this paper also involved test persons who can be con-
sidered to be members of the group of non-professionals.
Consequently, the results that were obtained are very
similar.
Analysis of the results presented in Fig. 16 leads to the
conclusion that users had a considerable problem with eval-
uation of relatively short web page opening times, i.e., be-
tween 0 and 5 s. The average mark is approximately 3.8,
but a very high degree of deviation can be observed with
marks ranging from 2.6 to very nearly 5. Average evaluation
marks for Web page opening times in the range of 5 to 10 s
and 10 to 15 s are at comparable levels, but the high value
of standard deviation is due to a big uncertainty, especially
for longer opening times, i.e., above 10 s. As is known
from former experiments, discussed in literature, these are
the times at which many users begin to consider whether
waiting for the page to open makes sense, and very many
of them resign. For longer page opening times (15 to 25 s)
user’s marks were significantly lower and, what is inter-
esting, standard deviation of these values was also lower.
From this it can be construed that users became much more
certain of their judgments. Users had the least problem
making their decision when page opening times were very
long, i.e., more than 25 s. Almost all of them gave the low-
est mark (MOS = 1) and standard deviation of the values
was very low.
5 10 15 20 25 30
T1 (total delay) [s]
1.2
1.0
0.8
0.6
0.4
0.2
0
P(
= 1
s)
t h
Fig. 17. Subjective evaluation of WWW page opening time in
the Power metric for a threshold value of 1 s.
It has been proved that most subjective methods of quality
assessment (QoE) are lab-intensive and time-consuming.
Objective methods and metrics are therefore an interesting
alternative. One such proposal is the new Power metric,
discussed in the paper, which was used for QoS assessment
in the test system here. Results of these experiments are
shown in the Fig. 17.
It is noticeable that the relationship between Web page
opening times and quality evaluation marks has an ex-
ponential character. Power value in the range between 0
and 1 (1 denotes MOS = 5) is inversely proportionate
to these (measured) times. It is evident that the curve is
more regular than that of the QoE results presented in
Figs. 16 and 17. In other words: it shows more clearly
the time-quality relationship. It is equally evident that
disparity of the results is far lower, which indicates a more
invariable, more dependable and – for a given environ-
ment and circumstances – repeatable WWW service quality
evaluation.
6. Summary and Outlook
Determining the QoS of the WWW service has been the
main topic of this paper. To begin with, the currently most
commonly used methods of measuring QoS in the WWW
service were presented. Following that, a new metric called
Power that has been designed for this purpose was defined
and explained. The metric is based on the main impair-
ment parameters in a network, i.e. delay and throughput. It
also takes account of the subjective parameter at the user’s
end, i.e. threshold of delay. The experiments that were
conducted in the course of this work and described in this
paper have confirmed that the new metric works in practice.
The new QoS measuring technique is easy to implement.
That is also a practical bonus. It delivers irrefutable and
reproducible results in a real environment; subjective QoS
measuring methods cannot. They are time-consuming and
expensive to boot, and not much good in practice.
In the course of the work described in this paper the new
QoS metric was used in conjunction with simple Web pages
using the Hypertext Transfer Protocol (HTTP). Further
measurements conducted in the real environment shown in
Fig. 3 (using the Internet) have revealed that the latest Web
pages often contain dynamic elements and their content is
often geographically dispersed over several servers. Hyper-
text Transfer Protocol Secure (HTTPS) is being used more
and more widely for this type of communication. The main
impetus behind further work is the inclusion of all these
aspects to prove the reliability of the new Power metric.
Preliminary results have been very encouraging and pro-
vide ample motivation for further analyses and advances in
this direction.
The paper is a modified and extended version of the
paper [19] from the 29th National Telecommunications
and Teleinformatics Symposium, Gdańsk, Poland, Septem-
ber 2013.
56

New Metric for World Wide Web Service Quality
References
[1] “Cisco Visual Networking Index: Forecast and Methodology”,
2010–2015.
[2] ETSI TR 102 276 User Group. Users’ Quality of Service Criteria
for Internet Access in Europe, Sophia Antipolis, France 10/2003.
[3] ETSI TR 102 678 QoS Parameter Measurements based on fixed Data
Transfer Times, Sophia Antipolis, France 11/2009.
[4] J. Klink, M. J. Podolska, and T. Uhl, “Regulatory framework and
technical aspects of broadband access to the Internet in Europe”, in
Proc. 2nd Baltic Conf. Future Internet Commun., Vilnius, Latvia,
2012, pp. 56–63.
[5] Directive 2009/140/EC of the European Parliament and of the
Council amending Directives 2002/21/EC on a common regulatory
framework for electronic communications networks and services,
2002/19/EC on access to, and interconnection of, electronic com-
munications networks and associated facilities, and 2002/20/EC on
the authorisation of electronic communications networks and ser-
vices (hereinafter: Better Regulation Directive). Official Journal EU
L.337/37, 25 November 2009.
[6] Directive 2009/136/EC of the European Parliament and of the Coun-
cil amending Directive 2002/22/EC on universal service and users’
rights relating to electronic communications networks and services,
Directive 2002/58/EC concerning the processing of personal data
and the protection of privacy in the electronic communications sector
and Regulation (EC) No 2006/2004 on cooperation between national
authorities responsible for the enforcement of consumer protection
laws (hereinafter: Citizens’ Rights Directive). Official Journal EU L
337/11, 25 November 2009.
[7] J. Podolska and T. Uhl, “Broadband network access in regulatory
framework in Europe”, in Proc. 7th ITG Conf. Broadband Supply in
Germany, Berlin, Germany, 2013.
[8] T. Uhl, “Broadband network access in regulatory framework in Ger-
many”, in Proc. XXIX Sym. “Telecommunications and Teleinfor-
matics”, Gdańsk, Poland, 2013.
[9] ITU-T Rec. G.1010 Transmission Systems and Media, Digital Sys-
tems and Networks. Quality of service and performance. End-user
multimedia QoS categories, Geneva/Switzerland, 11/2001.
[10] ITU-T Rec. G.1030 Quality of service and performance - Generic
and user-related Aspects. Estimating end-to-end performance in IP
networks for data applications, Geneva/Switzerland, 11/2005.
[11] ETSI TS 102 250-1 V2.2.1 (2011-04) Speech Processing, Transmis-
sion and Quality Aspects (STQ); QoS aspects for popular services in
GSM and 3G networks; Part 1: Identification of Quality of Service
criteria.
[12] ETSI TS 102 250-2 V2.2.1 (2011-04) Speech Processing, Transmis-
sion and Quality Aspects (STQ); QoS aspects for popular services
in GSM and 3G networks; Part 2: Definition of Quality of Service
parameters and their computation.
[13] ETSI TS 102 250-3 V2.2.1 (2011-04) Speech Processing, Transmis-
sion and Quality Aspects (STQ); QoS aspects for popular services
in GSM and 3G networks; Part 3: Typical procedures for Quality of
Service measurement equipment.
[14] ETSI TS 102 250-4 V2.2.1 (2011-04) Speech Processing, Transmis-
sion and Quality Aspects (STQ); QoS aspects for popular services in
GSM and 3G networks; Part 4: Requirements for Quality of Service
measurement equipment.
[15] ETSI TS 102 250-5 V2.2.1 (2011-04) Speech Processing, Transmis-
sion and Quality Aspects (STQ); QoS aspects for popular services
in GSM and 3G networks; Part 5.
[16] Mean Opinion Score (MOS) [Online]. Available:
http://www.itu.int/rec/T-REC-P.800/en
[17] Application Performance Index - Apdex Technical Specification Ver-
sion 1.1 [Online]. Available: http://www.apdex.org/specs.html
[18] ETSI reference page requirements [Online]. Available:
http://docbox.etsi.org/STQ/Open/Kepler/
[19] P. Bardowski, J. Klink, and T. Uhl, “Nowa metryka do oceny jakości
usługi WWW”, Przegląd Telekomunikacyjny, no. 8–9, pp. 644–649,
2013 (in Polish).
Tadeus Uhl received his M.Sc.
in Telecommunications from
the Academy of Technology
and Agriculture in Bydgoszcz,
Poland, in 1975, Ph.D. from
Gdańsk University of Technol-
ogy, Poland, in 1982 and his
D.Sc. from University at Dort-
mund, Germany, in 1992. Since
1992 he has worked as Profes-
sor at the Institute of Communi-
cations Technology, Flensburg University of Applied Sci-
ences, Germany, and in addition since 2013 as Professor
at the Institute of Transport Engineering, Maritime Uni-
versity of Szczecin, Poland. His main activities cover the
following areas: traffic engineering, performance analysis
of communications systems, measurement and evaluation
of communication protocols, QoS and QoE by Triple Play
Services, Ethernet and IP technology. He is an author or
co-author of three books and some 130 papers on the sub-
jects of LAN, WAN and NGN.
E-mail: [email protected]
Maritime University of Szczecin
Henryka Pobożnego st 11
70-507 Szczecin, Poland
Janusz Klink received his
M.Sc. and Ph.D. in Telecommu-
nications from Wrocław Uni-
versity of Technology in 1994
and 2000, respectively. Since
1994 he has worked as an As-
sistant and since 2000 as an
Assistant Professor at the Insti-
tute of Telecommunications and
Acoustics, Wrocław. In 2013 he
started to work for Department
of Telecommunications and Teleinformatics (since 2007 as
Head of Telecommunication Networks Laboratory) at the
Faculty of Electronics of the Wrocław University of Tech-
nology. His main activities concentrate on the following
areas: telecommunication networks, signalling protocols,
traffic engineering, quality of service and quality of ex-
perience. He is an author or co-author of 14 chapters in
books, over 50 papers and about 70 reports on the subject
of telecommunications networks, services and quality of
service.
E-mail: [email protected]
Wrocław University of Technology
Wybrzeże Wyspiańskiego st 27
50-370 Wrocław, Poland
57

Tadeus Uhl, Janusz Klink, and Paweł Bardowski
Paweł Bardowski received
his B.Eng. in Electronics and
Telecommunications and M.Sc.
in Computer Science from
Wrocław University of Tech-
nology, in 2009 and 2011,
respectively. He then began
his doctoral studies in the field
of telecommunications at the
same university. Since 2011
he has been working for the
Department of Telecommunications and Teleinformat-
ics, Wrocław University of Technology, as an Assis-
tant. His current research specialist areas include meth-
ods of real-time data transmission over wireless net-
works with multiple-hop. He is co-author of 3 papers on
the subjects of quality of service in telecommunication
networks.
E-mail: [email protected]
Wrocław University of Technology
Wybrzeże Wyspiańskiego st 27
50-370 Wrocław, Poland
58