Embed Size (px)
Citation preview

NEW MEDIA TRENDSFOR 2020

Ryan MancheeVice PresidentMedia Innovations + Technology
Noor NaseerSenior DirectorMedia Innovations + Technology

THEMES TO WATCH
+ Traditional Media Remix
+ Future of the Agency
+ New Retail Paradigm
+ Seamless Experiences
+ Reclaimed Identity

TRADITIONALMEDIA REMIX
TRADITIONAL MEDIA REMIX:
FORMATS CHANGE

TRADITIONAL MEDIA REMIX:
CONTENT REMAINS

TRADITIONAL AD SPENDING CONTINUES TO DECLINE…AND A SMALLER PART OF THE TOTAL MEDIA MIX
9% GROWTH
in total media spend in 2020
8% DECLINE
in traditional media spend by 2023
40% OF ALL MEDIA
dollars is made up of traditional in 2020
1/3RD OF ALL SPENDING
decline expected for traditional media by 2023

AUDIO TV OOH
THE REMIX TRIO

DIGITAL LISTENINGTO OUTPACETRADITIONAL THIS YEAR
80 RADIO
84 DIGITAL AUDIO
VS

PERCENTAGE OF
DIGITAL AUDIO
LISTENERS
PERCENTAGE
CHANGE (YOY)
Desktop/Laptop 71.9% -0.3%
Mobile 64.7% 4.4%
Smart Speakers 30.8% 19.7%
LISTENING VIA SMART SPEAKERS IS ON THE RISE
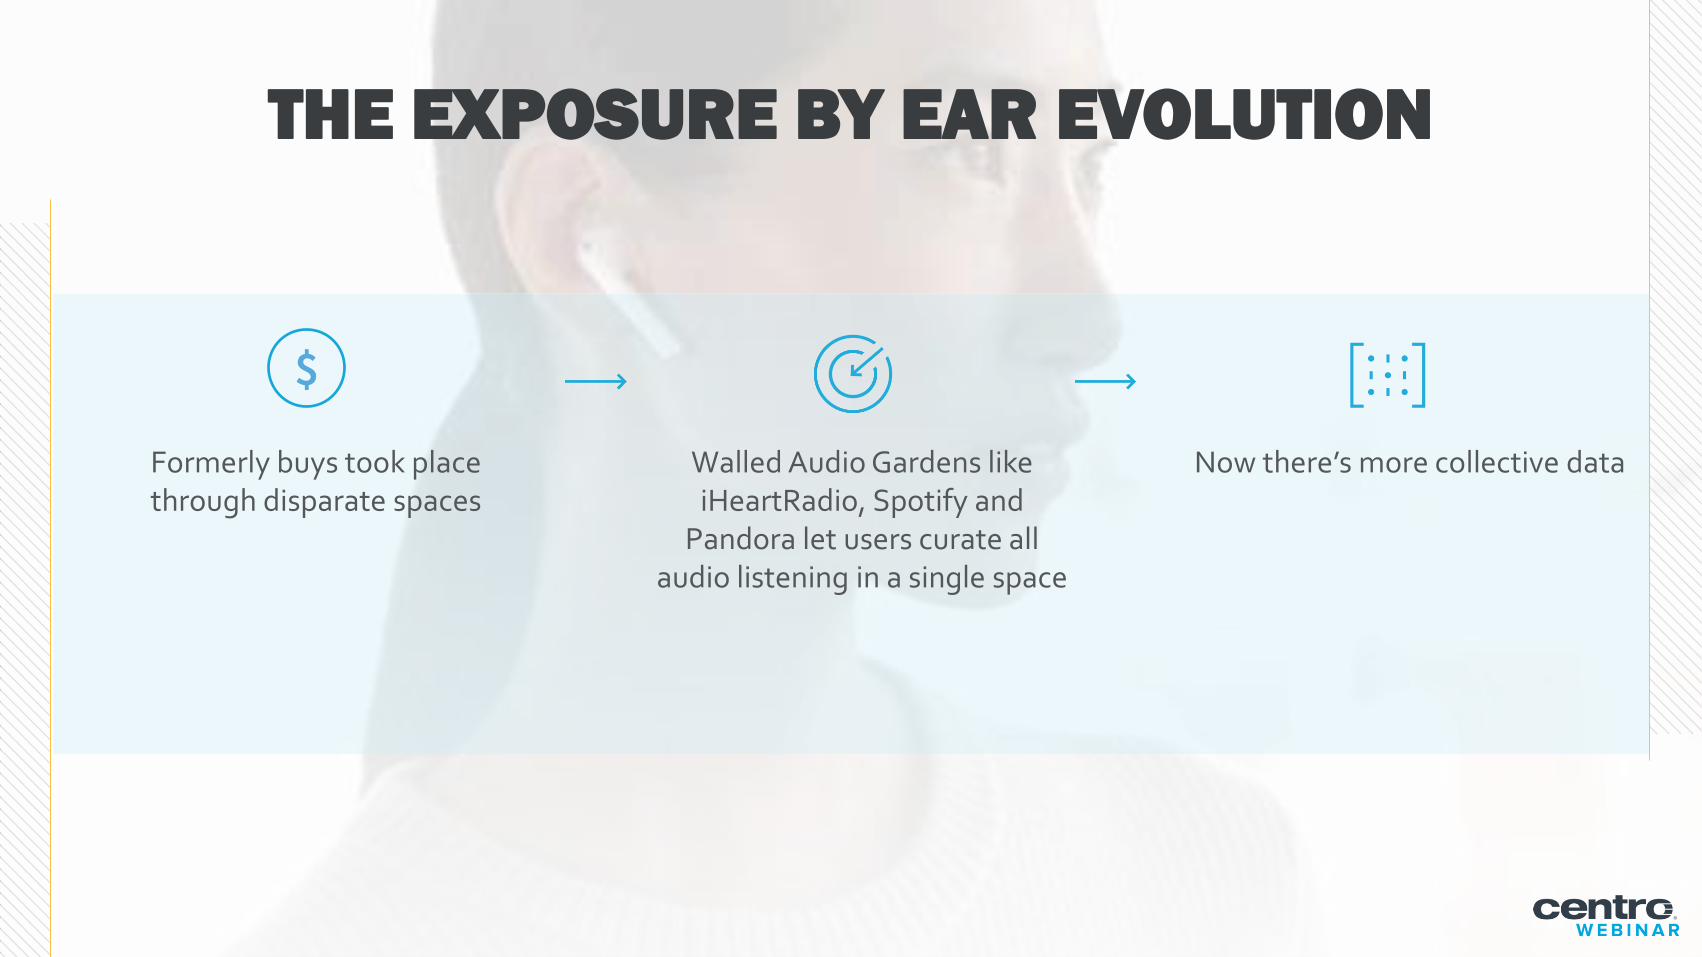
THE EXPOSURE BY EAR EVOLUTION
Formerly buys took place through disparate spaces
Walled Audio Gardens like iHeartRadio, Spotify and
Pandora let users curate all audio listening in a single space
Now there’s more collective data

DOOHTHE ONLY TRADITIONAL MEDIA TYPE TO EXPERIENCE GROWTH IN THE PAST DECADE
1.6%
4.8%
5.1%
4.5%
3.6%
3.3%2022
2021
2020
2019
2018
2017
US OUT-OF-HOME AD
SPENDING GROWTH2017–2022
DOOH expected to grow another 10% by 2021
Source: Kagan as cited in company blog, Oct 2019, eMarketer

5G EXPECTED TO EMPOWERDOOH WITH MORE DYNAMIC ADS
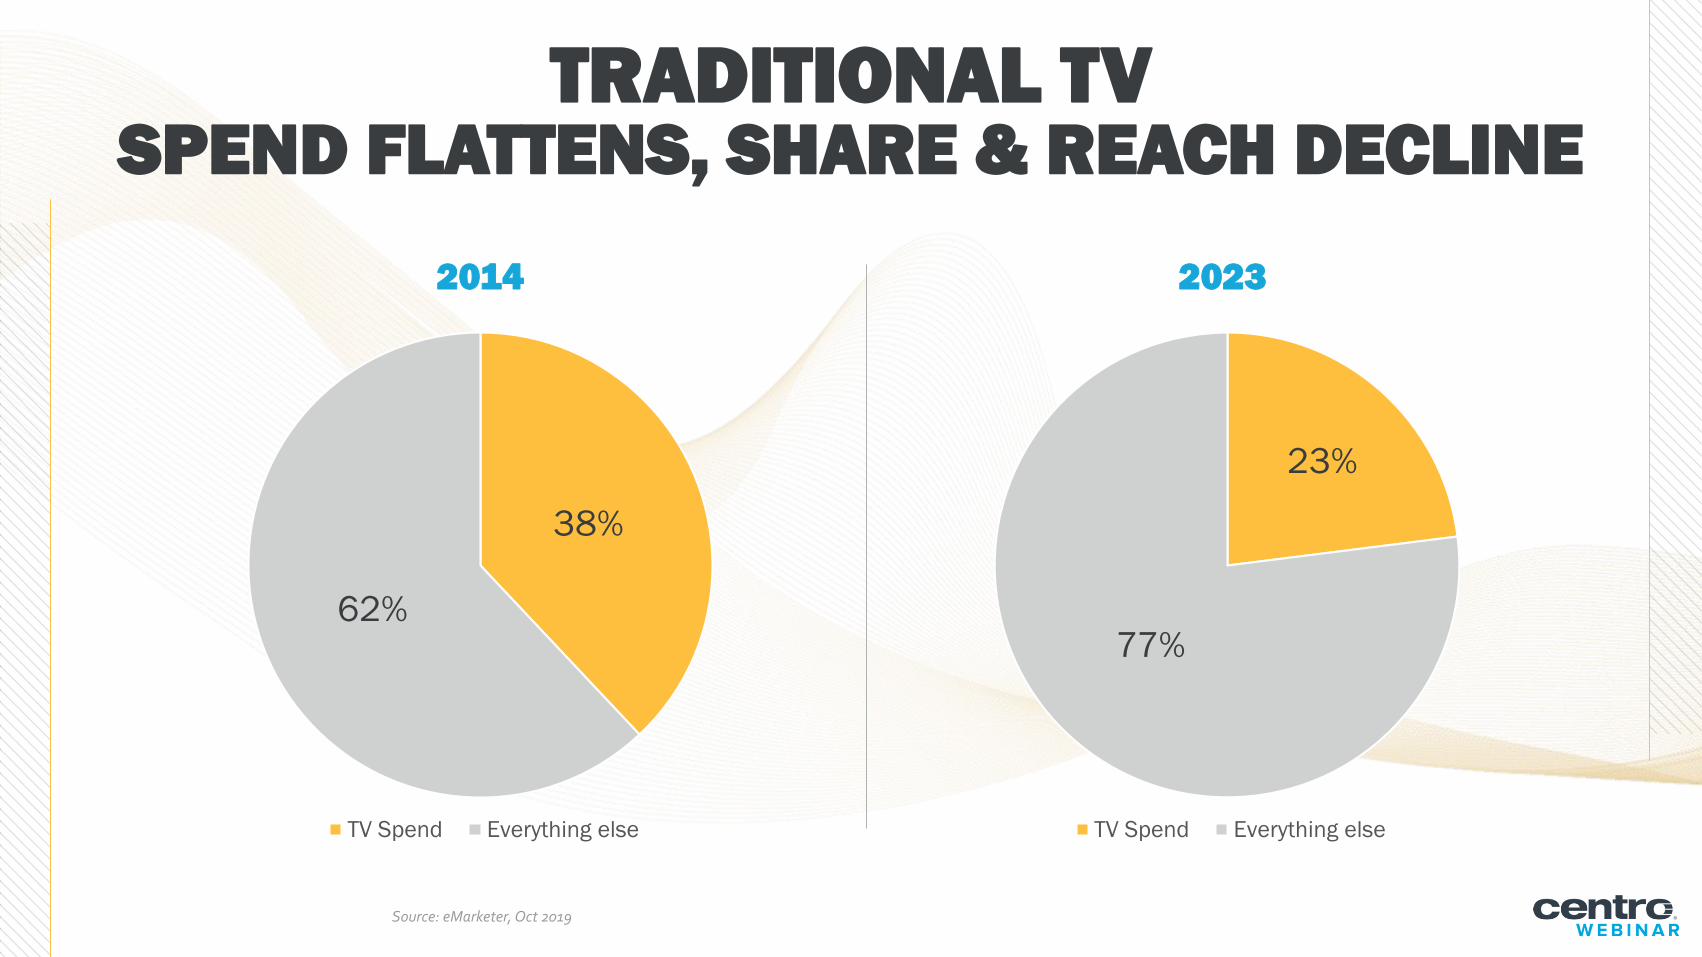
TRADITIONAL TVSPEND FLATTENS, SHARE & REACH DECLINE
38%
62%
TV Spend Everything else
23%
77%
TV Spend Everything else
2014 2023
Source: eMarketer, Oct 2019

• Connected TV delivered 5.5 billion hours of viewer consumption
• Former pay TV dollars now spent on SVOD
• 74% of US households have at least one SVOD service
SVOD GROWTH, STACKING INCREASES
SVOD PENETRATION IN US HOMES
47%52%
59%64%
69%74%
16%20%
28%33%
43%
51%
0%
10%
20%
30%
40%
50%
60%
70%
80%
2014 2015 2016 2017 2018 2019
Any SVOD Service 2 or more services
Source: Leichman Research, nScreenMedia calculations

STREAMING WARS
PAID SUBSCRIPTION AD-SUPPORTED

New media = old media, reborn
Upward potential for sight + sound audiences
Reborn adoption driving scale, quality audiences
TAKEAWAYTRADITIONALMEDIA REMIX

FUTURE OF THE AGENCY

0
3,000
6,000
9,000
12,000
15,000
18,000
0
50,000
100,000
150,000
200,000
19
39
19
48
19
54
19
58
19
63
19
67
19
72
19
77
19
82
19
87
19
92
20
00
20
06
20
10
20
14
20
18
Agencies Employees
GROWTH + CONSOLIDATION
+ MORE COMPLEXITY
Source: US Census Data
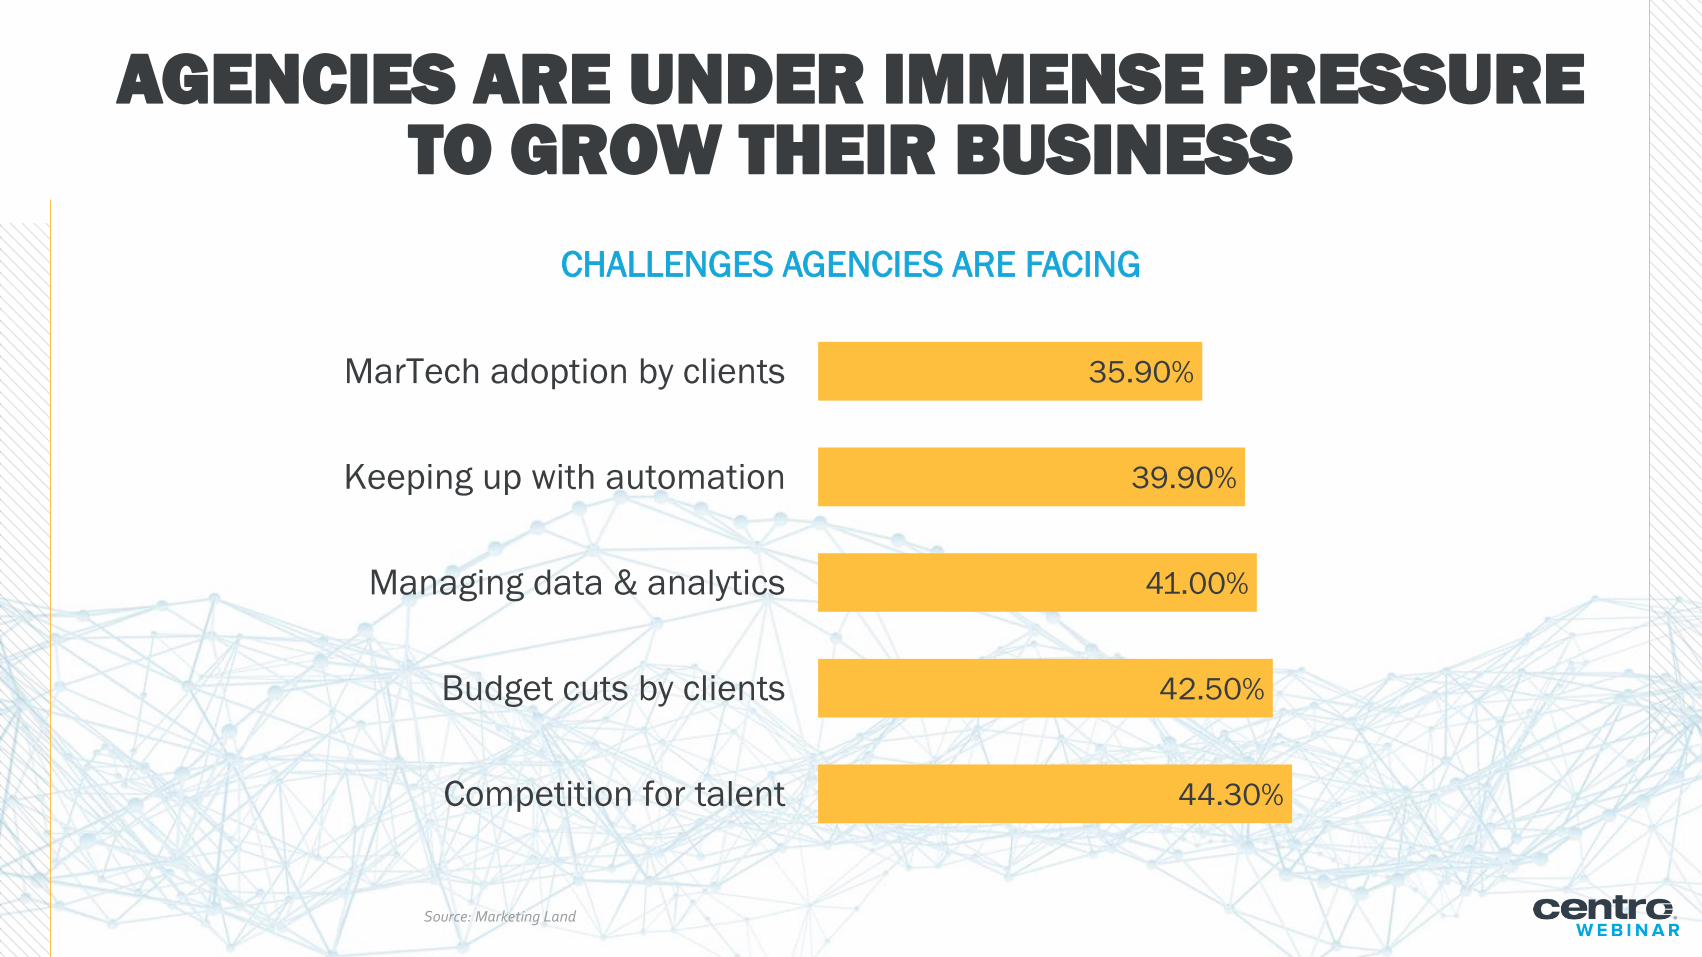
AGENCIES ARE UNDER IMMENSE PRESSURETO GROW THEIR BUSINESS
CHALLENGES AGENCIES ARE FACING
Source: Marketing Land
44.30%
42.50%
41.00%
39.90%
35.90%
Competition for talent
Budget cuts by clients
Managing data & analytics
Keeping up with automation
MarTech adoption by clients

79% of marketers stress the importance of analytic capabilities in selection / retention of agency
93% of agencies recognize the importance of providing high quality marketing data & analytics capabilities
New specialties
More cross-training
Greater practical
innovation
TRANSFORMATION OF THE AGENCY MODEL

AUTOMATIONis the use of technology to eliminate manual tasks, drive efficiency,
and improve efficacy while utilizing data-based rules and decisioning such as algorithms, machine learning or AI.
Automation creates productivity and cost savings.
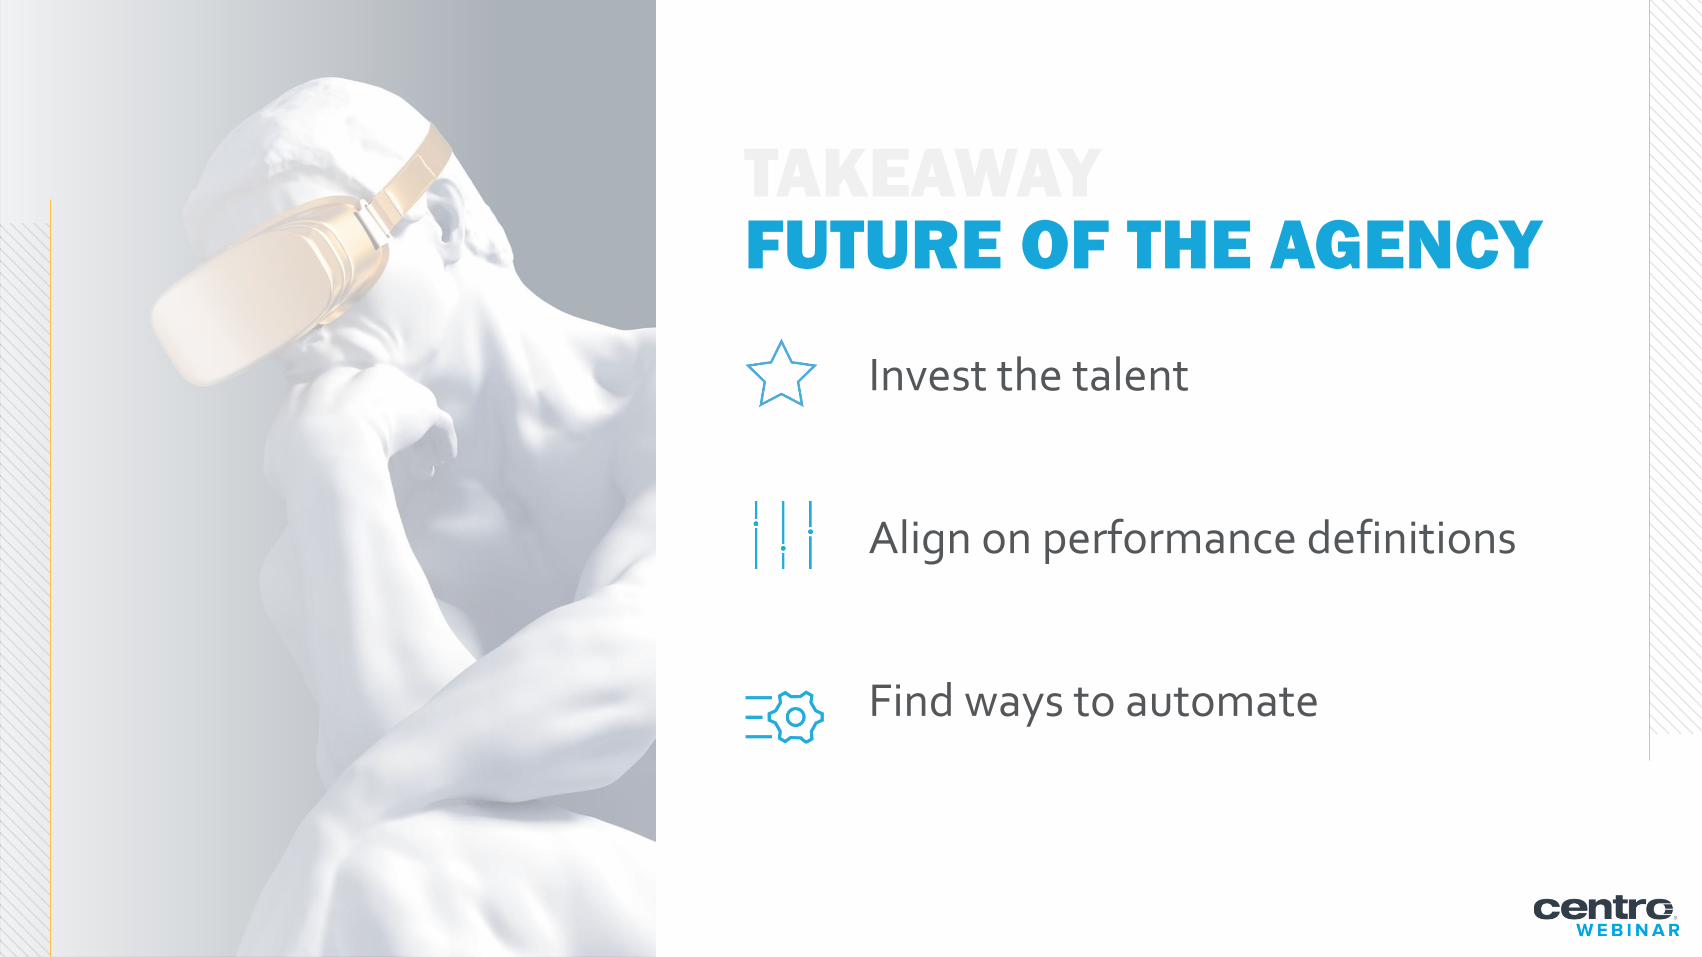
Invest the talent
Align on performance definitions
Find ways to automate
TAKEAWAYFUTURE OF THE AGENCY

RECLAIMEDIDENTITY

IDENTITY 2020Users identifiable via third party cookies will drop below 50% this year

▪ Transparency
▪ Choice
▪ Control
PRIVACY DEMANDS REQUIRE LANDSCAPE REWIRING
USERS DEMAND

IDENTITY 2020: IMPACT OF THE CHANGE
Impact of Change
– Audience Targeting
– Conversion Attribution
Targeting Options
– No identical workaround identity solution
– Contextual, PMP, Location, Machine Learning
Measurement Options
– Reporting options Context, location
– Alternatives in development

SEAMLESSEXPERIENCES

ADDRESSING THE NEW CONSUMER

DYNAMIC STORYTELLING
+ Personalized
+ Scaled
+ Optimized

$24.5
$35.2
$43.9
$52.7
$0
$10
$20
$30
$40
$50
$60
2017 2018 2019 2020
Bill
ion
s
NATIVE / BRANDED EXPERIENCES
NATIVE AD SPENDING
Source: eMarketer, March 2019

INFLUENCERS INFLUENCE
WHERE DO US GEN Z AND MILLENNIAL INTERNET USERS MOST OFTEN LEARNABOUT NEW PRODUCTS THEY ARE INTERESTED IN BUYING?
% Of Respondents, By Gender, Sep 2019
GEN Z (13-22) MILLENNIALS (22-38)
Female Male Female Male
Social media posts from influencers 24% 16% 20% 12%
Ads on social media 23% 24% 19% 12%
Social media posts from friends or family 10% 10% 15% 12%
TV 7% 12% 14% 23%
Newspapers or magazines 13% 12% 15% 17%
Word-of-mouth 3% 2% 5% 4%
Blogs 6% 8% 4% 9%
Source: Morning Consult, “The Influencer Report: Engaging Gen Z and Millennials,” 11/5/19
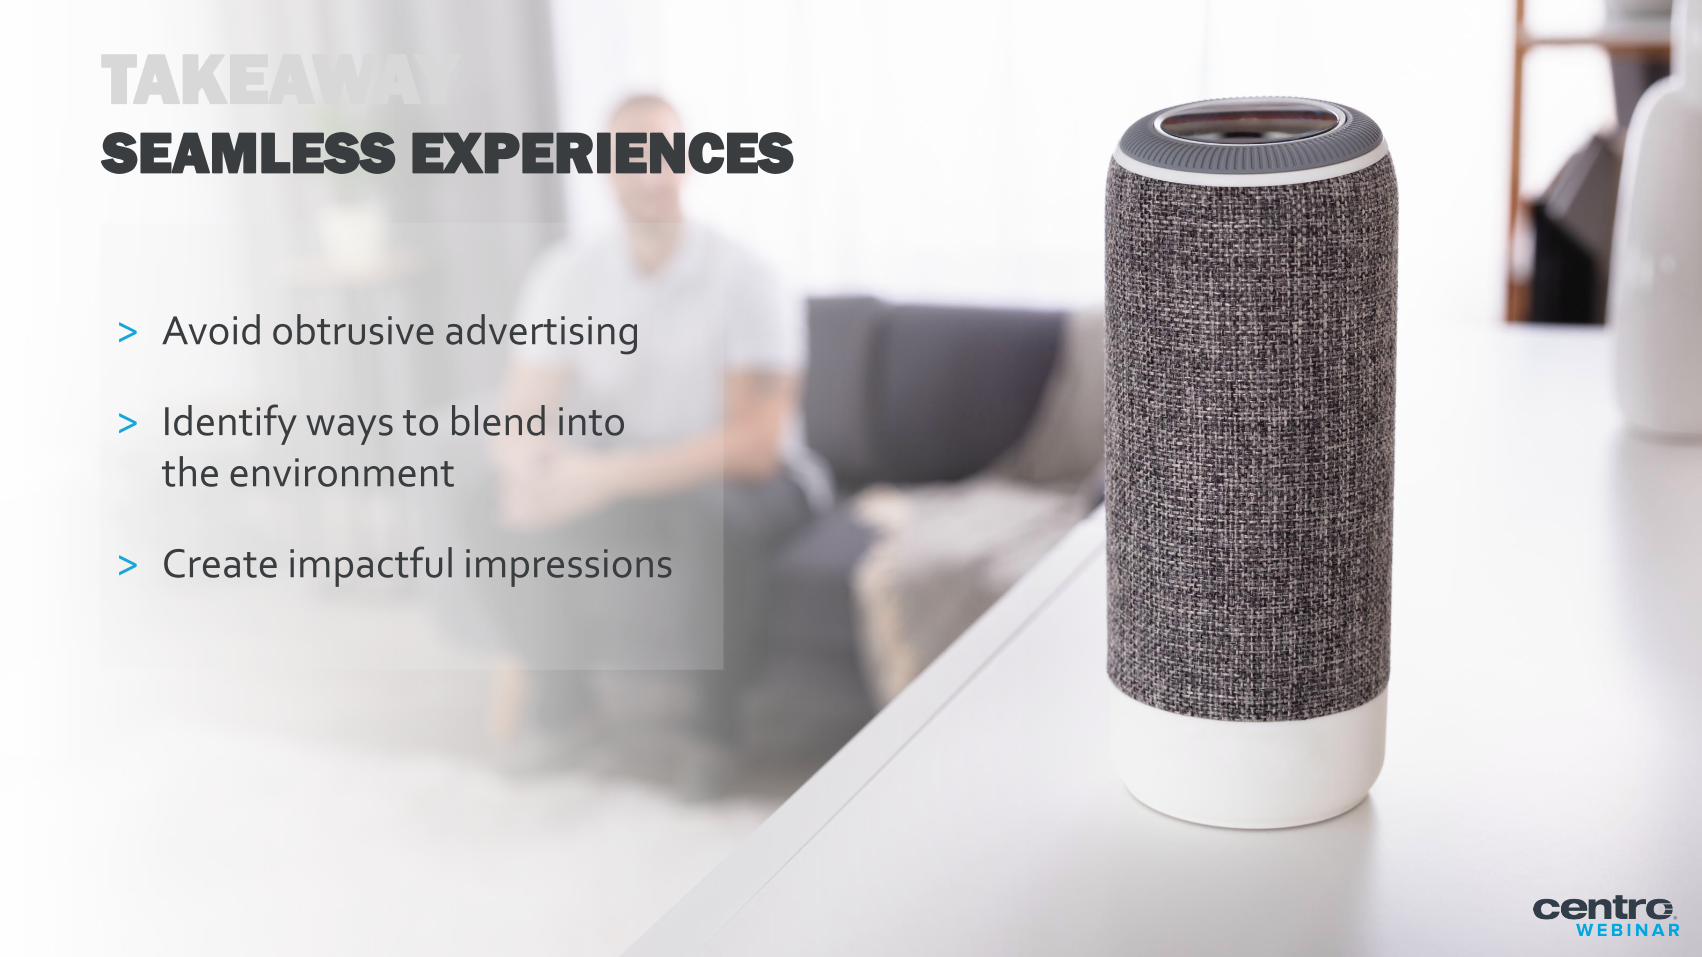
TAKEAWAYSEAMLESS EXPERIENCES
> Avoid obtrusive advertising
> Identify ways to blend into the environment
> Create impactful impressions

IF YOU BUILD IT,THEY WILL COMETHEY MAY NOT SHOW UP

THE RETAIL APOCALYPSE IS RISING
• More than 9,300 stores closed in 2019
• Popular household name brands including Sears, Kmart, Barneys, Gap, Family Dollar, Forever 21 and others, file for bankruptcy and close hundreds of store locations
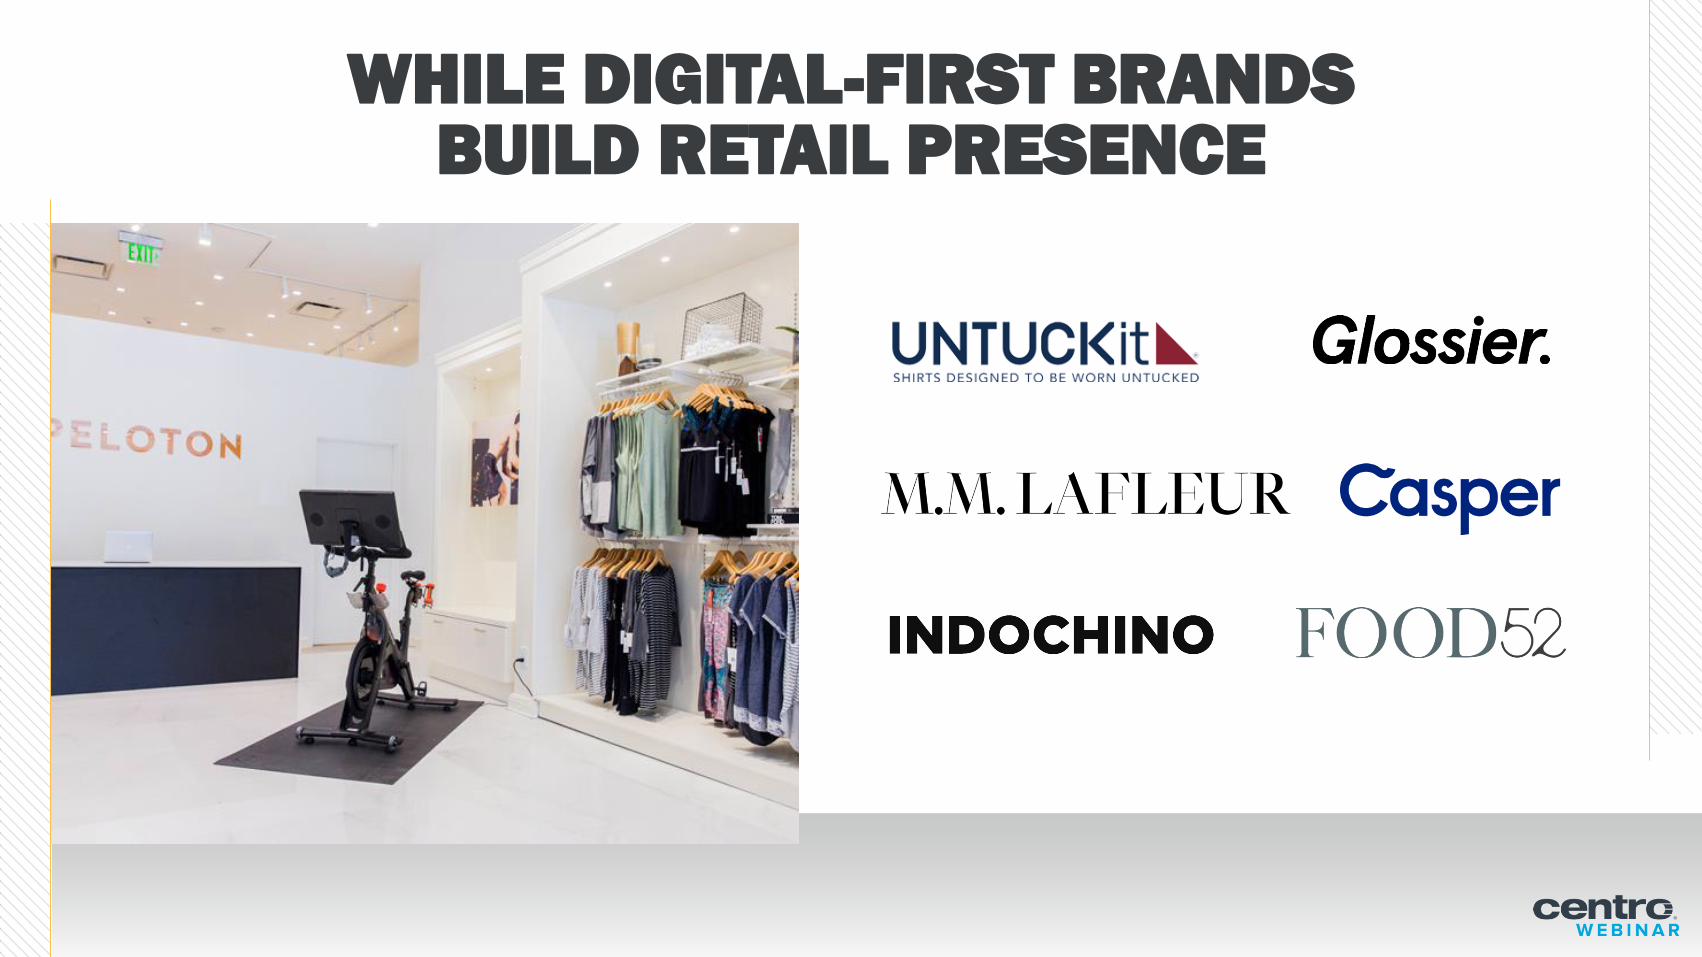
WHILE DIGITAL-FIRST BRANDS BUILD RETAIL PRESENCE

POP-UPS OFFER A HYBRID SOLUTION
Inspire + educate
Social experience for brand
enthusiasts
Cost-effective, low risk,
barrier to entry

RETAIL IMPLICATIONS FOR ADVERTISERS
Consider what split works for your retail
category
THINK ABOUT BOTH
Manage expectationaround retail’s
purpose
VS
Drive consumers both in-store and
online
Digital-engagement and functionality
is a must
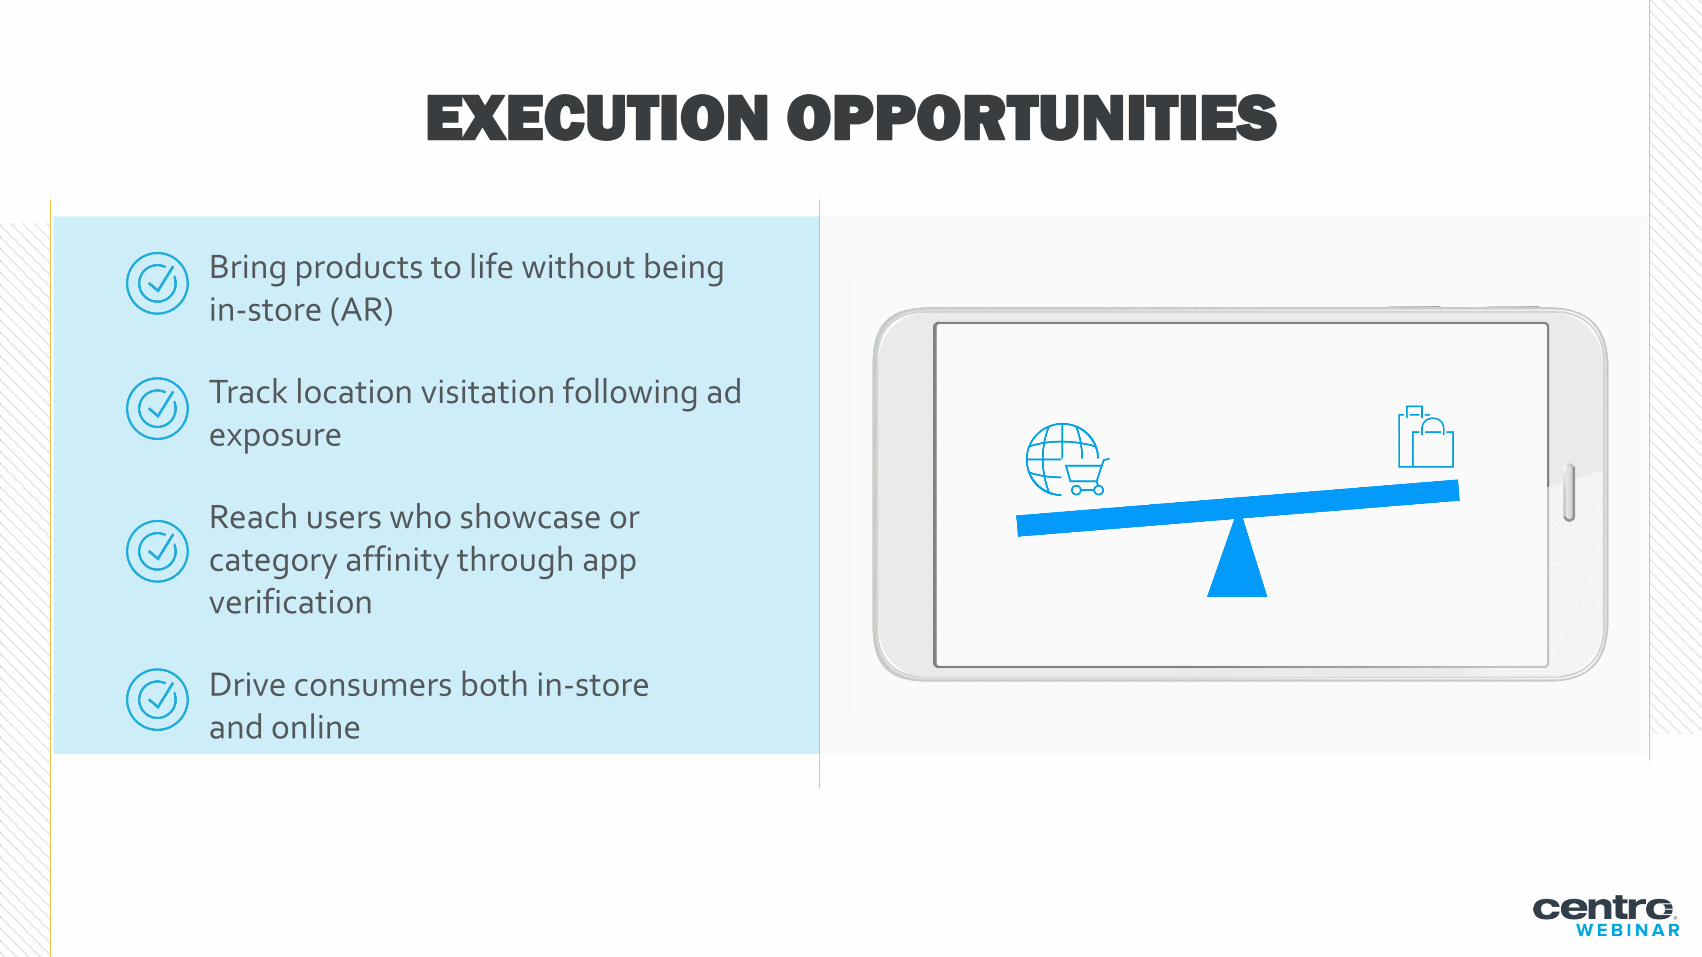
EXECUTION OPPORTUNITIES
Bring products to life without being in-store (AR)
Track location visitation following ad exposure
Reach users who showcase or category affinity through app verification
Drive consumers both in-store and online

+ Privacy initiated, audiences to come
+ Convergence in consumption & buying
+ Balance physical & digital
+ Agencies will automate
+ Ads become more seamless
THEMES TO WATCH

QUESTIONS?THANK YOU!