Embed Size (px)
Citation preview

New Hampshire Volunteer Lake Assessment Program
2014 Lakes Region
Regional Report
Hermit Lake, Sanbornton, NH


R-WD-16-08
New Hampshire Volunteer Lake Assessment Program 2014 Lakes Region Regional Report
State of New Hampshire Department of Environmental Services
Water Division Watershed Management Bureau
P.O. Box 95 29 Hazen Drive
Concord, NH 03302-0095
Thomas S. Burack Commissioner
Eugene Forbes Water Division Director
Ted Diers Watershed Management Bureau Administrator
Prepared By:
Sara Steiner VLAP Coordinator
Kirsten Nelson
Biologist
December 2015


i
REGIONAL HIGHLIGHTS
The Lakes region consists of towns in New Hampshire’s Belknap County, southern parts of Carroll and Grafton Counties, and central parts of Merrimack County.
Regional freshwater recreation, including boating, fishing and swimming, in the Lakes region generate approximately $210 million dollars in sales, $74 million in household income, and 3,313 jobs annually (Nordstrom, 2007).
A perceived decline in water quality as measured by water clarity, aesthetic beauty, or overuse could result in approximately $64.2 million dollars in lost revenue, $22.7 million in lost household income and 1,023 lost jobs. (Nordstrom, 2007).
Regional population is expected to grow by 37,000 people by 2030 in Belknap and Merrimack counties alone. The majority of growth is estimated to occur around Lake Winnipesaukee in the towns of Wolfeboro, Moultonborough, Meredith, Sanbornton, Gilford, Belmont, and Alton.
The Lakes Region is home to over 86,000 acres of lakes, river, and wetlands. Over 50,000 acres or 60 percent of water occurs in the towns predicted to experience the heaviest population growth.
Regional summer air temperatures were 0.5° F above the historical regional average conditions, as reported in Concord, N.H., in 2013 yet were 0.4° F below average in 2014. Regional average surface water temperatures were 1.2° F warmer than the historical regional average, as recorded by VLAP, in 2013 and 0.9° F warmer in 2014. Regional average summer precipitation (rainfall) was 1.35 inches above average in 2013 and only 0.3 inches above average in 2014. However, in 2014, July rainfall totals were 3.75 inches above average only to be offset by the drastically dry September which was 2.96 inches below average.
The Lakes region consists of 196 lakes or great ponds. Regional water quality data is collected at 35 lakes participating in VLAP while the remaining 80 percent of lakes are sparsely monitored through the Lake Trophic Survey Program.
Regional lakes are classified into three categories that describe the overall health of the lake as oligotrophic, mesotrophic, or eutrophic by the Lake Trophic Survey Program. Forty-four lakes are oligotrophic, 69 are mesotrophic, 39 are eutrophic, and 44 lakes are un-assessed for trophic class. Thirteen oligotrophic, 15 mesotrophic, and seven eutrophic lakes participate in VLAP.
VLAP lakes are monitored at the deepest point in the lake and at streams entering or exiting the lake. Lakes are monitored monthly during the summer season to establish baseline water quality data and discern long term water quality trends that provide information on overall waterbody health.
Regional trend analysis performed on historical water quality data found no significant trend for parameters acid neutralizing capacity (ANC), chloride, pH, or transparency. Chlorophyll-a and total phosphorus significantly decreased over time, which indicates improving conditions. Turbidity and conductivity significantly increased over time, which indicates declining conditions.

ii
LAKES REGION WATER QUALITY INDICATORS
The following describes the water quality indicator measured through VLAP, the regional trend that was detected and the current status of the indicator. Trends were determined with a non-parametric Mann-Kendall trend test of the annual medians for each parameter.
Exotic Species
Chlorophyll-a
Transparency
Phosphorus
Dissolved Oxygen
pH
Conductivity
Chloride
Turbidity
Indicator Trend description
N/A
Thirty-one waterbodies in the Lakes Region are infested with an exotic aquatic species, which represents the largest number of infestations of any state region. All waterbodies have Variable milfoil infestations.
↓ Significantly decreasing (improving) regional chlorophyll-a trend from 1985 - 2014. The regional median chlorophyll-a value is 3.57 mg/m3 and representative of mesotrophic conditions or average chlorophyll-a levels. Lake specific trend analysis indicates three lakes with significantly decreasing (improving) chlorophyll-a trends and 25 lakes with stable chlorophyll-a trends.
↔ No significant regional trend from 1985 - 2014. The regional median transparency is 4.49 meters and representative of oligotrophic or very good conditions. Lake specific trend analysis indicates four lakes with decreasing (worsening) transparency and 23 lakes with stable transparency trends.
↓ Significantly decreasing (improving) regional trend from 1985 – 2014 and is the only state region with improving epilimnetic phosphorus trend. The regional median epilimnetic phosphorus value is 8 ug/L and representative of oligotrophic or low phosphorus conditions. Lake specific trend analysis indicates six lakes with significantly decreasing (improving) epilimnetic phosphorus levels, 21 lakes with stable epilimnetic phosphorus, and only one lake with significantly increasing (worsening) epilimnetic phosphorus levels.
N/A
Dissolved oxygen levels fluctuate temporally and spatially within a lake system. Ideal levels are between 6.0 and 8.0 mg/L. The average whole water column dissolved oxygen level in 2012 was 5.32 mg/L, which is lower than desirable and considered to be in the critical range for aquatic life.
↔ No significant regional trend from 1985 - 2014. The regional median pH value is 6.82 and within a desirable range for aquatic life. Lake specific trend analysis indicates six lakes with significantly decreasing (worsening) epilimnetic pH, two lakes with significantly increasing (improving) epilimnetic pH, and 19 lakes with stable epilimnetic pH levels.
↑ Significantly increasing (worsening) regional epilimnetic conductivity trend from 1985 - 2014. The regional median epilimnetic conductivity value is 51.6 uMhos/cm which is within a desirable range, however, individual lake conductivity fluctuates widely from approximately 15.0 to 198.0 uMhos/cm due to differences in watershed development. Lake specific trend analysis indicates three lakes with significantly decreasing (improving) epilimnetic conductivity, ten lakes with significantly increasing (worsening) epilimnetic conductivity, and 14 lakes with stable epilimnetic conductivity trends.
↔ No significant regional epilimnetic chloride trend from 2002 - 2014. The regional median epilimnetic chloride value is 12 mg/L and much less than acute and chronic chloride standards. Regional epilimnetic chloride levels range from approximately 3 to 46 mg/L. Chloride trend analysis is not conducted on individual lakes.
↑ Significant increasing (worsening) regional epilimnetic turbidity trend from 1996 - 2014. The regional median epilimnetic turbidity value is 0.65 NTU and is indicative of good water quality however median values have increased particularly since 2002. Turbidity trend analysis is not conducted on individual lakes. Average epilimnetic turbidity values for individual lakes range from 0.47 NTU to 16.6 NTU.
iii
Table of Contents
INTRODUCTION AND HISTORY .............................................................................................................................. 1
PROGRAM OVERVIEW ........................................................................................................................................ 1
MONITORING AND PARAMETER SUMMARY ............................................................................................................ 2
LAKES REGION REGIONAL SUMMARY .................................................................................................................... 4
LAND USE AND POPULATION GROWTH ............................................................................................................. 7
EXOTIC SPECIES ............................................................................................................................................. 9
GEOMORPHOLOGY AND CLIMATE .................................................................................................................. 11
MONITORING AND ASSESSMENT .................................................................................................................... 13
VLAP WATER QUALITY DATA INTERPRETATION ............................................................................................... 15
Annual and Historical Chlorophyll-a Data Analysis ............................................................................ 16
Chlorophyll-a Trend Analysis .............................................................................................................. 18
Annual and Historical Transparency Data Analysis ............................................................................ 19
Transparency Trend Analyses ............................................................................................................. 21
Annual and Historical Total Phosphorus Data Analysis ...................................................................... 22
Epilimnetic Phosphorus Trend Analyses ............................................................................................ 24
Dissolved Oxygen Data Analysis ......................................................................................................... 25
Annual and Historical Deep Spot pH Data Analysis ............................................................................ 26
pH Trend Analysis .............................................................................................................................. 27
Annual and Historical Acid Neutralizing Capacity (ANC) Data Analysis ............................................ 29
Acid Neutralizing Capacity Trend Analysis ......................................................................................... 30
Annual and Historical Deep Spot Conductivity Data Analysis ............................................................ 31
Historical Conductivity Trend Analysis ............................................................................................... 32
Annual and Historical Deep Spot Chloride Analysis ........................................................................... 34
Historical Chloride Trend Analysis ...................................................................................................... 35
Annual and Historical Deep Spot Turbidity Data Analysis .................................................................. 36
Historical Turbidity Trend Analysis .................................................................................................... 36
REFERENCES ................................................................................................................................................... 38
List of Tables
Table 1. Current Year and Historical Average Temperature and Precipitation Data for Lakes Region .... 12
Table 2. Significant Chlorophyll-a Trends in Lakes Region Lakes ............................................................... 18

iv
Table 3. Significant Transparency Trends in Lakes Region Lakes ............................................................... 21
Table 4. Significant Epilimnetic Total Phosphorus Trends in Lakes Region Lakes ..................................... 24
Table 5. Significant Epilimnetic pH Trends in Lakes Region Lakes ............................................................. 28
Table 6. Significant Epilimnetic Conductivity Trends in Lakes Region Lakes ............................................. 33
List of Figures
Figure 1. VLAP Regions ............................................................................................................................... 4
Figure 2. Lakes Region Lakes ...................................................................................................................... 5
Figure 3. New Hampshire Population Growth per Town 2010-2030 ........................................................ 8
Figure 4. New Hampshire Exotic Aquatic Plant Infestations...................................................................... 10
Figure 5. VLAP Lake Trophic Class .............................................................................................................. 14
Figure 6. Average Chlorophyll-a Concentration for Lakes Region ............................................................. 16
Figure 7. Lakes Region Median Annual Chlorophyll-a Concentration ....................................................... 17
Figure 8. Average Transparency for Lakes Region ..................................................................................... 29
Figure 9. Lakes Region Median Annual Transparency ............................................................................... 20
Figure 10. Average Epilimnetic Phosphorus Concentration for Lakes Region ........................................... 22
Figure 11. Lakes Region Median Annual Epilimnetic Phosphorus Concentration ..................................... 23
Figure 12. Average Epilimnetic pH for Lakes Region ................................................................................. 26
Figure 13. Lakes Region Median Annual Epilimnetic pH............................................................................ 27
Figure 14. Average ANC for Lakes Region .................................................................................................. 29
Figure 15. Lakes Region Median Annual ANC ............................................................................................ 30
Figure 16. Average Epilimnetic Conductivity for Lakes Region .................................................................. 31
Figure 17. Lakes Region Median Annual Epilimnetic Conductivity ............................................................ 32
Figure 18. Average Chloride for Lakes Region ........................................................................................... 34
Figure 19. Lakes Region Median Annual Epilimnetic Chloride .................................................................. 35
Figure 20. Average Turbidity for Lakes Region .......................................................................................... 36
Figure 21. Lakes Region Median Annual Epilimnetic Turbidity.................................................................. 37
Appendices
Appendix A: Monitoring Parameters and Data Interpretation
Appendix B: Pollution Control Resources
Appendix C: Regional VLAP Lake Groupings
Appendix D:Regional Water Quality Trends
Appendix E: Individual Lake Reports

1
INTRODUCTION AND HISTORY New Hampshire is home to approximately 1,200 lakes and ponds, and thousands of river miles. Protecting our lakes and rivers is critical to sustaining New Hampshire’s drinking water resources, aquatic and natural environments, recreational and tourism industries. The New Hampshire Department of Environmental Services (NHDES) recognizes the importance of these waterbodies in maintaining a healthy ecosystem for our current and future generations. Protecting high-quality waters and restoring those that are impaired requires coordination and partnership between federal, state and local governments, non-profits, regional commissions, lake associations and watershed residents.
To help citizens assess the health of New Hampshire’s lakes and ponds, NHDES established the Volunteer Lake Assessment Program (VLAP) in 1985. The program is a volunteer-driven cooperative effort between the State and local governments, lake associations and lake residents. VLAP trains citizen volunteer monitors to collect water quality data at lakes and their associated tributaries on a monthly basis during the summer. VLAP compiles, interprets and reports the data back to state, federal and local governments, lake associations and lake residents. VLAP volunteer monitors are invaluable stewards for New Hampshire’s lakes. Volunteer monitoring allows NHDES to establish a strong set of baseline chemical and biological data, determine long-term water quality trends and identify emerging water quality issues. NHDES acts on these findings through its funding and regulatory programs. Volunteers use this information to educate lake and watershed residents, businesses and local governments on best management practices to keep New Hampshire’s lakes and ponds clean. They have been, and will continue to be, a key element in protecting the integrity of New Hampshire’s lakes.
PROGRAM OVERVIEW VLAP is a cooperative program between NHDES and lake residents and associations. Approximately 500 volunteers monitor water quality at 170 lakes throughout New Hampshire through VLAP. Interest in the program has grown drastically in the past ten years as citizens have become more aware of the connections between land use activities and water quality. Volunteer monitors continually collect high-quality data on their local waterbodies and educate watershed residents. Volunteer monitors are trained by NHDES to collect lake water quality data, survey the surrounding watershed, and sample the streams and rivers that are tributaries to the lake. Each of the participating lakes must be visited by a NHDES biologist on a biennial basis. This visit is a valuable event in which the volunteer monitors have an opportunity to discuss water quality and watershed concerns and receive recommendations on potential remediation activities. Also, the event allows NHDES biologists to perform a field sampling techniques audit to evaluate volunteer monitor’s ability to collect quality data, and to collect information on additional water quality parameters as necessary. Volunteers then sample on their own for the remaining summer months. To further encourage volunteer monitoring, NHDES, established partnerships with the Lake Sunapee Protective Association (LSPA), Colby Sawyer College (CSC) in New London, NH, and Plymouth State

2
University (PSU) in Plymouth, NH to operate VLAP satellite laboratories. These satellite laboratories serve as a convenient location for volunteers to borrow sampling equipment and deliver water samples for analysis. These strategic locations serve the Dartmouth Lake Sunapee, North Country and White Mountain regions. The data gathered by the volunteers are reviewed by NHDES quality assurance officers and satellite laboratory managers and imported into NHDES’ Environmental Monitoring Database (EMD). During the winter, NHDES biologists review and interpret the water quality data, perform trend analyses, and compile the results into annual reports. The high quality data gathered through VLAP also helps NHDES to conduct statewide surface water quality assessments. Assessment results are submitted to the Environmental Protection Agency (EPA) by NHDES every two years as a requirement of the Clean Water Act. Once the volunteer monitors receive the data and the annual report for their lake, NHDES encourages the volunteers to relay that information to their respective associations, organizations, businesses and local governments. Volunteers are also kept informed of the latest in lake management and water quality issues through an annual newsletter, technical and educational materials, regional workshops and information on important legislation. In addition, NHDES biologists give presentations at lake association meetings and participate in youth education events. Educational initiatives, such as those mentioned above, allow volunteers to recognize potential water quality or shoreland violations around the lake and report their findings to NHDES.
MONITORING AND PARAMETER SUMMARY VLAP encourages the collection of comprehensive data sets on key water quality parameters to determine overall health of the system. Lakes and tributaries are sampled several times each year over a period of years. This establishes baseline water quality data and allows for the discernment of long-term water quality trends. These trends depict lake health and provide invaluable information to NHDES’ mission to protect New Hampshire’s lakes. The sampling efforts of the volunteer monitors supplement the environmental monitoring efforts of NHDES. Only through the assistance of volunteer monitors can such a high volume of sampling be accomplished throughout the state.
NHDES recognizes the importance of collecting data sets that are representative of varying conditions. VLAP has an EPA-approved Quality Assurance Project Plan (QAPP). The QAPP identifies specific responsibilities of NHDES and volunteers, sampling rationale, training procedures, data management and quality control. NHDES and volunteers adhere to the QAPP regime to ensure high quality and representative data sets are collected.
Volunteers collect samples once per month in June, July and August, with some lakes monitored more or less frequently. Samples are collected at approximately the same location each month at each of the deep spot thermal layer, major tributaries (those flowing year round) and seasonal tributaries during spring run-off. The samples are analyzed for a variety of chemical and biological parameters including: pH, ANC, conductivity, chloride, turbidity, total phosphorus and E. coli (optional). Additional in-lake data are also collected at the deep spot including lake transparency (with and without a viewscope), chlorophyll-a, phytoplankton, and dissolved oxygen and temperature profiles. Volunteer monitors are also trained to identify and collect samples of suspicious aquatic plants and cyanobacteria.

3
Environmental outcomes are measured by making comparisons to established New Hampshire averages, medians, ranges of lake water quality and state water quality standards. If analytical results for a particular sampling station frequently exceed state water quality standards, then additional sampling to identify potential pollution sources is necessary. Volunteers often conduct storm event sampling, tributary bracket sampling and spring run-off sampling to better assess watershed health and provide additional data to guide lake management decisions. Appendix A includes a summary of each monitoring parameter and Appendix B includes recommended best management practices to remediate pollution sources.

4
LAKES REGION REGIONAL SUMMARY The Lakes region consists of towns in New Hampshire’s Belknap County, southern parts of Carroll and Grafton Counties, and central parts of Merrimack County (Figure 1). The region is home to a large number of lakes and rivers, most notably Lake Winnipesaukee and Newfound Lake. The Pemigewasset and Winnipesaukee Rivers converge as the headwaters of the Merrimack River. Freshwater resources in the Lakes region provide valuable drinking water and recreational opportunities and play an important role in the regional economy. Freshwater recreation, including boating, fishing and swimming, in the Lakes region generate approximately $210 million dollars in sales, $74 million in household income, and 3,313 jobs annually (Nordstrom, 2007). A perceived decline in water quality as measured by water clarity, aesthetic beauty or overuse could result in approximately $64.2 million dollars in lost revenue, $22.7 million in lost household income and 1,023 lost jobs. The Lakes Region generates the largest revenue from summer recreational activities and would stand to lose the most if water quality were perceived to decline (Nordstrom, 2007). Similarly, a decline in water clarity alone can result in a decrease in New Hampshire lakefront property values. A one meter decrease in water clarity can lead to an average decrease in property values of between 0.9% and 6.0% in New Hampshire (Gibbs, Halstead, Boyle& Huang, 2002). This may negatively impact property tax revenues, especially in a state where there are approximately 64,000 vacation homes concentrated
Figure 1. VLAP Regions

5
around the Lakes region (lakes), Seacoast (ocean) and North Country (skiing) (Loder, 2011). According to a 1999 publication of the Society for the Protection of New Hampshire Forests, “The Economic Impact of Open Space in New Hampshire,” vacation homes contribute approximately $286 million to state and local tax revenues (note: open space includes lakes). For a town with a large number of lakefront homes (vacation or residential), a decline in water clarity can cause decreased property values and local tax revenue. The Lakes region encompasses all or portions of the Level 8 Hydrologic Unit Code (HUC) Watersheds of the Pemigewasset, Winnipesaukee, Merrimack and Contoocook Rivers. The HUC boundary defines a specific drainage basin of a major river or series of smaller rivers. There are 18 HUC 8 watersheds in New Hampshire. There are seven VLAP regions (Figure 1). The Lakes Region consists of 35 VLAP lakes as follows. Individual reports for each lake can be found in Appendix E. Lake Name Town
Hills Pond Alton
Sunset Lake Alton
Bradley Lake Andover
Cole Pond Andover
Highland Lake Andover
Halfmoon Lake Barnstead
Locke Lake Barnstead
Suncook Pond, Lower Barnstead
Suncook Pond, Upper Barnstead
Winnisquam, Mohawk Isl. Belmont
Walker Pond Boscawen
Turee Pond Bow
Kimball Pond Canterbury
New Pond Canterbury
Chestnut Pond Epsom
Webster Lake Franklin
Crystal Lake Gilmanton
Loon Pond Gilmanton
French Pond Henniker
Clement Pond Hopkinton
Lake Name Town
Winnisquam, Pot Isl. Laconia
Winnisquam, Three Isl. Laconia
Clough Pond Loudon
Pemigewasset Lake Meredith
Waukewan Lake, Mayo Meredith
Waukewan Lake, Winona Meredith
Wicwas Lake Meredith
Lees Pond Moultonborough
Winona Lake New Hampton
Knowles Pond Northfield
Wild Goose Pond Pittsfield
Tucker Pond Salisbury
Hermit Lake Sanbornton
Hunkins Pond Sanbornton
Lower Beech Pond Tuftonboro
Mirror lake Tuftonboro
Tom Pond Warner
Pillsbury Lake Webster
Winnepocket Lake Webster
Rust Pond Wolfeboro

6
Figure 2. Lakes Region VLAP Lakes

7
LAND USE AND POPULATION GROWTH According to the 2010 update of the Society for the Protection of New Hampshire Forests’ publication “New Hampshire’s Changing Landscape 2010”, New Hampshire’s population is expected to increase by 180,000 through 2030 (Figure 3). Almost 70% of that growth will occur in the Southeastern part of the state, particularly in Merrimack, Hillsborough and Rockingham counties. The population is anticipated to grow by approximately 37,000 people in Belknap and Merrimack counties alone by 2030. The majority of growth is estimated to occur around Lake Winnipesaukee in the towns of Wolfeboro, Moultonborough, Meredith, Sanbornton, Gilford, Belmont, and Alton. The Lakes Region is home to over 86,000 acres of water (lakes, river and wetlands). Approximately 50% of this water is located in Belknap County, 26% is located in Carroll County, 17% is located in Merrimack County and 6% is located in Grafton County. Over 50,000 acres of water reside in the towns predicted to experience the heaviest population growth in these four counties, representing approximately 60% of the total waterbody acreage in the Lakes region. Major land use categories in the Lakes region include forest, developed land and agriculture. Population growth and land use change go hand-in-hand. Growing populations necessitate land clearing to accommodate new homes, housing complexes, roadways and commercial businesses. Developed land corresponds to more impervious surfaces such as roadways, driveways and rooftops. It also corresponds to the loss of tree canopy coverage, unstable sediments, wildlife habitat loss and vegetative buffer loss. Consequences of development can negatively affect our waterbodies through increases in stormwater runoff, water temperatures, erosion, turbidity and nutrients, as well as shifts in aquatic life, aquatic plant, algae and cyanobacteria growth. Population growth in the Lakes region could impact a large portion of its waterbodies. Efforts should be made to evaluate current land use activities, infrastructure and regional water quality. This information should facilitate a plan to accommodate projected population growth while conserving and protecting valuable land and water resources.

8
Figure 3. NH Population Growth per Town 2010-2030

9
EXOTIC SPECIES Exotic aquatic nuisance species are those plants and animals not native to New Hampshire’s waterbodies, spread quickly through the aquatic environment, negatively affect economic and recreational activities, and can have a detrimental influence on natural habitats, the ecology of the system, and native species. They are a serious threat to the health of New Hampshire’s aquatic ecosystems, recreation and tourism industries. New Hampshire currently has 106 exotic aquatic plant infestations in 85 waterbodies. Those include Variable milfoil, Eurasian milfoil, Brazilian Elodea, Water chestnut, Curly-leaf Pondweed, Fanwort, European Naiad and Didymo (Rock Snot). Variable milfoil inhabits the majority of infested waterbodies, and Didymo, an invasive alga, has now infested 54 river miles in the North Country. Currently, 31 waterbodies in the Lakes Region are infested with an exotic species, which represents the largest number of infestations of any region in the state (Figure 4). All waterbodies with an exotic aquatic species have Variable milfoil infestations. The unique nature and invasive tendencies of these exotic species heighten the need to prevent new infestations, manage current infestations and engage watershed residents. One program that educates the public and engages watershed residents is the NHDES Weed Watchers Program. The Weed Watchers program has approximately 750 volunteers dedicated to monitoring lakes and ponds for the presence of exotic aquatic plants. Volunteers are trained to survey their lake or pond once a month from May through September. To survey, volunteers slowly boat, or sometimes snorkel, around the perimeter of the waterbody and its islands looking for suspicious aquatic plant species. If a suspicious plant is found, the volunteers send a specimen to NHDES for identification, either in the form of a live specimen, or as a photograph emailed to the Exotic Species Program Coordinator. Upon positive identification, a biologist visits the site to determine the extent of infestation, initiates a rapid response management technique where possible, and formulates a long-term management plan to control the nuisance infestation. Another program dedicated to public education and engaging watershed residents regarding exotic plant species is the Lake Host™ program, which was developed in 2002 by the non-profit organization New Hampshire Lake Association (NHLA, a.k.a. NH LAKES) and NHDES. The Lake HostTM Program is funded through NHDES and federal grants and provides courtesy boat inspections at boat ramps to prevent invasive species introduction and spread. Since the program was implemented, the number of participating waterbodies, volunteers and number of “saves” (exotic plants discovered) has consistently increased. The program is invaluable in educating boaters, preventing recreational hazards, avoiding property value and aquatic ecosystem decline, addressing aesthetic issues and saving costly remediation efforts.

10
Figure 4. Lakes Region Exotic Aquatic Plant Infestations

11
GEOMORPHOLOGY AND CLIMATE Chemical, physical and biological properties of lakes often reflect how they were formed. Lake formation can occur in a variety of ways. In New Hampshire, most lakes were formed during the last ice age as glaciers retreated approximately 12,000 years ago. Lakes are also formed from rivers (oxbow), and are man-and animal-made (e.g., impoundments, dams and beavers). These formations create distinct lake morphology. Included in a lake’s morphology are length, width, area, volume and shape. Lake morphology affects the lake’s overall ability to adapt to shifts in climate and land use. Along with the morphological characteristics of lakes, the bedrock and sediment geology is also important in understanding lake properties. Underlying geological properties can affect the pH and ANC of our surface and groundwater. New Hampshire is typically referred to as the “Granite State” because the bedrock geology consists of variations of igneous rock high in granite content that contributes to a lower capacity to buffer acidic inputs such as acid rain. Metamorphic rocks make up the remainder of bedrock geology and consist of slate, schist, quartzite and carbonate rocks which tend to contribute to a more neutral pH and better buffering capacity. Climate also drives multiple processes in lake systems. Lakes respond to shifting weather conditions such as sunlight, rainfall, air temperature, and wind and wave action in various ways. This variability is reflected in the types and number of biological communities present, and chemical and physical properties of the lake system. It is essential that we understand how these factors influence water quality data collected at individual lake systems. Therefore, volunteers record pertinent weather data, rain and storm event totals on field data sheets while sampling. To summarize the Lakes region climate conditions in 2013, the sampling season experienced slightly warmer air temperatures and above average rainfall based on weather conditions recorded in Concord (Table 1). Average air temperatures in May, June and July were warmer than historical averages, while August was much cooler and September was average. Overall, the annual average summer air temperature was 0.5 degrees warmer than the historical average. Surface water temperatures were average for June yet increased to well above average in July and August making the 2013 summer average surface water temperature 1.2 degrees above the historical average. The annual monthly rainfall amounts were above average from May through July and September, and below average in August resulting in the 2013 average summer precipitation being 1.35 inches greater than the historical average. In contrast, the 2014 sampling season was slightly cooler and drier. Average air temperatures were at or below normal May through July and September, while August was cooler than normal resulting in the seasonal average being 0.4 degrees cooler than the historical average. Surface water temperatures were slightly above average in June, well above average in July, and then fell to below average levels in August resulting in the annual summer average surface water temperature 0.9 degrees above the historical average. This marks the fifth year in a row where summer average surface temperatures exceeded the historical average. The 2014 monthly rainfall amounts were average in May and June, above average in July and August, and well below average in September making the annual summer average precipitation only 0.3 inches above the historical average. July experienced rainfall amounts that were 3.75 inches above normal only to be offset by the drastically dry September which was 2.96 inches below normal.

12
Table 1. Current Year and Historical Average Temperature and Precipitation Data for Lakes Region
May June July August September Summer
2013 Average Air Temperature (°F) 56.7 66.0 73.2 66.9 59.5 64.5
2014 Average Air Temperature (°F) 56.1 65.3 70.3 66.4 60.1 63.6
Annual Average Air Temperature (°F) 56.0 65.0 70.0 69.0 60.0 64.0
2013 Average Surface Water Temperature (°F)
------- 70.4 78.6 75.6 -------- 74.9
2014 Average Surface Water Temperature (°F)
------- 71.6 78.6 73.5 -------- 74.6
Regional Average Surface Water Temperature (˚F)
70.7 75.6 74.9 73.7
2013 Precipitation (in.) 4.07 6.78 6.70 2.05 4.81 4.88
2014 Precipitation (in.) 3.58 3.83 7.49 3.82 0.42 3.83
Annual Average Precipitation (in.) 3.66 3.69 3.74 3.18 3.38 3.53

13
MONITORING AND ASSESSMENT
New Hampshire considers public waters to be great ponds or artificial impoundments greater than 10 acres in size, rivers, streams and tidal waters. The Lakes region consists of 196 lakes, or great ponds, and 35 of those lakes participate in VLAP. These data are critical for informing the local public of lake conditions, but also in making formal national water quality assessments reported to EPA. Data on the remaining 80% of lakes are sparse, being only occasionally sampled through the NHDES Lake Trophic Survey Program. The NHDES Lake Trophic Survey Program monitors New Hampshire’s lakes on a rotating basis, with the goal of conducting a comprehensive lake survey every 10 to 15 years. The surveys compile chemical, biological and morphological data. The data are used to assign a lake trophic class to each waterbody. The trophic class provides an assessment on lake productivity and can provide information on how population growth and human activities may be accelerating the lake-aging process, also known as lake eutrophication. Three trophic classes are used to assess a lake’s overall health: oligotrophic, mesotrophic, and eutrophic. Oligotrophic lakes have high dissolved oxygen levels (> 5 mg/L), high transparency (> 12 ft. or 3.65 m), low chlorophyll-a concentrations (< 4 mg/L), low phosphorus concentrations (< 10 ug/L), and sparse aquatic plant growth. Eutrophic lakes have low levels of dissolved oxygen (< 2 mg/L), low transparency (< 6 ft. or 1.8 m), high chlorophyll-a concentrations (> 15 mg/L), high phosphorus concentrations (> 20 ug/L), and abundant aquatic plant growth. Mesotrophic lakes have characteristics that fall in between those of oligotrophic and eutrophic lakes for the parameters listed. The trophic class breakdown of the Lakes region is as follows: 44 lakes are oligotrophic, 69 mesotrophic, 39 eutrophic and 44 lakes are un-assessed for trophic classification due to lack of data. Thirteen oligotrophic, 15 mesotrophic and seven eutrophic lakes participate in VLAP (Figure 5). Approximately 60% of the Lakes region lakes are classified as oligotrophic and mesotrophic; however only 27% of those lakes participate in VLAP or a similar monitoring program. As human activities in watersheds accelerate lake aging, it is imperative to keep a close eye on the health of those lakes. Efforts should also be made to gather data on the un-assessed waterbodies. Protecting a lake and preventing lake aging is much more cost-effective than restoring a damaged lake.

14
Figure 5. Lakes Region VLAP Lake Trophic
Class

15
VLAP WATER QUALITY DATA INTERPRETATION The Lakes Region is home to 36 lakes and ponds that participate in VLAP. Volunteer monitors at each lake collect comprehensive data sets at the deepest spot of the lake and from streams entering or exiting the lake. Deep spot sample collection is representative of overall lake quality conditions and is used to establish long-term water quality trends and to provide information into the overall health of the waterbody. Stream sample collection is representative of what flows into the lake from the surrounding watershed. Stream data are used to identify potential watershed pollution problems, such as stormwater inputs, so that remediation actions occur before they negatively impact the overall health of the waterbody. The following section provides a summary of the VLAP monitoring parameters, long-term water quality trends, and an analysis of the current year and historical data for the VLAP lakes and ponds in the Lakes region compared with regional and state medians. The deep spot data for the epilimnion, or surface water layer, is compared to the New Hampshire median to provide an understanding of how the quality of a lake deep spot compares to other New Hampshire lake deep spots. Similarly, the epilimnion data are compared to the regional median to provide an understanding of how the quality of your lake deep spot compares with other local lakes. Median values were utilized to represent historical state and regional conditions as the value tends to better represent ‘typical’ conditions while minimizing the effects of ‘extreme’ (i.e., outlier) values. Average annual lake and regional values are then compared to the historical medians. A complete list of monitoring parameters and how to interpret data are included in Appendix A.

16
Annual and Historical Chlorophyll-a Data Analysis Algae are microscopic plants that are naturally found in the lake ecosystem. Algae, including cyanobacteria, contain chlorophyll-a, a pigment used for photosynthesis. The measurement of chlorophyll-a in the water provides an estimation of the algal abundance or lake productivity. The median summer chlorophyll-a concentration for New Hampshire’s lakes and ponds is 4.58 mg/m3. The median chlorophyll-a concentration for the Lakes Region is 3.57 mg/m3.
Figure 6 represents the combined 2013 and 2014 average chlorophyll-a concentration for each lake in the Lakes region compared with the state and regional medians. The average chlorophyll-a concentration at 17 lakes is equal to or below the regional median and typically representative of good water quality. Four lakes have average chlorophyll-a concentration between the state and regional medians, and 14 lakes experienced average chlorophyll-a concentrations equal to or above the state median. Typically, chlorophyll-a concentrations that exceed 5.0 mg/m3 are considered higher than
desirable. Twelve lakes experienced average chlorophyll-a concentrations greater than 5.0 mg/m3. Two of those lakes are classified as eutrophic and typically experience annual cyanobacteria blooms. Overall, approximately 90% of the sampled lakes have chlorophyll-a concentrations representative of oligotrophic and mesotrophic classifications.
17
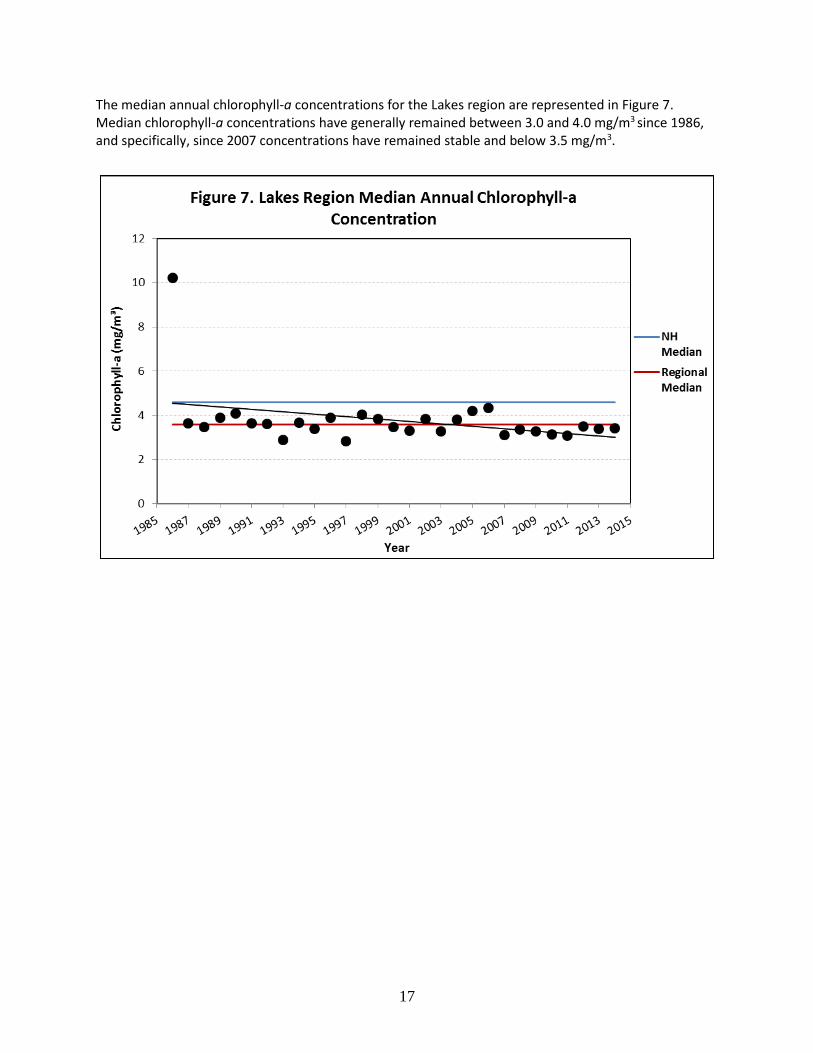
The median annual chlorophyll-a concentrations for the Lakes region are represented in Figure 7. Median chlorophyll-a concentrations have generally remained between 3.0 and 4.0 mg/m3 since 1986, and specifically, since 2007 concentrations have remained stable and below 3.5 mg/m3.

18
Chlorophyll-a Trend Analysis The regional median chlorophyll-a concentration was subject to Mann-Kendall non-parametric statistical analyses to determine if a significant regional trend existed using a 95% confidence limit. A significantly decreasing (improving) trend was detected for the Lakes Region which is a positive sign and correlates with the significantly decreasing (improving) epilimnetic total phosphorus trend (Appendix D: Table D-1). In addition to the regional trend analysis, Lakes Region lakes with 10 or more consecutive years of data were subject to linear regression analyses to determine whether water quality trends were significantly increasing, decreasing or stable over time. Chlorophyll-a trends were assessed for approximately 28 deep spots at 27 lakes in the region representing 80% of the Lakes Region VLAP lakes. Table 2 displays lakes that experienced significant trends for chlorophyll-a concentration. Chlorophyll-a concentrations have significantly improved (decreased) at three lake deep spots (Table 2) and remained stable at 25 lake deep spots. Refer to Appendix D: Table D-4 for the complete list of trend analyses for each individual lake. The stable and improving trends are a positive sign as chlorophyll-a concentrations are typically related to phosphorus concentrations. Phosphorus is a nutrient that promotes plant and algal growth in New Hampshire lakes. As phosphorus levels increase in lakes, it will normally cause an increase in algal growth.
Table 2. Significant Chlorophyll-a Trends in Lakes Region Lakes
Lake Name
Chlorophyll--a
Decreasing Trend
p
Chestnut Pond 0.04
Crystal Lake < 0.01
Tucker Pond < 0.01

19
Annual and Historical Transparency Data Analysis Volunteer monitors use the Secchi disk, a 20 cm disk with alternating black and white quadrants, to measure how far a person can see into the water. Transparency, a measure of water clarity, can be affected by algae and sediment in the water, as well as the natural color of the water. Transparency may also be measured using a viewscope, a cylindrical tube, designed to decrease surface water properties that may cause difficulty in viewing the Secchi disk. A comparison of transparency readings collected with and without the use of a viewscope shows that the viewscope typically increases the depth to which the Secchi disk can be seen into the lake, particularly on sunny and windy days. The median summer transparency for New Hampshire’s lakes and ponds is 3.20 meters. The median transparency for the Lakes region is 4.49 meters. Figure 8 represents the combined 2013 and 2014 average transparency for each lake in the Lakes region compared with state and regional medians. The average transparencies at ten lake deep spots are equal to or below the state median and are typically representative of poor to average water quality conditions. Eleven lakes fall between the state and regional medians, and 15 lakes are above the regional median and are typically representative of good water quality. Overall lake depth plays an important role when interpreting transparency data. Shallow lakes will typically report lower transparencies than deeper lakes, yet these waterbodies may be quite clear. A better representation would be to look at how transparency changes over time.

20
Figure 9 represents the annual median transparency for the Lakes region. Median transparencies for the region have generally remained between 4.0 and 5.0 meters since 1986 and have remained equal to or above the regional median in six of the last ten years with the 2014 median transparency being the best measured since 2001.

21
Transparency Trend Analyses The regional median transparency was subject to Mann-Kendall non-parametric statistical analyses to determine if a significant regional trend existed using a 95% confidence limit. A stable trend was detected for the Lakes Region which is the only region in the state not to experience a significant decrease in lake transparency (Appendix D: Table D-1). In addition to the regional trend analysis, Lakes Region lakes with 10 or more consecutive years of data were subject to linear regression analyses to determine whether water quality trends were significantly increasing, decreasing, or stable over time. Transparency trends were assessed for approximately 28 deep spots at 27 lakes in the region representing 80% of the region’s lakes. Trend analysis revealed four lake deep spots with decreasing (worsening) transparency trends (Table 3) and 24 lake deep spots with relatively stable transparency trends (Appendix D: Table D-4). The majority of regional lakes have stable transparency trends, which are a positive sign. Transparency, or water clarity, is typically affected by the amount of algae, color and particulate matter within the water column. Stormwater runoff can transport exposed and unstable sediments and other debris to lake systems. To maintain stable lake transparencies it is important to identify potential areas of concern in the watershed and utilize best management practices to control stormwater and erosion. Please refer to Appendix B for reference material on do-it-yourself stormwater best management practices.
Table 3. Significant Transparency Trends in Lakes Region Lakes
Lake Name
Transparency
Decreasing Trend
p
French Pond < 0.01
Hills Pond 0.04
Sunset Lake 0.03
Webster Lake < 0.01
22
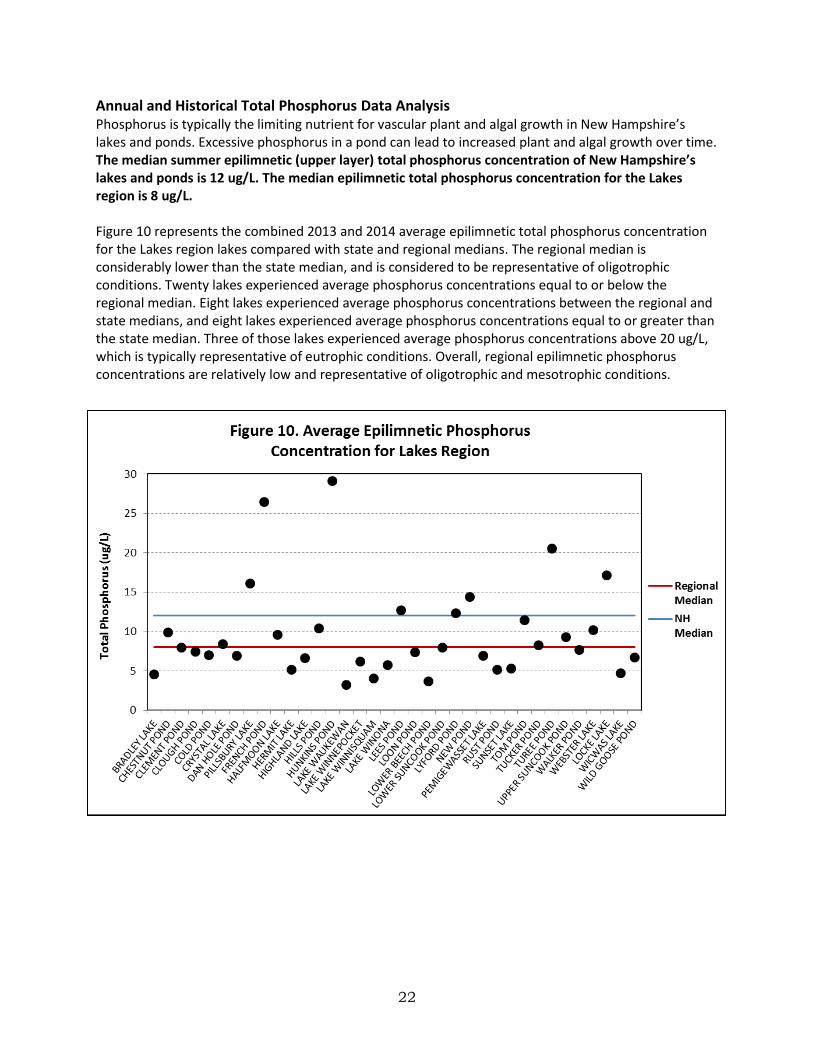
Annual and Historical Total Phosphorus Data Analysis Phosphorus is typically the limiting nutrient for vascular plant and algal growth in New Hampshire’s lakes and ponds. Excessive phosphorus in a pond can lead to increased plant and algal growth over time. The median summer epilimnetic (upper layer) total phosphorus concentration of New Hampshire’s lakes and ponds is 12 ug/L. The median epilimnetic total phosphorus concentration for the Lakes region is 8 ug/L. Figure 10 represents the combined 2013 and 2014 average epilimnetic total phosphorus concentration for the Lakes region lakes compared with state and regional medians. The regional median is considerably lower than the state median, and is considered to be representative of oligotrophic conditions. Twenty lakes experienced average phosphorus concentrations equal to or below the regional median. Eight lakes experienced average phosphorus concentrations between the regional and state medians, and eight lakes experienced average phosphorus concentrations equal to or greater than the state median. Three of those lakes experienced average phosphorus concentrations above 20 ug/L, which is typically representative of eutrophic conditions. Overall, regional epilimnetic phosphorus concentrations are relatively low and representative of oligotrophic and mesotrophic conditions.

23
Figure 11 represents the annual median epilimnetic phosphorus concentration for the Lakes region. Epilimnetic phosphorus concentrations have generally remained between the regional and state median since 1986. However since 1999, median phosphorus concentrations have remained at or below the regional median which generally represents oligotrophic conditions.

24
Epilimnetic Phosphorus Trend Analyses The regional median epilimnetic phosphorus was subject to Mann-Kendall non-parametric statistical analyses to determine if a significant regional trend existed using a 95% confidence limit. A significantly decreasing (improving) epilimnetic phosphorus trend was detected for the Lake Region (Appendix D: Table D-1) which was the only region with an improving trend. The significantly decreasing phosphorus levels were likely responsible for the significantly decreasing chlorophyll-a regional trend. In addition to the regional trend analysis, Lakes Region lakes with 10 or more consecutive years of data were subject to linear regression analyses to determine whether water quality trends were significantly increasing, decreasing or stable over time. Epilimnetic phosphorus trends were assessed for approximately 28 deep spots at 27 lakes in the region representing 80% of the region’s lakes. Trend analysis revealed six lake deep spots with significantly decreasing (improving) phosphorus levels (Table 4), 21 lake deep spots with stable trends, and only one lake had a significantly increasing epilimnetic phosphorus trend (Table 4). For a list of all lakes that had a linear regression analysis performed, refer to Appendix D: Table D-4. Increasing epilimnetic phosphorus trends are often a result of phosphorus-enriched stormwater runoff related to increased watershed development. An increase in watershed development often results in an increase in impervious surfaces and unstable sediments. This contributes to an increase in stormwater runoff and sedimentation to rivers and lakes. Efforts should continually be made to limit stormwater runoff and other phosphorus contributions to lakes. Watershed residents should be educated on utilizing and installing best management practices to control stormwater runoff from their own properties. For more information and resources to control phosphorus loading, refer to Appendix B.
Table 4. Significant Epilimnetic Total Phosphorus Trends in Lakes Region Lakes
Lake Name
Total Phosphorus (Epilimnion)
Increasing Trend
Decreasing Trend
p p
Loon Pond 0.02
Lower Beech Pond 0.04
Rust Pond < 0.01
Lake Waukewan, Mayo < 0.01
Lake Waukewan, Winona < 0.01
Wicwas Lake 0.04
Lake Winnisquam < 0.01

25
Dissolved Oxygen Data Analysis The presence of dissolved oxygen is vital to bottom-dwelling organisms as well as fish and amphibians. If the concentration of dissolved oxygen is low, typically less than 5 mg/L, species intolerant, (i.e., sensitive) to this situation, such as trout, will be forced to migrate closer to the surface where there is more dissolved oxygen but the water is generally warmer, and the species may not survive. Temperature and time of day also play a role in the amount of dissolved oxygen in the water column. Water can hold more oxygen at colder temperatures than at warmer temperatures. Therefore, a lake will typically have a higher concentration of dissolved oxygen during the winter, spring, and fall than during the summer. Oxygen concentrations are typically lower overnight than during the day. Plants and algae respire (use oxygen) at night and photosynthesize (produce oxygen) during the day. Dissolved oxygen levels may shift depending on the abundance of aquatic plants and algae in the littoral (near shore) and pelagic (deep water) zones. Dissolved oxygen and temperature profiles are collected at VLAP lakes on an annual or biennial basis. The average whole water column dissolved oxygen level for the Lakes region is 5.32 mg/L, which is in a critical range to support certain aquatic life. For additional information regarding dissolved oxygen, please refer to Appendix A.

26
Annual and Historical pH Data Analysis pH is measured on a logarithmic scale of 0 (acidic) to 14 (basic). pH is important to the survival and reproduction of fish and other aquatic life. A pH below 6.0 typically limits the growth and reproduction of fish. A waterbody is considered impaired for aquatic life when the pH falls below 6.5 or above 8.0. The median epilimnetic pH for New Hampshire’s lakes is 6.60, which indicates that the state surface waters are slightly acidic. The median epilimnetic pH for the Lakes Region is 6.82. Figure 12 represents the combined 2013 and 2014 average epilimnetic pH values for individual lakes in the Lakes Region compared with state and regional medians. The regional median is slightly better than the state median and within a desirable range for aquatic life. Ten lakes had epilimnetic pH levels equal to or below the state median and were slightly acidic, 12 lakes has epilimnetic pH levels between the state and regional medians, and 14 had epilimnetic pH levels were above the regional median. The lowest, most acidic, average pH was 6.22 measured at Bradley Lake in Andover whereas; the highest, most basic, pH value was 7.65 measured at French Pond in Henniker. This extremely basic value is not normally measured in New Hampshire surface waters and is caused by photosynthetic by-products released during algal and cyanobacteria blooms, common to French Pond. The majority of lakes experienced epilimnetic pH levels within the desirable range 6.5-8.0 units to support aquatic life.

27
Figure 13 represents the annual median epilimnetic pH for the Lakes Region compared with the regional and state median. The 2014 median epilimnetic pH value at the region’s lakes was 6.83, which means that the water is approximately neutral. Regional pH has fluctuated between 6.8 and 7.3 since 1986, yet has generally remained stable since 2010.
pH Trend Analysis The regional median epilimnetic pH was subject to Mann-Kendall non-parametric statistical analyses to determine if a significant regional trend existed using a 95% confidence limit. A stable epilimnetic pH trend was detected for the region which was one of three state regions to experience a stable trend (Appendix D: Table D-1). In addition to the regional trend analysis, Lakes Region lakes with 10 or more consecutive years of data were subject to linear regression analyses to determine whether water quality trends were significantly increasing, decreasing, or stable over time. Epilimnetic pH trends were assessed for approximately 28 deep spots at 27 lakes in the region representing 80% of the region’s lakes. Trend analysis revealed six lakes with significantly decreasing (worsening) epilimnetic pH trends, two lakes with significantly increasing (improving) epilimnetic pH trends, and 19 lakes with stable epilimnetic pH trends (Table 5; Appendix D: Table D-4). Variations in pH values between lakes and between different geographical regions may depend on the composition and weathering of underlying bedrock and the lake water chemistry. Another contributing factor to pH is acid deposition received as a result of emissions from power plants and vehicles. This

28
increases levels of atmospheric carbon, nitrogen and sulfur which fall back to the earth in the form of acidic precipitation.
A recent report published by NHDES, “Acid Rain Status and Trends New Hampshire Lakes, Ponds and Rainfall” analyzed trends in historical pH, ANC, conductivity, sulfate and nitrate concentrations from three state-wide monitoring programs to determine if the state’s lakes and ponds are recovering from the effects of acid rain. The Acid Outlet, Remote Pond and Rooftop Rain programs have been collecting data since the early 1970s and 1980s. Analysis of sulfate, nitrate and pH concentrations of precipitation indicate that pH levels have significantly increased (become less acidic), and sulfate and nitrate concentrations have significantly decreased (improved) since 1972. Analysis of sulfate, nitrate, pH and ANC concentrations of lake water indicate that the majority of lakes sampled have experienced a stable trend or increase (improvement) in pH and ANC as well as a 90% reduction in sulfate and nitrate concentration. This supports significant improvements in local and national air quality as regulations have improved acid rain; however, our surface waters reflect a slower rate of recovery.
Table 5. Significant Epilimnetic pH Trends in Lakes Region Lakes
Lake Name
pH (Epilimnion)
Increasing Trend
Decreasing Trend
p p
Chestnut Pond 0.04
New Pond 0.04
Clement Pond 0.01
Crystal Lake 0.03
Hills Pond 0.01
Sunset Lake 0.03
Tom Pond < 0.01
Tucker Pond < 0.01

29
Annual and Historical ANC Data Analysis ANC measures the buffering capacity of a water body, or its ability to resist changes in pH by neutralizing acidic inputs. These “buffers” are typically bases such as bicarbonate and carbonate. Geology can play an important part in a water body’s buffering capacity. Lakes located in areas with predominantly limestone (calcium carbonate), sedimentary rocks and carbonate-rich soils often have a higher ANC, while lakes located in areas with predominantly granite and carbon-poor soils often have a lower ANC. The higher the ANC, the more readily a waterbody can resist change in pH. The median ANC value for New Hampshire’s lakes and ponds is 4.8 mg/L, and the median ANC value for the Lakes region is 5.9 mg/L, which indicates that many lakes and ponds in the state are at least moderately vulnerable to acidic inputs. Figure 14 represents the combined 2013 and 2014 average ANC of individual lakes in the Lakes Region compared with state and regional medians. Ten lakes have ANC values equal to or less than the state and regional medians, six lakes have ANC values between the state and regional medians, and 20 lakes have ANC values greater than the regional median. The majority of lakes have ANC value within the moderately vulnerable range and four lakes have ANC values indicate of low vulnerability to acidic inputs. For more information on ANC values for New Hampshire lakes see Appendix A.

30
Figure 15 represents the annual median ANC for the Lakes region compared with state and regional medians. The regional ANC has generally remained between 5.0 and 7.0 mg/L since 1986 and ANC values do not fluctuate greatly from year to year.
Acid Neutralizing Capacity Trend Analysis The regional median ANC was subject to Mann-Kendall non-parametric statistical analyses to determine if a significant regional trend existed using a 95% confidence limit. No significant trend was detected for the Lakes Region (Appendix D: Table D-1; Figure 15); however, a significantly increasing ANC trend was detected for five of the seven regions indicating that New Hampshire lakes buffering capacity is improving. This further supports the NHDES “Acid Rain Status and Trends New Hampshire Lakes, Ponds and Rainfall” report.

31
Annual and Historical Deep Spot Conductivity Analysis Conductivity is the numerical expression of the ability of water to carry an electric current, which is determined by the number of negatively charged ions from metals, salts, and minerals in the water column. The soft waters of New Hampshire have traditionally low conductivity values, generally less than 50 uMhos/cm. However, specific categories of good and bad levels cannot be constructed for conductivity because variations in watershed geology can result in natural fluctuations. The median conductivity value for New Hampshire’s lakes and ponds is 40.0 uMhos/cm. The median epilimnetic conductivity value for the Lakes region is 51.6 uMhos/cm. Figure 16 represents the combined 2013 and 2014 average epilimnetic conductivity for individual lakes in the Lakes Region compared with state and regional medians. The regional median is slightly greater than the state median. Eleven lakes have epilimnetic conductivity values less than the state median, seven lakes have epilimnetic conductivity values between the state and regional medians, and 18 lakes have epilimnetic conductivity values greater than the regional median. Conductivity values fluctuate widely among the region’s lakes. The lowest value of 15.0 uMhos/cm was measured at Cold Pond in Andover whereas the highest value of 198.4 uMhos/cm was measured at Turee Pond in Bow. A wide range of watershed types and degrees of development exists in the region. Cold Pond experiences relatively little developmental pressures, whereas Turee Pond in Bow, although partially surrounded by forested land, receives stormwater runoff from residential development, paved roadways, parking lots, and athletic fields.

32
Figure 17 represents the annual median epilimnetic conductivity value for the Lakes region compared with the regional and state medians. Regional epilimnetic conductivity generally remained between 40.0 and 50.0 uMhos/cm between 1986 and 2001. Since then, conductivity has generally remained greater than 50.0 uMhos/cm with greater variability between years. The 2014 median epilimnetic conductivity value of the Lakes region was 48.3 uMhos/cm, which is slightly greater than the state median.
Historical Conductivity Trend Analysis The regional median epilimnetic conductivity was subject to Mann-Kendall non-parametric statistical analyses to determine if a significant regional trend existed using a 95% confidence limit. A significantly increasing (worsening) epilimnetic conductivity trend was detected for the Lakes Region which is consistent the majority of state regions (Appendix D: Table D-1). In addition to the regional trend analysis, Lakes Region lakes with 10 or more consecutive years of data were subject to linear regression analyses to determine whether water quality trends were significantly increasing, decreasing or stable over time. Epilimnetic conductivity trends were assessed for approximately 28 deep spots at 27 lakes in the region representing 80% of the region’s lakes. Trend analysis revealed three lakes with significantly decreasing (improving) epilimnetic conductivity, 10 lakes with significantly increasing (worsening) epilimnetic conductivity, and 14 lakes with stable epilimnetic conductivity trends (Table 6; Appendix D: Table D-4).

33
Table 6. Significant Epilimnetic Conductivity Trends in Lakes Region Lakes
Lake Name
Conductivity (Epilimnion)
Increasing Trend
Decreasing Trend
p p
Clough Pond < 0.01
French Pond < 0.01
Halfmoon Lake < 0.01
Lees Pond 0.04
New Pond < 0.01
Rust Pond < 0.01
Tucker Pond 0.03
Lake Waukewan, Mayo < 0.01
Lake Waukewan, Winona < 0.01
Lake Winnisquam < 0.01
Lake Winona 0.02
Cold Pond < 0.01
Wicwas Lake < 0.01
Winnepocket Lake < 0.01
Generally, conductivity values in New Hampshire lakes exceeding 100 uMhos/cm indicate cultural, meaning human, disturbances. An elevated conductivity trend typically indicates point sources and/or non-point sources of pollution are occurring within the watershed. These sources include failed or marginally functioning septic systems, agricultural runoff, road runoff and groundwater inputs. New development in the watershed can alter runoff patterns and expose new soil and bedrock areas, which could also contribute to increasing conductivity. In addition, natural sources, such as the mineral composition of bedrock, can influence conductivity.

34
Annual and Historical Deep Spot Chloride Analysis High conductivity values are often due to elevated chloride levels, which are generally associated with road salt and/or septic inputs. The chloride ion (Cl-) is found naturally in some surface and ground waters and in high concentrations in seawater. The chloride content in New Hampshire lakes is naturally low in surface waters located in remote areas away from habitation. Research has shown that elevated chloride levels can be toxic to freshwater aquatic life. In order to protect freshwater aquatic life in New Hampshire, the state has adopted acute and chronic chloride criteria of 860 and 230 mg/L respectively. The median chloride value for New Hampshire’s lakes is 4 mg/L. The median epilimnetic chloride value for the Lakes region is 12 mg/L. Figure 18 represents the combined 2013 and 2014 average epilimnetic chloride values of individual lakes in the Lakes Region compared with state and regional medians. Eight lakes have epilimnetic chloride levels less than or equal to the state median, 11 lakes have epilimnetic chloride levels between the state and regional medians, and nine lakes have epilimnetic chloride levels greater than the regional median. The chloride measurement is relatively new for VLAP and is an optional analyte for participating lakes. Lakes that serve as water supplies or where conductivity levels may be influenced by chloride are analyzed annually.

35
Figure 19 depicts annual median epilimnetic chloride levels for the Lakes region. Median epilimnetic chloride levels generally range between 6 and 15 mg/L and are considered low levels when compared with the acute and chronic chloride standards; however, they are slightly greater than what we would typically measure in undisturbed New Hampshire surface waters.
Historical Chloride Trend Analysis The regional median epilimnetic chloride was subject to Mann-Kendall non-parametric statistical analyses to determine if a significant regional trend existed using a 95% confidence limit. No significant trend was detected for the Lakes Region (Appendix D: Table D-1, Figure 19). This trend is consistent with all regions of the state. Watershed management efforts to control un-natural sources of conductivity and chloride in waterbodies should employ a combination of best management practices in regards to winter salting practices. State and local governments and private homeowners should evaluate the use of road salt and alternatives to reduce the amount of material applied while maintaining public safety. For additional information on the relationship between conductivity and chloride, please refer to Appendix A. For additional information on best management practices, please refer to Appendix B.

36
Annual and Historical Deep Spot Turbidity Data Analysis Turbidity in the water is caused by suspended matter (such as clay, silt and algae) that causes light to be scattered and absorbed, not transmitted in straight lines through water. Water clarity is strongly influenced by turbidity. The Class B surface water quality standard for turbidity is no greater than 10 NTUs over the lake background level. The median epilimnetic turbidity of the Lakes region is 0.65 NTU. Figure 20 represents the combined 2013 and 2014 average epilimnetic turbidity of individual lakes in the Lakes Region compared with the regional median. Thirteen lakes had epilimnetic turbidities that were less than the regional median and considered to be in a low range. Sixteen lakes had epilimnetic turbidities between the regional median and 1.2 NTU and considered to be in an average range, and seven lakes had epilimnetic turbidities greater than 1.2 NTU and were higher than desirable. Hunkins Pond turbidity of 16.6 NTU was not included in the graphic and was much higher than any other lake; this is caused by annual cyanobacteria blooms.

37
Figure 21 represents the annual median epilimnetic turbidity for the Lakes region. The 2014 median epilimnetic turbidity was 0.86 NTU which was slightly greater than the regional median and the highest turbidity measured since 2005. The increased frequency and intensity of storm events in recent years may be contributing to an increase in stormwater runoff and turbidity in the region’s lakes. However, regional epilimnetic turbidity remains below 1.0 NTU and is average for most New Hampshire lakes.
Historical Turbidity Trend Analysis The regional median epilimnetic turbidity was subject to Mann-Kendall non-parametric statistical analyses to determine if a significant regional trend existed using a 95% confidence limit. A significantly increasing (worsening) trend was detected for the Lakes Region (Appendix D: Table D-1, Figure 21). This trend is consistent with all regions of the state. Elevated deep spot turbidity levels are typically the result of stormwater runoff, algal or cyanobacteria blooms, and/or disturbance of lake bottom sediments. Stormwater BMPs should be implemented when possible to reduce the amount of suspended sediments and debris transported to surface water. Boating activity in shallow areas should adhere to rules specified by the New Hampshire Marine Patrol in regards to speed and no wake zones. If an algal or cyanobacteria bloom is observed, please contact NHDES immediately. For additional information on stormwater BMPs, boating, algae and cyanobacteria, please refer to Appendices A and B.

38
Reference:
Gibbs, J. P., Halstead, J. M., Boyle, K. J., & Huang, J. (2002). An hedonic analysis of the effects of
lake water clarity on New Hampshire lakefront properties. Agricultural and Resource
Economics Review, 31(1), 39-46.
Loder, A. (2011, September 08). Vacation communities and the rest of New Hampshire: How
their tax rates compare. Retrieved from http://stateimpact.npr.org/new-hampshire
2/27/2012
Nordstrom, A. The New Hampshire Lakes, Rivers, Streams and Ponds Partnership, (2007). The
economic impact of potential decline in New Hampshire water quality: The link between
visitor perceptions, usage and spending
Sundquist, D. Society for the Protection of New Hampshire Forests, (2010). New Hampshire's
changing landscape 2010
The Society for the Protection of New Hampshire Forests, (1999). The economic impact of open
space in New Hampshire