Embed Size (px)
Citation preview

New Hampshire SIM Stakeholder Meeting
November 21, 2013

Meeting Agenda
1. Introductions
2. General SIM Update
3. Consumer Online Survey Update
4. Additional Cost Overview of Individuals Receiving LTSS
5. SIM Design Update
6. Draft SIM Plan Overview

SIM Stakeholder Meeting Updated SIM Population Data Summaries
Presented by: John D. Meerschaert, FSA, MAAA Principal and Consulting Actuary
November 21, 2013

Offices in Principal Cities Worldwide
15800 Bluemound Road Suite 100 Brookfield, WI 53005 USA Tel +1 262 784 2250 Fax +1 262 923 3680 milliman.com John D. Meerschaert, FSA, MAAA Principal and Consulting Actuary [email protected] November 19, 2013
Ms. Sheri L. Rockburn, CPA, MBA Director of Finance Division of Community Based Care Services Department of Health and Human Services 129 Pleasant St. Concord, NH 03301 Re: Updated Preliminary Data Summaries for SIM Baseline Model Dear Sheri: The New Hampshire Department of Health and Human Services (DHHS) retained Milliman to provide actuarial support related to New Hampshire’s State Health Care Innovation Model (SIM) grant. This letter includes several new data summaries to help better understand the cost profile and the acuity of the population in the current LTC system in New Hampshire. The data summaries included with this letter are preliminary in nature. They will change as we receive feedback and additional information. DISCLAIMER The Medicare expenditures for dual eligibles shown in Exhibits A1-A6 and C1-C6 represent estimated Medicare costs for disabled and aged dual eligibles using the CMS 5% sample data for the state of New Hampshire and average Part D pharmacy expenditures. These estimates do not represent the Medicare cost for any particular waiver population, but rather represent an average Medicare dual eligible cost. A more detailed classification of Medicare beneficiaries could yield better estimates of Medicare expenditures for the various SIM populations. Please note that the values shown in the attached exhibits D1-D2 and E1-E2 could be understated if Medicaid claims for dual eligibles do not include comprehensive diagnosis coding. More complete diagnosis data is generally available in Medicare data, but person-specific Medicare data is not available for this project. COST DECILE SUMMARIES We developed data summaries by expenditure decile for the populations receiving Medicaid long-term care and support services. Exhibits A1-A6 show expenditure deciles for the SIM population in total grouped by age as follows:
Exhibit A1 – Total All Ages
Exhibit A2 – Ages Under 18
Exhibit A3 – Ages 19-64
Exhibit A4 – Ages 65-74
Exhibit A5 – Ages 75-84
Exhibit A6 – Ages 85+

Ms. Sheri L. Rockburn November 19, 2013
Page 2
Exhibit B1 shows counts of individuals from the SIM populations for each decile while Exhibit B2 shows the distribution for each decile. We also created a decile summary for the following major populations that will be impacted by the SIM model design:
> Exhibit C1 – Choices of Independence (CFI) waiver enrollees > Exhibit C2 – Developmental Disabilities (DD) waiver enrollees > Exhibit C3 – Acquired Brain Disorders (ABD) waiver enrollees > Exhibit C4 – In Home Supports (IHS) waiver enrollees > Exhibit C5 – Nursing home residents > Exhibit C6 – BBH consumer population
To develop these exhibits, we summarized total annual spend for SFY 2011 and SFY 2012 for each individual and ranked them from least expensive to most expensive. We then assigned each individual one of ten decile groupings based on that ranking system. For example, the 90%-100% decile group is the most expensive 10% of the population. The 80%-90% decile is the next most expensive 10% of the population. Expenditures are summarized based on the following service categories:
Medicaid ICF/SNF services
Medicaid HCBS Waiver services
Medicaid CMHC services
Medicaid Hospital Inpatient and Outpatient services
Medicaid at School services
Medicaid – Other services
Medicare services (estimated) Each exhibit shows total annual expenditures, annual expenditure per member and per member per month (PMPM) expenditures and allows for the comparison of expenditure distribution by major service category across individuals with various levels of need. The Medicare expenditures for dual eligibles represent estimated Medicare expenditures for disabled and aged dual eligibles using the CMS 5% sample data for the state of New Hampshire and average Part D pharmacy expenditures. The Medicare PMPM expenditure estimates were assigned to each dual eligible based on their age for each month they were eligible for both Medicaid and Medicare. These estimates do not represent the Medicare cost for any particular waiver population, but rather represent an average Medicare dual eligible cost. We will update our Medicare estimates if we get access to the 100% New Hampshire sample data from CMS or develop a more refined estimation methodology based on DHHS input. CO-MORBIDITY SUMMARIES We developed several exhibits to help assess the acuity of the various populations that will be impacted by the SIM model design. Exhibits D1-D2 shows the prevalence of the top 25 diagnostic categories as assigned by the CMS-HCC risk adjustment system used for the Medicare Advantage program for each population.

Ms. Sheri L. Rockburn November 19, 2013
Page 3
Exhibit D1 shows the prevalence rates for the population in total for SFY 2012. Exhibit D2 shows the prevalence rates for the 10% most expensive individuals in each population for SFY 2012. We included prevalence rates for the following populations:
> Choices of Independence (CFI) waiver enrollees > Developmental Disabilities (DD) waiver enrollees > Acquired Brain Disorders (ABD) waiver enrollees > In Home Supports (IHS) waiver enrollees > Nursing home residents > BBH consumer population > Total population
Exhibit E1 shows the distribution of the number of conditions for the population in total for SFY 2012. Exhibit E2 shows the distribution of the number of conditions for the 10% most expensive individuals in each population for SFY 2012. Please note that the values shown in Exhibits D1-D2 and E1-E2 could be understated if Medicaid claims for dual eligibles do not include comprehensive diagnosis coding. More complete diagnosis data is generally available in Medicare data, but person-specific Medicare data is not available for this project. DATA RELIANCE AND IMPORTANT CAVEATS We used FFS Medicaid cost and eligibility data for June 2010 through December 2012 and other DHHS information to develop the historical data summaries shown in this letter. This data was provided by DHHS. We have not audited or verified this data and other information. If the underlying data or information is inaccurate or incomplete, the results of our analysis may likewise be inaccurate or incomplete. We performed a limited review of the data used directly in our analysis for reasonableness and consistency and have not found material defects in the data. If there are material defects in the data, it is possible that they would be uncovered by a detailed, systematic review and comparison of the data to search for data values that are questionable or for relationships that are materially inconsistent. Such a review was beyond the scope of our assignment. Milliman prepared this letter and the accompanying appendices for the specific purpose of providing preliminary data summaries for use in the development of the baseline population and financial model of the current LTC system in New Hampshire. This report should not be used for any other purpose. This report has been prepared solely for the internal business use of and is only to be relied upon by the management of DHHS. Milliman does not intend to benefit or create a legal duty to any third party recipient of its work. This letter should only be reviewed in its entirety. The results of this letter are technical in nature and are dependent upon specific assumptions and methods. No party should rely on these results without a thorough understanding of those assumptions and methods. Such an understanding may require consultation with qualified professionals. I am a Principal and Consulting Actuary for Milliman, a member of the American Academy of Actuaries, and meet the Qualification Standards of the Academy to render the actuarial opinion contained herein. To the best of my knowledge and belief, this report is complete and accurate and has been prepared in accordance with generally recognized and accepted actuarial principles and practices. The terms of Milliman’s contract with the New Hampshire Department of Health and Human Services signed on November 16, 2012 apply to this report and its use.
Ms. Sheri L. Rockburn November 19, 2013
Page 4
Please call me at (262) 796-3434 if you have any questions. Sincerely, John D. Meerschaert, FSA, MAAA Principal and Consulting Actuary JDM/laa

4 November 21, 2013
Overview of Actuarial Analysis Purpose of analysis
– Provide information during SIM design grant period – Establish baseline information to be used in:
• High-level projections for SIM design grant report • More detailed modeling for next SIM application
– Part of the process has been to identify gaps in available data and how to address them in future steps
New data summaries for today’s discussion – Expenditure “decile summaries” for SIM population (ten groupings
of individuals ranked from most expensive 10% to least expensive 10% of population) • Total population, by age group, and by SIM population
– Detailed exhibits and documentation to be distributed via SIM website

5 November 21, 2013
Known Gaps in Available Data Medicare data
– DHHS does not have access to Medicare data that can be linked to individual dual eligibles in Medicaid data
– Current data summaries use “average” Medicare expenditures for <65 and 65+ dual eligible population in New Hampshire
– We are working with DHHS to develop more refined estimates – Limits ability to identify individuals with co-morbidities due to
missing Medicare diagnosis codes
Private insurance data – Collected through the New Hampshire Comprehensive Health Care
Information System (CHIS) – CHIS data is near the end of a major update – Data cannot be included during design grant time period

6 November 21, 2013
State Health Care Innovation Model (SIM) Baseline Summaries High Level Summary of Populations Receiving Medicaid LTSS
Population: Total
SFY 2011 SFY 2012 Member Months 240,465 243,859 Number of Individuals 27,006 27,299 % that are dual eligible 52% 52%
Expenditures by Service Expenditures Annual Per Individual Expenditures
Annual Per Individual
Medicaid ICF/SNF $190,315,614 $7,047 $202,192,918 $7,407 Medicaid HCBS Waiver $255,267,052 $9,452 $263,741,020 $9,661 Medicaid CMHC $74,372,759 $2,754 $72,861,434 $2,669 Medicaid Hospital IP and OP $26,628,858 $986 $28,936,315 $1,060 Medicaid at School $22,537,915 $835 $21,700,772 $795 Medicaid - All Other Covered Services $87,649,251 $3,246 $85,232,930 $3,122 Medicare (estimated) $149,544,812 $5,537 $150,769,167 $5,523 Total Medicaid and Medicare (estimated) $806,316,260 $29,857 $825,434,556 $30,237
* Please refer to Milliman’s November 19, 2013 report for a description of methodology and assumptions.

7 November 21, 2013
State Health Care Innovation Model (SIM) Baseline Summaries Decile Summary
Population: Total All Ages
SFY 2012 Population Expenditure Distribution
Decile Number of Individuals
Member Months
Percent Dual Eligible
Total Annual Expenditures
Percentage of Total Annual Expenditures
90-100% 2,728 32,324 68% $284,656,698 34% 80-90% 2,729 32,257 88% 163,932,290 20% 70-80% 2,728 30,675 79% 125,262,573 15% 60-70% 2,728 29,306 72% 90,260,879 11% 50-60% 2,729 27,781 61% 63,813,305 8% 40-50% 2,728 26,594 53% 43,561,506 5% 30-40% 2,728 23,473 34% 27,635,809 3% 20-30% 2,729 19,938 28% 15,923,652 2% 10-20% 2,728 13,698 26% 7,921,994 1% 0-10% 2,744 7,813 14% 2,465,849 0% Total 27,299 243,859 52% $825,434,556 100%
* Please refer to Milliman’s November 19, 2013 report for a description of methodology and assumptions.

8 November 21, 2013
State Health Care Innovation Model (SIM) Baseline Summaries Decile Summary
Population: Total All Ages
SFY 2012 Population Expenditure Distribution
Annual Per Member Expenditures
Decile
Percent Dual
Eligible Medicaid ICF/SNF
Medicaid HCBS Waiver
Medicaid CMHC
Medicaid Hospital
IP and OP Medicaid at School
Medicaid All Other
Medicare (estimated) Total
90-100% 68% $15,980 $59,531 $3,776 $2,912 $1,721 $11,978 $8,447 $104,346 80-90% 88% 32,963 7,495 1,397 1,143 898 2,865 13,309 60,070 70-80% 79% 14,605 12,036 2,062 1,477 1,574 3,524 10,640 45,917 60-70% 72% 4,998 10,720 2,790 1,328 1,408 3,059 8,784 33,087 50-60% 61% 2,966 4,546 4,019 1,357 1,218 2,992 6,284 23,383 40-50% 53% 1,361 1,450 4,375 1,007 600 2,642 4,532 15,968 30-40% 34% 807 574 3,725 779 319 2,111 1,815 10,130 20-30% 28% 307 227 2,660 409 143 1,243 846 5,835 10-20% 26% 112 83 1,392 156 62 637 462 2,904 0-10% 14% 5 12 506 38 10 188 139 899 Total 52% $7,407 $9,661 $2,669 $1,060 $795 $3,122 $5,523 $30,237
* Please refer to Milliman’s November 19, 2013 report for a description of methodology and assumptions.

9 November 21, 2013
State Health Care Innovation Model (SIM) Baseline Summaries Decile Summary - Counts of Individuals
Population: Total All Ages
SFY 2012 Population Member Distribution
Decile CFI Waiver Enrollees
DD Waiver Enrollees
ABD Waiver Enrollees
IHS Waiver Enrollees
Nursing Home
Residents BBH
Consumers Total
90-100% 173 1,588 151 36 624 156 2,728 80-90% 159 327 9 35 2,096 103 2,729 70-80% 576 544 10 63 1,333 202 2,728 60-70% 937 596 8 60 688 439 2,728 50-60% 507 529 7 40 578 1,068 2,729 40-50% 222 366 3 32 375 1,730 2,728 30-40% 144 259 3 16 352 1,954 2,728 20-30% 110 174 2 4 245 2,194 2,729 10-20% 95 145 0 3 194 2,291 2,728 0-10% 74 148 2 2 28 2,490 2,744 Total 2,997 4,676 195 291 6,513 12,627 27,299
* Please refer to Milliman’s November 19, 2013 report for a description of methodology and assumptions.

10 November 21, 2013
State Health Care Innovation Model (SIM) Baseline Summaries Decile Summary
Comparison by Age Group - All SIM Populations
SFY 2012 Annual Per Member Expenditures
Decile Age <18 Age 18-64 Age 65-74 Age 75-84 Age 85+ Total
90-100% $58,538 $130,581 $100,257 $76,768 $68,468 $104,346 80-90% 22,716 73,151 64,844 61,673 61,026 60,070 70-80% 14,200 47,136 56,459 55,671 57,259 45,917 60-70% 9,738 32,708 45,803 48,288 52,711 33,087 50-60% 6,911 23,431 37,935 39,999 45,770 23,383 40-50% 4,894 17,370 32,098 33,240 37,237 15,968 30-40% 3,264 12,428 25,299 26,816 29,859 10,130 20-30% 2,032 7,455 17,851 19,327 22,404 5,835 10-20% 1,093 3,775 9,870 11,620 13,232 2,904 0-10% 395 1,204 3,366 4,254 4,991 899 Total $12,365 $34,898 $39,394 $37,768 $39,296 $30,237
# of Individuals 8,130 11,456 2,045 2,637 3,689 27,299
* Please refer to Milliman’s November 19, 2013 report for a description of methodology and assumptions.

11 November 21, 2013
State Health Care Innovation Model (SIM) Baseline Summaries Decile Summary
Population: Choices for Independence Waiver Enrollees
SFY 2012 Population Expenditure Distribution
Annual Per Member Expenditures
Decile
Percent Dual
Eligible Medicaid ICF/SNF
Medicaid HCBS Waiver
Medicaid CMHC
Medicaid Hospital IP
and OP Medicaid at School
Medicaid All Other
Medicare (estimated) Total
90-100% 75% $280 $27,987 $1,730 $6,595 $0 $31,323 $9,574 $77,490 80-90% 88% 708 25,071 1,882 2,469 0 5,398 11,953 47,481 70-80% 87% 384 20,557 1,172 1,874 0 3,535 12,541 40,063 60-70% 92% 364 18,115 802 1,366 0 2,038 13,472 36,157 50-60% 92% 262 15,253 658 1,251 0 1,708 13,284 32,416 40-50% 90% 416 12,543 442 1,286 0 1,670 12,270 28,628 30-40% 86% 411 10,387 241 1,031 0 1,520 10,899 24,489 20-30% 83% 817 7,254 323 1,038 0 1,421 7,652 18,503 10-20% 85% 755 3,954 180 866 0 747 4,639 11,141 0-10% 82% 313 958 37 246 0 258 1,916 3,728 Total 86% $471 $14,208 $747 $1,802 $0 $4,960 $9,820 $32,008
* Please refer to Milliman’s November 19, 2013 report for a description of methodology and assumptions.

12 November 21, 2013
State Health Care Innovation Model (SIM) Baseline Summaries Decile Summary
Population: Developmentally Disabled Waiver Enrollees
SFY 2012 Population Expenditure Distribution
Annual Per Member Expenditures
Decile
Percent Dual
Eligible Medicaid ICF/SNF
Medicaid HCBS Waiver
Medicaid CMHC
Medicaid Hospital IP
and OP Medicaid at School
Medicaid All Other
Medicare (estimated) Total
90-100% 58% $3,366 $125,759 $652 $1,580 $2,003 $16,318 $6,465 $156,142 80-90% 70% 211 83,653 861 1,144 2,004 7,414 8,126 103,413 70-80% 72% 232 63,456 440 1,143 2,029 6,987 8,394 82,682 60-70% 63% 1,726 44,882 443 1,258 2,729 7,136 7,475 65,648 50-60% 57% 441 30,068 692 730 4,732 5,179 6,091 47,933 40-50% 54% 69 21,806 887 605 4,364 3,281 5,688 36,700 30-40% 44% 75 15,958 588 647 3,500 2,798 4,700 28,265 20-30% 41% 82 8,593 484 564 3,711 2,871 4,144 20,450 10-20% 30% 52 3,587 850 490 1,930 2,670 2,748 12,328 0-10% 6% 11 1,059 112 203 499 1,266 166 3,316 Total 49% $626 $39,834 $600 $836 $2,747 $5,587 $5,394 $55,624
* Please refer to Milliman’s November 19, 2013 report for a description of methodology and assumptions.

13 November 21, 2013
State Health Care Innovation Model (SIM) Baseline Summaries Decile Summary
Population: Nursing Home Residents
SFY 2012 Population Expenditure Distribution
Annual Per Member Expenditures
Decile
Percent Dual
Eligible Medicaid ICF/SNF
Medicaid HCBS Waiver
Medicaid CMHC
Medicaid Hospital IP
and OP Medicaid at School
Medicaid All Other
Medicare (estimated) Total
90-100% 83% $72,768 $256 $23 $1,867 $0 $3,949 $12,557 $91,419 80-90% 97% 46,821 31 10 565 0 833 15,353 63,613 70-80% 98% 43,379 7 6 385 0 591 15,363 59,730 60-70% 98% 39,770 7 10 438 0 464 15,230 55,919 50-60% 97% 35,318 18 16 425 0 638 14,186 50,601 40-50% 96% 28,628 105 17 661 0 723 11,937 42,072 30-40% 94% 20,746 165 11 754 0 720 8,437 30,832 20-30% 91% 13,484 132 23 753 0 592 5,697 20,680 10-20% 90% 7,106 235 32 571 0 392 3,079 11,415 0-10% 89% 2,398 163 22 209 0 171 1,447 4,408 Total 93% $31,041 $112 $17 $663 $0 $907 $10,329 $43,068
* Please refer to Milliman’s November 19, 2013 report for a description of methodology and assumptions.

14 November 21, 2013
* Please refer to Milliman’s November 19, 2013 report for a description of methodology and assumptions.
State Health Care Innovation Model (SIM) Baseline Summaries Decile Summary
Population: Bureau of Behavioral Health Consumers
SFY 2012 Population Expenditure Distribution
Annual Per Member Expenditures
Decile
Percent Dual
Eligible Medicaid ICF/SNF
Medicaid HCBS Waiver
Medicaid CMHC
Medicaid Hospital
IP and OP Medicaid at School
Medicaid All Other
Medicare (estimated) Total
90-100% 46% $494 $8,627 $19,095 $5,633 $1,967 $10,953 $5,163 $51,932 80-90% 46% 74 552 9,344 2,175 955 4,935 4,855 22,891 70-80% 47% 20 219 6,580 1,251 422 3,265 4,618 16,374 60-70% 28% 3 103 5,672 1,006 260 2,811 2,077 11,933 50-60% 21% 11 81 4,511 678 182 1,974 1,064 8,502 40-50% 19% 3 35 3,372 423 101 1,381 699 6,014 30-40% 19% 0 19 2,289 266 71 974 482 4,101 20-30% 21% 0 10 1,460 139 41 574 341 2,565 10-20% 25% 0 2 815 69 13 282 241 1,423 0-10% 2% 0 1 380 16 4 113 15 528 Total 27% $60 $965 $5,349 $1,165 $401 $2,725 $1,954 $12,619

SIM Design Update

Option 1. Service pricing originating from the provider/agency
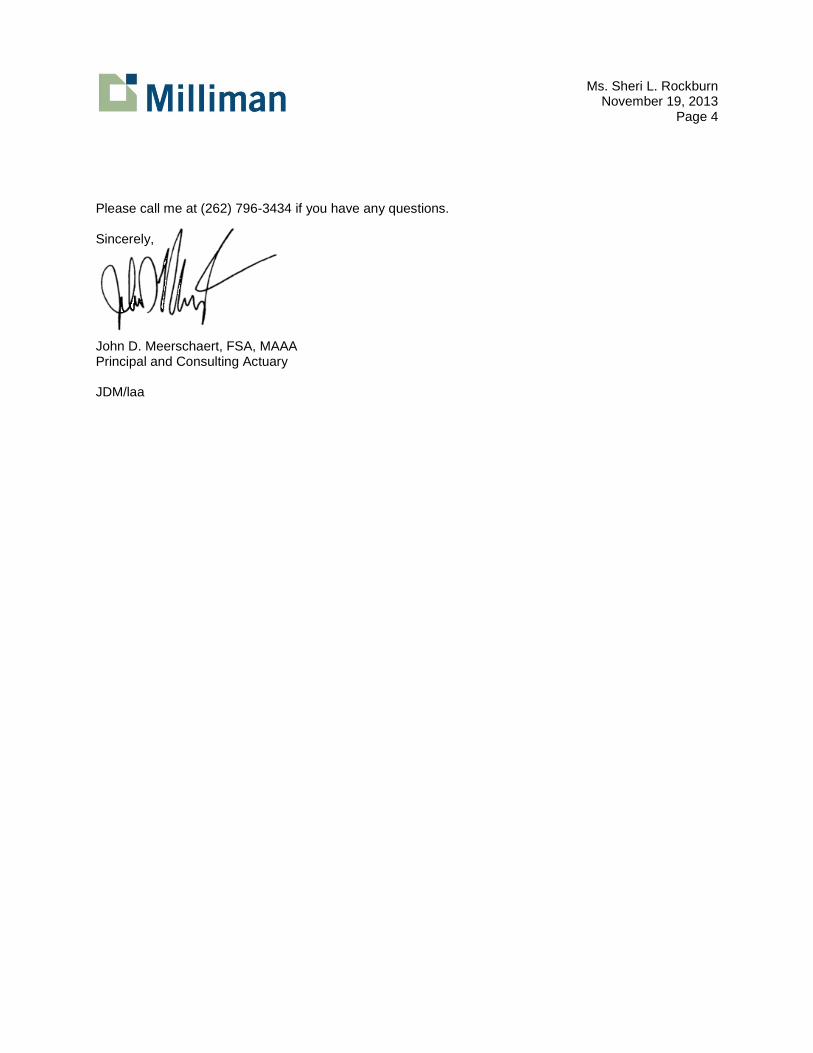
Three LTSS Budget Pricing Model Options
Pros Cons Tailored to individual need Work needed to examine
Provides for creative, low-cost solutions
Potentially more difficult to get through approval process
Supports person centered approach
Potential price variation for the same service at same intensity level
Reflects real costs of service Geographic variation
Takes into account geography Range of pricing (MCOs)
Allows for individual choice MCO rate setting could be a challenge
Three LTSS Budget Pricing Model Options
Option 2. Standardized fee schedule
Pros Cons
Reduces need to examine request Not tailored to individual
Straight forward projects of cost May increase costs
Works well with hourly staff costs No price differences per region
All diagnosis/services treated the same
All diagnosis/services treated the same
All providers treated the same All providers treated the same
Easier to align fee scheduled with available budget funds
Favors larger organizations Potential insensitivity to unit cost pressure May limit ability to compete

Three LTSS Budget Pricing Model Options
Option 3. Modified standardized fee schedule based upon differentiating state factors*
*Example of a differentiating state factor is the weight/scale of services in northern NH compared to services in southern NH
Pros Cons
Could work well if state and other factors modify rates
Potential disagreement over modification factors
All diagnosis/services treated the same
All diagnosis/services treated the same
Takes into account geography
May not reflect actual costs of services
Levels playing field of providers
Could lead to unfair competition, e.g. agencies going outside services area

Three LTSS Budget Approval and Appeal Options • In each scenario, the Team Coordinator creates the LTSS budget and
the individual has the right to fair hearings and appeals
Team Coordinator
submits budget to
individual’s MCO
MCO approves the
budget
MCO sends documentation to
DHHS 1.
Team Coordinator
submits budget to
DHHS
DHHS approves the
budget
DHHS sends determination to the
individual and to the MCO for budget
creation
2.
Team Coordinator
submits budget to
individual’s MCO
MCO reviews and
recommends budget to
DHHS
DHHS makes final budget decision
and sends determination to the individual and the MCO for budget
creation
3.

1. Team Coordinator creates the LTSS budget 2. Team Coordination submits budget to individual’s MCO 3. MCO approves the budget 4. MCO sends documentation to DHHS *Individual can appeal budget through the appeal process described in the MCO contracts
Option # 1
Pros Cons
Gives MCOs control over financial risk of waiver services
Could have different bundles being approved based on MCO Potential lack of consistency in approval standards; would need to establish criteria Timeliness of approval and appeal process may not occur

1. Team Coordinator creates the LTSS budget 2. Team Coordinator submits budget to DHHS 3. DHHS approves the budget 4. DHHS sends determination to the individual and to the MCO for budget
creation. *Individual can appeal through the DHHS fair hearings and appeals process
Option # 2
Pros Cons
Responsibility remains with state
Processing may be less timely than option #1 MCOs do not control financial risk

1. Team Coordinator creates the LTSS budget 2. Team Coordinator submits budget to individual’s MCO 3. MCO reviews and recommends budget to DHHS 4. DHHS makes final budget decision and sends determination to the
individual and the MCO for budget creation *Individual can appeal through the DHHS fair hearings and appeals process
Option # 3
Pros Cons
Streamlines appeal process as opposed to option #1
Timely processing may not occur; additional step in process is time consuming
Easier tracking of pattern of denials/approval rates for customer service
Less control of capitated funds on MCO side
Gives MCO more financial control than option #2 Allows for MCO and state collaboration to meet needs of individual
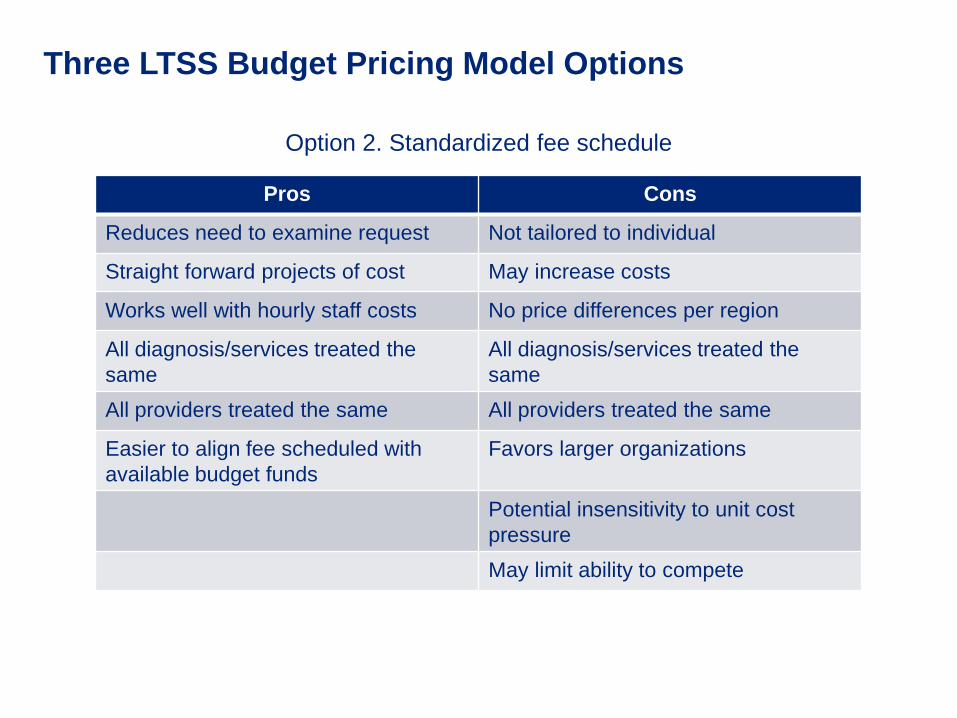
Alignment with Public Health • The Division of Public Health Services recently released a State Health
Improvement Plan that introduces initiatives focused in the following areas:
1. Tobacco 2. Obesity/Diabetes 3. Heart Disease & Stroke 4. Healthy Mothers & Babies 5. Cancer Prevention 6. Asthma 7. Injury Prevention 8. Infectious Disease 9. Emergency Preparedness 10. Misuse of Alcohol and Drugs
• Individuals receiving LTSS are not targeted populations for strategic communications about or enrollment in these programs
• We have identified three strategies for encouraging individuals with LTSS participation in these public health initiatives: – The LTSS Reimbursement Account could be used to fund transportation necessary for
individuals to participate in these programs – Public health programs need to be identified in the an individual’s Life Plan – The facilitation of participation in these programs can be a measurable aspect of the Team
Coordinator function – The training certification program for the Team Coordinator can include a public health
awareness component

Substance Misuse
• There is a significant opportunity to address substance misuse needs within the LTSS population through SIM, specifically by:
– Including substance use disorders (SUD) treatment within an individual’s Life Plan
– Including a substance misuse awareness component in the training certification program for the Team Coordinator
– Including a measure within the evaluation of Team Coordinator effectiveness that focuses on the utilization of available substance misuse services
– Including non-traditional services relating to SUD treatment within the contingency pool for individuals participating in the consumer-directed budget initiative
The rationale behind including substance misuse in this model is to incentivize individuals to seek a variety of different treatment options
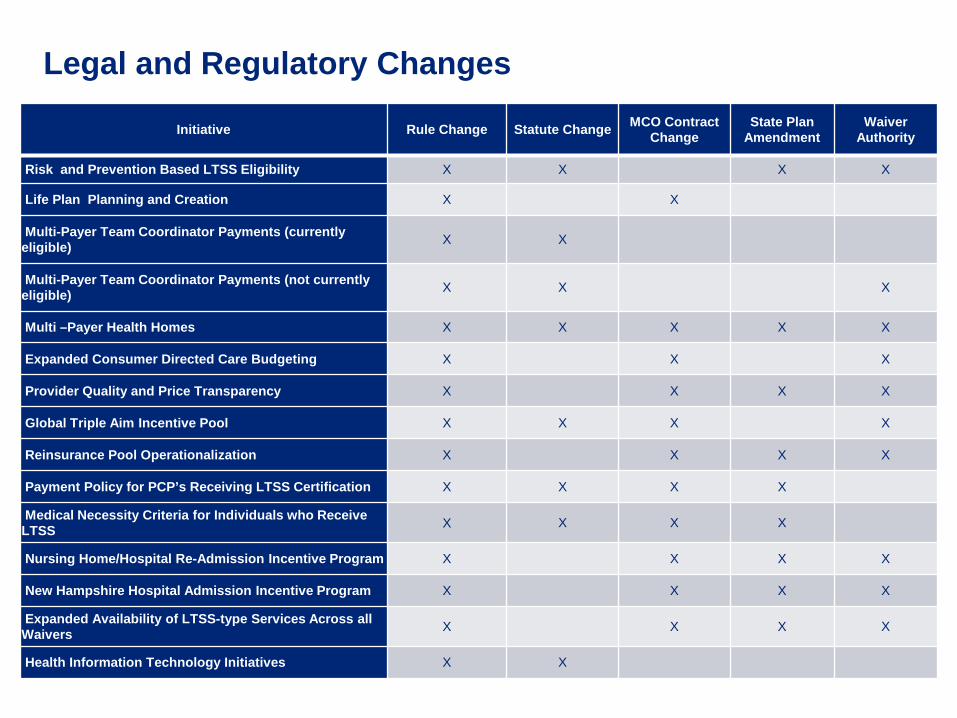
Initiative Rule Change Statute Change MCO Contract Change
State Plan Amendment
Waiver Authority
Risk and Prevention Based LTSS Eligibility X X X X
Life Plan Planning and Creation X X
Multi-Payer Team Coordinator Payments (currently eligible) X X
Multi-Payer Team Coordinator Payments (not currently eligible) X X X
Multi –Payer Health Homes X X X X X
Expanded Consumer Directed Care Budgeting X X X
Provider Quality and Price Transparency X X X X
Global Triple Aim Incentive Pool X X X X
Reinsurance Pool Operationalization X X X X
Payment Policy for PCP’s Receiving LTSS Certification X X X X
Medical Necessity Criteria for Individuals who Receive LTSS X X X X
Nursing Home/Hospital Re-Admission Incentive Program X X X X
New Hampshire Hospital Admission Incentive Program X X X X
Expanded Availability of LTSS-type Services Across all Waivers X X X X
Health Information Technology Initiatives X X
Legal and Regulatory Changes

Potential Implementation Approach

Draft SIM Plan Overview

Upcoming Schedule
December 2013 November 2013
M T W T F
1
4 5 6 7 8
11 12 13 14 15
18 19 20 21 22
25 26 27 28 29
M T W T F
2 3 4 5 6
9 10 11 12 13
16 17 18 19 20
23 24 25 26 27
30 31
Stakeholder Meetings
Workgroup Meetings