Embed Size (px)
Citation preview
New England Common Assessment Program
2008–2009 Technical Report
June 2009
100 Education Way, Dover, NH 03820 (800) 431-8901

Table of Contents i 2008–09 NECAP Technical Report
TABLE OF CONTENTS CHAPTER 1. OVERVIEW................................................................................................................................................1
1.1 Purpose of the New England Common Assessment Program.......................................................................1 1.2 Purpose of this Report ..................................................................................................................................1 1.3 Organization of this Report ..........................................................................................................................2
SECTION I—DESCRIPTION OF THE 2008–09 NECAP TEST ................................................................................3 CHAPTER 2. DEVELOPMENT AND TEST DESIGN............................................................................................................3
2.1 Operational Development Process ...............................................................................................................3 2.1.1 Item Development..................................................................................................................................................... 3 2.1.2 Grade-Level and Grade-Span Expectations............................................................................................................... 3 2.1.3 Internal Item Review................................................................................................................................................. 3 2.1.4 External Item Review................................................................................................................................................ 4 2.1.5 Bias and Sensitivity Review...................................................................................................................................... 5 2.1.6 Item Editing............................................................................................................................................................... 5 2.1.7 Reviewing and Refining............................................................................................................................................ 6 2.1.8 Operational Test Assembly ....................................................................................................................................... 6 2.1.9 Editing Drafts of Operational Tests........................................................................................................................... 7 2.1.10 Braille and Large-Print Translation........................................................................................................................... 7
2.2 Item Types.....................................................................................................................................................7 2.3 Operational Test Designs and Blueprints.....................................................................................................8
2.3.1 Embedded Equating and Field Test Items................................................................................................................. 9 2.3.2 Test Booklet Design.................................................................................................................................................. 9
2.4 Reading Test Designs....................................................................................................................................9 2.4.1 Reading Blueprint .......................................................................................................................................10 2.5 Mathematics Test Design............................................................................................................................12 2.5.1 The Use of Calculators on the NECAP.......................................................................................................12
2.5.2 Mathematics Blueprint ............................................................................................................................................ 13 2.6 Writing Test Design ....................................................................................................................................14 2.6.1 Writing Blueprint: Grades 5 and 8 .............................................................................................................15
2.6.2 Writing Blueprint: Grade 11.................................................................................................................................... 16 2.7 Test Sessions ...............................................................................................................................................17
CHAPTER 3. TEST ADMINISTRATION ..........................................................................................................................21 3.1 Responsibility for Administration ...............................................................................................................21 3.2 Administration Procedures .........................................................................................................................21 3.3 Participation Requirements and Documentation........................................................................................21 3.4 Administrator Training ...............................................................................................................................24 3.5 Documentation of Accommodations ...........................................................................................................24 3.6 Test Security................................................................................................................................................25 3.7 Test and Administration Irregularities .......................................................................................................25 3.8 Test Administration Window.......................................................................................................................26 3.9 NECAP Service Center ...............................................................................................................................27
CHAPTER 4. SCORING .................................................................................................................................................29 4.1 Scoring of Standard Test Items ...................................................................................................................29
4.1.1 Machine-Scored Items............................................................................................................................................. 29 4.1.2 Hand-Scored Items.................................................................................................................................................. 29
4.1.2.1 Scoring Location and Staff ........................................................................................................................... 30 4.1.2.2 Benchmarking Meetings with the NECAP State Specialists ........................................................................ 31 4.1.2.3 Reader Recruitment and Qualifications ........................................................................................................ 32 4.1.2.4 Methodology for Scoring Polytomous Items ................................................................................................ 32 4.1.2.5 Reader Training ............................................................................................................................................ 33 4.1.2.6 Senior Quality Assurance Coordinator (QAC) and Senior Reader (SR) Training ........................................ 35 4.1.2.7 Monitoring of Scoring Quality Control and Consistency ............................................................................. 35 4.1.2.8 Reports Generated During Scoring............................................................................................................... 39
SECTION II—STATISTICAL AND PSYCHOMETRIC SUMMARIES .................................................................41 CHAPTER 5. CLASSICAL ITEM ANALYSES...................................................................................................................41
5.1 Classical Difficulty and Discrimination Indices .........................................................................................41 5.2 Differential Item Functioning (DIF) ...........................................................................................................43 5.3 Dimensionality Analyses.............................................................................................................................44
CHAPTER 6. IRT SCALING AND EQUATING.................................................................................................................48 6.1 Item Response Theory Scaling ....................................................................................................................48
Table of Contents ii 2008–09 NECAP Technical Report
6.2 Item Response Theory Analyses..................................................................................................................50 6.3 Equating......................................................................................................................................................51 6.4 Equating Results .........................................................................................................................................52 6.5 Achievement Standards...............................................................................................................................53 6.6 Reported Scale Scores ................................................................................................................................54
6.6.1 Description of Scale ................................................................................................................................................ 54 6.6.2 Calculations............................................................................................................................................................. 55 6.6.3 Distributions............................................................................................................................................................ 57
CHAPTER 7. RELIABILITY ...........................................................................................................................................61 7.1 Reliability and Standard Errors of Measurement.......................................................................................62 7.2 Subgroup Reliability ...................................................................................................................................63 7.3 Item Type Reliability...................................................................................................................................63 7.4 Reporting Categories Reliability ................................................................................................................64 7.5 Reliability of Achievement Level Categorization........................................................................................65
7.5.1 Accuracy and Consistency ...................................................................................................................................... 65 7.5.2 Calculating Accuracy .............................................................................................................................................. 66 7.5.3 Calculating Consistency.......................................................................................................................................... 66 7.5.4 Calculating Kappa................................................................................................................................................... 66 7.5.5 Results of Accuracy, Consistency, and Kappa Analyses......................................................................................... 67
CHAPTER 8. VALIDITY................................................................................................................................................69 8.1 Questionnaire Data.....................................................................................................................................70 8.2 Validity Studies Agenda ..............................................................................................................................75
8.2.1 External Validity ..................................................................................................................................................... 75 8.2.2 Convergent and Discriminant Validity.................................................................................................................... 75 8.2.3 Structural Validity................................................................................................................................................... 76 8.2.4 Procedural Validity ................................................................................................................................................. 77
SECTION III—NECAP REPORTING..........................................................................................................................79 CHAPTER 9. SCORE REPORTING..................................................................................................................................79
9.1 Teaching Year vs. Testing Year Reporting..................................................................................................79 9.2 Primary Reports..........................................................................................................................................79 9.3 Student Report ............................................................................................................................................79 9.4 Item Analysis Reports .................................................................................................................................80 9.5 School and District Results Reports ...........................................................................................................81 9.6 School and District Summary Reports ........................................................................................................84 9.7 Decision Rules ............................................................................................................................................84 9.8 Quality Assurance.......................................................................................................................................85
SECTION IV—REFERENCES ......................................................................................................................................87 APPENDICES...................................................................................................................................................................89 Appendix A Committee Membership Appendix B Accommodation Frequencies by Content Area Appendix C Table of Standard Test Accommodations Appendix D Appropriateness of the Accommodations Allowed in NECAP
General Assessment, and Their Impact on Student Results Appendix E Double-blind Interrater Agreement Appendix F Item Level Classical Statistics Results Appendix G Classical Item Statistic Descriptives Summarized by Grade, Content, and Form Appendix H Number of Items Classified into DIF Categories by Subgroup, Test Form, and Item Type Appendix I Common Item DIF Category Counts in the Male vs. Female Comparison Appendix J Item Response Theory Parameters, TCCs and TIFs Appendix K Delta Analyses and Rescore Analysis Results Appendix L Raw to Scaled Score Look-up Tables Appendix M Scaled Score Percentages and Cumulative Percentages Appendix N Detailed Alpha Coefficient Results Appendix O Decision Accuracy and Consistency Results Appendix P Student Questionnaire Data Appendix Q Sample Reports Appendix R Decision Rules

Chapter 1——Overview 1 2008–09 NECAP Technical Report
Chapter 1. OVERVIEW
1.1 Purpose of the New England Common Assessment Program
The New England Common Assessment Program (NECAP) is the result of collaboration among New
Hampshire (NH), Rhode Island (RI), and Vermont (VT) to build a set of tests for grades 3 through 8 and 11 to
meet the requirements of the No Child Left Behind Act (NCLB). The purposes of the tests are as follows: (1)
provide data on student achievement in reading/language arts and mathematics to meet the requirements of
NCLB; (2) provide information to support program evaluation and improvement; and (3) provide information
regarding student and school performance to both parents and the public. The tests are constructed to meet
rigorous technical criteria, to include universal design elements and accommodations to allow all students
access to test content, and to gather reliable student demographic information for accurate reporting. School
improvement is supported by
providing a transparent test design through the elementary and middle school grade-level
expectations (GLEs), the high school grade-span expectations (GSEs), distributions of emphasis,
and practice tests
reporting results by GLE/GSE subtopics, released items, and subgroups
hosting report interpretation workshops to foster understanding of results
It is important to note that the NECAP tests in reading, mathematics, and writing are administered in
the fall at the beginning of the school year and test student achievement based on the prior year’s
GLEs/GSEs. Student-level results are provided to schools and families for use as one piece of evidence about
progress and learning that occurred on the prior year’s GLEs/GSEs. The results are a status report of a
student’s performance against GLEs/GSEs and should be used cautiously in concert with local data.
1.2 Purpose of this Report
The purpose of this report is to document the technical aspects of the 2008–09 NECAP. In October of
2008, students in grades 3 through 8 and 11 participated in the administration of the NECAP in reading and
mathematics. Students in grades 5, 8, and 11 also participated in writing. This report provides information
about the technical quality of those tests, including a description of the processes used to develop, administer,
and score the tests and to analyze the test results. This report is intended to serve as a guide for replicating
and/or improving the procedures in subsequent years.
Though some parts of this technical report may be used by educated laypersons, the intended
audience is experts in psychometrics and educational research. The report assumes a working knowledge of
measurement concepts, such as “reliability” and “validity,” and statistical concepts, such as “correlation” and
“central tendency.” In some chapters, knowledge on more advanced topics is required.

Chapter 1——Overview 2 2008–09 NECAP Technical Report
1.3 Organization of this Report
The organization of this report is based on the conceptual flow of a test’s life span; the report begins
with the initial test specification and addresses all the intermediate steps that lead to final score reporting.
Section I provides a description of the NECAP test, and consists of four chapters – test design and
development process; test administration; scoring; scaling and equating. Section II provides statistical and
psychometric summaries, and consists of three chapters – item analysis; reliability; and validity. Section III
covers NECAP score reporting. Section IV provides references, and Section V contains appendices to the
report.
Chapter 2—Development and Test Design 3 2008–09 NECAP Technical Report
SECTION I—DESCRIPTION OF THE 2008–09 NECAP TEST
Chapter 2. DEVELOPMENT AND TEST DESIGN
2.1 Operational Development Process
2.1.1 Item Development
Curriculum and assessment content specialists at Measured Progress begin the item development
process by selecting passages and graphics and developing items and scoring guides according to guidance
and specifications provided by the NECAP states. During this process, the curriculum and assessment
specialists do the following:
Work in close collabaoration with the states from conceptualization to production of the final
camera ready copies
Review the Grade-Level, (GLEs), Grade-Span Expectations (GSEs), and test specifications to
ensure that the items developed truly measure student learning and meet each state’s goals for
accountability
Write and edit items that adhere to the NECAP test specifications
Lead Item Review Committees
Participate in benchmarking to ensure NECAP scoring reflects the true intent of the items
Select items to create tests that are educationally significant, as well as valid and reliable for the
purposes of reporting data
2.1.2 Grade-Level and Grade-Span Expectations
NECAP test items are directly linked to the content standards and performance indicators described
in the GLEs/GSEs. The content standards for each grade are grouped into content clusters for the purpose of
reporting results; the performance indicators are used by the content specialists to help guide the development
of test questions. An item may address one, several, or all of the performance indicators.
2.1.3 Internal Item Review
The lead Measured Progress test developer within the content area reviewed the formatted item,
open response (OR) scoring guide, and any reading selections and graphics.
The lead developer considered item “integrity,” content, and structure; appropriateness to
designated content area; item format; clarity; possible ambiguity; answer cueing; appropriateness
and quality of reading selections and graphics; and appropriateness of scoring guide descriptions
Chapter 2—Development and Test Design 4 2008–09 NECAP Technical Report
and distinctions (in relation to each item and across all items within the guide). The item reviewer
also ensured that, for each item, there was only one correct answer.
The lead developer also considered scorability and evaluated whether the scoring guide
adequately addressed performance on the item.
Fundamental questions that the lead developer considered, but was not limited to, included the
following:
- What is the item asking?
- Is the key the only possible key? (Is there only one correct answer?)
- Is the OR item scorable as written (were the correct words used to elicit the response
defined by the guide)?
- Is the wording of the scoring guide appropriate and parallel to the item wording?
- Is the item complete (i.e., includes scoring guide, content codes, key, grade level, depth of
knowledge (DOK) and identified contract)?
- Is the item appropriate for the designated grade level?
2.1.4 External Item Review
Item Review Committees (IRCs) were formed by the states to provide an external review of items.
The committees included teachers, curriculum supervisors, and higher-education faculty from all three states,
with committee members serving rotating terms. (A list of IRC member names and affiliations is included in
Appendix A.) The committees role is to review test items for the NECAP, provide feedback , and make
recommendations about which items should be selected for program use. The 2008–09 NECAP IRCs for each
content area in grade levels 3 through 8 and 11 met in the spring of 2008. Committee members reviewed the
entire set of embedded field-test items proposed for the 2008–09 operational test and made recommendations
about selecting, revising, or eliminating specific items from the item pool. Members reviewed each item
against the following criteria:
Grade-Level/Grade-Span Expectation Alignment
- Is the test item aligned to the appropriate GLE/GSE?
- If not, which GLE/GSE or grade level is more appropriate?
Correctness
- Are the items and distractors correct with respect to content accuracy and developmental
appropriateness?
- Are the scoring guides consistent with GLE/GSE wording and developmental
appropriateness?

Chapter 2—Development and Test Design 5 2008–09 NECAP Technical Report
Depth of Knowledge1
- Are the items coded to the appropriate Depth of Knowledge?
- If consensus cannot be reached, is there clarity around why the item might be on the
borderline of two levels?
Language
- Is the item language clear?
- Is the item language accurate (syntax, grammar, conventions)?
Universal Design
- Is there an appropriate use of simplified language (does not interfere with the construct
being assessed)?
- Are charts, tables, and diagrams easy to read and understandable?
- Are charts, tables, and diagrams necessary to the item?
- Are instructions easy to follow?
- Is the item amenable to accommodations—read-aloud, signed, or Brailled?
2.1.5 Bias and Sensitivity Review
Bias review is an essential part of the development process. During the bias review process, NECAP
items were reviewed by a committee of teachers, English Language Learner (ELL) specialists, special-
education teachers, and other educators and members of major constituency groups who represent the
interests of legally protected and/or educationally disadvantaged groups. (A list of bias and sensitivity review
committee member names and affiliations is included in Appendix A.) Items were examined for issues that
might offend or dismay students, teachers, or parents. Including such groups in the development of test items
and materials can prevent many unduly controversial issues, and can allay unfounded concerns before the test
forms are produced.
2.1.6 Item Editing
Measured Progress editors reviewed and edited the items to ensure uniform style (based on The
Chicago Manual of Style, 15th edition) and adherence to sound testing principles. These principles included
the stipulation that items
were correct with regard to grammar, punctuation, usage, and spelling;
were written in a clear, concise style;
1 NECAP employed the work of Dr. Norman Webb to guide the development process with respect to Depth of Knowledge. Test specification documents identified ceilings and targets for Depth of Knowledge coding.

Chapter 2—Development and Test Design 6 2008–09 NECAP Technical Report
contained unambiguous explanations to students detailing what is required to attain a maximum
score;
were written at a reading level that would allow the student to demonstrate his or her knowledge
of the tested subject matter, regardless of reading ability;
exhibited high technical quality in terms of psychometric characteristics;
had appropriate answer options or score-point descriptors; and
were free of potentially sensitive content.
2.1.7 Reviewing and Refining
Test developers presented item sets to the IRCs who then recommended which items should be
included in the embedded field-test portions of the test. The NH, RI, and VT Departments of Education
content specialists made the final selections with the assistance of Measured Progress at a final face-to-face
meeting.
2.1.8 Operational Test Assembly
At Measured Progress, test assembly is the sorting and laying out of item sets into test forms. Criteria
considered during this process for the 2008–09 NECAP included the following:
Content coverage/match to test design. The Measured Progress test developers completed an
initial sorting of items into sets based on a balance of reporting categories across sessions and
forms, as well as a match to the test design (e.g., number of multiple-choice (MC), short-answer
(SA), and constructed-response (CR) items).
Item difficulty and complexity. Item statistics drawn from the data analysis of previously tested
items were used to ensure similar levels of difficulty and complexity across forms.
Visual balance. Item sets were reviewed to ensure that each reflected similar length and
“density” of selected items (e.g., length/complexity of reading selections, number of graphics).
Option balance. Each item set was checked to verify that it contained a roughly equivalent
number of key options (As, Bs, Cs, and Ds).
Name balance. Item sets were reviewed to ensure that a diversity of student names was used.
Bias. Each item set was reviewed to ensure fairness and balance based on gender, ethnicity,
religion, socioeconomic status, and other factors.
Page fit. Item placement was modified to ensure the best fit and arrangement of items on any
given page.
Facing-page issues. For multiple items associated with a single stimulus (a graphic or reading
selection), consideration was given both to whether those items needed to begin on a left- or
right-hand page and to the nature and amount of material that needed to be placed on facing

Chapter 2—Development and Test Design 7 2008–09 NECAP Technical Report
pages. These considerations served to minimize the amount of “page flipping” required of
students.
Relationship between forms. Although embedded field-test items differ from form to form, they
must take up the same number of pages in each form so that sessions and content areas begin on
the same page in every form. Therefore, the number of pages needed for the longest form often
determined the layout of each form.
Visual appeal. The visual accessibility of each page of the form was always taken into
consideration, including such aspects as the amount of “white space,” the density of the text, and
the number of graphics.
2.1.9 Editing Drafts of Operational Tests
Any changes made by a test construction specialist were reviewed and approved by a lead developer.
After a form was laid out in what was considered its final form, it was reviewed to identify any final
considerations, including the following:
Editorial changes. All text was scrutinized for editorial accuracy, including consistency of
instructional language, grammar, spelling, punctuation, and layout. (based on Measured
Progress’s publishing standards in The Chicago Manual of Style, 15th edition).
“Keying” items. Items were reviewed for any information that might “key” or provide
information that would help to answer another item. Decisions about moving keying items are
based on the severity of the “key-in” and the placement of the items in relation to each other
within the form.
Key patterns. The final sequence of keys was reviewed to ensure that their order appeared
random (i.e., no recognizable pattern and no more than three of the same key in a row).
2.1.10 Braille and Large-Print Translation
Common items for grades 3 through 8 and 11were translated into Braille by a subcontractor that
specializes in test materials for blind and visually impaired students. In addition, Form 1 for each grade was
adapted into a large-print version.
2.2 Item Types
The item types used and the functions of each are described below.
Multiple-Choice (MC) items were administered in grades 3 through 8 and 11 in reading and
mathematics, and in grades 5 and 8 in writing to provide breadth of coverage of the GLEs/GSEs. Because
they require approximately one minute for most students to answer, these items make efficient use of limited
Chapter 2—Development and Test Design 8 2008–09 NECAP Technical Report
testing time and allow coverage of a wide range of knowledge and skills, including, for example, word
identification and vocabulary skills.
Short-Answer (SA) items were administered in grades 3 through 8 and 11 mathematics to assess
students’ skills and their ability to work with brief, well-structured problems with one solution or a very
limited number of solutions. SA items require approximately two to five minutes for most students to answer.
The advantage of this item type is that it requires students to demonstrate knowledge and skills by generating
rather than merely selecting, an answer. SA planning boxes accompanied writing prompts in grades 5 and 8 as
noted below.
Constructed-Response (CR) items typically require students to use higher-order thinking skills such
as summary, evaluation, and analysis in constructing a satisfactory response. CR items require approximately
five to ten minutes for most students to complete. These items were administered in grades 3 through 8 and 11
in reading, in grades 5 and 8 in writing, and in grades 5 through 8 and 11 in mathematics.
Writing Prompt (WP). A single common writing prompt with three SA planning box items were
administered in grades 5 and 8. A single common writing prompt and one additional matrix writing prompt
per form were administered in grade 11. Students were given 45 minutes (plus additional time if necessary) to
compose an extended response for the common prompt that was scored by two independent readers both on
quality of the stylistic and rhetorical aspects of the writing and on the use of standard English conventions.
Students were encouraged to write a rough draft and were advised by the test administrator when to begin
copying their final draft into their student answer booklets.
Approximately twenty-five percent of the common NECAP items were released to the public in
2008–09. The released NECAP items are posted on a Web site hosted by Measured Progress and on the
Department of Education Web sites. Schools are encouraged to incorporate the use of released items in their
instructional activities so that students will be familiar with the types of questions found on the NECAP
assessment.
2.3 Operational Test Designs and Blueprints
Since the beginning of the program, the goal of the NECAP has been to measure what students know
and are able to do by using a variety of test item types. The program was structured to use both common and
matrix-sampled items. (Common items are those taken by all students at a given grade level. Matrix-sampled
items comprise a pool that is divided among the multiple forms of the test at each grade level. Their purpose
is described in the next section.) This design provides reliable and valid results at the student level, and
breadth of coverage of a content area at the school results level while minimizing testing time. (Note: Only
common items count toward students’ scaled scores.)
Chapter 2—Development and Test Design 9 2008–09 NECAP Technical Report
2.3.1 Embedded Equating and Field Test Items
To ensure that NECAP scores obtained from different test forms and different years are equivalent to
each other, a set of equating items is matrixed across forms of the reading and mathematics tests. Chapter 5
presents more detail on the equating process. (Note: Equating items are not counted toward students’ scaled
scores.)
The NECAP also includes embedded field-test items in all content areas except grades 5 and 8
writing. Because the field-test items are taken by many students, the sample is sufficient to produce reliable
data from which to inform the process of selecting items for future tests. Embedding field-test items achieves
two other objectives. First, it creates a pool of replacement items in reading and mathematics that are needed
due to the release of common items each year. Second, embedding field-test items into the operational test
ensures that students take the items under operational conditions. (Note: As with the matrixed equating items,
field-test items are not counted toward students’ scaled scores.)
2.3.2 Test Booklet Design
To accommodate the embedded equating and field-test items in the 2008–09 NECAP, there were nine
unique test forms in grades 3 through 8 and eight unique forms in grade 11. In all reading and mathematics
test sessions, the equating and field-test items were distributed among the common items in a way that was
not evident to test takers. The grades 5 and 8 writing design called for one common test form that was made
up of a single writing prompt with three SA planning box items, four CR items, and ten MC items. The grade
11 writing design called for each student to respond to two writing prompts. The first writing prompt was
common for all students and the second writing prompt was either a matrix prompt or a field-test prompt,
depending on the particular test form.
2.4 Reading Test Designs
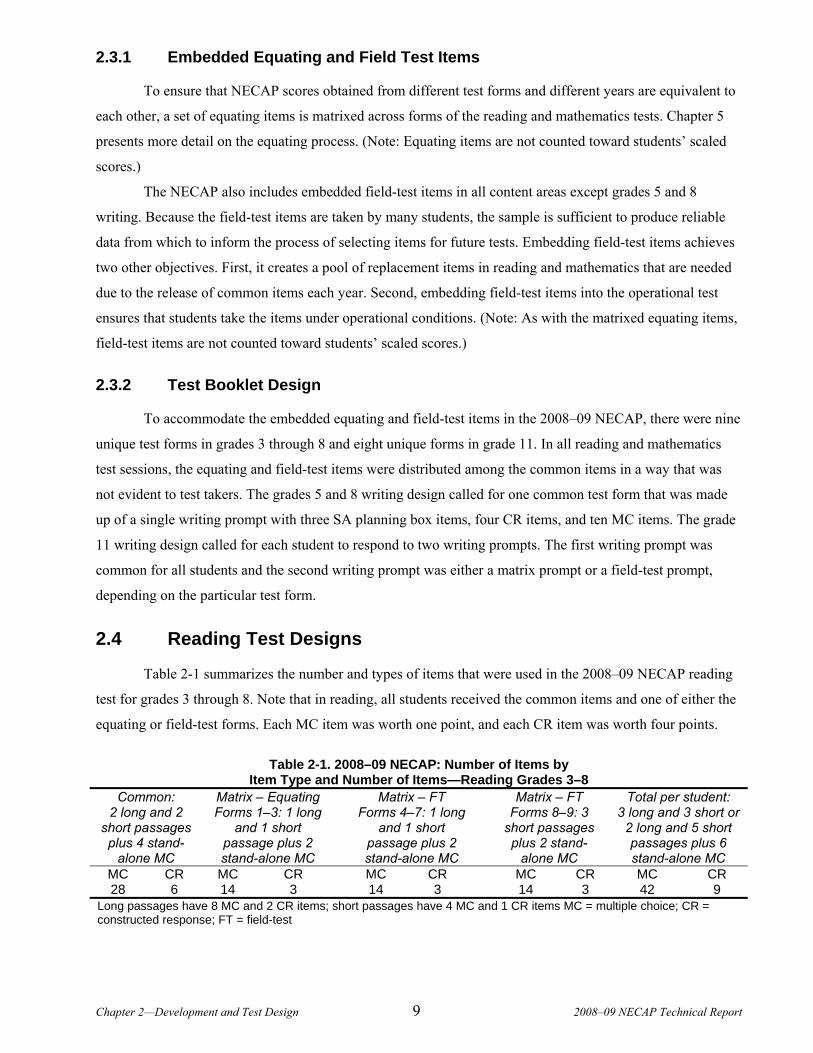
Table 2-1 summarizes the number and types of items that were used in the 2008–09 NECAP reading
test for grades 3 through 8. Note that in reading, all students received the common items and one of either the
equating or field-test forms. Each MC item was worth one point, and each CR item was worth four points.
Table 2-1. 2008–09 NECAP: Number of Items by Item Type and Number of Items—Reading Grades 3–8
Common: 2 long and 2
short passages plus 4 stand-
alone MC
Matrix – Equating Forms 1–3: 1 long
and 1 short passage plus 2 stand-alone MC
Matrix – FT Forms 4–7: 1 long
and 1 short passage plus 2 stand-alone MC
Matrix – FT Forms 8–9: 3
short passages plus 2 stand-
alone MC
Total per student: 3 long and 3 short or
2 long and 5 short passages plus 6 stand-alone MC
MC CR MC CR MC CR MC CR MC CR 28 6 14 3 14 3 14 3 42 9
Long passages have 8 MC and 2 CR items; short passages have 4 MC and 1 CR items MC = multiple choice; CR = constructed response; FT = field-test

Chapter 2—Development and Test Design 10 2008–09 NECAP Technical Report
Table 2-2 summarizes the numbers and types of items that were used in the 2008–09 NECAP reading
test for grade 11. Note that in reading, all students received the common items and one of either the equating
or field-test forms. Each MC item was worth one point, and each CR item was worth four points.
Table 2-2. Number of Items by Item Type and Number of Items—Reading Grade 11
Common: 2 long and 2 short
passages plus 4 stand-alone MC
Matrix – Equating Forms 1–2: 1 long and 1 short passage plus 2
stand-alone MC
Matrix – FT Forms 3–8: 1 long and 1 short passage
plus 2 stand-alone MC
Total per student 3 long and 3 short passages plus 6 stand-alone MC
MC CR MC CR MC CR MC CR 28 6 14 3 14 3 42 9
Long passages have 8 MC and 2 CR items; short passages have 4 MC and 1 CR items; MC = multiple choice; CR = constructed response; FT = field-test
2.4.1 Reading Blueprint
As indicated earlier, the test framework for reading in grades 3 through 8 was based on the NECAP
GLEs, and all items on the NECAP test were designed to measure a specific GLE. The test framework for
reading in grade 11 was based on the NECAP GSEs, and all items on the NECAP test were designed to
measure a specific GSE. The reading passages on all the NECAP tests are broken down into the following
categories:
Literary passages, representing a variety of forms: modern narratives; diary entries; drama;
poetry; biographies; essays; excerpts from novels; short stories; and traditional narratives, such as
fables, tall tales, myths, and folktales.
Informational passages/factual text, often dealing with areas of science and social studies. These
passages are taken from such sources as newspapers, magazines, and book excerpts.
Informational text could also be directions, manuals, recipes, etc. The passages are authentic texts
selected from grade level appropriate reading sources that students would be likely to encounter
in both classroom and independent reading. All passages are collected from published works.
Reading comprehension is assessed on the NECAP test by items that are dually-categorized by the
type of text and by the level of comprehension measured. The level of comprehension is designated as either
“Initial Understanding” or “Analysis and Interpretation.” Word identification and vocabulary skills are
assessed at each grade level primarily through MC items. The distribution of emphasis for reading is shown in
Table 2-3.
Chapter 2—Development and Test Design 11 2008–09 NECAP Technical Report
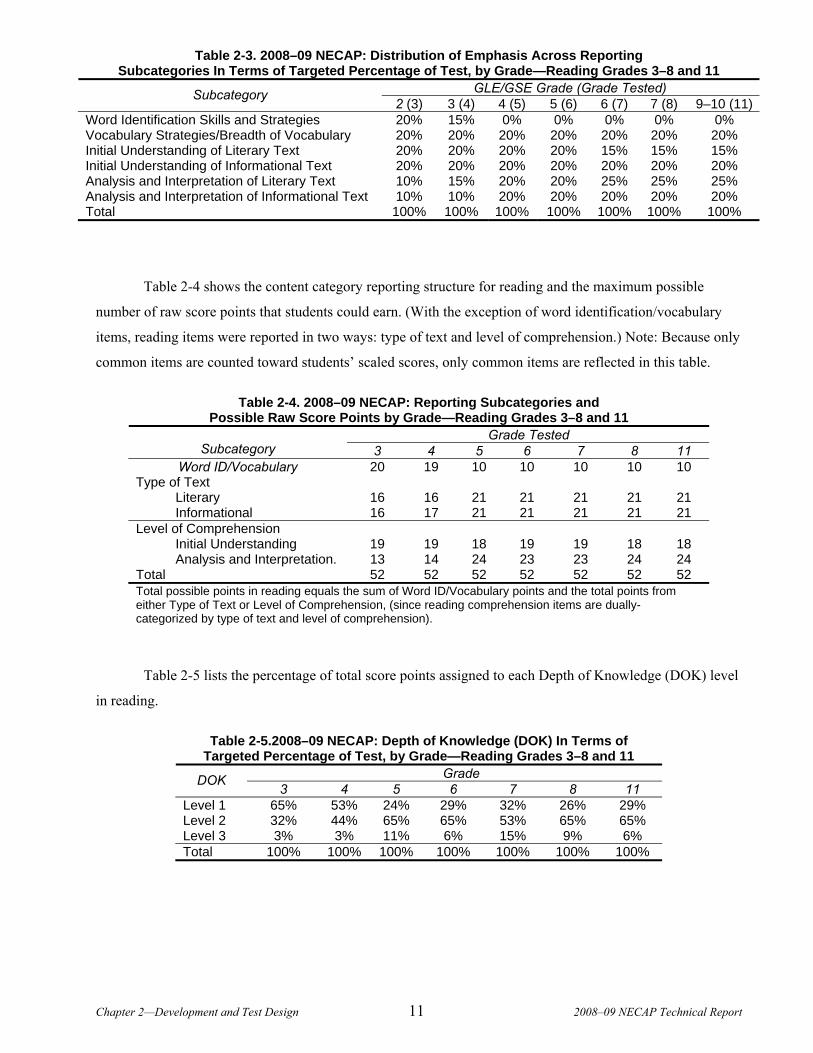
Table 2-3. 2008–09 NECAP: Distribution of Emphasis Across Reporting Subcategories In Terms of Targeted Percentage of Test, by Grade—Reading Grades 3–8 and 11
GLE/GSE Grade (Grade Tested) Subcategory 2 (3) 3 (4) 4 (5) 5 (6) 6 (7) 7 (8) 9–10 (11)
Word Identification Skills and Strategies 20% 15% 0% 0% 0% 0% 0% Vocabulary Strategies/Breadth of Vocabulary 20% 20% 20% 20% 20% 20% 20% Initial Understanding of Literary Text 20% 20% 20% 20% 15% 15% 15% Initial Understanding of Informational Text 20% 20% 20% 20% 20% 20% 20% Analysis and Interpretation of Literary Text 10% 15% 20% 20% 25% 25% 25% Analysis and Interpretation of Informational Text 10% 10% 20% 20% 20% 20% 20% Total 100% 100% 100% 100% 100% 100% 100%
Table 2-4 shows the content category reporting structure for reading and the maximum possible
number of raw score points that students could earn. (With the exception of word identification/vocabulary
items, reading items were reported in two ways: type of text and level of comprehension.) Note: Because only
common items are counted toward students’ scaled scores, only common items are reflected in this table.
Table 2-4. 2008–09 NECAP: Reporting Subcategories and Possible Raw Score Points by Grade—Reading Grades 3–8 and 11
Grade Tested Subcategory 3 4 5 6 7 8 11
Word ID/Vocabulary 20 19 10 10 10 10 10 Type of Text Literary 16 16 21 21 21 21 21 Informational 16 17 21 21 21 21 21 Level of Comprehension Initial Understanding 19 19 18 19 19 18 18 Analysis and Interpretation. 13 14 24 23 23 24 24 Total 52 52 52 52 52 52 52 Total possible points in reading equals the sum of Word ID/Vocabulary points and the total points from either Type of Text or Level of Comprehension, (since reading comprehension items are dually-categorized by type of text and level of comprehension).
Table 2-5 lists the percentage of total score points assigned to each Depth of Knowledge (DOK) level
in reading.
Table 2-5.2008–09 NECAP: Depth of Knowledge (DOK) In Terms of Targeted Percentage of Test, by Grade—Reading Grades 3–8 and 11
Grade DOK 3 4 5 6 7 8 11
Level 1 65% 53% 24% 29% 32% 26% 29% Level 2 32% 44% 65% 65% 53% 65% 65% Level 3 3% 3% 11% 6% 15% 9% 6% Total 100% 100% 100% 100% 100% 100% 100%
Chapter 2—Development and Test Design 12 2008–09 NECAP Technical Report
2.5 Mathematics Test Design
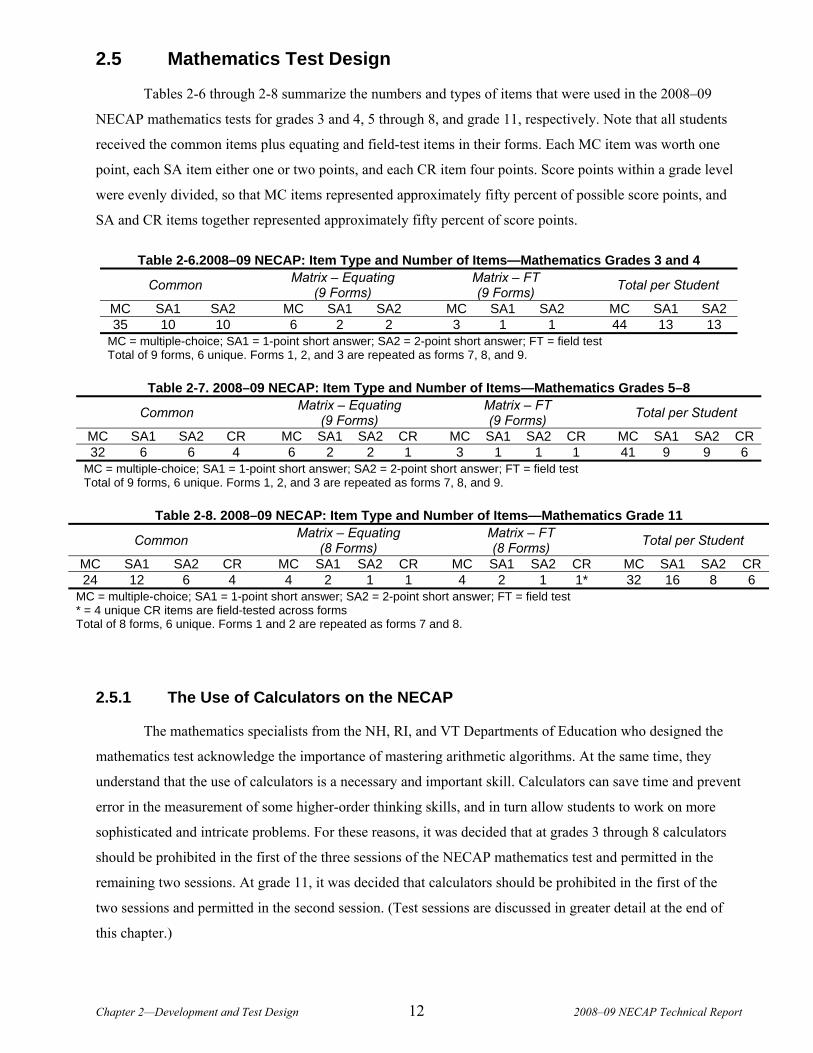
Tables 2-6 through 2-8 summarize the numbers and types of items that were used in the 2008–09
NECAP mathematics tests for grades 3 and 4, 5 through 8, and grade 11, respectively. Note that all students
received the common items plus equating and field-test items in their forms. Each MC item was worth one
point, each SA item either one or two points, and each CR item four points. Score points within a grade level
were evenly divided, so that MC items represented approximately fifty percent of possible score points, and
SA and CR items together represented approximately fifty percent of score points.
Table 2-6.2008–09 NECAP: Item Type and Number of Items—Mathematics Grades 3 and 4
Common Matrix – Equating (9 Forms) Matrix – FT
(9 Forms) Total per Student
MC SA1 SA2 MC SA1 SA2 MC SA1 SA2 MC SA1 SA2 35 10 10 6 2 2 3 1 1 44 13 13
MC = multiple-choice; SA1 = 1-point short answer; SA2 = 2-point short answer; FT = field test Total of 9 forms, 6 unique. Forms 1, 2, and 3 are repeated as forms 7, 8, and 9.
Table 2-7. 2008–09 NECAP: Item Type and Number of Items—Mathematics Grades 5–8
Common Matrix – Equating (9 Forms) Matrix – FT
(9 Forms) Total per Student
MC SA1 SA2 CR MC SA1 SA2 CR MC SA1 SA2 CR MC SA1 SA2 CR 32 6 6 4 6 2 2 1 3 1 1 1 41 9 9 6
MC = multiple-choice; SA1 = 1-point short answer; SA2 = 2-point short answer; FT = field test Total of 9 forms, 6 unique. Forms 1, 2, and 3 are repeated as forms 7, 8, and 9.
Table 2-8. 2008–09 NECAP: Item Type and Number of Items—Mathematics Grade 11
Common Matrix – Equating (8 Forms) Matrix – FT
(8 Forms) Total per Student
MC SA1 SA2 CR MC SA1 SA2 CR MC SA1 SA2 CR MC SA1 SA2 CR 24 12 6 4 4 2 1 1 4 2 1 1* 32 16 8 6
MC = multiple-choice; SA1 = 1-point short answer; SA2 = 2-point short answer; FT = field test * = 4 unique CR items are field-tested across forms Total of 8 forms, 6 unique. Forms 1 and 2 are repeated as forms 7 and 8.
2.5.1 The Use of Calculators on the NECAP
The mathematics specialists from the NH, RI, and VT Departments of Education who designed the
mathematics test acknowledge the importance of mastering arithmetic algorithms. At the same time, they
understand that the use of calculators is a necessary and important skill. Calculators can save time and prevent
error in the measurement of some higher-order thinking skills, and in turn allow students to work on more
sophisticated and intricate problems. For these reasons, it was decided that at grades 3 through 8 calculators
should be prohibited in the first of the three sessions of the NECAP mathematics test and permitted in the
remaining two sessions. At grade 11, it was decided that calculators should be prohibited in the first of the
two sessions and permitted in the second session. (Test sessions are discussed in greater detail at the end of
this chapter.)
Chapter 2—Development and Test Design 13 2008–09 NECAP Technical Report
2.5.2 Mathematics Blueprint
The test framework for mathematics at grades 3 through 8 was based on the NECAP GLEs, and all
items on the grades 3 through 8 NECAP tests were designed to measure a specific GLE. The test framework
for mathematics at grade 11 was based on the NECAP GSEs, and all items on the grade 11 NECAP test were
designed to measure a specific GSE. The mathematics items are organized into the four content strands as
follows:
Numbers and Operations: Students understand and demonstrate a sense of what numbers mean
and how they are used. Students understand and demonstrate computation skills.
Geometry and Measurement: Students understand and apply concepts from geometry. Students
understand and demonstrate measurement skills.
Functions and Algebra: Students understand that mathematics is the science of patterns,
relationships, and functions. Students understand and apply algebraic concepts.
Data, Statistics, and Probability: Students understand and apply concepts of data analysis.
Students understand and apply concepts of probability.
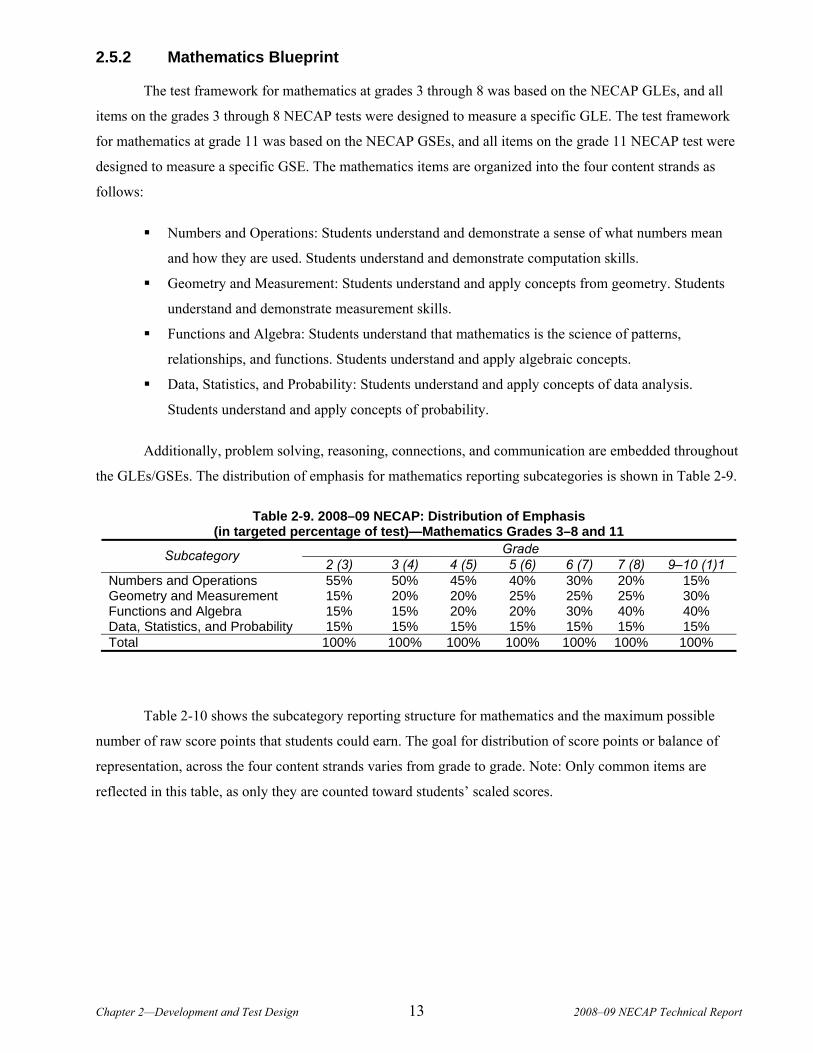
Additionally, problem solving, reasoning, connections, and communication are embedded throughout
the GLEs/GSEs. The distribution of emphasis for mathematics reporting subcategories is shown in Table 2-9.
Table 2-9. 2008–09 NECAP: Distribution of Emphasis (in targeted percentage of test)—Mathematics Grades 3–8 and 11
Grade Subcategory 2 (3) 3 (4) 4 (5) 5 (6) 6 (7) 7 (8) 9–10 (1)1
Numbers and Operations 55% 50% 45% 40% 30% 20% 15% Geometry and Measurement 15% 20% 20% 25% 25% 25% 30% Functions and Algebra 15% 15% 20% 20% 30% 40% 40% Data, Statistics, and Probability 15% 15% 15% 15% 15% 15% 15% Total 100% 100% 100% 100% 100% 100% 100%
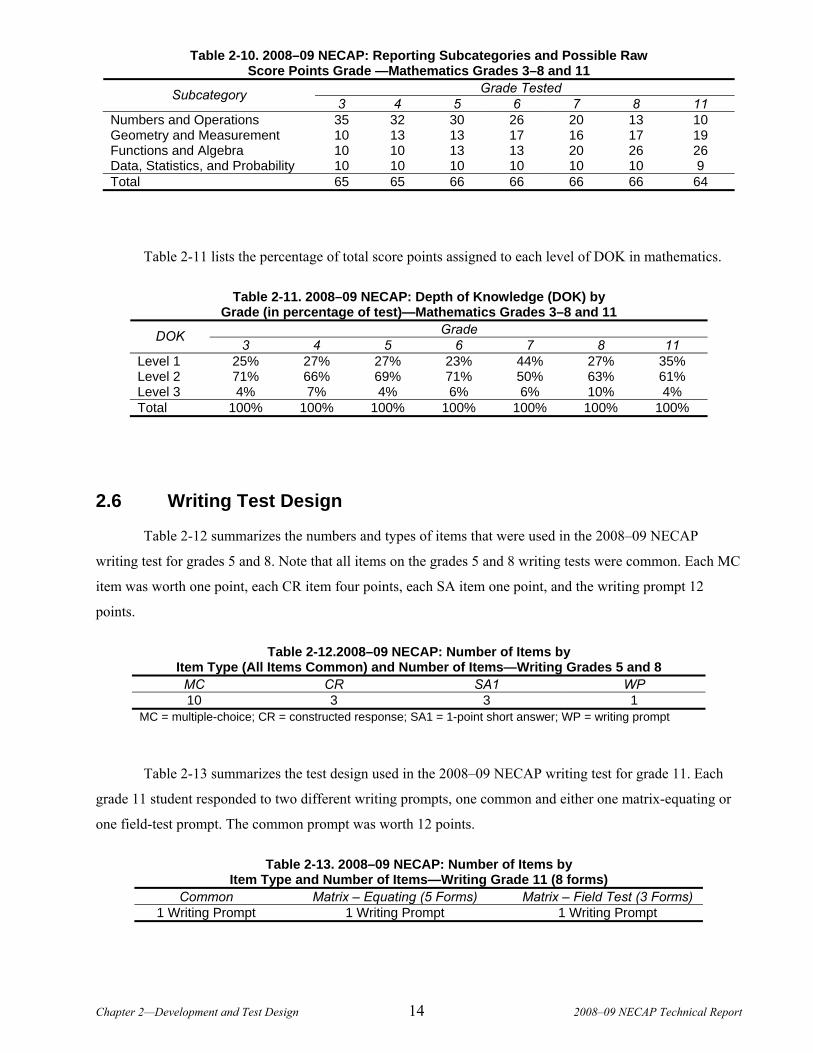
Table 2-10 shows the subcategory reporting structure for mathematics and the maximum possible
number of raw score points that students could earn. The goal for distribution of score points or balance of
representation, across the four content strands varies from grade to grade. Note: Only common items are
reflected in this table, as only they are counted toward students’ scaled scores.
Chapter 2—Development and Test Design 14 2008–09 NECAP Technical Report
Table 2-10. 2008–09 NECAP: Reporting Subcategories and Possible Raw Score Points Grade —Mathematics Grades 3–8 and 11
Grade Tested Subcategory 3 4 5 6 7 8 11
Numbers and Operations 35 32 30 26 20 13 10 Geometry and Measurement 10 13 13 17 16 17 19 Functions and Algebra 10 10 13 13 20 26 26 Data, Statistics, and Probability 10 10 10 10 10 10 9 Total 65 65 66 66 66 66 64
Table 2-11 lists the percentage of total score points assigned to each level of DOK in mathematics.
Table 2-11. 2008–09 NECAP: Depth of Knowledge (DOK) by Grade (in percentage of test)—Mathematics Grades 3–8 and 11
Grade DOK 3 4 5 6 7 8 11
Level 1 25% 27% 27% 23% 44% 27% 35% Level 2 71% 66% 69% 71% 50% 63% 61% Level 3 4% 7% 4% 6% 6% 10% 4% Total 100% 100% 100% 100% 100% 100% 100%
2.6 Writing Test Design
Table 2-12 summarizes the numbers and types of items that were used in the 2008–09 NECAP
writing test for grades 5 and 8. Note that all items on the grades 5 and 8 writing tests were common. Each MC
item was worth one point, each CR item four points, each SA item one point, and the writing prompt 12
points.
Table 2-12.2008–09 NECAP: Number of Items by Item Type (All Items Common) and Number of Items—Writing Grades 5 and 8
MC CR SA1 WP 10 3 3 1
MC = multiple-choice; CR = constructed response; SA1 = 1-point short answer; WP = writing prompt
Table 2-13 summarizes the test design used in the 2008–09 NECAP writing test for grade 11. Each
grade 11 student responded to two different writing prompts, one common and either one matrix-equating or
one field-test prompt. The common prompt was worth 12 points.
Table 2-13. 2008–09 NECAP: Number of Items by Item Type and Number of Items—Writing Grade 11 (8 forms)
Common Matrix – Equating (5 Forms) Matrix – Field Test (3 Forms) 1 Writing Prompt 1 Writing Prompt 1 Writing Prompt
Chapter 2—Development and Test Design 15 2008–09 NECAP Technical Report
2.6.1 Writing Blueprint: Grades 5 and 8
The test framework for grades 5 and 8 writing was based on the NECAP Grade-Level Expectations
(GLEs), and all items on the NECAP test were designed to measure a specific GLE. The content standards for
grades 5 and 8 writing identify four major genres that are assessed in the writing portion of the NECAP test
each year.
Writing in response to literary text
Writing in response to informational text
Narratives
Informational writing (report/procedure text for grade 5 and persuasive essay for grade 8)
The writing prompt and the three CR items each address a different genre. In addition, structures of
language and writing conventions are assessed through MC items and throughout the student-writing test. The
prompts and CR items were developed with the following criteria as guidelines:
the prompts must be interesting to students
the prompts must be accessible to all students (i.e., all students would have something to say
about the topic)
the prompts must generate sufficient text to be effectively scored
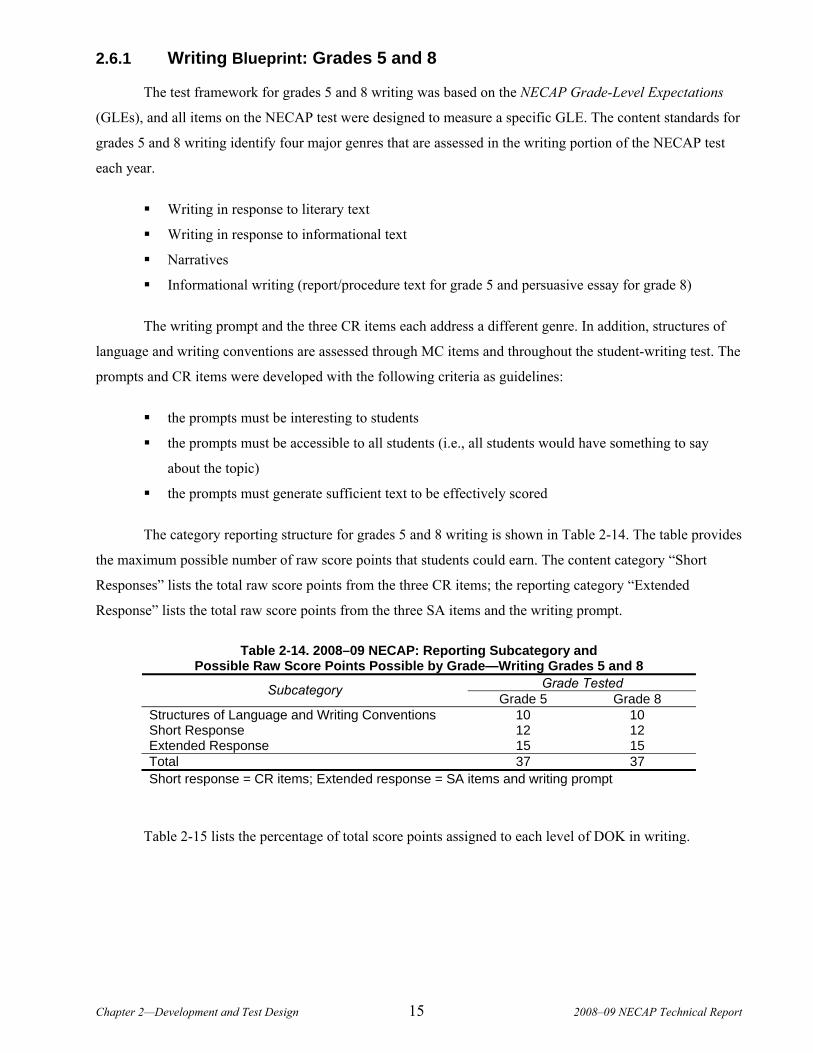
The category reporting structure for grades 5 and 8 writing is shown in Table 2-14. The table provides
the maximum possible number of raw score points that students could earn. The content category “Short
Responses” lists the total raw score points from the three CR items; the reporting category “Extended
Response” lists the total raw score points from the three SA items and the writing prompt.
Table 2-14. 2008–09 NECAP: Reporting Subcategory and Possible Raw Score Points Possible by Grade—Writing Grades 5 and 8
Grade Tested Subcategory Grade 5 Grade 8 Structures of Language and Writing Conventions 10 10 Short Response 12 12 Extended Response 15 15 Total 37 37 Short response = CR items; Extended response = SA items and writing prompt
Table 2-15 lists the percentage of total score points assigned to each level of DOK in writing.

Chapter 2—Development and Test Design 16 2008–09 NECAP Technical Report
Table 2-15. 2008–09 NECAP: Depth of Knowledge (DOK) by Grade (in percentage of test)—Writing Grades 5 and 8
Grade Tested DOK Grade 5 Grade 8
Level 1 35% 47% Level 2 41% 29% Level 3 24% 24% Total 100% 100%
2.6.2 Writing Blueprint: Grade 11
The test framework for grade 11 writing was based on the NECAP GSEs, and all items on the
NECAP test were designed to measure a specific GSE. The content standards for grade 11 writing identify six
genres that are grouped into three major strands:
Writing in response to text (literary and informational)
Informational writing (report, procedure, and persuasive essay)
Expressive writing (reflective essay)
The writing prompts (common, matrix equating, and field test) in combination, address each of the
different genres. The prompts were developed using the following criteria as guidelines:
the prompt must be interesting to students
the prompt must be accessible to all students (i.e., all students would have something to write
about the topic)
the prompt must generate sufficient text to be effectively scored
There is only one reporting category, “Extended Response,” for grade 11 writing, as shown in Table
2-16.
Table 2-16. 2008–09 NECAP: Reporting Subcategories and Possible Raw Score Points—Writing Grade 11
Subcategory Grade 11 Extended Response 12
Total 12
Table 2-17 lists the percentage of total score points assigned to each level of DOK in writing.
Chapter 2—Development and Test Design 17 2008–09 NECAP Technical Report
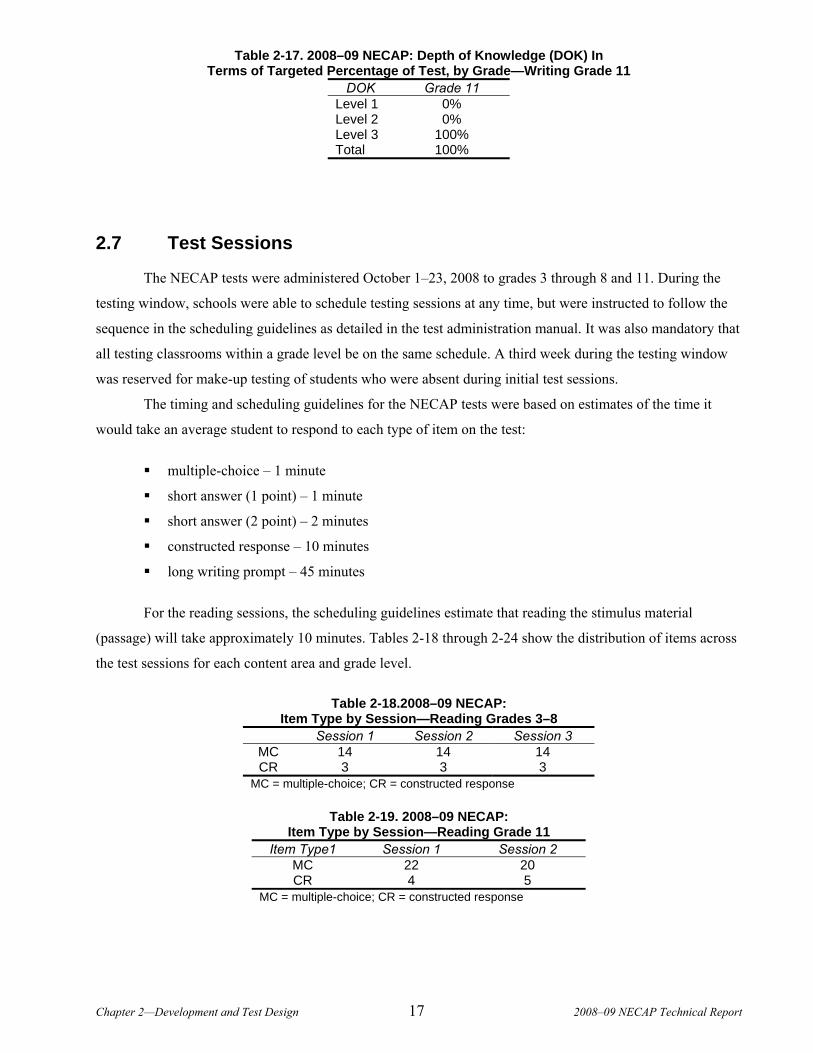
Table 2-17. 2008–09 NECAP: Depth of Knowledge (DOK) In Terms of Targeted Percentage of Test, by Grade—Writing Grade 11
DOK Grade 11 Level 1 0% Level 2 0% Level 3 100% Total 100%
2.7 Test Sessions
The NECAP tests were administered October 1–23, 2008 to grades 3 through 8 and 11. During the
testing window, schools were able to schedule testing sessions at any time, but were instructed to follow the
sequence in the scheduling guidelines as detailed in the test administration manual. It was also mandatory that
all testing classrooms within a grade level be on the same schedule. A third week during the testing window
was reserved for make-up testing of students who were absent during initial test sessions.
The timing and scheduling guidelines for the NECAP tests were based on estimates of the time it
would take an average student to respond to each type of item on the test:
multiple-choice – 1 minute
short answer (1 point) – 1 minute
short answer (2 point) – 2 minutes
constructed response – 10 minutes
long writing prompt – 45 minutes
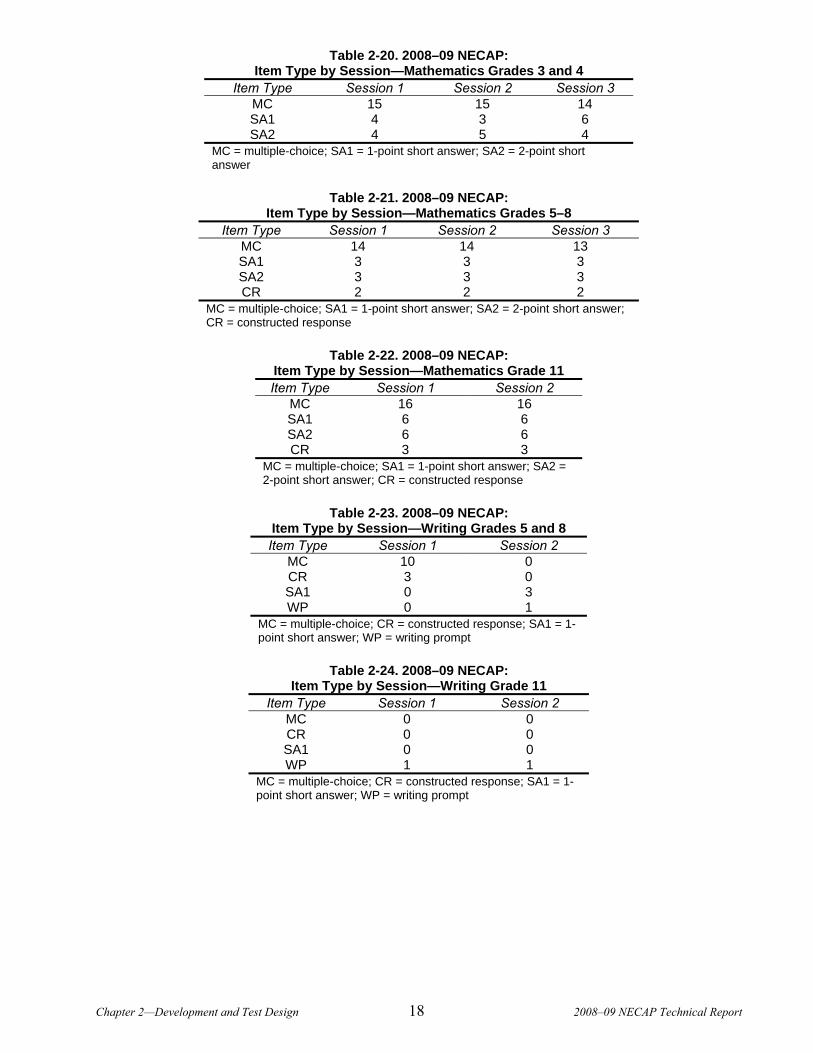
For the reading sessions, the scheduling guidelines estimate that reading the stimulus material
(passage) will take approximately 10 minutes. Tables 2-18 through 2-24 show the distribution of items across
the test sessions for each content area and grade level.
Table 2-18.2008–09 NECAP: Item Type by Session—Reading Grades 3–8
Session 1 Session 2 Session 3 MC 14 14 14 CR 3 3 3
MC = multiple-choice; CR = constructed response
Table 2-19. 2008–09 NECAP: Item Type by Session—Reading Grade 11
Item Type1 Session 1 Session 2 MC 22 20 CR 4 5
MC = multiple-choice; CR = constructed response
Chapter 2—Development and Test Design 18 2008–09 NECAP Technical Report
Table 2-20. 2008–09 NECAP: Item Type by Session—Mathematics Grades 3 and 4
Item Type Session 1 Session 2 Session 3 MC 15 15 14 SA1 4 3 6 SA2 4 5 4
MC = multiple-choice; SA1 = 1-point short answer; SA2 = 2-point short answer
Table 2-21. 2008–09 NECAP:
Item Type by Session—Mathematics Grades 5–8 Item Type Session 1 Session 2 Session 3
MC 14 14 13 SA1 3 3 3 SA2 3 3 3 CR 2 2 2
MC = multiple-choice; SA1 = 1-point short answer; SA2 = 2-point short answer; CR = constructed response
Table 2-22. 2008–09 NECAP:
Item Type by Session—Mathematics Grade 11 Item Type Session 1 Session 2
MC 16 16 SA1 6 6 SA2 6 6 CR 3 3
MC = multiple-choice; SA1 = 1-point short answer; SA2 = 2-point short answer; CR = constructed response
Table 2-23. 2008–09 NECAP:
Item Type by Session—Writing Grades 5 and 8 Item Type Session 1 Session 2
MC 10 0 CR 3 0 SA1 0 3 WP 0 1
MC = multiple-choice; CR = constructed response; SA1 = 1-point short answer; WP = writing prompt
Table 2-24. 2008–09 NECAP:
Item Type by Session—Writing Grade 11 Item Type Session 1 Session 2
MC 0 0 CR 0 0 SA1 0 0 WP 1 1
MC = multiple-choice; CR = constructed response; SA1 = 1-point short answer; WP = writing prompt

Chapter 2—Development and Test Design 19 2008–09 NECAP Technical Report
Although the scheduling guidelines are based on the assumption that most students will complete the
test within the estimated time, each test session allowed additional time for students who may have needed it.
Up to one-hundred percent additional time was allocated for each session (i.e., a 50-minute session could be
extended by an additional 50 minutes).
If classroom space was not available for students who required additional time to complete the tests,
schools were allowed to consider using another space for this purpose, such as a guidance office. If additional
areas were not available, it was recommended that each classroom used for test administration be scheduled
for the maximum amount of time. Detailed instructions regarding test administration and scheduling were
provided in the test coordinators’ and administrators’ manuals.

Chapter 3—Test Administration 21 2008–09 NECAP Technical Report
Chapter 3. TEST ADMINISTRATION
3.1 Responsibility for Administration
The 2008 NECAP Principal/Test Coordinator Manual indicated that principals and/or their
designated NECAP test coordinator were responsible for the proper administration of the NECAP. Uniformity
of administration procedures from school to school was ensured by using manuals that contained explicit
directions and scripts to be read aloud to students by test administrators.
3.2 Administration Procedures
Principals and/or the schools’ designated NECAP test coordinator were instructed to read the
Principal/Test Coordinator Manual before testing and to be familiar with the instructions provided in the Test
Administrator Manual. The Principal/Test Coordinator Manuals included a section highlighting aspects of
test administration that were new for the year and checklists to help prepare for testing. The checklists
outlined tasks to be performed by school staff before, during, and after test administration. In addition to these
checklists, the Principal/Test Coordinator Manuals described the testing material sent to each school, how to
inventory it, track it during administration, and return it after testing was complete. The Test Administrator
Manual included checklists for the administrators to use to prepare themselves, their classrooms, and the
students for the administration of the test. The Test Administrator Manual contained sections that detailed the
procedures to be followed for each test session and instructions for preparing the material before the
principal/test coordinator would return it to Measured Progress.
3.3 Participation Requirements and Documentation
The Department of Education’s intent is for all students in grades 3 though 8 and 11 to participate in
the NECAP through standard administration, administration with accommodations, or alternate assessment.
Furthermore, any student who is absent during any session of the NECAP is expected to take a make-up test
within the three-week testing window.
Schools were required to return a student answer booklet for every enrolled student in the grade level,
with the exception of students who took an alternate assessment in the 2007–08 school year and therefore
were not required participating in the NECAP in 2008–09. On those occasions when it was deemed
impossible to test a particular student, school personnel were required to inform their Department of
Education. A grid was included on the student answer booklets that listed the approved reasons why a booklet
could be returned blank for one or more sessions of the test:
Student is new to the United States after October 1, 2007 and is LEP (reading and writing only)

Chapter 3—Test Administration 22 2008–09 NECAP Technical Report
First-year LEP students who took the ACCESS test of English language proficiency, as
scheduled in their states, were not required to take the reading and writing tests in 2008–09.
However, these students were required to take the mathematics test in 2008–09.
Student withdrew from school after October 1, 2008
If a student withdrew after October 1, 2008 but before completing all of the test sessions,
school personnel were instructed to code this reason on the student’s answer booklet.
Student enrolled in school after October 1, 2008
If a student enrolled after October 1, 2008 and was unable to complete all of the test sessions
before the end of the test administration window, school personnel were instructed to code
this reason on the student’s answer booklet.
State-approved special consideration
Each state Department of Education had a process for documenting and approving
circumstances that made it impossible or not advisable for a student to participate in testing.
Student was enrolled in school on October 1, 2008 and did not complete test for reasons other
than those listed above
If a student was not tested for a reason other than those stated above, school personnel were
instructed to code this reason on the student’s answer booklet. These “Other” categories were
considered “not state-approved.”
Tables 3-1, 3-2, and 3-3 list the participation rates of the three states combined in reading,
mathematics, and writing.

Chapter 3—Test Administration 23 2008–09 NECAP Technical Report
Table 3-1. 2008–09 NECAP: Participation Rates—Reading
Category Description Enrollment Not Tested State-Approved
Not Tested Other
Number Tested
Percent Tested
All All Students 231,012 3,136 2,352 225,524 98 Male 119,552 1,913 1,455 116,184 97 Female 111,425 1,220 896 109,309 98 Gender Not Reported 35 3 1 31 89 Am. Indian 1,006 20 24 962 96 Asian 5,480 156 77 5,247 96 Black 9,745 237 155 9,353 96 Hispanic 18,197 482 250 17,465 96 NHPI 97 4 2 91 94 White 195,395 2,205 1,807 191,383 98
Ethnicity
Not Reported 1,092 32 37 1,023 94 Current 5,898 533 156 5,209 88 Monitoring Year 1 1,089 4 4 1,081 99 Monitoring Year 2 1,198 2 8 1,188 99 LEP
Other 222,827 2,597 2,184 218,046 98 IEP 37,426 2,200 907 34,319 92 IEP Other 193,586 936 1,445 191,205 99 SES 66,593 1,335 912 64,346 97 SES Other 164,419 1,801 1,440 161,178 98 Migrant 86 2 2 82 95 Migrant Other 230,926 3,134 2,350 225,442 98 Title 1 34,210 651 247 33,312 97 Title 1 Other 196,802 2,485 2,105 192,212 98 Plan 504 1,232 6 6 1,220 99 Plan 504 Other 229,780 3,130 2,346 224,304 98
Table 3-2. 2008–09 NECAP: Participation Rates—Mathematics
Category Description Enrollment Not Tested State-Approved
Not Tested Other
Number Tested
Percent Tested
All All Students 231,012 2,673 2,431 225,908 98 Male 119,552 1,655 1,519 116,378 97 Female 111,425 1,016 911 109,498 98 Gender Not Reported 35 2 1 32 91 Am. Indian 1,006 20 26 960 95 Asian 5,480 56 59 5,365 98 Black 9,745 153 156 9,436 97 Hispanic 18,197 223 231 17,743 98 NHPI 97 2 2 93 96 White 195,395 2,197 1,919 191,279 98
Ethnicity
Not Reported 1,092 22 38 1,032 95 Current 5,898 49 93 5,756 98 Monitoring Year 1 1,089 3 4 1,082 99 Monitoring Year 2 1,198 3 9 1,186 99 LEP
Other 222,827 2,618 2,325 217,884 98 IEP 37,426 2,212 994 34,220 91 IEP Other 193,586 461 1,437 191,688 99 SES 66,593 1,114 942 64,537 97 SES Other 164,419 1,559 1,489 161,371 98 Migrant 86 2 2 82 95 Migrant Other 230,926 2,671 2,429 225,826 98 Title 1 31,812 391 245 31,176 98 Title 1 Other 199,200 2,282 2,186 194,732 98 Plan 504 1,232 6 5 1221 99 Plan 504 Other 229,780 2,667 2,426 224,687 98

Chapter 3—Test Administration 24 2008–09 NECAP Technical Report
Table 3-3. 2008–09 NECAP: Participation Rates—Writing
Category Description Enrollment Not Tested State-Approved
Not Tested Other
Number Tested
Percent Tested
All All Students 102,467 1,344 1,979 99,144 97 Male 52,516 805 1,268 50,443 96 Female 49,932 539 710 48,683 97 Gender Not Reported 19 0 1 18 95 Am. Indian 452 9 22 421 93 Asian 2,256 64 54 2,138 95 Black 4,214 93 122 3,999 95 Hispanic 7,781 181 195 7,405 95 NHPI 46 0 2 44 96 White 87,278 983 1,555 84,740 97
Ethnicity
Not Reported 440 14 29 397 90 Current 2,078 191 98 1,789 86 Monitoring Year 1 400 2 4 394 99 Monitoring Year 2 510 1 4 505 99 LEP
Other 99,479 1,150 1,873 96,456 97 IEP 16,881 925 774 15,182 90 IEP Other 85,586 419 1,205 83,962 98 SES 27,345 585 745 26,015 95 SES Other 75,122 759 1,234 73,129 97 Migrant 24 1 1 22 92 Migrant Other 102,443 1,343 1,978 99,122 97 Title 1 12,246 242 184 11,820 97 Title 1 Other 90,221 1,102 1,795 87,324 97 Plan 504 627 5 3 619 99 Plan 504 Other 101,840 1,339 1,976 98,525 97
3.4 Administrator Training
In addition to distributing the Principal/Test Coordinator Manual and Test Administrator Manual, the
NH, RI, and VT Departments of Education, along with Measured Progress, conducted test administration
workshops in regional locations in each state to inform school personnel about the NECAP and to provide
training on the policies and procedures regarding administration of the tests. RI and VT reduced the number
of workshops conducted in each state, but produced a CD of the workshop PowerPoint presentation with
audio, which was produced and sent to each school in these states to use for additional training.
3.5 Documentation of Accommodations
The Principal/Test Coordinator Manual and Test Administrator Manual provided directions for
coding information related to accommodations and modifications on page 2 of the student answer booklet. All
accommodations used during any test session were required to be coded by authorized school personnel—not
students—after testing was completed.
An Accommodations, Guidelines, and Procedures: Administrator Training Guide was also produced
to provide detailed information on planning and implementing accommodations. This guide was available on
each state’s Department of Education Web site. The states collectively made the decision that

Chapter 3—Test Administration 25 2008–09 NECAP Technical Report
accommodations be made available to all students based on individual need regardless of disability status.
Decisions regarding accommodations were to be made by the students’ educational team on an individual
basis and were to be consistent with those used during the students’ regular classroom instruction. Making
accommodations decisions for a group rather than on an individual basis was not permitted. If the decision
made by a student’s educational team required an accommodation not listed in the state-approved Table of
Standard Test Accommodations, schools were instructed to contact the Department of Education in advance
of testing for specific instructions for coding in the “Other Accommodations (E)” and/or “Modifications (F)”
sections.
Appendix B shows the accommodation frequencies by content area for the October 2008 NECAP test
administration. The accommodation codes are defined in the Table of Standard Test Accommodations, which
can be found in Appendix C. Information on the appropriateness and impact of accommodations may be
found in Appendix D.
3.6 Test Security
Maintaining test security is critical to the success of the NECAP and the continued partnership among
the three states. The Principal/Test Coordinator Manual and the Test Administrator Manuals explain in detail
all test security measures and test administration procedures. School personnel were informed that any
concerns about breaches in test security were to be reported to the school’s test coordinator and/or principal
immediately. The test coordinator and/or principal were responsible for immediately reporting the concern to
the District Superintendent and the State Assessment Director at the Department of Education. Test security
was also strongly emphasized at test administration workshops that were conducted in all three states. The
three states also required principals to log on to a secure Web site to complete the Principal’s Certification of
Proper Test Administration form for each grade level tested at their school. Principals were requested to
provide the number of secure tests received from Measured Progress, the number of tests administered to
students, and the number of secure test materials that they were returning to Measured Progress. Principals
were instructed to submit the form by entering a unique password, which acted as their digital signature. By
signing and submitting the form, the principal was certifying that the tests were administered according to the
test administration procedures outlined in the Principal/Test Coordinator Manual and Test Administrator
Manual, that the security of the tests was maintained, that no secure material was duplicated or in any way
retained in the school, and that all test materials had been accounted for and returned to Measured Progress.
3.7 Test and Administration Irregularities
During test administration, a printing error was discovered in some of the grade 3 and grade 11
NECAP test booklets. These booklets were produced by two different print vendors. The printing
irregularities for grade 3 were not the same across booklets and occurred mainly in forms 3 and 7. The most
common errors included pages inserted upside down or pages 3–10 missing from a booklet. The print vendor
Chapter 3—Test Administration 26 2008–09 NECAP Technical Report
determined that the errors occurred while the binding machine was being loaded: page was either loaded
incorrectly or upside down. (Cameras are in place to check for specific images from a page, and the machine
stops if the correct image is not captured three times in a row. An operator is then tasked with finding the
error and pulling the incorrect booklets.) The vendor believes this was an isolated incident due to human
error.
The grade 11 printing error occurred only in form 7 and only five defective booklets were reported.
The booklets were missing pages 17–24, and pages 25–40 were repeated. The print vendor determined that an
operator loaded an incorrect group of pages into one of the pockets in the binding machine. A camera checks
for correct pages in each booklet as binding takes place. When a problem is detected, the machine shuts down,
the operator removes the incorrect booklets and inspects the booklets immediately ahead on the production
line. The vendor believes the incorrect booklets were missed by the operator while correcting the problem.
During login, printing errors were found and reported in seven grade 3 booklets and five grade 11
booklets, either by schools or by Measured Progress. All affected schools either replaced the defective test
booklets with extra test booklets they already had available or Measured Progress immediately sent new test
booklets to the school when an error was reported. NECAP reports were not affected by these irregularities.
Before the test administration window began but after test forms were printed and shipped to schools,
an error was discovered in forms 3 and 4 of the grade 5 test booklets. During item selection by test developers
and the test form production process, a mistake was made in the slotting of item types into each form. Form 3
was constructed with items 19 and 20 both as SA2 items (2-point short-answer items), and form 4 was
constructed with items 19 and 20 as CR items (4-point constructed-response items). There should have been
one of each item type in each form. The scannable answer booklets were designed as such. In form 3, there
was sufficient space to answer the SA2 items. But in form 4, the short-answer item space in position 19 was
insufficient to answer the CR item put errantly in that position. (It should be noted that the CR item was a
matrix item and not used for computing student scores.)
On September 29th, Measured Progress sent both a letter and revised administration instructions to all
schools with grade 5 students informing them of the error in the grade 5 form 4 test booklets. Test
administrators were asked to find all form 4 booklets and place an X over item 19 and the corresponding
answer space. Administrators were asked to follow a script alerting students with form 4 tests that they would
find item 19 had been crossed out in their booklets. They were told that there was not enough room for them
to answer the question and they should skip it. Otherwise, administrators were advised to continue with the
test session as outlined in the Test Administrator Manual. No student scores or reports were affected by this
error.
3.8 Test Administration Window
The test administration window was October 1–23, 2008.

Chapter 3—Test Administration 27 2008–09 NECAP Technical Report
3.9 NECAP Service Center
To provide additional support to schools before, during, and after testing, Measured Progress
established the NECAP Service Center. The support of the Service Center is essential to the successful
administration of any statewide test program. It provides a centralized location to which individuals in the
field can call using a toll-free number to ask specific questions or report any problems they may be
experiencing. Representatives are responsible for receiving, responding to and tracking calls, then routing
issues to the appropriate person(s) for resolution. All calls are logged into a database which includes notes
regarding the issue and resolution of each call.
The Service Center was staffed year-round by representatives depending upon need and call volume,
and available from 8:00 AM to 4:00 PM. Extra representatives were available beginning two weeks before the
start of testing and ending two weeks after testing.

Chapter 4—Scoring 29 2008–09 NECAP Technical Report
Chapter 4. SCORING
4.1 Scoring of Standard Test Items
Upon receipt of used NECAP answer booklets following testing, Measured Progress scanned all
student responses, along with student identification and demographic information. Imaged data for multiple-
choice responses were machine-scored. Images of open-response items were processed and organized by
iScore, a secure, server-to-server electronic scoring software designed by Measured Progress, for hand-
scoring.
Student responses that could not be physically scanned (e.g., answer documents damaged during
shipping), and typed responses submitted according to applicable test accommodations, were physically
reviewed and scored on an individual basis by trained, qualified readers. These scores were linked to the
student’s demographic data and merged with the student’s scoring file by Measured Progress’s data
processing department.
4.1.1 Machine-Scored Items
MC item responses were compared to scoring keys using item analysis software. Correct answers
were assigned a score of one point and incorrect answers were assigned zero points. Student responses with
multiple marks and blank responses were also assigned zero points.
The hardware elements of the scanners monitor themselves continuously for correct read, and the
software that drives these scanners also monitors correct data reads. Standard checks include recognition of a
sheet that does not belong, is upside down, or is backwards and identification of critical data that are missing
(e.g., a student ID number), test forms that are out of range or missing, and page or document sequence errors.
When a problem is detected, the scanner stops and displays an error message directing the operator to
investigate and to correct the situation.
4.1.2 Hand-Scored Items
The images of student responses to CR items were hand-scored through the iScore system. Use of
iScore minimizes the need for readers to physically handle answer booklets and related scoring materials.
Student confidentiality was easily maintained, since all NECAP scoring was “blind” (i.e., district, school, and
student names were not visible to readers) the iScore system maintained the linkage between the student
response images and their associated test booklet numbers.
Through iScore, qualified readers at computer terminals accessed electronically scanned images of
student responses. Readers evaluated each response and recorded each score via keypad or mouse entry
through the iScore system. When a reader finished one response, the next response appeared immediately on
the computer screen.
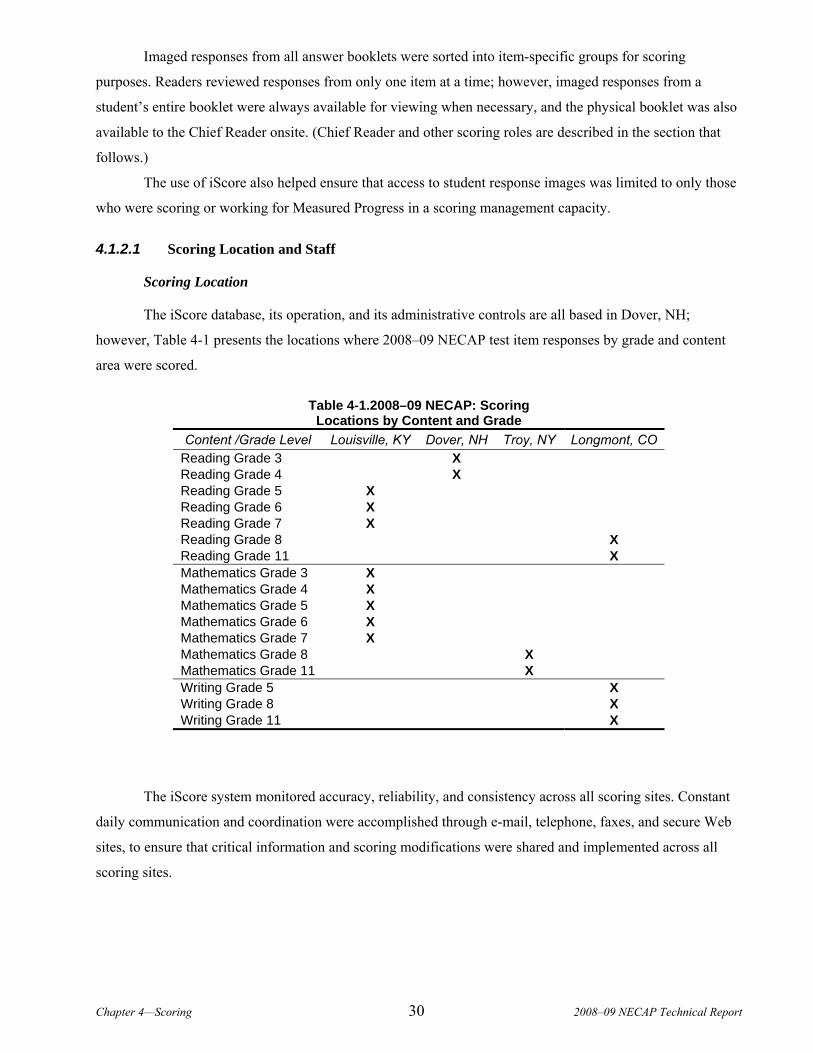
Chapter 4—Scoring 30 2008–09 NECAP Technical Report
Imaged responses from all answer booklets were sorted into item-specific groups for scoring
purposes. Readers reviewed responses from only one item at a time; however, imaged responses from a
student’s entire booklet were always available for viewing when necessary, and the physical booklet was also
available to the Chief Reader onsite. (Chief Reader and other scoring roles are described in the section that
follows.)
The use of iScore also helped ensure that access to student response images was limited to only those
who were scoring or working for Measured Progress in a scoring management capacity.
4.1.2.1 Scoring Location and Staff
Scoring Location
The iScore database, its operation, and its administrative controls are all based in Dover, NH;
however, Table 4-1 presents the locations where 2008–09 NECAP test item responses by grade and content
area were scored.
Table 4-1.2008–09 NECAP: Scoring Locations by Content and Grade
Content /Grade Level Louisville, KY Dover, NH Troy, NY Longmont, CO Reading Grade 3 X Reading Grade 4 X Reading Grade 5 X Reading Grade 6 X Reading Grade 7 X Reading Grade 8 X Reading Grade 11 X Mathematics Grade 3 X Mathematics Grade 4 X Mathematics Grade 5 X Mathematics Grade 6 X Mathematics Grade 7 X Mathematics Grade 8 X Mathematics Grade 11 X Writing Grade 5 X Writing Grade 8 X Writing Grade 11 X
The iScore system monitored accuracy, reliability, and consistency across all scoring sites. Constant
daily communication and coordination were accomplished through e-mail, telephone, faxes, and secure Web
sites, to ensure that critical information and scoring modifications were shared and implemented across all
scoring sites.
Chapter 4—Scoring 31 2008–09 NECAP Technical Report
Staff Positions
The following staff members were involved with scoring the 2008–09 NECAP responses:
The NECAP Scoring Project Manager, an employee of Measured Progress, was located in Dover,
NH and oversaw communication and coordination of scoring across all scoring sites.
The iScore Operational Manager and iScore administrators, employees of Measured Progress,
were located in Dover, NH and coordinated technical communication across all scoring sites.
A Chief Reader (CR) in each content area (mathematics, reading, and writing) ensured
consistency of scoring across all scoring sites for all grades tested in that content area. CRs also
provided read-behind activities (defined in a later section) for Quality Assurance Coordinators.
CRs are employees of Measured Progress.
Numerous Quality Assurance Coordinators (QACs), selected from a pool of experienced Senior
Readers for their ability to score accurately and their ability to instruct and train readers,
participated in benchmarking activities for each specific grade and content area. QACs provided
read-behind activities (defined in a later section) for Senior Readers at their sites. The ratio of
QACs and Senior Readers to Readers was approximately 1:11.
Numerous Senior Readers (SRs) selected from a pool of skilled and experienced Readers,
provided read-behind activities (defined in a later section) for the Readers at their scoring tables
(2–12 Readers at each table). The ratio of QACs and SRs to Readers was approximately 1:11.
Readers at scoring sites scored operational and field-test NECAP 2008–09 student responses.
Recruitment of Readers is described in Section 4.1.2.3.
4.1.2.2 Benchmarking Meetings with the NECAP State Specialists
In preparation for implementing NECAP scoring guidelines, Measured Progress scoring staff
prepared and facilitated benchmarking meetings held with NECAP state specialists from their respective
departments of education. The purpose of these meetings was to establish guidelines for scoring NECAP
items during the current field-test scoring session and for future operational scoring sessions.
Several dozen student responses for each item were selected that CRs identified as illustrative mid-
range examples of the respective score points. CRs presented these responses to the NECAP content
specialists during benchmarking meetings and worked collaboratively with them to finalize an authoritative
set of score-point exemplars for each field-test item. As a matter of practice, these sets are included in the
scoring training materials each time an item is administered.
This repeated use of NECAP-approved sets of mid-range score point exemplars helps ensure that
Readers follow established guidelines each time a particular NECAP item is scored.
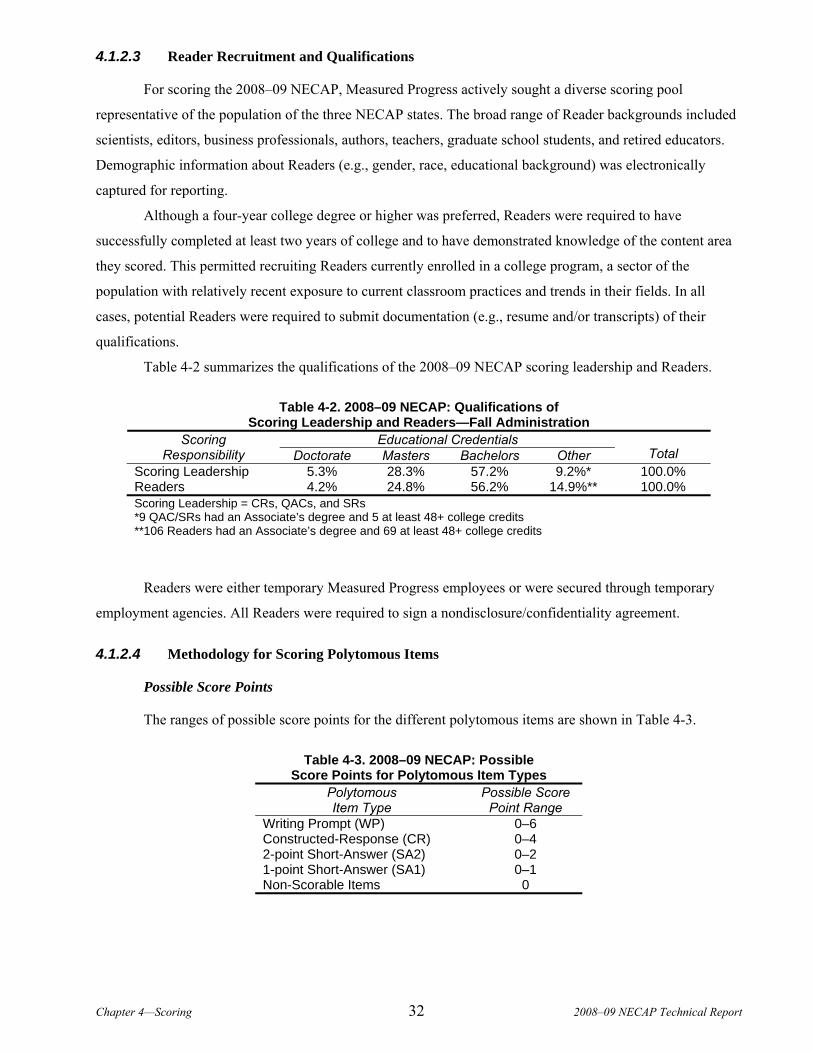
Chapter 4—Scoring 32 2008–09 NECAP Technical Report
4.1.2.3 Reader Recruitment and Qualifications
For scoring the 2008–09 NECAP, Measured Progress actively sought a diverse scoring pool
representative of the population of the three NECAP states. The broad range of Reader backgrounds included
scientists, editors, business professionals, authors, teachers, graduate school students, and retired educators.
Demographic information about Readers (e.g., gender, race, educational background) was electronically
captured for reporting.
Although a four-year college degree or higher was preferred, Readers were required to have
successfully completed at least two years of college and to have demonstrated knowledge of the content area
they scored. This permitted recruiting Readers currently enrolled in a college program, a sector of the
population with relatively recent exposure to current classroom practices and trends in their fields. In all
cases, potential Readers were required to submit documentation (e.g., resume and/or transcripts) of their
qualifications.
Table 4-2 summarizes the qualifications of the 2008–09 NECAP scoring leadership and Readers.
Table 4-2. 2008–09 NECAP: Qualifications of Scoring Leadership and Readers—Fall Administration
Educational Credentials Scoring Responsibility Doctorate Masters Bachelors Other Total
Scoring Leadership 5.3% 28.3% 57.2% 9.2%* 100.0% Readers 4.2% 24.8% 56.2% 14.9%** 100.0% Scoring Leadership = CRs, QACs, and SRs *9 QAC/SRs had an Associate’s degree and 5 at least 48+ college credits **106 Readers had an Associate’s degree and 69 at least 48+ college credits
Readers were either temporary Measured Progress employees or were secured through temporary
employment agencies. All Readers were required to sign a nondisclosure/confidentiality agreement.
4.1.2.4 Methodology for Scoring Polytomous Items
Possible Score Points
The ranges of possible score points for the different polytomous items are shown in Table 4-3.
Table 4-3. 2008–09 NECAP: Possible Score Points for Polytomous Item Types
Polytomous Item Type
Possible Score Point Range
Writing Prompt (WP) 0–6 Constructed-Response (CR) 0–4 2-point Short-Answer (SA2) 0–2 1-point Short-Answer (SA1) 0–1 Non-Scorable Items 0
Chapter 4—Scoring 33 2008–09 NECAP Technical Report
Non-Scorable Items.
Readers could designate a response as non-scorable for any of the following reasons:
- response was blank (no attempt to respond to the question) - response was unreadable (illegible, too faint to see, or only partially
legible/visible)—see note below - response was written in the wrong location (seemed to be a legitimate answer to a
different question)—see note below - response was written in a language other than English - response was completely off-task or off-topic - response included an insufficient amount of material to make scoring possible - response was an exact copy of the assignment - response was incomprehensible - student made a statement refusing to write a response to the question
Note: “Unreadable” and “wrong location” responses were eventually resolved, whenever possible, by
researching the actual answer document (electronic copy or hard copy, as needed) to identify the
correct location (in the answer document) or to more closely examine the response and then assign a
score.
Scoring Procedures
Scoring procedures for polytomous items included both single-scoring and double-scoring. Single-
scored items were scored by one Reader. Double-scored items were scored independently by two Readers,
whose scores were tracked for “interrater agreement” (for further discussion of double-scoring and interrater
agreement, see Section 4.1.2.7 and Appendix E).
4.1.2.5 Reader Training
Reader training began with an introduction of the onsite scoring staff and providing an overview of
the NECAP program’s purpose and goals (including discussion about the security, confidentiality, and
proprietary nature of testing materials, scoring materials, and procedures).
Next, Readers thoroughly reviewed and discussed the scoring guides for each item to be scored. Each
item-specific scoring guide included the item itself and score point descriptions.
Following review of an item’s scoring guide, Readers reviewing or scoring the particular response set
organized for that training: Anchor Sets, Training Sets, and Qualifying Sets. (These are defined below.)
During training, Readers could highlight or mark hard copies of the Anchor, Training, and first
Qualifying Sets, even if all or part of the set was also presented online via computer.
Anchor Set
Readers first reviewed an Anchor Set of exemplary responses for an item. This is a set approved by
the Reading, Writing, and Mathematics content specialists representing the three NECAP state departments of
Chapter 4—Scoring 34 2008–09 NECAP Technical Report
education. Responses in Anchor Sets are typical, rather than unusual or uncommon; solid, rather than
controversial or borderline; and true, meaning that they had scores that could not be changed by anyone other
than the NECAP client and Measured Progress test development staff. Each contains one client-approved
sample response per score point considered to be a mid-range exemplar. The set includes a second sample
response if there is more than one plausible way to illustrate the merits and intent of a score point.
Responses were read aloud to the room of Readers in descending score order. Announcing the true
score of each anchor response, trainers facilitated group discussion of responses in relation to score point
descriptions to help Readers internalize the typical characteristics of score points.
This Anchor Set continued to serve as a reference for Readers as they went on to calibration, scoring,
and recalibration activities for that item.
Training Set
Next, Readers practiced applying the scoring guide and anchors to responses in the Training Set. The
Training Set typically included 10 to 15 student responses designed to help establish both the full score point
range and the range of possible responses within each score point. The Training Set often included unusual
responses that were less clear or solid (e.g., shorter than normal, employing atypical approaches,
simultaneously containing very low and very high attributes, and written in ways difficult to decipher).
Responses in the Training Set were presented in randomized score point order.
After Readers independently read and scored a Training Set response, trainers would poll Readers or
use online training system reports to record their initial range of scores. Trainers then led group discussion of
one or two responses, directing Reader attention to difficult scoring issues (e.g., the borderline between two
score points). Trainers modeled for Readers throughout how to discuss scores by referring to the Anchor Set
and to scoring guides.
Qualifying Set
After the Training Set had been completed, Readers were required to score responses accurately and
reliably in Qualifying Sets assembled for CR items, WP items, and all SA2 items for grades 3 and 4
mathematics. The ten responses in each Qualifying Set were selected from an array of responses that clearly
illustrated the range of score points for that item as reviewed and approved by the state specialists. Hard
copies of the responses were also available to Readers so that they could make notes and refer back during the
post-qualifying discussion.
To be eligible to live score one of the above items, Readers were required to demonstrate scoring
accuracy rates of at least 80% exact agreement (i.e. to exactly match the pre-determined score on at least 8 of
the 10 responses) and at least 90% exact-or-adjacent agreement (i.e., to exactly match or be within one score
point of the pre-determined score on 9 or 10 of the 10 responses), except 70% and 90%, respectively, for 6-
point WP responses. In other words, Readers were allowed 1 discrepant score (i.e., 1 score of 10 that was
Chapter 4—Scoring 35 2008–09 NECAP Technical Report
more than one score point from the pre-determined score) provided they had at least 8 exact scores (7 for WP
items).
To be eligible to score SA1 mathematics items (which were benchmarked “right” or “wrong”), and
SA2 mathematics items for Grades 5–8 and 11, Readers had to qualify on at least one other mathematics item
for that grade.
Retraining
Readers who did not pass the first Qualifying Set were retrained as a group by reviewing their
performance with scoring leadership and then scoring a second Qualifying Set of responses. If they achieved
the required accuracy rate on the second Qualifying Set, they were allowed to score operational responses.
Readers who did not achieve the required scoring accuracy rates on the second Qualifying Set were
not allowed to score responses for that item. Instead, they either began training on a different item or were
dismissed from scoring for that day.
4.1.2.6 Senior Quality Assurance Coordinator (QAC) and Senior Reader (SR) Training
QACs and select SRs were trained in a separate training session immediately prior to Reader training.
In addition to discussing the items and their responses, QAC and SR training included greater detail on the
client’s rationale behind the score points than that covered with regular Readers in order to better equip QACs
and SRs to handle questions from the latter.
4.1.2.7 Monitoring of Scoring Quality Control and Consistency
Readers were monitored for continued accuracy and consistency throughout the scoring process,
using the following methods and tools (which are defined in this section):
- Embedded Committee-Reviewed Responses (CRRs) - “Read-Behind” Procedures - Double-Blind Scoring - Recalibration Sets - Scoring Reports
It should be noted that any Reader whose accuracy rate fell below the expected rate for a particular
item and monitoring method was retrained on that item. Upon approval by the QAC or CR as appropriate (see
below), the Reader was allowed to resume scoring. Readers who met or exceeded the expected accuracy rates
continued scoring.
Furthermore, the accuracy rate required of a Reader to qualify to score responses live was more strict
than that required to continue to score responses live. The reason for the difference is that an “exact score” in
double-blind scoring requires that two Readers choose the same score for a response (in other words, is
dependent on peer agreement), whereas an “exact score” in qualification requires only that a single Reader
Chapter 4—Scoring 36 2008–09 NECAP Technical Report
match a score pre-established by scoring leadership. Reader accuracy and the use of multiple monitoring
techniques is critical to the process of live scoring.
Embedded Committee-Reviewed Responses (CRRs)
Committee-Reviewed Responses (CRRs) are previously scored responses that are loaded
(“embedded”) by scoring leadership into iScore and distributed “blindly” to Readers during scoring.
Embedded CRRs may be chosen either before or during scoring, and are inserted into the scoring queue so
that they appear the same as all other live student responses.
Between 5 and 30 Embedded CRRs were distributed at random points throughout the first full day of
scoring to ensure that Readers were sufficiently calibrated at the beginning of the scoring period. Individual
Readers often received up to 20 Embedded CRRs within the first 100 responses scored and up to 10
additional responses within the next 100 responses scored on that first day of scoring.
Any Reader who fell below the required scoring accuracy rate was retrained before being allowed by
the QAC to continue scoring. Once allowed to resume scoring, scoring leadership carefully monitored these
Readers by increasing the number of Read-Behinds (defined in the next section).
Embedded CRRs were employed for all CR items. They were not used for WP items, because these
are 100% Double-Blind scored (defined below). Embedded CRRs were also not used for SA2 items, because
Read-Behind and Double-Blind techniques are more informative and cost effective for these items.
“Read-Behind” Procedures
Read-Behind scoring refers to scoring leadership (usually a SR) scoring a response after a Reader has
already scored the response. The practice was applied to all open-ended item types.
Responses placed into the Read-Behind queue were randomly selected by scoring leadership; Readers
were not aware which of their responses would be reviewed by their SR. The iScore system allowed 1, 2, or 3
responses per Reader to be placed into the Read-Behind queue at a time.
The SR entered his or her score into iScore before being allowed to see the Reader’s score. The SR
then compared the two scores, and the score of record (i.e., the reported score) was determined as follows:
If there was exact agreement between the scores, no action was necessary; the regular Reader’s
score remained.
If the scores were adjacent (i.e., differed by 1 point), the SR’s score became the score of record.
(A significant number of adjacent scores for a Reader triggered an individual scoring consultation
with the SR, after which the QAC determined whether or when the Reader could resume scoring.)
If the scores were discrepant (i.e., differed by more than 1 point), the SR’s score became the score
of record. (This triggered an individual consultation with the SR, after which the QAC
determined whether or when the reader could resume scoring.)

Chapter 4—Scoring 37 2008–09 NECAP Technical Report
Table 4-4 illustrates how scores were resolved by Read-Behind.
Table 4-4. 2008–09 NECAP: Examples of Read-Behind Scoring Resolutions
Reader Score
QAC/SR Score
Score of Record
4 4 4 4 3 3* 4 2 2*
* QAC/SR’s score.
SRs were tasked with conducting, on average, five Read-Behinds per Reader throughout each half-
scoring day; however, SRs conducted a proportionally greater number of Read-Behinds for Readers who
seemed to be struggling to maintain, or who fell below, accuracy standards.
In addition to regular Read-Behinds, scoring leadership could choose to do Read-Behinds on any
Reader at any point during the scoring process to gain an immediate, real-time “snapshot” of a Reader’s
accuracy.
Double-Blind Scoring
Double-Blind scoring refers to two Readers independently scoring a response without knowing it.
The practice was applied to all open-ended item types. Table 4-5 shows by which method(s) both common
and equating open-ended item responses for each operational test were scored.
Table 4-5. 2008–09 NECAP: Frequency of Double-Blind Scoring by Grade and Content
Grade Content Responses
Double-Blind Scored
3–8, 11 Reading 2% randomly
3–8, 11 Mathematics 2% randomly
5, 8, 11 Writing (WP) 100%
5, 8 Writing (CR) 2% randomly
All Unreadable responses 100% All Blank responses 100%
If there was a discrepancy (a difference greater than 1 score point) between Double-Blind scores, the
response was placed into an arbitration queue. Arbitration responses were reviewed by scoring leadership (SR
or QAC) without knowledge of the two Readers’ scores. Scoring leadership assigned the final score.
Appendix E provides the NECAP 2008–09 percentages of agreement between Readers for each common item
for each grade and content area.

Chapter 4—Scoring 38 2008–09 NECAP Technical Report
Scoring leadership consulted individually with any Reader whose scoring rate fell below the required
accuracy rate, and the QAC determined whether or when the reader could resume scoring. Once the reader
was allowed to resume scoring, scoring leadership carefully monitored the Reader by increasing the number
of Read-Behinds .
Recalibration Sets
To determine whether reinstated Readers were still calibrated to the scoring standard, Readers were
required to take an online Recalibration Set at the start and midpoint of the shift of their resumption of
scoring.
Each Recalibration Set consisted of five responses representing the entire range of possible scores,
including some with a score point of 0.
Readers who were discrepant on 2 of 5 responses of the first Recalibration Set, or exact on 2 or
fewer, were not permitted to score on that item that day and were either assigned to a different
item or dismissed for the day.
Readers who were discrepant on only 1 of 5 responses of the first Recalibration Set, and/or exact
on 3, were retrained by their SR by discussing the Recalibration Set responses in terms of the
score point descriptions and the original Anchor Set. After this retraining, such Readers began
scoring operational responses under the proviso that the Reader’s scores for that day and that item
would be kept only if the Reader was exact on all 5 of 5 responses of the second Recalibration Set
administered at the shift midpoint. The QAC determined whether or when these Readers had
received enough retraining to resume scoring operational responses. Scoring leadership also
carefully monitored the accuracy of such Readers by significantly increasing the number of their
Read-Behinds.
Readers who were not discrepant on any response of the first Recalibration Set, and exact on at
least 4, was allowed to begin scoring operational responses immediately, under the proviso that
this Recalibration performance would be combined with that of the second Recalibration Set
administered at the shift midpoint.
The results of both Recalibration Sets were combined with the expectation that Readers would have
achieved an overall 80%-exact and 90%-adjacent standard for that item for that day.
The Scoring Project Manager voided all scores posted on that item for that day by Readers who did
not meet the accuracy requirement. Responses associated with voided scores were reset and redistributed to
Readers with demonstrated accuracy for that item.
Recalibration Sets were employed for all CR items. They were not used for WP items, which were
100% Double-Blind scored. They were also not used for SA2 items, for which Read-Behind and Double-
Blind techniques are more informative and cost effective.

Chapter 4—Scoring 39 2008–09 NECAP Technical Report
Scoring Reports
Measured Progress’s electronic scoring software, iScore, generated multiple reports that were used by
scoring leadership to measure and monitor Readers for scoring accuracy, consistency, and productivity. These
reports are further discussed in the following section.
4.1.2.8 Reports Generated During Scoring
Due to the complexity of the 2008–09 NECAP administration, computer-generated reports were
necessary to ensure that
overall group-level accuracy, consistency, and reliability of scoring were maintained at
acceptable levels
immediate, real-time individual Reader data were available to allow early intervention when
necessary
scoring schedules were maintained
The following reports were produced by iScore:
The Read-Behind Summary showed the total number of Read-Behind responses for each
Reader and noted the number and percentages of exact, adjacent, and discrepant scores with the
SR/QAC. Scoring leadership could choose to generate this report by choosing options (such as
“Today” “Past Week” and “Cumulative”) from a pull-down menu. The report could also be
filtered to select data for a particular item or across all items. This report was used in conjunction
with other reports to determine whether a Reader’s scores would be voided (i.e., sent back out to
the floor to be rescored by other Readers). The benefit of this report is that it can reveal the
degree to which an individual Reader agrees with their QAC or SR on how best to score live
responses.
The Double-Blind Summary showed the total number of double-scored responses of each
Reader, and noted the number and percentages of exact, adjacent, and discrepant scores with
second Readers. This report was used in conjunction with other reports to determine whether a
Reader’s scores should be voided (i.e., sent back out to the floor to be rescored by other Readers).
The benefit of this report is that it can reveal the degree to which Readers are in agreement with
each other about how best to score live responses.
The Accuracy Summary combined Read-Behind and Double-Blind data, showing the total
number for the Readers, their accuracy rates, and their score-point distributions.
The Embedded CRR Summary showed, for each Reader (by item or across all items), the total
number of responses scored, the number of CRRs scored, and the numbers and percentages of
exact, adjacent, and discrepant scores with the CR. This report was used in conjunction with other
Chapter 4—Scoring 40 2008–09 NECAP Technical Report
reports to determine whether a Reader’s scores should be voided (i.e., sent back out to the floor to
be rescored by other Readers). The benefit of this report is that it can reveal the degree to which
an individual Reader agrees with their CR on how to best score live responses. Also, since
embedded CRRs are administered during the first hours of scoring, this report can provide an
early illustration of agreement between Readers and CRs.
The Qualification Statistics listed each Reader by name and ID number, identified which
Qualifying Set(s) they did and did not take and, for the ones taken, their pass rate. In addition to
the pass rates of individuals, the report also showed numbers of Readers passing or failing a
particular Qualifying Set. The QAC could use this report to determine how Readers within their
scoring group performed on specific Qualifying Sets.
The Summary showed the total number of student responses for an item, and identified, for the
time at which the report was generated, the following:
- the number of single and Double-Blind scorings that had been performed - the number of single and Double-Blind scorings yet to be performed
Chapter 5—Classical Item Analyses 41 2008–09 NECAP Technical Report
SECTION II—STATISTICAL AND PSYCHOMETRIC SUMMARIES
Chapter 5. CLASSICAL ITEM ANALYSES As noted in Brown (1983), “A test is only as good as the items it contains.” A complete evaluation of
a test’s quality must include an evaluation of each item. Both the Standards for Educational and
Psychological Testing (AERA, 1999) and the Code of Fair Testing Practices in Education (Joint Committee
on Testing Practices, 1988) include standards for identifying high-quality items. Test items should assess only
knowledge or skills that are identified as part of the domain being measured and should avoid assessing
irrelevant factors. They should also be unambiguous, and free of grammatical errors, potentially insensitive
content or language, and other confounding characteristics. Further, items must not unfairly disadvantage test
takers from particular racial, ethnic, or gender groups.
Both qualitative and quantitative approaches were taken to ensure that 2008–09 NECAP items met
these standards. Qualitative work was discussed in Chapter 2 (“Development and Test Design”). This chapter
summarizes several types of quantitative analyses that were carried out on the 2008–09 NECAP items:
classical item statistics
Differential Item Functioning (subgroup differences in item performance)
dimensionality analyses
All analyses presented are based on the statewide administration of the 2008–09 NECAP in fall 2008.
The numbers of students who participated in the assessment at each grade level were about 30,400 in grade 3,
30,450 in grade 4, 32,150 in grade 5, 32,400 in grade 6, 33,000 in grade 7, 33,600 in grade 8, and 33,700 in
grade 11.
5.1 Classical Difficulty and Discrimination Indices
All 2008–09 NECAP items were evaluated in terms of item difficulty according to standard Classical
Test Theory (CTT) practice. The expected item difficulty, also known as the p-value, is the main index of
item difficulty under the CTT framework. This index measures an item’s difficulty by averaging the
proportion of points received across all students who took the item. MC items were scored dichotomously
(correct vs. incorrect), so for these items, the difficulty index is simply the proportion of students who
correctly answered the item. CR items were scored polytomously, where a student can achieve a score of 0, 1,
2, 3, or 4. SA1 items were scored 0 or 1 and SA2 items 0, 1, or 2. By computing the CR and SA2 difficulty
indices as the average proportion of points achieved, the indices for all item types are placed on a similar
scale and ranges from 0.00 to 1.00. Although the p-value is traditionally called a measure of difficulty, it is
Chapter 5—Classical Item Analyses 42 2008–09 NECAP Technical Report
properly interpreted as an easiness index, because larger values indicate easier items. An index of 1.00
indicates that every student received full credit for the item; such items provide little information about
differences in student ability, but do indicate knowledge or skills that have been mastered by most students.
Similarly, an index of 0.00 indicates that no student received credit for the item; such items provide little
information about differences in student ability, but may indicate knowledge or skills that have not yet been
mastered by most students.
To provide best measurement, difficulty indices generally should range from near-chance
performance (i.e., 0.25 for four-option, multiple-choice items; essentially 0.00 for open-response items) to
0.90. Indices outside this range indicate items that were either too difficult or too easy for the target
population. Nonetheless, on a standards-referenced assessment such as NECAP, it may be appropriate to
include some items with very low or very high item difficulty values to ensure sufficient content coverage.
Another desirable feature of an item is that the higher-achieving students perform better on the item
than do lower-achieving students. The correlation between student performance on a single item and total test
score is a commonly used measure of this characteristic of an item. Within classical test theory, the item-test
correlation is referred to as the item’s discrimination, because it indicates the extent to which successful
performance on an item discriminates between high and low scores on the test. For CR items, the item
discrimination index used was the Pearson product-moment correlation; for dichotomous items (MC and
SA1), this statistic is commonly referred to as a point-biserial correlation. The theoretical range of these
statistics is –1.00 to +1.00 and their typical observed range is 0.20 to 0.60.
A discrimination index can be thought of as measuring how closely an item assesses the same
knowledge and skills assessed by other items contributing to the criterion total score. That is, as a measure of
construct consistency. In light of this interpretation, the selection of an appropriate criterion total score is
crucial to the interpretation of the discrimination index. Because each form of the 2008–09 NECAP was
constructed to be parallel in content, the criterion score selected for each item was the raw score total for each
form. The analyses were conducted for each form separately.
Difficulty and discrimination indices (i.e., item level classical stats) for each item are provided in
Appendix F. Item level statistics are summarized by form in Appendix G. The item difficulty and
discrimination indices are within acceptable and expected ranges. Very few items were answered correctly at
near-chance or near-perfect rates. Similarly, the positive discrimination indices indicate that students who
performed well on individual items tended to perform well overall. There were a small number of items with
near-zero discrimination indices, but none were negative.
Attempting to compare CTT difficulty indices across content areas or grade levels is a thorny
proposition, because the statistics are population dependent. Such direct comparisons would require that
either items or students were common across comparisons, and since that is not the case, it can not be
determined whether differences in performance are due to real differences in student ability or differences in
item difficulty or both. With this caveat in mind, it appears generally that students in higher grades found their
Chapter 5—Classical Item Analyses 43 2008–09 NECAP Technical Report
mathematics items more difficult than did students in lower grades. Mathematics items also appeared to be
more difficult than items in other content areas across grades. Comparing difficulty indices across item types
is also suspect, because MC items can be answered correctly by guessing. That the difficulty indices for the
dichotomous items tended to be higher (i.e., the items are easier) than those for the polytomous items is not
surprising. Similarly, discrimination indices for the polytomous items were larger than those for the
dichotomous items due to the greater variability of the former (i.e., the partial credit these items allow) and
the tendency for higher correlation coefficients given greater variances of the correlates
5.2 Differential Item Functioning (DIF)
The Code of Fair Testing Practices in Education (2004) explicitly states that subgroup differences in
performance should be examined when sample sizes permit, and actions should be taken to make certain that
differences in performance are due to construct-relevant, rather than irrelevant, factors. The Standards for
Educational and Psychological Testing (AERA, 1999) includes similar guidelines.
The standardization differential item functioning (DIF) procedure (Dorans and Kulick, 1986) is
designed to identify items for which subgroups of interest perform differently, beyond the impact of
differences in overall achievement. The DIF procedure calculates the difference in item performance for two
groups of students (at a time) matched for achievement on the total test. Specifically, average item
performance is calculated for students at every total score. Then an overall average is calculated, weighting
the total score distribution so that it is the same for the two groups. The criterion (matching) score for 2008–
09 NECAP was computed two ways. For common items, total score was the sum of scores on common items.
Total score for matrix items was the sum of item scores on common and matrix items (excluding field-test
items). Based on experience, this dual definition of criterion scores has worked well in identifying
problematic common and matrix items.
When differential performance between two groups occurs on an item (i.e., a DIF index in the “low”
or “high” categories, explained below), it may or may not be indicative of item bias. Course-taking patterns or
differences in school curricula can lead to DIF but for construct-relevant reasons. On the other hand, if
subgroup differences in performance could be traced to differential experience (such as geographical living
conditions or access to technology), the inclusion of such items should be re-considered.
Computed DIF indices have a theoretical range from –1.0 to 1.0 for multiple-choice and short-answer
items, and the index is adjusted to the same scale for constructed-response items. Dorans and Holland (1993)
suggested that index values between –0.05 and 0.05 should be considered negligible. The preponderance of
[contract] items fell within this range. Dorans and Holland further stated that items with values between –0.10
and –0.05 and between 0.05 and 0.10 (i.e., “low” DIF) should be inspected to ensure that no possible effect is
Chapter 5—Classical Item Analyses 44 2008–09 NECAP Technical Report
overlooked, and that items with values outside the [–0.10, 0.10] range (i.e., “high” DIF) are more unusual and
should be examined very carefully2.
For the 2008–09 NECAP tests, three subgroup comparisons were evaluated for DIF:
Male versus female White versus African American White versus Hispanic
Other race/ethnicity groups (e.g., Asians) were not analyzed using DIF procedures, because limited
sample sizes would have inflated type I error rates. Appendix H presents the number of items classified into
each DIF category by test form and item type. Appendix I presents the number of items classified into each
DIF category that favor males or females, by item type.
5.3 Dimensionality Analyses
Because tests are constructed with multiple content area categories and their associated knowledge
and skills, the potential exists for a large number of dimensions being invoked beyond the common primary
dimension. Generally, the reporting categories are highly correlated with each other; therefore, the primary
dimension they share typically explains an overwhelming majority of variance in test scores. In fact, the
presence of just such a dominant primary dimension is the psychometric assumption that provides the
foundation for the unidimensional IRT models that are used for calibrating, linking, scaling, and equating the
NECAP test forms.
The purpose of dimensionality analysis is to investigate whether violation of the assumption of test
unidimensionality is statistically detectable and, if so, (a) the degree to which unidimensionality is violated
and (b) the nature of the multidimensionality. Findings from dimensionality (DIM) analyses performed on the
2008–09 NECAP common items for mathematics, reading, and writing are reported below. (Note: Only
common items were analyzed since they are used for score reporting.)
The DIM analyses were conducted using the nonparametric IRT-based methods DIMTEST (Stout,
1987; Stout, Froelich, & Gao, 2001) and DETECT (Zhang & Stout, 1999). Both of these methods use as their
basic statistical building block the estimated average conditional covariances for item pairs. A conditional
covariance is the covariance between two items conditioned on total score for the rest of the test, and the
average conditional covariance is obtained by averaging over all possible conditioning scores. When a test is
strictly unidimensional, all conditional covariances are expected to take on values within random noise of
zero, indicating statistically independent item responses for examinees with equal expected scores. Non-zero
conditional covariances are essentially violations of the principle of local independence; local dependence
2 It should be pointed out here that DIF for items is evaluated initially at the time of field-testing. If an item displays high DIF, it is flagged for review by a Measured Progress content specialist. The content specialist consults with the Department to determine whether to include the flagged item in a future operational test administration.
Chapter 5—Classical Item Analyses 45 2008–09 NECAP Technical Report
would imply multidimensionality. Thus, non-random patterns of positive and negative conditional
covariances are indicative of multidimensionality.
DIMTEST is a hypothesis-testing procedure for detecting violations of local independence. The data
are first randomly divided into a training sample and a cross-validation sample. Then an exploratory analysis
of the conditional covariances is conducted on the training sample data to find the cluster of items that
displays the greatest evidence of local dependence. The cross-validation sample is then used to test whether
the conditional covariances of the selected cluster of items display local dependence, conditioning on total
score on the non-clustered items. The DIMTEST statistic follows a standard normal distribution under the
null hypothesis of unidimensionality.
DETECT is an effect-size measure of multidimensionality. As with DIMTEST, the data are first
randomly divided into a training sample and a cross-validation sample (these samples are drawn
independently of those used with DIMTEST). The training sample is used to find a set of mutually exclusive
and collectively exhaustive clusters of items that best fit a systematic pattern of positive conditional
covariances for pairs of items from the same cluster and negative conditional covariances from different
clusters. Next, the clusters from the training sample are used with the cross-validation sample data to average
the conditional covariances: within-cluster conditional covariances are summed, from this sum the between-
cluster conditional covariances are subtracted, this difference is divided by the total number of item pairs, and
this average is multiplied by 100 to yield an index of the average violation of local independence for an item
pair. DETECT values less than 0.20 indicate very weak multidimensionality (or near unidimensionality)
values of 0.20 to 0.40 weak to moderate multidimensionality; values of 0.40 to 1.00 moderate to strong
multidimensionality and values greater than 1.0 very strong multidimensionality.
DIMTEST and DETECT were applied to the 2008–09 NECAP data. For each grade and content area,
the data were split into a training sample and a cross-validation sample. Every grade content combination had
at least 30,000 student examinees. Because DIMTEST is limited to using 24,000 students, the training and
cross-validation samples were constructed by randomly sampling 12,000 students each from the total sample.
DETECT has an upper limit of 50,000 students, so all students were selected randomly into training and
cross-validation samples of 15,000 or more students. DIMTEST was then applied to every grade content, and
DETECT was applied in order to estimate the effect size of the multidimensionality to those datasets for
which the DIMTEST null hypothesis was rejected.
The DIMTEST null hypothesis was strongly rejected for every data set (p = .0002 for writing grade 5
and p < 0.00005 for all other grade contents). Because strict unidimensionality is an idealization that almost
never holds exactly for a given data set, these DIMTEST results were not surprising. Indeed, because of the
very large NECAP sample sizes, DIMTEST would be sensitive to even quite small violations of
unidimensionality. It was therefore important to use DETECT to estimate the effect size of the violations of
local independence. Table 5-1 displays the multidimensional effect size estimates from DETECT for the
2008–09 NECAP along with the estimates from 2007–08 for comparison purposes.
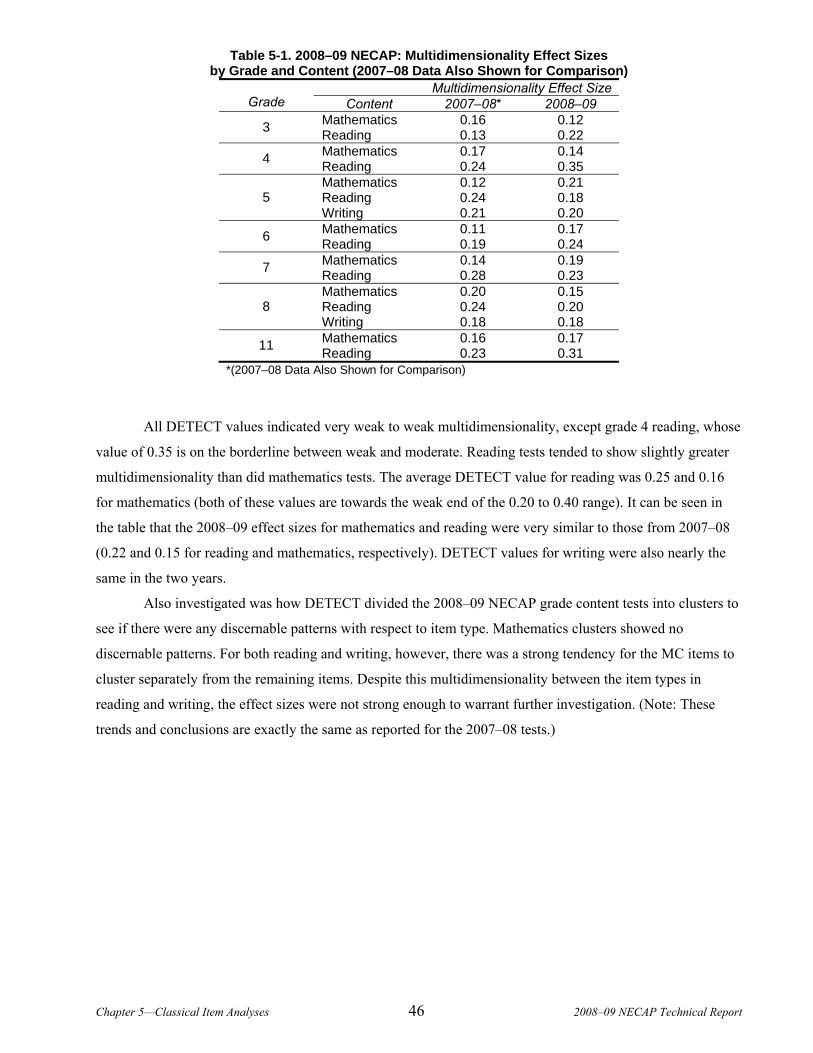
Chapter 5—Classical Item Analyses 46 2008–09 NECAP Technical Report
Table 5-1. 2008–09 NECAP: Multidimensionality Effect Sizes by Grade and Content (2007–08 Data Also Shown for Comparison)
Multidimensionality Effect Size Grade Content 2007–08* 2008–09
Mathematics 0.16 0.12 3 Reading 0.13 0.22 Mathematics 0.17 0.14 4 Reading 0.24 0.35 Mathematics 0.12 0.21 Reading 0.24 0.18 5 Writing 0.21 0.20 Mathematics 0.11 0.17 6 Reading 0.19 0.24 Mathematics 0.14 0.19 7 Reading 0.28 0.23 Mathematics 0.20 0.15 Reading 0.24 0.20 8 Writing 0.18 0.18 Mathematics 0.16 0.17 11 Reading 0.23 0.31
*(2007–08 Data Also Shown for Comparison)
All DETECT values indicated very weak to weak multidimensionality, except grade 4 reading, whose
value of 0.35 is on the borderline between weak and moderate. Reading tests tended to show slightly greater
multidimensionality than did mathematics tests. The average DETECT value for reading was 0.25 and 0.16
for mathematics (both of these values are towards the weak end of the 0.20 to 0.40 range). It can be seen in
the table that the 2008–09 effect sizes for mathematics and reading were very similar to those from 2007–08
(0.22 and 0.15 for reading and mathematics, respectively). DETECT values for writing were also nearly the
same in the two years.
Also investigated was how DETECT divided the 2008–09 NECAP grade content tests into clusters to
see if there were any discernable patterns with respect to item type. Mathematics clusters showed no
discernable patterns. For both reading and writing, however, there was a strong tendency for the MC items to
cluster separately from the remaining items. Despite this multidimensionality between the item types in
reading and writing, the effect sizes were not strong enough to warrant further investigation. (Note: These
trends and conclusions are exactly the same as reported for the 2007–08 tests.)


Chapter 6—IRT Scaling & Equating 48 2008–09 NECAP Technical Report
Chapter 6. IRT SCALING AND EQUATING
6.1 Item Response Theory Scaling
All NECAP items were calibrated using Item Response Theory (IRT). IRT uses mathematical models
to define a relationship between an unobserved measure of student performance, usually referred to as theta
(θ ), and the probability (p) of getting a dichotomous item correct or of getting a particular score on a
polytomous item. In IRT, it is assumed that all items are independent measures of the same construct (i.e., of
the same θ ). Another way to think of θ is as a mathematical representation of the latent trait of interest.
Several common IRT models are used to specify the relationship between θ and p (Hambleton and van der
Linden, 1997; Hambleton and Swaminathan, 1985). The process of determining the specific mathematical
relationship between θ and p is called item calibration. After items are calibrated, they are defined by a set of
parameters that specify a nonlinear, monotonically increasing relationship between θ and p. Once the item
parameters are known, an estimate of θ for each student can be calculated. This estimate θ̂ , is considered to
be an estimate of the student’s true score or a general representation of student performance. It has
characteristics that may be preferable to those of raw scores for equating purposes.
For NECAP 2008–09, the three-parameter logistic (3PL) model was used for dichotomous items and
the graded-response model (GRM) was used for polytomous items. The 3PL model for dichotomous items
can be defined as follows (note that for SA1 items, the c parameter is set to zero, thus the model becomes
2PL):
( ) ( )( )
( ),
exp1 1
1 expi j i
i j i i ii j i
Da bP c c
Da b
θθ ξ
θ
⎡ ⎤−⎣ ⎦= + −⎡ ⎤+ −⎣ ⎦
Where:
i indexes the items,
j indexes students,
a represents item discrimination,
b represents item difficulty,
c is the pseudo-guessing parameter,
ξi represents the set of item parameters (a, b, and c), and
D is a normalizing constant equal to 1.701.
In the GRM for polytomous items, an item is scored in k+1 graded categories that can be viewed as a
set of k dichotomies. At each point of dichotomization (i.e., at each threshold), a two-parameter model can be
used. This implies that a polytomous item with k+1 categories can be characterized by k item category
threshold curves (ICTC) of the two-parameter logistic form:
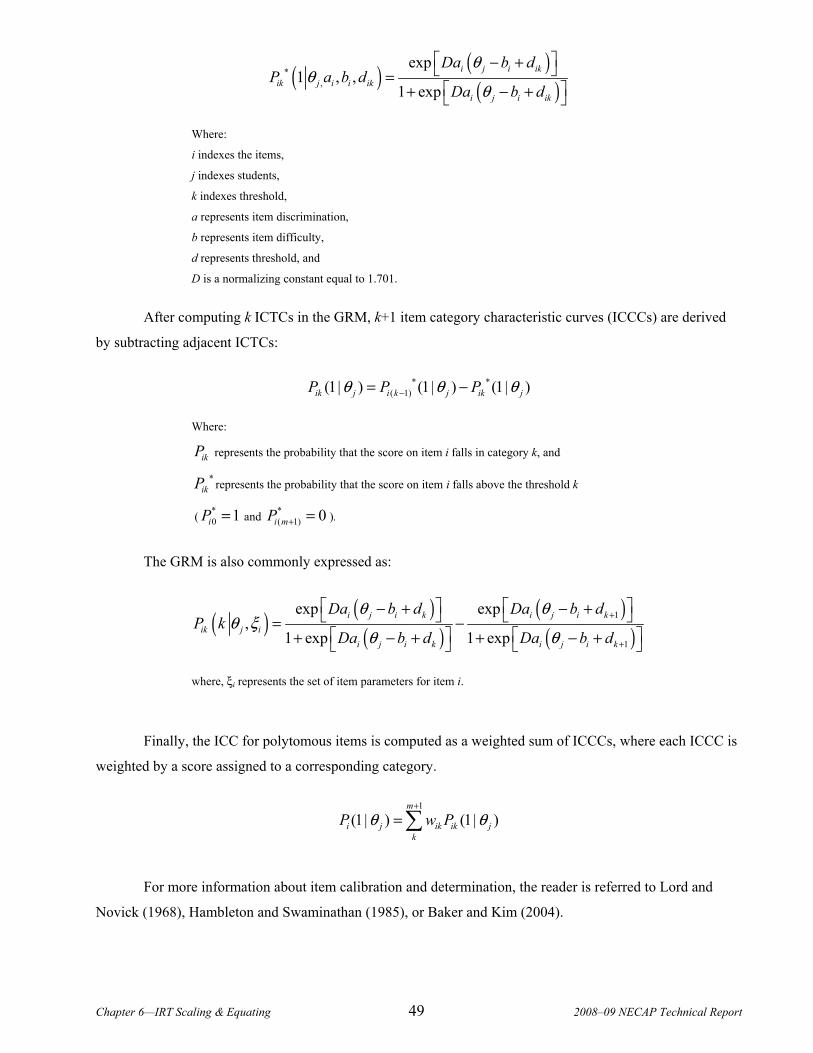
Chapter 6—IRT Scaling & Equating 49 2008–09 NECAP Technical Report
( ) ( )( )
*,
exp1 , ,
1 expi j i ik
ik j i i iki j i ik
Da b dP a b d
Da b d
θθ
θ
⎡ ⎤− +⎣ ⎦=⎡ ⎤+ − +⎣ ⎦
Where:
i indexes the items,
j indexes students,
k indexes threshold,
a represents item discrimination,
b represents item difficulty,
d represents threshold, and
D is a normalizing constant equal to 1.701.
After computing k ICTCs in the GRM, k+1 item category characteristic curves (ICCCs) are derived
by subtracting adjacent ICTCs:
* *( 1)(1| ) (1| ) (1| )ik j i k j ik jP P Pθ θ θ−= −
Where:
ikP represents the probability that the score on item i falls in category k, and
*ikP represents the probability that the score on item i falls above the threshold k
( *0 1iP = and *
( 1) 0i mP + = ).
The GRM is also commonly expressed as:
( ) ( )( )
( )( )
1
1
exp exp,
1 exp 1 expi j i k i j i k
ik j ii j i k i j i k
Da b d Da b dP k
Da b d Da b d
θ θθ ξ
θ θ+
+
⎡ ⎤ ⎡ ⎤− + − +⎣ ⎦ ⎣ ⎦= −⎡ ⎤ ⎡ ⎤+ − + + − +⎣ ⎦ ⎣ ⎦
where, ξi represents the set of item parameters for item i.
Finally, the ICC for polytomous items is computed as a weighted sum of ICCCs, where each ICCC is
weighted by a score assigned to a corresponding category.
1
(1| ) (1| )m
i j ik ik jk
P w Pθ θ+
=∑
For more information about item calibration and determination, the reader is referred to Lord and
Novick (1968), Hambleton and Swaminathan (1985), or Baker and Kim (2004).
Chapter 6—IRT Scaling & Equating 50 2008–09 NECAP Technical Report
6.2 Item Response Theory Analyses
The previous section introduced IRT and gave a thorough description of the topic. It was discussed
there that all 2008–09 NECAP items were calibrated using IRT and that the calibrated item parameters were
ultimately used to scale both the items and students onto a common framework. The results of those analyses
are presented in Appendix J.
The tables in Appendix J give the IRT item parameters of all common items on the 2007–08 NECAP
tests by grade and content area. Accompanying the parameter tables are graphs of the corresponding Test
Characteristic Curves (TCCs) and Test Information Functions (TIFs), which are defined below.
TCCs display the expected (average) raw score associated with each jθ value between –4.0 and 4.0.
Mathematically, the TCC is computed by summing the ICCs of all items that contribute to the raw score.
Using the notation introduced in Section 6.1, the expected raw score at a given value of jθ is
( )1
( | ) 1 ,n
j i ji
E X Pθ θ=
=∑
where
i indexes the items (and n is the number of items contributing to the raw score),
j indexes students (here, θj runs from –4 to 4)
( | )jE X θ is the expected raw score for a student of ability θj.
The expected raw score monotonically increases with jθ , consistent with the notion that students of
high ability tend to earn higher raw scores than do students of low ability. Most TCCs are “S-shaped” flatter
at the ends of the distribution and steeper in the middle.
The TIF displays the amount of statistical information that the test provides at each value of jθ .
Information functions depict test precision across the entire latent trait continuum. There is an inverse
relationship between the information of a test and its standard error of measurement (SEM). For long tests,
the SEM at a given jθ is approximately equal to the inverse of the square root of the statistical information at
θj (Hambleton, Swaminathan, & Rogers, 1991), as follows:
1( )( )
jj
SEMI
θθ
=
Compared to the tails, TIFs are often higher near the middle of the θ distribution where most students
are located and where most items are sensitive by design.
Chapter 6—IRT Scaling & Equating 51 2008–09 NECAP Technical Report
6.3 Equating
The purpose of equating is to ensure that scores obtained from different forms of a test are equivalent
to each other. Equating may be used if multiple test forms are administered in the same year, as well as to
equate one year’s forms to those given in the previous year. Equating ensures that students are not given an
unfair advantage or disadvantage because the test form they took is easier or harder than those taken by other
students.
The 2008–09 administration of NECAP used a raw score-to-theta equating procedure in which test
forms are equated every year to the theta scale of the reference test forms. (In the case of NECAP, the
reference forms are those from the 2005–06 administration for grades 3 through 8 and 2007–08 for grade 11.)
This is accomplished through the chained linking design, in which every new form is equated back to the
theta scale of the previous year’s test form. It can therefore be assumed that the theta scale of every new test
form is the same as the theta scale of the reference form, since this is where the chain originated.
Students who took the equating items on the 2008–09 and 2007–08 NECAP tests are not equivalent
groups. IRT is particularly useful for equating scenarios that involve nonequivalent groups (Allen and Yen,
1979). Equating for NECAP uses the anchor-test-nonequivalent-groups design described by Petersen, Kolen,
and Hoover (1989). In this equating design, no assumption is made about the equivalence of the examinee
groups taking different test forms (that is, naturally occurring groups are assumed). Comparability is instead
evaluated through utilizing a set of anchor items (also called equating items). The NECAP uses an external
anchor test design, which means that the equating items are not counted toward students’ test scores.
However, the equating items are designed to mirror the common test in terms of item types and distribution of
emphasis. Subsets of the equating items are matrixed across forms.
Item parameter estimates for 2008–09 were placed on the 2007–08 scale by using the method of
Stocking and Lord (1983), which is based on the IRT principle of item parameter invariance. According to
this principle, the equating items for both the 2007–08 and 2008–09 NECAP tests should have the same item
parameters. After the item parameters for each 2007–08 NECAP mathematics and reading test were estimated
using PARSCALE, as described earlier, he Stocking and Lord method was employed to find the linear
transformation (slope and intercept) that adjusted the equating items’ parameter estimates such that the 2008–
09 TCC was as close as possible to that of 2007–08. The transformation constants are presented in Table 6-1.
It should be noted that grades 5 and 8 writing were excepted from the equating process; writing test forms are
equated through the scoring rubric.
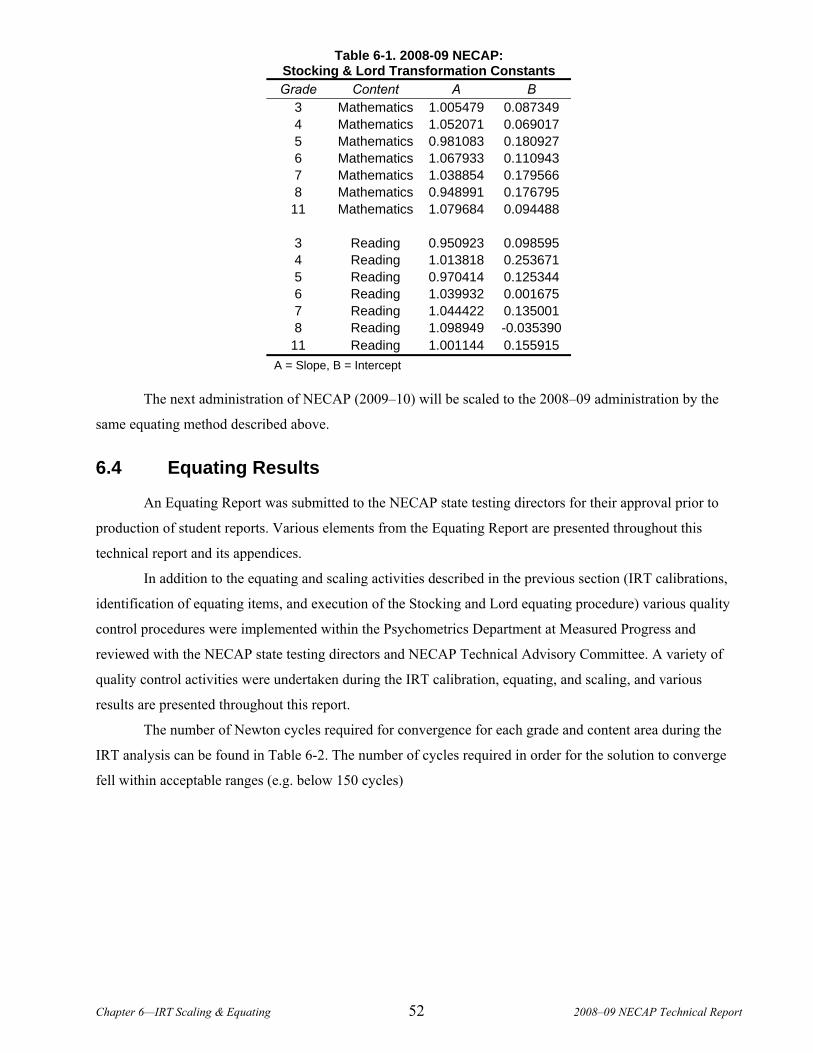
Chapter 6—IRT Scaling & Equating 52 2008–09 NECAP Technical Report
Table 6-1. 2008-09 NECAP: Stocking & Lord Transformation Constants Grade Content A B
3 Mathematics 1.005479 0.087349 4 Mathematics 1.052071 0.069017 5 Mathematics 0.981083 0.180927 6 Mathematics 1.067933 0.110943 7 Mathematics 1.038854 0.179566 8 Mathematics 0.948991 0.176795 11 Mathematics 1.079684 0.094488
3 Reading 0.950923 0.098595 4 Reading 1.013818 0.253671 5 Reading 0.970414 0.125344 6 Reading 1.039932 0.001675 7 Reading 1.044422 0.135001 8 Reading 1.098949 -0.035390 11 Reading 1.001144 0.155915
A = Slope, B = Intercept
The next administration of NECAP (2009–10) will be scaled to the 2008–09 administration by the
same equating method described above.
6.4 Equating Results
An Equating Report was submitted to the NECAP state testing directors for their approval prior to
production of student reports. Various elements from the Equating Report are presented throughout this
technical report and its appendices.
In addition to the equating and scaling activities described in the previous section (IRT calibrations,
identification of equating items, and execution of the Stocking and Lord equating procedure) various quality
control procedures were implemented within the Psychometrics Department at Measured Progress and
reviewed with the NECAP state testing directors and NECAP Technical Advisory Committee. A variety of
quality control activities were undertaken during the IRT calibration, equating, and scaling, and various
results are presented throughout this report.
The number of Newton cycles required for convergence for each grade and content area during the
IRT analysis can be found in Table 6-2. The number of cycles required in order for the solution to converge
fell within acceptable ranges (e.g. below 150 cycles)
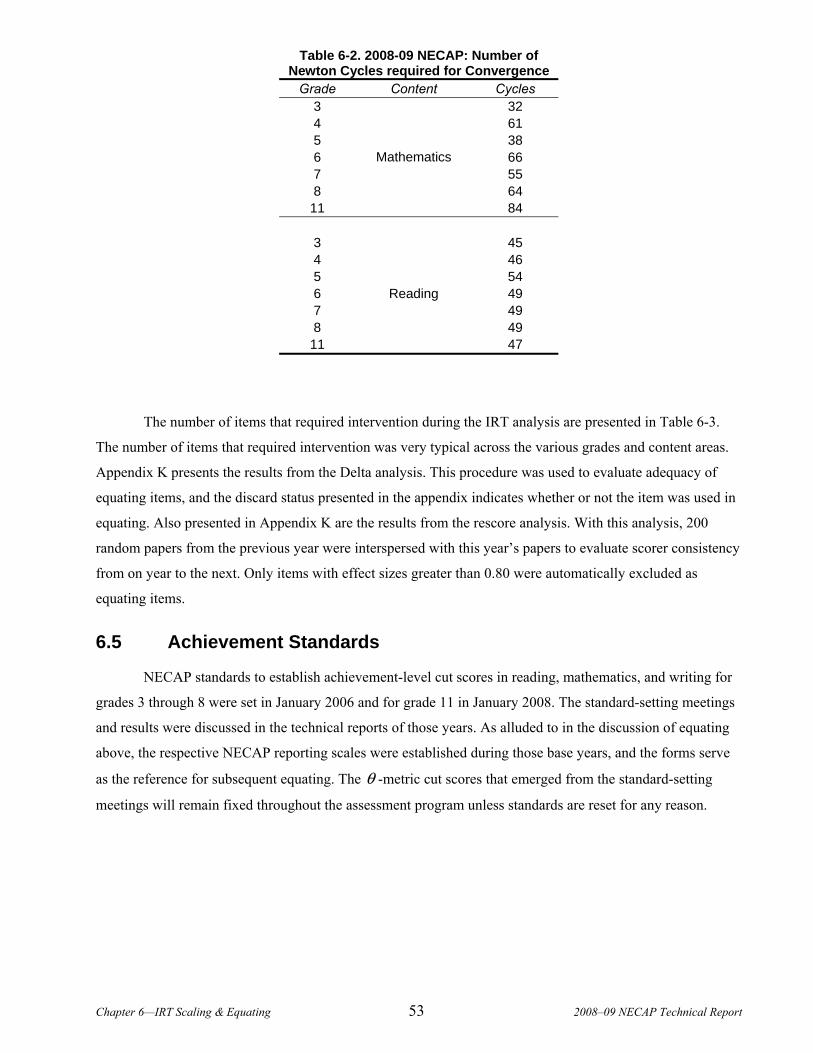
Chapter 6—IRT Scaling & Equating 53 2008–09 NECAP Technical Report
Table 6-2. 2008-09 NECAP: Number of Newton Cycles required for Convergence
Grade Content Cycles 3 32 4 61 5 38 6 66 7 55 8 64 11
Mathematics
84
3 45 4 46 5 54 6 49 7 49 8 49 11
Reading
47
The number of items that required intervention during the IRT analysis are presented in Table 6-3.
The number of items that required intervention was very typical across the various grades and content areas.
Appendix K presents the results from the Delta analysis. This procedure was used to evaluate adequacy of
equating items, and the discard status presented in the appendix indicates whether or not the item was used in
equating. Also presented in Appendix K are the results from the rescore analysis. With this analysis, 200
random papers from the previous year were interspersed with this year’s papers to evaluate scorer consistency
from on year to the next. Only items with effect sizes greater than 0.80 were automatically excluded as
equating items.
6.5 Achievement Standards
NECAP standards to establish achievement-level cut scores in reading, mathematics, and writing for
grades 3 through 8 were set in January 2006 and for grade 11 in January 2008. The standard-setting meetings
and results were discussed in the technical reports of those years. As alluded to in the discussion of equating
above, the respective NECAP reporting scales were established during those base years, and the forms serve
as the reference for subsequent equating. The θ -metric cut scores that emerged from the standard-setting
meetings will remain fixed throughout the assessment program unless standards are reset for any reason.

Chapter 6—IRT Scaling & Equating 54 2008–09 NECAP Technical Report
6.6 Reported Scale Scores
6.6.1 Description of Scale
Because the θ scale used in IRT calibrations is not readily understood by most stakeholders,
reporting scales were developed for the NECAP tests. The reporting scales are simple linear transformations
of the underlying θ scale. The scales were developed such that they ranged from X00 through X80, where X
is grade level. In other words, grade 3 scaled scores ranged from 300 to 380, grade 4 from 400 through 480,
and so forth through grade 11, where scores ranged from 1100 through 1180. The lowest scaled score in the
Proficient range was set at “X40” for each grade level. For example, to be classified in the Proficient
achievement level or above, a minimum scaled score of 340 was required at grade 3, 440 at grade 4, and so
forth.
By providing information that is more specific about the position of a student’s results, scaled scores
supplement achievement-level. School- and district-level scaled scores are calculated by computing the
average of student-level scaled scores. Students’ raw scores (i.e., total number of points) on the 2008–09
NECAP tests were translated to scaled scores using a data analysis process called scaling. Scaling simply
converts from one scale to another. In the same way that a given temperature can be expressed on either
Fahrenheit or Celsius scales, or the same distance can be expressed in either miles or kilometers, student
scores on the 2008–09 NECAP tests can be expressed in raw or scaled scores.
In Figure 6-1, two-way arrows depict how raw scores (the vertical axis) map through the S-shaped
TCC to corresponding scores on the θ scale (horizontal axis), which in turn map directly to scaled scores.
Figure 6-1. Conceptual Illustration of Raw Score to Theta Scaled Score
Transformation Using a Test Characteristic Curve
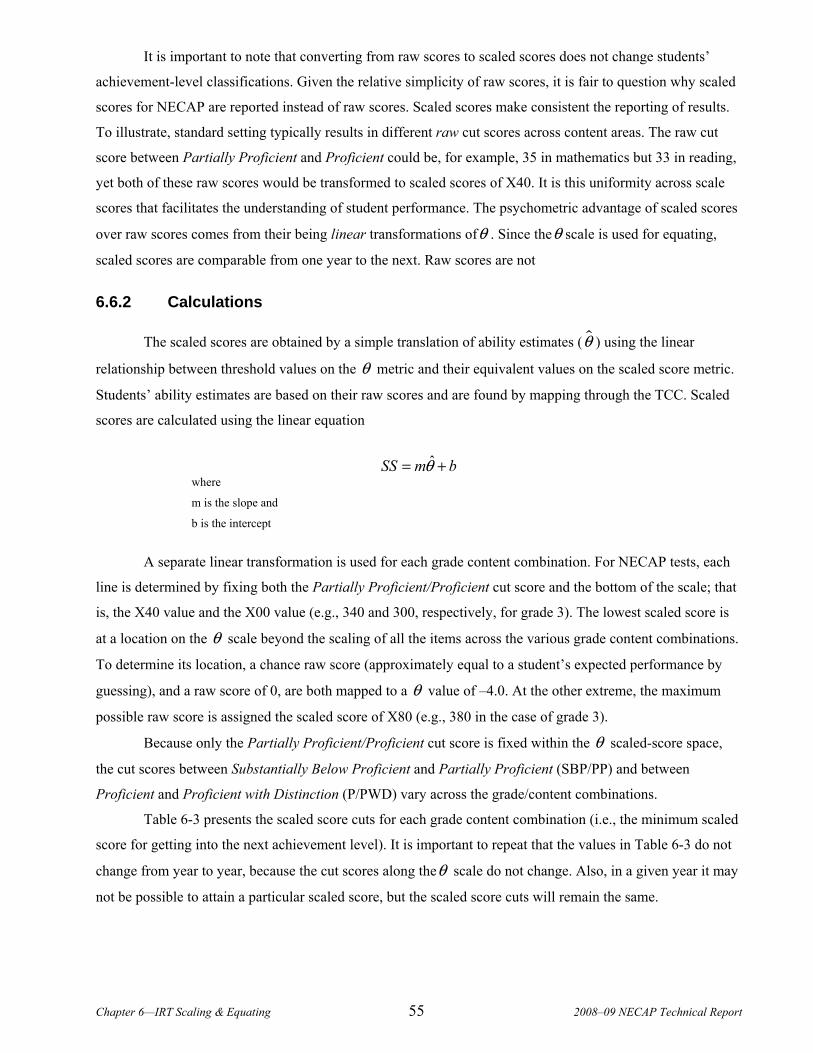
Chapter 6—IRT Scaling & Equating 55 2008–09 NECAP Technical Report
It is important to note that converting from raw scores to scaled scores does not change students’
achievement-level classifications. Given the relative simplicity of raw scores, it is fair to question why scaled
scores for NECAP are reported instead of raw scores. Scaled scores make consistent the reporting of results.
To illustrate, standard setting typically results in different raw cut scores across content areas. The raw cut
score between Partially Proficient and Proficient could be, for example, 35 in mathematics but 33 in reading,
yet both of these raw scores would be transformed to scaled scores of X40. It is this uniformity across scale
scores that facilitates the understanding of student performance. The psychometric advantage of scaled scores
over raw scores comes from their being linear transformations ofθ . Since theθ scale is used for equating,
scaled scores are comparable from one year to the next. Raw scores are not
6.6.2 Calculations
The scaled scores are obtained by a simple translation of ability estimates (θ ) using the linear
relationship between threshold values on the θ metric and their equivalent values on the scaled score metric.
Students’ ability estimates are based on their raw scores and are found by mapping through the TCC. Scaled
scores are calculated using the linear equation
ˆSS m bθ= + where
m is the slope and
b is the intercept
A separate linear transformation is used for each grade content combination. For NECAP tests, each
line is determined by fixing both the Partially Proficient/Proficient cut score and the bottom of the scale; that
is, the X40 value and the X00 value (e.g., 340 and 300, respectively, for grade 3). The lowest scaled score is
at a location on the θ scale beyond the scaling of all the items across the various grade content combinations.
To determine its location, a chance raw score (approximately equal to a student’s expected performance by
guessing), and a raw score of 0, are both mapped to a θ value of –4.0. At the other extreme, the maximum
possible raw score is assigned the scaled score of X80 (e.g., 380 in the case of grade 3).
Because only the Partially Proficient/Proficient cut score is fixed within the θ scaled-score space,
the cut scores between Substantially Below Proficient and Partially Proficient (SBP/PP) and between
Proficient and Proficient with Distinction (P/PWD) vary across the grade/content combinations.
Table 6-3 presents the scaled score cuts for each grade content combination (i.e., the minimum scaled
score for getting into the next achievement level). It is important to repeat that the values in Table 6-3 do not
change from year to year, because the cut scores along theθ scale do not change. Also, in a given year it may
not be possible to attain a particular scaled score, but the scaled score cuts will remain the same.
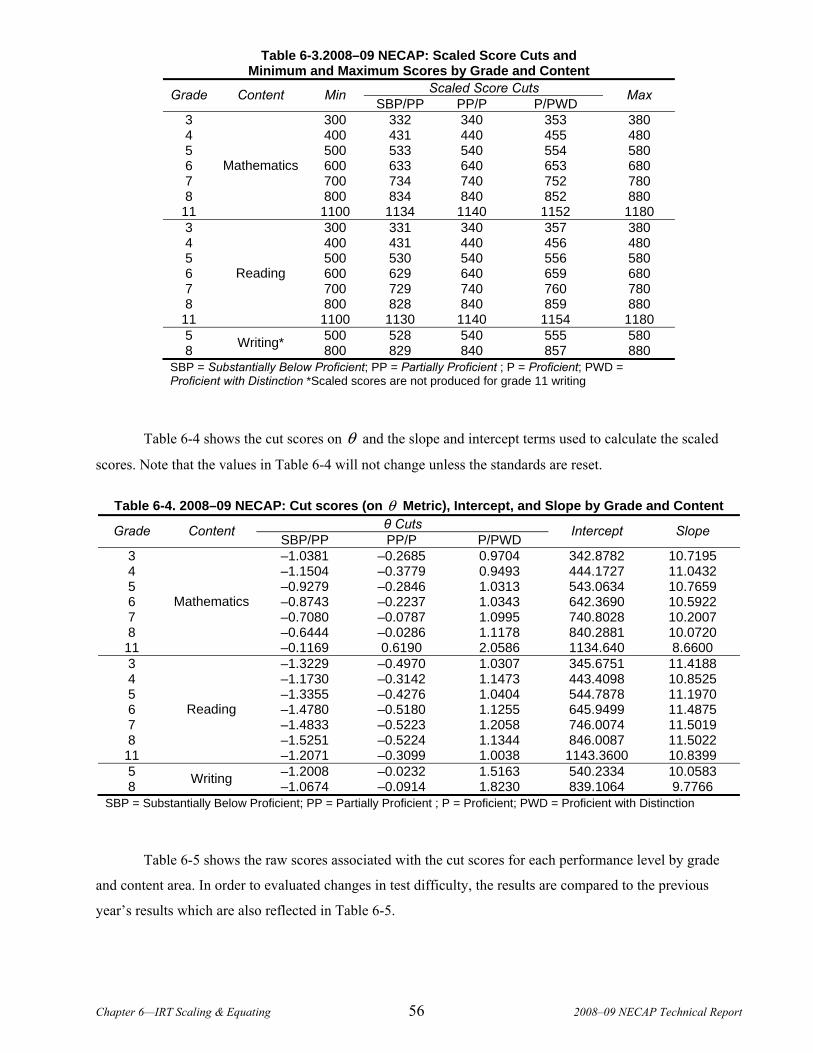
Chapter 6—IRT Scaling & Equating 56 2008–09 NECAP Technical Report
Table 6-3.2008–09 NECAP: Scaled Score Cuts and Minimum and Maximum Scores by Grade and Content
Scaled Score Cuts Grade Content Min SBP/PP PP/P P/PWD
Max
3 300 332 340 353 380 4 400 431 440 455 480 5 500 533 540 554 580 6 600 633 640 653 680 7 700 734 740 752 780 8 800 834 840 852 880
11
Mathematics
1100 1134 1140 1152 1180 3 300 331 340 357 380 4 400 431 440 456 480 5 500 530 540 556 580 6 600 629 640 659 680 7 700 729 740 760 780 8 800 828 840 859 880
11
Reading
1100 1130 1140 1154 1180 5 500 528 540 555 580 8 Writing* 800 829 840 857 880
SBP = Substantially Below Proficient; PP = Partially Proficient ; P = Proficient; PWD = Proficient with Distinction *Scaled scores are not produced for grade 11 writing
Table 6-4 shows the cut scores on θ and the slope and intercept terms used to calculate the scaled
scores. Note that the values in Table 6-4 will not change unless the standards are reset.
Table 6-4. 2008–09 NECAP: Cut scores (on θ Metric), Intercept, and Slope by Grade and Content θ Cuts Grade Content
SBP/PP PP/P P/PWD Intercept Slope
3 –1.0381 –0.2685 0.9704 342.8782 10.7195 4 –1.1504 –0.3779 0.9493 444.1727 11.0432 5 –0.9279 –0.2846 1.0313 543.0634 10.7659 6 –0.8743 –0.2237 1.0343 642.3690 10.5922 7 –0.7080 –0.0787 1.0995 740.8028 10.2007 8 –0.6444 –0.0286 1.1178 840.2881 10.0720 11
Mathematics
–0.1169 0.6190 2.0586 1134.640 8.6600 3 –1.3229 –0.4970 1.0307 345.6751 11.4188 4 –1.1730 –0.3142 1.1473 443.4098 10.8525 5 –1.3355 –0.4276 1.0404 544.7878 11.1970 6 –1.4780 –0.5180 1.1255 645.9499 11.4875 7 –1.4833 –0.5223 1.2058 746.0074 11.5019 8 –1.5251 –0.5224 1.1344 846.0087 11.5022 11
Reading
–1.2071 –0.3099 1.0038 1143.3600 10.8399 5 –1.2008 –0.0232 1.5163 540.2334 10.0583 8 Writing –1.0674 –0.0914 1.8230 839.1064 9.7766
SBP = Substantially Below Proficient; PP = Partially Proficient ; P = Proficient; PWD = Proficient with Distinction
Table 6-5 shows the raw scores associated with the cut scores for each performance level by grade
and content area. In order to evaluated changes in test difficulty, the results are compared to the previous
year’s results which are also reflected in Table 6-5.
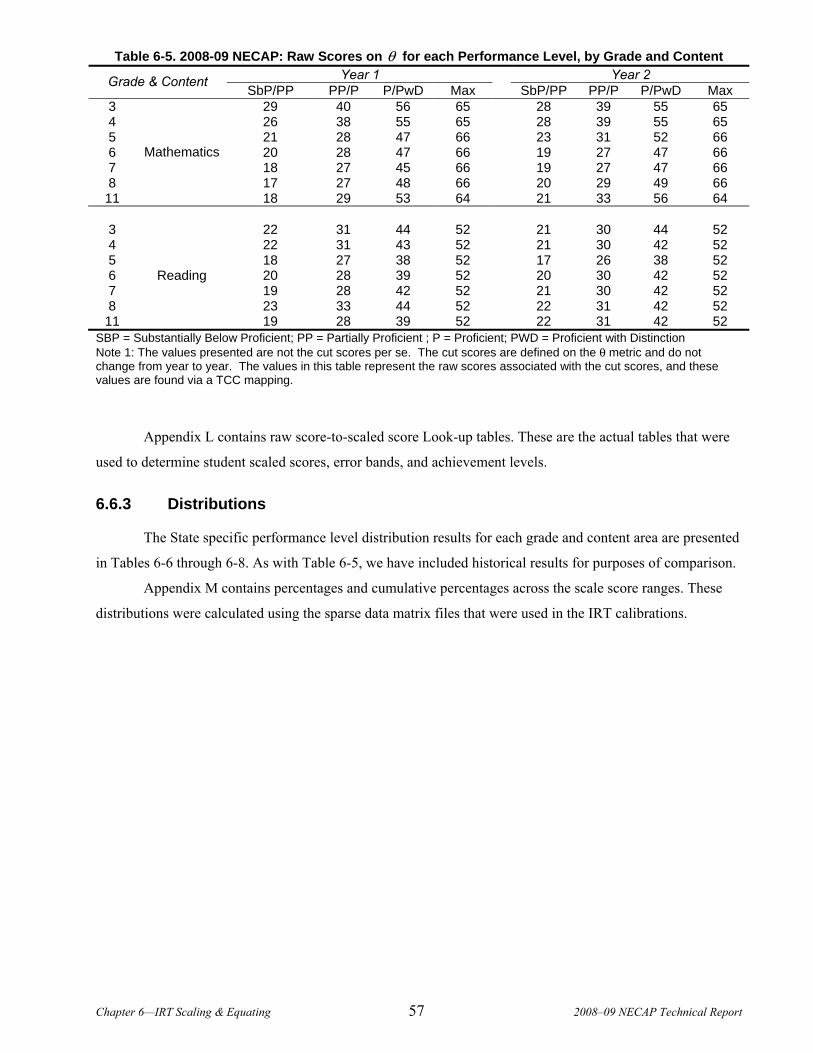
Chapter 6—IRT Scaling & Equating 57 2008–09 NECAP Technical Report
Table 6-5. 2008-09 NECAP: Raw Scores on θ for each Performance Level, by Grade and Content Year 1 Year 2 Grade & Content SbP/PP PP/P P/PwD Max SbP/PP PP/P P/PwD Max
3 29 40 56 65 28 39 55 65 4 26 38 55 65 28 39 55 65 5 21 28 47 66 23 31 52 66 6 20 28 47 66 19 27 47 66 7 18 27 45 66 19 27 47 66 8 17 27 48 66 20 29 49 66 11
Mathematics
18 29 53 64 21 33 56 64
3 22 31 44 52 21 30 44 52 4 22 31 43 52 21 30 42 52 5 18 27 38 52 17 26 38 52 6 20 28 39 52 20 30 42 52 7 19 28 42 52 21 30 42 52 8 23 33 44 52 22 31 42 52 11
Reading
19 28 39 52 22 31 42 52 SBP = Substantially Below Proficient; PP = Partially Proficient ; P = Proficient; PWD = Proficient with Distinction Note 1: The values presented are not the cut scores per se. The cut scores are defined on the θ metric and do not change from year to year. The values in this table represent the raw scores associated with the cut scores, and these values are found via a TCC mapping.
Appendix L contains raw score-to-scaled score Look-up tables. These are the actual tables that were
used to determine student scaled scores, error bands, and achievement levels.
6.6.3 Distributions
The State specific performance level distribution results for each grade and content area are presented
in Tables 6-6 through 6-8. As with Table 6-5, we have included historical results for purposes of comparison.
Appendix M contains percentages and cumulative percentages across the scale score ranges. These
distributions were calculated using the sparse data matrix files that were used in the IRT calibrations.

Chapter 6—IRT Scaling & Equating 58 2008–09 NECAP Technical Report
Table 6-6.2008-09 NECAP: Preliminary Performance Level Distribution Results—New Hampshire
08-09 07-08 06-07 08-09 07-08 06-07 08-09 07-08 06-07 08-09 07-08 06-07 08-09 07-08 06-07 08-09 07-08 06-07 08-09 07-08PwD 22 21 20 24 18 15 23 20 18 23 22 21 22 19 17 18 15 14 2 2
P 49 52 49 49 50 51 50 49 49 46 46 46 44 44 45 47 43 43 30 26BP 18 17 20 16 21 21 14 16 18 16 17 16 18 21 18 19 22 19 30 28
SBP 10 10 10 10 11 13 13 16 15 15 16 16 17 16 20 16 19 24 38 45Ave. SS 345 345 345 446 445 444 546 545 544 645 644 644 744 743 742 843 841 841 1135 1134
P+ (delta) 71 (-2) 73 (4) 69 73 (5) 68 (2) 66 73 (4) 69 (2) 67 69 (1) 68 (1) 67 66 (3) 63 (1) 62 65 (7) 58 (1) 57 32 (4) 28
Math Grade 5Grade 4Grade 3 Grade 11Grade 8Grade 7Grade 6
08-09 07-08 06-07 08-09 07-08 06-07 08-09 07-08 06-07 08-09 07-08 06-07 08-09 07-08 06-07 08-09 07-08 06-07 08-09 07-08PwD 23 14 18 23 19 17 16 18 16 14 15 14 17 15 9 14 13 10 18 17
P 55 63 57 52 55 55 60 53 56 60 58 58 60 60 58 56 54 56 54 50BP 14 14 15 17 17 19 18 21 18 19 19 19 17 18 25 22 23 24 18 22
SBP 8 9 10 8 9 9 6 8 10 8 8 9 6 7 8 8 10 10 10 12Ave. SS 348 347 347 447 446 446 547 546 545 647 646 646 748 747 745 846 845 844 1145 1144
P+ (delta) 78 (1) 77 (2) 75 75 (1) 74 (2) 72 76 (5) 71 (-1) 72 74 (1) 73 (1) 72 77 (2) 75 (8) 67 70 (3) 67 (1) 66 72 (5) 67
Reading Grade 6 Grade 7 Grade 8 Grade 11Grade 3 Grade 4 Grade 5
08-09 07-08 06-07 08-09 07-08 06-07 08-09 07-08PwD 30 16 13 9 7 8 3 3
P 30 36 37 42 36 34 36 30BP 26 30 29 35 40 38 50 49
SBP 14 18 21 14 17 20 11 18Ave. SS 546 541 540 841 839 839 6 5.5
P+ (delta) 60 (8) 52 (2) 50 51 (8) 43 (1) 42 39 (6) 33
Grade 5 Grade 8 Grade 11Writing
*Percentages may not sum to 100 due to rounding.
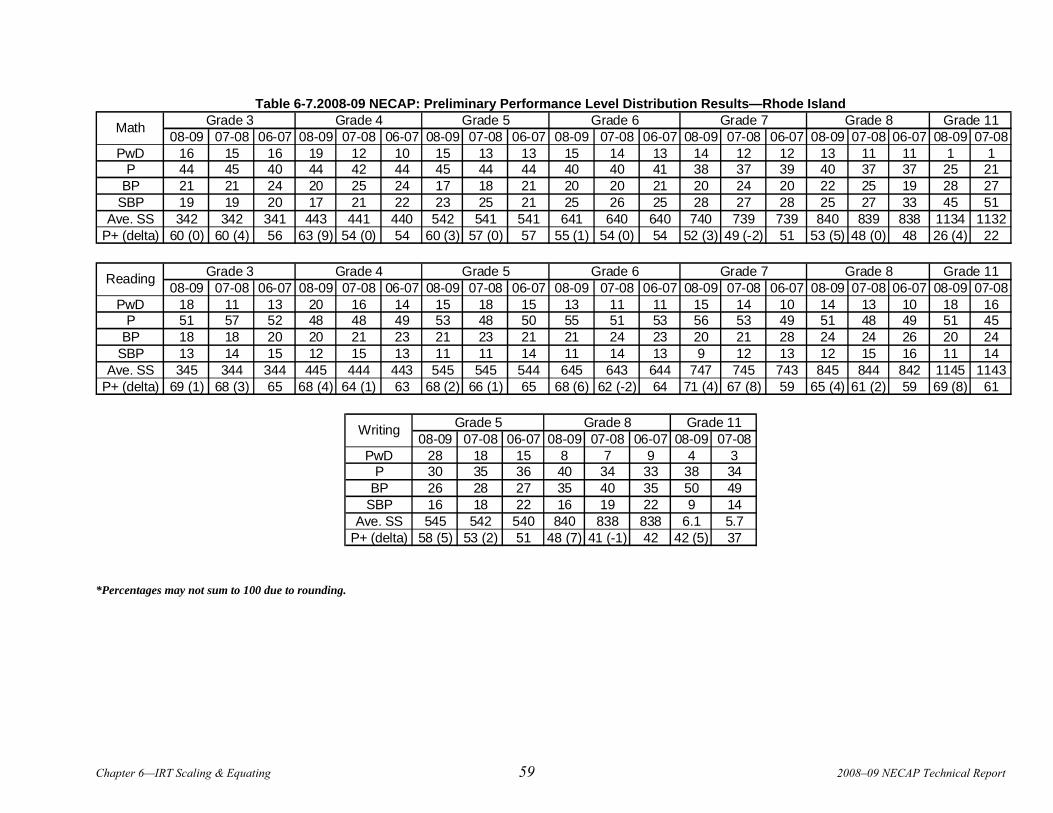
Chapter 6—IRT Scaling & Equating 59 2008–09 NECAP Technical Report
Table 6-7.2008-09 NECAP: Preliminary Performance Level Distribution Results—Rhode Island
08-09 07-08 06-07 08-09 07-08 06-07 08-09 07-08 06-07 08-09 07-08 06-07 08-09 07-08 06-07 08-09 07-08 06-07 08-09 07-08PwD 16 15 16 19 12 10 15 13 13 15 14 13 14 12 12 13 11 11 1 1
P 44 45 40 44 42 44 45 44 44 40 40 41 38 37 39 40 37 37 25 21BP 21 21 24 20 25 24 17 18 21 20 20 21 20 24 20 22 25 19 28 27
SBP 19 19 20 17 21 22 23 25 21 25 26 25 28 27 28 25 27 33 45 51Ave. SS 342 342 341 443 441 440 542 541 541 641 640 640 740 739 739 840 839 838 1134 1132
P+ (delta) 60 (0) 60 (4) 56 63 (9) 54 (0) 54 60 (3) 57 (0) 57 55 (1) 54 (0) 54 52 (3) 49 (-2) 51 53 (5) 48 (0) 48 26 (4) 22
Grade 6 Grade 7 Grade 8 Grade 11Math Grade 3 Grade 4 Grade 5
08-09 07-08 06-07 08-09 07-08 06-07 08-09 07-08 06-07 08-09 07-08 06-07 08-09 07-08 06-07 08-09 07-08 06-07 08-09 07-08PwD 18 11 13 20 16 14 15 18 15 13 11 11 15 14 10 14 13 10 18 16
P 51 57 52 48 48 49 53 48 50 55 51 53 56 53 49 51 48 49 51 45BP 18 18 20 20 21 23 21 23 21 21 24 23 20 21 28 24 24 26 20 24
SBP 13 14 15 12 15 13 11 11 14 11 14 13 9 12 13 12 15 16 11 14Ave. SS 345 344 344 445 444 443 545 545 544 645 643 644 747 745 743 845 844 842 1145 1143
P+ (delta) 69 (1) 68 (3) 65 68 (4) 64 (1) 63 68 (2) 66 (1) 65 68 (6) 62 (-2) 64 71 (4) 67 (8) 59 65 (4) 61 (2) 59 69 (8) 61
Grade 6 Grade 7 Grade 8 Grade 11Reading Grade 3 Grade 4 Grade 5
08-09 07-08 06-07 08-09 07-08 06-07 08-09 07-08PwD 28 18 15 8 7 9 4 3
P 30 35 36 40 34 33 38 34BP 26 28 27 35 40 35 50 49
SBP 16 18 22 16 19 22 9 14Ave. SS 545 542 540 840 838 838 6.1 5.7
P+ (delta) 58 (5) 53 (2) 51 48 (7) 41 (-1) 42 42 (5) 37
Writing Grade 5 Grade 8 Grade 11
*Percentages may not sum to 100 due to rounding.
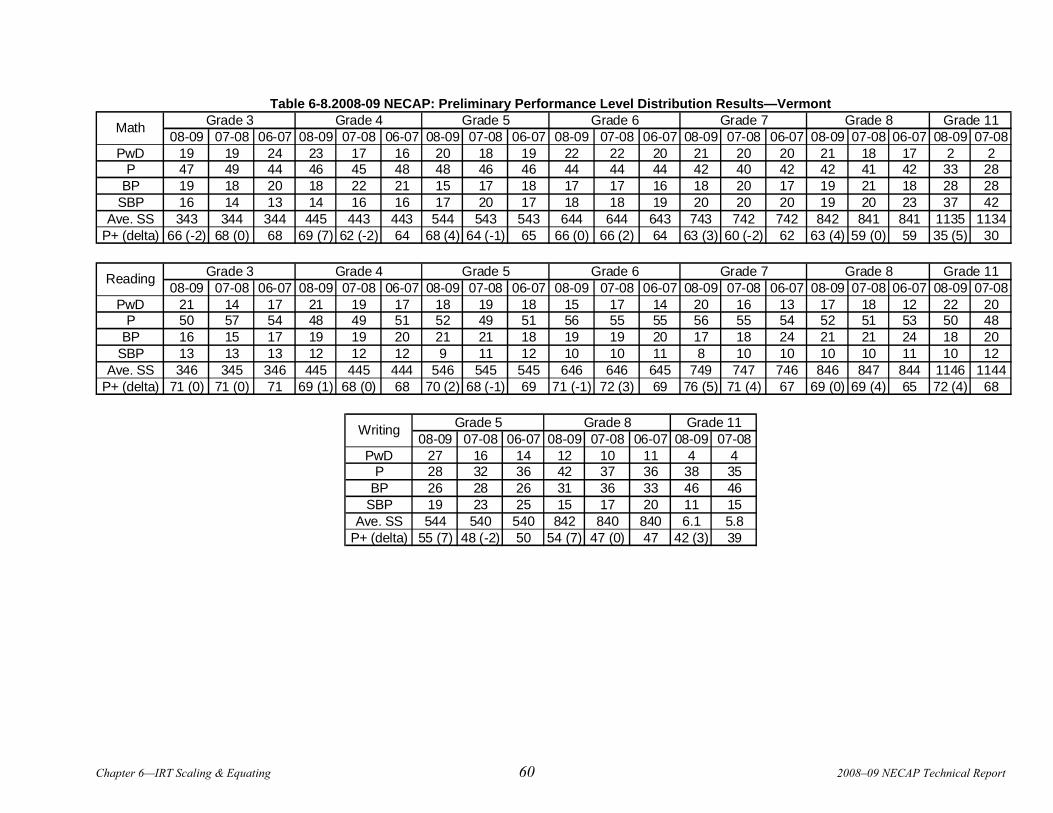
Chapter 6—IRT Scaling & Equating 60 2008–09 NECAP Technical Report
Table 6-8.2008-09 NECAP: Preliminary Performance Level Distribution Results—Vermont
08-09 07-08 06-07 08-09 07-08 06-07 08-09 07-08 06-07 08-09 07-08 06-07 08-09 07-08 06-07 08-09 07-08 06-07 08-09 07-08PwD 19 19 24 23 17 16 20 18 19 22 22 20 21 20 20 21 18 17 2 2
P 47 49 44 46 45 48 48 46 46 44 44 44 42 40 42 42 41 42 33 28BP 19 18 20 18 22 21 15 17 18 17 17 16 18 20 17 19 21 18 28 28
SBP 16 14 13 14 16 16 17 20 17 18 18 19 20 20 20 19 20 23 37 42Ave. SS 343 344 344 445 443 443 544 543 543 644 644 643 743 742 742 842 841 841 1135 1134
P+ (delta) 66 (-2) 68 (0) 68 69 (7) 62 (-2) 64 68 (4) 64 (-1) 65 66 (0) 66 (2) 64 63 (3) 60 (-2) 62 63 (4) 59 (0) 59 35 (5) 30
Grade 6 Grade 7 Grade 8 Grade 11Math Grade 3 Grade 4 Grade 5
08-09 07-08 06-07 08-09 07-08 06-07 08-09 07-08 06-07 08-09 07-08 06-07 08-09 07-08 06-07 08-09 07-08 06-07 08-09 07-08PwD 21 14 17 21 19 17 18 19 18 15 17 14 20 16 13 17 18 12 22 20
P 50 57 54 48 49 51 52 49 51 56 55 55 56 55 54 52 51 53 50 48BP 16 15 17 19 19 20 21 21 18 19 19 20 17 18 24 21 21 24 18 20
SBP 13 13 13 12 12 12 9 11 12 10 10 11 8 10 10 10 10 11 10 12Ave. SS 346 345 346 445 445 444 546 545 545 646 646 645 749 747 746 846 847 844 1146 1144
P+ (delta) 71 (0) 71 (0) 71 69 (1) 68 (0) 68 70 (2) 68 (-1) 69 71 (-1) 72 (3) 69 76 (5) 71 (4) 67 69 (0) 69 (4) 65 72 (4) 68
Grade 6 Grade 7 Grade 8 Grade 11Reading Grade 3 Grade 4 Grade 5
08-09 07-08 06-07 08-09 07-08 06-07 08-09 07-08PwD 27 16 14 12 10 11 4 4
P 28 32 36 42 37 36 38 35BP 26 28 26 31 36 33 46 46
SBP 19 23 25 15 17 20 11 15Ave. SS 544 540 540 842 840 840 6.1 5.8
P+ (delta) 55 (7) 48 (-2) 50 54 (7) 47 (0) 47 42 (3) 39
Writing Grade 5 Grade 8 Grade 11
Chapter 7—Reliability 61 2008–09 NECAP Technical Report
Chapter 7. RELIABILITY Although an individual item’s performance is an important focus for evaluation, a complete
evaluation of an assessment must also address the way items function together and complement one another.
Tests that function well provide a dependable assessment of the student’s level of ability. Unfortunately, no
test can do this perfectly. A variety of factors can contribute to a given student’s score being either higher or
lower than his or her true ability. For example, a student may mis-read an item, or mistakenly fill in the wrong
bubble when he or she knew the answer. Collectively, extraneous factors that impact a student’s score are
referred to as measurement error. Any assessment includes some amount of measurement error; that is, no
measurement is perfect. This is true of all academic assessments—some students will receive scores that
underestimate their true ability, and other students will receive scores that overestimate their true ability.
When tests have a high amount of measurement error, student scores are very unstable. Students with high
ability may get low scores or vice versa. Consequently, one cannot reliably measure a student’s true level of
ability with such a test. Assessments that have less measurement error (i.e., errors made are small on average
and student scores on such a test will consistently represent their ability) are described as reliable.
There are a number of ways to estimate an assessment’s reliability. One possible approach is to give
the same test to the same students at two different points in time. If students receive the same scores on each
test, then the extraneous factors affecting performance are small and the test is reliable. (This is referred to as
test-retest reliability.) A potential problem with this approach is that students may remember items from the
first administration or may have gained (or lost) knowledge or skills in the interim between the two
administrations. A solution to the “remembering items” problem is to give a different, but parallel test at the
second administration. If student scores on each test correlate highly the test is considered reliable. (This is
known as alternate forms reliability, because an alternate form of the test is used in each administration.) This
approach, however, does not address the problem that students may have gained (or lost) knowledge or skills
in the interim between the two administrations. In addition, the practical challenges of developing and
administering parallel forms generally preclude the use of parallel forms reliability indices. One way to
address the latter problems is to split the test in half and then correlate students’ scores on the two half-tests;
this in effect treats each half-test as a complete test. By doing this, the problems associated with an
intervening time interval, and of creating and administering two parallel forms of the test, are alleviated. This
is known as a split-half estimate of reliability. If the two half-test scores correlate highly, items on the two
half-tests must be measuring very similar knowledge or skills. This is evidence that the items complement one
another and function well as a group. This also suggests that measurement error will be minimal.
The split-half method requires psychometricians to select items that contribute to each half-test score.
This decision may have an impact on the resulting correlation, since each different possible split of the test
halves will result in a different correlation. Another problem with the split-half method of calculating
reliability is that it underestimates reliability, because test length is cut in half. All else being equal, a shorter
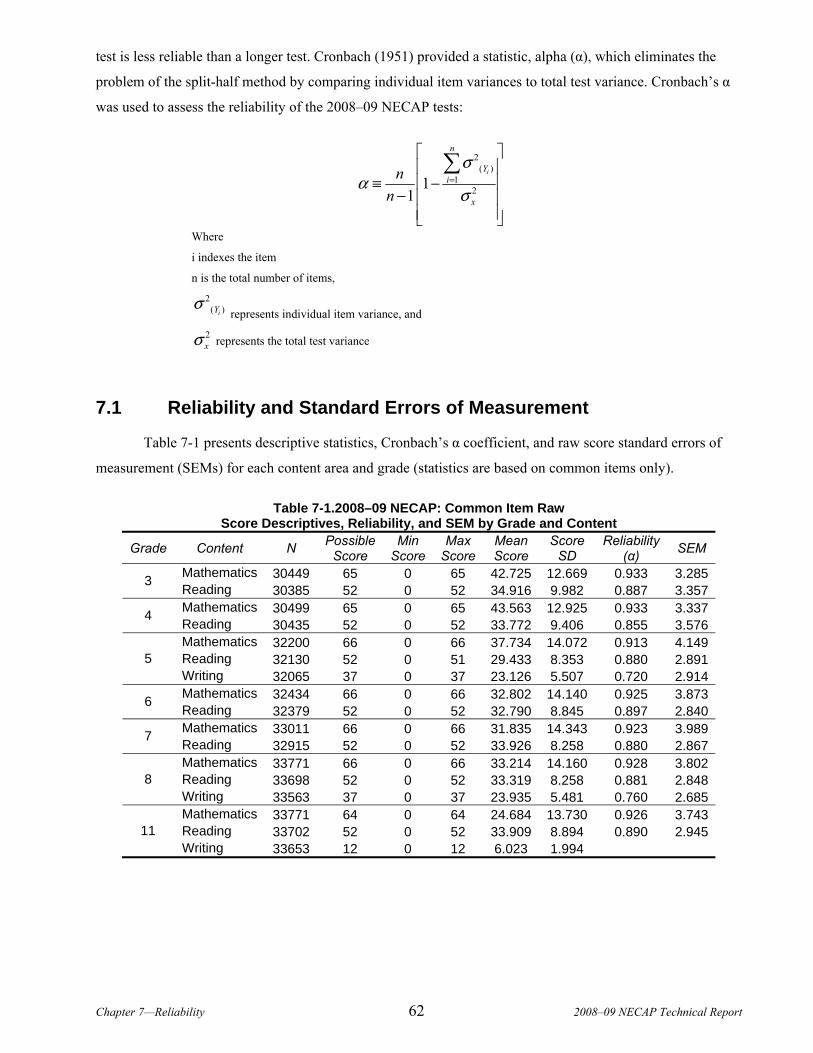
Chapter 7—Reliability 62 2008–09 NECAP Technical Report
test is less reliable than a longer test. Cronbach (1951) provided a statistic, alpha (α), which eliminates the
problem of the split-half method by comparing individual item variances to total test variance. Cronbach’s α
was used to assess the reliability of the 2008–09 NECAP tests:
2( )
121
1
i
n
Yi
x
nn
σα
σ=
⎡ ⎤⎢ ⎥⎢ ⎥≡ −
− ⎢ ⎥⎢ ⎥⎣ ⎦
∑
Where
i indexes the item
n is the total number of items, 2
( )iYσ represents individual item variance, and
2xσ represents the total test variance
7.1 Reliability and Standard Errors of Measurement
Table 7-1 presents descriptive statistics, Cronbach’s α coefficient, and raw score standard errors of
measurement (SEMs) for each content area and grade (statistics are based on common items only).
Table 7-1.2008–09 NECAP: Common Item Raw Score Descriptives, Reliability, and SEM by Grade and Content
Grade Content N Possible Score
Min Score
Max Score
Mean Score
Score SD
Reliability (α) SEM
Mathematics 30449 65 0 65 42.725 12.669 0.933 3.2853 Reading 30385 52 0 52 34.916 9.982 0.887 3.357Mathematics 30499 65 0 65 43.563 12.925 0.933 3.3374 Reading 30435 52 0 52 33.772 9.406 0.855 3.576Mathematics 32200 66 0 66 37.734 14.072 0.913 4.149Reading 32130 52 0 51 29.433 8.353 0.880 2.8915 Writing 32065 37 0 37 23.126 5.507 0.720 2.914Mathematics 32434 66 0 66 32.802 14.140 0.925 3.8736 Reading 32379 52 0 52 32.790 8.845 0.897 2.840Mathematics 33011 66 0 66 31.835 14.343 0.923 3.9897 Reading 32915 52 0 52 33.926 8.258 0.880 2.867Mathematics 33771 66 0 66 33.214 14.160 0.928 3.802Reading 33698 52 0 52 33.319 8.258 0.881 2.8488 Writing 33563 37 0 37 23.935 5.481 0.760 2.685Mathematics 33771 64 0 64 24.684 13.730 0.926 3.743Reading 33702 52 0 52 33.909 8.894 0.890 2.94511 Writing 33653 12 0 12 6.023 1.994
Chapter 7—Reliability 63 2008–09 NECAP Technical Report
For mathematics, the reliability coefficient ranged from 0.91 to 0.93, for reading 0.86 to 0.90. For the
grade 5 and grade 8 writing tests, the values were 0.72 and 0.76, respectively. Because different grades and
content areas have different test designs (e.g., the number of items varies by test), it is inappropriate to make
inferences about the quality of one test by comparing its reliability to that of another test from a different
grade and/or content area.
The Alpha coefficients, broken down by subgroup, item type, and reporting category, are presented in
Appendix N. These detailed α coefficient results are discussed in sections 7.2 through 7.4.
7.2 Subgroup Reliability
The reliability coefficients discussed in the previous section were based on the overall population of
students who took the 2008–09 NECAP tests. Subgroup Cronbach’s α’s were calculated using the formula
defined above using only the members of the subgroup in question in the computations. For mathematics,
subgroup reliabilities ranged from 0.54 to 0.95, for reading from 0.69 to 0.92, and for writing from 0.62 to
0.80.
For several reasons, the results of this section should be interpreted with caution. First, inherent
differences between grades and content areas preclude making valid inferences about the quality of a test
based on statistical comparisons with other tests. Second, reliabilities are dependent not only on the
measurement properties of a test but on the statistical distribution of the studied subgroup. For example, it can
be readily seen in Appendix N that subgroup sample sizes may vary considerably, which results in natural
variation in reliability coefficients. Or α, which is a type of correlation coefficient, may be artificially
depressed for subgroups with little variability (Draper and Smith, 1998). Third, there is no industry standard
to interpret the strength of a reliability coefficient, and this is particularly true when the population of interest
is a single subgroup.
7.3 Item Type Reliability
Another approach to estimating the reliability for a test with differing item types (i.e., multiple-choice
and constructed-response) is to assume that at least a small, but important, degree of unique variance is
associated with item type (Feldt and Brennan, 1989), in contrast to Cronbach’s α, which assumes that there
are no such local or clustered dependencies. A stratified version of coefficient α corrects for this problem by
using the following formula:
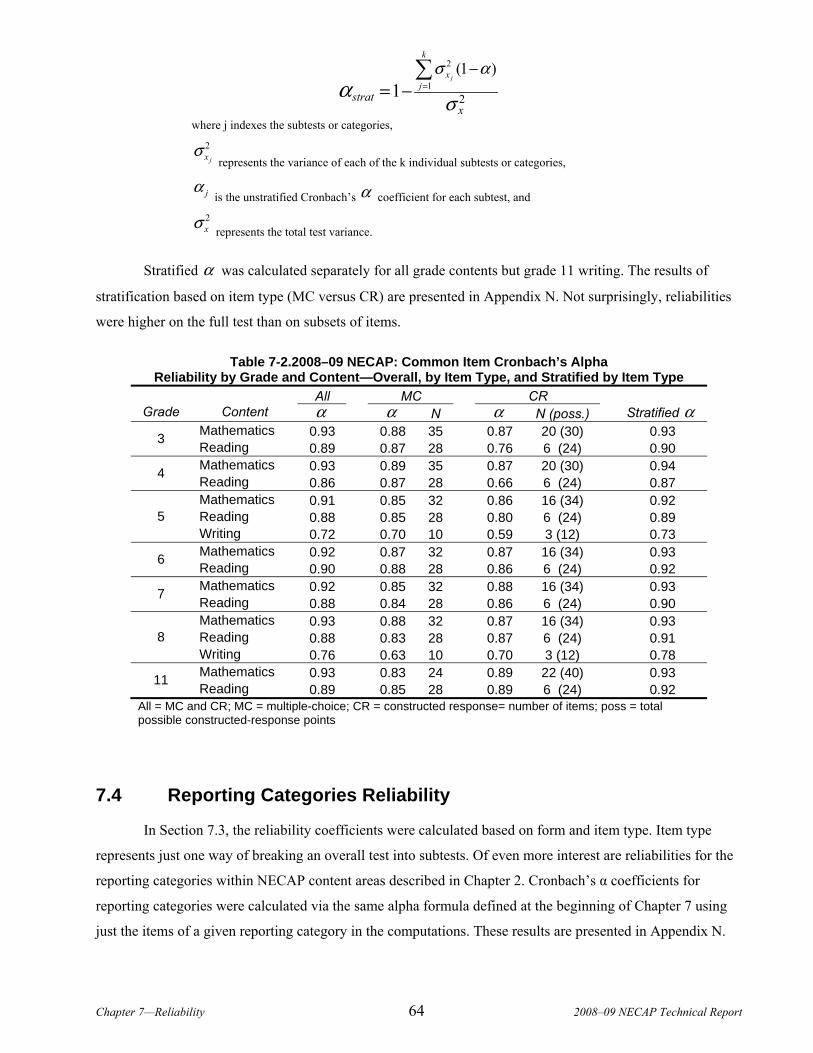
Chapter 7—Reliability 64 2008–09 NECAP Technical Report
2
12
(1 )1 =
−= −
∑ j
k
xj
stratx
σ α
σα
where j indexes the subtests or categories,
2jxσ represents the variance of each of the k individual subtests or categories,
jα is the unstratified Cronbach’s α coefficient for each subtest, and
2xσ
represents the total test variance.
Stratified α was calculated separately for all grade contents but grade 11 writing. The results of
stratification based on item type (MC versus CR) are presented in Appendix N. Not surprisingly, reliabilities
were higher on the full test than on subsets of items.
Table 7-2.2008–09 NECAP: Common Item Cronbach’s Alpha Reliability by Grade and Content—Overall, by Item Type, and Stratified by Item Type
All MC CR Grade Content α α N α N (poss.) Stratified α
Mathematics 0.93 0.88 35 0.87 20 (30) 0.93 3 Reading 0.89 0.87 28 0.76 6 (24) 0.90 Mathematics 0.93 0.89 35 0.87 20 (30) 0.94 4 Reading 0.86 0.87 28 0.66 6 (24) 0.87 Mathematics 0.91 0.85 32 0.86 16 (34) 0.92 Reading 0.88 0.85 28 0.80 6 (24) 0.89 5 Writing 0.72 0.70 10 0.59 3 (12) 0.73 Mathematics 0.92 0.87 32 0.87 16 (34) 0.93 6 Reading 0.90 0.88 28 0.86 6 (24) 0.92 Mathematics 0.92 0.85 32 0.88 16 (34) 0.93 7 Reading 0.88 0.84 28 0.86 6 (24) 0.90 Mathematics 0.93 0.88 32 0.87 16 (34) 0.93 Reading 0.88 0.83 28 0.87 6 (24) 0.91 8 Writing 0.76 0.63 10 0.70 3 (12) 0.78 Mathematics 0.93 0.83 24 0.89 22 (40) 0.93 11 Reading 0.89 0.85 28 0.89 6 (24) 0.92
All = MC and CR; MC = multiple-choice; CR = constructed response= number of items; poss = total possible constructed-response points
7.4 Reporting Categories Reliability
In Section 7.3, the reliability coefficients were calculated based on form and item type. Item type
represents just one way of breaking an overall test into subtests. Of even more interest are reliabilities for the
reporting categories within NECAP content areas described in Chapter 2. Cronbach’s α coefficients for
reporting categories were calculated via the same alpha formula defined at the beginning of Chapter 7 using
just the items of a given reporting category in the computations. These results are presented in Appendix N.
Chapter 7—Reliability 65 2008–09 NECAP Technical Report
Once again as expected, because they are based on a subset of items rather than the full test, computed
reporting category reliabilities were lower (sometimes substantially so) than were overall test reliabilities, and
interpretations should take this into account.
For mathematics, reporting category reliabilities ranged from 0.61 to 0.74, for reading from 0.56 to
0.72, and for writing from 0.06 to 0.76. The reliabilities for the Extended Response writing categories were
substantially lower than those of other categories because 12 of the 15 points for the category came from a
single 12-point writing prompt item. In general, the reporting category reliabilities were lower than those
based on the total test and approximately to the degree one would expect based on CTT. Qualitative
differences between grades and content areas once again preclude valid inferences about the quality of the full
test based on statistical comparisons among subtest.
7.5 Reliability of Achievement Level Categorization
All test scores contain measurement error; thus, classifications based on test scores are also subject to
measurement error. After the 2008–09 NECAP achievement levels were specified and students classified into
those levels, empirical analyses were conducted to determine the statistical accuracy and consistency of the
classifications. For every 2008–09 NECAP grade and content area, each student was classified into one of the
following achievement levels: Substantially Below Proficient (SBP), Partially Proficient (PP), Proficient (P),
or Proficient With Distinction (PWD). This section of the report explains the methodologies used to assess the
reliability of classification decisions and presents the results.
7.5.1 Accuracy and Consistency
Accuracy refers to the extent to which decisions based on test scores match decisions that would have
been made if the scores did not contain any measurement error. Accuracy must be estimated, because
errorless test scores do not exist.
Consistency measures the extent to which classification decisions based on test scores match the
decisions based on scores from a second, parallel form of the same test. Consistency can be evaluated directly
from actual responses to test items if two complete and parallel forms of the test are given to the same group
of students. In operational test programs, however, such a design is usually impractical. Instead, techniques,
such as one due to Livingston and Lewis (1995), have been developed to estimate both the accuracy and
consistency of classification decisions based on a single administration of a test. The Livingston and Lewis
technique was used for the 2008–09 NECAP because it is easily adaptable to all types of testing formats,
including mixed-format tests.
Chapter 7—Reliability 66 2008–09 NECAP Technical Report
7.5.2 Calculating Accuracy
The accuracy and consistency estimates reported below make use of “true scores” in the CTT sense.
A true score is the score that would be obtained if a test had no measurement error. Of course, true scores
cannot be observed and so must be estimated. In the Livingston and Lewis method, estimated true scores are
used to classify students into their “true” achievement level.
For the 2007–08 NECAP, after various technical adjustments were made (described in Livingston and
Lewis, 1995), a 4 x 4 contingency table of accuracy was created for each content area and grade, where cell
[i,j] represented the estimated proportion of students whose true score fell into achievement level i (where i =
1 – 4) and observed score into achievement level j (where j = 1 – 4). The sum of the diagonal entries, i.e., the
proportion of students whose true and observed achievement levels matched one another, signified overall
accuracy.
7.5.3 Calculating Consistency
To estimate consistency, true scores were used to estimate the joint distribution of classifications on
two independent, parallel test forms. Following statistical adjustments (per Livingston and Lewis, 1995), a
new 4 × 4 contingency table was created for each content area and grade and populated by the proportion of
students who would be classified into each combination of achievement levels according to the two
(hypothetical) parallel test forms. Cell [i,j] of this table represented the estimated proportion of students
whose observed score on the first form would fall into achievement level i (where i = 1 – 4), and whose
observed score on the second form would fall into achievement level j(where j = 1 – 4). The sum of the
diagonal entries, i.e., the proportion of students classified by the two forms into exactly the same achievement
level, signified overall consistency.
7.5.4 Calculating Kappa
Another way to measure consistency is to use Cohen’s (1960) coefficient κ (kappa), which assesses
the proportion of consistent classifications after removing the proportion of consistent classifications that
would be expected by chance. It is calculated using the following formula:
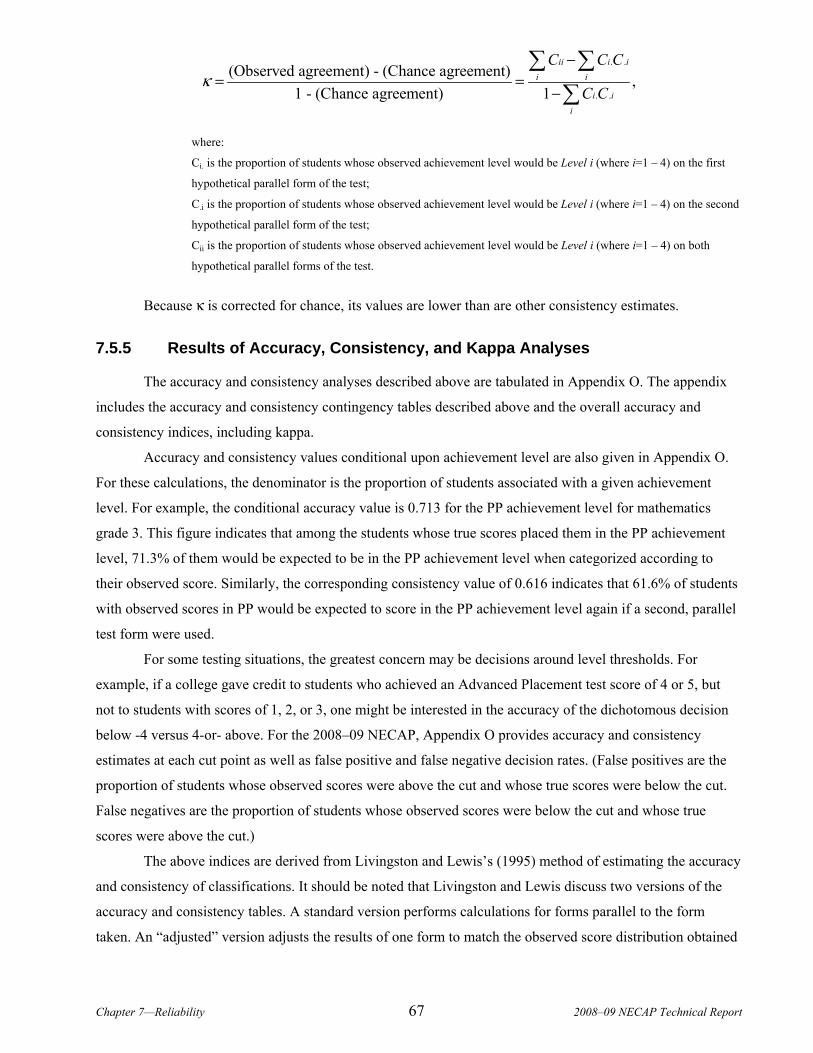
Chapter 7—Reliability 67 2008–09 NECAP Technical Report
. .
. .
(Observed agreement) - (Chance agreement) ,1 - (Chance agreement) 1
ii i i
i i
i i
i
C C C
C Cκ
−= =
−
∑ ∑∑
where:
Ci. is the proportion of students whose observed achievement level would be Level i (where i=1 – 4) on the first
hypothetical parallel form of the test;
C.i is the proportion of students whose observed achievement level would be Level i (where i=1 – 4) on the second
hypothetical parallel form of the test;
Cii is the proportion of students whose observed achievement level would be Level i (where i=1 – 4) on both
hypothetical parallel forms of the test.
Because κ is corrected for chance, its values are lower than are other consistency estimates.
7.5.5 Results of Accuracy, Consistency, and Kappa Analyses
The accuracy and consistency analyses described above are tabulated in Appendix O. The appendix
includes the accuracy and consistency contingency tables described above and the overall accuracy and
consistency indices, including kappa.
Accuracy and consistency values conditional upon achievement level are also given in Appendix O.
For these calculations, the denominator is the proportion of students associated with a given achievement
level. For example, the conditional accuracy value is 0.713 for the PP achievement level for mathematics
grade 3. This figure indicates that among the students whose true scores placed them in the PP achievement
level, 71.3% of them would be expected to be in the PP achievement level when categorized according to
their observed score. Similarly, the corresponding consistency value of 0.616 indicates that 61.6% of students
with observed scores in PP would be expected to score in the PP achievement level again if a second, parallel
test form were used.
For some testing situations, the greatest concern may be decisions around level thresholds. For
example, if a college gave credit to students who achieved an Advanced Placement test score of 4 or 5, but
not to students with scores of 1, 2, or 3, one might be interested in the accuracy of the dichotomous decision
below -4 versus 4-or- above. For the 2008–09 NECAP, Appendix O provides accuracy and consistency
estimates at each cut point as well as false positive and false negative decision rates. (False positives are the
proportion of students whose observed scores were above the cut and whose true scores were below the cut.
False negatives are the proportion of students whose observed scores were below the cut and whose true
scores were above the cut.)
The above indices are derived from Livingston and Lewis’s (1995) method of estimating the accuracy
and consistency of classifications. It should be noted that Livingston and Lewis discuss two versions of the
accuracy and consistency tables. A standard version performs calculations for forms parallel to the form
taken. An “adjusted” version adjusts the results of one form to match the observed score distribution obtained
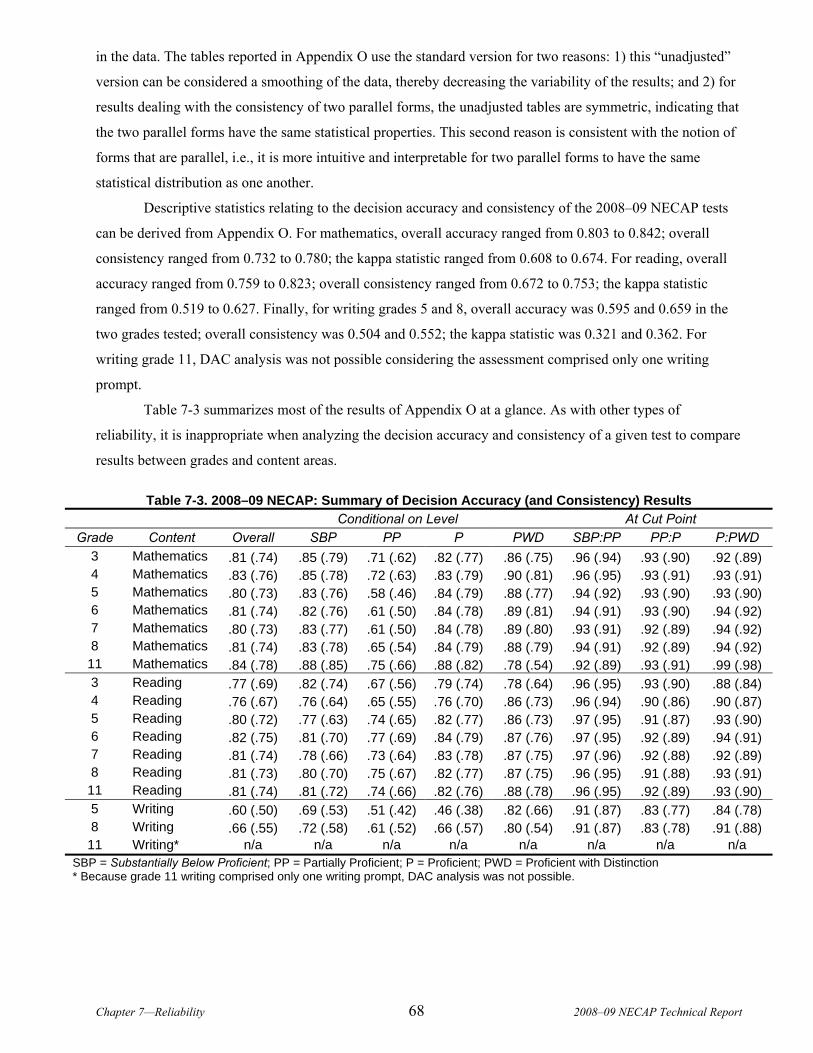
Chapter 7—Reliability 68 2008–09 NECAP Technical Report
in the data. The tables reported in Appendix O use the standard version for two reasons: 1) this “unadjusted”
version can be considered a smoothing of the data, thereby decreasing the variability of the results; and 2) for
results dealing with the consistency of two parallel forms, the unadjusted tables are symmetric, indicating that
the two parallel forms have the same statistical properties. This second reason is consistent with the notion of
forms that are parallel, i.e., it is more intuitive and interpretable for two parallel forms to have the same
statistical distribution as one another.
Descriptive statistics relating to the decision accuracy and consistency of the 2008–09 NECAP tests
can be derived from Appendix O. For mathematics, overall accuracy ranged from 0.803 to 0.842; overall
consistency ranged from 0.732 to 0.780; the kappa statistic ranged from 0.608 to 0.674. For reading, overall
accuracy ranged from 0.759 to 0.823; overall consistency ranged from 0.672 to 0.753; the kappa statistic
ranged from 0.519 to 0.627. Finally, for writing grades 5 and 8, overall accuracy was 0.595 and 0.659 in the
two grades tested; overall consistency was 0.504 and 0.552; the kappa statistic was 0.321 and 0.362. For
writing grade 11, DAC analysis was not possible considering the assessment comprised only one writing
prompt.
Table 7-3 summarizes most of the results of Appendix O at a glance. As with other types of
reliability, it is inappropriate when analyzing the decision accuracy and consistency of a given test to compare
results between grades and content areas.
Table 7-3. 2008–09 NECAP: Summary of Decision Accuracy (and Consistency) Results Conditional on Level At Cut Point
Grade Content Overall SBP PP P PWD SBP:PP PP:P P:PWD 3 Mathematics .81 (.74) .85 (.79) .71 (.62) .82 (.77) .86 (.75) .96 (.94) .93 (.90) .92 (.89) 4 Mathematics .83 (.76) .85 (.78) .72 (.63) .83 (.79) .90 (.81) .96 (.95) .93 (.91) .93 (.91) 5 Mathematics .80 (.73) .83 (.76) .58 (.46) .84 (.79) .88 (.77) .94 (.92) .93 (.90) .93 (.90) 6 Mathematics .81 (.74) .82 (.76) .61 (.50) .84 (.78) .89 (.81) .94 (.91) .93 (.90) .94 (.92) 7 Mathematics .80 (.73) .83 (.77) .61 (.50) .84 (.78) .89 (.80) .93 (.91) .92 (.89) .94 (.92) 8 Mathematics .81 (.74) .83 (.78) .65 (.54) .84 (.79) .88 (.79) .94 (.91) .92 (.89) .94 (.92) 11 Mathematics .84 (.78) .88 (.85) .75 (.66) .88 (.82) .78 (.54) .92 (.89) .93 (.91) .99 (.98) 3 Reading .77 (.69) .82 (.74) .67 (.56) .79 (.74) .78 (.64) .96 (.95) .93 (.90) .88 (.84) 4 Reading .76 (.67) .76 (.64) .65 (.55) .76 (.70) .86 (.73) .96 (.94) .90 (.86) .90 (.87) 5 Reading .80 (.72) .77 (.63) .74 (.65) .82 (.77) .86 (.73) .97 (.95) .91 (.87) .93 (.90) 6 Reading .82 (.75) .81 (.70) .77 (.69) .84 (.79) .87 (.76) .97 (.95) .92 (.89) .94 (.91) 7 Reading .81 (.74) .78 (.66) .73 (.64) .83 (.78) .87 (.75) .97 (.96) .92 (.88) .92 (.89) 8 Reading .81 (.73) .80 (.70) .75 (.67) .82 (.77) .87 (.75) .96 (.95) .91 (.88) .93 (.91) 11 Reading .81 (.74) .81 (.72) .74 (.66) .82 (.76) .88 (.78) .96 (.95) .92 (.89) .93 (.90) 5 Writing .60 (.50) .69 (.53) .51 (.42) .46 (.38) .82 (.66) .91 (.87) .83 (.77) .84 (.78) 8 Writing .66 (.55) .72 (.58) .61 (.52) .66 (.57) .80 (.54) .91 (.87) .83 (.78) .91 (.88) 11 Writing* n/a n/a n/a n/a n/a n/a n/a n/a
SBP = Substantially Below Proficient; PP = Partially Proficient; P = Proficient; PWD = Proficient with Distinction * Because grade 11 writing comprised only one writing prompt, DAC analysis was not possible.
Chapter 8—Validity 69 2008–09 NECAP Technical Report
Chapter 8. VALIDITY Because interpretations of test scores, and not a test itself, are evaluated for validity, the purpose of
the 2008–09 NECAP Technical Report is to describe several technical aspects of the NECAP tests in support
of score interpretations (AERA, 1999). Each chapter contributes an important component in the investigation
of score validation: test development and design; test administration; scoring, scaling, and equating; item
analyses; reliability; and score reporting.
The NECAP tests are based on and aligned with the content standards and performance indicators in
the GLEs for mathematics, reading, and writing. Inferences about student achievement on the content
standards are intended from NECAP results, which in turn serve the evaluation of school accountability and
inform the improvement of programs and instruction.
The Standards for Educational and Psychological Testing (AERA, 1999) provides a framework for
describing sources of evidence that should be considered when evaluating validity. These sources include
evidence on the following five general areas: test content, response processes, internal structure,
consequences of testing, and relationship to other variables. Although each of these sources may speak to a
different aspect of validity, they are not distinct types of validity. Instead, each contributes to a body of
evidence about the comprehensive validity of score interpretations.
A measure of test content validity is to determine how well the test’s tasks represent the curriculum
and standards for each content area and grade level. This is informed by the item development process,
including how test blueprints and test items align with the curriculum and standards. Validation through this
content lens was extensively described in Chapter 2. In other words, the element’s components discussed in
the chapter—item alignment with content standards; item bias; sensitivity and content appropriateness review
processes; adherence to the test blueprint; use of multiple item types; use of standardized administration
procedures, with accommodated options for participation; and appropriate test administration training—are all
components of content-based validity evidence. Every NECAP test question or prompt was aligned by
educators to specific content standards and underwent several rounds of review for content fidelity and
appropriateness. Items of multiple formats (MC, SA, and CR) were presented to students. Finally, tests were
administered according to mandated standardized procedures, with allowable accommodations, and all test
coordinators and test administrators were required to familiarize themselves with and adhere to all of the
procedures outlined in the NECAP Test Coordinator Manual and Test Administrator Manual.
The scoring information in Chapter 4 describes the steps taken to train and monitor hand-scorers as
well as the quality control procedures related to machine-scanning and scoring. Additional studies might be
informative on student response processes. For example, think-aloud protocols could be used to investigate
students’ cognitive processes when confronting test items.
Evidence on internal structure is extensively detailed in the chapters on item analyses, scaling and
equating, and reliability (Chapters 5–7). Technical characteristics of the internal structure of the tests were
Chapter 8—Validity 70 2008–09 NECAP Technical Report
presented in terms of classical item statistics (p-values and discriminations), DIF analyses, several reliability
coefficients, SEMs, multidimensionality hypothesis-testing and effect size estimation, and IRT analyses. In
general, item difficulty indices were within acceptable and expected ranges. Chapter 6 also describes the
procedures used to equate the 2008–09 test to the 2007–08 scales.
Evidence on the consequences of testing is addressed in information on scaled score and reporting in
Chapters 6 and 9 and in the Guide to Using the 2008 NECAP Reports, which is a separate document
referenced in the discussion of reporting. Each of these speak to efforts undertaken for providing the public
with accurate and clear test score information. Scaled scores simplify results reporting across content areas,
grade levels, and successive years. Achievement levels give reference points for mastery at each grade level,
another useful and simple way to interpret scores. Several different standard reports were provided to
stakeholders. Evidence on the consequences of testing could be supplemented with broader research on the
impact on student learning of NECAP testing.
8.1 Questionnaire Data
A measure of external validity was provided by comparing student performance with answers to a
questionnaire administered at the end of test. The grades 3 through 8 questionnaire contained 32 questions (9
concerned reading, 11 mathematics, and 12 writing). The grade 11 questionnaire contained 36 questions (12
concerned writing, 11 reading, and 13 mathematics). Most of the questions were designed to gather
information about students and their study habits; however, a subset could be utilized in the evaluation of
external validity. One question from each content area was most expected to correlate with student
performance on NECAP tests. To the extent that the answers to those questions did correlate with student
performance in the anticipated manner, the external validity of score interpretations was confirmed. The three
questions are now discussed one at a time.
Question 8 (grades 3–8)/Question 21 (grade 11) concerning reading, read as follows
How often do you choose to read in your free time?
A. almost every day
B. a few times a week
C. a few times a month
D. I almost never read.
It was anticipated that students who read more in their free time would have higher average scaled
scores than students who did not read as much. In particular, it was expected that the reading performance of
students who chose “A” would exceed that of students who chose “B,” whose performance would exceed that
of students who chose “C,” whose performance would exceed that of students who chose “D.” This pattern
may be observed in the scaled scores in Table 8-1.
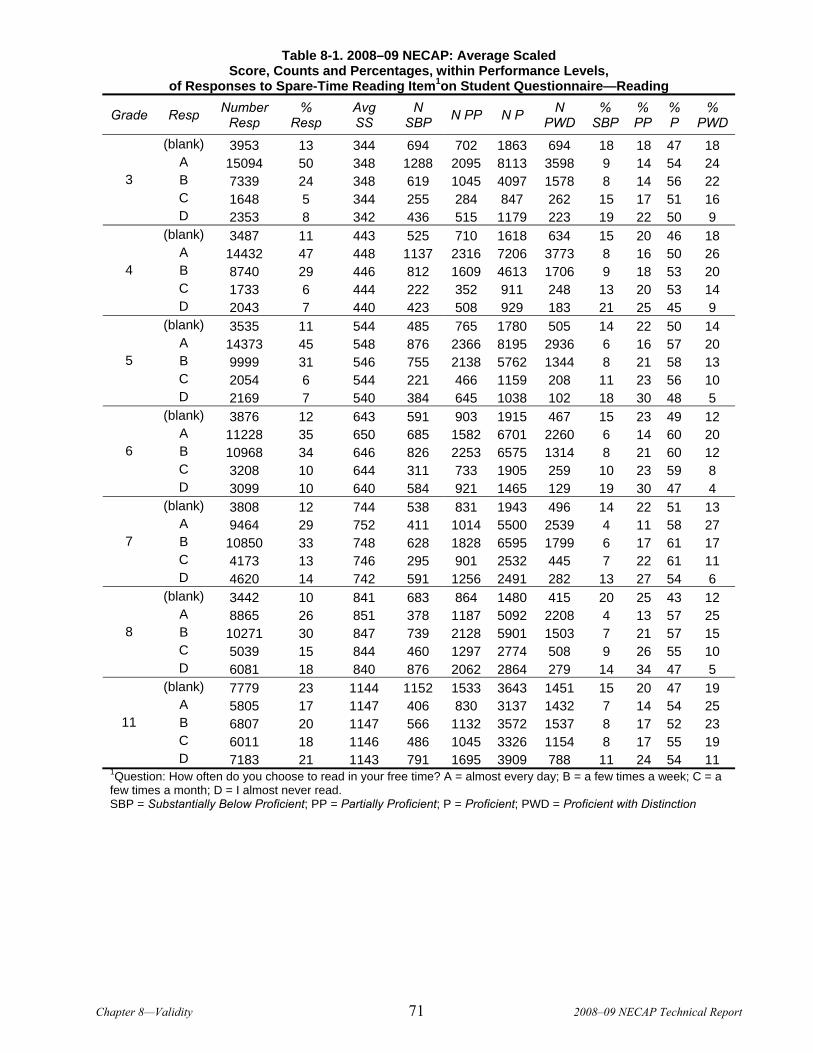
Chapter 8—Validity 71 2008–09 NECAP Technical Report
Table 8-1. 2008–09 NECAP: Average Scaled Score, Counts and Percentages, within Performance Levels,
of Responses to Spare-Time Reading Item1on Student Questionnaire—Reading
Grade Resp Number Resp
% Resp
Avg SS
N SBP N PP N P N
PWD %
SBP % PP
% P
% PWD
(blank) 3953 13 344 694 702 1863 694 18 18 47 18 A 15094 50 348 1288 2095 8113 3598 9 14 54 24 B 7339 24 348 619 1045 4097 1578 8 14 56 22 C 1648 5 344 255 284 847 262 15 17 51 16
3
D 2353 8 342 436 515 1179 223 19 22 50 9 (blank) 3487 11 443 525 710 1618 634 15 20 46 18
A 14432 47 448 1137 2316 7206 3773 8 16 50 26 B 8740 29 446 812 1609 4613 1706 9 18 53 20 C 1733 6 444 222 352 911 248 13 20 53 14
4
D 2043 7 440 423 508 929 183 21 25 45 9 (blank) 3535 11 544 485 765 1780 505 14 22 50 14
A 14373 45 548 876 2366 8195 2936 6 16 57 20 B 9999 31 546 755 2138 5762 1344 8 21 58 13 C 2054 6 544 221 466 1159 208 11 23 56 10
5
D 2169 7 540 384 645 1038 102 18 30 48 5 (blank) 3876 12 643 591 903 1915 467 15 23 49 12
A 11228 35 650 685 1582 6701 2260 6 14 60 20 B 10968 34 646 826 2253 6575 1314 8 21 60 12 C 3208 10 644 311 733 1905 259 10 23 59 8
6
D 3099 10 640 584 921 1465 129 19 30 47 4 (blank) 3808 12 744 538 831 1943 496 14 22 51 13
A 9464 29 752 411 1014 5500 2539 4 11 58 27 B 10850 33 748 628 1828 6595 1799 6 17 61 17 C 4173 13 746 295 901 2532 445 7 22 61 11
7
D 4620 14 742 591 1256 2491 282 13 27 54 6 (blank) 3442 10 841 683 864 1480 415 20 25 43 12
A 8865 26 851 378 1187 5092 2208 4 13 57 25 B 10271 30 847 739 2128 5901 1503 7 21 57 15 C 5039 15 844 460 1297 2774 508 9 26 55 10
8
D 6081 18 840 876 2062 2864 279 14 34 47 5 (blank) 7779 23 1144 1152 1533 3643 1451 15 20 47 19
A 5805 17 1147 406 830 3137 1432 7 14 54 25 B 6807 20 1147 566 1132 3572 1537 8 17 52 23 C 6011 18 1146 486 1045 3326 1154 8 17 55 19
11
D 7183 21 1143 791 1695 3909 788 11 24 54 11 1Question: How often do you choose to read in your free time? A = almost every day; B = a few times a week; C = a few times a month; D = I almost never read. SBP = Substantially Below Proficient; PP = Partially Proficient; P = Proficient; PWD = Proficient with Distinction

Chapter 8—Validity 72 2008–09 NECAP Technical Report
Question 16 (grades 3–8)/Question 32 (grade 11) concerning mathematics read as follows
How often do you have mathematics homework [assignments]?
A. almost every day
B. a few times a week
C. a few times a month
D. I usually don’t have homework in mathematics.
The relationship between the question and student performance in mathematics (see Table 8-2)
mirrored the scaled-score pattern observed for reading as, on average, mathematics performance appeared
related to the frequency of mathematics homework assignments.”
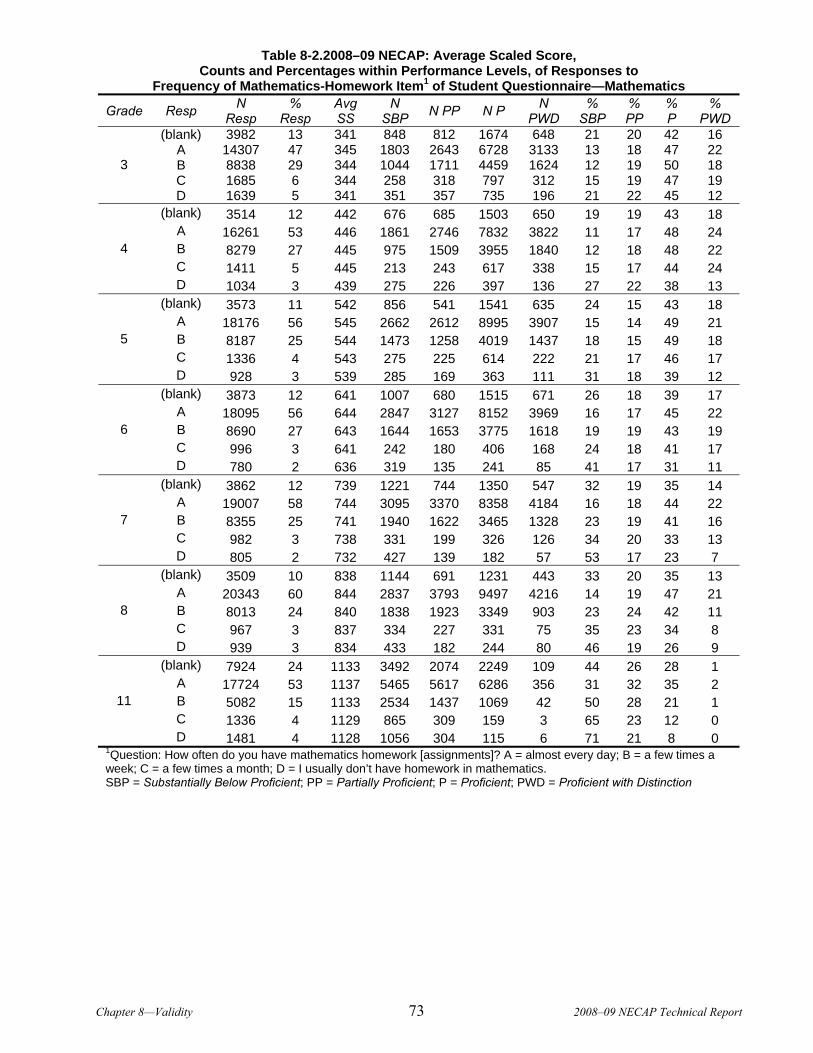
Chapter 8—Validity 73 2008–09 NECAP Technical Report
Table 8-2.2008–09 NECAP: Average Scaled Score, Counts and Percentages within Performance Levels, of Responses to
Frequency of Mathematics-Homework Item1 of Student Questionnaire—Mathematics
Grade Resp N Resp
% Resp
Avg SS
N SBP N PP N P N
PWD %
SBP % PP
% P
% PWD
(blank) 3982 13 341 848 812 1674 648 21 20 42 16 A 14307 47 345 1803 2643 6728 3133 13 18 47 22 B 8838 29 344 1044 1711 4459 1624 12 19 50 18 C 1685 6 344 258 318 797 312 15 19 47 19
3
D 1639 5 341 351 357 735 196 21 22 45 12 (blank) 3514 12 442 676 685 1503 650 19 19 43 18
A 16261 53 446 1861 2746 7832 3822 11 17 48 24 B 8279 27 445 975 1509 3955 1840 12 18 48 22 C 1411 5 445 213 243 617 338 15 17 44 24
4
D 1034 3 439 275 226 397 136 27 22 38 13 (blank) 3573 11 542 856 541 1541 635 24 15 43 18
A 18176 56 545 2662 2612 8995 3907 15 14 49 21 B 8187 25 544 1473 1258 4019 1437 18 15 49 18 C 1336 4 543 275 225 614 222 21 17 46 17
5
D 928 3 539 285 169 363 111 31 18 39 12 (blank) 3873 12 641 1007 680 1515 671 26 18 39 17
A 18095 56 644 2847 3127 8152 3969 16 17 45 22 B 8690 27 643 1644 1653 3775 1618 19 19 43 19 C 996 3 641 242 180 406 168 24 18 41 17
6
D 780 2 636 319 135 241 85 41 17 31 11 (blank) 3862 12 739 1221 744 1350 547 32 19 35 14
A 19007 58 744 3095 3370 8358 4184 16 18 44 22 B 8355 25 741 1940 1622 3465 1328 23 19 41 16 C 982 3 738 331 199 326 126 34 20 33 13
7
D 805 2 732 427 139 182 57 53 17 23 7 (blank) 3509 10 838 1144 691 1231 443 33 20 35 13
A 20343 60 844 2837 3793 9497 4216 14 19 47 21 B 8013 24 840 1838 1923 3349 903 23 24 42 11 C 967 3 837 334 227 331 75 35 23 34 8
8
D 939 3 834 433 182 244 80 46 19 26 9 (blank) 7924 24 1133 3492 2074 2249 109 44 26 28 1
A 17724 53 1137 5465 5617 6286 356 31 32 35 2 B 5082 15 1133 2534 1437 1069 42 50 28 21 1 C 1336 4 1129 865 309 159 3 65 23 12 0
11
D 1481 4 1128 1056 304 115 6 71 21 8 0 1Question: How often do you have mathematics homework [assignments]? A = almost every day; B = a few times a week; C = a few times a month; D = I usually don’t have homework in mathematics. SBP = Substantially Below Proficient; PP = Partially Proficient; P = Proficient; PWD = Proficient with Distinction
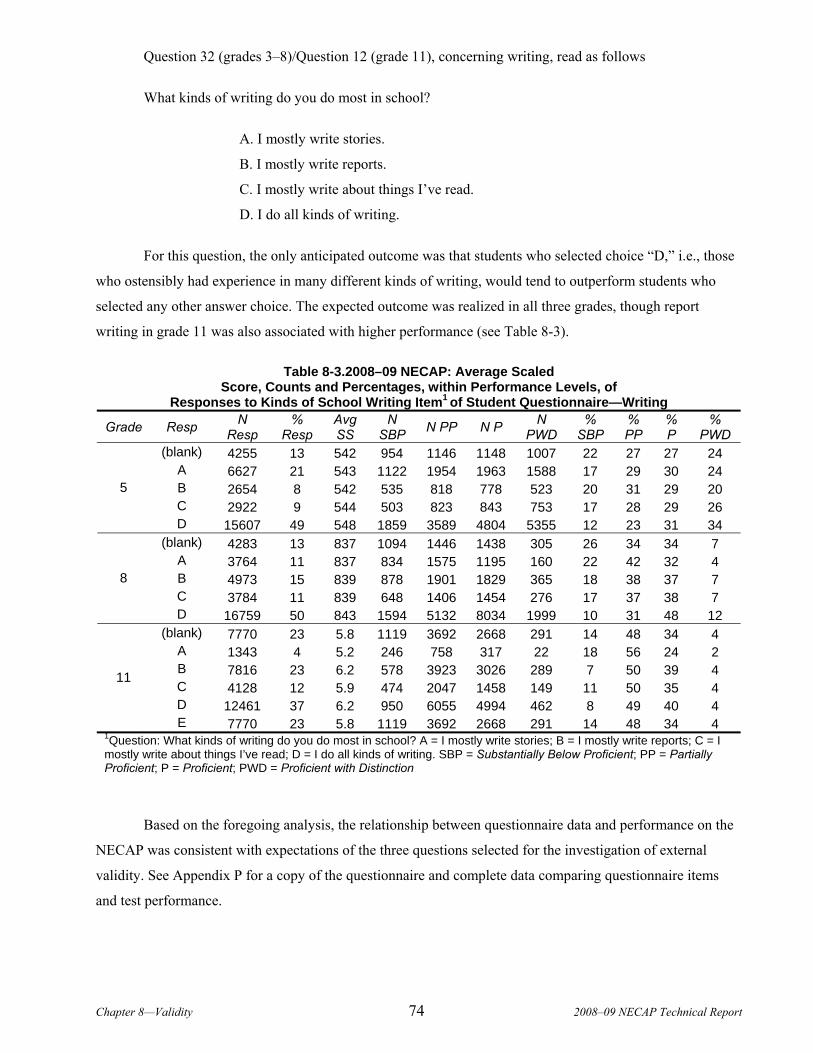
Chapter 8—Validity 74 2008–09 NECAP Technical Report
Question 32 (grades 3–8)/Question 12 (grade 11), concerning writing, read as follows
What kinds of writing do you do most in school?
A. I mostly write stories.
B. I mostly write reports.
C. I mostly write about things I’ve read.
D. I do all kinds of writing.
For this question, the only anticipated outcome was that students who selected choice “D,” i.e., those
who ostensibly had experience in many different kinds of writing, would tend to outperform students who
selected any other answer choice. The expected outcome was realized in all three grades, though report
writing in grade 11 was also associated with higher performance (see Table 8-3).
Table 8-3.2008–09 NECAP: Average Scaled Score, Counts and Percentages, within Performance Levels, of
Responses to Kinds of School Writing Item1 of Student Questionnaire—Writing
Grade Resp N Resp
% Resp
Avg SS
N SBP N PP N P N
PWD %
SBP % PP
% P
% PWD
(blank) 4255 13 542 954 1146 1148 1007 22 27 27 24 A 6627 21 543 1122 1954 1963 1588 17 29 30 24 B 2654 8 542 535 818 778 523 20 31 29 20 C 2922 9 544 503 823 843 753 17 28 29 26
5
D 15607 49 548 1859 3589 4804 5355 12 23 31 34 (blank) 4283 13 837 1094 1446 1438 305 26 34 34 7
A 3764 11 837 834 1575 1195 160 22 42 32 4 B 4973 15 839 878 1901 1829 365 18 38 37 7 C 3784 11 839 648 1406 1454 276 17 37 38 7
8
D 16759 50 843 1594 5132 8034 1999 10 31 48 12 (blank) 7770 23 5.8 1119 3692 2668 291 14 48 34 4
A 1343 4 5.2 246 758 317 22 18 56 24 2 B 7816 23 6.2 578 3923 3026 289 7 50 39 4 C 4128 12 5.9 474 2047 1458 149 11 50 35 4 D 12461 37 6.2 950 6055 4994 462 8 49 40 4
11
E 7770 23 5.8 1119 3692 2668 291 14 48 34 4 1Question: What kinds of writing do you do most in school? A = I mostly write stories; B = I mostly write reports; C = I mostly write about things I’ve read; D = I do all kinds of writing. SBP = Substantially Below Proficient; PP = Partially Proficient; P = Proficient; PWD = Proficient with Distinction
Based on the foregoing analysis, the relationship between questionnaire data and performance on the
NECAP was consistent with expectations of the three questions selected for the investigation of external
validity. See Appendix P for a copy of the questionnaire and complete data comparing questionnaire items
and test performance.

Chapter 8—Validity 75 2008–09 NECAP Technical Report
8.2 Validity Studies Agenda
The remaining part of this chapter describes further studies of validity that could enhance the
investigations of validity that have already been performed. The proposed areas of validity to be examined fall
into four categories: external validity, convergent and discriminant validity, structural validity, and
procedural validity. These will be discussed in turn.
8.2.1 External Validity
In the future, investigations of external validity could involve targeted examination of variables which
one might expect correlate with NECAP results, like classroom grades or classroom test scores in the same
content areas as the NECAP test in question, for example.
Further evidence of external validity might come from correlating NECAP scores with scores on
another standardized test, such as the Iowa Test of Basic Skills (ITBS). As with the study of concordance
between NECAP scores and grades, this investigation would compare scores in analogous content areas (e.g.,
NECAP reading and ITBS reading comprehension). All tests taken by each student would be appropriate to
the student’s grade level.
8.2.2 Convergent and Discriminant Validity
The concepts of convergent and discriminant validity were defined by Campbell and Fiske (1959) as
specific types of validity that fall under the umbrella of construct validity. The notion of convergent validity
states that measures or variables that are intended to align with one another should actually be aligned in
practice. Discriminant validity, on the other hand, is the idea that measures or variables that are intended to
differ from one another should not be too highly correlated. Evidence for validity comes from examining
whether the correlations among variables are as expected in direction and magnitude.
Campbell and Fiske (1959) introduced the study of different traits and methods as the means of
assessing convergent and discriminant validity. Traits refer to the constructs that are being measured (e.g.,
mathematical ability), and methods are the instruments of measuring them (e.g., a mathematics test or grade).
To utilize the framework of Campbell and Fiske, it is necessary that more than one trait and more than one
method be examined. Analysis is performed through the multi-trait/multi-method matrix, which gives all
possible correlations of the different combinations of traits and methods. Campbell and Fiske defined four
properties of the multi-trait/multi-method matrix that serve as evidence of convergent and discriminant
validity:
The correlation among different methods of measuring the same trait should be sufficiently
different from zero. For example, scores on a mathematics test and grades in a mathematics class
should be positively correlated.

Chapter 8—Validity 76 2008–09 NECAP Technical Report
The correlation among different methods of measuring the same trait should be higher than that
of different methods of measuring different traits. For example, scores on a mathematics test and
grades in a mathematics class should be more highly correlated than are scores on a mathematics
test and grades in a reading class.
The correlation among different methods of measuring the same trait should be higher than the
same method of measuring different traits. For example, scores on a mathematics test and grades
in a mathematics class should be more highly correlated than scores on a mathematics test and
scores on an analogous reading test.
The pattern of correlations should be similar across comparisons of different traits and methods.
For example, if the correlation between test scores in reading and writing is higher than the
correlation between test scores in reading and mathematics, it is expected that the correlation
between grades in reading and writing would also be higher than the correlation between grades
in reading and mathematics.
For NECAP, convergent and discriminant validity could be examined by constructing a multi-
trait/multi-method matrix and analyzing the four pieces of evidence described above. The traits examined
would be mathematics, reading, and writing; different methods could include NECAP score and such
variables as grades, teacher judgments, scores on another standardized test, etc.
8.2.3 Structural Validity
Though the previous types of validity examine the concurrence between different measures of the
same content area, structural validity focuses on the relation between strands within a content area, thus
supporting content validity. Standardized tests are carefully designed to ensure that all appropriate strands of a
content area are adequately covered in a test, and structural validity is the degree to which related elements of
a test are correlated in the intended manner. For instance, it is desired that performance on different strands of
a content area be positively correlated; however, as these strands are designed to measure distinct components
of the content area, it is reasonable to expect that each strand would contribute a unique component to the test.
Additionally, it is desired that the correlation between different item types (MC, SA, and CR) of the same
content area be positive.
As an example, an analysis of NECAP structural validity would investigate the correlation between
performance in Geometry and Measurement and performance in Functions and Algebra. Additionally, the
concordance between performance on MC items and CR items would be examined. Such a study would
address the consistency of NECAP tests within each grade and content area. In particular, the dimensionality
analyses of Chapter 5 could be expanded to include confirmatory analyses addressing these concerns.
Chapter 8—Validity 77 2008–09 NECAP Technical Report
8.2.4 Procedural Validity
As mentioned earlier, the NECAP Test Coordinator and Test Administrator manuals delineated the
procedures to which all NECAP test coordinators and test administrators were required to adhere. A study of
procedural validity would provide a comprehensive documentation of the procedures that were followed
throughout the NECAP administration. The results of the documentation would then be compared to the
manuals, and procedural validity would be confirmed to the extent that the two were in alignment. Evidence
of procedural validity is important because it verifies that the actual administration practices were in accord
with the intentions of the design.
Possible instances where discrepancies can exist between design and implementation include the
following: A teacher spirals test forms incorrectly within a classroom; cheating among students occurs;
answer documents are scanned incorrectly. These are examples of administration error. A study of procedural
validity involves capturing any administration errors and presenting them within a cohesive document for
review.
All potential tests of validity that have been introduced in this chapter should be considered by the
NECAP Technical Advisory Committee (NECAP TAC) during 2009–10. With the advice of the NECAP
TAC, the states will develop short-term and longer term (e.g., 2-year to 5-year) plans for validity studies


Chapter 9—Score Reporting 79 2008–09 NECAP Technical Report
SECTION III—NECAP REPORTING Chapter 9. SCORE REPORTING
9.1 Teaching Year vs. Testing Year Reporting
The data used for the NECAP reports are the results of the fall 2008 administration of the NECAP
test. It is important to note that the NECAP tests are based on the GLEs from the previous year. For example,
the grade 7 NECAP test administered in the fall of seventh grade is based on the grade 6 GLEs. Because
many students receive instruction at a different school from where they were tested, the state Departments of
Education determined that access to results information would be valuable to both the school where the
student was tested and the school where the student received instruction. To achieve this goal, separate Item
Analysis, School and District Results, and School and District Summary reports were created for the “testing”
school and the “teaching” school. Every student who participated in the NECAP test was represented in
testing reports, and most students were represented in teaching reports. In some cases (e.g. a student who
recently moved to the state), it is not possible to provide information for a student in a “teaching” report.
9.2 Primary Reports
There were four primary reports for the 2008–09 NECAP:
Student Report
Item Analysis Report
School and District Results Report
School and District Summary Report
With the exception of the Student Report, all reports were available for schools and districts to view
or download on a password-secure Website hosted by Measured Progress. Student-level data files were also
available for districts to download from the secure Web site. Each of these reports is described in the
following sections. Sample reports are provided in Appendix Q.
9.3 Student Report
The NECAP Student Report is a single-page double-sided report printed on 8.5” by 14” paper. The
front of the report includes informational text about the design and uses of the assessment. The front of the
report also contains text describing the three corresponding sections on the reverse side of the student report
and the achievement level definitions. The reverse side of the student report provides a complete picture of an
individual student’s performance on the NECAP, divided into three sections. The first section provides the
student’s overall performance for each content area. The student’s achievement levels are provided, and
Chapter 9—Score Reporting 80 2008–09 NECAP Technical Report
scaled scores are presented numerically as well as in a graphic that depicts the scaled score with the standard
error of measurement bar constructed about it, set within the full range of possible scaled scores demarcated
into the four achievement levels.
The second section displays the student’s achievement level in each content area relative to the
percentage of students at each achievement level within the school, district, and state.
The third section shows the student’s raw-score performance in content area reporting categories
relative to possible points, gives the average points earned for the school, district, and state; and gives the
average points earned by students at the Proficient level on the overall content area test. For reading, with the
exception of Word ID/Vocabulary items, items are reported by Type of Text (Literary, Informational) and
Level of Comprehension (Initial Understanding, Analysis and Interpretation). For mathematics, the reporting
subcategories are Numbers and Operations; Geometry and Measurement; Functions and Algebra; and Data,
Statistics, and Probability. The content area categories for writing at grades 5 and 8 are Structures of
Language & Writing Conventions, Short Responses and Extended Response. Grade 11 writing only reports
Extended Response as a category.
During scoring of the writing prompt, each scorer selects up to three comments about the student’s
writing performance. The comments are selected from a predetermined list produced by the writing
representatives from each state’s Department of Education. These scorers’ comments are presented in a box
next to the writing results.
The NECAP Student Report is confidential and should be kept secure within the school and district.
The Family Educational Rights and Privacy Act (FERPA) requires that access to individual student results be
restricted to the student, the student’s parents/guardians, and authorized school personnel.
9.4 Item Analysis Reports
The NECAP Item Analysis Report provides a roster of all students in a school and provides their
performances on the common items that are released to the public, one report per content area. For all grades
and content areas, the student names and identification numbers are listed as row headers down the left side of
the report. For grades 3 through 8 and 11 in reading and mathematics, and grades 5 and 8 writing, the items
are listed as column headers in the same order they appeared in the released item documents (not the position
in which they appeared on the test).
For each item, seven pieces of information are shown: the released item number, the content strand
for the item, the GLE/GSE code for the item, the DOK code for the item, the item type, the correct response
key for MC items, and the total possible points.
For each student, MC items are marked either with a plus sign (+), indicating that the student chose
the correct MC response, or a letter (from A to D), indicating the incorrect response chosen by the student.
For SA and CR items, the number of points earned is shown. All responses to released items are shown in the
report, regardless of the student’s participation status.
Chapter 9—Score Reporting 81 2008–09 NECAP Technical Report
The columns on the right side of the report show the Total Test Results, broken into several
categories. A Subcategory Points Earned columns show points earned by the student in each content area
relative to total points possible. A Total Points Earned column is a summary of all points earned and total
possible points in the content area. The last two columns show the student’s Scaled Score and Achievement
Level. Students reported as Not Tested are given a code in the Achievement Level column to indicate the
reason why the student did not test. Descriptions of these codes can be found on the legend, after the last page
of data on the report. It is important to note that not all items used to compute student scores are included in
this report, only released items. At the bottom of the report, the average percentage correct for each MC item
and average scores for the SA and CR items and writing prompts are shown for the school, district, and state.
For grade 11 writing, the top portion of the NECAP Item Analysis Report consists of a single row of
item information containing: the content stand, GSE codes, DOK code, item type/writing prompt, and total
possible points. The student names and identification numbers are listed as row headers down the left side of
the report. The Total Test Results section to the right includes Total Points Earned and Achievement Level for
each student. At the bottom, the average points earned on the writing prompt are provided for the school,
district, and state.
The NECAP Item Analysis Report is confidential and should be kept secure within the school and
district. The FERPA requires that access to individual student results be restricted to the student, the student’s
parents/guardians, and authorized school personnel.
9.5 School and District Results Reports
The NECAP School Results Report and the NECAP District Results Report consist of three parts: the
grade level summary report (page 2), the results for the content areas (pages 3, 5, and 7), and the
disaggregated content area results (pages 4, 6, and 8).
The grade level summary report provides a summary of participation in the NECAP and a summary
of NECAP results. The participation section on the top half of the page shows the number and percentage of
students who were enrolled on or after October 1, 2008. The total number of students enrolled is defined as
the number of students tested plus the number of students not tested.
Because students who were not tested did not participate, average school scores were not affected by
non-tested students. These students were included in the calculation of the percentage of students
participating, but not in the calculation of scores. For students who participated in some but not all sessions of
the NECAP test, actual scores were reported for the content areas in which they participated. These reporting
decisions were made to support the requirement that all students participate in the NECAP testing program.
Data are provided for the following groups of students who may not have completed the entire battery
of NECAP tests:
Chapter 9—Score Reporting 82 2008–09 NECAP Technical Report
Alternate Assessment: Students in this category completed an alternate test for the 2007–08
school year.
First-Year LEP: Students in this category are defined as being new to the United States after
October 1, 2007 and were not required to take the NECAP tests in reading and writing. Students
in this category were expected to take the mathematics portion of the NECAP.
Withdrew After October 1: Students withdrawing from a school after October 1, 2008 may
have taken some sessions of the NECAP tests prior to their withdrawal from the school.
Enrolled After October 1: Students enrolling in a school after October 1, 2008 may not have
had adequate time to participate fully in all sessions of NECAP testing.
Special Consideration: Schools received state approval for special consideration for an
exemption on all or part of the NECAP tests for any student whose circumstances are not
described by the previous categories but for whom the school determined that taking the NECAP
tests would not be possible.
Other: Occasionally students will not have completed the NECAP tests for reasons other than
those listed above. These “other” categories were considered not state approved.
The results section in the bottom half of the page shows the number and percentage of students
performing at each achievement level in each of the three content areas across the school, district, and state. In
addition, a mean scaled score is provided for each content area across school, district, and state levels except
for grade 11 writing where the mean raw score is provided across the school, district, and state. School
information is blank for the district version of this report..
The content area results pages provide information on performance in specific content categories of
the tested content areas (for example, Geometry, and Measurement within mathematics). The purpose of these
sections is to help schools to determine the extent to which their curricula are effective in helping students to
achieve the particular standards and benchmarks contained in the Grade-Level and Grade-Span Expectations.
Information about each content area (reading, mathematics and writing) for school, district, and state includes
the total number of students enrolled, not tested (state-approved reason), not tested (other reason),
and tested;
the total number and percentage of students at each achievement level (based on the number in
the tested column); and
the mean scaled score.
Information about each content area reporting category for reading, mathematics and writing includes
the following

Chapter 9—Score Reporting 83 2008–09 NECAP Technical Report
The total possible points for that category. In order to provide as much information as possible for
each category, the total number of points includes both the common items used to calculate scores
and additional items in each category used for equating the test from year to year.
A graphic display of the percent of total possible points for the school, state, and district. In this
graphic display, there are symbols representing school, district, and state performance. In
addition, there is a line representing the standard error of measurement. This statistic indicates
how much a student’s score could vary if the student were examined repeatedly with the same test
(assuming that no learning were to occur between test administrations).
For grade 11 writing only, a column showing the number of prompts for each subtopic (strand) is
also provided, as well as the distribution of score points across prompts within each strand in
terms of percentages for the school, district, and state.
The disaggregated content area results pages present the relationship between performance and
student reporting variables (see list below) in each content area across school, district, and state levels. Each
content area page shows the number of students categorized as enrolled, not tested (state-approved reason),
not tested (other reason), and tested. The tables also provide the number and percentage of students within
each of the four achievement levels and the mean scaled score by each reporting category.
The list of student reporting categories is as follows:
All Students
Gender
Primary Race/Ethnicity
LEP Status (limited English proficiency)
IEP
SES (socioeconomic status)
Migrant
Title I
504 Plan
The data for achievement levels and mean scaled score are based on the number shown in the tested
column. The data for the reporting categories were provided by information coded on the students’ answer
booklets by teachers and/or data linked to the student label. Because performance is being reported by
categories that can contain relatively low numbers of students, school personnel are advised, under FERPA
guidelines, to treat these pages confidentially.
It should be noted that for NH and VT, no data were reported for the 504 Plan in any of the content
areas. In addition, for VT, no data were reported for Title I in any of the content areas.
Chapter 9—Score Reporting 84 2008–09 NECAP Technical Report
9.6 School and District Summary Reports
The NECAP School Summary Report and the NECAP District Summary Report provide details,
broken down by content area, on student performance by grade level tested in the school. The purpose of the
summary is to help schools determine the extent to which their students achieve the particular standards and
benchmarks contained in the Grade-Level Expectations and Grad- Span Expectations.
Information about each content area and grade level for school, district, and state includes
the total number of students enrolled, not tested (state-approved reason), not tested (other reason),
and tested;
the total number and percentage of students at each achievement level (based on the number in
the tested column); and
the mean scaled score (mean raw score for grade 11 writing)
The data reported, the report format, and the guidelines for using the reported data are identical for
both the school and district reports. The only difference between the reports is that the NECAP District
Summary Report includes no individual school data. Separate school report and district reports were produced
for each grade level tested.
9.7 Decision Rules
To ensure that reported results for the 2008–09 NECAP are accurate relative to collected data and
other pertinent information, a document that delineates analysis and reporting rules was created. These
decision rules were observed in the analyses of NECAP test data and in reporting the test results. Moreover,
these rules are the main reference for quality assurance checks.
The decision rules document used for reporting results of the October 2008 administration of the
NECAP is found in Appendix R.
The first set of rules pertains to general issues in reporting scores. Each issue is described, and
pertinent variables are identified. The actual rules applied are described by the way they impact analyses and
aggregations and their specific impact on each of the reports. The general rules are further grouped into issues
pertaining to test items, school type, student exclusions, and number of students for aggregations.
The second set of rules pertains to reporting student participation. These rules describe which students
were counted and reported for each subgroup in the student participation report.

Chapter 9—Score Reporting 85 2008–09 NECAP Technical Report
9.8 Quality Assurance
Quality assurance measures are embedded throughout the entire process of analysis and reporting.
The data processor, data analyst, and psychometrician assigned to work on NECAP implement quality control
checks of their respective computer programs and intermediate products. Moreover, when data are handed off
to different functions within the Research and Analysis division, the sending function verifies that the data are
accurate before handoff. Additionally, when a function receives a data set, the first step is to verify the data
for accuracy.
Another type of quality assurance measure is parallel processing. Students’ scaled scores for each
content area are assigned by a psychometrician through a process of equating and scaling. The scaled scores
are also computed by a data analyst to verify that scaled scores and corresponding achievement levels are
assigned accurately. Respective scaled scores and assigned achievement levels are compared across all
students for 100% agreement. Different exclusions that determine whether each student receives scaled scores
and/or is included in different levels of aggregation are also parallel-processed. Using the decision rules
document, two data analysts independently write a computer program that assigns students’ exclusions. For
each content area and grade combination, the exclusions assigned by each data analyst are compared across
all students. Only when 100% agreement is achieved can the rest of data analysis be completed.
The third aspect of quality control involves the procedures implemented by the quality assurance
group to check the accuracy of reported data. Using a sample of schools and districts, the quality assurance
group verifies that reported information is correct. The step is conducted in two parts: (1) verify that the
computed information was obtained correctly through appropriate application of different decision rules and
(2) verify that the correct data points populate each cell in the NECAP reports. The selection of sample
schools and districts for this purpose is very specific and can affect the success of the quality control efforts.
There are two sets of samples selected that may not be mutually exclusive.
The first set includes those that satisfy the following criteria:
One-school district
Two-school district
Multi-school district

Chapter 9—Score Reporting 86 2008–09 NECAP Technical Report
The second set of samples includes districts or schools that have unique reporting situations as
indicated by decision rules. This second set is necessary to ensure that each rule is applied correctly. The
second set includes the following criteria:
Private school
Small school that receives no school report
Small district that receives no district report
District that receives a report but all schools are too small to receive a school report
School with excluded (not tested) students
School with home-schooled students
The quality assurance group uses a checklist to implement its procedures. After the checklist is
completed, sample reports are circulated for psychometric checks and program management review. The
appropriate sample reports are then presented to the client for review and sign-off.
References 87 2008–09 NECAP Technical Report
SECTION IV—REFERENCES American Educational Research Association, American Psychological Association, and National Council on
Measurement in Education (1999). Standards for Educational and Psychological Testing. Washington, DC: American Educational Research Association.
Brown, F. G. (1983). Principles of educational and psychological testing (3rd ed.). Fort Worth: Holt, Rinehart and Winston.
Campbell, D. T., and Fiske, D. W. (1959). Convergent and discriminant validation by the multitrait-multimethod matrix. Psychological Bulletin, 56, 81–105.
Cohen, J. (1960). A coefficient of agreement for nominal scales. Educational and Psychological Measurement, 20, 37–46.
Cronbach, L. J. (1951). Coefficient alpha and the internal structure of tests. Psychometrika, 16, 297–334.
Dorans, N. J., and Holland, P. W. (1993). DIF detection and description. In P. W. Holland and H. Wainer (Eds.), Differential item functioning (pp. 35–66). Hillsdale, NJ: Lawrence Erlbaum Associates.
Dorans, N. J., and Kulick, E. (1986). Demonstrating the utility of the standardization approach to assessing unexpected differential item performance on the Scholastic Aptitude Test. Journal of Educational Measurement, 23, 355–368.
Draper, N. R., and Smith, H. (1998). Applied Regression Analysis (3rd ed.). New York: John Wiley and Sons, Inc.
Feldt, L. S., and Brennan, R. L. (1989). Reliability. In R. L. Linn (Ed.), Educational measurement (3rd ed.) (pp. 105–146). New York: Macmillan Publishing Co.
Hambleton, R. K., and Swaminathan, H. (1985). Item response theory: Principles and applications. Boston, MA: Kluwer Academic Publishers.
Hambleton, R. K., Swaminathan, H., and Rogers, H. J. (1991). Fundamentals of item response theory. Newbury Park, CA: Sage Publications.
Hambleton, R. K., and van der Linden, W. J. (1997). Handbook of modern item response theory. New York: Springer-Verlag.
Joint Committee on Testing Practices (1988). Code of Fair Testing Practices in Education. Washington, D.C.: National Council on Measurement in Education.
Livingston, S. A., and Lewis, C. (1995). Estimating the consistency and accuracy of classifications based on test scores. Journal of Educational Measurement, 32, 179–197.
Lord, F. M., and Novick, M. R. (1968). Statistical theories of mental test scores. Reading, MA: Addison-Wesley.
Muraki, E. and R. D. Bock (2003). PARSCALE 4.1. Lincolnwood, IL: Scientific Software International.
Subkoviak, M.J. (1976). Estimating reliability from a single administration of a mastery test. Journal of Educational Measurement, 13, 265 –276.
References 88 2008–09 NECAP Technical Report
Stout, W. F. (1987). A nonparametric approach for assessing latent trait dimensionality. Psychometrika, 52, 589 –617.
Stout, W. F., Froelich, A. G., and Gao, F. (2001). Using resampling methods to produce an improved DIMTEST procedure. In A. Boomsma, M. A. J. van Duign, & T. A. B. Snijders (Eds.), Essays on Item Response Theory, (pp. 357 –375). New York: Springer-Verlag.
Zhang, J., and Stout, W. F. (1999). The theoretical DETECT index of dimensionality and its application to approximate simple structure. Psychometrika, 64, 213 –249.

Appendices 89 2008–09 NECAP Technical Report
APPENDICES

![1 Appendix: Common distributionsfaculty.chicagobooth.edu/nicholas.polson/teaching/41900/Appendices...1 Appendix: Common distributions ... Beta • A random variable X ∈ [0,1] has](https://img.dokumen.tips/doc/110x75/5ae3e1407f8b9a595d8f03f5/1-appendix-common-appendix-common-distributions-beta-a-random-variable.jpg)


