Embed Size (px)
Citation preview
New England Common Assessment Program
2007–2008
Technical Report
June 2008
100 Education Way, Dover, NH 03820 (800) 431-8901


i
Table of Contents
CHAPTER 1 OVERVIEW ................................................................................................................................................ 1 1.1 Purpose of the New England Common Test Program .................................................................................. 1 1.2 Purpose of this Report .................................................................................................................................. 1 1.3 Organization of this Report .......................................................................................................................... 2
SECTION I—DESCRIPTION OF THE 2007 NECAP TEST ....................................................................................... 3
CHAPTER 2 DEVELOPMENT AND TEST DESIGN ............................................................................................................ 3 2.1 2006 Grade 11 Pilot Test .............................................................................................................................. 3
2.1.1 Test Design of the 2006 Grade 11 Pilot .................................................................................................................... 4 2.1.2 Administration of the 2006 Grade 11 Pilot Test ........................................................................................................ 5 2.1.3 Scoring of the 2006 Grade 11 Pilot Test ................................................................................................................... 5
2.2 Operational Development Process ............................................................................................................... 6 2.2.1 Grade-Level Expectations ......................................................................................................................................... 6 2.2.2 External Item Review ................................................................................................................................................ 6 2.2.3 Internal Item Review ................................................................................................................................................. 7 2.2.4 Bias and Sensitivity Review ...................................................................................................................................... 8 2.2.5 Item Editing............................................................................................................................................................... 9 2.2.6 Reviewing and Refining ............................................................................................................................................ 9 2.2.7 Operational Test Assembly ....................................................................................................................................... 9 2.2.8 Editing Drafts of Operational Tests ......................................................................................................................... 11 2.2.9 Braille and Large-Print Translation ......................................................................................................................... 12
2.3 Item Types ................................................................................................................................................... 12 2.4 Operational Test Designs and Blueprints ................................................................................................... 13
2.4.1 Embedded Equating Items and Field Test ............................................................................................................... 13 2.4.2 Test Booklet Design ................................................................................................................................................ 14
2.5 Reading Test Designs.................................................................................................................................. 14 2.5.1 Reading Blueprint ................................................................................................................................................... 15
2.6 Mathematics Test Design ............................................................................................................................ 17 2.6.1 The Use of Calculators on the NECAP ................................................................................................................... 18 2.6.2 Mathematics Blueprint ............................................................................................................................................ 19
2.7 Writing Test Design .................................................................................................................................... 20 2.7.1 Writing Blueprint: Grades 5, and 8 ......................................................................................................................... 21 2.7.2 Writing Blueprint: Grade 11.................................................................................................................................... 23
2.8 Test Sessions ............................................................................................................................................... 24 CHAPTER 3 TEST ADMINISTRATION .......................................................................................................................... 27
3.1 Responsibility for Administration ............................................................................................................... 27 3.2 Administration Procedures ......................................................................................................................... 27 3.3 Participation Requirements and Documentation ........................................................................................ 27 3.4 Administrator Training ............................................................................................................................... 31 3.5 Documentation of Accommodations ........................................................................................................... 31 3.6 Test Security................................................................................................................................................ 34 3.7 Test and Administration Irregularities ....................................................................................................... 35 3.8 Test Administration Window ....................................................................................................................... 36 3.9 NECAP Service Center ............................................................................................................................... 36
CHAPTER 4 SCORING ................................................................................................................................................. 37 4.1 Imaging Process ......................................................................................................................................... 37 4.2 Quality Control ........................................................................................................................................... 37 4.3 Hand-Scoring .............................................................................................................................................. 38
4.3.1 iScore ...................................................................................................................................................................... 38 4.3.2 Scorer Qualifications ............................................................................................................................................... 39
4.4 Benchmarking ............................................................................................................................................. 39 4.5 Selecting and Training Quality Assurance Coordinators and Senior Readers ........................................... 40
4.5.1 Selecting Readers .................................................................................................................................................... 40 4.5.2 Training Readers ..................................................................................................................................................... 40 4.5.3 Monitoring Readers ................................................................................................................................................. 41
4.6 Scoring Locations ....................................................................................................................................... 42 4.7 External Observations ................................................................................................................................ 43
CHAPTER 5 SCALING AND EQUATING ........................................................................................................................ 45 5.1 Item Response Theory Scaling .................................................................................................................... 45 5.2 Equating ...................................................................................................................................................... 47

ii
5.3 Standard Setting .......................................................................................................................................... 48 5.4 Reported Scale Scores ................................................................................................................................. 49
5.4.1 Description of Scale ................................................................................................................................................ 49 5.4.2 Calculations............................................................................................................................................................. 50 5.4.3 Distributions ............................................................................................................................................................ 52
SECTION II - STATISTICAL AND PSYCHOMETRIC SUMMARIES ................................................................... 53
CHAPTER 6 ITEM ANALYSES ...................................................................................................................................... 53 6.1 Difficulty Indices ......................................................................................................................................... 53 6.2 Item–Test Correlations ............................................................................................................................... 54 6.3 Summary of Item Analysis Results .............................................................................................................. 55 6.4 Differential Item Functioning ..................................................................................................................... 56 6.5 Dimensionality Analyses ............................................................................................................................. 67 6.6 Item Response Theory Analyses .................................................................................................................. 70 6.7 Equating Results ......................................................................................................................................... 71
CHAPTER 7 RELIABILITY ........................................................................................................................................... 73 7.1 Reliability and Standard Errors of Measurement ....................................................................................... 74 7.2 Subgroup Reliability ................................................................................................................................... 74 7.3 Stratified Coefficient Alpha ......................................................................................................................... 75 7.4 Reporting Subcategories Reliability ........................................................................................................... 79 7.5 Reliability of Achievement Level Categorization ........................................................................................ 81
7.5.1 Accuracy and Consistency ...................................................................................................................................... 81 7.5.2 Calculating Accuracy .............................................................................................................................................. 82 7.5.3 Calculating Consistency .......................................................................................................................................... 82 7.5.4 Calculating Kappa ................................................................................................................................................... 83 7.5.5 Results of Accuracy, Consistency, and Kappa Analyses ......................................................................................... 83
CHAPTER 8 VALIDITY ................................................................................................................................................ 87 8.1 Questionnaire Data ..................................................................................................................................... 89 8.2 Validity Studies Agenda .............................................................................................................................. 93
8.2.1 External Validity ..................................................................................................................................................... 93 8.2.2 Convergent and Discriminant Validity .................................................................................................................... 94 8.2.3 Structural Validity ................................................................................................................................................... 95 8.2.4 Procedural Validity ................................................................................................................................................. 96
SECTION III —2007-08 NECAP REPORTING ........................................................................................................... 99
CHAPTER 9 SCORE REPORTING .................................................................................................................................. 99 9.1 Teaching Year vs. Testing Year Reporting .................................................................................................. 99 9.2 Primary Reports .......................................................................................................................................... 99 9.3 Student Report ........................................................................................................................................... 100 9.4 Item Analysis Reports ............................................................................................................................... 101 9.5 School and District Results Reports .......................................................................................................... 102 9.6 School and District Summary Reports ...................................................................................................... 106 9.7 Decision Rules .......................................................................................................................................... 107 9.8 Quality Assurance ..................................................................................................................................... 108
SECTION IV -- REFERENCES.................................................................................................................................... 111
SECTION V—APPENDICES ....................................................................................................................................... 113
Appendix A Committee Membership ......................................................................................................... 115
Appendix B Table of Standard Test Accommodations ............................................................................... 123
Appendix C Appropriateness of Accommodations ..................................................................................... 125
Appendix D Equating Report ..................................................................................................................... 145
Appendix E Item Response Theory Calibration Results ............................................................................ 257
Appendix F NECAP Standard Setting Report ........................................................................................... 299
Appendix G Raw to Scaled Score Conversions .......................................................................................... 389
Appendix H Scales Score Cumulative Density Functions .......................................................................... 421
Appendix I Summary Statistics of Difficulty and Discrimination Indices ................................................ 439
Appendix J Subgroup Reliability .............................................................................................................. 453
Appendix K Decision Accuracy and Consistency Results .......................................................................... 459
Appendix L Student Questionnaire ............................................................................................................ 483
Appendix M Sample Reports ...................................................................................................................... 513
Appendix N Decision Rules ....................................................................................................................... 545

Chapter 1 Overview 1 2007-08 NECAP Technical Report
Chapter 1 OVERVIEW
1.1 Purpose of the New England Common Test Program
The New England Common Test Program (NECAP) is the result of collaboration among
New Hampshire (NH), Rhode Island (RI), and Vermont (VT) to build a set of tests for grades 3
through 8 and 11 to meet the requirements of the No Child Left Behind Act (NCLB). The purposes
of the tests are as follows: (1) Provide data on student achievement in reading/language arts and
mathematics to meet the requirements of NCLB; (2) provide information to support program
evaluation and improvement; and (3) provide to parents and the public information on the
performance of students and schools. The tests are constructed to meet rigorous technical criteria,
include universal design elements and accommodations so that students can access test content, and
gather reliable student demographic information for accurate reporting. School improvement is
supported by
providing a transparent test design through the elementary and middle school grade-level
expectations (GLEs), the high school grade-span expectations (GSEs), distributions of
emphasis, and practice tests
reporting results by GLE/GSE subtopics, released items, and subgroups
hosting test interpretation workshops to foster understanding of results
Student-level results are provided to schools and families to be used as one piece of evidence
about progress and learning that occurred on the prior year’s GLEs/GSEs. The results are a status
report of a student’s performance against GLEs/GSEs and should be used cautiously in concert with
local data.
1.2 Purpose of this Report
The purpose of this report is to document the technical aspects of the 2007–08 NECAP. In
October of 2007, students in grades 3 through 8 and 11 participated in the administration of the

Chapter 1 Overview 2 2007-08 NECAP Technical Report
NECAP in reading and mathematics. Students in grades 5, 8, and 11 also participated in writing.
This report provides information about the technical quality of those tests, including a description of
the processes used to develop, administer, and score the tests and to analyze the test results. This
report is intended to serve as a guide for replicating and/or improving the procedures in subsequent
years.
Though some parts of this technical report may be used by educated laypersons, the intended
audience is experts in psychometrics and educational research. The report assumes a working
knowledge of measurement concepts, such as ―reliability‖ and ―validity,‖ and statistical concepts,
such as ―correlation‖ and ―central tendency.‖ In some chapters, the reader is presumed also to have
basic familiarity with advanced topics in measurement and statistics.
1.3 Organization of this Report
The organization of this report is based on the conceptual flow of a test’s life span; the report
begins with the initial test specification and addresses all the intermediate steps that lead to final
score reporting. Section I provides a description of the NECAP test. It consists of four chapters
covering the test design and development process; the administration of the tests; scoring; and
scaling and equating. Section II provides statistical and psychometric summaries. It consists of three
chapters covering item analysis, reliability, and validity. Section III covers NECAP score reporting.
Section IV contains references, and Section V contains appendices to the report.

Chapter 2 Development and Test Design 3 2007-08 NECAP Technical Report
SECTION I—DESCRIPTION OF THE 2007 NECAP TEST
Chapter 2 DEVELOPMENT AND TEST DESIGN
2.1 2006 Grade 11 Pilot Test
In preparation for the first operational administration of the grade 11 NECAP in October of
2007, a pilot test was conducted in the fall of 2006, with the following purposes:
Field-test all newly developed reading, mathematics, and writing items to be used in the
common and matrix-equating sections of the following year’s operational test.
Try out all procedures and materials of the program (e.g., the timing of test sessions,
accommodations, test administrator and test coordinator manuals, mathematics reference
sheets, and the like) before the first operational administration.
Provide schools the opportunity to experience the new assessment so as to assist them in
preparing for the first operational administration.
Obtain feedback from students, test administrators, and test coordinators in order to make
any necessary modifications.
The test development process for the pilot test mirrored the operational test process described
in this chapter. The numbers of items developed and field-tested are listed on the following page
(where FT=field-test, MC=multiple-choice, CR=constructed-response, SA1=1-point short answer,
SA2=2-point short answer.)
Table 2.1. 2006 NECAP Grade 11 Pilot Items Developed and Field-Tested—Reading
Needed to Populate
First Year (not counting embedded FT)
Initial FT To be Developed
Passages 4 long 4 short
6 long 6 short
8 long 8 short
MC 32 long 16 short
60 long 36 short
80 long 48 short
CR 8 long 4 short
18 long 12 short
24 long 16 short
Stand Alone MC 8 16 20

Chapter 2 Development and Test Design 4 2007-08 NECAP Technical Report
Table 2.2. 2006 NECAP Grade 11 Pilot Items Developed and Field-Tested—Mathematics
Needed to Populate
First Year (not counting embedded FT)
Initial FT To be Developed
MC 48 80 96
SA1 24 32 48
SA2 12 16 24
CR 10 16 20
Table 2.3. 2006 NECAP Grade 11 Pilot Items Developed and Field-Tested—Writing
Needed to Populate First
Year (not counting embedded FT)
Initial FT To be Developed
Stand Alone Writing Prompt
6 12 24
2.1.1 Test Design of the 2006 Grade 11 Pilot
Because one of the purposes of the pilot test administration was to give schools an
opportunity to experience what the operational test would be like, the pilot test forms were
constructed to mirror the intended operational test design. The only difference was that all item
positions on the pilot test forms were populated with field-test items. The designs of the pilot tests
are presented on the following pages. Some items received more exposure than others,
Reading: Grade 11
8 forms: four block A’s and four block B’s
Each passage repeated in two forms – 10 unique MC and 3 unique CR for each long
passage and 6 unique MC and 2 unique CR for each short passage
Each of 4 Block A’s contain 1 Long and 2 Short passages (total of 20 MC and 4 CR) plus
4 MC
Each of 4 Block B’s contain 1 Short and 2 Long passages (total of 20 MC and 5 CR)

Chapter 2 Development and Test Design 5 2007-08 NECAP Technical Report
Table 2.4. 2006 NECAP Grade 11 Reading Pilot Forms Construction
Form/ Block
1
Form/ Block
2
Form/ Block
3
Form/ Block
4
Form/ Block
5
Form/ Block
6
Form/ Block
7
Form/ Block
8 A A A A B B B B
Long Passage L1 L1 L2 L2 L3 L3 L5 L5 MC# 1-8 3-10 1-8 3-10 1-8 3-10 1-8 3-10 CR# 1-2 2-3 1-2 2-3 1-2 2-3 1-2 2-3
Long Passage L4 L4 L6 L6 MC# 1-8 3-10 1-8 3-10 CR# 1-2 2-3 1-2 2-3
Short Passage S1 S1 S3 S3 S5 S5 S6 S6 MC# 1-4 3-6 1-4 3-6 1-4 3-6 1-4 3-6 CR# 1 2 1 2 1 2 1 2
Short Passage S2 S2 S4 S4 MC# 1-4 3-6 1-4 3-6 CR# 1 2 1 2
Stand Alone MC# 1-4 5-8 9-12 13-16
Note: While some piloted items received exposure to more students than others, item statistics were computed on roughly equivalent
samples of examinees.
Mathematics: Grade 11
8 forms, 2 blocks each (one Block A, one Block B)
Block A (non-calculator) = 5 MC, 2 SA1, 1 SA2, 1 CR
Block B (calculator) = 5 MC, 2 SA1, 1 SA2, 1 CR
Writing: Grade 11
12 forms, one unique prompt each
2.1.2 Administration of the 2006 Grade 11 Pilot Test
All schools and all students in grade 11 participated in the pilot test. The test administration
procedures for the pilot test mirrored the procedures for the operational test to ensure an even
distribution of forms among all schools and all students.
2.1.3 Scoring of the 2006 Grade 11 Pilot Test
All student responses to MC questions were scanned and analyzed to produce item statistics.
All available SA, CR, and writing prompt items were benchmarked and scored on a sample of
roughly 1200 students.

Chapter 2 Development and Test Design 6 2007-08 NECAP Technical Report
Because the pilot test was conducted to emulate the subsequent operational test as much as
possible, readers are referred to other chapters of this report for more specific details.
2.2 Operational Development Process
2.2.1 Grade-Level Expectations
NECAP test items are directly linked to content standards and performance indicators
described in the GLEs/GSEs. The content standards for each grade are grouped into content clusters
for purposes of reporting results; the performance indicators are used by content specialists to help
guide the development of test questions. An item may address one, several, or all of the performance
indicators.
2.2.2 External Item Review
Item Review Committees (IRCs) were formed by the states to provide an external review of
items. The committees are made up of teachers, curriculum supervisors, and higher-education
faculty from the states, and all committee members serve rotating terms. A list of IRC member
names and affiliations is included in Appendix A. The committees review test items for the NECAP,
provide feedback on the items, and make recommendations on which items should be selected for
program use. The 2007–08 NECAP IRCs for each content area in grade levels 3 through 8 and 11
met in the spring of 2007. Committee members reviewed the entire set of embedded field-test items
proposed for the 2007–08 operational test and made recommendations about selecting, revising, or
eliminating specific items from the item pool. Members reviewed each item against the following
criteria:
Grade-Level/Grade-Span Expectation Alignment
- Is the test item aligned to the appropriate GLE/GSE?
- If not, which GLE/GSE or grade level is more appropriate?

Chapter 2 Development and Test Design 7 2007-08 NECAP Technical Report
Correctness
- Are the items and distracters correct with respect to content accuracy and
developmental appropriateness?
- Are the scoring guides consistent with GLE/GSE wording and developmental
appropriateness?
Depth of Knowledge1
- Are the items coded to the appropriate Depth of Knowledge?
- If consensus cannot be reached, is there clarity around why the item might be on the
borderline of two levels?
Language
- Is the item language clear?
- Is the item language accurate (syntax, grammar, conventions)?
Universal Design
- Is there an appropriate use of simplified language (does not interfere with the
construct being assessed)?
- Are charts, tables, and diagrams easy to read and understandable?
- Are charts, tables, and diagrams necessary to the item?
- Are instructions easy to follow?
- Is the item amenable to accommodations—read aloud, signed, or Braille?
2.2.3 Internal Item Review
The lead Measured Progress test developer within the content specialty reviewed the
formatted item, CR scoring guide, and any reading selections and graphics.
The content reviewer considered item ―integrity,‖ content, and structure; appropriateness
to designated content area; item format; clarity; possible ambiguity; answer cueing;
appropriateness and quality of reading selections and graphics; and appropriateness of
scoring guide descriptions and distinctions (in relation to each item and across all items
1 NECAP employed the work of Dr. Norman Webb to guide the development process with respect to Depth of Knowledge. Test
specification documents identified ceilings and targets for Depth of Knowledge coding.

Chapter 2 Development and Test Design 8 2007-08 NECAP Technical Report
within the guide). The item reviewer also ensured that, for each item, there was only one
correct answer.
The content reviewer also considered scorability and evaluated whether the scoring guide
adequately addressed performance on the item.
Fundamental questions that the content reviewer considered, but was not limited to,
included the following:
- What is the item asking?
- Is the key the only possible key? (Is there only one correct answer?)
- Is the CR item scorable as written (were the correct words used to elicit the response
defined by the guide)?
- Is the wording of the scoring guide appropriate and parallel to the item wording?
- Is the item complete (e.g., with scoring guide, content codes, key, grade level, and
identified contract)?
- Is the item appropriate for the designated grade level?
2.2.4 Bias and Sensitivity Review
Bias review is an essential component of the development process. During the bias review
process, NECAP items were reviewed by a committee of teachers, English language learner (ELL)
specialists, special-education teachers, and other educators and members of major constituency
groups who represent the interests of legally protected and/or educationally disadvantaged groups. A
list of bias and sensitivity review committee member names and affiliations are included in
Appendix A. Items were examined for issues that might offend or dismay students, teachers, or
parents. Including such groups in the development of test items and materials can avoid many
unduly controversial issues, and unfounded concerns can be allayed before the test forms are
produced.

Chapter 2 Development and Test Design 9 2007-08 NECAP Technical Report
2.2.5 Item Editing
Measured Progress editors reviewed and edited the items to ensure uniform style (based on
The Chicago Manual of Style, 14th edition) and adherence to sound testing principles. These
principles included the stipulation that items
were correct with regard to grammar, punctuation, usage, and spelling
were written in a clear, concise style
contained unambiguous explanations to students as to what is required to attain a
maximum score
were written at a reading level that would allow the student to demonstrate his or her
knowledge of the tested subject matter, regardless of reading ability
exhibited high technical quality regarding psychometric characteristics
had appropriate answer options or score-point descriptors
were free of potentially sensitive content
2.2.6 Reviewing and Refining
Test developers presented item sets to the item review committees for their recommendations
on which items should be available to include in the embedded field-test portions of the test. The
NH, RI, and VT Departments of Education content specialists made the final selections with the
assistance of Measured Progress at a final face-to-face meeting.
2.2.7 Operational Test Assembly
At Measured Progress, test assembly is the sorting and laying out of item sets into test forms.
Criteria considered during this process included the following:

Chapter 2 Development and Test Design 10 2007-08 NECAP Technical Report
Content coverage/match to test design. The Measured Progress test developers
completed an initial sorting of items into sets based on a balance of content categories
across sessions and forms, as well as a match to the test design (e.g., number of MC, SA,
and CR items).
Item difficulty and complexity. Item statistics drawn from the data analysis of
previously tested items were used to ensure similar levels of difficulty and complexity
across forms.
Visual balance. Item sets were reviewed to ensure that each reflected a similar length
and ―density‖ of selected items (e.g., length/complexity of reading selections, number of
graphics).
Option balance. Each item set was checked to verify that it contained a roughly
equivalent number of key options (A, B, C, and D).
Name balance. Item sets were reviewed to ensure that a diversity of student names was
used.
Bias. Each item set was reviewed to ensure fairness and balance based on gender,
ethnicity, religion, socioeconomic status, and other factors.
Page fit. Item placement was modified to ensure the best fit and arrangement of items on
any given page.
Facing-page issues. For multiple items associated with a single stimulus (a graphic or
reading selection), consideration was given both to whether those items needed to begin
on a left- or right-hand page and to the nature and amount of material that needed to be
placed on facing pages. These considerations served to minimize the amount of ―page
flipping‖ required of students.

Chapter 2 Development and Test Design 11 2007-08 NECAP Technical Report
Relationship between forms. Although embedded field-test items differ from form to
form, they must take up the same number of pages in each form so that sessions and
content areas begin on the same page in every form. Therefore, the number of pages
needed for the longest form often determines the layout of each form.
Visual appeal. The visual accessibility of each page of the form was always taken into
consideration, including such aspects as the amount of ―white space,‖ the density of the
text, and the number of graphics.
2.2.8 Editing Drafts of Operational Tests
Any changes made by a test construction specialist must be reviewed and approved by a test
developer. After a form was laid out in what was considered its final form, it was reread to identify
any final considerations, including the following:
Editorial changes. All text was scrutinized for editorial accuracy, including consistency
of instructional language, grammar, spelling, punctuation, and layout. Measured
Progress’s publishing standards are based on The Chicago Manual of Style, 14th edition.
“Keying” items. Items were reviewed for any information that might ―key‖ or provide
information that would help to answer another item. Decisions about moving keying
items are based on the severity of the ―key-in‖ and the placement of the items in relation
to each other within the form.
Key patterns. The final sequence of keys was reviewed to ensure that their order
appeared random (e.g., no recognizable pattern and no more than three of the same key in
a row).

Chapter 2 Development and Test Design 12 2007-08 NECAP Technical Report
2.2.9 Braille and Large-Print Translation
Common items for grades 3 through 8 and 11were translated into Braille by a subcontractor
that specializes in test materials for blind and visually impaired students. In addition, Form 1 for
each grade was also adapted into a large-print version.
2.3 Item Types
The item types used and the functions of each are described below.
Multiple-Choice (MC) items were administered in grades 3 through 8 and 11 in reading and
mathematics and in grades 5 and 8 in writing to provide breadth of coverage of the GLEs/GSEs.
Because they require approximately one minute for most students to answer, these items make
efficient use of limited testing time and allow coverage of a wide range of knowledge and skills,
including, for example, Word Identification (Word ID) and vocabulary skills.
Short-Answer (SA) items were administered in grades 3 through 8 and 11, mathematics
only, to assess students’ skills and their abilities to work with brief, well-structured problems that
had one solution or a very limited number of solutions. SA items require approximately two to five
minutes for most students to answer. The advantage of this item type is that it requires students to
demonstrate knowledge and skills by generating, rather than merely selecting, an answer.
Constructed-Response (CR) items typically require students to use higher-order thinking
skills—evaluation, analysis, summarization, and so on—in constructing a satisfactory response. CR
items should take most students approximately five to ten minutes to complete. These items were
administered in grades 3 through 8 and 11 in reading, in grades 5 and 8 in writing, and in grades 5
through 8 and 11 in mathematics.
A single common writing prompt with three SA planning box items was administered in
grades 5 and 8. A single common writing prompt and one additional matrix writing prompt per form
were administered in grade 11. Students were given 45 minutes (plus limited additional time if
necessary) to compose an extended response for the common prompt that was scored by two

Chapter 2 Development and Test Design 13 2007-08 NECAP Technical Report
independent readers both on the quality of the stylistic and rhetorical aspects of the writing and on
the use of standard English conventions. Students were encouraged to write a rough draft and were
advised by the test administrator when to begin copying their final draft into their student answer
booklets.
Approximately twenty-five percent of the common NECAP items were released to the public
in 2007–08. The released NECAP items are posted on a Web site hosted by Measured Progress and
on the Department of Education Web sites. Schools are encouraged to incorporate the use of released
items in their instructional activities so that students will be familiar with them.
2.4 Operational Test Designs and Blueprints
Since the beginning of the program, the goal of the NECAP has been to measure what
students know and are able to do by using a variety of test item types. The program was structured to
use both common and matrix-sampled items. (Common items are those taken by all students at a
given grade level; matrix-sampled items make up a pool that is divided among the multiple forms of
the test at each grade level.) This design provides reliable and valid results at the student level and
breadth of coverage of a content area for school results while minimizing testing time. (Note: Only
common items are counted toward students’ scaled scores.)
2.4.1 Embedded Equating Items and Field Test
To ensure that NECAP scores obtained from different test forms and different years are
equivalent to each other, a set of equating items is matrixed across forms of the reading and
mathematics tests. Chapter 5 presents more detail on the equating process. (Note: Equating items are
not counted toward students’ scaled scores.)
The NECAP also includes embedded field test items in all content areas except grades 5 and
8 writing. Because the field tested items are taken by many students, the sample is sufficient to
produce reliable data with which to inform the process of selecting items for future tests. Embedding
field tested items achieves two other objectives. First, it creates a pool of replacement items in

Chapter 2 Development and Test Design 14 2007-08 NECAP Technical Report
reading and mathematics that are needed due to the release of common items each year. Second,
embedding field-test items into the operational test ensures that students take the items under
operational conditions. (Note: As with the matrixed equating items, field test items are not counted
toward students’ scaled scores.)
2.4.2 Test Booklet Design
To accommodate the embedded equating and field test items in the 2007–08 NECAP, there
were nine unique test forms in grades 3 through 8 and eight unique forms in grade 11. In all reading
and mathematics test sessions, the equating and field-test items were distributed among the common
items in a way that was not evident to test takers. The grades 5 and 8 writing design called for one
common test form that was made up of a single writing prompt with three SA planning box items,
four CR items, and ten MC items. The grade 11 writing design called for each student to respond to
two writing prompts. The first writing prompt was common for all students and the second writing
prompt was either a matrix prompt or a field test prompt, depending on the particular test form.
2.5 Reading Test Designs
Table 2-5 summarizes the numbers and types of items that were used in the 2007–08 NECAP
reading test for grades 3 through 8. Note that in reading, all students received the common items and
one of either the equating or field test forms. Each MC item was worth one point, and each CR item
was worth four points.
Table 2-5. 2007-08 NECAP Reading—Grades 3 through 8: Item Type and Numbers of Items
Common – 2 long
1 and 2
short1 passages
plus 4 stand-alone MC
2
Matrix – Equating Forms 1,2,3
1 long and 1 short passage plus 2 stand-alone MC
Matrix – FT3
Forms 4-7 1 long and 1 short
passage plus 2 stand-alone MC
Matrix – FT3
Forms 8–9 3 short passages
plus 2 stand-alone MC
Total per student – 3 long and 3 short or 2 long and 5 short passages plus 6 stand-alone MC
MC
2
CR
2
MC
CR
MC
CR
MC
CR
MC
CR
28
6
14
3
14
3
14
3
42
9
1Long passages have 8 MC and 2 CR items; short passages have 4 MC and 1 CR items 2MC = multiple choice; CR = constructed response 3FT = field test

Chapter 2 Development and Test Design 15 2007-08 NECAP Technical Report
Table 2-6 summarizes the numbers and types of items that were used in the 2007–08 NECAP
reading test for grade 11. Note that in reading, all students received the common items and one of
either the equating or field test forms. Each MC item was worth one point, and each CR item was
worth four points.
Table 2-6. 2007-08 NECAP Reading—Grade 11: Item Type and Numbers of Items
Common – 2 long
1 and 2 short
1
passages plus 4 stand-alone MC
2
Matrix – Equating Forms 1 and 2
1 long and 1 short passage plus 2 stand-
alone MC
Matrix – FT3
Forms 3-8 1 long and 1 short
passage plus 2 stand-alone MC
Total per student – 3 long and 3 short
passages plus 6 stand-alone MC
MC
2
CR
2
MC
CR
MC
CR
MC
CR
28
6
14
3
14
3
42
9
1Long passages have 8 MC and 2 CR items; short passages have 4 MC and 1 CR items 2MC = multiple choice; CR = constructed response 3FT = field test
2.5.1 Reading Blueprint
As indicated earlier, the test framework for reading in grades 3 through 8 was based on the
NECAP Grade Level Expectations, and all items on the NECAP test were designed to measure a
specific GLE. The test framework for reading in grade 11 was based on the NECAP Grade Span
Expectations, and all items on the NECAP test were designed to measure a specific GSE. The
reading passages on all the NECAP tests are broken down into the following categories:
Literary passages, representing a variety of forms: modern narratives; diary entries;
drama; poetry; biographies; essays; excerpts from novels; short stories; and traditional
narratives, such as fables, tall tales, myths, and folktales.
Informational passages, factual text often dealing with areas of science and social studies.
These passages are taken from such sources as newspapers, magazines, and book
excerpts. Informational text could also be directions, manuals, and recipes, etc. The
passages are authentic texts—selected from grade-level-appropriate reading sources—
that students would be likely to experience in both the classroom and independent
Chapter 2 Development and Test Design 16 2007-08 NECAP Technical Report
reading. Passages are written specifically for the test; all are collected from published
works.
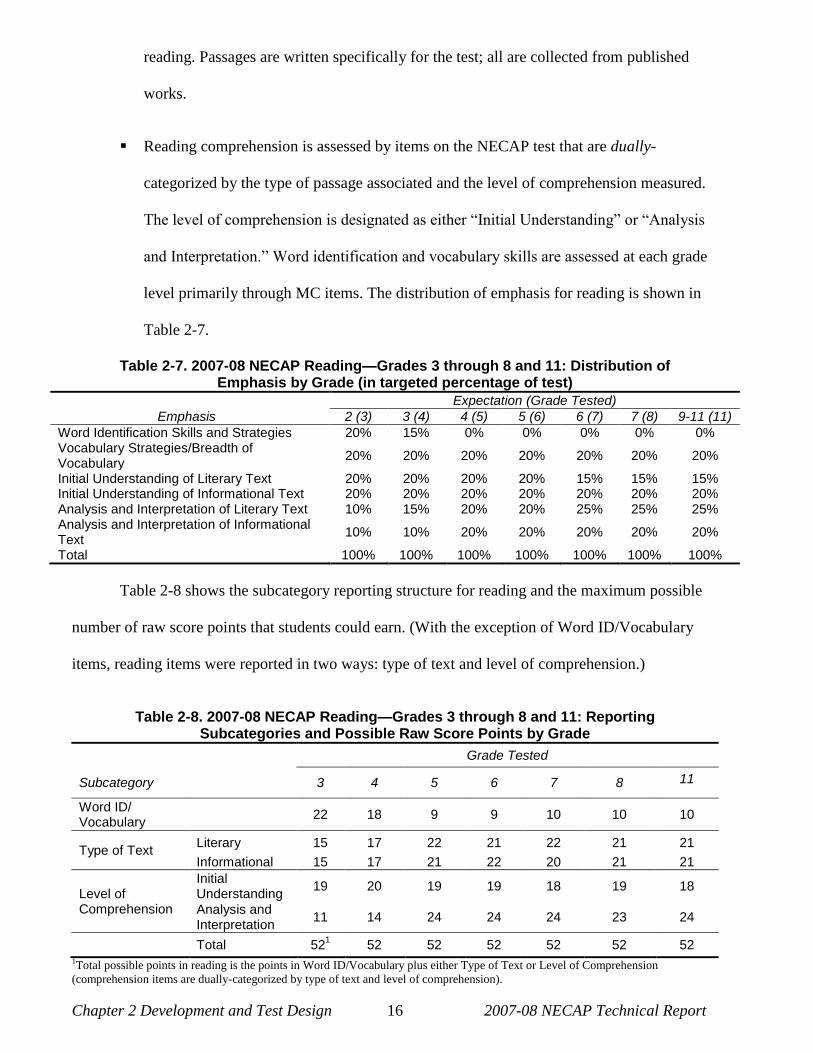
Reading comprehension is assessed by items on the NECAP test that are dually-
categorized by the type of passage associated and the level of comprehension measured.
The level of comprehension is designated as either ―Initial Understanding‖ or ―Analysis
and Interpretation.‖ Word identification and vocabulary skills are assessed at each grade
level primarily through MC items. The distribution of emphasis for reading is shown in
Table 2-7.
Table 2-7. 2007-08 NECAP Reading—Grades 3 through 8 and 11: Distribution of Emphasis by Grade (in targeted percentage of test)
Emphasis
Expectation (Grade Tested)
2 (3) 3 (4) 4 (5) 5 (6) 6 (7) 7 (8) 9-11 (11)
Word Identification Skills and Strategies 20% 15% 0% 0% 0% 0% 0% Vocabulary Strategies/Breadth of Vocabulary
20% 20% 20% 20% 20% 20% 20%
Initial Understanding of Literary Text 20% 20% 20% 20% 15% 15% 15% Initial Understanding of Informational Text 20% 20% 20% 20% 20% 20% 20% Analysis and Interpretation of Literary Text 10% 15% 20% 20% 25% 25% 25% Analysis and Interpretation of Informational Text
10% 10% 20% 20% 20% 20% 20%
Total 100% 100% 100% 100% 100% 100% 100%
Table 2-8 shows the subcategory reporting structure for reading and the maximum possible
number of raw score points that students could earn. (With the exception of Word ID/Vocabulary
items, reading items were reported in two ways: type of text and level of comprehension.)
Table 2-8. 2007-08 NECAP Reading—Grades 3 through 8 and 11: Reporting
Subcategories and Possible Raw Score Points by Grade
Grade Tested
Subcategory 3 4 5 6 7 8 11
Word ID/ Vocabulary
22 18 9 9 10 10 10
Type of Text Literary 15 17 22 21 22 21 21
Informational 15 17 21 22 20 21 21
Level of Comprehension
Initial Understanding
19 20 19 19 18 19 18
Analysis and Interpretation
11 14 24 24 24 23 24
Total 521 52 52 52 52 52 52
1Total possible points in reading is the points in Word ID/Vocabulary plus either Type of Text or Level of Comprehension
(comprehension items are dually-categorized by type of text and level of comprehension).

Chapter 2 Development and Test Design 17 2007-08 NECAP Technical Report
Table 2-9 lists the percentage of total score points assigned to each level of Depth of
Knowledge in Reading.
Table 2-9. 2007-08 NECAP Reading—Grades 3 through 8 and 11: Depth of
Knowledge (DOK) by Grade (in percentage of test)
DOK
Grade Tested
Grade 3 Grade 4 Grade 5 Grade 6 Grade 7 Grade 8 Grade 11
Level 1 34% 27% 15% 17% 15% 17% 13%
Level 2 58% 65% 70% 58% 44% 52% 64%
Level 3 8% 8% 15% 25% 41% 31% 23%
Total 100% 100% 100% 100% 100% 100% 100%
2.6 Mathematics Test Design
Table 2-10 summarizes the numbers and types of items that were used in the 2007–08
NECAP mathematics test for grades 3 and 4, Table 2-11 for grades 5 through 8, and Table 2-12 for
grade 11. Note that all students received the common items plus one of either the equating or field
test forms. Each MC item was worth one point, each SA item either one or two points, and each CR
item four points. Score points within a grade level were evenly divided, so that MC items
represented approximately fifty percent of possible score points, and SA and CR items together
represented approximately fifty percent of score points.

Chapter 2 Development and Test Design 18 2007-08 NECAP Technical Report
Table 2-10. 2007-08 NECAP Mathematics—Grades 3 and 4: Item Type and Numbers of Items
Common Matrix – Equating Matrix – FT2 Total per Student
MC
1
SA1
1
SA2
1
MC
SA1
SA2
MC
SA1
SA2
MC
SA1
SA2
35
10
10
6
2
2
3
1
1
44
13
13
1MC = multiple choice; SA1 = 1-point short answer; SA2 = 2-point short answer 2FT = field test
Table 2-11. 2007-08 NECAP Mathematics—Grades 5 through 8: Item Type and Numbers of Items
Common Matrix – Equating Matrix – FT2 Total per Student
MC1
SA1
1
SA2
1
CR1
MC
SA1
SA2
CR
MC
SA1
SA2
CR
MC
SA1
SA2
CR
32
6
6
4
6
2
2
1
3
1
1
1
41
9
9
6
1MC = multiple choice; SA1 = 1-point short answer; SA2 = 2-point short answer; CR = constructed response
2FT = field test
Table 2-12. 2007-08 NECAP Mathematics—Grade 11: Item Type and Numbers of Items
Common Matrix – Equating Matrix – FT2 Total per Student
MC1
SA11
SA21
CR1
MC
SA1
SA2
CR
MC
SA1
SA2
CR
MC
SA1
SA2
CR
24
12
6
4
4
2
1
1
4
2
1
1*
32
16
8
6
1MC = multiple choice; SA1 = 1-point short answer; SA2 = 2-point short answer; CR = constructed response
2FT = field test; * = 4 unique with 2 repeated
2.6.1 The Use of Calculators on the NECAP
The mathematics specialists from the NH, RI, and VT Departments of Education who
designed the mathematics test acknowledge the importance of mastering arithmetic algorithms. At
the same time, they understand that the use of calculators is a necessary and important skill.
Calculators can save time and prevent error in the measurement of some higher-order thinking skills,
allowing students to work more sophisticated and intricate problems. For these reasons, it was
decided that, at grades 3 through 8, calculators should be prohibited in the first of the three sessions
of the NECAP mathematics test and permitted in the remaining two sessions. At grade 11, it was
decided that calculators should be prohibited in the first of the two sessions and permitted in the
second session. (Test sessions are discussed in greater detail at the end of this chapter.)

Chapter 2 Development and Test Design 19 2007-08 NECAP Technical Report
2.6.2 Mathematics Blueprint
The test framework for mathematics at grades 3 through 8 was based on the NECAP Grade
Level Expectations, and all items on the grades 3 through 8 NECAP tests were designed to measure a
specific GLE. The test framework for mathematics at grade 11 was based on the NECAP Grade
Span Expectations, and all items on the grade 11 NECAP test were designed to measure a specific
GSE. The mathematics items are organized into four content standards as shown on the following
list:
Numbers and Operations: Students understand and demonstrate a sense of what numbers
mean and how they are used. Students understand and demonstrate computation skills.
Geometry and Measurement: Students understand and apply concepts from geometry.
Students understand and demonstrate measurement skills.
Functions and Algebra: Students understand that mathematics is the science of patterns,
relationships, and functions. Students understand and apply algebraic concepts.
Data, Statistics, and Probability: Students understand and apply concepts of data analysis.
Students understand and apply concepts of probability.
In addition, problem solving, reasoning, connections, and communication are embedded
throughout the GLEs/GSEs. The distribution of emphasis for Mathematics is shown in Table 2-13.
Table 2-13. 2007-08 NECAP Mathematics—Grades 3 through 8 and 11:
Distribution of Emphasis (in targeted percentage of test)
Emphasis
GLE grade (grade tested)
2 (3) 3 (4) 4 (5) 5 (6) 6 (7) 7 (8) 8-10 (11)
Numbers and Operations 55% 50% 45% 40% 30% 20% 15%
Geometry and Measurement 15% 20% 20% 25% 25% 25% 30%
Functions and Algebra 15% 15% 20% 20% 30% 40% 40%
Data, Statistics, and Probability 15% 15% 15% 15% 15% 15% 15%
Total 100% 100% 100% 100% 100% 100% 100%

Chapter 2 Development and Test Design 20 2007-08 NECAP Technical Report
Table 2-14 shows the subcategory reporting structure for mathematics and the maximum
possible number of raw score points that students could earn. It can be seen that the goal for
distribution of score points, or balance of representation across the four content strands, varies from
grade to grade. Note: Only common items are counted toward students’ scaled scores.
Table 2-14. 2007-08 NECAP Mathematics—Grades 3 through 8 and 11: Reporting
Subcategories and Possible Raw Score Points by Grade
Subcategory
Grade Tested
Grade 3 Grade 4 Grade 5 Grade 6 Grade 7 Grade 8 Grade 11
Numbers and Operations 35 32 30 26 20 13 10
Geometry and Measurement 10 13 13 17 16 16 19
Functions and Algebra 10 10 13 13 19 27 25
Data, Statistics, and Probability
10 10 10 10 11 10 10
Total 65 65 66 66 66 66 64
Table 2-15 lists the percentage of total score points assigned to each level of Depth of
Knowledge in mathematics.
Table 2-15. 2007-08 NECAP Mathematics—Grades 3 through 8 and 11: Depth of Knowledge (DOK) by Grade (in percentage of test)
DOK
Grade Tested
Grade 3 Grade 4 Grade 5 Grade 6 Grade 7 Grade 8 Grade 11
Level 1 29% 24% 20% 17% 24% 20% 27%
Level 2 63% 62% 63% 70% 59% 62% 70%
Level 3 8% 14% 17% 13% 17% 18% 3%
Total 100% 100% 100% 100% 100% 100% 100%
2.7 Writing Test Design
Table 2-16 summarizes the numbers and types of items that were used in the 2007–08
NECAP writing test for grades 5 and 8. Note that all items on the grades 5 and 8 writing tests were

Chapter 2 Development and Test Design 21 2007-08 NECAP Technical Report
common. Each MC item was worth one point, each CR item four points, each SA item one point,
and the writing prompt 12 points.
Table 2-16. 2007-08 NECAP Writing—Grades 5 and 8: Item Type and Numbers of Items
All Common – Total Per Student
MC1 CR
1 SA1
1 WP
1
10 3 3 1
1MC = multiple choice; CR = constructed response; SA1 = 1-point short answer; WP = Writing Prompt
Table 2-17 summarizes the test design used in the 2007-08 NECAP writing test for grade 11.
Each grade 11 student responded to two different writing prompts, one common and one matrix-
equating or field-test prompt. The common prompt was worth 12 points.
Table 2-17. 2007-08 NECAP Writing—Grade 11 (8 Test Forms)
Common Matrix Equating (5 Forms) Field Test (3 Forms)
1 Writing Prompt 1 Writing Prompt 1 Writing Prompt
2.7.1 Writing Blueprint: Grades 5, and 8
The test framework for grades 5 and 8 writing was based on the NECAP Grade Level
Expectations, and all items on the NECAP test were designed to measure a specific GLE. The
content standards for grades 5 and 8 writing identify four major genres that are assessed in the
writing portion of the NECAP test each year.
Writing in response to literary text
Writing in response to informational text
Narratives
Informational writing (report/procedure for Grade 5 and persuasive at Grade 8)
The writing prompt and the three CR items each address a different genre. In addition,

Chapter 2 Development and Test Design 22 2007-08 NECAP Technical Report
structures and conventions of language are assessed through MC items and throughout the student’s
writing. The prompts and CR items were developed with the following criteria as guidelines:
the prompts must be interesting to students
the prompts must be accessible to all students (i.e., all students would have something to
say about the topics)
the prompts must generate sufficient text to be effectively scored
The subcategory reporting structure for grades 5 and 8 writing is shown in Table 2-18. Also
displayed are the maximum possible number of raw score points that students could earn. The
subcategory ―Short Responses‖ lists the total raw score points from the three CR items; the
subcategory ―Extended Response‖ lists the total raw score points from the three SA items and the
writing prompt.
Table 2-18. 2007-08 NECAP Writing—Grades 5 and 8: Reporting Subcategories and Possible Raw Score Points by Grade
Subcategory
Grade Tested
Grade 5 Grade 8
Structures of Language and Writing Conventions 10 10 Short Responses 12 12 Extended Response 15 15 Total 37 37
Table 2-19 lists the percentage of total score points assigned to each level of Depth of
Knowledge in writing.
Table 2-19. 2007-08 NECAP Writing—Grades 5 and 8: Depth of Knowledge (DOK) by Grade (in percentage of test)
DOK
Grade Tested
Grade 5 Grade 8
Level 1 19% 22% Level 2 41% 38% Level 3 40% 40% Total 100% 100%

Chapter 2 Development and Test Design 23 2007-08 NECAP Technical Report
2.7.2 Writing Blueprint: Grade 11
The test framework for grade 11 writing was based on the NECAP Grade Span Expectations,
and all items on the NECAP test were designed to measure a specific GSE. The content standards for
grade 11 writing identify six genres that are grouped into 3 major strands:
Writing in response to text (literary and informational)
Informational writing (report, procedure, & persuasive essay
Expressive Writing (reflective essay)
The writing prompts (common, matrix equating, and field test) combined address each
different genre. The prompts were developed with the following criteria as guidelines:
the prompts must be interesting to students
the prompts must be accessible to all students (i.e., all students would have something to
say about the topics)
the prompts must generate sufficient text to be effectively scored
The subcategory reporting structure for grade 11 writing is shown in Table 2-20. The
subcategory ―Extended Response‖ lists the total raw score points from the writing prompt.
Table 2-20. 2007-08 NECAP Writing—Grade 11: Reporting Subcategories and Possible Raw Score Points
Subcategory Grade 11
Extended Response 12
Total 12
Table 2-21 lists the percentage of total score points assigned to each level of Depth of
Knowledge in writing.

Chapter 2 Development and Test Design 24 2007-08 NECAP Technical Report
Table 2-21. 2007-08 NECAP Writing—Grade 11: Depth of Knowledge (DOK)
DOK Grade 11
Level 1 0%
Level 2 0%
Level 3 100%
Total 100%
2.8 Test Sessions
The NECAP tests were administered to grades 3 through 8 and 11 during October 1–23,
2007. Schools were able to schedule testing sessions at any time during two weeks of this period,
provided they followed the sequence in the scheduling guidelines detailed in test administration
manuals and that all testing classes within a school were on the same schedule. A third week was
reserved for make-up testing of students who were absent from initial test sessions.
The timing and scheduling guidelines for the NECAP tests were based on estimates of the
time it would take an average student to respond to each type of item that makes up the test:
multiple-choice – 1 minute
short-answer (1 point) – 1 minute
short-answer (2 point) – 2 minutes
constructed-response – 10 minutes
long writing prompt – 45 minutes
For the reading tests, the scheduling guidelines included an estimate of 10 minutes to read the
stimulus material used in the test. Tables 2-22 through 2-28 show the distribution of items across the
test sessions for each content area and grade levels.

Chapter 2 Development and Test Design 25 2007-08 NECAP Technical Report
Table 2-22. 2007-08 NECAP Reading—Grades 3 through 8: Test Sessions by Item Type
Session 1 Session 2 Session 3
Item Type
1
1 long and 1 short passage plus 2 stand-alone MC
1 long and 1 short passage plus 2 stand-alone MC
1 long and 1 short passage plus 2 stand-alone MC
MC 14 14 14 CR 3 3 3
1MC = multiple choice; CR = constructed response
Table 2-23. 2007-08 NECAP Reading—Grade 11:
Test Sessions by Item Type
Item Type
1
Session 1 Session 2
MC 22 20
CR 4 5
Table 2-24. 2007-08 NECAP Mathematics—Grades 3 and 4: Test Sessions by Item Type
Item Type1 Session 1 Session 2 Session 3
MC 15 15 14
SA1 4 3 6
SA2 4 5 4 1MC = multiple choice; SA1 = 1-point short answer; SA2 = 2-point short answer
Table 2-25. 2007-08 NECAP Mathematics—Grades 5 through 8: Test Sessions by Item Type
Item Type1 Session 1 Session 2 Session 3
MC 14 14 13
SA1 3 3 3
SA2 3 3 3
CR 2 2 2 1MC = multiple choice; SA1 = 1-point short answer; SA2 = 2-point short answer; CR = constructed response
Table 2-26. 2007-08 NECAP Mathematics—Grade 11:
Test Sessions by Item Type
Item Type
1
Session 1 Session 2
MC 16 16 SA1 6 6 SA2 6 6 CR 3 3
1MC = multiple choice; SA1 = 1-point short answer; SA2 = 2-point short answer; CR = constructed response
Table 2-27. 2007-08 NECAP Writing—Grades 5 and 8:
Test Sessions by Item Type
Item Type
1
Session 1 Session 2
MC 10 0 CR 3 0 SA 0 3 WP 0 1
1MC = multiple choice; CR = constructed response; SA1 = 1-point short answer; WP = Writing Prompt

Chapter 2 Development and Test Design 26 2007-08 NECAP Technical Report
Table 2-28. 2007-08 NECAP Writing—Grade 11: Test Sessions by Item Type
Item Type
1
Session 1 Session 2
MC 0 0 CR 0 0 SA 0 0 WP 1 1
1MC = multiple choice; CR = constructed response; SA1 = 1-point short answer; WP = Writing Prompt
Though the guidelines for scheduling are based on the assumption that most students will
complete the test within the estimated time, each test session was scheduled so that additional time
was provided for students who needed it. Up to one-hundred percent additional time was allocated
for each session (i.e., a 50-minute session could be extended by an additional 50 minutes).
If classroom space was not available for students who required additional time to complete
the tests, schools were allowed to consider using another space for this purpose, such as the guidance
office. If additional areas were not available, it was recommended that each classroom used for test
administration be scheduled for the maximum amount of time. Detailed instructions on test
administration and scheduling were provided in the test coordinators’ and administrators’ manuals.

Chapter 3 Test Administration 27 2007-08 NECAP Technical Report
Chapter 3 TEST ADMINISTRATION
3.1 Responsibility for Administration
The 2007-08 NECAP Principal/Test Coordinator Manual indicated that principals and/or
their designated NECAP test coordinator were responsible for the proper administration of the
NECAP. Manuals that contained explicit directions and scripts to be read aloud to students by test
administrators were used in order to ensure the uniformity of administration procedures from school
to school.
3.2 Administration Procedures
Principals and/or their school’s designated NECAP coordinator were instructed to read the
Principal/Test Coordinator Manual before testing and to be familiar with the instructions provided
in the Test Administrator Manual. The Principal/Test Coordinator Manual provided each school
with checklists to help them to prepare for testing. The checklists outlined tasks to be performed by
school staff before, during, and after test administration. Besides these checklists, the Principal/Test
Coordinator Manual described the testing material being sent to each school and how to inventory
the material, track it during administration, and return it after testing was complete. The Test
Administrator Manual included checklists for the administrators to prepare themselves, their
classrooms, and the students for the administration of the test. The Test Administrator Manual
contained sections that detailed the procedures to be followed for each test session, and instructions
for preparing the material before the principal/test coordinator would return it to Measured Progress.
3.3 Participation Requirements and Documentation
The legislation’s intent is for all students in grades 3 though 8 and 11 to participate in the
NECAP through standard administration, administration with accommodations, or alternate test.
Furthermore, any student who is absent during any session of the NECAP is expected to take a
makeup test within the three-week testing window.

Chapter 3 Test Administration 28 2007-08 NECAP Technical Report
Schools were required to return a student answer booklet for every enrolled student in the
grade level. On those occasions when it was deemed impossible to test a particular student, school
personnel were required to inform their Department of Education. The states included a grid on the
student answer booklets that listed the approved reasons why a student answer booklet could be
returned blank for one or more sessions of the test:
Student completed the Alternate Test for the 2006–2007 school year
If a student completed the alternate test in the previous school year, the student was not
required to participate in the NECAP in 2007-08.
Student is new to the United States after October 1, 2006 and is LEP (reading and writing
only)
First-year LEP students that took the ACCESS test of English language proficiency, as
scheduled in their states, were not required to take the reading and writing tests in 2007–
08. However, these students were required to take the mathematics test in 2007–08.
Student withdrew from school after October 1, 2007
If a student withdrew after October 1, 2007 but before completing all of the test sessions,
school personnel were instructed to code this reason on the student’s answer booklet.
Student enrolled in school after October 1, 2007
If a student enrolled after October 1, 2007 and was unable to complete all of the test
sessions before the end of the testing administration window, school personnel were
instructed to code this reason on the student’s answer booklet.
State-approved special consideration

Chapter 3 Test Administration 29 2007-08 NECAP Technical Report
Each state department of education had a process for documenting and approving
circumstances that made it impossible or not advisable for a student to participate in
testing. Schools were required to obtain state approval before beginning testing.
Student was enrolled in school on October 1, 2007 and did not complete test for reasons
other than those listed above
If a student was not tested for a reason not stated above, school personnel were instructed
to code this reason on the student’s answer booklet. These ―Other‖ categories were
considered ―not state-approved.‖
Tables 3-1, 3-2, and 3-3 list the participation rates of the three states combined in reading,
mathematics, and writing.
Table 3-1. 2007-08 NECAP Participation Rates—Reading
Category Description Enrollment Not Tested
State-Approved Not Tested
Other Number Tested
Percent Tested
All All Students 236893 3066 3071 230756 0.97
Gender Male 122269 1869 1827 118573 0.97 Female 114514 1190 1241 112083 0.98 Not Reported 110 7 3 100 0.91
Ethnicity
Am. Indian 1264 21 22 1221 0.97 Asian 5540 127 108 5305 0.96 Black 9786 230 199 9357 0.96 Hispanic 18041 526 315 17200 0.95 NHPI 82 0 0 82 1.00 White 201121 2133 2396 196592 0.98 Not Reported 1059 29 31 999 0.94
LEP
Current 6125 603 181 5341 0.87 Monitoring Year 1 1283 7 4 1272 0.99 Monitoring Year 2 848 2 5 841 0.99 Other 228637 2454 2881 223302 0.98
IEP IEP 39117 2056 1131 35930 0.92 Other 197776 1010 1940 194826 0.99
SES SES 66588 1325 1150 64113 0.96 Other 170305 1741 1921 166643 0.98
Migrant Migrant 134 5 2 127 0.95 Other 236759 3061 3069 230629 0.97
Title 1 Title 1 31554 608 272 30674 0.97 Other 205339 2458 2799 200082 0.97
Plan 504 Plan 504 1330 9 5 1316 0.99 Other 235563 3057 3066 229440 0.97

Chapter 3 Test Administration 30 2007-08 NECAP Technical Report
Table 3-2. Participation Rates for 2007-08 NECAP—Mathematics
Category Description Enrollment Not Tested
State-Approved Not Tested
Other Number Tested
Percent Tested
All All Students 236893 2551 3173 231169 0.98
Gender Male 122269 1589 1893 118787 0.97 Female 114514 956 1278 112280 0.98 Not Reported 110 6 2 102 0.93
Ethnicity
Am. Indian 1264 21 25 1218 0.96 Asian 5540 43 97 5400 0.97 Black 9786 143 208 9435 0.96 Hispanic 18041 199 267 17575 0.97 NHPI 82 0 0 82 1.00 White 201121 2117 2546 196458 0.98 Not Reported 1059 28 30 1001 0.95
LEP
Current 6125 47 92 5986 0.98 Monitoring Year 1 1283 6 4 1273 0.99 Monitoring Year 2 848 2 6 840 0.99 Other 228637 2496 3071 223070 0.98
IEP IEP 39117 2066 1200 35851 0.92 Other 197776 485 1973 195318 0.99
SES SES 66588 1037 1168 64383 0.97 Other 170305 1514 2005 166786 0.98
Migrant Migrant 134 4 3 127 0.95 Other 236759 2547 3170 231042 0.98
Title 1 Title 1 28928 298 229 28401 0.98 Other 207965 2253 2944 202768 0.98
Plan 504 Plan 504 1330 10 9 1311 0.99 Other 235563 2541 3164 229858 0.98
Table 3-3. Participation Rates for 2007-08 NECAP—Writing
Category Description Enrollment Not Tested
State-Approved Not Tested
Other Number Tested
Percent Tested
All All Students 104892 923 2873 101096 0.96
Gender Male 53960 529 1730 51701 0.96 Female 50921 391 1142 49388 0.97 Not Reported 11 3 1 7 0.64
Ethnicity
Am. Indian 521 7 18 496 0.95 Asian 2394 47 92 2255 0.94 Black 4199 78 159 3962 0.94 Hispanic 7681 180 221 7280 0.95 NHPI 42 0 0 42 1.00 White 89667 605 2365 86697 0.97 Not Reported 388 6 18 364 0.94
LEP
Current 2233 213 89 1931 0.86 Monitoring Year 1 471 2 5 464 0.99 Monitoring Year 2 341 1 3 337 0.99 Other 101847 707 2776 98364 0.97
IEP IEP 17588 465 1325 15798 0.90 Other 87304 458 1548 85298 0.98
SES SES 27107 428 961 25718 0.95 Other 77785 495 1912 75378 0.97
Migrant Migrant 67 2 2 63 0.94 Other 104825 921 2871 101033 0.96
Title 1 Title 1 10216 176 135 9905 0.97 Other 94676 747 2738 91191 0.96
Plan 504 Plan 504 630 8 4 618 0.98 Other 104262 915 2869 100478 0.96

Chapter 3 Test Administration 31 2007-08 NECAP Technical Report
3.4 Administrator Training
In addition to distributing the Principal/Test Coordinator and Test Administrator Manuals,
the NH, RI, and VT Departments of Education, along with Measured Progress, conducted test
administration workshops in five separate regional locations in each state to inform school personnel
about the NECAP and to provide training on the policies and procedures regarding administration of
the NECAP tests.
3.5 Documentation of Accommodations
The Principal/Test Coordinator and Test Administrator Manual provided directions for
coding the information related to accommodations and modifications on page 2 of the student
answer booklet.
All accommodations used during any test session were required to be coded by authorized
school personnel—not students—after testing was completed.
An Accommodations, Guidelines, and Procedures: Administrator Training Guide was also
produced to provide detailed information on planning and implementing accommodations. This
guide can be located on each state’s Department of Education Web site. The states collectively made
the decision that accommodations be made available to all students based on individual need
regardless of disability status. Decisions regarding accommodations were to be made by the
students’ educational team on an individual basis and were to be consistent with those used during
the students’ regular classroom instruction. Making accommodations decisions on an entire-group
basis rather than on an individual basis was not permitted. If the decision made by a student’s
educational team required an accommodation not listed in the state-approved Table of Standard Test
Accommodations, schools were instructed to contact the Department of Education in advance of
testing for specific instructions for coding the ―Other Accommodations (E)‖ and/or ―Modifications
(F)‖ section.

Chapter 3 Test Administration 32 2007-08 NECAP Technical Report
Tables 3-4 through 3-6 show the accommodations observed for the October 2007 NECAP
administration. The accommodation codes are defined in the Table of Standard Test
Accommodations, which can be found in Appendix B. Information on the appropriateness and
impact of accommodations may be found in Appendix C.
Table 3-4. 2007-08 NECAP Accommodation Frequencies by
Subject Area, Grades 3 through 5
Accommodation
Grade 3 Grade 4 Grade 5
Math Reading Math Reading Math Reading Writing
A01 772 796 703 720 732 755 711 A02 3758 3587 4166 3983 4373 4262 4138 A03 1370 1372 1419 1401 1294 1292 1227 A04 309 304 275 278 209 215 207 A05 12 13 8 10 10 13 14 A06 13 17 12 11 14 12 14 A07 1380 1357 1572 1549 1588 1536 1513 A08 1525 1459 1392 1335 1247 1217 1155 A09 7 19 3 3 9 12 9
B01 227 222 248 237 244 247 240
B02 2060 2061 2211 2199 2370 2378 2234 B03 2149 2159 2484 2369 2835 2728 2485
C01 3 3 2 2 3 3 3 C02 37 37 37 36 31 24 27 C03 14 14 11 8 14 12 15 C04 3423 0 3393 0 3231 0 3018 C05 555 719 560 690 413 488 353 C06 36 16 43 13 67 19 21 C07 586 619 635 664 570 590 514 C08 9 9 11 14 10 10 12 C09 197 257 191 248 220 250 210 C10 7 16 9 13 17 16 11 C11 45 51 63 67 54 56 55 C12 8 0 22 0 21 0 6 C13 2 0 1 0 5 0 0
D01 10 10 15 19 41 89 128 D02 49 56 52 61 70 98 104 D03 6 6 1 1 5 8 4 D04 73 71 102 102 101 109 79 D05 934 1005 872 961 849 913 0 D06 11 11 10 13 15 21 0
E01 4 2 5 5 2 2 8 E02 0 0 0 0 0 0 36
F01 41 0 34 0 20 0 0 F02 0 26 0 12 0 4 0 F03 8 5 1 2 2 1 4

Chapter 3 Test Administration 33 2007-08 NECAP Technical Report
Table 3-5. 2007-08 NECAP Accommodation Frequencies by Subject Area, Grades 6 through 8
Accommodation
Grade 6 Grade 7 Grade 8
Math Reading Math Reading Math Reading Writing
A01 499 496 436 460 372 375 361 A02 3818 3790 3733 3786 3766 3741 3643 A03 912 935 703 730 532 523 508 A04 280 275 257 290 195 200 200 A05 7 9 8 17 4 3 4 A06 21 11 14 14 6 6 8 A07 1528 1538 1514 1563 1501 1493 1482 A08 788 769 545 548 434 439 421 A09 8 8 3 7 4 3 4
B01 190 174 163 161 118 114 112
B02 1883 1912 1638 1667 1408 1413 1372 B03 2465 2341 2165 2137 1798 1715 1692
C01 3 3 0 0 0 0 0 C02 31 23 19 22 20 22 18 C03 10 9 19 19 3 4 7 C04 2247 0 1817 0 1578 0 1515 C05 252 294 132 141 62 76 57 C06 36 9 37 31 24 15 13 C07 465 478 467 503 285 284 261 C08 12 4 5 9 3 4 8 C09 44 49 33 29 23 23 20 C10 9 0 7 7 1 1 1 C11 28 29 26 28 10 9 9 C12 41 0 52 0 43 0 39 C13 2 0 4 0 1 0 231
D01 69 125 77 143 82 156 41 D02 43 50 41 53 27 30 8 D03 8 4 2 4 6 5 41 D04 77 74 71 70 44 48 0 D05 464 581 296 371 186 222 0 D06 9 10 7 11 7 6 0
E01 3 4 1 1 0 0 0 E02 0 0 0 0 0 0 22
F01 50 0 35 0 53 0 0 F02 0 3 0 13 0 8 0 F03 0 0 0 0 0 0 2

Chapter 3 Test Administration 34 2007-08 NECAP Technical Report
Table 3-6. 2007-08 NECAP Accommodation Frequencies by Subject Area, Grade 11
Accommodation Math Reading Writing
A01 250 246 266 A02 2500 2486 2519 A03 357 355 359 A04 93 71 70 A05 3 1 3 A06 22 4 4 A07 1364 1374 1372 A08 213 200 200 A09 18 15 13
B01 103 87 86
B02 551 563 572 B03 1692 1290 1142
C01 0 0 0 C02 32 16 20 C03 12 15 13 C04 674 0 689 C05 22 20 22 C06 78 64 62 C07 87 84 93 C08 18 4 5 C09 11 6 6 C10 19 1 2 C11 5 5 7 C12 71 0 56 C13 1 0 0
D01 33 61 97 D02 10 11 16 D03 10 1 1 D04 17 15 14 D05 47 53 0 D06 7 8 0
E01 2 2 3 E02 0 0 20
F01 146 0 0 F02 0 10 0 F03 0 0 0
3.6 Test Security
Maintaining test security is critical to the success of the New England Common Test program
and the continued partnership among the three states. The Principal/Test Coordinator Manual and
the Test Administrator Manuals explain in detail all test security measures and test administration
procedures. School personnel were informed that any concerns about breaches in test security were
to be reported to the schools’ test coordinator and principal immediately. The test coordinator and/or
principal were responsible for immediately reporting the concern to the district superintendent and
the state director of testing at the department of education. Test Security was also strongly

Chapter 3 Test Administration 35 2007-08 NECAP Technical Report
emphasized at test administration workshops that were conducted in all three states. The three states
also required the principal of each school that participated in testing to log on to a secure website to
complete the Principal’s Certification of Proper Test Administration form for each grade level
tested. Principals were requested to provide the number of secure tests received from Measured
Progress, the number of tests administered to students, and the number of secure test materials that
they were returning to Measured Progress. Principals were then instructed to print off a hard copy of
the form, sign it, and return it with their test materials shipment. By signing the form, the principal
was certifying that the tests were administered according to the test administration procedures
outlined in the Principal/Test Coordinator and Test Administrator Manuals, that they maintained the
security of the tests, that no secure material was duplicated or in any way retained in the school, and
that all test materials had been accounted for and returned to Measured Progress.
3.7 Test and Administration Irregularities
During the test administration, a printing error was discovered in some of the integrated
grade 3 and grade 4 NECAP test booklets, across different forms. Thirteen schools called the
NECAP Service Center or their state Department of Education and reported that pages were missing
from one or more of their grade 3 or grade 4 test booklets. The pages missing were not the same in
each test booklet; the most common error was that pages 11 through 18 were missing in a grade 3,
form 7 test booklet and that pages 19 through 26 were repeated.
The print vendor determined that the errors occurred due to human error during the loading
of the binding machine. The vendor explained that the signatures for the test booklets are pre-loaded
by signature in groups of three to four signatures at adjacent pockets on each side of the binder.
Because the pockets are loaded by hand, the potential exists for incorrect signatures to be loaded into
a pocket and bound in test booklets. This would result in 10 to 50 booklets in a row having a
duplicate or missing signature. The vendor also explained that, when the binding machine stops due
to miss-feeds, the operator must re-collate any loose signatures in the correct pockets at the restart. If
the loose signatures are re-collated incorrectly, this would results in a couple booklets having a

Chapter 3 Test Administration 36 2007-08 NECAP Technical Report
duplicate or missing signature.
In total, schools reported 42 defective booklets. All affected schools either replaced the
defective test booklets with extra test booklets they already had available or Measured Progress
immediately sent new test booklets to the school. No NECAP report was affected by these
irregularities.
3.8 Test Administration Window
The test administration window was October 1–23, 2007.
3.9 NECAP Service Center
To provide additional support to schools before, during, and after testing, Measured Progress
established the NECAP Service Center. The additional support that the Service Center provides is an
essential element to the successful administration of any statewide test program. It provides a
centralized location to which individuals in the field can call using a toll-free number and ask
specific questions or report any problems they may be experiencing.
The Service Center was staffed by representatives at varying levels based on need volume
and was available from 8:00 AM to 4:00 PM beginning two weeks before the start of testing and
ending two weeks after testing. The representatives were responsible for receiving, responding to,
and tracking calls, then routing issues to the appropriate person(s) for resolution. All calls were
logged into a database that was provided to each state after testing was completed.

Chapter 4 Scoring 37 2007-08 NECAP Technical Report
Chapter 4 SCORING
4.1 Imaging Process
When the 2007–08 NECAP student answer booklets arrived at Measured Progress, they were
logged in, identified with pre-printed scannable school information header sheets, examined for
extraneous materials, and batched. They were then moved to the scanning area for imaging. Booklets
were scanned and all necessary information to produce required reports was captured and converted
into an electronic format (e.g., all student identification and demographics, CR answers, and digital
image clips of hand-written writing-prompt responses). Such digital image-clip information allows
Measured Progress to replicate student responses, just as they appeared originally, onto readers’
monitors for scoring. All remaining processes—data processing, benchmarking, scoring, data
analysis, and reporting—are accomplished without further reference to original paper forms.
The first step in digitally converting student booklets was removal of booklet bindings so that
individual pages could pass through the scanners one at a time. Once booklets were cut, their pages
were put back into their proper boxes and placed in storage until needed for scanning and imaging.
Customized scanning programs were prepared to selectively read the 2007-08 NECAP
student answer booklets and to format the scanned information electronically according to pre-
determined requirements. All information (including MC response data) that had been designated
time-critical or process-critical was handled first.
4.2 Quality Control
The scanning system used at Measured Progress is equipped with many built-in safeguards
that prevent data errors (e.g., real-time quality control checks, duplex reading). Furthermore, scanner
hardware is continually monitored automatically, and if standards are not met, an error message is
displayed and scanning shuts down. Areas automatically monitored include document page and
integrity checks as well as internal checks of electronic functioning.

Chapter 4 Scoring 38 2007-08 NECAP Technical Report
Before each scanning shift began, Measured Progress operators performed a diagnostic
routine. In the event any inconsistencies were identified, an operator calibrated the machine and
performed the test again. If the machine was still not up to standard, a field service engineer was
called for assistance.
As a final safeguard, bubble-by-bubble and image-by–image spot checks of scanned files
were routinely made throughout scanning runs to ensure data integrity.
After data were entered and scanning logs and paperwork completed, student booklets were
put into storage (where they are kept for a minimum of 180 days beyond the close of the fiscal year).
Once it had been determined that the 2007-08 NECAP databases were complete and accurate,
batches were uploaded to Measured Progress’ local area network (LAN).These data were then
available to be scored or transferred as appropriate to the Internet, CD-ROM, or optical disk.
4.3 Hand-Scoring
4.3.1 iScore
Student responses to open-ended items on the 2007-08 NECAP were accessed as stored
images off the LAN by qualified readers at computer terminals for ―hand-scoring.‖ All scoring
personnel are subject to the same nondisclosure requirements and supervision as is regular Measured
Progress staff.
Readers evaluate each response and record each student’s score via keypad or mouse entry
through the Measured Progress proprietary iScore system. All iScore scoring is ―anonymous.‖ No
student names or scores are associated with viewed responses. Readers can only access student
responses for items they are qualified to score. When a scorer finishes evaluating a response, another
random response immediately appears onscreen. In these ways, complete anonymity and
randomization of student responses is ensured.

Chapter 4 Scoring 39 2007-08 NECAP Technical Report
4.3.2 Scorer Qualifications
Under the Director of Scoring Services, scoring staff carried out the various scoring
operations. Scoring staff included
chief readers (CRs), who oversaw all training and scoring within particular content areas;
quality assurance coordinators (QACs), who led range finding and training activities and
monitored scoring consistency and rates;
senior readers (SRs), who performed read-behinds of readers and assisted at scoring
tables as necessary; and
readers, who performed the bulk of the scoring.
Table 4-1 summarizes the qualifications of the 2007-08 NECAP quality assurance
coordinators and readers.
Table 4-1. 2007-08 NECAP QAC1 and Reader Qualifications
Scoring Responsibility
Educational Credentials
Doctorate Masters Bachelors Other Total
QAC
2% 36% 60% 2% 100% Reader 4% 27% 59% 10% 100%
1QAC = Quality Assurance Coordinator
4.4 Benchmarking
Before the scheduled start of scoring activities, Measured Progress scoring center staff and
test developers reviewed test items and scoring guides for benchmarking. One or two anchor
examplars were selected for each item score point to prepare an anchor pack; an additional six to ten
responses were selected to go into the training pack. Anchor papers are mid-range exemplars of a
score point, while the training pack papers illustrate the range within the score point. CRs working
closely with QACs for each content area facilitated the selection process. Finding a sufficient
number of papers representing the highest scores is very difficult due to their rarity.
All selected materials were subsequently reviewed by the content representatives from each

Chapter 4 Scoring 40 2007-08 NECAP Technical Report
state. Based on their recommendations, the anchor exemplars and training packs were modified,
finalized, and approved for scorer training.
4.5 Selecting and Training Quality Assurance Coordinators and Senior Readers
Because ―read-behinds‖ would be performed by the QACs and SRs in order to moderate the
scoring process and maintain the integrity of scores, scoring accuracy was a strong criterion for
selecting individuals to fill those positions. Since QACs train readers to score items in particular
content areas, they were selected based also on their ability to instruct and on their content area level
of expertise. QACs typically are retired teachers. The ratio of QACs and SRs to readers was
approximately 1:11.
4.5.1 Selecting Readers
Reader applicants were required to demonstrate their ability by participating in a preliminary
scoring evaluation. The iScore system enables Measured Progress to efficiently measure a
prospective reader’s ability to score student responses accurately. After participating in a training
session, applicants are required to achieve at least eighty percent exact scoring agreement for reading
and mathematics, seventy percent exact agreement for writing, on a qualifying pack consisting of ten
responses to a predetermined item in their content area (or twenty responses in the case of equating
items). The qualifying responses are randomly selected from a bank of approximately 150, all of
which are selected by QACs and approved by the CRs, developers, and content representatives from
each state.
4.5.2 Training Readers
To train readers, QACs demonstrated how to apply the language of the scoring guide to an
item’s anchor pack exemplars. At the conclusion of anchor pack discussion, readers scored the

Chapter 4 Scoring 41 2007-08 NECAP Technical Report
training pack exemplars. QACs then reviewed the training-pack scoring by the readers and
answered any questions readers had.
The optimum ratio of training to scoring hours was determined for divvying readers into
content area groups trained to score different items. The resulting amount of time a reader scored a
given item was thereby kept short enough to minimize ―drift‖ but long enough to analyze the
reader’s scoring trends. This scheme helped reconcile the need to provide cost-effective scoring
while ensuring that readers maintain or exceed quality standards.
4.5.3 Monitoring Readers
Training and hand-scoring took place over a period of approximately three weeks. Responses
were randomly assigned to readers; thus, each item in a student’s response booklet was more than
likely scored by a different reader. By using the maximum possible number of readers for each
student, the procedure effectively minimized error variance due to reader sampling.
After a reader scored a student response, iScore determined whether that response should be
scored by a second reader, scored by a QAC or SR, or routed for special attention. QACs and SRs
used iScore to produce daily reader accuracy and speed reports. They were also able to obtain
current reader accuracy speed reports on-line at any time. All common and matrix CR items in
reading and mathematics were scored once with a two-percent double-blind (scored independently
by two readers) to ensure consistency among readers and accuracy of individual readers. At grades
5, 8, and 11, the common writing prompt was 100% double-blind scored with the requirement that
the two scores for each writing component had to be at least adjacent. Non-adjacent scores were
arbitrated. The combined scores given by the two readers resulted in the student’s raw score on the
writing prompt. Each of the three writing CR items at grades 5 and 8 was scored once with a two-
percent read-behind, and these points were added to the points earned on the writing prompt and the
points earned on the ten MC items covering the structures of language and conventions, resulting in
the total raw score for writing.

Chapter 4 Scoring 42 2007-08 NECAP Technical Report
Tables 4-2 and 4-3 present the weighted averages of exact, adjacent, and total percentages of
agreement. The weighting was based on the number of responses that were re-scored for each
question. (Note: These data underestimate scorer accuracy.) Blanks were included in both read-
behind and double-blind scoring. Readers were instructed to score as a zero any ―minimal‖
responses for which the student had made at least a mark of any kind. However, in many instances it
was impossible for the reader to tell whether a mark on the page was written by the student or
whether there was a crease in the paper, bleed-through from the other side of the page, or dust on the
scanner’s image screen. In such instances, these responses were counted as neither exact nor
adjacent agreement, though the effect of blanks and zeroes on student scores was identical.
Table 4-2. 2007-08 NECAP: Percentage Scoring Consistency and Reliability Double-Blind
Grade
Math Reading Writing
Exact1 Adjacent
1 Total
1 Exact Adjacent Total Exact Adjacent Total
3 94.5 1.7 96.2 88.3 9.0 97.3 4 94.2 2.6 96.8 81.7 12.3 94.0 5 90.9 4.3 95.2 81.4 13.5 94.9 62.0 35.0 97.0 6 92.4 4.0 96.4 78.4 12.4 90.8 7 93.1 3.2 96.3 76.7 14.0 90.7 8 93.4 3.0 96.4 81.9 13.5 95.4 59.6 36.7 96.3 11 96.8 0.5 97.3 81.3 5.4 86.7 58.2 38.0 96.2
1Exact = two readers assigned the same score; Adjacent = two readers differed by one point; Total = Exact or adjacent
Table 4-3. 2007-08 NECAP: Percentage Scoring Read-Behind
Grade
Math Reading Writing
Exact1 Adjacent
1 Total
1 Exact Adjacent Total Exact Adjacent Total
3 93.8 5.2 99.0 75.8 22.3 98.1 4 92.8 6.7 99.5 68.3 28.4 96.7 5 84.4 14.0 98.4 75.0 23.6 98.6 77.6 21.6 99.2 6 86.0 12.7 98.7 72.3 26.6 98.9 7 88.0 10.4 98.4 64.3 33.4 97.7 8 86.9 11.2 98.1 75.8 23.2 99.0 72.8 26.0 98.8
11 92.7 6.2 98.9 72.6 26.3 98.9 71.4 26.9 98.3 1Exact = two readers assigned the same score; Adjacent = two readers differed by one point; Total = Exact or adjacent
4.6 Scoring Locations
All of the oversight and administrative controls applied to the iScore database were managed
for scoring at Measured Progress headquarters in Dover, NH. However, student responses were
scored in four locations: Dover, NH; Troy, NY; Louisville, KY; and Longmont, CO. Table 4-4
shows the locations where all content area/grade level combinations were scored. It is important to

Chapter 4 Scoring 43 2007-08 NECAP Technical Report
note that no single item was scored in more than one location. The iScore system monitored
accuracy, reliability, and consistency across all scoring locations. Constant communication and
coordination were accomplished through e-mail, telephone, faxes, and secure Web sites, to ensure
that critical information and scoring modifications were shared/implemented across all scoring
locations.
Table 4-4. 2007-08 NECAP Content Area/Grade Level Scoring Locations
Content Area/ Grade Level
Dover, NH Troy, NY Louisville, KY Longmont, CO
Reading Grade 3 X Reading Grade 4 X Reading Grade 5 X Reading Grade 6 X Reading Grade 7 X Reading Grade 8 X Reading Grade 11 X
Mathematics Grade 3 X Mathematics Grade 4 X Mathematics Grade 5 X Mathematics Grade 6 X Mathematics Grade 7 X Mathematics Grade 8 X Mathematics Grade 11 X
Writing Grade 5 X Writing Grade 8 X Writing Grade 11 X
4.7 External Observations
The Dover, NH and Longmont, CO scoring locations were visited by at least one
representative from each of the three Departments of Education during scoring. State test directors
and content specialists from the three states were present at some point at each of the locations
during benchmarking, training, and live scoring throughout the scoring window. The state test
directors and content specialists from the three states met with program management and scoring
management staff from Measured Progress to share their observations and provide feedback.
Recommendations that were a result of that meeting will be applied to the next round of scoring in
2008–09.


Chapter 5 Scaling & Equating 45 2007-08 NECAP Technical Report
Chapter 5 SCALING AND EQUATING
5.1 Item Response Theory Scaling
All NECAP items were calibrated using Item Response Theory (IRT). IRT uses
mathematical models to define a relationship between an unobserved measure of student
performance, usually referred to as theta (θ), and the probability (p) of getting a dichotomous item
correct or of getting a particular score on a polytomous item. In IRT, it is assumed that all items are
independent measures of the same construct (i.e., of the same θ). Another way to think of θ is as a
mathematical representation of the latent trait of interest. Several common IRT models are used to
specify the relationship between θ and p (Hambleton and van der Linden, 1997; Hambleton and
Swaminathan, 1985). The process of determining the specific mathematical relationship between θ
and p is called item calibration. After items are calibrated, they are defined by a set of parameters
that specify a nonlinear, monotonically increasing relationship between θ and p. Once the item
parameters are known, , an estimate of θ for each student, can be calculated. ( is considered to be
an estimate of the student’s true score or a general representation of student performance. It has
characteristics that may be preferable to those of raw scores for equating purposes.)
For NECAP 2007-08, the three-parameter logistic (3PL) model was used for dichotomous
items (MC and SA) and the graded-response model (GRM) was used for polytomous items. The 3PL
model for dichotomous items can be defined as:
exp1 1
1 exp
i j i
i j i i
i j i
Da bP c c
Da b
where i indexes the items,
j indexes students,
a represents the item discrimination parameter,
b represents the item difficulty parameter,
c is the pseudo-guessing parameter (fixed at 0 for short answer items), and
D is a normalizing constant equal to approximately 1.701.
In the GRM for polytomous items, an item is scored in k+1 graded categories that can be
viewed as a set of k dichotomies. At each point of dichotomization (i.e., at each threshold), a two-

Chapter 5 Scaling & Equating 46 2007-08 NECAP Technical Report
parameter model can be used. This implies that a polytomous item with k+1 categories can be
characterized by k item category threshold curves (ICTC) of the two-parameter logistic form:
*exp
11 exp
i j i ik
ik j
i j i ik
Da b dP
Da b d
where i indexes the items,
j indexes students,
k indexes thresholds,
a represents the item discrimination parameter,
b represents the item difficulty parameter,
d represents a category step parameter, and
D is a normalizing constant equal to approximately 1.701.
After computing k item category threshold curves in the GRM, k+1 item category
characteristic curves (ICCC) are derived by subtracting adjacent ICTC curves:
* *
( 1)(1| ) (1| ) (1| )ik j i k j ik jP P P
where ikP represents the probability that the score on item i falls in category k, and
*
ikPrepresents the probability that the score on item i falls above the threshold k
(*
0 1iP and
*
( 1) 0i kP ).
The GRM is also commonly expressed as:
1
1
exp exp,
1 exp 1 exp
i j i k i j i k
ik j i
i j i k i j i k
Da b d Da b dP k
Da b d Da b d
where ξi represents the set of item parameters for item i.
Finally, the ICC for polytomous items is computed as a weighted sum of ICCCs, where each
ICCC is weighted by the score assigned to a corresponding category.
1
(1| ) (1| )m
i j ik ik j
k
P w P
For more information about item calibration and determination, the reader is referred to Lord
and Novick (1968) or Hambleton and Swaminathan (1985).

Chapter 5 Scaling & Equating 47 2007-08 NECAP Technical Report
5.2 Equating
The purpose of equating is to ensure that scores obtained from different forms of a test are
equivalent to each other. Equating may be used if multiple test forms are administered in the same
year, as well as to equate one year’s forms to those given in the previous year. Equating ensures that
students are not given an unfair advantage or disadvantage because the test form they took is easier
or harder than those taken by other students.
The 2007-08 administration of NECAP used a raw score-to-theta equating procedure in
which test forms are equated every year to the theta scale of the reference test forms. This is
established through the chained linking design, which means that every new form is equated back to
the theta scale of the previous year’s test form. Since the chain originates from the reference form, it
can be assumed that the theta scale of every new test form is the same as the theta scale of the
reference form—in the current case, the theta scale of the 2005-06 NECAP
Equating for NECAP uses the anchor-test-nonequivalent-groups design described by
Petersen, Kolen, & Hoover (1989). In this equating design, no assumption is made about the
equivalence of the examinee groups taking different test forms (that is, naturally occurring groups
are assumed). Comparability is instead evaluated through utilizing a set of anchor items (i.e.,
equating items). The NECAP uses an external anchor test design, which means that the equating
items are not counted toward students’ test scores. However, the equating items are designed to
mirror the common test in terms of item types and distribution of emphasis. The set of equating
items is matrixed across the forms of the test.
Item parameter estimates for 2007-08 were placed on the 2006-07 scale by using the method
of Stocking and Lord (1983), which is based on the IRT principle of item parameter invariance.
According to this principle, the equating items for both the 2006-07 and 2007-08 NECAP tests
should have the same item parameters. The equating procedure was as follows: PARSCALE was
used to estimate item parameters for 2007-08 NECAP mathematics and reading tests (the three-

Chapter 5 Scaling & Equating 48 2007-08 NECAP Technical Report
parameter logistic model [3PL] for dichotomous items and the graded response model [GRM] for
polytomous items). The Stocking and Lord method was employed to find the linear transformation
(slope and intercept) that adjusted the equating items’ parameter estimates such that the test
characteristic curve (TCC; see section 6.5 for a definition of TCCs) was as close as possible to the
TCC based on the 2006-07 equating item parameter estimates. (The transformation constants can be
found in Appendix D, Table I.d.1.) Note: Grades 5 and 8 writing were excepted from this equating
process; the writing test forms were pre-equated based on pilot testing in 2004-05 (see the 2005-06
NECAP Technical Report for more details on the NECAP pilot). The same IRT models used in all
other grade/contents were used for writing (i.e., 3PL and GRM). The final item parameter estimates
for all grades and content areas are provided in Appendix E.
Students who took the equating items on the 2007-08 and 2006-07 NECAP tests are not
equivalent groups. Item Response Theory (IRT) is particularly useful for equating scenarios that
involve nonequivalent groups (Allen & Yen, 1979). The next administration of NECAP, 2008-09,
will be scaled to the 2007-08 administration by the same equating method described above.
The Equating Report was submitted to the NECAP state testing directors for their approval
prior to production of student reports. The Equating Report is included as Appendix D, and results
are discussed more fully in Section 6.7.
5.3 Standard Setting
A standard setting meeting was conducted for the grade 11 NECAP tests in January 2008.
Thus, operational 2007-08 data were used to set grade 11 standards, and all subsequent
administrations of grade 11 NECAP will be equated back to the 2007-08 base-year scale.
The grade 11 standard-setting report is included as Appendix F to this document. This
detailed report outlines the methods and results of the standard-setting meetings. The meetings
resulted in cut scores on the θ metric. Because future equating will scale back to the 2007-08 θ
metric, the grade 11 cut scores (presented later in Tables 5-1 and 5-2) will remain fixed throughout

Chapter 5 Scaling & Equating 49 2007-08 NECAP Technical Report
the assessment program (unless standards are reset for any reason). After the standard-setting
meetings were completed and the cut scores determined, a meeting was held for the commissioners
of education from each of the three states to review and officially adopt the final cutscores.
A list of Standard-Setting Committee member names and affiliations are included in
Appendix A.
5.4 Reported Scale Scores
5.4.1 Description of Scale
A scale was developed for reporting purposes for each NECAP test. These reporting scales
are simple linear transformations of the underlying scale (θ) used in the IRT calibrations. The scales
were developed such that they ranged from X00 through X80, where X is grade level. In other
words, grade 3 scaled scores ranged from 300 to 380, grade 4 from 400 through 480, and so forth
through grade 8, where scores ranged from 800 through 880. The lowest scaled score in the
Proficient range was set at ―X40‖ for each grade level. For example, to be classified in the Proficient
achievement level or above, a minimum scaled score of 340 was required at grade 3, 440 at grade 4,
and so forth.
Scaled scores supplement achievement-level results by providing information that is more
specific about the position of a student’s results within an achievement level. School- and district-
level scaled scores are calculated by computing the average of student-level scaled scores. Students’
raw scores (i.e., total number of points) on the 2007-08 NECAP tests were translated to scaled scores
using a data analysis process called scaling. Scaling simply converts raw points from one scale to
another through the TCC. In the same way that a given temperature can be expressed on either
Fahrenheit or Celsius scales, or the same distance can be expressed in either miles or kilometers,
student scores on the 2007-08 NECAP tests can be expressed in raw or scaled scores.
It is important to note that converting from raw scores to scaled scores does not change
students’ achievement-level classifications. Given the relative simplicity of raw scores, it is fair to
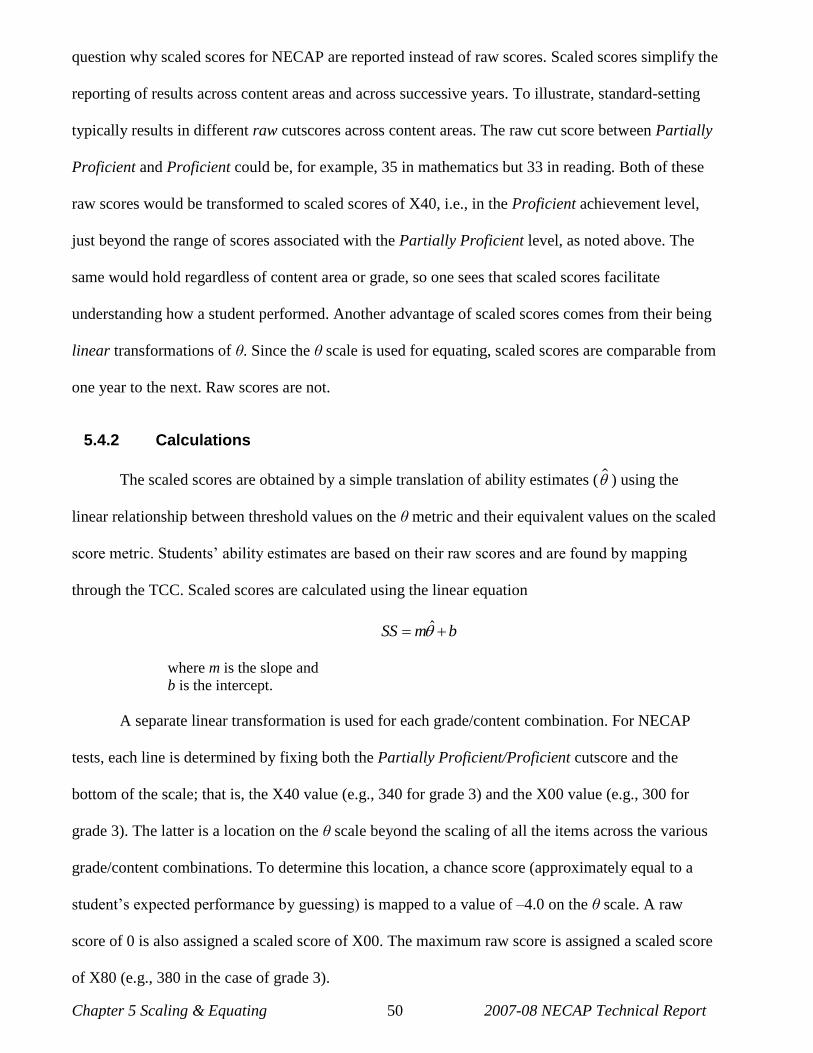
Chapter 5 Scaling & Equating 50 2007-08 NECAP Technical Report
question why scaled scores for NECAP are reported instead of raw scores. Scaled scores simplify the
reporting of results across content areas and across successive years. To illustrate, standard-setting
typically results in different raw cutscores across content areas. The raw cut score between Partially
Proficient and Proficient could be, for example, 35 in mathematics but 33 in reading. Both of these
raw scores would be transformed to scaled scores of X40, i.e., in the Proficient achievement level,
just beyond the range of scores associated with the Partially Proficient level, as noted above. The
same would hold regardless of content area or grade, so one sees that scaled scores facilitate
understanding how a student performed. Another advantage of scaled scores comes from their being
linear transformations of θ. Since the θ scale is used for equating, scaled scores are comparable from
one year to the next. Raw scores are not.
5.4.2 Calculations
The scaled scores are obtained by a simple translation of ability estimates ( ) using the
linear relationship between threshold values on the θ metric and their equivalent values on the scaled
score metric. Students’ ability estimates are based on their raw scores and are found by mapping
through the TCC. Scaled scores are calculated using the linear equation
ˆSS m b
where m is the slope and
b is the intercept.
A separate linear transformation is used for each grade/content combination. For NECAP
tests, each line is determined by fixing both the Partially Proficient/Proficient cutscore and the
bottom of the scale; that is, the X40 value (e.g., 340 for grade 3) and the X00 value (e.g., 300 for
grade 3). The latter is a location on the θ scale beyond the scaling of all the items across the various
grade/content combinations. To determine this location, a chance score (approximately equal to a
student’s expected performance by guessing) is mapped to a value of –4.0 on the θ scale. A raw
score of 0 is also assigned a scaled score of X00. The maximum raw score is assigned a scaled score
of X80 (e.g., 380 in the case of grade 3).

Chapter 5 Scaling & Equating 51 2007-08 NECAP Technical Report
Because only two points within the θ scaled-score space are fixed, the cutscores between
Substantially Below Proficient and Partially Proficient (SBP/PP) and between Proficient and
Proficient with Distinction (P/PWD) vary across the grade/content combinations.
Table 5-1 represents the scaled cutscores for each grade/content combination (i.e., the
minimum scaled score for getting into the next achievement level). It is important to note that the
values in Table 5-1 do not change from year to year because the cutscores along the θ scale do not
change. In any given year, it may not be possible to attain a particular scaled score, but the scaled
score cuts will remain the same.
Table 5-1. 2007-08 NECAP Cut Scores for Each Achievement Level by Grade and Content Area
Grade Content Min
Scale Score Cuts
Max SBP/PP PP/P P/PWD
3
Math
300 332 340 353 380
4 400 431 440 455 480
5 500 533 540 554 580
6 600 633 640 653 680
7 700 734 740 752 780
8 800 834 840 852 880
11 1100 1134 1140 1152 1180
3
Reading
300 331 340 357 380
4 400 431 440 456 480
5 500 530 540 556 580
6 600 629 640 659 680
7 700 729 740 760 780
8 800 828 840 859 880
11 1100 1130 1140 1154 1180
5 Writing*
500 528 540 555 580
8 800 829 840 857 880
SBP = Substantially Below Proficient; PP = Partially Proficient; P = Proficient; PWD = Proficient with Distinction
*Scaled scores are not produced for grade 11 writing
Table 5-2 shows the cutscores on the θ metric resulting from standard setting (see the 2005-
06 NECAP Technical Report for a description of the grades 3-8 standard-setting process and
Appendix F for the grade 11 process) and the slope and intercept terms used to calculate the scaled
scores. Note that no number in Table 5-2 will change unless the standards are reset.

Chapter 5 Scaling & Equating 52 2007-08 NECAP Technical Report
Table 5-2. 2007/08 NECAP Cutscores (on θ Metric), Intercept, and Slope by Grade and Content Area
Grade Content
θ Cuts
Intercept Slope SBP/PP PP/P P/PWD
3
Math
–1.0381 –0.2685 0.9704 342.8782 10.7195
4 –1.1504 –0.3779 0.9493 444.1727 11.0432
5 –0.9279 –0.2846 1.0313 543.0634 10.7659
6 –0.8743 –0.2237 1.0343 642.3690 10.5922
7 –0.7080 –0.0787 1.0995 740.8028 10.2007
8 –0.6444 –0.0286 1.1178 840.2881 10.0720
11 -0.1169 0.6190 2.0586 1134.640 8.6600
3
Reading
–1.3229 –0.4970 1.0307 345.6751 11.4188
4 –1.1730 –0.3142 1.1473 443.4098 10.8525
5 –1.3355 –0.4276 1.0404 544.7878 11.1970
6 –1.4780 –0.5180 1.1255 645.9499 11.4875
7 –1.4833 –0.5223 1.2058 746.0074 11.5019
8 –1.5251 –0.5224 1.1344 846.0087 11.5022
11 -1.2071 -0.3099 1.0038 1143.3600 10.8399
5 Writing
–1.2008 –0.0232 1.5163 540.2334 10.0583
8 –1.0674 –0.0914 1.8230 839.1064 9.7766
SBP = Substantially Below Proficient; PP = Partially Proficient; P = Proficient; PWD = Proficient with Distinction
Appendix G contains the raw score-to-scaled score conversion tables. These are the actual
tables that were used to determine student scaled scores, error bands, and achievement levels.
5.4.3 Distributions
Appendix H contains the scaled score cumulative density functions. These distributions were
calculated using the sparse data matrix files that were used in the IRT calibrations. For each
grade/content, these distributions show the cumulative percentage of students scoring at or below a
particular scaled score across the entire scaled score range.

Chapter 6 Item Analyses 53 2007-08 NECAP Technical Report
SECTION II - STATISTICAL AND PSYCHOMETRIC
SUMMARIES
Chapter 6 ITEM ANALYSES
As noted in Brown (1983), ―A test is only as good as the items it contains.‖ A complete
evaluation of a test’s quality must include an evaluation of each question. Both the Standards for
Educational and Psychological Testing (AERA, 1999) and the Code of Fair Testing Practices in
Education (Joint Committee on Testing Practices, 1988) include standards for identifying quality
questions. Questions should assess only knowledge or skills that are identified as part of the domain
being measured and should avoid assessing irrelevant factors. They should also be unambiguous and
free of grammatical errors, potentially insensitive content or language, and other confounding
characteristics. Further, questions must not unfairly disadvantage test takers from particular racial,
ethnic, or gender groups.
Both qualitative and quantitative analyses were conducted to ensure that NECAP questions
met these standards. Qualitative analyses were discussed in Chapter 2 (―Development and Test
Design‖). The following discussion focuses on several categories of quantitative evaluation of 2007-
08 NECAP items: (a) difficulty indices, (b) item-test correlations, (c) subgroup differences in item
performance (differential item functioning), (d) dimensionality analyses, (e) IRT analyses, and (f)
equating results.
6.1 Difficulty Indices
All 2007-08 NECAP items were evaluated in terms of difficulty according to standard
classical test theory (CTT) practice. The expected item difficulty, also known as the p-value, is the
main index of item difficulty under the CTT framework. This index measures an item’s difficulty by
averaging the proportion of points received across all students who took the item. MC items were
scored dichotomously (correct vs. incorrect), so for these items, the difficulty index is simply the
proportion of students who correctly answered the item. To place all item types on the same 0–1

Chapter 6 Item Analyses 54 2007-08 NECAP Technical Report
scale, the p-value of an OR item was computed as the average score on the item divided by its
maximum possible score. Although the p-value is traditionally called a measure of difficulty, it is
properly interpreted as an easiness index, because larger values indicate easier items. An index of
0.0 indicates that no student received credit for the item. At the opposite extreme, an index of 1.0
indicates that every student received full credit for the item.
Items that are answered correctly by almost all students provide little information about
differences in student ability, but they do indicate knowledge or skills that have been mastered by
most students. The converse is true of items that are incorrectly answered by most students. In
general, to provide the most precise measurement, difficulty indices should range from near-chance
performance (0.25 for four-option MC items, 0.00 for CR items) to 0.90. Experience has indicated
that items conforming to this guideline tend to provide satisfactory statistical information for the
bulk of the student population. However, on a criterion-referenced test such as NECAP, it may be
appropriate to include some items with difficulty values outside this region in order to measure well,
throughout the range, the skill present at a given grade. Having a range of item difficulties also helps
to ensure that the test does not exhibit an excess of scores at the floor or ceiling of the distribution.
6.2 Item–Test Correlations
It is a desirable feature of an item when higher-ability students perform better on it than do
lower-ability students. A commonly used measure of this characteristic is the correlation between
total test score and student performance on the item. Within CTT, this item-test correlation is
referred to as the item’s discrimination, because it indicates the extent to which successful
performance on an item discriminates between high and low scores on the test. For polytomous
items on the 2007-08 NECAP, the Pearson product-moment correlation was used as the item
discrimination index and the point-biserial correlation was used for dichotomous items.
The theoretical range of these statistics is –1.0 to +1.0, with a typical range from +0.2 to
+0.6.
One can think of a discrimination index as a measure of how closely an item assesses the

Chapter 6 Item Analyses 55 2007-08 NECAP Technical Report
same knowledge and skills as other items that contribute to the criterion total score; in other words,
the discrimination index can be interpreted as a measure of construct consistency. In light of this, it
is quite important that an appropriate total score criterion be selected. For the 2007-08 NECAP, raw
score—the sum of student scores on the common items—was selected. Item-test correlations were
computed for each common item, and results are summarized in the next section.
6.3 Summary of Item Analysis Results
Summary statistics of the difficulty and discrimination indices by grade and content area are
provided in Appendix I. Table F-1 displays the means and standard deviations of p-values and
discriminations by form for each grade and content area of the 2007-08 NECAP administration. p-
value means ranged between 0.26 and 0.73, and their standard deviations ranged between 0.11 and
0.25 across all grades, subject areas, and forms. Discrimination (item-total correlation) means ranged
between 0.36 and 0.52, standard deviations between 0.05 and 0.21.
Table F-2 presents summary statistics (means and standard deviations) for the p-values and
discriminations by item type (MC and OR) and aggregated over both item types. Across all grades
and content areas, mean p-values for MC items fell between 0.53 and 0.80, for OR items between
0.34 and 0.71, and for both item types together between 0.46 and 0.75. Mean discrimination indices
for MC items ranged between 0.34 and 0.44, for OR items between 0.44 and 0.65, and for all items
together between 0.38 and 0.47.
Finally, Table F-3 shows the number, relative percentages, and cumulative percentages of
common items that had difficulty or discrimination values within stated ranges. p-values and
discrimination indices were generally in expected ranges. Very few items were answered correctly at
near-chance or near-perfect rates, and positive discrimination indices indicate that students who
performed well on individual items tended to perform well overall. Though it is not inappropriate to
include low discriminating items or very difficult or very easy items, to ensure that the entire ability
spectrum is appropriately covered, there were very few such items on the NECAP tests.

Chapter 6 Item Analyses 56 2007-08 NECAP Technical Report
A comparison of indices across grade levels is complicated because these indices are
population-dependent. Direct comparisons would require that either the items or students were
common across groups. As that was not the case, it cannot be determined whether differences in item
functioning across grade levels were due to differences in student cohorts’ abilities or differences in
item-set difficulties or both. However, one noteworthy statistical trend in math was that p-values
tended to be highest at the lower grades.
Comparing the difficulty indices between MC and OR items is also inappropriate. MC items
can be answered correctly by guessing; thus, it is not surprising that the p-values for MC items were
higher than those for OR items. Similarly, because of partial-credit scoring, the discrimination
indices of OR items tended to be larger than those of MC items.
6.4 Differential Item Functioning
The Code of Fair Testing Practices in Education (Joint Committee on Testing Practices,
1988) explicitly states that subgroup differences in performance should be examined when sample
sizes permit, and actions should be taken to make certain that differences in performance are due to
construct-relevant, rather than construct-irrelevant, factors. The Standards for Educational and
Psychological Testing (AERA, 1999) includes similar guidelines. As part of the effort to identify
such problems, 2007-08 NECAP items were evaluated by means of DIF statistics.
DIF procedures are designed to identify items on which the performance by certain
subgroups of interest differs after controlling for construct-relevant achievement. For the 2007-08
NECAP, the standardization DIF procedure (Dorans & Kulick, 1986) was employed. This procedure
calculates the difference in item performance for two groups of students (at a time) matched for
achievement on the total test. Specifically, average item performance is calculated for students at
every total score. Then an overall average is calculated, weighting the total score distribution so that
it is the same for the two groups. The criterion (matching) score for 2007-08 NECAP was computed
two ways. For common items, total score was the sum of scores on common items. The total score

Chapter 6 Item Analyses 57 2007-08 NECAP Technical Report
criterion for matrix items was the sum of item scores on both common and matrix items (excluding
field-test items). Based on experience, this dual definition of criterion scores has worked well in
identifying problematic common and matrix items.
Differential performances between groups may or may not be indicative of bias in the test.
Group differences in course-taking patterns, interests, or school curricula can lead to DIF. If
subgroup differences are related to construct-relevant factors, items should be considered for
inclusion on a test.
Computed DIF indices have a theoretical range from –1.00 to 1.00 for MC items; those for
OR items are adjusted to the same scale. For reporting purposes, items were categorized according to
DIF index range guidelines suggested by Dorans and Holland (1993). Indices between –0.05 and
0.05 (Type A) can be considered ―negligible.‖ Most items should fall in this range. DIF indices
between –0.10 and –0.05 or between 0.05 and 0.10 (Type B) can be considered ―low DIF‖ but
should be inspected to ensure that no possible effect is overlooked. Items with DIF indices outside
the [–0.10, 0.10] range (Type C) can be considered ―high DIF‖ and should trigger careful test.
The following series of three tables presents the number of 2007-08 NECAP items classified
into each DIF category, broken down by grade, subject area form, and item type. Results are given,
respectively, for comparisons between Male and Female, White and Black, and White and Hispanic.
Note that ―Form 00‖ contains the common items that are used in calculating reported scores for
students. In addition to the DIF categories defined above (i.e., Types A, B, and C), ―Type D‖ in the
tables indicates that there were not enough students in the grouping to perform a reliable DIF
analysis (i.e., fewer than 200 in at least one of the subgroups).

Chapter 6 Item Analyses 58 2007-08 NECAP Technical Report
Table 6-1. Number of 2007-08 NECAP Items Classified into Differential Item Functioning (DIF) Categories by Grade, Subject, and Test Form—Male versus Female
Grade Subject Form All A
All B
All C
All D
MC A
MC B
MC C
MC D
OR A
OR B
OR C
OR D
3
Math
00 54 1 0 0 34 1 0 0 20 0 0 0
01 8 2 0 0 5 1 0 0 3 1 0 0
02 10 0 0 0 6 0 0 0 4 0 0 0
03 9 1 0 0 5 1 0 0 4 0 0 0
04 10 0 0 0 6 0 0 0 4 0 0 0
05 10 0 0 0 6 0 0 0 4 0 0 0
06 10 0 0 0 6 0 0 0 4 0 0 0
07 8 2 0 0 5 1 0 0 3 1 0 0
08 9 1 0 0 5 1 0 0 4 0 0 0
09 10 0 0 0 6 0 0 0 4 0 0 0
Reading
00 34 0 0 0 28 0 0 0 6 0 0 0
01 16 1 0 0 14 0 0 0 2 1 0 0
02 17 0 0 0 14 0 0 0 3 0 0 0
03 16 1 0 0 14 0 0 0 2 1 0 0
4
Math
00 53 2 0 0 33 2 0 0 20 0 0 0
01 10 0 0 0 6 0 0 0 4 0 0 0
02 7 2 1 0 3 2 1 0 4 0 0 0
03 9 0 1 0 5 0 1 0 4 0 0 0
04 10 0 0 0 6 0 0 0 4 0 0 0
05 7 3 0 0 5 1 0 0 2 2 0 0
06 9 1 0 0 6 0 0 0 3 1 0 0
07 10 0 0 0 6 0 0 0 4 0 0 0
08 6 3 1 0 3 2 1 0 3 1 0 0
09 9 0 1 0 5 0 1 0 4 0 0 0
Reading
00 33 1 0 0 28 0 0 0 5 1 0 0
01 16 0 1 0 13 0 1 0 3 0 0 0
02 16 1 0 0 13 1 0 0 3 0 0 0
03 15 2 0 0 13 1 0 0 2 1 0 0
5
Math
00 45 3 0 0 29 3 0 0 16 0 0 0
01 10 1 0 0 5 1 0 0 5 0 0 0
02 10 1 0 0 6 0 0 0 4 1 0 0
03 6 5 0 0 4 2 0 0 2 3 0 0
04 11 0 0 0 6 0 0 0 5 0 0 0
05 11 0 0 0 6 0 0 0 5 0 0 0
06 11 0 0 0 6 0 0 0 5 0 0 0
07 10 1 0 0 5 1 0 0 5 0 0 0
08 9 2 0 0 5 1 0 0 4 1 0 0
09 7 4 0 0 4 2 0 0 3 2 0 0
Reading
00 31 3 0 0 25 3 0 0 6 0 0 0
01 13 3 1 0 10 3 1 0 3 0 0 0
02 15 2 0 0 12 2 0 0 3 0 0 0
03 15 2 0 0 12 2 0 0 3 0 0 0
Writing 01 17 0 0 0 10 0 0 0 7 0 0 0
(continued)

Chapter 6 Item Analyses 59 2007-08 NECAP Technical Report
Grade Subject Form All A
All B
All C
All D
MC A
MC B
MC C
MC D
OR A
OR B
OR C
OR D
6
Math
00 43 5 0 0 29 3 0 0 14 2 0 0
01 8 3 0 0 5 1 0 0 3 2 0 0
02 10 1 0 0 6 0 0 0 4 1 0 0
03 9 2 0 0 5 1 0 0 4 1 0 0
04 10 1 0 0 5 1 0 0 5 0 0 0
05 10 1 0 0 5 1 0 0 5 0 0 0
06 9 2 0 0 5 1 0 0 4 1 0 0
07 8 3 0 0 5 1 0 0 3 2 0 0
08 11 0 0 0 6 0 0 0 5 0 0 0
09 7 4 0 0 3 3 0 0 4 1 0 0
Reading
00 32 2 0 0 26 2 0 0 6 0 0 0
01 13 3 1 0 10 3 1 0 3 0 0 0
02 15 2 0 0 12 2 0 0 3 0 0 0
03 16 1 0 0 13 1 0 0 3 0 0 0
7
Math
00 37 10 1 0 25 6 1 0 12 4 0 0
01 10 1 0 0 5 1 0 0 5 0 0 0
02 10 1 0 0 5 1 0 0 5 0 0 0
03 8 3 0 0 4 2 0 0 4 1 0 0
04 10 1 0 0 6 0 0 0 4 1 0 0
05 11 0 0 0 6 0 0 0 5 0 0 0
06 4 6 1 0 4 1 1 0 0 5 0 0
07 9 2 0 0 6 0 0 0 3 2 0 0
08 10 1 0 0 5 1 0 0 5 0 0 0
09 7 4 0 0 4 2 0 0 3 2 0 0
Reading
00 23 9 2 0 21 5 2 0 2 4 0 0
01 16 1 0 0 14 0 0 0 2 1 0 0
02 13 4 0 0 12 2 0 0 1 2 0 0
03 12 3 2 0 10 2 2 0 2 1 0 0
8
Math
00 40 8 0 0 27 5 0 0 13 3 0 0
01 9 2 0 0 5 1 0 0 4 1 0 0
02 8 3 0 0 3 3 0 0 5 0 0 0
03 7 4 0 0 4 2 0 0 3 2 0 0
04 8 3 0 0 5 1 0 0 3 2 0 0
05 9 2 0 0 6 0 0 0 3 2 0 0
06 7 4 0 0 4 2 0 0 3 2 0 0
07 10 1 0 0 6 0 0 0 4 1 0 0
08 10 1 0 0 5 1 0 0 5 0 0 0
09 8 3 0 0 4 2 0 0 4 1 0 0
Reading
00 30 4 0 0 25 3 0 0 5 1 0 0
01 16 1 0 0 14 0 0 0 2 1 0 0
02 14 3 0 0 11 3 0 0 3 0 0 0
03 13 4 0 0 11 3 0 0 2 1 0 0
Writing 01 16 1 0 0 10 0 0 0 6 1 0 0
(continued)
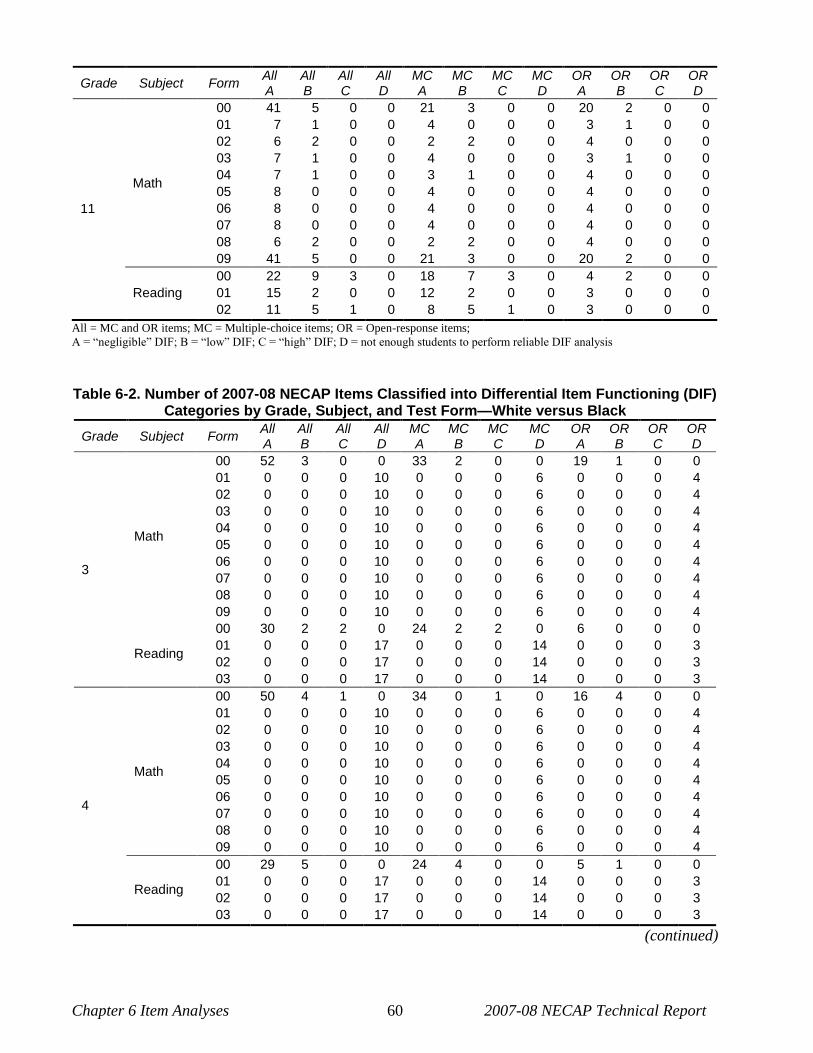
Chapter 6 Item Analyses 60 2007-08 NECAP Technical Report
Grade Subject Form All A
All B
All C
All D
MC A
MC B
MC C
MC D
OR A
OR B
OR C
OR D
11
Math
00 41 5 0 0 21 3 0 0 20 2 0 0
01 7 1 0 0 4 0 0 0 3 1 0 0
02 6 2 0 0 2 2 0 0 4 0 0 0
03 7 1 0 0 4 0 0 0 3 1 0 0
04 7 1 0 0 3 1 0 0 4 0 0 0
05 8 0 0 0 4 0 0 0 4 0 0 0
06 8 0 0 0 4 0 0 0 4 0 0 0
07 8 0 0 0 4 0 0 0 4 0 0 0
08 6 2 0 0 2 2 0 0 4 0 0 0
09 41 5 0 0 21 3 0 0 20 2 0 0
Reading
00 22 9 3 0 18 7 3 0 4 2 0 0
01 15 2 0 0 12 2 0 0 3 0 0 0
02 11 5 1 0 8 5 1 0 3 0 0 0
All = MC and OR items; MC = Multiple-choice items; OR = Open-response items;
A = ―negligible‖ DIF; B = ―low‖ DIF; C = ―high‖ DIF; D = not enough students to perform reliable DIF analysis
Table 6-2. Number of 2007-08 NECAP Items Classified into Differential Item Functioning (DIF) Categories by Grade, Subject, and Test Form—White versus Black
Grade Subject Form All A
All B
All C
All D
MC A
MC B
MC C
MC D
OR A
OR B
OR C
OR D
3
Math
00 52 3 0 0 33 2 0 0 19 1 0 0
01 0 0 0 10 0 0 0 6 0 0 0 4
02 0 0 0 10 0 0 0 6 0 0 0 4
03 0 0 0 10 0 0 0 6 0 0 0 4
04 0 0 0 10 0 0 0 6 0 0 0 4
05 0 0 0 10 0 0 0 6 0 0 0 4
06 0 0 0 10 0 0 0 6 0 0 0 4
07 0 0 0 10 0 0 0 6 0 0 0 4
08 0 0 0 10 0 0 0 6 0 0 0 4
09 0 0 0 10 0 0 0 6 0 0 0 4
Reading
00 30 2 2 0 24 2 2 0 6 0 0 0
01 0 0 0 17 0 0 0 14 0 0 0 3
02 0 0 0 17 0 0 0 14 0 0 0 3
03 0 0 0 17 0 0 0 14 0 0 0 3
4
Math
00 50 4 1 0 34 0 1 0 16 4 0 0
01 0 0 0 10 0 0 0 6 0 0 0 4
02 0 0 0 10 0 0 0 6 0 0 0 4
03 0 0 0 10 0 0 0 6 0 0 0 4
04 0 0 0 10 0 0 0 6 0 0 0 4
05 0 0 0 10 0 0 0 6 0 0 0 4
06 0 0 0 10 0 0 0 6 0 0 0 4
07 0 0 0 10 0 0 0 6 0 0 0 4
08 0 0 0 10 0 0 0 6 0 0 0 4
09 0 0 0 10 0 0 0 6 0 0 0 4
Reading
00 29 5 0 0 24 4 0 0 5 1 0 0
01 0 0 0 17 0 0 0 14 0 0 0 3
02 0 0 0 17 0 0 0 14 0 0 0 3
03 0 0 0 17 0 0 0 14 0 0 0 3
(continued)

Chapter 6 Item Analyses 61 2007-08 NECAP Technical Report
Grade Subject Form All A
All B
All C
All D
MC A
MC B
MC C
MC D
OR A
OR B
OR C
OR D
5
Math
00 47 1 0 0 32 0 0 0 15 1 0 0
01 0 0 0 11 0 0 0 6 0 0 0 5
02 0 0 0 11 0 0 0 6 0 0 0 5
03 0 0 0 11 0 0 0 6 0 0 0 5
04 0 0 0 11 0 0 0 6 0 0 0 5
05 0 0 0 11 0 0 0 6 0 0 0 5
06 0 0 0 11 0 0 0 6 0 0 0 5
07 0 0 0 11 0 0 0 6 0 0 0 5
08 0 0 0 11 0 0 0 6 0 0 0 5
09 0 0 0 11 0 0 0 6 0 0 0 5
Reading
00 27 7 0 0 21 7 0 0 6 0 0 0
01 0 0 0 17 0 0 0 14 0 0 0 3
02 0 0 0 17 0 0 0 14 0 0 0 3
03 0 0 0 17 0 0 0 14 0 0 0 3
Writing 01 15 2 0 0 8 2 0 0 7 0 0 0
6
Math
00 44 4 0 0 29 3 0 0 15 1 0 0
01 0 0 0 11 0 0 0 6 0 0 0 5
02 0 0 0 11 0 0 0 6 0 0 0 5
03 0 0 0 11 0 0 0 6 0 0 0 5
04 0 0 0 11 0 0 0 6 0 0 0 5
05 0 0 0 11 0 0 0 6 0 0 0 5
06 0 0 0 11 0 0 0 6 0 0 0 5
07 0 0 0 11 0 0 0 6 0 0 0 5
08 0 0 0 11 0 0 0 6 0 0 0 5
09 0 0 0 11 0 0 0 6 0 0 0 5
Reading
00 25 9 0 0 19 9 0 0 6 0 0 0
01 0 0 0 17 0 0 0 14 0 0 0 3
02 0 0 0 17 0 0 0 14 0 0 0 3
03 0 0 0 17 0 0 0 14 0 0 0 3
7
Math
00 43 4 1 0 27 4 1 0 16 0 0 0
01 0 0 0 11 0 0 0 6 0 0 0 5
02 0 0 0 11 0 0 0 6 0 0 0 5
03 0 0 0 11 0 0 0 6 0 0 0 5
04 0 0 0 11 0 0 0 6 0 0 0 5
05 0 0 0 11 0 0 0 6 0 0 0 5
06 0 0 0 11 0 0 0 6 0 0 0 5
07 0 0 0 11 0 0 0 6 0 0 0 5
08 0 0 0 11 0 0 0 6 0 0 0 5
09 0 0 0 11 0 0 0 6 0 0 0 5
Reading
00 27 7 0 0 21 7 0 0 6 0 0 0
01 0 0 0 17 0 0 0 14 0 0 0 3
02 0 0 0 17 0 0 0 14 0 0 0 3
03 0 0 0 17 0 0 0 14 0 0 0 3
(continued)

Chapter 6 Item Analyses 62 2007-08 NECAP Technical Report
Grade Subject Form All A
All B
All C
All D
MC A
MC B
MC C
MC D
OR A
OR B
OR C
OR D
8
Math
00 46 2 0 0 31 1 0 0 15 1 0 0
01 0 0 0 11 0 0 0 6 0 0 0 5
02 0 0 0 11 0 0 0 6 0 0 0 5
03 0 0 0 11 0 0 0 6 0 0 0 5
04 0 0 0 11 0 0 0 6 0 0 0 5
05 0 0 0 11 0 0 0 6 0 0 0 5
06 0 0 0 11 0 0 0 6 0 0 0 5
07 0 0 0 11 0 0 0 6 0 0 0 5
08 0 0 0 11 0 0 0 6 0 0 0 5
09 0 0 0 11 0 0 0 6 0 0 0 5
Reading
00 27 5 2 0 21 5 2 0 6 0 0 0
01 0 0 0 17 0 0 0 14 0 0 0 3
02 0 0 0 17 0 0 0 14 0 0 0 3
03 0 0 0 17 0 0 0 14 0 0 0 3
Writing 01 13 4 0 0 6 4 0 0 7 0 0 0
11
Math
00 41 5 0 0 19 5 0 0 22 0 0 0
01 0 0 0 8 0 0 0 4 0 0 0 4
02 0 0 0 8 0 0 0 4 0 0 0 4
03 0 0 0 8 0 0 0 4 0 0 0 4
04 0 0 0 8 0 0 0 4 0 0 0 4
05 0 0 0 8 0 0 0 4 0 0 0 4
06 0 0 0 8 0 0 0 4 0 0 0 4
07 0 0 0 8 0 0 0 4 0 0 0 4
08 0 0 0 8 0 0 0 4 0 0 0 4
09 41 5 0 0 19 5 0 0 22 0 0 0
Reading
00 24 9 1 0 18 9 1 0 6 0 0 0
01 0 0 0 17 0 0 0 14 0 0 0 3
02 0 0 0 17 0 0 0 14 0 0 0 3
All = MC and OR items; MC = Multiple-choice items; OR = Open-response items;
A = ―negligible‖ DIF; B = ―low‖ DIF; C = ―high‖ DIF; D = not enough students to perform reliable DIF analysis
Table 6-3. Number of 2007-08 NECAP Items Classified into Differential Item Functioning (DIF) Categories by Grade, Subject, and Test Form—White versus Hispanic
Grade Subject Form All A
All B
All C
All D
MC A
MC B
MC C
MC D
OR A
OR B
OR C
OR D
3
Math
00 48 7 0 0 30 5 0 0 18 2 0 0
01 7 1 2 0 4 0 2 0 3 1 0 0
02 7 3 0 0 4 2 0 0 3 1 0 0
03 10 0 0 0 6 0 0 0 4 0 0 0
04 9 1 0 0 6 0 0 0 3 1 0 0
05 9 1 0 0 5 1 0 0 4 0 0 0
06 8 2 0 0 5 1 0 0 3 1 0 0
07 7 3 0 0 5 1 0 0 2 2 0 0
08 8 2 0 0 5 1 0 0 3 1 0 0
09 9 1 0 0 6 0 0 0 3 1 0 0
Reading
00 30 1 3 0 24 1 3 0 6 0 0 0
01 13 3 1 0 11 2 1 0 2 1 0 0
02 13 2 2 0 10 2 2 0 3 0 0 0
03 14 3 0 0 11 3 0 0 3 0 0 0
(continued)

Chapter 6 Item Analyses 63 2007-08 NECAP Technical Report
Grade Subject Form All A
All B
All C
All D
MC A
MC B
MC C
MC D
OR A
OR B
OR C
OR D
4
Math
00 44 8 3 0 31 2 2 0 13 6 1 0
01 9 1 0 0 5 1 0 0 4 0 0 0
02 9 1 0 0 6 0 0 0 3 1 0 0
03 9 1 0 0 6 0 0 0 3 1 0 0
04 7 3 0 0 5 1 0 0 2 2 0 0
05 8 2 0 0 4 2 0 0 4 0 0 0
06 7 3 0 0 5 1 0 0 2 2 0 0
07 6 4 0 0 6 0 0 0 0 4 0 0
08 8 2 0 0 6 0 0 0 2 2 0 0
09 9 1 0 0 5 1 0 0 4 0 0 0
Reading
00 30 3 1 0 25 2 1 0 5 1 0 0
01 13 4 0 0 10 4 0 0 3 0 0 0
02 16 1 0 0 13 1 0 0 3 0 0 0
03 15 1 1 0 12 1 1 0 3 0 0 0
5
Math
00 44 3 1 0 29 2 1 0 15 1 0 0
01 10 1 0 0 6 0 0 0 4 1 0 0
02 6 5 0 0 4 2 0 0 2 3 0 0
03 8 3 0 0 5 1 0 0 3 2 0 0
04 8 3 0 0 4 2 0 0 4 1 0 0
05 10 1 0 0 6 0 0 0 4 1 0 0
06 7 4 0 0 3 3 0 0 4 1 0 0
07 9 2 0 0 5 1 0 0 4 1 0 0
08 8 3 0 0 4 2 0 0 4 1 0 0
09 8 3 0 0 4 2 0 0 4 1 0 0
Reading
00 22 9 3 0 16 9 3 0 6 0 0 0
01 11 2 4 0 8 2 4 0 3 0 0 0
02 10 5 2 0 8 4 2 0 2 1 0 0
03 10 5 2 0 7 5 2 0 3 0 0 0
Writing 01 15 2 0 0 8 2 0 0 7 0 0 0
6
Math
00 43 4 1 0 28 3 1 0 15 1 0 0
01 8 3 0 0 4 2 0 0 4 1 0 0
02 7 3 1 0 3 3 0 0 4 0 1 0
03 8 3 0 0 4 2 0 0 4 1 0 0
04 9 2 0 0 5 1 0 0 4 1 0 0
05 8 3 0 0 3 3 0 0 5 0 0 0
06 9 2 0 0 5 1 0 0 4 1 0 0
07 9 2 0 0 5 1 0 0 4 1 0 0
08 7 3 1 0 4 2 0 0 3 1 1 0
09 10 1 0 0 5 1 0 0 5 0 0 0
Reading
00 24 5 5 0 19 4 5 0 5 1 0 0
01 10 3 4 0 7 3 4 0 3 0 0 0
02 12 4 1 0 9 4 1 0 3 0 0 0
03 9 3 5 0 9 0 5 0 0 3 0 0
(continued)
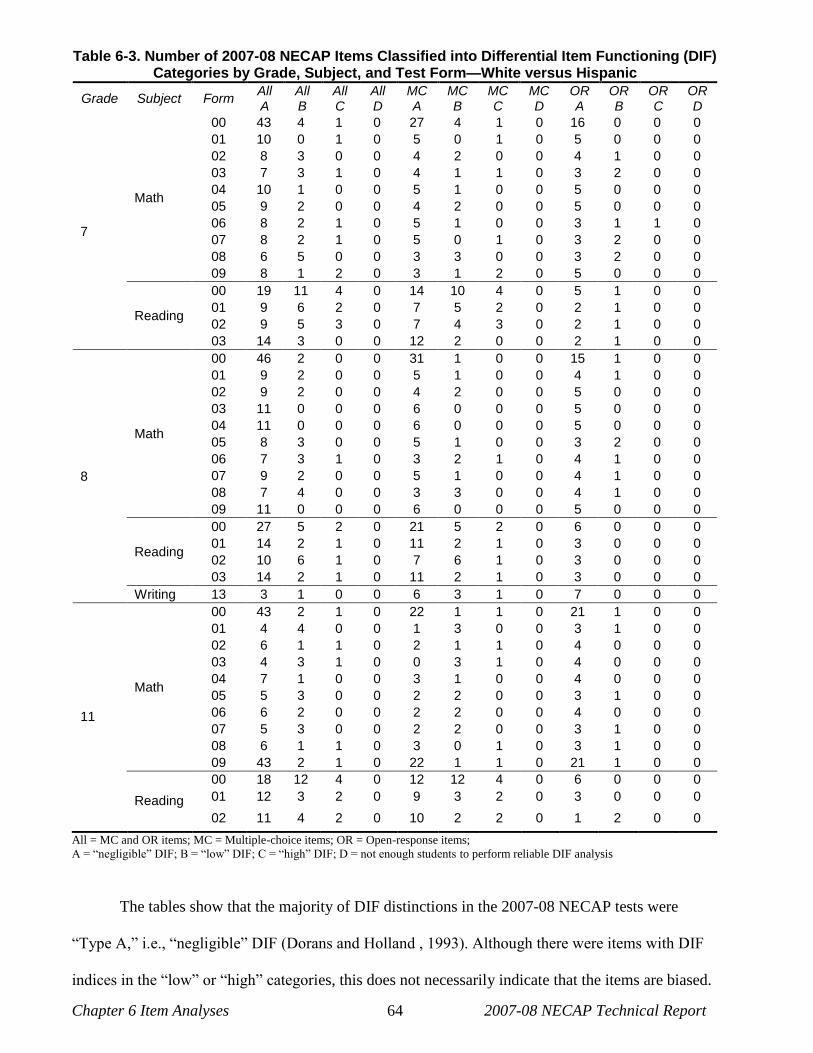
Chapter 6 Item Analyses 64 2007-08 NECAP Technical Report
Table 6-3. Number of 2007-08 NECAP Items Classified into Differential Item Functioning (DIF) Categories by Grade, Subject, and Test Form—White versus Hispanic
Grade Subject Form All A
All B
All C
All D
MC A
MC B
MC C
MC D
OR A
OR B
OR C
OR D
7
Math
00 43 4 1 0 27 4 1 0 16 0 0 0
01 10 0 1 0 5 0 1 0 5 0 0 0
02 8 3 0 0 4 2 0 0 4 1 0 0
03 7 3 1 0 4 1 1 0 3 2 0 0
04 10 1 0 0 5 1 0 0 5 0 0 0
05 9 2 0 0 4 2 0 0 5 0 0 0
06 8 2 1 0 5 1 0 0 3 1 1 0
07 8 2 1 0 5 0 1 0 3 2 0 0
08 6 5 0 0 3 3 0 0 3 2 0 0
09 8 1 2 0 3 1 2 0 5 0 0 0
Reading
00 19 11 4 0 14 10 4 0 5 1 0 0
01 9 6 2 0 7 5 2 0 2 1 0 0
02 9 5 3 0 7 4 3 0 2 1 0 0
03 14 3 0 0 12 2 0 0 2 1 0 0
8
Math
00 46 2 0 0 31 1 0 0 15 1 0 0
01 9 2 0 0 5 1 0 0 4 1 0 0
02 9 2 0 0 4 2 0 0 5 0 0 0
03 11 0 0 0 6 0 0 0 5 0 0 0
04 11 0 0 0 6 0 0 0 5 0 0 0
05 8 3 0 0 5 1 0 0 3 2 0 0
06 7 3 1 0 3 2 1 0 4 1 0 0
07 9 2 0 0 5 1 0 0 4 1 0 0
08 7 4 0 0 3 3 0 0 4 1 0 0
09 11 0 0 0 6 0 0 0 5 0 0 0
Reading
00 27 5 2 0 21 5 2 0 6 0 0 0
01 14 2 1 0 11 2 1 0 3 0 0 0
02 10 6 1 0 7 6 1 0 3 0 0 0
03 14 2 1 0 11 2 1 0 3 0 0 0
Writing 13 3 1 0 0 6 3 1 0 7 0 0 0
11
Math
00 43 2 1 0 22 1 1 0 21 1 0 0
01 4 4 0 0 1 3 0 0 3 1 0 0
02 6 1 1 0 2 1 1 0 4 0 0 0
03 4 3 1 0 0 3 1 0 4 0 0 0
04 7 1 0 0 3 1 0 0 4 0 0 0
05 5 3 0 0 2 2 0 0 3 1 0 0
06 6 2 0 0 2 2 0 0 4 0 0 0
07 5 3 0 0 2 2 0 0 3 1 0 0
08 6 1 1 0 3 0 1 0 3 1 0 0
09 43 2 1 0 22 1 1 0 21 1 0 0
Reading
00 18 12 4 0 12 12 4 0 6 0 0 0
01 12 3 2 0 9 3 2 0 3 0 0 0
02 11 4 2 0 10 2 2 0 1 2 0 0
All = MC and OR items; MC = Multiple-choice items; OR = Open-response items;
A = ―negligible‖ DIF; B = ―low‖ DIF; C = ―high‖ DIF; D = not enough students to perform reliable DIF analysis
The tables show that the majority of DIF distinctions in the 2007-08 NECAP tests were
―Type A,‖ i.e., ―negligible‖ DIF (Dorans and Holland , 1993). Although there were items with DIF
indices in the ―low‖ or ―high‖ categories, this does not necessarily indicate that the items are biased.

Chapter 6 Item Analyses 65 2007-08 NECAP Technical Report
Both the Code of Fair Testing Practices in Education (Joint Committee on Testing Practices, 1988)
and the Standards for Educational and Psychological Testing (AERA, 1999) assert that test items
must be free from construct-irrelevant sources of differential difficulty. If subgroup differences in
performance can be plausibly attributed to construct-relevant factors, the items may be inclu1ded on
a test. What is important is to determine whether the cause of this differential performance is
construct-relevant.
Table 6-4 presents the number of items classified into each DIF category by direction,
comparing males and females. For example, the ―F_A‖ column denotes the total number of items
classified as ―negligible‖ DIF on which females performed better than males relative to performance
on the test as a whole. The ―M_A‖ column next to it gives the total number of ―negligible‖ DIF
items on which males performed better than females relative to performance on the test as a whole.
The ―N_A‖ and ―P_A‖ columns display the aggregate number and proportion of ―negligible‖ DIF
items, respectively. To provide a complete summary across items, both common and matrix items
are included in the tally that falls into each category. Results are broken out by grade, content area,
and item type.

Chapter 6 Item Analyses 66 2007-08 NECAP Technical Report
Table 6-4. Number and Proportion of 2007-08 NECAP Items Classified into Each DIF Category and Direction by Item Type—Male versus Female
Grade Subject Item Type F_A M_A N_A P_A F_B M_B N_B P_B F_C M_C N_C P_C N_D P_D
3
Math MC 51 33 84 0.94 1 4 5 0.06 0 0 0 0.00 0 0
OR 30 24 54 0.96 0 2 2 0.04 0 0 0 0.00 0 0
Reading MC 39 31 70 1.00 0 0 0 0.00 0 0 0 0.00 0 0
OR 11 2 13 0.87 1 1 2 0.13 0 0 0 0.00 0 0
4
Math MC 47 31 78 0.88 2 5 7 0.08 0 4 4 0.04 0 0
OR 21 31 52 0.93 2 2 4 0.07 0 0 0 0.00 0 0
Reading MC 30 37 67 0.96 0 2 2 0.03 0 1 1 0.01 0 0
OR 10 3 13 0.87 2 0 2 0.13 0 0 0 0.00 0 0
5
Math MC 40 36 76 0.88 1 9 10 0.12 0 0 0 0.00 0 0
OR 30 24 54 0.89 4 3 7 0.11 0 0 0 0.00 0 0
Reading MC 24 35 59 0.84 0 10 10 0.14 0 1 1 0.01 0 0
OR 15 0 15 1.00 0 0 0 0.00 0 0 0 0.00 0 0
Writing MC 5 5 10 1.00 0 0 0 0.00 0 0 0 0.00 0 0
OR 7 0 7 1.00 0 0 0 0.00 0 0 0 0.00 0 0
6
Math MC 41 33 74 0.86 3 9 12 0.14 0 0 0 0.00 0 0
OR 34 17 51 0.84 5 5 10 0.16 0 0 0 0.00 0 0
Reading MC 21 40 61 0.87 0 8 8 0.11 0 1 1 0.01 0 0
OR 15 0 15 1.00 0 0 0 0.00 0 0 0 0.00 0 0
7
Math MC 42 28 70 0.81 4 10 14 0.16 0 2 2 0.02 0 0
OR 35 11 46 0.75 10 5 15 0.25 0 0 0 0.00 0 0
Reading MC 20 37 57 0.81 0 9 9 0.13 0 4 4 0.06 0 0
OR 7 0 7 0.47 8 0 8 0.53 0 0 0 0.00 0 0
8
Math MC 34 35 69 0.80 6 11 17 0.20 0 0 0 0.00 0 0
OR 31 16 47 0.77 9 5 14 0.23 0 0 0 0.00 0 0
Reading MC 20 41 61 0.87 1 8 9 0.13 0 0 0 0.00 0 0
OR 12 0 12 0.80 3 0 3 0.20 0 0 0 0.00 0 0
Writing MC 5 5 10 1.00 0 0 0 0.00 0 0 0 0.00 0 0
OR 6 0 6 0.86 1 0 1 0.14 0 0 0 0.00 0 0
11
Math MC 22 26 48 0.86 1 7 8 0.14 0 0 0 0.00 0 0
OR 27 23 50 0.93 2 2 4 0.07 0 0 0 0.00 0 0
Reading MC 20 18 38 0.68 3 11 14 0.25 0 4 4 0.07 0 0
OR 10 0 10 0.83 2 0 2 0.17 0 0 0 0.00 0 0
F_ = items on which females performed better than males (controlling for total test score); M_ = items on which males performed better than females, (controlling for total test score); N_ = number of
items; P_ = proportion of items
_A = ―negligible‖ DIF; _B = ―low‖ DIF; _C = ―high‖ DIF; _D = not enough students to perform a reliable DIF analysis

Chapter 6 Item Analyses 67 2007-08 NECAP Technical Report
6.5 Dimensionality Analyses
Because tests are constructed with multiple content area subcategories, and their associated
knowledge and skills, the potential exists for a large number of dimensions being invoked beyond
the common primary dimension. Generally, the subcategories are highly correlated with each other;
therefore, the primary dimension they share typically explains an overwhelming majority of variance
in test scores. In fact, the presence of just such a dominant primary dimension is the psychometric
assumption that provides the foundation for the unidimensional IRT models that are used for
calibrating, linking, scaling, and equating the NECAP test forms.
The purpose of dimensionality analysis is to investigate whether violation of the assumption
of test unidimensionality is statistically detectable and, if so, (a) the degree to which
unidimensionality is violated and (b) the nature of the multidimensionality. Findings from
dimensionality (DIM) analyses performed on the 2007-08 NECAP common items for Math,
Reading, and Writing are reported below. (Note: only common items were analyzed since they are
used for score reporting.)
The DIM analyses were conducted using the nonparametric IRT-based methods DIMTEST
(Stout, 1987; Stout, Froelich, & Gao, 2001) and DETECT (Zhang & Stout, 1999). Both of these
methods use as their basic statistical building block the estimated average conditional covariances
for item pairs. A conditional covariance is the covariance between two items conditioned on total
score for the rest of the test, and the average conditional covariance is obtained by averaging over all
possible conditioning scores. When a test is strictly unidimensional, all conditional covariances are
expected to take on values within random noise of zero, indicating statistically independent item
responses for examinees with equal expected scores. Non-zero conditional covariances are
essentially violations of the principle of local independence, and local dependence implies
multidimensionality. Thus, non-random patterns of positive and negative conditional covariances are
indicative of multidimensionality.
Chapter 6 Item Analyses 68 2007-08 NECAP Technical Report
DIMTEST is a hypothesis-testing procedure for detecting violations of local independence.
The data are first randomly divided into a training sample and a cross-validation sample. Then an
exploratory analysis of the conditional covariances is conducted on the training sample data to find
the cluster of items that displays the greatest evidence of local dependence. The cross-validation
sample is then used to test whether the conditional covariances of the selected cluster of items
displays local dependence, conditioning on total score on the non-clustered items. The DIMTEST
statistic follows a standard normal distribution under the null hypothesis of unidimensionality.
DETECT is an effect-size measure of multidimensionality. As with DIMTEST, the data are
first randomly divided into a training sample and a cross-validation sample (these samples are drawn
independent of those used with DIMTEST). The training sample is used to find a set of mutually
exclusive and collectively exhaustive clusters of items that best fit a systematic pattern of positive
conditional covariances for pairs of items from the same cluster and negative conditional
covariances from different clusters. Next, the clusters from the training sample are used with the
cross-validation sample data to average the conditional covariances: within-cluster conditional
covariances are summed, from this sum the between-cluster conditional covariances are subtracted,
this difference is divided by the total number of item pairs, and this average is multiplied by 100 to
yield an index of the average violation of local independence for an item pair. DETECT values less
than 0.2 indicate very weak multidimensionality (or near unidimensionality), values of 0.2 to 0.4
weak to moderate multidimensionality; values of 0.4 to 1.0 moderate to strong multidimensionality,
and values greater than 1.0 very strong multidimensionality.
DIMTEST and DETECT were applied to the 2007-08 NECAP. The data for each grade and
content area were split into a training sample and a cross-validation sample. Every grade/content
area combination had at least 30,000 student examinees. Because DIMTEST was limited to using
24,000 students, the training and cross-validation samples for the DIMTEST analyses used 12,000
each, randomly sampled from the total sample. DETECT, on the other hand, had an upper limit of
50,000 students, so every training sample and cross-validation sample used with DETECT had at
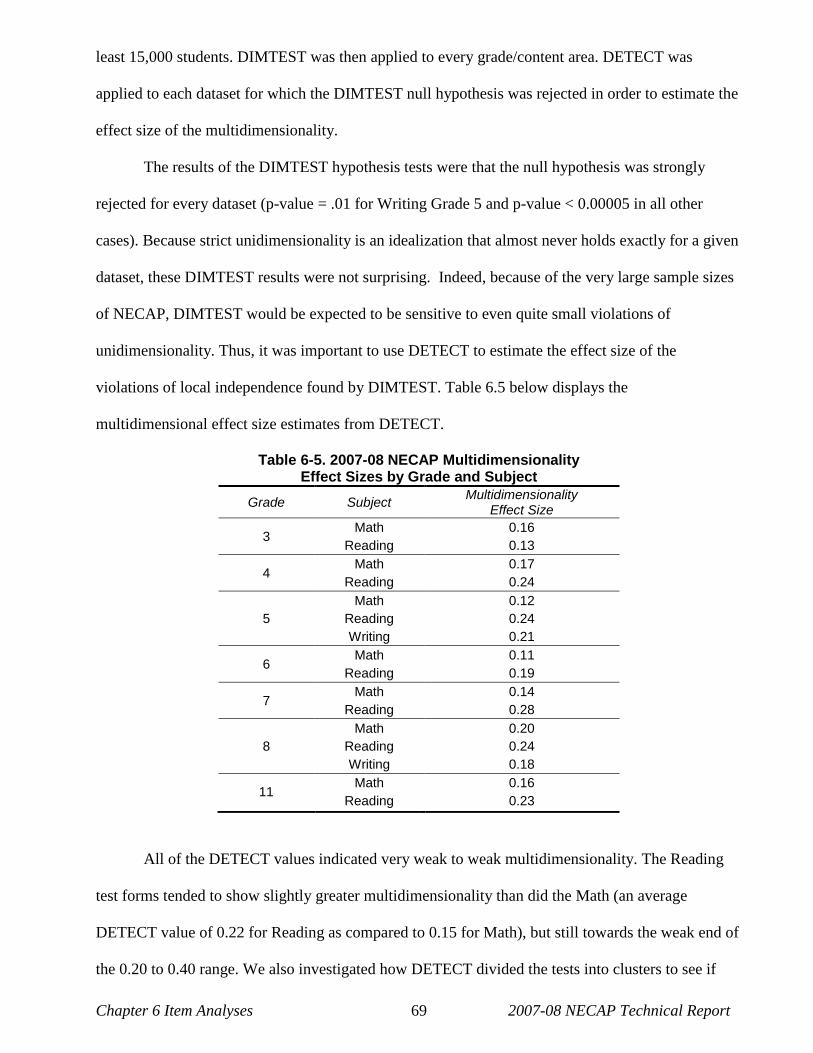
Chapter 6 Item Analyses 69 2007-08 NECAP Technical Report
least 15,000 students. DIMTEST was then applied to every grade/content area. DETECT was
applied to each dataset for which the DIMTEST null hypothesis was rejected in order to estimate the
effect size of the multidimensionality.
The results of the DIMTEST hypothesis tests were that the null hypothesis was strongly
rejected for every dataset (p-value = .01 for Writing Grade 5 and p-value < 0.00005 in all other
cases). Because strict unidimensionality is an idealization that almost never holds exactly for a given
dataset, these DIMTEST results were not surprising. Indeed, because of the very large sample sizes
of NECAP, DIMTEST would be expected to be sensitive to even quite small violations of
unidimensionality. Thus, it was important to use DETECT to estimate the effect size of the
violations of local independence found by DIMTEST. Table 6.5 below displays the
multidimensional effect size estimates from DETECT.
Table 6-5. 2007-08 NECAP Multidimensionality Effect Sizes by Grade and Subject
Grade Subject Multidimensionality
Effect Size
3 Math 0.16
Reading 0.13
4 Math 0.17
Reading 0.24
5
Math 0.12
Reading 0.24
Writing 0.21
6 Math 0.11
Reading 0.19
7 Math 0.14
Reading 0.28
8
Math 0.20
Reading 0.24
Writing 0.18
11 Math 0.16
Reading 0.23
All of the DETECT values indicated very weak to weak multidimensionality. The Reading
test forms tended to show slightly greater multidimensionality than did the Math (an average
DETECT value of 0.22 for Reading as compared to 0.15 for Math), but still towards the weak end of
the 0.20 to 0.40 range. We also investigated how DETECT divided the tests into clusters to see if

Chapter 6 Item Analyses 70 2007-08 NECAP Technical Report
there were any discernable patterns with respect to the item types (i.e., multiple choice, short answer,
and constructed response). The Math clusters showed no discernable patterns. For both Reading and
Writing, however, there was a strong tendency for the multiple-choice items to cluster separately
from the remaining items. Despite this multidimensionality between the multiple-choice items and
remaining items for Reading and Writing, the effect sizes were weak and did not warrant further
investigation.
6.6 Item Response Theory Analyses
Chapter 5, subsection 5.1, introduced IRT and gave a thorough description of the topic. It
was noted there that all 2007-08 NECAP items were calibrated using IRT and that the calibrated
item parameters were ultimately used to scale both the items and students onto a common
framework. The results of those analyses are presented in this subsection and Appendix E.
The tables in Appendix E give the IRT item parameters of all common items on the 2007-08
NECAP tests, broken down by grade and content area. Graphs of the corresponding Test
Characteristic Curves (TCCs) and Test Information Functions (TIFs), defined below, accompany the
data tables.
TCCs display the expected (average) raw score associated with each θj value between –4.0
and 4.0. Mathematically, the TCC is computed by summing the ICCs of all items that contribute to
the raw score. Using the notation introduced in subsection 5.1, the expected raw score at a given
value of θj is
1
( | ) 1 ,n
j i j
i
E X P
where i indexes the items (and n is the number of items contributing to the raw score),
j indexes students (here, θj runs from –4 to 4)
( | )jE X is the expected raw score for a student of ability θj.
The expected raw score monotonically increases with θj, consistent with the notion that
students of high ability tend to earn higher raw scores than do students of low ability. Most TCCs are

Chapter 6 Item Analyses 71 2007-08 NECAP Technical Report
―S-shaped‖—flatter at the ends of the distribution and steeper in the middle.
The TIF displays the amount of statistical information that the test provides at each value of
θj. There is a direct relation between the information of a test and its standard error of measurement
(SEM). Information functions depict test precision across the entire latent trait continuum. For long
tests, the SEM at a given θj is approximately equal to the inverse of the square root of the statistical
information at θj (Hambleton, Swaminathan, & Rogers, 1991):
1( )
( )j
j
SEMI
Compared to the tails, TIFs are often higher near the middle of the θ distribution, where most
students are located and most items are sensitive by design.
6.7 Equating Results
As discussed in Section 5.1, a combination of IRT models was used for scaling NECAP
items: 3PL for dichotomously scored items; 3PL with c=0 (i.e., 2PL) for short answer items; and
GRM for polytomously scored items. As a result of conducting the IRT calibration and the equating
process (see Section 5.2), an Equating Report was generated. The Equating Report is included as
Appendix D to this technical report.
There were three basic steps involved in the equating and scaling activities: IRT calibrations,
identification of equating items, and execution of the Stocking & Lord equating procedure. These,
along with the various quality control procedures implemented within the Psychometrics Department
at Measured Progress, have been reviewed with the NECAP state testing directors and the NECAP
Technical Advisory Committee. An outline of the quality control activities undertaken during the
IRT calibration, equating, and scaling is presented in section I.E in the Equating Report, and specific
results are found throughout the report, including
The numbers of Newton cycles required for convergence during calibration (Table I.c.1)

Chapter 6 Item Analyses 72 2007-08 NECAP Technical Report
Comparison plots between the 2006-07 and 2007-08 parameter estimates and TCCs,
along with raw score to scaled score comparisons (Section II.A)
Items studied during the calibration/equating process, reasons why, and any interventions
undertaken (Table I.c.2)
The Stocking & Lord transformation constants used for each grade-content used to place
the estimated item parameters onto the previous year’s scale (Table I.d.1, where ―A‖ is
analogous to slope and ―B‖ to intercept)
Results from the rescore analysis conducted on the polytomously scored equating items
(Section II.B)
Raw scores associated with cutpoints (Table I.b.1)

Chapter 7 Reliability 73 2007-08 NECAP Technical Report
Chapter 7 RELIABILITY
Although an individual item’s performance is an important focus for evaluation, a complete
evaluation of a test must also address the way in which items function together and complement one
another. Any measurement includes some amount of measurement error. No academic test can
measure student performance with perfect accuracy; some students will receive scores that
underestimate their true ability, and other students will receive scores that overestimate their true
ability. Items that function well together produce tests that have less measurement error (i.e., the
error is small on average). Such tests are described as ―reliable.‖
There are a number of ways to estimate a test’s reliability. One approach is to split all test
items into two groups and then correlate students’ scores on the two half-tests. This is known as a
split-half estimate of reliability. If the two half-test scores correlate highly, items on the two half-
tests are likely measuring very similar knowledge or skills. Such a correlation is evidence that the
items complement one another and suggest that measurement error will be minimal.
The split-half method requires psychometricians to select items that contribute to each half-
test score. This decision may have an impact on the resulting correlation. Cronbach (1951) provided
a statistic, alpha (α), which avoids this concern of the split-half method. By comparing individual
item variances to total test variance, Cronbach’s α coefficient estimates the average of all possible
split-half reliability coefficients and was used to assess the reliability of the 2007-08 NECAP tests:
2
1
21
1
i
x
n
Yi
n
n
where i indexes the item,
n is the number of items,
2iY represents individual item variance
2x represents the total test variance.

Chapter 7 Reliability 74 2007-08 NECAP Technical Report
7.1 Reliability and Standard Errors of Measurement
Table 7-1 presents descriptive statistics, Cronbach’s α coefficient, and raw score standard
errors of measurement (SEMs) for each content area and grade (statistics are based on common
items only).
Table 7-1. 2007-08 NECAP Common Item Raw Score Descriptive Statistics,
Reliabilities, and Standard Errors of Measurement by Grade and Subject Area
Grade Subject N Possible
Score Min
Score Max
Score Mean Score
Score SD
Reliability (α)
S.E.M.
3 Math 30503 65 0 65 43.869 12.555 0.930 3.332
Reading 30401 52 0 52 34.373 9.279 0.892 3.056
4 Math 32334 65 0 65 40.441 13.252 0.929 3.522
Reading 32226 52 0 52 33.961 9.341 0.872 3.342
5
Math 32438 66 0 65 32.934 12.831 0.911 3.823
Reading 32353 52 0 52 29.777 8.540 0.880 2.952
Writing 32281 37 0 36 21.265 4.728 0.740 2.411
6 Math 32930 66 0 66 32.904 13.852 0.924 3.822
Reading 32850 52 0 52 30.460 8.036 0.881 2.771
7 Math 33949 66 0 66 30.116 13.404 0.920 3.800
Reading 33879 52 0 52 32.070 9.282 0.889 3.090
8
Math 35109 66 0 66 29.862 14.595 0.918 4.167
Reading 35052 52 0 52 34.395 9.154 0.899 2.911
Writing 34929 37 0 37 22.271 5.396 0.750 2.698
11 Math 33907 64 0 63 21.212 12.292 0.912 3.650
Reading 33996 52 0 52 29.994 9.154 0.895 2.960
For mathematics, the reliability coefficient ranged from 0.91 to 0.93, for reading 0.87 to 0.90.
For the grade 5 and grade 8 writing tests, the values were 0.74 and 0.75, respectively. Because
different grades and content areas have different test designs (e.g., the number of items varies by
test), it is inappropriate to make inferences about the quality of one test by comparing its reliability
to that of another test from a different grade and/or content area.
7.2 Subgroup Reliability
The reliability coefficients discussed in the previous section were based on the overall
population of students who took the 2007-08 NECAP tests. Appendix J presents reliabilities for
various subgroups of interest. Subgroup Cronbach’s α’s were calculated using the formula defined
above using only the members of the subgroup in question in the computations. For mathematics,
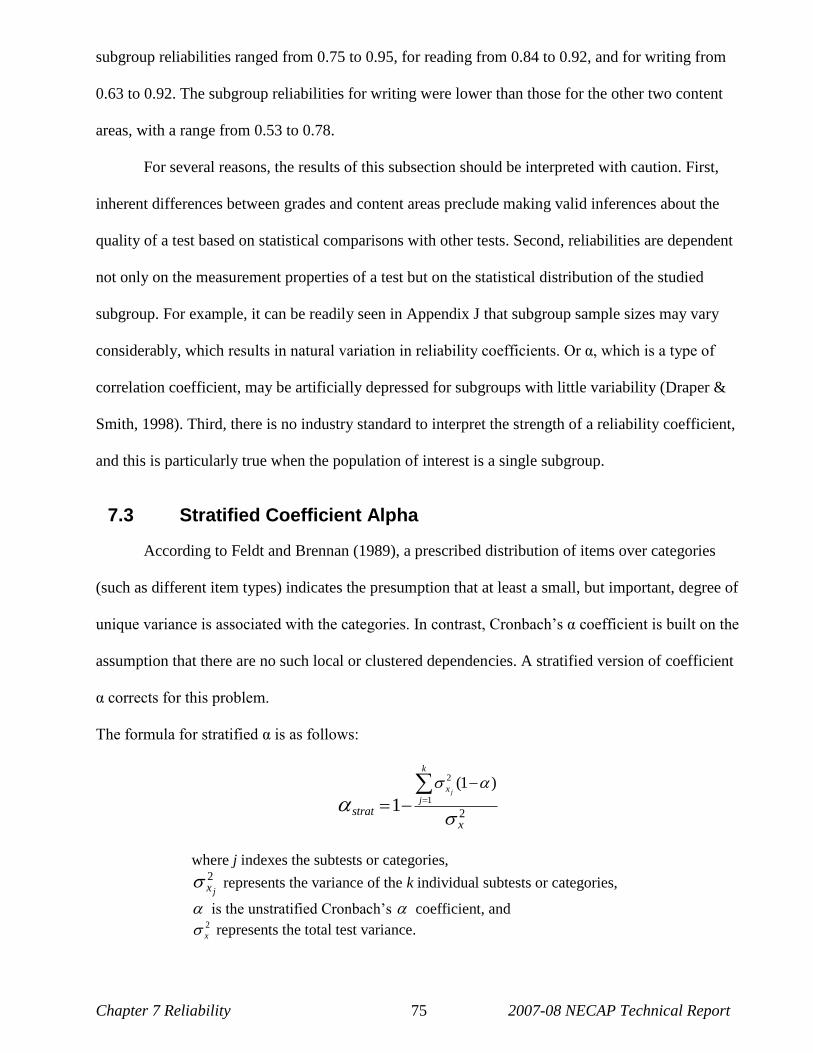
Chapter 7 Reliability 75 2007-08 NECAP Technical Report
subgroup reliabilities ranged from 0.75 to 0.95, for reading from 0.84 to 0.92, and for writing from
0.63 to 0.92. The subgroup reliabilities for writing were lower than those for the other two content
areas, with a range from 0.53 to 0.78.
For several reasons, the results of this subsection should be interpreted with caution. First,
inherent differences between grades and content areas preclude making valid inferences about the
quality of a test based on statistical comparisons with other tests. Second, reliabilities are dependent
not only on the measurement properties of a test but on the statistical distribution of the studied
subgroup. For example, it can be readily seen in Appendix J that subgroup sample sizes may vary
considerably, which results in natural variation in reliability coefficients. Or α, which is a type of
correlation coefficient, may be artificially depressed for subgroups with little variability (Draper &
Smith, 1998). Third, there is no industry standard to interpret the strength of a reliability coefficient,
and this is particularly true when the population of interest is a single subgroup.
7.3 Stratified Coefficient Alpha
According to Feldt and Brennan (1989), a prescribed distribution of items over categories
(such as different item types) indicates the presumption that at least a small, but important, degree of
unique variance is associated with the categories. In contrast, Cronbach’s α coefficient is built on the
assumption that there are no such local or clustered dependencies. A stratified version of coefficient
α corrects for this problem.
The formula for stratified α is as follows:
2
1
2
(1 )
1
j
k
x
j
stratx
where j indexes the subtests or categories, 2
jx represents the variance of the k individual subtests or categories,
is the unstratified Cronbach’s coefficient, and 2
x represents the total test variance.

Chapter 7 Reliability 76 2007-08 NECAP Technical Report
Stratified was calculated separately for each grade/content combination. The results of
stratification based on item type (MC versus OR) are presented below in Table 7-2. This is directly
followed by results of stratification based on form in Table 7-3.
Table 7-2. 2007-08 NECAP: Common Item and
Stratified byGrade, Subject, and Item Type
Grade
All MC OR
Subject N N (poss) Stratified
3 Math 0.93 0.89 35 0.85 20 (30) 0.93
Reading 0.89 0.87 28 0.75 6 (24) 0.90
4 Math 0.93 0.88 35 0.86 20 (30) 0.93
Reading 0.87 0.88 28 0.68 6 (24) 0.88
5 Math 0.91 0.84 32 0.85 16 (34) 0.91
Reading 0.88 0.84 28 0.85 6 (24) 0.90
6 Math 0.92 0.87 32 0.87 16 (34) 0.93
Reading 0.88 0.85 28 0.83 6 (24) 0.90
7 Math 0.92 0.85 32 0.87 16 (34) 0.92
Reading 0.89 0.85 28 0.86 6 (24) 0.91
8 Math 0.92 0.85 32 0.87 16 (34) 0.92
Reading 0.90 0.87 28 0.88 6 (24) 0.92
11 Math 0.91 0.79 24 0.88 22 (40) 0.92
Reading 0.90 0.85 28 0.89 6 (24) 0.92
All = MC and OR; MC = multiple-choice; OR = open response
= number of items; poss = total possible open-response points

Chapter 7 Reliability 77 2007-08 NECAP Technical Report
Table 7-3. 2007-08 NECAP: Reliability by Grade, Subject, Item Type, and Form
Grade Subject Stat Form1 Form2 Form3 Form4 Form5 Form6 Form7 Form8 Form9
3
Math
All 0.94 0.94 0.94 0.94 0.94 0.94 0.94 0.94 0.94
MC 0.91 0.91 0.91 0.91 0.90 0.90 0.90 0.91 0.91
OR 0.87 0.87 0.87 0.88 0.88 0.86 0.87 0.88 0.87
Frmt Strat 0.94 0.94 0.94 0.94 0.94 0.94 0.94 0.94 0.94
Com alpha 0.93 0.93 0.93 0.93 0.93 0.93 0.93 0.93 0.93
Reading
All 0.92 0.92 0.93 0.89 0.89 0.89 0.89 0.89 0.89
MC 0.91 0.90 0.92 0.88 0.87 0.87 0.87 0.87 0.87
OR 0.82 0.82 0.83 0.75 0.74 0.75 0.75 0.77 0.75
Frmt Strat 0.93 0.93 0.94 0.90 0.90 0.90 0.90 0.91 0.90
Com alpha 0.89 0.88 0.90 0.89 0.89 0.89 0.89 0.89 0.89
4
Math
All 0.94 0.94 0.94 0.94 0.94 0.94 0.94 0.94 0.93
MC 0.90 0.89 0.89 0.90 0.90 0.89 0.90 0.89 0.89
OR 0.89 0.89 0.88 0.89 0.88 0.89 0.88 0.89 0.87
Frmt Strat 0.94 0.94 0.94 0.94 0.94 0.94 0.94 0.94 0.94
Com alpha 0.93 0.93 0.93 0.93 0.93 0.93 0.93 0.93 0.93
Reading
All 0.92 0.91 0.91 0.87 0.88 0.87 0.87 0.87 0.87
MC 0.92 0.91 0.91 0.87 0.88 0.88 0.87 0.87 0.87
OR 0.79 0.77 0.77 0.68 0.70 0.68 0.68 0.68 0.67
Frmt Strat 0.93 0.92 0.92 0.88 0.89 0.88 0.88 0.88 0.88
Com alpha 0.88 0.87 0.87 0.87 0.88 0.87 0.87 0.87 0.87
5
Math
All 0.93 0.93 0.93 0.93 0.93 0.93 0.93 0.93 0.93
MC 0.87 0.87 0.86 0.87 0.87 0.87 0.86 0.87 0.87
OR 0.88 0.87 0.88 0.89 0.89 0.88 0.88 0.87 0.88
Frmt Strat 0.93 0.93 0.93 0.94 0.94 0.93 0.93 0.93 0.93
Com alpha 0.91 0.91 0.91 0.92 0.91 0.91 0.91 0.91 0.91
Reading
All 0.93 0.92 0.92 0.88 0.88 0.88 0.88 0.88 0.88
MC 0.90 0.89 0.88 0.85 0.84 0.84 0.83 0.84 0.84
OR 0.90 0.90 0.89 0.86 0.85 0.85 0.86 0.85 0.85
Frmt Strat 0.94 0.93 0.93 0.90 0.90 0.90 0.90 0.90 0.90
Com alpha 0.89 0.88 0.88 0.88 0.88 0.88 0.88 0.88 0.88
Writing1
All 0.74
MC 0.65
OR 0.68
Frmt Strat 0.76
Com alpha 0.74
6
Math
All 0.94 0.94 0.94 0.94 0.94 0.94 0.94 0.94 0.94
MC 0.89 0.89 0.89 0.89 0.88 0.88 0.89 0.89 0.90
OR 0.90 0.89 0.90 0.90 0.90 0.89 0.89 0.89 0.89
Frmt Strat 0.94 0.94 0.94 0.94 0.94 0.94 0.94 0.94 0.94
Com alpha 0.93 0.92 0.93 0.92 0.92 0.92 0.92 0.92 0.93
Reading
All 0.93 0.92 0.92 0.89 0.88 0.88 0.88 0.88 0.87
MC 0.90 0.90 0.89 0.86 0.84 0.85 0.84 0.84 0.84
OR 0.89 0.89 0.89 0.83 0.83 0.83 0.82 0.82 0.83
Frmt Strat 0.94 0.93 0.93 0.90 0.90 0.90 0.89 0.90 0.89
Com alpha 0.89 0.88 0.88 0.89 0.88 0.88 0.88 0.88 0.87 (continued)

Chapter 7 Reliability 78 2007-08 NECAP Technical Report
Grade Subject Stat Form1 Form2 Form3 Form4 Form5 Form6 Form7 Form8 Form9
7
Math
All 0.94 0.93 0.93 0.93 0.93 0.93 0.93 0.93 0.93
MC 0.87 0.86 0.87 0.86 0.86 0.87 0.87 0.87 0.88
OR 0.90 0.89 0.89 0.90 0.88 0.89 0.89 0.89 0.89
Frmt Strat 0.94 0.93 0.94 0.94 0.93 0.93 0.94 0.94 0.94
Com alpha 0.92 0.92 0.92 0.92 0.92 0.92 0.92 0.92 0.92
Reading
All 0.92 0.92 0.92 0.89 0.89 0.89 0.89 0.88 0.89
MC 0.90 0.90 0.90 0.85 0.85 0.84 0.85 0.84 0.86
OR 0.91 0.91 0.90 0.86 0.87 0.86 0.87 0.86 0.87
Frmt Strat 0.94 0.94 0.94 0.91 0.91 0.91 0.91 0.91 0.92
Com alpha 0.89 0.89 0.89 0.89 0.89 0.89 0.89 0.88 0.89
8
Math
All 0.93 0.94 0.93 0.94 0.94 0.93 0.93 0.94 0.93
MC 0.88 0.87 0.86 0.88 0.87 0.87 0.88 0.88 0.87
OR 0.89 0.90 0.89 0.89 0.90 0.89 0.89 0.90 0.89
Frmt Strat 0.94 0.94 0.94 0.94 0.94 0.94 0.94 0.94 0.94
Com alpha 0.92 0.92 0.92 0.92 0.92 0.91 0.92 0.92 0.92
Reading
All 0.93 0.93 0.93 0.90 0.90 0.90 0.90 0.90 0.89
MC 0.91 0.90 0.90 0.87 0.87 0.87 0.86 0.86 0.86
OR 0.93 0.92 0.93 0.89 0.88 0.88 0.88 0.88 0.88
Frmt Strat 0.95 0.95 0.95 0.93 0.92 0.92 0.92 0.92 0.92
Com alpha 0.90 0.90 0.90 0.90 0.90 0.90 0.90 0.90 0.89
Writing1
All 0.75
MC 0.57
OR 0.70
Frmt Strat 0.77
Com alpha 0.75
11
Math
All 0.92 0.92 0.93 0.92 0.93 0.92 0.92 0.92
MC 0.81 0.82 0.81 0.79 0.83 0.80 0.81 0.82
OR 0.89 0.89 0.90 0.90 0.90 0.89 0.89 0.89
Frmt Strat 0.93 0.93 0.93 0.93 0.93 0.92 0.93 0.93
Com alpha 0.91 0.91 0.91 0.91 0.91 0.91 0.91 0.91
Reading
All 0.93 0.93 0.90 0.90 0.90 0.89 0.90 0.90
MC 0.90 0.90 0.85 0.85 0.85 0.84 0.85 0.85
OR 0.92 0.92 0.89 0.88 0.88 0.89 0.89 0.89
Frmt Strat 0.95 0.95 0.92 0.92 0.92 0.92 0.92 0.92
Com alpha 0.90 0.89 0.90 0.90 0.90 0.89 0.90 0.90 MC = multiple-choice; OR = open response; All = MC and OR
All = common and matrix items; MC = MC items only; OR = OR items only; Frmt Strat = stratified by MC/OR;
Com alpha = common items only
1Writing tests had only one form
Not surprisingly, reliabilities were higher on the full test than on subsets of items (i.e., only
MC or OR items).

Chapter 7 Reliability 79 2007-08 NECAP Technical Report
7.4 Reporting Subcategories Reliability
In subsection 7.3, the reliability coefficients were calculated based on form and item type.
Item type represents just one way of breaking an overall test into subtests. Of even more interest are
reliabilities for the reporting subcategories within NECAP subject areas, described in Chapter 2.
Cronbach’s α coefficients for subcategories were calculated via the same formula defined in
subsection 7.1 using just the items of a given subcategory in the computations. Results are presented
in Table 7-4. Once again as expected, because they are based on a subset of items rather than the full
test, computed subcategory reliabilities were lower (sometimes substantially so) than were overall
test reliabilities, and interpretations should take this into account.
Table 7-4. 2007-08 NECAP Common Item by Grade, Subject, and Reporting Subcategory
Grade Subject Reporting Subcategory Possible Points
3
Math
Number & Operations 35 0.89
Geometry & Measurement 10 0.60
Functions & Algebra 10 0.68
Data, Statistics, & Probability 10 0.69
Reading
Word ID/Vocabulary 22 0.80
Literary 15 0.71
Informational 15 0.66
Initial Understanding 19 0.76
Analysis & Interpretation 11 0.54
4
Math
Number & Operations 32 0.87
Geometry & Measurement 13 0.70
Functions & Algebra 10 0.67
Data, Statistics, & Probability 10 0.73
Reading
Word ID/Vocabulary 18 0.71
Literary 17 0.75
Informational 17 0.66
Initial Understanding 20 0.75
Analysis & Interpretation 14 0.61
5
Math
Number & Operations 30 0.84
Geometry & Measurement 13 0.57
Functions & Algebra 13 0.65
Data, Statistics, & Probability 10 0.62
Reading
Word ID/Vocabulary 9 0.59
Literary 22 0.73
Informational 21 0.78
Initial Understanding 19 0.74
Analysis & Interpretation 24 0.77
(continued)

Chapter 7 Reliability 80 2007-08 NECAP Technical Report
Grade Subject Reporting Subcategory Possible Points
5 Writing
Structures of Language & Writing Conventions 10 0.65
Short Responses 12 0.73
Extended Responses 15 0.18
6
Math
Number & Operations 26 0.85
Geometry & Measurement 17 0.73
Functions & Algebra 13 0.62
Data, Statistics, & Probability 10 0.66
Reading
Word ID/Vocabulary 9 0.66
Literary 21 0.73
Informational 22 0.76
Initial Understanding 19 0.73
Analysis & Interpretation 24 0.76
7
Math
Number & Operations 20 0.78
Geometry & Measurement 16 0.72
Functions & Algebra 19 0.81
Data, Statistics, & Probability 11 0.56
Reading
Word ID/Vocabulary 10 0.73
Literary 22 0.77
Informational 20 0.76
Initial Understanding 18 0.75
Analysis & Interpretation 24 0.77
8
Math
Number & Operations 13 0.69
Geometry & Measurement 16 0.68
Functions & Algebra 27 0.82
Data, Statistics, & Probability 10 0.67
Reading
Word ID/Vocabulary 10 0.70
Literary 21 0.81
Informational 21 0.76
Initial Understanding 19 0.76
Analysis & Interpretation 23 0.80
Writing
Structures of Language & Writing Conventions 10 0.57
Short Responses 12 0.78
Extended Responses 15 0.17
11
Math
Number & Operations 10 0.60
Geometry & Measurement 19 0.73
Functions & Algebra 25 0.83
Data, Statistics, & Probability 10 0.55
Reading
Word ID/Vocabulary 10 0.67
Literary 21 0.76
Informational 21 0.79
Initial Understanding 18 0.77
Analysis & Interpretation 24 0.79
For mathematics, subcategory reliabilities ranged from 0.55 to 0.83, for reading from 0.54 to
0.81, and for writing from 0.18 to 0.73. The subcategory reliabilities for the Extended Response
writing categories were lower than those of other categories because 12 of the 15 points for the
category came from a single 12-point writing prompt item. In general, the subcategory reliabilities

Chapter 7 Reliability 81 2007-08 NECAP Technical Report
were lower than those based on the total test and approximately to the degree one would expect
based on classical test theory. Qualitative differences between grades and content areas once again
preclude valid inferences about the quality of the full test based on statistical comparisons among
subtests.
7.5 Reliability of Achievement Level Categorization
All test scores contain measurement error; thus, classifications based on test scores are also
subject to measurement error. After the 2007-08 NECAP achievement levels were specified and
students classified into those levels, empirical analyses were conducted to determine the statistical
accuracy and consistency of the classifications. For every 2007-08 NECAP grade and content area,
each student was classified into one of the following achievement levels: Substantially Below
Proficient (SBP), Partially Proficient (PP), Proficient (P), or Proficient With Distinction (PWD).
This section of the report explains the methodologies used to assess the reliability of classification
decisions and presents the results.
7.5.1 Accuracy and Consistency
Accuracy refers to the extent to which decisions based on test scores match decisions that
would have been made if the scores did not contain any measurement error. Accuracy must be
estimated, because errorless test scores do not exist.
Consistency measures the extent to which classification decisions based on test scores match
the decisions based on scores from a second, parallel form of the same test. Consistency can be
evaluated directly from actual responses to test items if two complete and parallel forms of the test
are given to the same group of students. In operational test programs, however, such a design is usu-
ally impractical. Instead, techniques, such as one due to Livingston and Lewis (1995), have been
developed to estimate both the accuracy and consistency of classification decisions based on a single
administration of a test. The Livingston and Lewis technique was used for the 2007-08 NECAP
because it is easily adaptable to tests of all kinds of formats, including mixed-format tests.

Chapter 7 Reliability 82 2007-08 NECAP Technical Report
7.5.2 Calculating Accuracy
The accuracy and consistency estimates reported below make use of ―true scores‖ in the
classical test theory sense. A true score is the score that would be obtained if a test had no
measurement error. Of course, true scores cannot be observed and so must be estimated. In the
Livingston and Lewis method, estimated true scores are used to classify students into their ―true‖
achievement level.
For the 2007-08 NECAP, after various technical adjustments were made (described in
Livingston and Lewis, 1995), a 4 x 4 contingency table of accuracy was created for each content
area and grade, where cell [i,j] represented the estimated proportion of students whose true score fell
into achievement level i (where i = 1 – 4) and observed score into achievement level j (where j = 1 –
4). The sum of the diagonal entries, i.e., the proportion of students whose true and observed
achievement levels matched one another, signified overall accuracy.
7.5.3 Calculating Consistency
To estimate consistency, true scores were used to estimate the joint distribution of classifica-
tions on two independent, parallel test forms. Following statistical adjustments (per Livingston and
Lewis, 1995), a new 4 4 contingency table was created for each content area and grade and
populated by the proportion of students who would be classified into each combination of
achievement levels according to the two (hypothetical) parallel test forms. Cell [i,j] of this table
represented the estimated proportion of students whose observed score on the first form would fall
into achievement level i (where i = 1 – 4), and whose observed score on the second form would fall
into achievement level j(where j = 1 – 4). The sum of the diagonal entries, i.e., the proportion of
students classified by the two forms into exactly the same achievement level, signified overall
consistency.

Chapter 7 Reliability 83 2007-08 NECAP Technical Report
7.5.4 Calculating Kappa
Another way to measure consistency is to use Cohen’s (1960) coefficient (kappa), which
assesses the proportion of consistent classifications after removing the proportion of consistent
classifications that would be expected by chance. It is calculated using the following formula:
. .
. .
(Observed agreement) - (Chance agreement),
1 - (Chance agreement) 1
ii i i
i i
i i
i
C C C
C C
where:
Ci. is the proportion of students whose observed achievement level would be Level i
(where i=1 – 4) on the first hypothetical parallel form of the test;
C.i is the proportion of students whose observed achievement level would be Level i
(where i=1 – 4) on the second hypothetical parallel form of the test;
Cii is the proportion of students whose observed achievement level would be Level i
(where i=1 – 4) on both hypothetical parallel forms of the test.
Because is corrected for chance, its values are lower than are other consistency estimates.
7.5.5 Results of Accuracy, Consistency, and Kappa Analyses
The accuracy and consistency analyses described above are tabulated in Appendix K. The
appendix includes the accuracy and consistency contingency tables described above and the overall
accuracy and consistency indices, including kappa.
Accuracy and consistency values conditional upon achievement level are also given in
Appendix K. For these calculations, the denominator is the proportion of students associated with a
given achievement level. For example, the conditional accuracy value is 0.709 for the PP
achievement level for mathematics grade 3. This figure indicates that among the students whose true
scores placed them in the PP achievement level, 70.9% of them would be expected to be in the PP
achievement level when categorized according to their observed score. Similarly, the corresponding
consistency value of 0.614 indicates that 61.4% of students with observed scores in PP would be
expected to score in the PP achievement level again if a second, parallel test form were used.
For some testing situations, the greatest concern may be decisions around level thresholds.
For example, if a college gave credit to students who achieved an Advanced Placement test score of

Chapter 7 Reliability 84 2007-08 NECAP Technical Report
4 or 5, but not to scores of 1, 2, or 3, one might be interested in the accuracy of the dichotomous
decision below-4 versus 4-or-above. For the 2007-08 NECAP, Appendix K provides accuracy and
consistency estimates at each cutpoint as well as false positive and false negative decision rates.
(False positives are the proportion of students whose observed scores were above the cut and true
scores below the cut. False negatives are the proportion of students whose observed scores were
below the cut and true scores above the cut.)
The above indices are derived from Livingston & Lewis’ (1995) method of estimating the
accuracy and consistency of classifications. It should be noted that Livingston & Lewis discuss two
versions of the accuracy and consistency tables. A standard version performs calculations for forms
parallel to the form taken. An ―adjusted‖ version adjusts the results of one form to match the
observed score distribution obtained in the data. The tables reported in Appendix K use the standard
version for two reasons: 1) this ―unadjusted‖ version can be considered a smoothing of the data,
thereby decreasing the variability of the results; and 2) for results dealing with the consistency of
two parallel forms, the unadjusted tables are symmetric, indicating that the two parallel forms have
the same statistical properties. This second reason is consistent with the notion of forms that are
parallel, i.e., it is more intuitive and interpretable for two parallel forms to have the same statistical
distribution as one another.
Descriptive statistics relating to the decision accuracy and consistency of the 2007-08
NECAP tests can be derived from Appendix K. For mathematics, overall accuracy ranged from
0.778 to 0.815; overall consistency ranged from 0.701 to 0.743; the kappa statistic ranged from
0.577 to 0.631. For reading, overall accuracy ranged from 0.781 to 0.818; overall consistency ranged
from 0.704 to 0.747; the kappa statistic ranged from 0.542 to 0.622. Finally, for writing, overall
accuracy was 0.617 or 0.642 in the two grades tested; overall consistency was 0.516 or 0.539; the
kappa statistic was 0.343 or 0.362.

Chapter 7 Reliability 85 2007-08 NECAP Technical Report
Table 7-5 below summarizes most of the results of Appendix K at a glance. As with other
types of reliability, it is inappropriate when analyzing the decision accuracy and consistency of a
given test to compare results between grades and content areas.
Table 7-5. 2007-08 NECAP: Summary of Decision Accuracy (and Consistency) Results
Conditional on Level At Cut Point
Content/Grade Overall SBP PP P PWD SBP:PP PP:P P:PWD
Math/3 .82(.75) .84(.77) .71(.61) .83(.78) .89(.78) .96(.94) .93(.90) .93(.91)
Math/4 .82(.75) .84(.77) .73(.64) .84(.79) .88(.77) .95(.93) .92(.89) .94(.92)
Math/5 .79(.72) .82(.75) .56(.45) .83(.78) .87(.75) .93(.91) .92(.88) .94(.91)
Math/6 .81(.74) .85(.78) .62(.51) .84(.79) .89(.79) .94(.92) .92(.89) .94(.92)
Math/7 .79(.72) .82(.76) .65(.55) .82(.76) .88(.77) .93(.91) .92(.88) .94(.92)
Math/8 .79(.72) .81(.75) .66(.55) .83(.77) .88(.77) .93(.90) .92(.89) .95(.93)
Math/11 .83(.77) .88(.85) .72(.63) .87(.80) .81(.54) .91(.88) .93(.90) .99(.99)
Reading/3 .80(.72) .79(.69) .69(.60) .82(.77) .87(.73) .96(.94) .91(.88) .93(.90)
Reading/4 .77(.68) .77(.66) .67(.57) .78(.72) .86(.71) .95(.93) .90(.86) .91(.88)
Reading/5 .80(.72) .79(.67) .74(.65) .80(.75) .87(.75) .96(.95) .91(.87) .93(.90)
Reading/6 .80(.72) .79(.68) .72(.63) .82(.77) .86(.73) .96(.94) .91(.87) .93(.90)
Reading/7 .82(.74) .80(.70) .72(.63) .84(.80) .87(.74) .96(.95) .92(.89) .93(.91)
Reading/8 .81(.74) .82(.74) .76(.68) .82(.76) .88(.76) .96(.94) .92(.88) .94(.91)
Reading/11 .81(.73) .82(.73) .75(.67) .81(.75) .88(.78) .96(.94) .92(.88) .93(.91)
Writing/5 .61(.51) .73(.61) .53(.44) .54(.45) .80(.61) .89(.84) .83(.77) .88(.83)
Writing/8 .66(.55) .72(.59) .62(.54) .66(.56) .78(.50) .90(.86) .83(.77) .92(.89)
SBP = Substantially Below Proficient; PP = Partially Proficient; P = Proficient; PWD = Proficient with Distinction


Chapter 8 Validity 87 2007-08 NECAP Technical Report
Chapter 8 VALIDITY
Because interpretations of test scores, and not a test itself, are evaluated for validity, the
purpose of the 2007-08 NECAP Technical Report is to describe several technical aspects of the
NECAP tests in support of score interpretations (AERA, 1999). Each chapter contributes an
important component in the investigation of score validation: test development and design; test
administration; scoring, scaling, and equating; item analyses; reliability; and score reporting.
The NECAP tests are based on and aligned with the content standards and performance
indicators in the GLEs for mathematics, reading, and writing. Inferences about student achievement
on the content standards are intended from NECAP results, which in turn serve evaluation of school
accountability and inform the improvement of programs and instruction.
The Standards for Educational and Psychological Testing (1999) provides a framework for
describing sources of evidence that should be considered when evaluating validity. These sources
include evidence on the following five general areas: test content, response processes, internal
structure, consequences of testing, and relationship to other variables. Although each of these
sources may speak to a different aspect of validity, they are not distinct types of validity. Instead,
each contributes to a body of evidence about the comprehensive validity of score interpretations.
A measure of test content validity is to determine how well the test tasks represent the
curriculum and standards for each subject and grade level. This is informed by the item development
process, including how test blueprints and test items align with the curriculum and standards.
Validation through the content lens was extensively described in Chapter 2. Item alignment with
content standards; item bias; sensitivity and content appropriateness review processes; adherence to
the test blueprint; use of multiple item types; use of standardized administration procedures, with
accommodated options for participation; and appropriate test administration training are all
components of validity evidence based on test content.

Chapter 8 Validity 88 2007-08 NECAP Technical Report
All NECAP test questions were aligned by educators with specific content standards and
underwent several rounds of review for content fidelity and appropriateness. Items were presented to
students in multiple formats (MC, SA, and CR). Finally, tests were administered according to
mandated standardized procedures, with allowable accommodations, and all test coordinators and
test administrators were required to familiarize themselves with and adhere to all of the procedures
outlined in the NECAP Test Coordinator and Test Administrator manuals.
The scoring information in Chapter 4 described both the steps taken to train and monitor
hand-scorers and quality control procedures related to scanning and machine-scoring. Additional
studies might be helpful for evidence on student response processes. For example, think-aloud
protocols could be used to investigate students’ cognitive processes when confronting test items.
Evidence on internal structure was extensively detailed in discussions of scaling and
equating, item analyses, and reliability in Chapters 5, 6, and 7. Technical characteristics of the
internal structure of the tests were presented in terms of classical item statistics (item difficulty and
item-test correlation), differential item functioning analyses, a variety of reliability coefficients,
SEM, multidimensionality hypothesis testing and effect size estimation, and IRT parameters and
procedures. In general, item difficulty indices were within acceptable and expected ranges; very few
items were answered correctly at near-chance or near-perfect rates. Similarly, the positive
discrimination indices indicated that students who performed well on individual items tended to
perform well overall. Chapter 5 also described the method used to equate the 2007-08 test to the
2006-07 scales.
Evidence on the consequences of testing was addressed in information on scaled score and
reporting in Chapters 5 and 9 and in the Guide to Using the 2007 NECAP Reports, which is a
separate document referenced in the discussion of reporting. Each of these spoke to efforts
undertaken for providing the public with accurate and clear test score information. Scaled scores
simplify results reporting across content areas, grade levels, and successive years. Achievement
levels give reference points for mastery at each grade level, another useful and simple way to
Chapter 8 Validity 89 2007-08 NECAP Technical Report
interpret scores. Several different standard reports were provided to stakeholders. Evidence on the
consequences of testing could be supplemented with broader research on the impact on student
learning of NECAP testing.
8.1 Questionnaire Data
A measure of external validity was provided by comparing student performance with answers
to a questionnaire administered at the end of test. The grades 3–8 questionnaire contained 31
questions (9 concerned reading, 10 mathematics, and 12 writing). The grade 11 questionnaire
contained 36 questions (11 concerned reading, 13 mathematics, and 12 writing) Most of the
questions were designed to gather information about students and their study habits; however, a
subset could be utilized in the test of external validity. One question from each content area was
most expected to correlate with student performance on NECAP tests. To the extent that the answers
to those questions did correlate with student performance in the anticipated manner, the external
validity of score interpretations was confirmed. The three questions are now discussed one at a time.
Question 8 (grades 3–8)/21 (grade 11) concerning reading, read as follows:
How often do you choose to read in your free time?
A. almost every day
B. a few times a week
C. a few times a month
D. I almost never read.
It was anticipated that students who read more in their free time would have higher average
scaled scores and achievement level designations in reading than students who did not read as much.
In particular, it was expected that on average, reading performance among students who chose ―A‖
would meet or exceed performance of students who chose ―B,‖ whose performance would meet or
exceed that of students who chose ―C,‖ whose performance would meet or exceed that of students
who chose ―D.‖ This pattern was observed in Table 8-1 in all grades, both in terms of average scaled
scores and the percentage of students in the Proficient with Distinction achievement level.

Chapter 8 Validity 90 2007-08 NECAP Technical Report
Table 8-1. 2007-08 NECAP: Average Scaled Score, and Counts and Percentages, within Performance Levels, of Responses to Spare-Time Reading Item1
on Student Questionnaire—Reading
Grade Resp Number
Resp Percentage
Resp Avg SS
N SBP
N PP
N P
N PWD
% SBP
% PP
% P
% PWD
3
(blank) 3954 13 343 663 685 2145 461 17 17 54 12
A 14801 49 347 1336 2171 9011 2283 9 15 61 15
B 7520 25 346 720 1090 4768 942 10 14 63 13
C 1689 6 343 255 312 981 141 15 18 58 8
D 2437 8 340 497 520 1309 111 20 21 54 5
4
(blank) 3200 10 442 576 692 1460 472 18 22 46 15
A 15521 48 447 1433 2641 8005 3442 9 17 52 22
B 9411 29 445 932 1801 5148 1530 10 19 55 16
C 1846 6 442 313 357 936 240 17 19 51 13
D 2248 7 438 507 625 987 129 23 28 44 6
5
(blank) 3162 10 542 525 789 1387 461 17 25 44 15
A 14410 45 548 983 2566 7466 3395 7 18 52 24
B 10206 32 545 841 2308 5463 1594 8 23 54 16
C 2193 7 542 270 601 1094 228 12 27 50 10
D 2382 7 539 467 799 993 123 20 34 42 5
6
(blank) 3744 11 642 714 871 1727 432 19 23 46 12
A 11347 35 649 786 1669 6420 2472 7 15 57 22
B 11167 34 645 953 2400 6464 1350 9 21 58 12
C 3387 10 643 384 827 1893 283 11 24 56 8
D 3205 10 639 553 1006 1512 134 17 31 47 4
7
(blank) 3805 11 742 737 883 1763 422 19 23 46 11
A 9501 28 751 508 1071 5548 2374 5 11 58 25
B 11220 33 747 813 2093 6692 1622 7 19 60 14
C 4555 13 745 436 1043 2664 412 10 23 58 9
D 4798 14 741 734 1344 2522 198 15 28 53 4
8
(blank) 3412 10 840 825 871 1344 372 24 26 39 11
A 8904 25 850 506 1231 4998 2169 6 14 56 24
B 10796 31 846 970 2290 5954 1582 9 21 55 15
C 5481 16 843 629 1454 2906 492 11 27 53 9
D 6459 18 840 1125 2137 2888 309 17 33 45 5
11
(blank) 7890 23 1141 1532 1838 3303 1217 19 23 42 15
A 5597 16 1147 456 883 2790 1468 8 16 50 26
B 7303 21 1145 694 1381 3633 1595 10 19 50 22
C 6144 18 1144 572 1342 3216 1014 9 22 52 17
D 7062 21 1141 997 2128 3326 611 14 30 47 9
1Question: How often do you choose to read in your free time? A = almost every day; B = a few times a week; C = a few times a
month; D = I almost never read.
SBP = Substantially Below Proficient; PP = Partially Proficient; P = Proficient; PWD = Proficient with Distinction.

Chapter 8 Validity 91 2007-08 NECAP Technical Report
Table 8-2. 2007-08 NECAP: Average Scaled Score, and Counts and Percentages, within Performance Levels, of Responses to Kinds of School Writing Item1 of Student
Questionnaire—Writing.
Grade Resp N
Resp %
Resp Avg SS
N SBP
N PP
N P
N PWD
% SBP
% PP
% P
% PWD
5
(blank) 3850 12 537 1095 1122 1122 511 28 29 29 13
A 6161 19 539 1296 1959 2107 799 21 32 34 13
B 2860 9 538 655 941 935 329 23 33 33 12
C 3018 9 540 632 888 1049 449 21 29 35 15
D 16392 51 543 2503 4441 6040 3408 15 27 37 21
8
(blank) 4039 12 835 1270 1430 1092 247 31 35 27 6
A 3853 11 835 1011 1738 987 117 26 45 26 3
B 5700 16 838 1097 2420 1836 347 19 42 32 6
C 4204 12 838 805 1799 1336 264 19 43 32 6
D 17133 49 842 1960 6288 7110 1775 11 37 41 10
11
(blank) 7846 23 5.3 1739 3621 2237 249 22 46 29 3
A 1493 4 4.8 400 762 314 17 27 51 21 1
B 7718 23 5.8 1001 3901 2585 231 13 51 33 3
C 4204 12 5.5 748 2064 1242 150 18 49 30 4
D 12625 37 5.9 1589 6025 4548 463 13 48 36 4
1Question: What kinds of writing do you do most in school? A = I mostly write stories; B = I mostly write reports; C = I mostly write
about things I’ve read; D = I do all kinds of writing.
SBP = Substantially Below Proficient; PP = Partially Proficient; P = Proficient; PWD = Proficient with Distinction.
Question 15/31, concerning mathematics, read as follows:
How often do you have mathematics homework?
A. almost every day
B. a few times a week
C. a few times a month
D. I usually don’t have homework in mathematics.
As anticipated, the relationship between Question 15/31 and student performance in
mathematics (see Table 8-3 below) mirrored the pattern of Question 8/21 at each grade: On average,
mathematics performance among students who chose ―A‖ met or exceeded the performance of
students who chose ―B,‖ whose performance met or exceeded that of students who chose ―C,‖ whose
performance met or exceeded that of students who chose ―D.‖ This pattern was again evident both in
terms of average scaled scores and the percentage of students in the Proficient with Distinction
achievement level.

Chapter 8 Validity 92 2007-08 NECAP Technical Report
Table 8-3. 2007-08 NECAP: Average Scaled Score, and Counts and Percentages, within Performance Levels, of Responses to Frequency of Mathematics-Homework Item1 of Student
Questionnaire—Mathematics
Grade Resp N
Resp %
Resp Avg SS
N SBP
N PP
N P
N PWD
% SBP
% PP
% P
% PWD
3
(blank) 3992 13 342 784 785 1847 576 20 20 46 14
A 13818 45 345 1683 2490 6758 2887 12 18 49 21
B 9139 30 345 1072 1667 4664 1736 12 18 51 19
C 1750 6 343 268 323 863 296 15 18 49 17
D 1804 6 340 403 398 800 203 22 22 44 11
4
(blank) 3211 10 440 759 803 1247 402 24 25 39 13
A 16824 52 444 2241 3663 8049 2871 13 22 48 17
B 9502 29 443 1333 2217 4522 1430 14 23 48 15
C 1515 5 442 306 323 641 245 20 21 42 16
D 1282 4 438 357 343 464 118 28 27 36 9
5
(blank) 3194 10 540 908 526 1343 417 28 16 42 13
A 17978 55 544 2911 2849 8781 3437 16 16 49 19
B 8921 28 543 1825 1655 4056 1385 20 19 45 16
C 1355 4 542 314 245 605 191 23 18 45 14
D 990 3 537 362 173 373 82 37 17 38 8
6
(blank) 3779 11 639 1129 710 1399 541 30 19 37 14
A 17797 54 645 2709 2999 8146 3943 15 17 46 22
B 9376 28 642 1927 1830 4017 1602 21 20 43 17
C 1049 3 640 257 189 464 139 24 18 44 13
D 929 3 634 408 183 270 68 44 20 29 7
7
(blank) 3801 11 738 1257 833 1226 485 33 22 32 13
A 19746 58 743 3043 4178 8634 3891 15 21 44 20
B 8671 26 741 1944 2034 3462 1231 22 23 40 14
C 954 3 737 310 236 320 88 32 25 34 9
D 777 2 732 406 160 171 40 52 21 22 5
8
(blank) 3495 10 836 1273 810 1038 374 36 23 30 11
A 21216 60 842 3422 4520 9403 3871 16 21 44 18
B 8373 24 839 2154 2248 3251 720 26 27 39 9
C 1110 3 835 429 287 328 66 39 26 30 6
D 915 3 831 481 189 202 43 53 21 22 5
11
(blank) 7975 24 1131 4193 1953 1732 97 53 24 22 1
A 18051 53 1136 6572 5597 5537 345 36 31 31 2
B 4805 14 1131 2725 1215 822 43 57 25 17 1
C 1441 4 1128 1009 296 133 3 70 21 9 0
D 1635 5 1126 1241 282 107 5 76 17 7 0
1Question: How often do you have mathematics homework? A = almost every day; B = a few times a week; C = a few times a month;
D = I usually don’t have homework in mathematics.
SBP = Substantially Below Proficient; PP = Partially Proficient; P = Proficient; PWD = Proficient with Distinction.

Chapter 8 Validity 93 2007-08 NECAP Technical Report
Question 31/12, concerning writing, read as follows:
What kinds of writing do you do most in school?
A. I mostly write stories.
B. I mostly write reports.
C. I mostly write about things I’ve read.
D. I do all kinds of writing.
For this question, the only anticipated outcome was that students who selected choice ―D,‖
i.e., those who ostensibly had experience in many different kinds of writing, would tend to
outperform students who selected any other answer choice. The expected outcome was realized in all
three grades (see Table 8-2).
Based on the foregoing analysis, the relationship between questionnaire data and
performance on the NECAP was consistent with expectations of the three questions selected for the
investigation of external validity. See Appendix L for a copy of the questionnaire and complete data
comparing questionnaire items and test performance.
8.2 Validity Studies Agenda
The remaining part of this chapter describes further studies of validity that are being
considered for the future. These studies could enhance the investigations of validity that have
already been performed. The proposed areas of validity to be examined fall into four categories:
external validity, convergent and discriminant validity, structural validity, and procedural validity.
These will be discussed in turn.
8.2.1 External Validity
In the future, investigations of external validity would involve targeted examination of
variables which correlate with NECAP results. For example, data could be collected on the
classroom grades of each student who took the NECAP tests. As with the analysis of student
questionnaire data, cross-tabulations of NECAP achievement levels and assigned grades could be

Chapter 8 Validity 94 2007-08 NECAP Technical Report
created. The average NECAP scaled score could also be computed for each possible assigned grade
(A, B, C, etc.). Analysis would focus on the relationship between NECAP scores and grades in the
appropriate class (i.e., NECAP mathematics would be correlated with student grades in mathematics,
not reading). NECAP scores could also be correlated with other appropriate classroom tests in
addition to final grades.
Further evidence of external validity might come from correlating NECAP scores with scores
on another standardized test, such as the Iowa Test of Basic Skills (ITBS). As with the study of
concordance between NECAP scores and grades, this investigation would compare scores in
analogous content areas (e.g., NECAP reading and ITBS reading comprehension). All tests taken by
each student would be appropriate to the student’s grade level.
8.2.2 Convergent and Discriminant Validity
The concepts of convergent and discriminant validity were defined by Campbell and Fiske
(1959) as specific types of validity that fall under the umbrella of construct validity. The notion of
convergent validity states that measures or variables that are intended to align with one another
should actually be aligned in practice. discriminant validity, on the other hand, is the idea that
measures or variables that are intended to differ from one another should not be too highly
correlated. Evidence for validity comes from examining whether the correlations among variables
are as expected in direction and magnitude.
Campbell and Fiske (1959) introduced the study of different traits and methods as the means
of assessing convergent and discriminant validity. Traits refer to the constructs that are being
measured (e.g., mathematical ability), and methods are the instruments of measuring them (e.g., a
mathematics test or grade). To utilize the framework of Campbell and Fiske, it is necessary that
more than one trait and more than one method be examined. Analysis is performed through the
multi-trait/multi-method matrix, which gives all possible correlations of the different combinations
of traits and methods. Campbell and Fiske defined four properties of the multi-trait/multi-method
matrix that serve as evidence of convergent and discriminant validity:

Chapter 8 Validity 95 2007-08 NECAP Technical Report
The correlation among different methods of measuring the same trait should be
sufficiently different from zero. For example, scores on a mathematics test and grades in
a mathematics class should be positively correlated.
The correlation among different methods of measuring the same trait should be higher
than that of different methods of measuring different traits. For example, scores on a
mathematics test and grades in a mathematics class should be more highly correlated than
are scores on a mathematics test and grades in a reading class.
The correlation among different methods of measuring the same trait should be higher
than the same method of measuring different traits. For example, scores on a mathematics
test and grades in a mathematics class should be more highly correlated than scores on a
mathematics test and scores on an analogous reading test.
The pattern of correlations should be similar across comparisons of different traits and
methods. For example, if the correlation between test scores in reading and writing is
higher than the correlation between test scores in reading and mathematics, it is expected
that the correlation between grades in reading and writing would also be higher than the
correlation between grades in reading and mathematics.
For NECAP, convergent and discriminant validity could be examined by constructing a
multi-trait/multi-method matrix and analyzing the four pieces of evidence described above. The
traits examined would be mathematics, reading, and writing; different methods would include
NECAP score and such variables as grades, teacher judgments, and/or scores on another
standardized test.
8.2.3 Structural Validity
Though the previous types of validity examine the concurrence between different measures
of the same content area, structural validity focuses on the relation between strands within a content

Chapter 8 Validity 96 2007-08 NECAP Technical Report
area, thus supporting content validity. Standardized tests are carefully designed to ensure that all
appropriate strands of a content area are adequately covered in test, and structural validity is the
degree to which related elements of a test are correlated in the intended manner. For instance, it is
desired that performance on different strands of a content area be positively correlated; however, as
these strands are designed to measure distinct components of the content area, it is reasonable to
expect that each strand would contribute a unique component to the test. Additionally, it is desired
that the correlation between different item types (MC, SA, and CR) of the same content area be
positive.
As an example, an analysis of NECAP structural validity would investigate the correlation
between performance in Geometry and Measurement and performance in Functions and Algebra.
Additionally, the concordance between performance on MC items and OR items would be
examined. Such a study would address the consistency of NECAP tests within each grade and
content area. In particular, the dimensionality analyses of Chapter 6 could be expanded to include
confirmatory analyses addressing these concerns.
8.2.4 Procedural Validity
As mentioned earlier, the NECAP Test Coordinator and Test Administrator manuals
delineated the procedures to which all NECAP test coordinators and test administrators were
required to adhere. A study of procedural validity would provide a comprehensive documentation of
the procedures that were followed throughout the NECAP administration. The results of the
documentation would then be compared to the manuals, and procedural validity would be confirmed
to the extent that the two are in alignment. Evidence of procedural validity is important because it
verifies that the actual administration practices are in accord with the intentions of the design.
Possible instances where discrepancies can exist between design and implementation include
the following: A teacher may spiral test forms incorrectly within a classroom; cheating may occur
among students; answer documents may be scanned incorrectly. These are examples of
administration error. A study of procedural validity involves capturing any administration errors and

Chapter 8 Validity 97 2007-08 NECAP Technical Report
presenting them within a cohesive document for review.
All potential tests of validity that have been introduced in this chapter will be discussed as
candidates for action by the NECAP Technical Advisory Committee (NECAP TAC) during 2008-
09. With the advice of the NECAP TAC, the states will develop a short-term (e.g., 1-year) and
longer term (e.g., 2-year to 5-year) plan for validity studies.


Chapter 9 Score Reporting 99 2007-08 NECAP Technical Report
SECTION III —2007-08 NECAP REPORTING
Chapter 9 SCORE REPORTING
9.1 Teaching Year vs. Testing Year Reporting
The data used for the NECAP Reports are the results of the fall 2007 administration of the
NECAP test. However, the NECAP tests are based on the GLEs from the prior year. For example,
the Grade 7 NECAP test, administered in the fall of seventh grade, is based on the grade 6 GLEs.
Many students therefore receive the instruction they need for the fall test at a different school than
where they are currently enrolled. The state Departments of Education determined that access to
results information would be valuable to both the school where the student was tested and the school
where the student received instruction in order to improve curriculum. To achieve this goal, separate
Item Analysis, School and District Results, and School and District Summary reports were created
for the ―testing‖ school and the ―teaching‖ school. Every student who participated in the NECAP test
was represented in ―testing‖ reports, and most students were also represented in ―teaching‖ reports.
In some cases, such as a student who recently moved to the state, it is not possible to provide
information about a student in ―teaching‖ reports.
9.2 Primary Reports
There were four primary reports for the 2007–08 NECAP:
Student Report
Item Analysis Report
School and District Results Report
School and District Summary Report

Chapter 9 Score Reporting 100 2007-08 NECAP Technical Report
With the exception of the Student Report, all reports were available for schools and districts
to view or download on a password-secure website hosted by Measured Progress. Student-level data
files were also available for districts to download from the secure Web site. Each of these reports is
described in the following subsections. Sample reports are provided in Appendix M.
9.3 Student Report
The NECAP Student Report is a single-page two-sided report that is printed onto 8.5‖ by 14‖
paper. The front side of the report includes informational text about the design and uses of the
assessment. This side of the report also contains text that describes the three corresponding sections
of the reverse side of the student report as well as the achievement level definitions. The reverse
side of the student report provides a complete picture of an individual student’s performance on the
NECAP, divided into three sections. The first section provides the student’s overall performance for
each content area. The student’s achievement levels are provided and scaled scores are presented
numerically as well as in a graphic that places the student’s scaled score, with its standard error of
measurement bar constructed about it, within the full range of possible scaled scores demarcated into
the four achievement levels.
The second section of the report displays the student’s achievement level in each content area
relative to the percentage of students at each achievement level across the school, district, and state.
The third section of the report shows the student’s performance compared to school, district,
and statewide performances. Each content area is reported by subcategories. For reading, with the
exception of Word ID/Vocabulary items, items are reported by Type of Text (Literary,
Informational) and Level of Comprehension (Initial Understanding, Analysis and Interpretation). For
mathematics, the subcategories are Numbers and Operations; Geometry and Measurement;
Functions and Algebra; and Data, Statistics, and Probability. The content area subcategories for
writing at grades 5 and 8 are reported on the Structures of Language and Writing Conventions and
by the type of response—short or extended. Grade 11 writing only reports on the extended response
as a subcategory.

Chapter 9 Score Reporting 101 2007-08 NECAP Technical Report
Student performances by subject area are reported in the context of possible points; average
points earned for the school, district, and state; and the average points earned by students at the
Proficient level on the total test.
To provide a more complete picture of the student’s performance on the writing test, each
scorer chose up to three comments about the student’s writing performance from a predetermined list
produced by the writing representatives from each state department of education. Scorers’ comments
are presented in a box next to the writing results.
The NECAP Student Report is confidential and should be kept secure within the school and
district. The Family Educational Rights and Privacy Act (FERPA) requires that access to individual
student results be restricted to the student, the student’s parents/guardians, and authorized school
personnel.
9.4 Item Analysis Reports
The NECAP Item Analysis Report provides a roster of all the students in each school and
their performances on the common items in the test that are released to the public, one report per
content area. For all grades and content areas, the student names and identification numbers are
listed as row headers down the left side of the report. For grades 3 through 8 and 11 in reading and
mathematics and grades 5 and 8 writing, the items are listed as column headers across the top in the
order they appeared in the released item documents (not the position in which they appeared on the
test). For each item, seven pieces of information are shown: the released item number, the content
strand for the item, the GLE code for the item, the Depth of Knowledge code for the item, the item
type, the correct response letter for MC items, and the total possible points for each item. For each
student, MC items are marked either with a plus sign (+), indicating that the student chose the
correct MC response, or a letter (from A to D), indicating the incorrect response chosen by the
student. For CR items, the number of points that the student attained is shown. All responses to
released items are shown is the report, regardless of the student’s participation status.

Chapter 9 Score Reporting 102 2007-08 NECAP Technical Report
The columns on the right side of the report show Total Test Results broken into several
categories. The Subcategory Points Earned columns show points earned by the student in each
content area relative to total points possible. The Total Points Earned column is a summary of all
points earned and total possible points in the content area. The last two columns show the Scaled
Score and Achievement Level for each student. For students who are reported as Not Tested, a code
appears in the Achievement Level column to indicate the reason why the student did not test. The
descriptions of these codes can be found on the legend, after the last page of data on the report. It is
important to note that not all items used to compute student scores are included in this report. Only
those items that have been released are included. At the bottom of the report, the average percentage
correct for each MC item and average scores for the SA and CR items and writing prompts is shown
across the school, district, and state.
For grade 11 writing, the top portion of the NECAP Item Analysis Report consists of a single
row of item information containing: the content stand, GSE codes, the Depth of Knowledge code,
the item type – writing prompt, and total possible points. The student names and identification
numbers are listed as row headers down the left side of the report. The Total Test Results section to
the right includes the Total Points Earned and Achievement Level for each student. At the bottom of
the last page of the report, the average points earned on the writing prompt are provided for the
school, district, and state.
The NECAP Item Analysis Report is confidential and should be kept secure within the school
and district. The FERPA requires that access to individual student results be restricted to the student,
the student’s parents/guardians, and authorized school personnel.
9.5 School and District Results Reports
The NECAP School Results Report and the NECAP District Results Report consist of three
parts: the grade level summary report (page 2), the content area results (pages 3, 5, and 7), and the
disaggregated content area results (pages 4, 6, and 8).

Chapter 9 Score Reporting 103 2007-08 NECAP Technical Report
The grade level summary report provides a summary of participation in the NECAP and a
summary of NECAP results. The participation section on the top half of the page shows the number
and percentage of students who were enrolled on or after October 1, 2007-08. The total number of
students enrolled is defined as the number of students tested plus the number of students not tested.
Because students who were not tested did not participate, average school scores were not
affected by non-tested students. These students were included in the calculation of the percentage of
students participating but not in the calculation of scores. For students who participated in some but
not all sessions of the NECAP test, actual scores were reported for the content areas in which they
participated. These reporting decisions were made to support the requirement that all students
participate in the NECAP testing program.
Data are provided for the following groups of students who may not have completed the
entire battery of NECAP tests:
Alternate Test: Students in this category completed an alternate test for the 2006-07
school year.
First-Year LEP: Students in this category are defined as being new to the United States
after October 1, 2006 and were not required to take the NECAP tests in reading and
writing. Students in this category were expected to take the mathematics portion of the
NECAP.
Withdrew After October 1: Students withdrawing from a school after October 1, 2007
may have taken some sessions of the NECAP tests prior to their withdrawal from the
school.
Enrolled After October 1: Students enrolling in a school after October 1, 2007 may not
have had adequate time to participate fully in all sessions of NECAP testing.

Chapter 9 Score Reporting 104 2007-08 NECAP Technical Report
Special Consideration: Schools received state approval for special consideration for an
exemption on all or part of the NECAP tests for any student whose circumstances are not
described by the previous categories but for whom the school determined that taking the
NECAP tests would not be possible.
Other: Occasionally students will not have completed the NECAP tests for reasons other
than those listed above. These ―other‖ categories were considered not state approved.
The results section in the bottom half of the page shows the number and percentage of
students performing at each achievement level in each of the three content areas across the school,
district, and state. In addition, a mean scaled score is provided for each content area across school,
district, and state levels except for grade 11 writing where the mean raw score is provided across the
school, district, and state. For the district version of this report, the school information is blank.
The content area results pages provide information on performance in specific subcategories
of the tested content areas (for example, geometry, and measurement within mathematics). The
purpose of these sections is to help schools to determine the extent to which their curricula are
effective in helping students to achieve the particular standards and benchmarks contained in the
Grade Level and Grade Span Expectations. Information about each content area (reading,
mathematics and writing) for school, district, and state includes
the total number of students enrolled, not tested (state-approved reason), not tested (other
reason), and tested;
the total number and percentage of students at each achievement level (based on the
number in the tested column); and
the mean scaled score.

Chapter 9 Score Reporting 105 2007-08 NECAP Technical Report
Information about each content area subcategory for reading mathematics and writing
include the following
The total possible points for that category. In order to provide as much information as
possible for each category, the total number of points includes both the common items
used to calculate scores and additional items in each category used for equating the test
from year to year.
A graphic display of the percent of total possible points for the school, state, and district.
In this graphic display, there are symbols representing school, district, and state
performance. In addition, there is a line representing the standard error of measurement.
This statistic indicates how much a student’s score could vary if the student were
examined repeatedly with the same test (assuming that no learning were to occur between
test administrations).
For grade 11 writing only, a column showing the number of prompts for each subtopic
(strand) is provided as well as the distribution of score points across prompts within each
strand in terms of percentages for the school, district, and state.
The disaggregated content area results pages present the relationship between performance
and student reporting variables (see list below) in each content area across school, district, and state
levels. Each content area page shows the number of students categorized as enrolled, not tested
(state-approved reason), not tested (other reason), and tested. The tables also provide the number and
percentage of students within each of the four achievement levels and the mean scaled score by each
reporting category.

Chapter 9 Score Reporting 106 2007-08 NECAP Technical Report
The list of student reporting categories is as follows:
All Students
Gender
Primary Race/Ethnicity
LEP Status (Limited English Proficiency)
IEP
SES (socioeconomic status)
Migrant
Title I
504 Plan
The data for achievement levels and mean scaled score are based on the number shown in the
tested column. The data for the reporting categories were provided by information coded on the
students’ answer booklets by teachers and/or data linked to the student label. Because performance is
being reported by categories that can contain relatively low numbers of students, school personnel
are advised, under FERPA guidelines, to treat these pages confidentially.
It should be noted that for NH and VT, no data were reported for the 504 Plan in any of the
content areas. In addition, for VT, no data were reported for Title I in any of the content areas.
9.6 School and District Summary Reports
The NECAP School Summary Report and the NECAP District Summary Report provide
details, broken down by content area, on student performance by grade level tested in the school.
The purpose of the summary is to help schools determine the extent to which their students achieve
the particular standards and benchmarks contained in the Grade Level and Grade Span Expectations.

Chapter 9 Score Reporting 107 2007-08 NECAP Technical Report
Information about each content area and grade level for school, district, and state includes
the total number of students enrolled, not tested (state-approved reason), not tested (other
reason), and tested
the total number and percentage of students at each achievement level (based on the
number in the tested column) and
the the mean scaled score (mean raw score for Grade 11 writing)
The data reported, report format, and guidelines for using the reported data are identical for
both the school and district reports. The only difference between the reports is that the NECAP
District Summary Report includes no individual school data. Separate school report and district
reports were produced for each grade level tested.
9.7 Decision Rules
To ensure that reported results for the 2007–08 NECAP are accurate relative to collected data
and other pertinent information, a document that delineates analysis and reporting rules was created.
These decision rules were observed in the analyses of NECAP test data and in reporting the test
results. Moreover, these rules are the main reference for quality assurance checks.
The decision rules document used for reporting results of the October 2007 administration of
the NECAP is founded in Appendix N.
The first set of rules pertains to general issues in reporting scores. Each issue is described,
and pertinent variables are identified. The actual rules applied are described by the way they impact
analyses and aggregations and their specific impact on each of the reports. The general rules are
further grouped into issues pertaining to test items, school type, student exclusions, and number of
students for aggregations.
The second set of rules pertains to reporting student participation. These rules describe which
students were counted and reported for each subgroup in the student participation report.
Chapter 9 Score Reporting 108 2007-08 NECAP Technical Report
9.8 Quality Assurance
Quality assurance measures are embedded throughout the entire process of analysis and
reporting. The data processor, data analyst, and psychometrician assigned to work on the NECAP
implement quality control checks of their respective computer programs and intermediate products.
Moreover, when data are handed off to different functions within the Research and Analysis
division, the sending function verifies that the data are accurate before handoff. Additionally, when a
function receives a data set, the first step is to verify the data for accuracy.
Another type of quality assurance measure is parallel processing. Students’ scaled scores for
each content area are assigned by a psychometrician through a process of equating and scaling. The
scaled scores are also computed by a data analyst to verify that scaled scores and corresponding
achievement levels are assigned accurately. Respective scaled scores and achievement levels
assigned are compared across all students for 100% agreement. Different exclusions assigned to
students that determine whether each student receives scaled scores and/or is included in different
levels of aggregation are also parallel-processed. Using the decision rules document, two data
analysts independently write a computer program that assigns students’ exclusions. For each subject
and grade combination, the exclusions assigned by each data analyst are compared across all
students. Only when 100% agreement is achieved can the rest of data analysis be completed.
The third aspect of quality control involves the procedures implemented by the quality
assurance group to check the veracity and accuracy of reported data. Using a sample of schools and
districts, the quality assurance group verifies that reported information is correct. The step is
conducted in two parts: (1) verify that the computed information was obtained correctly
through appropriate application of different decision rules and (2) verify that the correct data points
populate each cell in the NECAP reports. The selection of sample schools and districts for this
purpose is very specific and can affect the success of the quality control efforts. There are two sets of
samples selected that may not be mutually exclusive.

Chapter 9 Score Reporting 109 2007-08 NECAP Technical Report
The first set includes those that satisfy the following criteria:
One-school district
Two-school district
Multi-school district
The second set of samples includes districts or schools that have unique reporting situations
as indicated by decision rules. This set is necessary to check that each rule is applied correctly. The
second set includes the following criteria:
Private school
Small school that receives no school report
Small district that receives no district report
District that receives a report but all schools are too small to receive a school report
School with excluded (not tested) students
School with home-schooled students
The quality assurance group uses a checklist to implement its procedures. After the checklist
is completed, sample reports are circulated for psychometric checks and program management
review. The appropriate sample reports are then presented to the client for review and sign-off.


References 111 2007-08 NECAP Technical Report
SECTION IV -- REFERENCES American Educational Research Association, American Psychological Association, & National
Council on Measurement in Education (1999). Standards for Educational and Psychological
Testing. Washington, DC: American Educational Research Association.
Brown, F. G. (1983). Principles of educational and psychological testing (3rd ed.). Fort Worth:
Holt, Rinehart and Winston.
Campbell, D. T., & Fiske, D. W. (1959). Convergent and discriminant validation by the
multitrait-multimethod matrix. Psychological Bulletin, 56, 81–105.
Cohen, J. (1960). A coefficient of agreement for nominal scales. Educational and Psychological
Measurement, 20, 37–46.
Cronbach, L. J. (1951). Coefficient alpha and the internal structure of tests. Psychometrika, 16,
297–334.
Dorans, N. J., & Holland, P. W. (1993). DIF detection and description. In P. W. Holland & H.
Wainer (Eds.), Differential item functioning (pp. 35–66). Hillsdale, NJ: Lawrence Erlbaum
Associates.
Dorans, N. J., & Kulick, E. (1986). Demonstrating the utility of the standardization approach to
assessing unexpected differential item performance on the Scholastic Aptitude Test. Journal
of Educational Measurement, 23, 355–368.
Draper, N. R., & Smith, H. (1998). Applied Regression Analysis (3rd ed.). New York: John
Wiley & Sons, Inc.
Feldt, L. S., & Brennan, R. L. (1989). Reliability. In R. L. Linn (Ed.), Educational measurement
(3rd ed.) (pp. 105–146). New York: Macmillan Publishing Co.
Hambleton, R. K., & Swaminathan, H. (1985). Item response theory: Principles and
applications. Boston, MA: Kluwer Academic Publishers.
Hambleton, R. K., Swaminathan, H., & Rogers, H. J. (1991). Fundamentals of item response
theory. Newbury Park, CA: Sage Publications.
Hambleton, R. K., & van der Linden, W. J. (1997). Handbook of modern item response theory.
New York: Springer-Verlag.
Joint Committee on Testing Practices (1988). Code of Fair Testing Practices in Education.
Washington, D.C.: National Council on Measurement in Education.
Livingston, S. A., & Lewis, C. (1995). Estimating the consistency and accuracy of
classifications based on test scores. Journal of Educational Measurement, 32, 179–197.
Lord, F. M., & Novick, M. R. (1968). Statistical theories of mental test scores. Reading, MA:
Addison-Wesley.
Muraki, E. & R. D. Bock (2003). PARSCALE 4.1. Lincolnwood, IL: Scientific Software International.
Subkoviak, M.J. (1976). Estimating reliability from a single administration of a mastery test.

References 112 2007-08 NECAP Technical Report
Journal of Educational Measurement, 13, 265-276.
Stout, W. F. (1987). A nonparametric approach for assessing latent trait dimensionality.
Psychometrika, 52, 589-617.
Stout, W. F., Froelich, A. G., & Gao, F. (2001). Using resampling methods to produce
an improved DIMTEST procedure. In A. Boomsma, M. A. J. van Duign, & T. A. B. Snijders
(Eds.), Essays on Item Response Theory, (pp. 357-375). New York: Springer-Verlag.
Zhang, J., & Stout, W. F. (1999). The theoretical DETECT index of dimensionality and its
application to approximate simple structure. Psychometrika, 64, 213-249.

Appendices 113 2007-08 NECAP Technical Report
SECTION V—APPENDICES


Appendix A Committee Membership 2007-08 NECAP Technical Report 1
APPENDIX A—COMMITTEE MEMBERSHIP

Appendix A Committee Membership 2007-08 NECAP Technical Report 2
Technical Advisory Committee New Hampshire Name Association/Affiliation Richard Hill Center for Assessment, Board of Trustees Chair Scott Marion Center for Assessment, Associate Director Charles Pugh Moultonborough District Assessment Coordinator Rachel Quenemoen University of Minnesota Stanley Rabinowitz WestEd, Assessment & Standards Development Services Director Christine Rath Concord, Superintendent Steve Sireci University of Massachusetts Professor Carina Wong Consultant
Rhode Island Name Association/Affiliation Sylvia Blanda Westerly School Department Bill Erpenbach WJE Consulting, Ltd. Richard Hill Center for Assessment, Board of Trustees Chair Jon Mickelson Providence School Department Joe Ryan Consultant Lauress Wise HumRRO, President
Vermont Name Association/Affiliation Dale Carlson NAEP Coach, NAEO-Westat Lizanne DeStefano Bureau of Educational Research Jonathan Dings Boulder, Co. School District Brian Gong Center for Assessment, Executive Director Bill Mathis Rutland Northeast Supervisory Union, Superintendent of Schools Bob McNamara Washington West Supervisory Union, Superintendent of Schools Bob Stanton Lamoille South Supervisory Union, Assistant Superintendent of Schools Phoebe Winter Consultant

Appendix A Committee Membership 2007-08 NECAP Technical Report 3
New Hampshire Item Review Committee March 26, 27, & 28, 2007
First Name Last Name School/Association Affiliation Position
Richard Alan Manadnock Regional High School English Language Arts Teacher
Linda Becker Oyster River Middle School English Language Arts and Special Education Teacher
Gina Bell Hillside Middle School Mathematics Teacher
Gail Bourn Elm Street School Reading/Writing Teacher
Meredith Campbell Nashua High School North Geometry Teacher
Emily Cicconi Kearsarge Regional School District Mathematics Special Education Teacher
Alison Cook Conway Elementary School English Language Arts Teacher
Denise Copley Dover Middle School Reading Specialist and Teacher
Deborah Doscher Pittsfield High School Mathematics Teacher
Lisa Dwyer Merrimack Valley Middle School Reading Teacher
Sarah Eaton Fall Mountain Regional School District Mathematics Teacher
Linda Ferland Vilas Middle School Mathematics Teacher
Judy Filkins Lebanon District District Mathematics Coordinator
Jack Finley Franklin High School English Language Arts Teacher
Megan Fowler Chesterfield School Mathematics Teacher
Kelly Gagnon Gorham High School Mathematics Teacher and Department Chair
Martha Hardiman Whitefield School English Language Arts Teacher
Pam Hopkins North Hampton School Mathematics Teacher
Ann King Hindsdale School District Mathematics Teacher
Don Lavalette Unity School English Language Arts Teacher
Leah Macleod Runlet Middle School Secondary English and Adjunct Plymouth State University
Wendy Mahoney Barka Elementary English Language Arts Teacher and Reading Specialist
Nancy Monks Amherst Middle School Mathematics Teacher
Jeff Nielson Littleton High School Mathematics Teacher
John Potucek Southside Middle Mathematics Teacher
Stuart Robertson Pelham Elementary Principal
Chris Saunders Nashua High North English Language Arts Teacher
William Sawyer James Mastricola Upper Elementary School Mathematics Teacher
Jean Shankle Milford High School English Language Arts Teacher
Marilyn St. George Amherst Elementary School Reading Specialist
Kim Wheelock Groveton High School English Language Arts Teacher

Appendix A Committee Membership 2007-08 NECAP Technical Report 4
Rhode Island Item Review Committee March 26, 27, & 28, 2007
First Name Last Name School/Association Affiliation Position
Kara Alling Woonsocket Middle School English Language Arts Teacher
Brenda Asplund Aldrich Jr. High School English Language Arts Teacher
Dawn August Barrington Middle School Reading Teacher
Ruth Lynn Butler Forest Avenue School Reading Coach
Sally Caruso Kickemuitt Middle School Reaching Coach
Christina Cipolla William Davies Career and Technical High School Reading Specialist
Jennifer Cloud South Kingstown High School Mathematics Teacher
Ginny Curtis Ranger School Classroom Teacher
Catherine Dumsar Coventry High School Mathematics Teacher
Barbara Fox North Providence MS Mathematics Teacher
Laurie Fuge Charlotte Woods Elementary Mathematics Coach
Collette Gagnon Burrillville Middle Mathematics Teacher
Meridee Goodwin Gallagher Middle School Mathematics Teacher
Rosemary Hayes Providence School Department Mathematics Coach
Melissa Kerins J.H. Gaudet Middle School Title I Teacher, Mathematics Coach
Karen Luth West Glocester Elementary School Mathematics Coach
Robert Marley Barrington High School Mathematics Teacher
Cheryl Anne McElroy Alan Shawn Feinstein School at Broad Street Classroom Teacher
Jeff Miner Toll Gate High School Department Chair
Laurie Mokaba Fogary Memorial School Mathematics Coach
Christine Murphy Johnston Public Schools Mathematics Special Education Teacher
Donna Pennacchia Scituate High School Mathematics Classroom Teacher
Tricia Pora Leo A. Savoie Elementary School Classroom Teacher
Kathleen Pora Harris School Reading Specialist
Morgan Schatz (Nunn) Woonsocket High School English Language Arts Teacher
Kevin Seekell Knotty Oak Middle School Mathematics Teacher
Donna Sorensen Westerly Middle School English Language Arts Teacher
Diana Tucker Ponagansett Middle School Mathematics Teacher
Catherine Wallace Flat River Middle English Language Arts Teacher

Appendix A Committee Membership 2007-08 NECAP Technical Report 5
Vermont Item Review Committee March 26, 27, & 28, 2007
First Name Last Name School/Association Affiliation Position
Carol Amos Twinfield Union Teacher and Mathematics Coordinator
Judith Augsberg Otter Valley HS Literacy Teacher
Julie Bacon Deerfield Valley Teacher and Mathematics Leader
Renee Berthiaume North Country High School Literacy Teacher
Jay Burnell Mt. Anthony Middle School Literacy Teacher
Laurie Camelio Mt. Anthony Union High School Mathematics Chair
Marion Dewey Flood Brook School Teacher
Nancy Disenhaus Union 32 Literacy Teacher
Maggie Eaton Union 32 Literacy Leader
Kristy Ellis Orleans Essex North Supervisory Union Literacy Coach
Sandy Friezell North Country High School Literacy Teacher
Katherine Gallagher Fair Haven Union HS Mathematics Teacher
Courtney Giknis Rutland City Middle School English Language Arts Teacher
Margo Grace Vergennes Elementary Teacher
Karen Heath Barre Supervisory Union Literacy Coordinator
Beth Hulburt Barre Supervisory Union Mathematics Coordinator
Rita Lapier Browns River MS Mathematics Teacher
Julie Longchamp Williston Central School Mathematics Teacher
Deb March Newport Town School Teacher
Suzanne McDevitt Browns River Middle School Mathematics Teacher
Carol McNair Camels Hump Middle School Mathematics Teacher
Travis Redman Rutland Town Elementary Mathematics Teacher
Laura Sommariva Colchester HS Mathematics Teacher
Barbara Spaulding Hinesburg Elementary Teacher
Penny Sterns Burlington Schools Mathematics Coordinator
Cherrie Torrey Dothan Brook Elementary Reading Teacher
Eric Weiss Lamoille Union MS Mathematics Teacher
Loretta Whitehead Lynton Town School Mathematics Teacher
Tara Whitney Colchester MS Mathematics Teacher
John Willard Colchester HS Mathematics Department Chair
Marilyn Woodard Mount Anthony High School Literature Department Chair

Appendix A Committee Membership 2007-08 NECAP Technical Report 6
Bias and Sensitivity Committee March 26 & 27, 2007
New Hampshire First Name Last Name School/Association Affiliation Position
Eileen Banfield Merrimack High School English Department Head
Diane Bush Jaffrey-Rindge Middle School School Counselor
Clint Cogswell Concord Elementary Principal
Sherry Corbett Merrimack High School Special Education Director
Karen Dow Southwick School Reading Specialist
Amanda Eason Alton Central School English Teacher
Rhode Island First Name Last Name School/Association Affiliation Position
Adam Flynn Davies Career and Technical School Classroom Teacher
Kim Hicks Kickemuitt Middle School Mathematics Coach
Devida Irving Pawtucket School District ESL Director
Karen Lepore George C. Calef School Classroom Teacher
Mary Surber Portsmouth Middle Special Education Teacher
Vermont First Name Last Name School/Association Affiliation Position
Jenn Bostwick Williston Central Teacher for the Deaf
Maria Lamson Chelsea School Librarian
Lynn Murphy Waits River Valley School Science Teacher
Joyce Roof Woodstock Union MS Literacy Teacher Leader
Robin Roy Vergennes HS Speech-Language Pathologist

Appendix A Committee Membership 2007-08 NECAP Technical Report 7
Bias and Sensitivity Committee August 2007
New Hampshire First Name Last Name School/Association Affiliation Position
Karen Dow Southwick School Reading Specialist
Christine Leach Nashua District Counselor
Alexander Markowsky Franklin Hill District School Psychologist
Ashley Meehan James Mastrocola Upper Elementary School Teacher
Keith Pfeiffer Sanborn Regional District Superintendent
Mary Sohm Londonderry High School Special Education
Lisa Witte Pembroke Academy Assistant Principal
Rhode Island First Name Last Name School/Association Affiliation Position
Christina Cipolla William Davies Career and Technical High School Reading Specialist
Paula Dillon East Greenwich High School Special Education Teacher
MariceAnn Piquette Thompson Middle School English Language Literacy Teacher
Bob Wall Southern Rhode Island Collaborative Director of Special Education
Vermont First Name Last Name School/Association Affiliation Position
Diane Baker Lothrop School Reading Specialist
Colleen Fiore Long Trail School Director of Special Services
Sharon Hunt Gilman Middles School Special Education Teacher
Maria Lamson Chelsea Librarian
Dan Rosenthal Mt. Anthony HS Teacher
Kelly Wedding Bellows Falls High School Head of Science Department

Appendix A Committee Membership 2007-08 NECAP Technical Report 8
Bias and Sensitivity Committee November 7 & 8, 2007
New Hampshire First Name Last Name School/Association Affiliation Position
Suzanne Bergman Winnisquam Regional Middle School Enrichment Coordinator
Diane Bush Jaffrey-Rindge Middle School School Counselor
Enchi Chen Farmington School District English Language Literacy Teacher
Ashley Meehan James Mastrocola Upper Elementary School Teacher
Mary Sohm Londonderry High School Special Education Teacher
Lisa Witte Pembroke Academy Assistant Principal
Rhode Island First Name Last Name School/Association Affiliation Position
Christina Cipolla William Davies Career and Technical High School Reading Specialist
Paula Dillon East Greenwich High School Special Education Teacher
Scott Gray Woonsocket Middle School Special Education Teacher
Karen Lepore Johnston School District Elementary Coach
MariceAnn Piquette Thompson Middle School English Language Literacy Teacher
Kathleen Pora Harris School Reading Specialist
Vermont First Name Last Name School/Association Affiliation Position
Maria Lamson Chelsea Librarian
Todd Mackenzie U32 Teacher
Lynn Murphy Waits River Valley USD #36 Science Teacher
Robin Roy Vergennes HS Speech-Language Pathologist

Appendix B Standard Test Accommodations 1 2007-08 NECAP Technical Report
APPENDIX B—TABLE OF STANDARD TEST
ACCOMMODATIONS

Appendix B Standard Test Accommodations 2 2007-08 NECAP Technical Report
Table of Standard Test Accommodations Any accommodation(s) utilized for the assessment of individual students shall be the result of a formal or informal team decision made at the local level. Accommodations are available to all students on the basis of individual need, regardless of disability status. A. Alternative Settings A-1 Administer the test individually in a separate
location A-2 Administer the test to a small group in a
separate location A-3 Administer the test in locations with minimal
distractions (e.g., study carrel or different room from rest of class)
A-4 Preferential seating (e.g., front of room) A-5 Provide special acoustics A-6 Provide special lighting or furniture A-7 Administer the test with special education
personnel A-8 Administer the test with other school personnel
known to the student A-9 Administer the test with school personnel at a
non-school setting B. Scheduling and Timing B-1 Administer the test at the time of day that takes
into account the student’s medical needs or learning style
B-2 Allow short supervised breaks during testing B-3 Allow extended time, beyond what is
recommended, until in the administrator’s judgment the student can no longer sustain the activity
C. Presentation Formats C-1 Braille C-2 Large-print version C-3 Sign directions to student C-4 Read test aloud to student (Mathematics and
Session 1 Writing only) 1
C-5 Student reads test aloud to self C-6 Translate directions into other language C-7 Underline key information in directions C-8 Visual magnification devices C-9 Reduction of visual print by blocking or other
techniques C-10 Acetate shield C-11 Auditory amplification device or noise buffers C-12 Word-to-word translation dictionary, non-
electronic with no definitions (For ELL students in Mathematics and Writing only)
C-13 Abacus use for student with sever visual impairment or blindness (Mathematics – Any Session)
D. Response Formats D-1 Student writes using word processor, typewriter,
computer 2
(School personnel transcribes student responses exactly as written, into the Student Answer Booklet.)
D-2 Student hand writes responses on separate paper. (School personnel transcribes student responses exactly as written, into the Student Answer Booklet.)
D-3 Student writes using Brailler (School personnel transcribes student responses exactly as written, into the Student Answer Booklet.)
D-4 Student indicates response to multiple-choice items. (School personnel records student responses into the Student Answer Booklet.)
D-5 Student dictates constructed responses (Reading and Mathematics only) to school personnel. (School personnel transcribes student responses exactly as written, into the Student Answer Booklet.)
D-6 Student dictates constructed responses (Reading and Mathematics only) using assistive technology. (School personnel transcribes student responses exactly as written, into the Student Answer Booklet.)
If an accommodation that is not listed above is needed for a student, please contact the state personnel for accommodations to discuss it. E. Other Accommodations
3
E-1 Accommodations team requested other accommodation not on list and DOE approved as comparable
E-2 Scribing the Writing Test (only for students requiring special consideration)
F. Modifications
4
F-1 Using a calculator and/or manipulatives on Session 1 of the Mathematics Test
F-2 Reading the Reading Test F-3 Other
1. Reading the reading test to the student invalidates all reading sessions.
2. Spell and grammar checks must be turned off. This accommodation is intended for unique individual needs, not an entire class 3. Test coordinators must obtain approval for the accommodation from the Department of Education prior to test administration. 4. All affected sessions using these modifications are counted as incorrect.

Appendix C Appropriateness of Accommodations 1 2007-08 NECAP Technical Report
APPENDIX C—APPROPRIATENESS OF THE
ACCOMMODATIONS ALLOWED IN NECAP
GENERAL ASSESSMENT AND THEIR IMPACT ON
STUDENT RESULTS

Appendix C Appropriateness of Accommodations 2 2007-08 NECAP Technical Report
Appropriateness of the Accommodations Allowed in NECAP General Assessment and Their Impact on Student Results
1) Overview & Purpose:
To meet Federal peer review requirements for approval of state assessment systems, in the spring of 2006 New Hampshire, Rhode Island and Vermont submitted extensive documentation to the United States Department of Education on the design, implementation and technical adequacy of the New England Common Assessment Program (NECAP), a state level achievement testing program developed through a collaborative effort of the three states. In response to peer review finding, the states were required to submit additional documentation for a second round of peer review, including information on the use, appropriateness, and impact of NECAP accommodations. This report was prepared in response to the questions posed by the peer reviewers, and has been included in the 2007 NECAP Technical Report for other groups or individuals who may be interested in NECAP accommodation policies and procedures, and how well they have been working.
2) Report on the Appropriateness and Comparability of Accommodations allowed
in statewide NECAP General Assessment A. Who may use accommodations in NECAP assessment? NECAP test accommodations are available to all students, regardless of whether or not a disability has been identified. Accommodations allowed are not group specific. For example, students in Title I reading programs, though not formally identified as “disabled” may still need extra time on assessments. Students with limited English proficiency sometimes break their arms and need to dictate multiple choice responses. Other students may need low vision accommodations even though they are not considered to be “blind”. Before they are members of any subgroup, each student is first an individual with unique learning needs. NECAP assessment accommodations policy treats students in this way. The decision to allow all students to use accommodations, as needed, is consistent with prior research on best practice in the provision of accommodations (c.f., Elbaum, Aguelles, Campbell, & Saleh, 2004):
“…the challenge of assigning the most effective and appropriate testing accommodations for students with disabilities, like that of designing the most
The New England Common Assessment Program New Hampshire + Rhode Island + Vermont

Appendix C Appropriateness of Accommodations 3 2007-08 NECAP Technical Report
effective and appropriate instructional programs for these students, is unlikely to be successfully addressed by disability. Instead, much more attention will need to be paid to individual student’s characteristics and responses to accommodations in relation to particular types of testing and testing situations.” (pp. 71-87)
The NECAP management team believes strongly that a fair and valid path of access to a universally designed test should not require that a student carry a label of disability. Rather, much like differentiated instruction, accommodated conditions of test participation that preserve the essential construct of the standard being assessed should be supported for any student who has been shown to need these differentiated test conditions. This philosophy is consistent with the NECAP team’s commitment to building a universally accessible test that provides an accurate measure of what each student knows in reading and mathematics content.
The following critical variables drive the process of providing NECAP accommodations:
1. The decision to use an accommodation for an individual student must be made
using a valid and carefully structured team process consistent with daily instructional practice, and
2. The accommodated test condition must preserve the essential construct being assessed, resulting in a criterion-referenced measure of competency considered to be comparable to that produced under standard test conditions.
B. Are NECAP Accommodations Consistent with Accepted Best Practice?
NECAP provides a Table of Standard Test Accommodations that was assembled from the experience and long assessment histories of the three partner states. The NECAP Table of Standard Accommodations was created by establishing a three state cross-disciplinary consensus reached with key expert groups: special educators, ELL specialists, and reading, writing and mathematics content specialists from each of the partner states. In addition, the work of various stakeholder and research groups with special instructional expertise was also considered. These sources included: • Meetings with state advocacy groups for students with severe visual impairment
or blindness, • Meetings with state advocacy groups for students who with deafness or hearing
impairment, and consultations with other research-based groups like: • The American Printing House for the Blind, Accessible Tests Division, • The National Center on Educational Outcomes (NCEO), and • The New England Compact Group, who conducted federally-funded enhanced
assessment research on accommodations, in partnership with Boston College (inTASC group) and the Center for Applied Special Technologies (CAST).

Appendix C Appropriateness of Accommodations 4 2007-08 NECAP Technical Report
The NECAP cross-disciplinary team, consulting with these other specialists, chose accommodations that were commonly accepted as standard, well established on a national basis, and that were consistent with assessment practice across all the NECAP states. Each identified standard accommodation was chosen to support best educational practice as it is currently understood.
Examples of the impact on accommodations design resulting from consultation with the American Printing House for the Blind experts in accessible test development included the addition to our standard accommodations of the use of an abacus in place of scrap paper for students with severe visual impairment. Recent research from the American Printing House for the Blind also indicated that 20 pt. font was producing better outcomes for students using large print accommodations (Personal communication, October, 2004). Based on this input, the NECAP team decided to provide a minimum of 20 pt. instead of 18 point font for large print editions of the NECAP assessment. This, in turn, led to improved production and type setting for large print NECAP tests. Consultation with advocacy groups for the deaf and hard of hearing led to improved item design, in particular helping item developers avoid the unnecessary use of rhyming words and homophones, supporting a decreased need for sign language accommodations with this group. Impact of WIDA Partnership on development of Accommodations for LEP students. An important relationship exists between NECAP assessment and the NECAP partner states’ active membership in WIDA/ACCESS for ELL’s Assessment Consortium. New understandings in the area of accommodations policy and practice are beginning to emerge. For example, we have learned that word-to-word dictionary accommodations are most effective when used by LEP students at an intermediate level of proficiency and are not advised for beginning LEP students. The NECAP Accommodations Manual reflects this. Community learning opportunities created through the WIDA partnership have set a strong and supportive context for long term benefit and mutual growth potential. A wise investment has been made by the NECAP group in this effort.
During the last 2 years, assessment leaders from all three NECAP states, as active partners in the WIDA consortium developing the new ACCESS for ELLs Test of English Language Proficiency, have collaborated in a cross-disciplinary team process to establish accommodations policy for this English language proficiency assessment. The ACCESS for ELLs accommodations team was composed of ESOL teachers, special educators, measurement specialists, and SEA assessment leaders. All three NECAP states took an active role and learned much from this process. This joint development effort opened dialog across ELL and special education accommodation groups and continues to support the ongoing review and improvement of both ACCESS and NECAP accommodations. The states are learning from each other, and with each new development cycle, are improving the accommodations system. The community of professional practice in this area is growing. Best practice understandings are expanding with our increasing experience and communication about the needs of LEP student groups. Specifically, we are learning about the

Appendix C Appropriateness of Accommodations 5 2007-08 NECAP Technical Report
importance of academic language to English Language Learners who are attempting to take the state-level general content assessments. Accommodations specific to this academic language support issue are being explored and considered. We are finding that vocabulary lists, practice tests, computer-based read-alouds and other supports and accommodations are eliciting positive responses from our LEP students who take the state content assessments. This will be addressed in more detail in a later section.
C. How are NECAP Accommodations Structured?
Standard Accommodations: NECAP sorts standard accommodations into 4 categories (labeled A-D), which include: A) Alternative Settings, B) Scheduling and Timing, C) Presentation Formats, and D) Response Formats. School teams may choose any combination of standard (A-D) accommodations to use with any student so long as proper accommodation selection and usage procedure is followed and properly documented (see following subsection). Students who use standard accommodations on NECAP tests receive full performance credit as earned for the test items taken under these standard conditions. NECAP standard accommodations are treated as fully comparable to test conditions where no accommodation is used.
In addition, NECAP lists 2 additional categories of altered test conditions which require formal state level review and approval on a student by student basis. These special test conditions are: E) Other Accommodations and F) Modifications. (See: NECAP Accommodations, Guidelines and Procedures Training Manual, (2005), p 5, Available on state websites listed following references.)
Non-Standard Test Conditions – Review, Monitoring and Documentation of Preservation of the Intended Construct: “Other (E type) Accommodations” are accommodations without long or wide history of use that are not listed under the standard (A-D) categories. If schools wish to use accommodations that are not listed in A-D as standard, then they must send a formal written Request for Use of Other Accommodations to the State Department for review and approval for usage with an individual student. This request documents the team decision and describes fully the procedure to be used. Upon receipt by the SEA, these requests are thoroughly reviewed by state assessment content specialists together with special educators to determine if the accommodation proposed will allow performance of the essential constructs intended by the impacted test items. If the requested “other” accommodation is found to allow performance that will not alter the intended construct or criterion referenced standard to be assessed, then the school is issued a written receipt giving permission for use of this other accommodation as a standard accommodation for one test cycle. Schools are instructed on how to document the use of this approved “E) Other Accommodation” and the SEA monitors the process, ensuring that both school test booklets and state records accurately reflect the final test data. All “E) Other Accommodations” are approved in this way by the Department and, if approved, are treated as standard accommodations. Item responses completed under approved “E) Other” test conditions receive full credit as earned by the student.

Appendix C Appropriateness of Accommodations 6 2007-08 NECAP Technical Report
If a requested “other” accommodation is found by the state review team to NOT preserve the intended construct, then the review team sends the school a receipt and notice that the requested change in test condition will be considered to be a test modification “F) Modification”. All items completed under these test conditions will NOT receive performance credit. An example of a non-credited “F) Modification” would be any test condition where reading test passages, items, or response options are read to a student. State reading content specialists have determined that this change in a reading test condition does, in fact, alter the decoding construct being tested in all reading items. Therefore, reading items completed under this test condition would not be credited. Use and approval of “E) Other Accommodations” are carefully monitored by the state. If any school claims use of an “E) Other Accommodation” that has not received prior state review and documented approval, then the test data documentation is similarly flagged to reflect that an F) Modification was instead provided. This flagged situation is treated as a non-credited test modification and the items impacted are invalidated. Further, any sections of the test completed under “F) Modification” conditions are later documented in student reports as not credited due to the non-standard and non-comparable test administration conditions used.
D. How does the NECAP Structure Guide Appropriate Use of Accommodations by Schools? In 2005, New Hampshire, Rhode Island, and Vermont collaborated on the NECAP Accommodations Guidelines and Procedures Training Manual. The guide was disseminated through a series of regional test coordinator’s workshops, as well as additional professional development opportunities provided by the individual states, and was also posted on each states website. This tool was designed to provide schools with a structured and valid process for decision making regarding the selection and use of accommodations for students on statewide assessment. Prior studies have outlined assessment guidelines that maximize the participation of students with disabilities in large-scale assessment. The National Center on Educational Outcomes (NCEO), in Synthesis Report 25 (1996), presented a set of criteria that states should meet in providing guidelines to schools for using accommodations (pp. 13-14, and 25). The NCEO recommendations figured prominently in preparation of the NECAP accommodations guide.
The NECAP Accommodations Guidelines and Procedures Training Manual (2005) meets all seven of the criteria established by NCEO as follows:
1. The decision about accommodations is made by a team of educators who
know the student’s instructional needs. NECAP goes beyond this recommendation and requires that the student’s parent or guardian also be part of this decision team, (NECAP Accommodations Manual, pp. 2-3, and 20-22).

Appendix C Appropriateness of Accommodations 7 2007-08 NECAP Technical Report
2. The decision about accommodations is based on the student’s current level of functioning and learning characteristics. (Manual, pp20-22).
3. A form is used that lists the variables to consider in making the accommodations decisions, and that documents for each student the decision and reasons for it. (Manual, pp. 20-22).
4. Accommodation guidelines require alignment of instructional accommodations and assessment accommodations. (Manual, pp2 and 20-22).
5. Decisions about accommodations are not based on program setting, category of disability, percent time in the mainstream classroom (Manual, p.15, p.20-22).
6. Decisions about accommodations are documented on the student’s IEP or on an additional form that is attached to the IEP. (Manual, pp.2, 15, and 20-22).
7. Parents are informed about accommodation options and about the implications for their child (1) not being allowed to use the needed accommodations, or (2) being excluded from the accountability system when certain accommodations are used, (Manual pp 3 and 20-22).
As described above, NECAP states use a highly structured process for the review, approval, and monitoring of requests by schools for the use of other (non-standard) accommodations for individual students. As described in section B, above, the NECAP Accommodations Manual provides a Table of Standard Accommodations each year. The manual provides two structured decision making worksheets (pp. 20-22) to guide the decision process of educational teams. One worksheet guides the selection of standard accommodations; the second provides guidance on the selection of other accommodations. The manual contains information on the entire decision making process. In addition, the manual provides detailed descriptions and research-based information on many specific accommodations. Ongoing Teacher Training and Support: Throughout each academic year, several teacher workshops on planning and implementing accommodations are offered at multiple locations regionally in each of the three states to teams of educators. In the spring of 2005, prior to the launch of the first NECAP assessment, a series of introductory statewide 2-hour workshops in accommodations administration was offered in multiple locations. Each year thereafter, in late summer prior to the administration of the NECAP tests, a series of accommodations usage updates is offered as part of the NECAP Test Administration Workshop series; five regional workshops are offered in each state. Additionally, each state’s Department of Education has consultants who are available to provide individualized support and problem solving, as well as small and large group in-service for schools. Finally, the DOE assessment consultants work directly with a variety of statewide groups and organizations to promote the use of effective accommodations, and to gather feedback on the efficacy of the NECAP accommodation policies and procedures. These include University-based Disability Centers, statewide parent advocacy organizations, organizations representing individuals with vision and hearing disabilities. Finally,

Appendix C Appropriateness of Accommodations 8 2007-08 NECAP Technical Report
each state has systems in place to provide schools with individualized support and consultation: New Hampshire employs two distinguished special field educators who, by appointment and free of charge, provide onsite training and support in alternate assessment and accommodations strategies. Rhode Island has an IEP Network that provides on-site consultation with schools on a variety of special services topics including planning and implementing assessment accommodations. Vermont has a cadre of district-level alternate assessment mentors who provide a point of contact for disseminating information, and who are also available in schools and school districts for intensive consultation related to the assessment needs of individual students.
Monitoring of the Use of Accommodations in the Field: Each year during the NECAP test window, the DOE content specialists schedule a limited number of on-site visitations to observe test administration as it is occurring in the schools. State capacity to provide such direct monitoring during the test window is limited, but such monitoring is conducted during each test window and observers report observations directly to the state assessment team. Additional on-site accommodations monitoring is provided by district special education directors and the NECAP test coordinators. Both of these groups also receive training each year. Throughout each school year, program review teams from the DOEs’ special education divisions conduct on-site focused monitoring of all special education programs. These comprehensive visits include on-site monitoring of the use of accommodations for students who have Individualized Educational Programs (IEPs).
E. Are NECAP Accommodations Consistent with Recent Research Findings?
The NECAP development team has attempted to learn from the research on accommodations, but this has not been a simple matter. In 2002, Thompson, Johnstone, and Thurlow concluded in their report on universal design in large scale assessments that research validating the use of standard and non-standard accommodations has yet to provide conclusive evidence about the influence of many accommodations on test scores. In 2006, Johnstone, Altman, Thurlow, & Thompson published an updated review of 49 research studies conducted between 2002 and 2004 on the use of accommodations and again found accommodations research to be inconclusive. They noted the similarity to past findings from NCEO summaries of research (Thompson, Blount & Thurlow, 2002). The authors of the 2006 review state:
“Although accommodations research has been part of educational research for
decades, it appears that it is still in its nascence. There is still much scientific disagreement on the effects, validity, and decision-making surrounding accommodations.” (p 12)
However, a frequently cited research review by Sireci, Li, & Scarpati, (2005) documented evidence of support for the accommodation of providing extended time. This accommodation is one of the most frequently used standard NECAP accommodations. Extended time accommodations appeared to hold up best under the

Appendix C Appropriateness of Accommodations 9 2007-08 NECAP Technical Report
interaction hypothesis for judging the validity of an accommodation. In a 2006 presentation addressing lessons learned from the research on assessment accommodations to date, Sireci and Pitoniak, (2006), concluded that, in general, “accommodations being used are sensible and defensible.” They replicated their prior finding that the extended time accommodation seems to be a valid accommodation and noted that many other accommodations have produced less convincing results. They noted that oral or read-aloud accommodation for math appears to be valid, but that a similar read-aloud accommodation for reading involves consideration of specific construct changes which threaten score comparability. These findings are also consistent with and support the NECAP accommodation policy of allowing the read-aloud accommodation for mathematics, but not allowing this accommodation for reading tests. Despite the inconclusive and conflicting current state of accommodations research, findings seem to be emerging that do, in fact, provide validation for some of the most frequently used NECAP accommodations: the extended time and mathematics read-aloud accommodations. Accommodations for English language learners. In a presentation on the validity and effectiveness of accommodations for English language learners with disabilities, Abedi (2006) reported that students who use an English or bilingual dictionary accommodation (word meanings allowed) may be advantaged over those without access to dictionaries and that this may jeopardize the validity of the assessment. Abedi argues persuasively that linguistic accommodations for English language learners should not be allowed to alter the construct being tested. He also argues that the language of assessment should be the same language as that used in instruction in the classroom – otherwise student performance is hindered. NECAP assessment policy is consistent with both of these findings: ELL students may use word-to-word translations as linguistic accommodation support, but may not use dictionaries with definitions provided. Abedi’s research supports this decision. Also NECAP assessment items are not translated into primary languages for ELL students. This, too, is consistent with classroom practice in the NECAP states and is supported by the current literature. At the same conference referenced just above, Frances (2006), presented findings from a meta-analysis in which he compared the results of eleven studies of the use of linguistic accommodations provided for ELL students in large scale assessments. In his presentation, given at the LEP Partnership Meeting in Washington, DC, he noted that no significant differences in student performance were observed for 7 of the 8 most commonly provided linguistic accommodations. Although Frances was not recommending its use, the only linguistic accommodation that showed any significant positive effect on the performance of ELL students was an accommodation allowing the use of an English dictionary or glossary during statewide assessment. This is the very same accommodation that Abedi (2006) recommends against using because it violates intended test constructs. As noted above, in NECAP assessment, the use of word-to-word translations is an allowed standard linguistic accommodation. However, the use of an English dictionary with glossary meanings is not an allowable standard accommodation. It is the position of the NECAP reading content team that

Appendix C Appropriateness of Accommodations 10 2007-08 NECAP Technical Report
allowing any student to use a dictionary with definitions or a glossary of meanings violates the vocabulary and comprehension constructs intended in the NECAP reading test and would invalidate test results. For this reason, NECAP does not allow this linguistic accommodation. As reported by Frances, analysis of the remaining 7 linguistic accommodations typically allowed for ELL students showed no significant positive effect on test performance. These included: bilingual dictionary use, dual language booklets, dual language questions and read-aloud in Spanish, extra time to test, simplified English, and offering a Spanish version of a test. Despite the lack of positive effects observed for these other linguistic accommodations to date, NECAP does provide a number of linguistic supports for ELL students. One of these linguistic supports includes: employing the universal design technique of simplifying the English in all test items. Review and editing of test items for language simplicity and clarity has been a formal part of the annual process of test item development and review since the inception of the NECAP. In addition to word-to-word translations, a number of other standard linguistic accommodations are allowed in NECAP testing to provide a path of access for ELL students to show what they know and can do in reading and mathematics. Standard linguistic accommodations permitted by NECAP include: allowing mathematics test items to be read aloud to the student, allowing students to read aloud to themselves (if bundled with an individual test setting), translation of test directions into primary language, underlining key information in written directions and dictation/ scribing of reading and math test responses. NECAP assessments provide linguistic access for students who are English language learners. As noted earlier, a number of studies have shown some positive effect of the use of the extended time and read-aloud accommodations for students in general. As ELL students continue to gain proficiency in English, they may also increasingly benefit from these accommodations. More research is needed to clarify how states can most appropriately support ELL students to show us what they know and can do. NECAP Supported Research Studies: Through the New England Compact Enhanced Assessment Project (2007), the NECAP states have completed a number of accommodations and universal design research studies. These studies have shed additional light on the appropriateness of existing standard accommodations and have helped to inform the development of new accommodations and improved universal design of assessment. Under the Enhanced Assessment Grant, in joint partnership with: the inTASC group of Boston College, the Center for Applied Special Technologies (CAST), the state of Maine, and the Educational Development Center, Inc., the NECAP states supported research studies on accommodations and universal design in four distinct areas. These studies, summarized below, are described more fully in the appendix to this report: ! Use of computer-based read-aloud tools. NECAP supported a study of 274
students in New Hampshire high schools. This study, Miranda, H., Russell, M., Seeley, K., Hoffman, T., (2004), provided evidence that computer–based read

Appendix C Appropriateness of Accommodations 11 2007-08 NECAP Technical Report
aloud accommodations led to improved content access and performance of students with disabilities when taking mathematics tests.
As direct result of this study, New Hampshire was able to build and pilot a new computer-based read aloud tool that is now under development for use with NECAP assessments for all three NECAP states. Following this New Hampshire pilot of the new computer-based read aloud tool on the state high school assessment, the New Hampshire Department of Education conducted a focus group study with participating students from Nashua North High School. The results of this focus group (May 17, 2006) are available from the New Hampshire Department of Education. One of the primary findings from this focus group was the strong impact of having experienced the read-aloud in practice test format prior to actual testing. Experience with this tool prior to testing appeared to be very important for student performance. High school students indicated a very strong preference for computer-based read aloud over the same accommodation provided by a person. Both groups of students, those with limited English proficiency and those with disabilities consistently reported that they were able to focus much more clearly on the math content (not just the words) than in prior math tests they had taken without this accommodation. Based on student report, use of this read-aloud seemed to improve content access for these students. The ability to benefit from the individual work of each of the three NECAP states is a major benefit of the tri-state partnership.
! Use of computers to improve student writing performance on tests. Another
research study conducted by Higgins, J., Russell, M., & Hoffmann, T., (2004), studied 1000 students from the three states to examine how the use of computers for writing tests affected student performance. The study found that minority girls tended to perform about the same whether using a computer or pencil-and-paper to provide written responses. However, all other groups, on average, tended to perform better when using a computer to produce written responses. A minimum degree of keyboarding skill correlated with improved performance. Lack of keyboarding skill produced results that did not significantly differ from pencil-and–paper responding and therefore, appeared to ‘do no harm’. As a result, NECAP states entered into talks to determine how a computer based response might be more fully supported in future versions of the assessment. The study suggested that a minimum number of words typed accurately per minute of 18-20 was the recommended threshold to obtain benefit from this accommodation. This finding has been incorporated into NECAP training and support activities. At the present time, NECAP allows use of a word processor to produce written test responses as a standard accommodation on all NECAP content tests. The research supports this practice.
! Use of Computers for Reading Tests. A third study conducted by Miranda, H.,
Russell, M., & Hoffmann, T., (2004), examined how the presentation of reading passages via computer screen impacted the test performance of 219 fourth grade students from eight schools in Vermont. This study found no significant

Appendix C Appropriateness of Accommodations 12 2007-08 NECAP Technical Report
differences in reading comprehension scores across the 3 (silent) presentation modes studied: 1. Standard presentation on paper, 2. On computer screen with use of a scrolling feature, and 3. On computer with passages divided into sections presented as whole pages without the scrolling feature. Results from this study were not conclusive, but some trend data suggested that the scrolling presentation feature may disadvantage many students, especially those with weaker computer skills. The majority of students indicated an overall preference for computer-based presentation over pencil-and-paper. As other research studies, previously cited, continue to show that read-aloud accommodations are generally effective, it can be expected that pressure to offer computer-based read-alouds involving text presentation will increase. Additional research in this area may help shed important light on the most effective ways to provide this useful accommodation. (See also: Higgins, J., Russell, M., & Hoffmann, T., (2004).)
! Use of Computer-Based Speak-Aloud Responses to Short Answer Items. The
states’ enhanced assessment grant also supported a study by Miranda, H., Russell, M., Seeley, K., Hoffman, T., (2004) that looked at the feasibility and effectiveness of using a computer to transcribe spoken responses into written text in response to short answer test items. This was considered as a possible linguistic accommodation for use with English language learners in reading and mathematics tests. Unfortunately, this study found that it is not yet feasible to use computers to record student’s verbal responses to short-answer items. A variety of technical problems occurred and students were not comfortable in speaking to the computer. The researchers concluded that, with existing technology limitations, use of this kind of computer based accommodation may not be feasible for some years.
F. What evidence has the state gathered on the impact and comparability of accommodations allowed on NECAP test scores?
Direct and Immediate Score Impact. First, as a matter of policy, there is a direct and immediate impact on NECAP test scores for students when standard accommodations (accepted and credited as comparable) vs. non-standard accommodations (not accepted and not credited as comparable) are used during test administration. The student performance score is significantly reduced for each subtest where test items and the constructs they were designed to measure have been modified by use of a non-standard accommodation. Sessions with modified items receive no credit in the student total score for that content area. If the entire reading test is read to a student, the student will earn 0 points in that content area. If only certain sessions of the reading test are read to the student, then only the score of those sessions will be impacted, but this will result in a lower overall reading content score.
Empirical bases for Comparability of NECAP Test Scores Obtained from Accommodated vs. Non-Accommodated Test Conditions: During the NECAP Pilot Test in 2004, differential item functioning (DIF) analyses were conducted on the use of accommodations by various student subgroups. In December 2006, the

Appendix C Appropriateness of Accommodations 13 2007-08 NECAP Technical Report
NECAP Technical Advisory Committee (TAC) reviewed the use of these DIF analyses and discussed long range planning for ongoing review of the use of accommodations in NECAP assessment. There was consensus among TAC members that the current use of DIF analyses for evaluation of accommodation use allows very limited inferences to be made therefore is of minimal practical value to the states. Other general methods of organizing and reviewing accommodations data and performance outcomes should be developed for states to employ. A NECAP TAC subgroup was formed to consider and respond to the following question: What should NECAP states be doing at this stage in our development to review use, appropriateness, design, etc, of the NECAP Accommodations and related policy & guidelines? What information and processes will help us learn, clarify & communicate how, why, and when to use what accommodations? The results of this December 2006 TAC accommodations workgroup are available on each of the three states’ websites. In summary, the TAC workgroup recommended 5 categories of activity for the NECAP states: 1. Given what states have learned from initial implementation and recent research, they should review, revise, describe and more fully document NECAP Accommodations Policies and Guidelines. This should be part of an ongoing review process. 2. Explore available research on questionable or controversial accommodations. Document this review and revise where indicated. 3. Transparency of reporting should be examined. There was group consensus that the use of accommodations during assessment should be fully disclosed, and thereby made transparent in the reporting process. NECAP states should work to sort out this aspect of reporting policy and determine where and how to report what aspects of accommodation usage to parents and to the public at large. 4. States need to further address monitoring of accommodation usage. Find ways to improve the quality of district/school choices in the selection and use of accommodations for students. Strategies that take limited state resource capacity into account must be considered. The issue is fundamentally one of putting improved quality control processes in place in the most efficient, cost effective ways. Several resources currently under development may assist the states in this effort. One of these resources in already being developed in the OSEP funded General Supervision Grant to one of the NECAP states. This grant will develop digitized video clips illustrating proper ways to provide certain accommodations, especially for students with severe disabilities. Creation of this video tool may enhance state capacity to provide and distribute effective training to districts and improved local monitoring of day to day use of accommodations for both instruction and assessment. 5. Available data needs to be mined and organized on the current use of accommodations in NECAP testing. Usage and outcomes for various subgroups

Appendix C Appropriateness of Accommodations 14 2007-08 NECAP Technical Report
should be examined. DIF analyses may not be as useful in this regard as other types of carefully planned descriptive comparisons. Some research concerns were also identified. How do states differentiate between an access issue for a student – where the student has skills they cannot show as opposed to a lack of opportunity to learn or lack of skill development? This issue appears repeatedly in a number of research studies reviewed. It is not a simple matter to differentiate between these situations. One indicates a need for an assessment design change. The other indicates a need for instructional change. Research to help sort this out should be supported.
Test Access Fairness as One Kind of Evidence for Comparability: NECAP states have made a commitment to work with stakeholders representing various groups of students who typically use accommodations or who may benefit from improved universal assessment design. The feedback received from these stakeholder groups is a valuable source of information and ideas for continued improvement of our assessment program.
NECAP consults regularly with experts in accessible test design at the American Printing House for the Blind in Lexington, KY (Allman (2004), and Personal Communications: (October 2004), (September 2006)). This group has informed NECAP management about the recent research in the use of larger print fonts and the abacus as standard accommodations for students with severe visual impairments. This consultation has directly impacted test development and has resulted in positive feedback from the stakeholders who represent students with visual impairment in our states. In addition, all three states work closely with stakeholders representing students with hearing impairment and deafness to help inform test item development and improved access to test items for students with vision or hearing impairments. An example of this commitment is contained in two focus group reports prepared by the New Hampshire Department of Education; a February 2006 focus group report from NH Teachers of the Visually Impaired (TVI) on NECAP Test Accessibility for Students with Severe Visual Impairment and a May 2006 report on the performance of English language learners and students with disabilities for the on the Grade 10 New Hampshire Educational Improvement & Assessment Program (NHEIAP). The latter of these two reports addressed computer-based read aloud accommodation for mathematics assessment. (Both Focus Group Reports are available from the New Hampshire Department of Education).
NECAP states are also pursuing other grant–funded research to support and explore development of new comparable accommodations that might provide meaningful access to general assessment at grade level for students who currently take only alternate assessments based on alternate achievement standards.

Appendix C Appropriateness of Accommodations 15 2007-08 NECAP Technical Report
G. Summary of the Evidence - Are NECAP Accommodations Appropriate and Do They Yield Reasonably Comparable Results?
• Yes, it is clear from the evidence cited in sections 2 A, B, C and D above, that NECAP accommodations are highly consistent with established best practice.
• For accommodations with a consistent research basis available, research evidence
suggests that continued use of the following accommodations in NECAP testing is valid:
• Extended time accommodation • Mathematics Read-Aloud Accommodation • Word-to-word translation for ELL students • Use of Computer-Based Read-Aloud Tools ( for mathematics) • Use of Computers to write extended test item responses (NECAP
accommodation -D1)
• Preliminary research evidence from The New England Compact Enhanced Assessment Project, presented above (2004), does not appear to support improved student performance with NECAP accommodation D6- Using assistive technology (specifically speech-to-text technology) to dictate open responses via computer. However, if consistently used in classroom settings for students with severe access limitations, sufficient familiarity may be gained to make this a viable accommodation for certain students. Further review of this accommodation by the NECAP management team is recommended.
• Early focus group results (NHDOE, May 17, 2006) and trial experience with
computer-based read aloud testing is very promising and merits further research. • NECAP Focus group responses (NHDOE, February 22, 2006) from Teachers of
the Visually Impaired support existing NECAP accommodations and are helping inform improvement in other aspects of universal design of items, test booklets and materials.
• Structured DIF analysis of the performance of NECAP accommodations is in an
early and inconclusive phase. Currently, development of other increasingly useful accommodations data analysis designs is going forward and is supported by all NECAP states. The NECAP Technical Advisory Committee (TAC) will continue to explore this line of inquiry in the future.
• As each yearly cycle of large scale NECAP DIF item analysis allows the group to
gain insight and to clarify questions, the design of future DIF data collection may be refined to more fully inform item selection to improve the fairness and accessibility of NECAP assessment items. This exploration is highly valued by the NECAP management group and will continue to be supported. Limitations in this kind of statistical analysis will continue to occur when sample sizes are too small to draw reliable or useful conclusions.

Appendix C Appropriateness of Accommodations 16 2007-08 NECAP Technical Report
• NECAP states are developing an ongoing review and improvement process for
the NECAP accommodations policy and procedures. Concluding Comment: NECAP Commitment to Universal Design and Continuous Improvement. The NECAP management group has made a solid commitment to continuously improve and strengthen the universal design of our assessment instruments. As the quality of universal design elements of the NECAP assessment continues to improve, it is conceivable that the number of students who need to use accommodations may decline. In fact, this is a worthy goal. Although this would cause diminishing sample sizes and challenges for accommodations analysis, declining use of accommodations due to improved universal accessibility in overall test design would be viewed as a very positive outcome. Since its inception in 2003, the NECAP group has supported and funded research and development in accommodations policy and procedures. This is evidenced by the many research activities generated through the multiple Enhanced Assessment Grants of the three participating states referenced earlier in this report.
The NECAP group has shown leadership in obtaining funding and actively supporting accommodations and related research in a number of areas:
1. Describing the performance of students in the assessment gap and exploring alternate ways of assessing students performing below proficient levels (see: New England Compact Enhanced Assessment Project: Task Module Assessment System- Closing the Gap in Assessments),
2. Research in the design and use of accommodations (New England Compact Enhanced Assessment Project: Using Computers to Improve Test Design and Support Students with Disabilities and English-Language Learners),
3. The relationships among and between elements of English language proficiency test scores, academic language competency scores, and performance on NECAP academic content tests (Parker, C. (2007)),
4. Defining and developing technical adequacy in alternate assessments (NHEAI Grant),
5. Developing improved accommodations that will foster increased participation in general assessment for students currently alternately assessed (Jorgensen & McSheehan, (2006)), and
6. All three NECAP states are partners in the ongoing development of the new ACCESS for ELLsTM Test of English Language Proficiency. The Vermont Test Director is a member of the Technical Advisory Committee
The NECAP Development Team has been very busy. These efforts are ongoing and will continue. We are committed to the long-term development of a well validated and highly accessible assessment program that meets the highest possible standards of quality. More importantly, we are committed to the establishment of an assessment system that effectively supports the growth of each and every one of our students.

Appendix C Appropriateness of Accommodations 17 2007-08 NECAP Technical Report
References
Abedi, J. (2006) Validity, effectiveness and feasibility of accommodations for English language learners with disabilities (ELLWD). Paper presented at the Accommodating Students with Disabilities on State Assessments: What Works Conference, Savannah, GA.
Allman, C.B., (Ed.). (2004) Test Access: Making Tests Accessible for Students with
Visual Impairments. Louisville, KY: American Printing House for the Blind, Inc. American Printing House for the Blind, Inc., Accessible Tests Division Staff, (personal
communication, October 2004) American Printing House for the Blind, Inc., Accessible Tests Division Staff, (personal
communication, September 2006) Dolan, R. (2004) Computer Accommodations Must Begin As Classroom Accommodation:
The New England Compact Enhanced Assessment Project: Using Computers to Improve Test Design and Support Students with Disabilities and English-Language Learners. ©1994-2007 by Education Development Center, Inc. All Rights Reserved. http://www.necompact.org/research.asp
Elbaum, B., Aguelles, M.E., Campbell, Y., & Saleh, M.B. (2004). Effects of a student-
reads-aloud accommodation on the performance of students with and without learning disabilities on a test of reading comprehension. Exceptionality, 12(2), 71-87.
Elliott, J., Thurlow, M., & Ysseldyke, J. (1996) Assessment guidelines that maximize the
participation of students with disabilities in large-scale assessments: Characteristics and considerations, Synthesis report 25. Minneapolis, MN: University of Minnesota, National Center on Educational Outcomes.
Frances, D.J. (2006). Practical guidelines for the education of English language
learners. Paper presented at the 2006 LEP Partnership Meeting. Washington, DC. Presentation retrieved December 21, 2006, from http:// www.centeroninstruction.org.
Higgins, J., Russell, M., & Hoffmann, T., (2004) Examining the Effect of Computer-Based Passage Presentation on Reading Test Performance: Part of the New England Compact Enhanced Assessment Project. Boston, MA, in Technology Assessment Study Collaborative (inTASC), Boston College (http://www.bc.edu/research/intasc/publications.shtml)
Higgins, J., Russell, M., & Hoffmann, T., (2004) Examining the Effect of Text Editor and Robust Word Processor on Student Writing Test Performance: Part of the New England Compact Enhanced Assessment Project. Boston, MA, in Technology Assessment Study Collaborative (inTASC), Boston College (http://www.bc.edu/research/intasc/publications.shtml)

Appendix C Appropriateness of Accommodations 18 2007-08 NECAP Technical Report
Johnstone, C.J, Altman, J., Thurlow, M.L., & Thompson, S.J. (2006): A summary of research on the effects of test accommodations: 2002-2004: Synthesis Report 45. Minneapolis, MN: University of Minnesota, National Center on Educational Outcomes.
Jorgensen, C. & McSheehan, M. (2006) Beyond Access for Assessment
Accommodations, General Supervision Enhancement Grant Research (in progress) supported by the US Education Department, Office of Special Education Research, Washington, DC.
Miranda, H., Russell, M., & Hoffmann, T., (2004) Examining the Feasibility and Effect of a Computer-Based Read-Aloud Accommodation on Mathematics Test Performance: Part of the New England Compact Enhanced Assessment Project. Boston, MA, in Technology Assessment Study Collaborative (inTASC), Boston College (http://www.bc.edu/research/intasc/publications.shtml)
Miranda, H., Russell, M., Seeley, K., Hoffman, T., (2004) Examining the Feasibility and Effect of Computer-Based Verbal Response to Open-Ended Reading Comprehension Test Items: Part of the New England Compact Enhanced Assessment Project. •Boston, MA, in Technology Assessment Study Collaborative (inTASC), Boston College (http://www.bc.edu/research/intasc/publications.shtml)
Parker, C. Deepening Analysis of Large-Scale Assessment Data: Understanding the results for English language learners, Study in progress (2007). Project funded by the U.S. Department of Education, Office of Educational Research and Improvement. http://www.relnei.org
Quenemoen, R. (2007). New Hampshire Enhanced Assessment Initiative (NHEAI):
Knowing What Students with Severe Cognitive Disabilities Know... Research (in progress) supported by the US Education Department, Office of Elementary and Secondary Education, Washington, DC.
Sireci, S.G., Li, S., & Scarpati, S. (2005). Test accommodations for students with
disabilities: An analysis of the interaction hypothesis. Review of Educational Research, 75 (4), 457-490.
Sireci, S.G. and Pitoniak, M.J. (2006). Assessment accommodations: What have we
learned from research? Paper presented at the Accommodating Students with Disabilities on State Assessments: What Works Conference, Savannah, GA.
The New England Compact Enhanced Assessment Project: Using Computers to Improve Test Design and Support Students with Disabilities and English-Language Learners. ©1994-2007 by Education Development Center, Inc. All Rights Reserved. http://www.necompact.org/research.asp
The New England Compact Enhanced Assessment Project: Task Module Assessment System. ©1994-2007 by Education Development Center, Inc. All Rights Reserved. http://www.necompact.org/research.asp

Appendix C Appropriateness of Accommodations 19 2007-08 NECAP Technical Report
Thompson, S.J., Blount, A., & Thurlow, M.L. (2002): A summary of research on the effects of test accommodations 1999-2001, Technical Report 34. Minneapolis, MN: University of Minnesota, National Center on Educational Outcomes.
Thompson, S.J., Johnstone, C.J., & Thurlow, M.L. (2002): Universal design applied to
large-scale assessments: Synthesis Report 44. Minneapolis, MN: University of Minnesota, National Center on Educational Outcomes.
Additional Resources: Rhode Island Department of Education, NECAP Assessment Website:
http://www.ridoe.net/assessment/NECAP.aspx Vermont Department of Education, NECAP Assessment Website:
http://education.vermont.gov/new/html/pgm_assessment.html New Hampshire Department of Education, NECAP Assessment Website:
http://www.ed.state.nh.us/NECAP


Appendix D Equating Report 2007-08 NECAP Technical Report 1
APPENDIX D—EQUATING REPORT

Appendix D Equating Report 2007-08 NECAP Technical Report 2
E Q U A T I N G R E P O R T
NEW ENGLAND COMMON ASSESSMENT PROGRAM 2007-2008 EQUATING RESULTS
Final Report January 2008

Appendix D Equating Report 2007-08 NECAP Technical Report 3
NEW ENGLAND COMMON ASSESSMENT PROGRAM 2007-2008 EQUATING RESULTS
The purpose of this document is to summarize the equating results obtained from Measured Progress for NECAP. Presented in this report are various program summary statistics and specific results related to the equating study. The results of this report are organized as follows:
I. Aggregate Results a. Percentage of students by performance level categories b. Raw Scores Associated with Cutpoints c. Calibration Report d. Equating Report e. Summary of Psychometric QC Activities
II. For each grade content: a. ∆ Plot, b plot, a plot, TCCs, SS distributions, and Lookup Tables b. Rescore Analysis Results c. Content and item type distribution of equating items d. Classical test theory statistics and item specifications for equating item e. Tabled delta analysis results
The final results of this equating will be included as part of the 2007-2008 NECAP Technical Manual. If requested Measured Progress will distribute and/or present this report at the next NECAP Technical Advisory Committee Meeting. Equating was not required for Writing Grades 5 and 8 because a pre-equated solution was used for the forms administered. Results for these two grade/contents are included in Sections I.a and I.b, and the lookup tables as well as the TCCs and Scaled Score distribution are provided in Section II.a. Additionally, the Grade 11 program is only included in part of the Calibration Report, and other results can be calculated only after standards have been set.

Appendix D Equating Report 2007-08 NECAP Technical Report 4
SECTION I.A NECAP
PERCENTAGE OF STUDENTS BY PERFORMANCE LEVEL CATEGORIES

Appendix D Equating Report 2007-08 NECAP Technical Report 5
SECTION I.B NECAP
RAW SCORES ASSOCIATED WITH CUTPOINTS

Appendix D Equating Report 2007-08 NECAP Technical Report 6
Table I.b.1 SbP/PP PP/P P/PwD Max Points
Grade Content 2007 2008 2007 2008 2007 2008 2007 2008
3 Math 26 29 38 40 54 56 65 65
4 Math 26 26 37 38 54 55 65 65
5 Math 20 21 29 28 50 47 66 66
6 Math 19 20 28 28 49 47 66 66
7 Math 19 18 26 27 44 45 66 66
8 Math 18 17 25 27 45 48 66 66
3 Reading 21 22 31 31 46 44 52 52
4 Reading 21 22 31 31 43 43 52 52
5 Reading 18 18 27 27 39 38 52 52
6 Reading 20 20 29 28 42 39 52 52
7 Reading 19 19 29 28 42 42 52 52
8 Reading 21 23 31 33 44 44 52 52
5 Writing 18 18 22 22 27 26 37 37
8 Writing 19 18 25 24 31 30 37 37
Note 1: Tan shading indicates lower raw scored needed, blue shading indicates higher raw score needed, while no shading indicated any difference between years. Note 2: The values presented in Table I.b.1 are not the cutscores per se. The cutscores are defined on the θ metric and do not change from year to year. The values in this table represent the raw scores associated with the cutscores, and these values are found via a TCC mapping.

Appendix D Equating Report 2007-08 NECAP Technical Report 7
SECTION I.C NECAP
Calibration Report

Appendix D Equating Report 2007-08 NECAP Technical Report 8
NECAP
Calibration Report
PARSCALE 4.1 was used for all analyses. All command files were set up in a way that all general settings were identical to last year. For example the calibration statement read:
CAL GRADED,LOGISTIC,CYCLE=(100,1,1,1,1),TPRIOR,SPRIOR,GPRIOR;
Thus, a graded response model was used for the polytomous items, and a 3PLM was used for all MC items. For dichotomously scored short answer items the lower asymptote of the ICC was set equal to 0.0 (i.e., a 2PLM was used). The logistic version of the IRT models was used, and default priors were used for all parameter estimates. Each item occupied its own unique block in the command file; thus, allowing the threshold parameters to vary across the polytomously scored items. Table 1 shows the number of Newton cycles to conversion for each grade/content. The resulting parameters demonstrated excellent model fit.
Table I.c.1 Number of Cycles to Convergence
Grade/Content Cycles
MAT03 59
MAT04 47
MAT05 74
MAT06 61
MAT07 62
MAT08 67
MAT11 94
REA03 57
REA04 52
REA05 50
REA06 52
REA07 47
REA08 50
REA11 50
For some items the guessing parameter was not fully estimated during the IRT calibration. This is not at all unusual as difficulty in estimating the c-parameter has been well documented in the psychometric literature. After carefully studying these items we found that fixing the lower asymptote to a value of c=0.0 resulted in stable and reasonable estimates for both the a and b parameters (relative to CTT statistics). This

Appendix D Equating Report 2007-08 NECAP Technical Report 9
technique also produced item parameters that resulted in excellent model fit (comparing theoretical ICCs to observed ICCs). Using a delta analysis procedure to evaluate equating items very few items were removed from the equating analysis. With generally only about 1 item being removed for each grade/content these results are what we have found typically occurs. Results from this analysis are included in Section II of this report. Items were also flagged for a variety of other reasons such as: IRT statistical criteria, copy match, or actions taken during IRT calibration. This created our Table I.c.2, which includes final actions taken on these items.
Table I.c.2 Items Studied and/or Requiring Intervention
During the IRT Calibration / Equating Process IREF Content Grade Form Pos Reason Action
255679 MAT 03 00 2 c parameter c = 0.00
255902 MAT 03 00 48 c parameter c = 0.00
205957 MAT 03 06 15 delta analysis removed from anchor
255673 MAT 04 00 27 c parameter c = 0.00
232594 MAT 04 04 7 CM: Name change none
227035 MAT 04 03 55 delta analysis removed from anchor
225307 MAT 05 00 22 c parameter c = 0.00
255226 MAT 05 00 48 c parameter c = 0.00
203949 MAT 05 07 61 CM: Position change none
225345 MAT 06 01 51 delta analysis removed from anchor
225267 MAT 06 03 28 delta analysis removed from anchor
224793 MAT 07 05 49 c parameter c = 0.00
199947 MAT 07 05 51 c parameter c = 0.00
255899 MAT 07 08 19 a parameter cslope
234459 MAT 07 02 16 delta analysis removed from anchor
256309 MAT 08 06 36 delta analysis removed from anchor
259808 MAT 11 00 6 ALL STATS
255216 REA 03 00 38 c parameter c = 0.00
225242 REA 03 03 46 ALL IRT initial values / no EQ
255334 REA 03 02 50 delta analysis removed from anchor
255618 REA 04 00 29 ALL IRT initial values
230656 REA 05 00 10 c parameter c = 0.00
201396 REA 05 00 13 c parameter c = 0.00
230676 REA 05 00 16 c parameter c = 0.16
256253 REA 05 00 37 c parameter c = 0.00
256259 REA 05 00 39 c parameter c = 0.00
256368 REA 05 02 42 CM: Position change none
226599 REA 05 02 18 delta analysis removed from anchor
256435 REA 06 00 32 c parameter c = 0.00
256316 REA 06 00 36 c parameter c = 0.00
204479 REA 06 02 18 delta analysis removed from anchor
255924 REA 07 00 16 c parameter c = 0.00
255962 REA 07 00 27 c parameter c = 0.00

Appendix D Equating Report 2007-08 NECAP Technical Report 10
IREF Content Grade Form Pos Reason Action
201554 REA 07 00 37 c parameter c = 0.00
201561 REA 07 00 40 c parameter c = 0.00
255823 REA 08 00 25 c parameter c = 0.00
255824 REA 08 00 26 c parameter c = 0.00
255829 REA 08 00 27 c parameter c = 0.00
199616 REA 08 00 39 c parameter c = 0.00
199617 REA 08 00 40 c parameter c = 0.00
204095 REA 08 01 43 delta analysis removed from anchor
258651 REA 11 00 13 c parameter c = 0.00
258724 REA 11 00 18 c parameter c = 0.00
258476 REA 11 00 22 c parameter c = 0.00
258475 REA 11 00 23 c parameter c = 0.00
258479 REA 11 00 24 c parameter c = 0.00
258611 REA 11 00 30 c parameter c = 0.00
258541 REA 11 01 37 c parameter c = 0.00
258510 REA 11 01 47 c parameter c = 0.00
The number of items identified in Table I.c.2 is very typical for a program such as NECAP, and the actions taken are not outside of the normal routines used at Measured Progress. This list is intended to be an exhaustive list of actions taken during the IRT calibration and equating process and our recommendation is that no further action is required.

Appendix D Equating Report 2007-08 NECAP Technical Report 11
SECTION I.D NECAP
EQUATING REPORT

Appendix D Equating Report 2007-08 NECAP Technical Report 12
NECAP
Equating Report
In order to report both student performance and to characterize items onto last year’s scale a statistical equating procedure was used. Namely, the Stocking & Lord procedure was used for the NECAP program. The equating procedures done this year for NECAP were identical to those used last year, and the same software system was used. In particular the software program STUIRT was used to conduct this portion of the analysis. The STUIRT system was developed by researchers at the University of Iowa CASMA program and can be found at: http://www.education.uiowa.edu/casma/. The resulting transformation constants using the Stocking & Lord procedure are presented in Table I.d.1. These values are very typical for this procedure and suggests that none of the equatings performed for NECAP resulted in dramatic changes in item parameters from one year to the next.
Table I.d.1
Stocking & Lord Transformation Constants
Grade Subject A B
3 Math 1.013353 0.11305
4 Math 1.034457 -0.08558
5 Math 0.990527 0.126522
6 Math 1.064973 0.130143
7 Math 0.998032 0.111462
8 Math 0.949159 0.133506
3 Reading 1.031863 -0.07915
4 Reading 0.976459 0.172988
5 Reading 0.993657 0.046554
6 Reading 1.041473 -0.04252
7 Reading 1.041472 0.06933
8 Reading 1.095715 -0.06115
In all 12 equatings conducted for NECAP the analyses finished with a termination code of 1.0 (on a 1-5 scale with 1.0 being the best and 5.0 being a less optimal solution). This indicates that for the NECAP program we were able to optimize the equating solution consistently across all grade contents. Additionally, for all grade/contents similar results were found using other equating procedures (e.g., Mean/Mean, Mean/Sigma, and Haebara methods), and this suggests that there were likely no violations to statical assumptions that are specific to the Stocking & Lord method.

Appendix D Equating Report 2007-08 NECAP Technical Report 13
SECTION I.E NECAP
Summary of Psychometric QC Activities

Appendix D Equating Report 2007-08 NECAP Technical Report 14
NECAP Summary of Psychometric QC Activities
1) Copy match of equating items
2) Key verification process
3) Delta analysis
a. Crit > 3 removed
4) Equating Analysis
a. Reasonableness of item parameters
b. Low a, high SE on B, c parameter not fully estimated
c. Fit files
d. Normal end evaluation – over 48 executable programs were run
e. Delta plot
f. a-plot, b-plots
g. TCCs
h. Proficiency levels and scaled score distributions
i. Internal parallel processing procedures
5) Table I.c.1 – items were continuously evaluated
a. Statistical values
b. Content
6) Parallel processing of SS calculation

Appendix D Equating Report 2007-08 NECAP Technical Report 15
SECTION II.A NECAP
RESULTS FOR EACH GRADE CONTENT

Appendix D Equating Report 2007-08 NECAP Technical Report 16
MATH GRADE 03 EQUATING ITEM EVALUATION
Delta Values
0
5
10
15
20
0 5 10 15 20
2008
20
07
a parameters
0
0.25
0.5
0.75
1
1.25
1.5
1.75
2
0 0.25 0.5 0.75 1 1.25 1.5 1.75 2
2008
20
07
b parameters
-4
-3
-2
-1
0
1
2
3
4
-4 -3 -2 -1 0 1 2 3 4
2008
20
07

Appendix D Equating Report 2007-08 NECAP Technical Report 17

Appendix D Equating Report 2007-08 NECAP Technical Report 18
Math Grade 3 Raw 2008 2007
0 300 300
1 300 300
2 300 300
3 300 300
4 300 300
5 300 300
6 300 300
7 300 303
8 304 307
9 307 311
10 309 313
11 312 315
12 313 317
13 315 319
14 317 320
15 318 321
16 320 323
17 321 324
18 322 325
19 323 326
20 324 327
21 325 328
22 326 329
23 327 329
24 328 330
25 329 331
26 329 332
27 330 333
28 331 333
29 332 334
30 333 335
31 333 336
32 334 336
33 335 337
34 336 338
35 336 338
36 337 339
37 338 339
38 339 341
39 339 341
40 340 342
41 341 343
42 342 343
43 342 344
44 343 345
45 344 346
46 345 346
47 345 347
48 346 348
49 347 349
50 348 350
51 349 351
52 350 352
53 351 352
54 352 353
55 352 355
56 354 356
57 356 357
58 357 358
59 359 360
60 361 361
61 363 364
62 366 366
63 371 370
64 378 376
65 380 380

Appendix D Equating Report 2007-08 NECAP Technical Report 19
MATH GRADE 04 EQUATING ITEM EVALUATION
Delta Values
0
5
10
15
20
0 5 10 15 20
2008
20
07
a parameters
0
0.25
0.5
0.75
1
1.25
1.5
1.75
2
0 0.25 0.5 0.75 1 1.25 1.5 1.75 2
2008
20
07
b parameters
-4
-3
-2
-1
0
1
2
3
4
-4 -3 -2 -1 0 1 2 3 4
2008
20
07
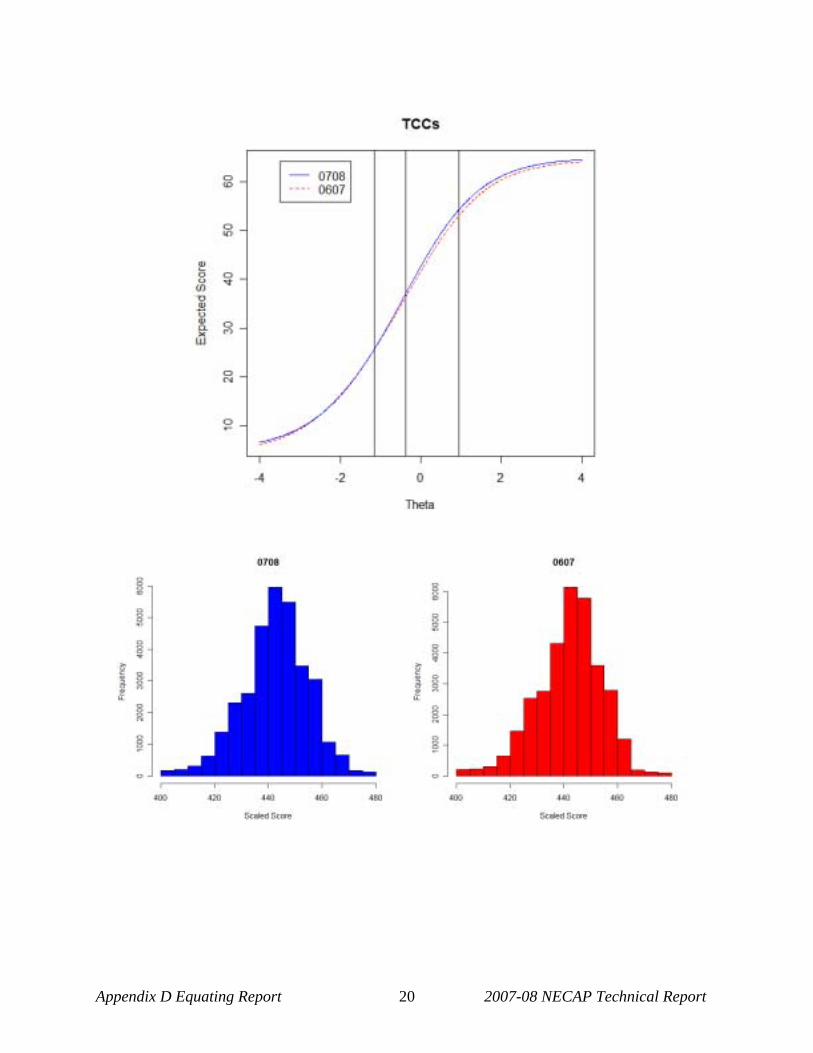
Appendix D Equating Report 2007-08 NECAP Technical Report 20

Appendix D Equating Report 2007-08 NECAP Technical Report 21
Math Grade 4 Raw 2008 2007
400 400
1 400 400
2 400 400
3 400 400
4 400 400
5 400 400
6 400 400
7 402 404
8 406 408
9 410 410
10 412 412
11 414 414
12 416 416
13 418 418
14 419 419
15 421 421
16 422 422
17 423 423
18 424 424
19 425 425
20 426 426
21 427 427
22 428 428
23 429 429
24 430 430
25 430 430
26 432 432
27 432 433
28 433 433
29 434 434
30 435 435
31 436 436
32 436 437
33 437 437
34 438 438
35 439 439
36 439 439
37 439 441
38 441 441
39 441 442
40 442 443
41 443 444
42 444 444
43 444 445
44 445 446
45 446 447
46 447 448
47 448 449
48 448 450
49 449 450
50 450 451
51 451 452
52 452 453
53 453 454
54 454 456
55 456 457
56 457 458
57 458 460
58 460 461
59 462 463
60 464 465
61 466 468
62 469 472
63 473 477
64 480 480
65 480 480

Appendix D Equating Report 2007-08 NECAP Technical Report 22
MATH GRADE 05 EQUATING ITEM EVALUATION
Delta Values
0
5
10
15
20
0 5 10 15 20
2008
20
07
a parameters
0
0.25
0.5
0.75
1
1.25
1.5
1.75
2
0 0.25 0.5 0.75 1 1.25 1.5 1.75 2
2008
20
07
b parameters
-4
-3
-2
-1
0
1
2
3
4
-4 -3 -2 -1 0 1 2 3 4
2008
20
07

Appendix D Equating Report 2007-08 NECAP Technical Report 23

Appendix D Equating Report 2007-08 NECAP Technical Report 24
Math Grade 5 Raw 2008 2007
0 500 500
1 500 500
2 500 500
3 500 500
4 500 500
5 500 500
6 500 503
7 505 510
8 511 514
9 515 517
10 518 520
11 520 522
12 522 523
13 524 525
14 526 526
15 527 528
16 528 529
17 530 530
18 531 531
19 532 532
20 532 533
21 534 534
22 535 535
23 536 536
24 537 537
25 538 537
26 539 538
27 539 539
28 540 539
29 541 540
30 542 541
31 543 542
32 543 543
33 544 543
34 545 544
35 546 544
36 546 545
37 547 546
38 548 546
39 549 547
40 549 548
41 550 548
42 551 549
43 552 550
44 552 550
45 553 551
46 553 552
47 555 552
48 555 553
49 556 553
50 557 555
51 558 555
52 559 556
53 560 557
54 561 558
55 562 559
56 563 560
57 565 561
58 566 562
59 568 564
60 569 565
61 571 567
62 574 570
63 576 573
64 580 577
65 580 580
66 580 580
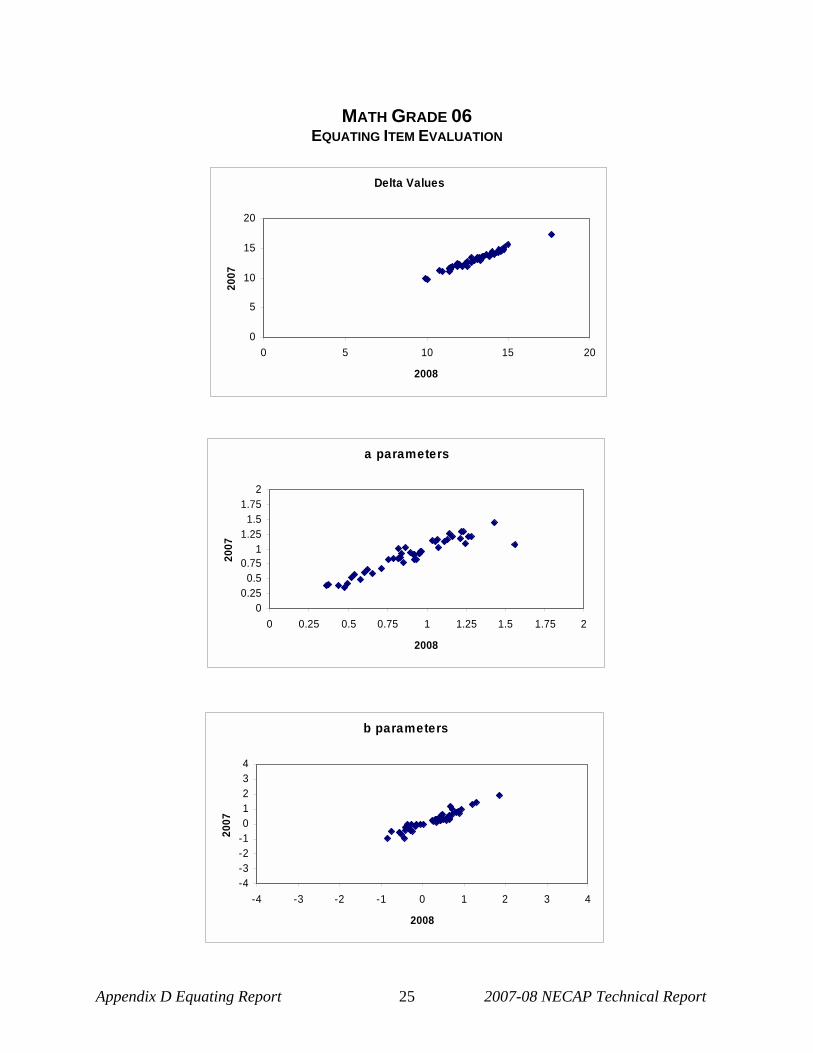
Appendix D Equating Report 2007-08 NECAP Technical Report 25
MATH GRADE 06 EQUATING ITEM EVALUATION
Delta Values
0
5
10
15
20
0 5 10 15 20
2008
20
07
a parameters
0
0.25
0.5
0.75
1
1.25
1.5
1.75
2
0 0.25 0.5 0.75 1 1.25 1.5 1.75 2
2008
20
07
b parameters
-4
-3
-2
-1
0
1
2
3
4
-4 -3 -2 -1 0 1 2 3 4
2008
20
07

Appendix D Equating Report 2007-08 NECAP Technical Report 26

Appendix D Equating Report 2007-08 NECAP Technical Report 27
Math Grade 6 Raw 2008 2007
0 600 600
1 600 600
2 600 600
3 600 600
4 600 600
5 600 600
6 600 600
7 606 609
8 612 615
9 616 619
10 619 621
11 621 623
12 623 625
13 625 627
14 627 628
15 628 629
16 630 630
17 631 631
18 632 632
19 632 633
20 634 634
21 635 635
22 636 636
23 637 636
24 637 637
25 638 638
26 639 639
27 639 639
28 641 640
29 641 641
30 642 641
31 643 642
32 644 643
33 644 643
34 645 644
35 646 645
36 646 645
37 647 646
38 648 647
39 648 647
40 649 648
41 650 648
42 650 649
43 651 650
44 652 650
45 652 651
46 652 652
47 654 652
48 655 652
49 655 654
50 656 655
51 657 655
52 658 656
53 658 657
54 659 658
55 660 659
56 661 660
57 662 661
58 663 662
59 665 663
60 666 665
61 668 666
62 670 668
63 673 671
64 677 674
65 680 680
66 680 680

Appendix D Equating Report 2007-08 NECAP Technical Report 28
MATH GRADE 07 EQUATING ITEM EVALUATION
Delta Values
0
5
10
15
20
0 5 10 15 20
2008
20
07
a parameters
0
0.25
0.5
0.75
1
1.25
1.5
1.75
2
0 0.25 0.5 0.75 1 1.25 1.5 1.75 2
2008
20
07
b parameters
-4
-3
-2
-1
0
1
2
3
4
-4 -3 -2 -1 0 1 2 3 4
2008
20
07

Appendix D Equating Report 2007-08 NECAP Technical Report 29

Appendix D Equating Report 2007-08 NECAP Technical Report 30
Math Grade 7 Raw 2008 2007
0 700 700
1 700 700
2 700 700
3 700 700
4 700 700
5 700 700
6 707 700
7 714 709
8 718 715
9 721 718
10 723 721
11 725 723
12 727 725
13 728 727
14 729 728
15 731 730
16 732 731
17 733 732
18 734 733
19 735 734
20 735 735
21 736 736
22 737 737
23 738 738
24 739 739
25 739 739
26 739 740
27 741 741
28 741 742
29 742 743
30 743 743
31 743 744
32 744 745
33 744 745
34 745 746
35 746 747
36 746 747
37 747 748
38 748 748
39 748 749
40 749 750
41 749 750
42 750 751
43 751 751
44 751 752
45 752 753
46 753 753
47 754 754
48 754 755
49 755 756
50 756 756
51 757 757
52 758 758
53 759 759
54 760 760
55 761 761
56 762 762
57 763 763
58 764 764
59 766 765
60 768 767
61 770 769
62 772 771
63 775 774
64 779 779
65 780 780
66 780 780

Appendix D Equating Report 2007-08 NECAP Technical Report 31
MATH GRADE 08 EQUATING ITEM EVALUATION
Delta Values
0
5
10
15
20
0 5 10 15 20
2008
20
07
a parameters
0
0.25
0.5
0.75
1
1.25
1.5
1.75
2
0 0.25 0.5 0.75 1 1.25 1.5 1.75 2
2008
20
07
b parameters
-4
-3
-2
-1
0
1
2
3
4
-4 -3 -2 -1 0 1 2 3 4
2008
20
07

Appendix D Equating Report 2007-08 NECAP Technical Report 32

Appendix D Equating Report 2007-08 NECAP Technical Report 33
Math Grade 8 Raw 2008 2007
0 800 800
1 800 800
2 800 800
3 800 800
4 800 800
5 800 800
6 802 800
7 815 807
8 820 817
9 823 821
10 825 824
11 827 826
12 829 828
13 830 829
14 831 830
15 832 832
16 833 833
17 834 833
18 835 835
19 835 836
20 836 836
21 837 837
22 837 838
23 838 839
24 839 839
25 839 840
26 839 841
27 840 842
28 841 842
29 842 843
30 842 843
31 843 844
32 843 845
33 844 845
34 844 846
35 845 846
36 845 847
37 846 847
38 846 848
39 847 849
40 847 849
41 848 850
42 848 850
43 849 851
44 850 851
45 850 852
46 851 853
47 851 853
48 852 854
49 852 854
50 853 855
51 854 856
52 854 857
53 855 857
54 856 858
55 857 859
56 857 860
57 858 861
58 859 862
59 860 863
60 861 865
61 863 867
62 865 869
63 867 871
64 870 875
65 875 880
66 880 880

Appendix D Equating Report 2007-08 NECAP Technical Report 34
READING GRADE 03 EQUATING ITEM EVALUATION
Delta Values
0
5
10
15
20
0 5 10 15
2008
20
07
a parameters
0
0.25
0.5
0.75
1
1.25
1.5
1.75
2
0 0.25 0.5 0.75 1 1.25 1.5 1.75 2
2008
20
07
b parameters
-4
-3
-2
-1
0
1
2
3
4
-4 -3 -2 -1 0 1 2 3 4
2008
20
07

Appendix D Equating Report 2007-08 NECAP Technical Report 35
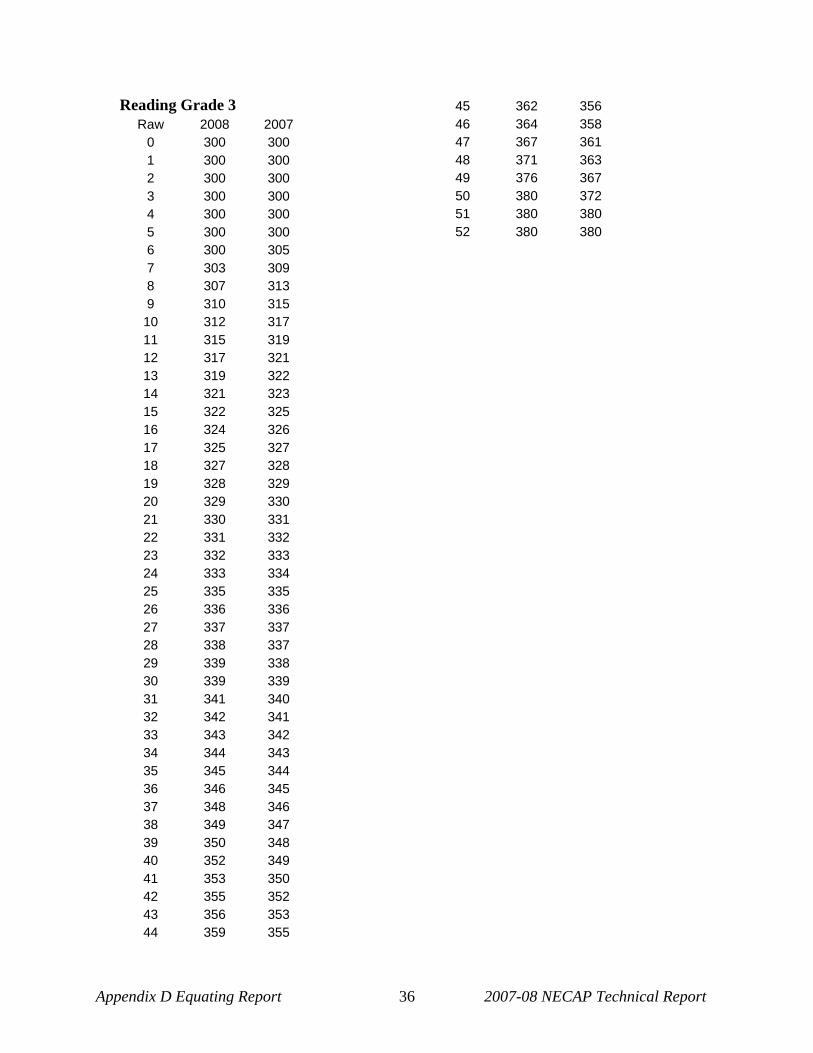
Appendix D Equating Report 2007-08 NECAP Technical Report 36
Reading Grade 3 Raw 2008 2007
0 300 300
1 300 300
2 300 300
3 300 300
4 300 300
5 300 300
6 300 305
7 303 309
8 307 313
9 310 315
10 312 317
11 315 319
12 317 321
13 319 322
14 321 323
15 322 325
16 324 326
17 325 327
18 327 328
19 328 329
20 329 330
21 330 331
22 331 332
23 332 333
24 333 334
25 335 335
26 336 336
27 337 337
28 338 337
29 339 338
30 339 339
31 341 340
32 342 341
33 343 342
34 344 343
35 345 344
36 346 345
37 348 346
38 349 347
39 350 348
40 352 349
41 353 350
42 355 352
43 356 353
44 359 355
45 362 356
46 364 358
47 367 361
48 371 363
49 376 367
50 380 372
51 380 380
52 380 380

Appendix D Equating Report 2007-08 NECAP Technical Report 37
READING GRADE 04 EQUATING ITEM EVALUATION
Delta Values
0
5
10
15
20
0 5 10 15
2008
20
07
a parameters
0
0.25
0.5
0.75
1
1.25
1.5
1.75
2
0 0.25 0.5 0.75 1 1.25 1.5 1.75 2
2008
20
07
b parameters
-4
-3
-2
-1
0
1
2
3
4
-4 -3 -2 -1 0 1 2 3 4
2008
20
07

Appendix D Equating Report 2007-08 NECAP Technical Report 38

Appendix D Equating Report 2007-08 NECAP Technical Report 39
Reading Grade 4 Raw 2008 2007
0 400 400
1 400 400
2 400 400
3 400 400
4 400 400
5 400 400
6 400 402
7 402 407
8 406 411
9 409 413
10 412 416
11 415 418
12 417 419
13 419 421
14 421 423
15 422 424
16 424 425
17 425 426
18 426 428
19 428 429
20 429 430
21 430 431
22 431 432
23 432 433
24 433 434
25 434 435
26 435 436
27 436 437
28 437 438
29 438 439
30 439 439
31 440 441
32 441 442
33 442 443
34 443 444
35 445 445
36 446 446
37 447 447
38 448 449
39 450 450
40 451 452
41 453 453
42 455 455
43 457 457
44 460 458
45 462 461
46 465 463
47 469 466
48 473 469
49 477 473
50 480 478
51 480 480
52 480 480

Appendix D Equating Report 2007-08 NECAP Technical Report 40
READING GRADE 05 EQUATING ITEM EVALUATION
Delta Values
0
5
10
15
20
0 5 10 15 20
2008
20
07
a parameters
0
0.25
0.5
0.75
1
1.25
1.5
1.75
2
0 0.25 0.5 0.75 1 1.25 1.5 1.75 2
2008
20
07
b parameters
-4
-3
-2
-1
0
1
2
3
4
-4 -3 -2 -1 0 1 2 3 4
2008
20
07

Appendix D Equating Report 2007-08 NECAP Technical Report 41

Appendix D Equating Report 2007-08 NECAP Technical Report 42
Reading Grade 5 Raw 2008 2007
0 500 500
1 500 500
2 500 500
3 500 500
4 500 500
5 502 503
6 507 509
7 511 513
8 514 516
9 516 518
10 518 520
11 520 522
12 522 524
13 523 525
14 525 526
15 526 527
16 528 529
17 529 529
18 530 531
19 531 532
20 533 533
21 534 534
22 535 535
23 536 536
24 537 537
25 539 538
26 539 539
27 541 540
28 542 542
29 543 543
30 545 544
31 546 545
32 547 546
33 549 548
34 550 549
35 552 550
36 553 552
37 555 553
38 557 555
39 558 557
40 560 559
41 562 560
42 564 562
43 566 564
44 568 567
45 570 569
46 572 571
47 574 574
48 577 577
49 580 580
50 580 580
51 580 580
52 580 580

Appendix D Equating Report 2007-08 NECAP Technical Report 43
READING GRADE 06 EQUATING ITEM EVALUATION
Delta Values
0
5
10
15
20
0 5 10 15
2008
20
07
a parameters
0
0.25
0.5
0.75
1
1.25
1.5
1.75
2
0 0.25 0.5 0.75 1 1.25 1.5 1.75 2
2008
20
07
b parameters
-4
-3
-2
-1
0
1
2
3
4
-4 -3 -2 -1 0 1 2 3 4
2008
20
07

Appendix D Equating Report 2007-08 NECAP Technical Report 44

Appendix D Equating Report 2007-08 NECAP Technical Report 45
Reading Grade 6 Raw 2008 2007
0 600 600
1 600 600
2 600 600
3 600 600
4 600 600
5 602 600
6 606 604
7 609 608
8 611 611
9 614 614
10 616 616
11 617 617
12 619 619
13 621 621
14 622 622
15 623 624
16 625 625
17 626 626
18 627 627
19 628 628
20 630 630
21 631 631
22 632 632
23 634 633
24 635 634
25 636 635
26 638 637
27 639 638
28 640 639
29 642 640
30 643 642
31 645 643
32 646 644
33 648 646
34 650 647
35 651 648
36 653 650
37 655 652
38 657 653
39 660 655
40 662 657
41 664 658
42 667 660
43 670 662
44 672 665
45 675 667
46 678 669
47 680 672
48 680 675
49 680 679
50 680 680
51 680 680
52 680 680

Appendix D Equating Report 2007-08 NECAP Technical Report 46
READING GRADE 07 EQUATING ITEM EVALUATION
Delta Values
0
5
10
15
20
0 5 10 15
2008
20
07
a parameters
0
0.25
0.5
0.75
1
1.25
1.5
1.75
2
0 0.25 0.5 0.75 1 1.25 1.5 1.75 2
2008
20
07
b parameters
-4
-3
-2
-1
0
1
2
3
4
-4 -3 -2 -1 0 1 2 3 4
2008
20
07

Appendix D Equating Report 2007-08 NECAP Technical Report 47

Appendix D Equating Report 2007-08 NECAP Technical Report 48
Reading Grade 7 Raw 2008 2007
0 700 700
1 700 700
2 700 700
3 700 700
4 700 700
5 704 702
6 708 707
7 711 710
8 714 712
9 716 715
10 718 717
11 719 718
12 721 720
13 722 721
14 724 723
15 725 724
16 726 725
17 727 727
18 728 728
19 730 729
20 731 730
21 732 731
22 733 733
23 734 734
24 736 735
25 737 736
26 738 737
27 739 739
28 740 739
29 741 741
30 743 742
31 744 744
32 745 745
33 746 746
34 748 748
35 749 749
36 751 751
37 752 753
38 754 754
39 755 756
40 757 758
41 759 759
42 761 761
43 763 763
44 765 765
45 767 768
46 769 770
47 772 772
48 774 775
49 778 778
50 780 780
51 780 780
52 780 780
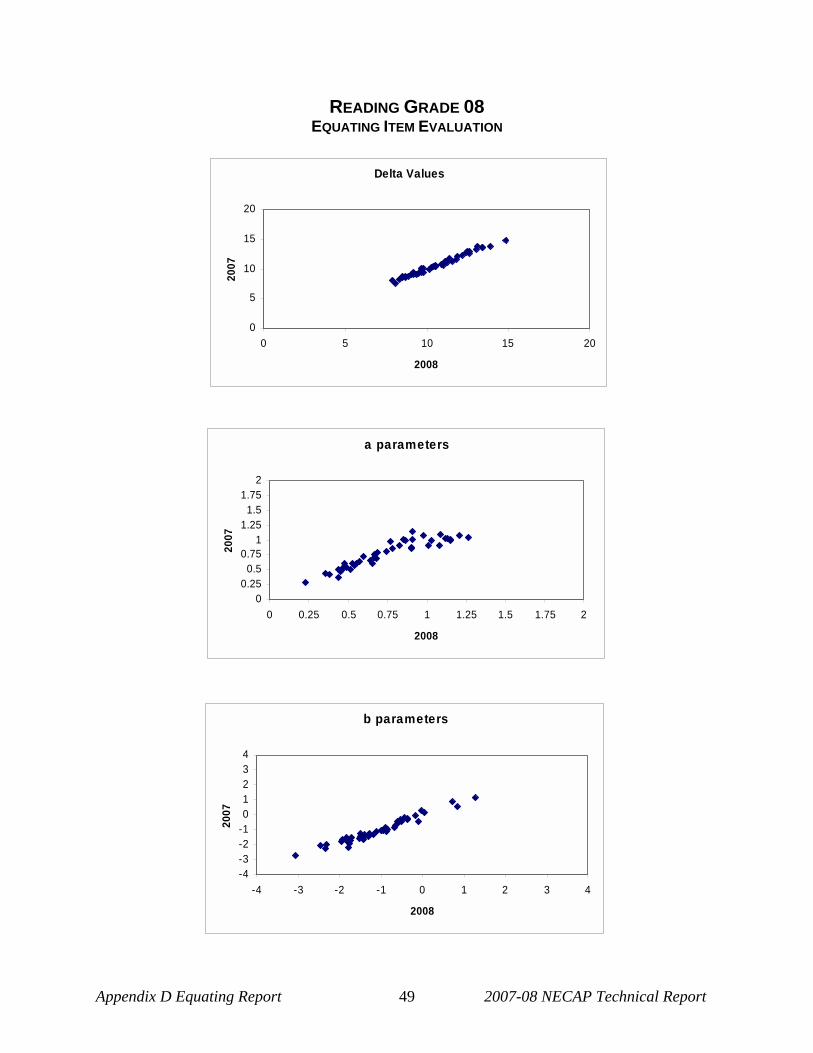
Appendix D Equating Report 2007-08 NECAP Technical Report 49
READING GRADE 08 EQUATING ITEM EVALUATION
Delta Values
0
5
10
15
20
0 5 10 15 20
2008
20
07
a parameters
0
0.25
0.5
0.75
1
1.25
1.5
1.75
2
0 0.25 0.5 0.75 1 1.25 1.5 1.75 2
2008
20
07
b parameters
-4
-3
-2
-1
0
1
2
3
4
-4 -3 -2 -1 0 1 2 3 4
2008
20
07

Appendix D Equating Report 2007-08 NECAP Technical Report 50

Appendix D Equating Report 2007-08 NECAP Technical Report 51
Reading Grade 8 Raw 2008 2007
0 800 800
1 800 800
2 800 800
3 800 800
4 800 800
5 802 800
6 805 805
7 808 808
8 810 811
9 812 813
10 814 815
11 815 817
12 817 818
13 818 819
14 819 821
15 820 822
16 822 823
17 823 824
18 824 826
19 825 827
20 826 827
21 827 829
22 827 830
23 829 831
24 830 832
25 831 833
26 833 835
27 834 836
28 835 837
29 836 838
30 837 839
31 838 841
32 839 842
33 841 843
34 843 845
35 844 846
36 846 847
37 847 849
38 849 850
39 851 852
40 853 854
41 854 855
42 856 857
43 858 858
44 860 861
45 862 863
46 864 865
47 867 867
48 869 870
49 873 873
50 877 876
51 880 880
52 880 880

Appendix D Equating Report 2007-08 NECAP Technical Report 52
SECTION II.B NECAP
Rescore Analysis Results

Appendix D Equating Report 2007-08 NECAP Technical Report 53
NECAP Rescore Analysis Results
For Mathematics and Reading, a rescore analysis was conducted to evaluate potential constructed-response equating items. For each potential equating item, a sample of approximately 200 papers from the 2007-08 test was randomly selected and rescored by this year’s scorers. The scores for the two years were compared, and any items found to have a large difference between the average scores would be excluded as equating items.
The results of the rescore analysis are shown in the tables below. As can be seen in the tables, no constructed-response items were excluded for use as equating items as a result of the rescore analysis.
MATH GRADE 3
IREF MAXIMUM OLDMEAN NEWMEAN OLDSTDEV NEWSTDEV EFF_SIZE ABS_DIFF DISCARD
201754 2 1.3676 1.3873 0.6839 0.6583 0.0287 0.0196 NO
198517 2 1.4341 1.4634 0.7662 0.7618 0.0382 0.0293 NO
202089 2 0.9507 0.9458 0.9508 0.9427 -0.0052 0.0049 NO
231017 2 0.7073 0.7561 0.5693 0.6317 0.0857 0.0488 NO
227127 2 0.8537 0.8927 0.7379 0.738 0.0529 0.039 NO
223923 2 0.7304 0.7402 0.7988 0.8379 0.0123 0.0098 NO
198636 2 1.3805 1.3707 0.7065 0.7048 -0.0138 0.0098 NO
242779 2 0.9415 0.9756 0.9194 0.8968 0.0371 0.0341 NO
242782 2 1.3756 1.4634 0.7125 0.6735 0.1232 0.0878 NO
198521 2 1.0439 0.9854 0.874 0.8638 -0.067 0.0585 NO
MATH GRADE 4
IREF MAXIMUM OLDMEAN NEWMEAN OLDSTDEV NEWSTDEV EFF_SIZE ABS_DIFF DISCARD
232429 2 0.9854 1 0.9395 0.9318 0.0156 0.0146 NO
224096 2 0.9415 0.9707 0.8419 0.8199 0.0348 0.0293 NO
224099 2 1.5874 1.5874 0.7566 0.7566 0 0 NO
198442 2 1.1171 1.0976 0.8358 0.8441 -0.0233 0.0195 NO
202368 2 1.2573 1.1699 0.6586 0.7473 -0.1327 0.0874 NO
202489 2 1.299 1.2843 0.8188 0.809 -0.018 0.0147 NO
198431 2 0.7024 0.7512 0.817 0.8214 0.0597 0.0488 NO
227096 2 0.761 0.7707 0.8003 0.797 0.0122 0.0098 NO
202377 2 1.5268 1.4683 0.7428 0.7747 -0.0788 0.0585 NO
227082 2 1.3317 1.3317 0.5736 0.582 0 0 NO
227082 2 1.3317 1.3317 0.5736 0.582 0 0 NO

Appendix D Equating Report 2007-08 NECAP Technical Report 54
MATH GRADE 5
IREF MAXIMUM OLDMEAN NEWMEAN OLDSTDEV NEWSTDEV EFF_SIZE ABS_DIFF DISCARD
234368 2 1.0196 0.9853 0.8798 0.9366 -0.039 0.0343 NO
241932 4 1.7892 1.8186 1.4685 1.5183 0.02 0.0294 NO
203949 2 0.6585 0.6537 0.778 0.7976 -0.0063 0.0049 NO
225025 2 0.8209 0.8308 0.8568 0.8646 0.0116 0.01 NO
230748 4 0.9055 0.9502 1.2681 1.2726 0.0353 0.0448 NO
198603 2 1.2956 1.3498 0.8371 0.819 0.0647 0.0542 NO
225453 4 1.2709 1.33 1.1954 1.2134 0.0494 0.0591 NO
225346 2 1.1078 1.1029 0.8956 0.8989 -0.0055 0.0049 NO
225028 4 1.5025 1.4926 1.4934 1.526 -0.0066 0.0099 NO
225389 2 0.6158 0.5567 0.7879 0.7819 -0.075 0.0591 NO
225389 2 0.6158 0.5567 0.7879 0.7819 -0.075 0.0591 NO
MATH GRADE 6
IREF MAXIMUM OLDMEAN NEWMEAN OLDSTDEV NEWSTDEV EFF_SIZE ABS_DIFF DISCARD
198727 2 0.5833 0.598 0.7592 0.7574 0.0194 0.0147 NO
234406 2 1.2195 1.2049 0.7812 0.7945 -0.0187 0.0146 NO
234417 4 1.7794 1.6667 1.7194 1.691 -0.0656 0.1127 NO
198632 2 0.8137 0.7941 0.8937 0.8838 -0.0219 0.0196 NO
225381 4 1.2976 1.3756 1.3913 1.4484 0.0561 0.078 NO
198716 2 0.8916 0.9015 0.7005 0.6878 0.0141 0.0099 NO
225334 4 1.7171 1.5659 1.4842 1.4855 -0.1019 0.1512 NO
233588 4 1.4412 1.4118 1.3867 1.3674 -0.0212 0.0294 NO
203279 2 1.4585 1.4195 0.8112 0.8083 -0.0481 0.039 NO
198726 2 0.8146 0.7854 0.9078 0.9175 -0.0322 0.0293 NO
MATH GRADE 7
IREF MAXIMUM OLDMEAN NEWMEAN OLDSTDEV NEWSTDEV EFF_SIZE ABS_DIFF DISCARD
224856 2 0.5294 0.4902 0.8484 0.8194 -0.0462 0.0392 NO
224876 4 0.8676 0.8971 1.3602 1.3912 0.0216 0.0294 NO
206195 4 2.0683 2.0976 1.6395 1.6469 0.0179 0.0293 NO
206213 2 1.0296 0.9507 0.9307 0.9245 -0.0847 0.0788 NO
206127 4 1.5833 1.652 1.0972 1.1296 0.0625 0.0686 NO
206127 4 1.5833 1.652 1.0972 1.1296 0.0625 0.0686 NO
206152 2 0.3073 0.3366 0.5394 0.575 0.0543 0.0293 NO
234455 2 0.561 0.5707 0.6028 0.6256 0.0162 0.0098 NO
234455 2 0.561 0.5707 0.6028 0.6256 0.0162 0.0098 NO
225135 2 0.722 0.6488 0.8239 0.8166 -0.0888 0.0732 NO
206189 2 0.9559 0.8627 0.8928 0.8916 -0.1043 0.0931 NO
206189 2 0.9559 0.8627 0.8928 0.8916 -0.1043 0.0931 NO
224924 4 1.2976 1.2634 1.2704 1.2874 -0.0269 0.0341 NO

Appendix D Equating Report 2007-08 NECAP Technical Report 55
MATH GRADE 8
IREF MAXIMUM OLDMEAN NEWMEAN OLDSTDEV NEWSTDEV EFF_SIZE ABS_DIFF DISCARD
199783 2 0.6049 0.6878 0.5631 0.5588 0.1473 0.0829 NO
233609 4 1.2451 1.2402 0.9439 0.9373 -0.0052 0.0049 NO
206245 4 1.0829 1.0439 1.3608 1.304 -0.0287 0.039 NO
234148 2 0.6878 0.678 0.6478 0.6353 -0.0151 0.0098 NO
199747 2 0.3122 0.4146 0.5927 0.6543 0.1728 0.1024 NO
206240 2 1.2562 1.2857 0.8785 0.8862 0.0336 0.0296 NO
206240 2 1.2562 1.2857 0.8785 0.8862 0.0336 0.0296 NO
206331 4 2.0537 1.961 1.14 1.1554 -0.0813 0.0927 NO
233719 2 1.3805 1.3659 0.8391 0.8368 -0.0174 0.0146 NO
233719 2 1.3805 1.3659 0.8391 0.8368 -0.0174 0.0146 NO
260926 4 1.3088 1.3333 1.1323 1.1827 0.0216 0.0245 NO
260926 4 1.3088 1.3333 1.1323 1.1827 0.0216 0.0245 NO
199780 2 1.0293 1.1659 0.8259 0.7726 0.1654 0.1366 NO
READING GRADE 3
IREF MAXIMUM OLDMEAN NEWMEAN OLDSTDEV NEWSTDEV EFF_SIZE ABS_DIFF DISCARD
205940 4 2.3268 2.2829 1.2119 1.2329 -0.0362 0.0439 NO
230980 4 1.6275 1.549 1.0565 1.1257 -0.0742 0.0784 NO
230973 4 1.8098 1.8634 0.9965 1.0869 0.0538 0.0537 NO
255338 4 3.1024 3.0439 1.3808 1.3733 -0.0424 0.0585 NO
255336 4 2.039 2.2146 1.2449 1.2426 0.1411 0.1756 NO
201764 4 2.2146 2.2634 1.3225 1.3754 0.0369 0.0488 NO
225242 4 3.478 3.5122 0.9137 0.8645 0.0374 0.0341 NO
225253 4 2.0343 1.9608 1.1219 1.1107 -0.0655 0.0735 NO
READING GRADE 4
IREF MAXIMUM OLDMEAN NEWMEAN OLDSTDEV NEWSTDEV EFF_SIZE ABS_DIFF DISCARD
200843 4 2.0098 2.3578 1.372 1.4018 0.2537 0.348 NO
225776 4 2.1902 2.2098 0.9515 1.0169 0.0205 0.0195 NO
225778 4 1.4878 1.4732 0.9505 1.0663 -0.0154 0.0146 NO
203810 4 2.761 2.7463 1.2674 1.2353 -0.0115 0.0146 NO
232528 4 2.6341 2.5659 1.5548 1.6295 -0.0439 0.0683 NO
203873 4 2.6078 2.5343 0.9768 0.9771 -0.0753 0.0735 NO
232595 4 2.1512 2.2488 1.032 1.0599 0.0945 0.0976 NO
203768 4 1.4341 1.5659 1.0601 1.1095 0.1242 0.1317 NO

Appendix D Equating Report 2007-08 NECAP Technical Report 56
READING GRADE 5
IREF MAXIMUM OLDMEAN NEWMEAN OLDSTDEV NEWSTDEV EFF_SIZE ABS_DIFF DISCARD
201937 4 1.6585 1.7902 1.0594 0.9525 0.1243 0.1317 NO
202072 4 1.5463 1.6146 0.9495 0.9842 0.0719 0.0683 NO
202075 4 1.7206 1.6765 0.8719 0.9305 -0.0506 0.0441 NO
201769 4 1.8818 1.7783 1.1123 1.0147 -0.093 0.1034 NO
256415 4 1.5266 1.6135 0.9721 0.9456 0.0895 0.087 NO
256370 4 1.6098 1.561 0.9127 0.8793 -0.0534 0.0488 NO
201911 4 1.6502 1.8128 0.9047 0.9121 0.1797 0.1626 NO
226515 4 1.3202 1.2956 0.9474 0.9371 -0.026 0.0246 NO
226517 4 1.5805 1.5805 0.9726 0.8721 0 0 NO
READING GRADE 6
IREF MAXIMUM OLDMEAN NEWMEAN OLDSTDEV NEWSTDEV EFF_SIZE ABS_DIFF DISCARD
226669 4 1.8571 1.6847 0.7905 0.7422 -0.2181 0.1724 NO
204294 4 1.5025 1.4286 0.9994 0.9616 -0.0739 0.0739 NO
204298 4 1.5074 1.532 1.0615 1.0376 0.0232 0.0246 NO
200348 4 1.9655 1.8966 1.08 0.9696 -0.0639 0.069 NO
204026 4 1.9388 1.8061 0.849 0.7581 -0.1563 0.1327 NO
204022 4 1.7941 1.7353 0.9003 0.8334 -0.0653 0.0588 NO
256347 4 1.6634 1.6829 0.9312 0.7535 0.021 0.0195 NO
226730 4 1.9212 1.6601 1.014 0.9193 -0.2575 0.2611 NO
226735 4 1.5854 1.5805 0.997 0.8665 -0.0049 0.0049 NO
READING GRADE 7
IREF MAXIMUM OLDMEAN NEWMEAN OLDSTDEV NEWSTDEV EFF_SIZE ABS_DIFF DISCARD
201535 4 1.8333 1.951 0.9608 0.9889 0.1224 0.1176 NO
199609 4 1.7317 1.7268 0.9059 0.8285 -0.0054 0.0049 NO
199608 4 1.8732 1.9366 1.0516 1.0269 0.0603 0.0634 NO
256108 4 1.6488 1.8439 1.0376 1.0569 0.188 0.1951 NO
199535 4 1.8829 1.7756 0.8812 0.8195 -0.1218 0.1073 NO
199536 4 1.9659 2.0927 0.891 0.8646 0.1423 0.1268 NO
199569 4 2.0539 2.1618 0.8867 0.8902 0.1216 0.1078 NO
201492 4 1.7931 1.8522 0.9606 0.9085 0.0615 0.0591 NO
201490 4 1.9415 2.1073 0.9141 0.8544 0.1814 0.1659 NO
READING GRADE 8
IREF MAXIMUM OLDMEAN NEWMEAN OLDSTDEV NEWSTDEV EFF_SIZE ABS_DIFF DISCARD
204155 4 2.0049 2.0882 1.0122 0.9812 0.0823 0.0833 NO
204128 4 1.8732 1.9366 0.9441 1.055 0.0672 0.0634 NO
204133 4 2.3707 2.2829 0.9774 0.9412 -0.0898 0.0878 NO
226247 4 2.2732 2.2829 0.9944 0.9667 0.0098 0.0098 NO
255976 4 1.8049 1.9122 0.9632 0.9888 0.1114 0.1073 NO
255965 4 1.9512 2.0341 0.9964 0.9896 0.0832 0.0829 NO
199674 4 1.9707 2.078 1.0069 1.0091 0.1066 0.1073 NO
199675 4 2.1961 2.2549 1.1029 0.987 0.0533 0.0588 NO

Appendix D Equating Report 2007-08 NECAP Technical Report 57
SECTION II.C NECAP
Content and Item Type of Equating Items

Appendix D Equating Report 2007-08 NECAP Technical Report 58
Reporting Category Grade 3 Grade 4 Common Matrix Equating Common Matrix Equating MC SA1 SA2 CR MC SA1 SA2 CR MC SA1 SA2 CR MC SA1 SA2 CRNumber & Operations 19 6 5 17 5 6 15 6 5 17 5 6 Geometry & Measurement 5 1 2 5 1 2 9 1 2 8 1 2 Functions & Algebra 6 2 1 6 3 0 4 2 1 1 3 0 Data, Statistics, & Probability 5 1 2 3 1 2 7 1 2 5 1 2 Reporting Category Grade 5 Grade 6 Common Matrix Equating Common Matrix Equating MC SA1 SA2 CR MC SA1 SA2 CR MC SA1 SA2 CR MC SA1 SA2 CRNumber & Operations 18 2 3 1 17 3 3 1 14 2 3 1 12 1 2 2 Geometry & Measurement 6 1 1 1 4 1 1 1 9 2 1 1 9 1 1 1 Functions & Algebra 6 1 1 1 10 1 2 0 6 1 1 1 5 1 1 1 Data, Statistics, & Probability 2 2 1 1 1 1 0 2 3 1 1 1 5 3 2 0 Reporting Category Grade 7 Grade 8 Common Matrix Equating Common Matrix Equating MC SA1 SA2 CR MC SA1 SA2 CR MC SA1 SA2 CR MC SA1 SA2 CRNumber & Operations 12 2 1 1 11 2 2 1 6 1 1 1 6 1 1 1 Geometry & Measurement 7 1 2 1 10 1 2 1 7 1 2 1 10 1 2 1 Functions & Algebra 9 2 2 1 8 2 2 1 16 3 2 1 12 3 1 2 Data, Statistics, & Probability 4 1 1 1 3 1 1 1 3 1 1 1 4 1 2 0
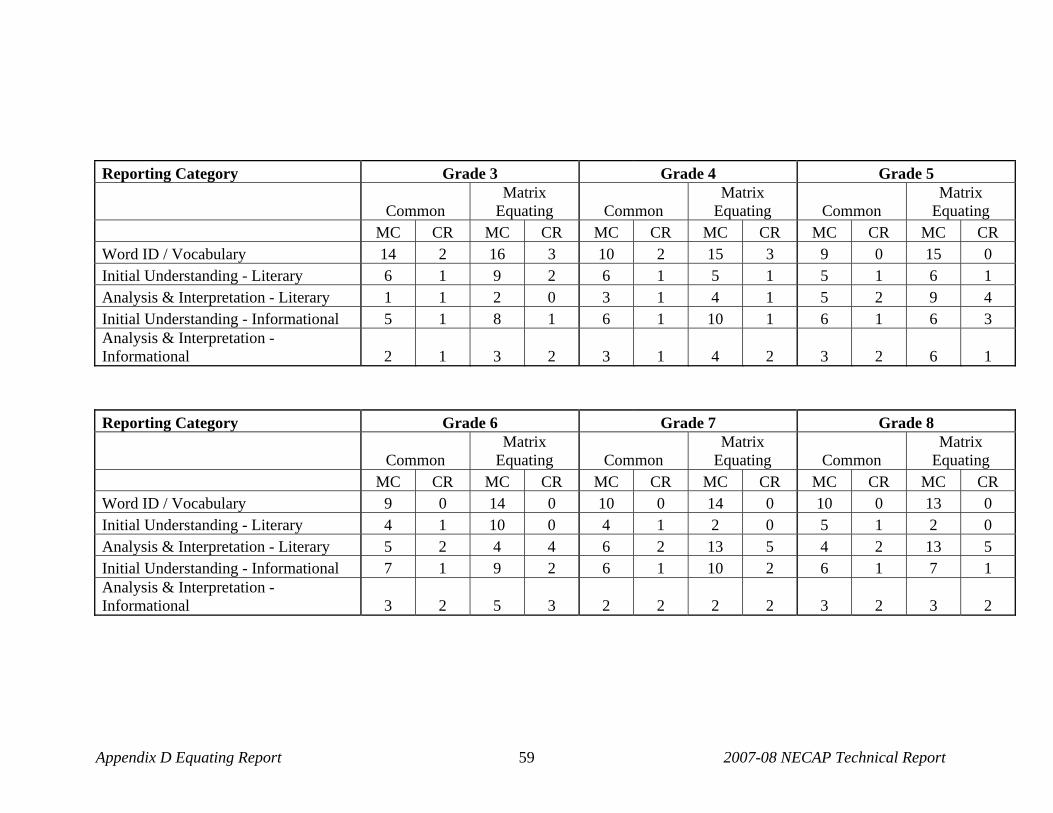
Appendix D Equating Report 2007-08 NECAP Technical Report 59
Reporting Category Grade 3 Grade 4 Grade 5
Common Matrix
Equating Common Matrix
Equating Common Matrix
Equating MC CR MC CR MC CR MC CR MC CR MC CR Word ID / Vocabulary 14 2 16 3 10 2 15 3 9 0 15 0 Initial Understanding - Literary 6 1 9 2 6 1 5 1 5 1 6 1 Analysis & Interpretation - Literary 1 1 2 0 3 1 4 1 5 2 9 4 Initial Understanding - Informational 5 1 8 1 6 1 10 1 6 1 6 3 Analysis & Interpretation - Informational 2 1 3 2 3 1 4 2 3 2 6 1 Reporting Category Grade 6 Grade 7 Grade 8
Common Matrix
Equating Common Matrix
Equating Common Matrix
Equating MC CR MC CR MC CR MC CR MC CR MC CR Word ID / Vocabulary 9 0 14 0 10 0 14 0 10 0 13 0 Initial Understanding - Literary 4 1 10 0 4 1 2 0 5 1 2 0 Analysis & Interpretation - Literary 5 2 4 4 6 2 13 5 4 2 13 5 Initial Understanding - Informational 7 1 9 2 6 1 10 2 6 1 7 1 Analysis & Interpretation - Informational 3 2 5 3 2 2 2 2 3 2 3 2

Appendix D Equating Report 2007-08 NECAP Technical Report 60
SECTION II.D NECAP
Classical Test Theory Statistics and Item Specifications for Equating Items

Appendix D Equating Report 2007-08 NECAP Technical Report 61
Equating Math Grade 03
Item number oldform
Old position oldmean oldstd oldcorrwtotal form position mean std corrwtotal MAX
Old Contract
Old TestYear
198283 6 55 0.82 0.39 0.42 4 32 0.84 0.37 0.4 1 1364 '06-07
198292 6 32 0.74 0.44 0.35 5 7 0.76 0.43 0.36 1 1364 '06-07
198465 3 53 0.59 0.49 0.42 6 30 0.61 0.49 0.44 1 1364 '06-07
198465 9 53 0.6 0.49 0.43 6 30 0.61 0.49 0.44 1 1364 '06-07
198468 0 50 0.79 0.41 0.5 5 30 0.79 0.41 0.55 1 1364 '06-07
198517 0 23 1.46 0.76 0.39 2 19 1.44 0.78 0.39 2 1364 '06-07
198517 0 23 1.46 0.76 0.39 8 19 1.48 0.76 0.42 2 1364 '06-07
198521 5 46 0.83 0.83 0.53 6 69 0.89 0.86 0.52 2 1364 '06-07
198551 0 49 0.85 0.36 0.44 4 53 0.85 0.36 0.48 1 1364 '06-07
198557 0 28 0.85 0.36 0.47 3 53 0.87 0.34 0.5 1 1364 '06-07
198557 0 28 0.85 0.36 0.47 9 53 0.86 0.35 0.47 1 1364 '06-07
198573 5 30 0.81 0.39 0.4 4 55 0.81 0.39 0.44 1 1364 '06-07
198577 0 66 0.89 0.31 0.34 3 65 0.88 0.33 0.39 1 1364 '06-07
198577 0 66 0.89 0.31 0.34 9 65 0.88 0.32 0.34 1 1364 '06-07
198582 0 59 0.49 0.5 0.41 1 55 0.51 0.5 0.45 1 1363 '05-06
198582 0 59 0.49 0.5 0.41 7 55 0.49 0.5 0.46 1 1363 '05-06
198636 0 20 1.4 0.69 0.54 4 69 1.36 0.7 0.55 2 1364 '06-07
201312 0 25 0.84 0.37 0.45 3 30 0.85 0.36 0.46 1 1364 '06-07
201312 0 25 0.84 0.37 0.45 9 30 0.86 0.35 0.44 1 1364 '06-07
201401 5 5 0.86 0.34 0.38 1 7 0.83 0.38 0.4 1 1364 '06-07
201401 5 5 0.86 0.34 0.38 7 7 0.84 0.36 0.37 1 1364 '06-07
201404 0 11 0.74 0.44 0.55 3 7 0.76 0.43 0.55 1 1364 '06-07
201404 0 11 0.74 0.44 0.55 9 7 0.74 0.44 0.55 1 1364 '06-07
201416 0 3 0.71 0.45 0.47 2 7 0.65 0.48 0.51 1 1364 '06-07
201416 0 3 0.71 0.45 0.47 8 7 0.64 0.48 0.5 1 1364 '06-07
201446 0 4 0.52 0.5 0.49 3 5 0.52 0.5 0.48 1 1364 '06-07
201446 0 4 0.52 0.5 0.49 9 5 0.51 0.5 0.5 1 1364 '06-07
201459 6 5 0.51 0.5 0.45 1 5 0.49 0.5 0.46 1 1364 '06-07
201459 6 5 0.51 0.5 0.45 7 5 0.5 0.5 0.46 1 1364 '06-07
201477 0 13 0.74 0.44 0.46 2 15 0.73 0.45 0.47 1 1364 '06-07
201477 0 13 0.74 0.44 0.46 8 15 0.72 0.45 0.45 1 1364 '06-07
201481 0 67 0.77 0.42 0.52 1 65 0.78 0.41 0.52 1 1364 '06-07
201481 0 67 0.77 0.42 0.52 7 65 0.79 0.41 0.51 1 1364 '06-07
201520 5 42 0.7 0.46 0.49 2 65 0.68 0.47 0.44 1 1364 '06-07
201520 5 42 0.7 0.46 0.49 8 65 0.66 0.47 0.47 1 1364 '06-07
201581 5 55 0.69 0.46 0.37 5 32 0.6 0.49 0.36 1 1364 '06-07
201604 9 7 0.57 0.5 0.43 3 32 0.55 0.5 0.44 1 1364 '06-07
201604 3 7 0.56 0.5 0.46 9 32 0.55 0.5 0.41 1 1364 '06-07
201614 9 30 0.81 0.39 0.34 3 55 0.82 0.39 0.33 1 1364 '06-07
201614 3 30 0.81 0.39 0.33 9 55 0.82 0.38 0.38 1 1364 '06-07
201619 6 42 0.8 0.4 0.34 3 42 0.85 0.35 0.29 1 1364 '06-07
201619 6 42 0.8 0.4 0.34 9 42 0.85 0.36 0.3 1 1364 '06-07
201754 0 45 1.32 0.71 0.42 1 46 1.36 0.7 0.44 2 1364 '06-07

Appendix D Equating Report 2007-08 NECAP Technical Report 62
Equating Math Grade 03
Item number oldform
Old position oldmean oldstd oldcorrwtotal form position mean std corrwtotal MAX
Old Contract
Old TestYear
201754 0 45 1.32 0.71 0.42 7 46 1.34 0.71 0.42 2 1364 '06-07
201800 0 56 0.85 0.36 0.32 5 55 0.88 0.32 0.31 1 1364 '06-07
201811 8 30 0.77 0.42 0.42 1 53 0.75 0.43 0.43 1 1364 '06-07
201811 2 30 0.77 0.42 0.43 7 53 0.76 0.43 0.44 1 1364 '06-07
201851 6 65 0.65 0.48 0.55 5 65 0.65 0.48 0.59 1 1364 '06-07
201890 6 53 0.86 0.35 0.44 1 30 0.88 0.32 0.44 1 1364 '06-07
201890 6 53 0.86 0.35 0.44 7 30 0.89 0.32 0.41 1 1364 '06-07
202089 4 46 0.83 0.94 0.51 2 69 0.93 0.94 0.53 2 1364 '06-07
202089 4 46 0.83 0.94 0.51 8 69 0.92 0.94 0.51 2 1364 '06-07
205957 0 14 0.34 0.47 0.46 6 15 0.53 0.5 0.51 1 1364 '06-07
223879 0 9 0.84 0.36 0.42 5 5 0.84 0.37 0.45 1 1364 '06-07
223883 9 5 0.76 0.43 0.38 6 7 0.75 0.43 0.38 1 1364 '06-07
223883 3 5 0.76 0.43 0.38 6 7 0.75 0.43 0.38 1 1364 '06-07
223892 0 59 0.82 0.39 0.4 4 30 0.78 0.42 0.41 1 1364 '06-07
223896 4 55 0.82 0.39 0.4 6 53 0.8 0.4 0.43 1 1364 '06-07
223920 0 17 0.65 0.48 0.43 1 15 0.68 0.47 0.51 1 1364 '06-07
223920 0 17 0.65 0.48 0.43 7 15 0.71 0.46 0.52 1 1364 '06-07
223923 0 18 0.68 0.78 0.52 4 19 0.72 0.8 0.52 2 1364 '06-07
226696 4 5 0.71 0.46 0.47 4 7 0.73 0.44 0.5 1 1364 '06-07
226937 0 29 0.6 0.49 0.49 1 32 0.63 0.48 0.48 1 1364 '06-07
226937 0 29 0.6 0.49 0.49 7 32 0.63 0.48 0.5 1 1364 '06-07
226943 7 55 0.69 0.46 0.44 6 32 0.72 0.45 0.43 1 1364 '06-07
226943 1 55 0.7 0.46 0.42 6 32 0.72 0.45 0.43 1 1364 '06-07
226945 0 37 0.58 0.49 0.46 2 32 0.62 0.49 0.43 1 1364 '06-07
226945 0 37 0.58 0.49 0.46 8 32 0.62 0.49 0.46 1 1364 '06-07
226965 0 16 0.62 0.48 0.46 4 15 0.63 0.48 0.46 1 1364 '06-07
226979 0 51 0.54 0.5 0.29 5 53 0.6 0.49 0.28 1 1364 '06-07
227039 0 60 0.52 0.5 0.48 6 55 0.46 0.5 0.45 1 1364 '06-07
227127 9 69 0.87 0.75 0.55 3 69 0.94 0.75 0.56 2 1364 '06-07
227127 3 69 0.88 0.75 0.58 9 69 0.88 0.73 0.55 2 1364 '06-07
231017 6 19 0.68 0.59 0.44 3 19 0.71 0.63 0.43 2 1364 '06-07
231017 6 19 0.68 0.59 0.44 9 19 0.68 0.6 0.42 2 1364 '06-07
242779 0 68 0.9 0.91 0.55 5 46 0.95 0.91 0.56 2 1364 '06-07
242782 0 70 1.42 0.71 0.58 5 69 1.51 0.71 0.61 2 1364 '06-07
255686 9 6 0.76 0.43 0.48 4 5 0.76 0.43 0.48 1 1364 '06-07
255686 3 6 0.75 0.43 0.48 4 5 0.76 0.43 0.48 1 1364 '06-07
255983 2 42 0.5 0.5 0.48 5 42 0.55 0.5 0.52 1 1364 '06-07

Appendix D Equating Report 2007-08 NECAP Technical Report 63
Equating Math Grade 04
Item number oldform
Old position oldmean oldstd oldcorrwtotal form position mean std corrwtotal MAX
Old Contract
Old TestYear
198327 0 24 0.93 0.26 0.26 3 5 0.92 0.27 0.29 1 1364 '06-07
198327 0 24 0.93 0.26 0.26 9 5 0.93 0.26 0.25 1 1364 '06-07
198328 0 4 0.35 0.48 0.38 3 7 0.4 0.49 0.38 1 1364 '06-07
198328 0 4 0.35 0.48 0.38 9 7 0.39 0.49 0.38 1 1364 '06-07
198381 8 5 0.69 0.46 0.47 4 5 0.72 0.45 0.45 1 1364 '06-07
198381 2 5 0.7 0.46 0.5 4 5 0.72 0.45 0.45 1 1364 '06-07
198384 5 7 0.52 0.5 0.34 6 7 0.52 0.5 0.29 1 1364 '06-07
198400 0 3 0.74 0.44 0.46 1 7 0.7 0.46 0.49 1 1364 '06-07
198400 0 3 0.74 0.44 0.46 7 7 0.71 0.45 0.5 1 1364 '06-07
198401 0 40 0.76 0.43 0.33 2 65 0.7 0.46 0.35 1 1364 '06-07
198401 0 40 0.76 0.43 0.33 8 65 0.71 0.45 0.35 1 1364 '06-07
198411 6 15 0.32 0.47 0.48 6 15 0.47 0.5 0.56 1 1364 '06-07
198426 1 15 0.77 0.42 0.39 5 15 0.8 0.4 0.38 1 1364 '06-07
198426 7 15 0.77 0.42 0.39 5 15 0.8 0.4 0.38 1 1364 '06-07
198430 0 35 0.87 0.34 0.43 3 30 0.86 0.35 0.49 1 1364 '06-07
198430 0 35 0.87 0.34 0.43 9 30 0.85 0.36 0.45 1 1364 '06-07
198431 0 20 0.84 0.83 0.48 5 19 0.76 0.82 0.46 2 1364 '06-07
198442 0 44 1.29 0.8 0.37 3 69 1.17 0.83 0.33 2 1364 '06-07
198442 0 44 1.29 0.8 0.37 9 69 1.17 0.83 0.35 2 1364 '06-07
202322 8 55 0.86 0.35 0.39 4 55 0.85 0.36 0.38 1 1364 '06-07
202322 2 55 0.85 0.35 0.39 4 55 0.85 0.36 0.38 1 1364 '06-07
202331 6 30 0.8 0.4 0.35 2 30 0.8 0.4 0.37 1 1364 '06-07
202331 6 30 0.8 0.4 0.35 8 30 0.8 0.4 0.35 1 1364 '06-07
202347 0 9 0.7 0.46 0.44 5 5 0.73 0.45 0.43 1 1364 '06-07
202354 6 5 0.5 0.5 0.48 6 5 0.52 0.5 0.46 1 1364 '06-07
202368 6 19 1.19 0.68 0.6 4 19 1.11 0.76 0.56 2 1364 '06-07
202377 0 18 1.58 0.73 0.48 6 19 1.54 0.76 0.47 2 1364 '06-07
202384 6 55 0.79 0.41 0.33 4 32 0.79 0.41 0.32 1 1364 '06-07
202388 0 50 0.73 0.44 0.48 2 32 0.7 0.46 0.47 1 1364 '06-07
202388 0 50 0.73 0.44 0.48 8 32 0.71 0.45 0.44 1 1364 '06-07
202396 4 53 0.86 0.34 0.17 6 30 0.86 0.35 0.21 1 1364 '06-07
202484 4 15 0.21 0.41 0.38 2 15 0.28 0.45 0.43 1 1364 '06-07
202484 4 15 0.21 0.41 0.38 8 15 0.3 0.46 0.44 1 1364 '06-07
202489 5 69 1.23 0.83 0.56 4 69 1.23 0.83 0.59 2 1364 '06-07
202500 0 48 0.85 0.36 0.38 3 53 0.83 0.37 0.4 1 1364 '06-07
202500 0 48 0.85 0.36 0.38 9 53 0.83 0.38 0.39 1 1364 '06-07
223956 0 48 0.76 0.43 0.51 1 53 0.8 0.4 0.5 1 1363 '05-06
223956 0 48 0.76 0.43 0.51 7 53 0.81 0.39 0.49 1 1363 '05-06
223960 0 12 0.84 0.36 0.4 2 7 0.85 0.35 0.4 1 1364 '06-07
223960 0 12 0.84 0.36 0.4 8 7 0.85 0.35 0.39 1 1364 '06-07
223966 0 52 0.51 0.5 0.39 4 53 0.57 0.5 0.44 1 1364 '06-07
223968 7 7 0.2 0.4 0.27 1 5 0.2 0.4 0.27 1 1364 '06-07

Appendix D Equating Report 2007-08 NECAP Technical Report 64
Equating Math Grade 04
Item number oldform
Old position oldmean oldstd oldcorrwtotal form position mean std corrwtotal MAX
Old Contract
Old TestYear
223968 1 7 0.2 0.4 0.28 7 5 0.21 0.41 0.26 1 1364 '06-07
224032 0 26 0.61 0.49 0.47 4 30 0.63 0.48 0.48 1 1364 '06-07
224096 4 46 0.99 0.81 0.61 2 69 1.05 0.81 0.63 2 1363 '05-06
224096 4 46 0.99 0.81 0.61 8 69 1.06 0.82 0.64 2 1363 '05-06
224099 9 46 1.59 0.73 0.42 3 46 1.55 0.73 0.44 2 1364 '06-07
224099 3 46 1.6 0.72 0.41 9 46 1.58 0.72 0.43 2 1364 '06-07
227035 7 32 0.73 0.44 0.45 3 55 0.85 0.36 0.47 1 1364 '06-07
227035 1 32 0.72 0.45 0.45 9 55 0.85 0.36 0.46 1 1364 '06-07
227058 0 28 0.87 0.34 0.39 5 32 0.88 0.33 0.39 1 1364 '06-07
227060 0 51 0.85 0.35 0.46 5 53 0.83 0.38 0.47 1 1364 '06-07
227070 0 8 0.36 0.48 0.28 2 5 0.36 0.48 0.26 1 1364 '06-07
227070 0 8 0.36 0.48 0.28 8 5 0.36 0.48 0.28 1 1364 '06-07
227082 9 69 1.37 0.58 0.59 6 69 1.38 0.56 0.61 2 1364 '06-07
227082 3 69 1.35 0.56 0.55 6 69 1.38 0.56 0.61 2 1364 '06-07
227088 0 29 0.19 0.39 0.09 3 32 0.19 0.39 0.1 1 1364 '06-07
227088 0 29 0.19 0.39 0.09 9 32 0.17 0.38 0.05 1 1364 '06-07
227089 6 32 0.66 0.47 0.41 2 55 0.76 0.43 0.4 1 1364 '06-07
227089 6 32 0.66 0.47 0.41 8 55 0.76 0.43 0.39 1 1364 '06-07
227096 0 68 0.83 0.81 0.4 5 69 0.81 0.8 0.46 2 1364 '06-07
227098 0 33 0.65 0.48 0.51 5 30 0.66 0.47 0.53 1 1364 '06-07
227107 0 57 0.81 0.39 0.49 1 55 0.8 0.4 0.49 1 1364 '06-07
227107 0 57 0.81 0.39 0.49 7 55 0.82 0.39 0.49 1 1364 '06-07
232429 0 21 1.18 0.92 0.59 1 19 1.17 0.89 0.57 2 1364 '06-07
232429 0 21 1.18 0.92 0.59 7 19 1.18 0.9 0.55 2 1364 '06-07
232445 7 30 0.81 0.39 0.45 6 32 0.81 0.39 0.36 1 1364 '06-07
232445 1 30 0.81 0.39 0.44 6 32 0.81 0.39 0.36 1 1364 '06-07
232534 0 64 0.55 0.5 0.53 3 65 0.57 0.5 0.53 1 1364 '06-07
232534 0 64 0.55 0.5 0.53 9 65 0.56 0.5 0.54 1 1364 '06-07
232535 0 13 0.56 0.5 0.47 1 15 0.56 0.5 0.49 1 1364 '06-07
232535 0 13 0.56 0.5 0.47 7 15 0.56 0.5 0.49 1 1364 '06-07
232537 5 30 0.72 0.45 0.48 1 30 0.74 0.44 0.43 1 1363 '05-06
232537 5 30 0.72 0.45 0.48 7 30 0.76 0.43 0.44 1 1363 '05-06
232543 0 67 0.71 0.45 0.49 4 65 0.59 0.49 0.44 1 1364 '06-07
232594 8 7 0.48 0.5 0.39 4 7 0.49 0.5 0.39 1 1364 '06-07
232594 2 7 0.46 0.5 0.4 4 7 0.49 0.5 0.39 1 1364 '06-07
232599 5 65 0.49 0.5 0.42 5 65 0.47 0.5 0.4 1 1364 '06-07
232604 4 5 0.46 0.5 0.43 5 7 0.5 0.5 0.46 1 1364 '06-07
255732 4 42 0.59 0.49 0.43 6 65 0.59 0.49 0.44 1 1364 '06-07
255739 1 42 0.54 0.5 0.43 1 65 0.6 0.49 0.41 1 1364 '06-07
255739 1 42 0.54 0.5 0.43 7 65 0.61 0.49 0.4 1 1364 '06-07

Appendix D Equating Report 2007-08 NECAP Technical Report 65
Equating Math Grade 05
Item number oldform
Old position oldmean oldstd oldcorrwtotal form position mean std corrwtotal MAX
Old Contract
Old TestYear
198487 8 7 0.73 0.44 0.46 5 9 0.72 0.45 0.48 1 1364 '06-07
198487 2 7 0.73 0.45 0.47 5 9 0.72 0.45 0.48 1 1364 '06-07
198548 9 38 0.5 0.5 0.48 2 36 0.49 0.5 0.47 1 1364 '06-07
198548 3 38 0.49 0.5 0.49 8 36 0.51 0.5 0.47 1 1364 '06-07
198585 3 51 0.65 0.48 0.44 1 49 0.63 0.48 0.46 1 1364 '06-07
198585 9 51 0.66 0.47 0.47 7 49 0.63 0.48 0.42 1 1364 '06-07
198603 3 61 1.39 0.79 0.47 3 39 1.32 0.85 0.47 2 1364 '06-07
198603 9 61 1.44 0.79 0.48 9 39 1.31 0.86 0.46 2 1364 '06-07
203258 0 46 0.85 0.36 0.35 1 51 0.87 0.34 0.33 1 1364 '06-07
203258 0 46 0.85 0.36 0.35 7 51 0.87 0.34 0.29 1 1364 '06-07
203280 0 32 0.7 0.46 0.48 4 28 0.69 0.46 0.49 1 1364 '06-07
203293 5 49 0.49 0.5 0.57 3 51 0.51 0.5 0.53 1 1364 '06-07
203293 5 49 0.49 0.5 0.57 9 51 0.51 0.5 0.56 1 1364 '06-07
203298 4 9 0.35 0.48 0.34 3 7 0.42 0.49 0.35 1 1364 '06-07
203298 4 9 0.35 0.48 0.34 9 7 0.41 0.49 0.33 1 1364 '06-07
203299 6 9 0.46 0.5 0.36 2 7 0.52 0.5 0.4 1 1364 '06-07
203299 6 9 0.46 0.5 0.36 8 7 0.51 0.5 0.4 1 1364 '06-07
203356 4 7 0.5 0.5 0.46 1 9 0.52 0.5 0.42 1 1364 '06-07
203356 4 7 0.5 0.5 0.46 7 9 0.54 0.5 0.47 1 1364 '06-07
203358 0 2 0.71 0.45 0.41 5 7 0.72 0.45 0.41 1 1364 '06-07
203367 2 9 0.4 0.49 0.26 4 7 0.42 0.49 0.22 1 1364 '06-07
203367 8 9 0.43 0.49 0.24 4 7 0.42 0.49 0.22 1 1364 '06-07
203378 6 26 0.61 0.49 0.36 4 51 0.63 0.48 0.38 1 1364 '06-07
203556 5 36 0.59 0.49 0.33 4 38 0.63 0.48 0.35 1 1364 '06-07
203559 6 16 0.55 0.5 0.46 6 16 0.6 0.49 0.46 1 1364 '06-07
203584 0 30 0.53 0.5 0.44 6 49 0.54 0.5 0.44 1 1364 '06-07
203606 2 28 0.45 0.5 0.43 5 49 0.46 0.5 0.44 1 1364 '06-07
203606 8 28 0.45 0.5 0.44 5 49 0.46 0.5 0.44 1 1364 '06-07
203893 6 49 0.75 0.43 0.35 2 26 0.76 0.43 0.31 1 1364 '06-07
203893 6 49 0.75 0.43 0.35 8 26 0.77 0.42 0.29 1 1364 '06-07
203898 4 51 0.6 0.49 0.42 6 9 0.57 0.5 0.41 1 1364 '06-07
203914 2 51 0.55 0.5 0.23 3 49 0.54 0.5 0.37 1 1364 '06-07
203914 8 51 0.52 0.5 0.26 9 49 0.53 0.5 0.37 1 1364 '06-07
203933 0 22 0.84 0.36 0.36 5 26 0.84 0.37 0.35 1 1364 '06-07
203938 8 26 0.71 0.45 0.49 4 26 0.66 0.47 0.46 1 1364 '06-07
203938 2 26 0.72 0.45 0.47 4 26 0.66 0.47 0.46 1 1364 '06-07
203941 0 37 0.81 0.39 0.37 4 36 0.79 0.4 0.4 1 1364 '06-07
203949 0 65 0.66 0.78 0.58 1 61 0.74 0.83 0.58 2 1364 '06-07
203949 0 65 0.66 0.78 0.58 7 61 0.74 0.84 0.57 2 1364 '06-07
203977 5 28 0.51 0.5 0.38 6 28 0.49 0.5 0.37 1 1364 '06-07
203997 4 16 0.38 0.49 0.46 1 36 0.38 0.49 0.44 1 1364 '06-07
203997 4 16 0.38 0.49 0.46 7 36 0.38 0.49 0.41 1 1364 '06-07

Appendix D Equating Report 2007-08 NECAP Technical Report 66
Equating Math Grade 05
Item number oldform
Old position oldmean oldstd oldcorrwtotal form position mean std corrwtotal MAX
Old Contract
Old TestYear
225011 0 29 0.42 0.49 0.49 5 28 0.43 0.5 0.53 1 1364 '06-07
225025 0 41 0.8 0.85 0.39 2 39 0.9 0.87 0.4 2 1364 '06-07
225025 0 41 0.8 0.85 0.39 8 39 0.91 0.87 0.38 2 1364 '06-07
225028 0 62 1.58 1.46 0.67 5 64 1.67 1.45 0.69 4 1364 '06-07
225032 9 26 0.48 0.5 0.49 4 49 0.52 0.5 0.5 1 1364 '06-07
225032 3 26 0.48 0.5 0.48 4 49 0.52 0.5 0.5 1 1364 '06-07
225295 0 52 0.48 0.5 0.34 3 26 0.47 0.5 0.32 1 1364 '06-07
225295 0 52 0.48 0.5 0.34 9 26 0.47 0.5 0.37 1 1364 '06-07
225298 8 49 0.57 0.5 0.44 3 28 0.59 0.49 0.46 1 1364 '06-07
225298 2 49 0.56 0.5 0.45 9 28 0.61 0.49 0.46 1 1364 '06-07
225316 0 48 0.54 0.5 0.44 6 51 0.49 0.5 0.37 1 1364 '06-07
225333 0 11 0.5 0.5 0.44 2 9 0.5 0.5 0.49 1 1364 '06-07
225333 0 11 0.5 0.5 0.44 8 9 0.51 0.5 0.46 1 1364 '06-07
225346 0 63 1.18 0.86 0.56 4 61 1.18 0.88 0.58 2 1364 '06-07
225389 2 39 0.55 0.76 0.56 6 61 0.54 0.77 0.53 2 1364 '06-07
225389 8 39 0.54 0.74 0.57 6 61 0.54 0.77 0.53 2 1364 '06-07
225404 6 28 0.69 0.46 0.32 1 26 0.7 0.46 0.34 1 1364 '06-07
225404 6 28 0.69 0.46 0.32 7 26 0.71 0.45 0.33 1 1364 '06-07
225408 0 4 0.36 0.48 0.3 1 28 0.36 0.48 0.32 1 1364 '06-07
225408 0 4 0.36 0.48 0.3 7 28 0.35 0.48 0.3 1 1364 '06-07
225453 6 20 1.08 1.27 0.66 4 20 1.06 1.27 0.64 4 1364 '06-07
226715 8 8 0.34 0.47 0.33 4 9 0.33 0.47 0.38 1 1364 '06-07
226715 2 8 0.33 0.47 0.35 4 9 0.33 0.47 0.38 1 1364 '06-07
226814 7 49 0.36 0.48 0.42 6 26 0.34 0.48 0.4 1 1364 '06-07
226814 1 49 0.36 0.48 0.43 6 26 0.34 0.48 0.4 1 1364 '06-07
230748 0 40 1.01 1.35 0.59 3 20 1.02 1.35 0.58 4 1364 '06-07
230748 0 40 1.01 1.35 0.59 9 20 0.98 1.35 0.59 4 1364 '06-07
234368 4 19 0.88 0.88 0.58 1 19 0.77 0.9 0.55 2 1364 '06-07
234368 4 19 0.88 0.88 0.58 7 19 0.79 0.9 0.54 2 1364 '06-07
234370 0 24 0.75 0.43 0.42 2 49 0.77 0.42 0.41 1 1364 '06-07
234370 0 24 0.75 0.43 0.42 8 49 0.77 0.42 0.41 1 1364 '06-07
234393 5 9 0.49 0.5 0.44 1 7 0.47 0.5 0.45 1 1364 '06-07
234393 5 9 0.49 0.5 0.44 7 7 0.48 0.5 0.47 1 1364 '06-07
241932 0 18 1.96 1.42 0.59 1 20 1.93 1.43 0.61 4 1364 '06-07
241932 0 18 1.96 1.42 0.59 7 20 1.97 1.43 0.61 4 1364 '06-07
255763 9 50 0.51 0.5 0.41 5 51 0.47 0.5 0.4 1 1364 '06-07
255763 3 50 0.5 0.5 0.4 5 51 0.47 0.5 0.4 1 1364 '06-07
260931 7 36 0.42 0.49 0.45 6 36 0.39 0.49 0.44 1 1364 '06-07
260931 1 36 0.42 0.49 0.46 6 36 0.39 0.49 0.44 1 1364 '06-07

Appendix D Equating Report 2007-08 NECAP Technical Report 67
Equating Math Grade 06
Item number oldform
Old position oldmean oldstd oldcorrwtotal form position mean std corrwtotal MAX
Old Contract
Old TestYear
198609 5 7 0.48 0.5 0.48 4 7 0.48 0.5 0.5 1 1364 '06-07
198610 0 6 0.78 0.41 0.46 1 7 0.78 0.42 0.46 1 1364 '06-07
198610 0 6 0.78 0.41 0.46 7 7 0.78 0.41 0.44 1 1364 '06-07
198612 0 11 0.38 0.48 0.43 6 7 0.38 0.49 0.44 1 1364 '06-07
198632 8 19 0.82 0.89 0.68 3 19 0.79 0.89 0.66 2 1364 '06-07
198632 2 19 0.8 0.88 0.69 9 19 0.87 0.9 0.67 2 1364 '06-07
198649 0 55 0.47 0.5 0.39 4 51 0.49 0.5 0.44 1 1364 '06-07
198650 0 32 0.63 0.48 0.36 6 28 0.66 0.47 0.35 1 1364 '06-07
198713 0 14 0.61 0.49 0.55 1 16 0.58 0.49 0.55 1 1364 '06-07
198713 0 14 0.61 0.49 0.55 7 16 0.61 0.49 0.56 1 1364 '06-07
198716 0 41 0.89 0.67 0.49 3 61 0.92 0.68 0.5 2 1364 '06-07
198716 0 41 0.89 0.67 0.49 9 61 0.91 0.67 0.45 2 1364 '06-07
198722 9 49 0.62 0.48 0.51 3 51 0.63 0.48 0.49 1 1364 '06-07
198722 3 49 0.63 0.48 0.5 9 51 0.65 0.48 0.5 1 1364 '06-07
198726 4 61 0.75 0.9 0.56 6 61 0.73 0.89 0.54 2 1364 '06-07
198727 5 19 0.52 0.74 0.57 1 39 0.63 0.78 0.57 2 1364 '06-07
198727 5 19 0.52 0.74 0.57 7 39 0.62 0.78 0.56 2 1364 '06-07
203167 5 9 0.4 0.49 0.47 3 9 0.39 0.49 0.48 1 1364 '06-07
203167 5 9 0.4 0.49 0.47 9 9 0.41 0.49 0.49 1 1364 '06-07
203173 4 7 0.46 0.5 0.45 2 26 0.46 0.5 0.46 1 1364 '06-07
203173 4 7 0.46 0.5 0.45 8 26 0.48 0.5 0.46 1 1364 '06-07
203188 9 26 0.63 0.48 0.51 2 7 0.64 0.48 0.48 1 1364 '06-07
203188 3 26 0.63 0.48 0.5 8 7 0.66 0.47 0.48 1 1364 '06-07
203204 0 13 0.62 0.49 0.5 2 9 0.64 0.48 0.47 1 1364 '06-07
203204 0 13 0.62 0.49 0.5 8 9 0.65 0.48 0.47 1 1364 '06-07
203217 0 12 0.65 0.48 0.37 5 9 0.65 0.48 0.35 1 1364 '06-07
203279 0 21 1.37 0.85 0.54 6 19 1.39 0.81 0.53 2 1364 '06-07
203350 5 26 0.61 0.49 0.26 5 26 0.64 0.48 0.31 1 1364 '06-07
203379 0 53 0.33 0.47 0.32 5 28 0.33 0.47 0.37 1 1364 '06-07
203381 0 33 0.79 0.4 0.25 5 51 0.77 0.42 0.28 1 1364 '06-07
203393 0 30 0.5 0.5 0.49 1 26 0.48 0.5 0.49 1 1364 '06-07
203393 0 30 0.5 0.5 0.49 7 26 0.47 0.5 0.49 1 1364 '06-07
203452 4 28 0.52 0.5 0.46 1 28 0.54 0.5 0.43 1 1364 '06-07
203452 4 28 0.52 0.5 0.46 7 28 0.55 0.5 0.44 1 1364 '06-07
203453 8 9 0.59 0.49 0.36 1 9 0.57 0.5 0.38 1 1364 '06-07
203453 2 9 0.6 0.49 0.37 7 9 0.58 0.49 0.36 1 1364 '06-07
203457 2 51 0.68 0.46 0.5 4 26 0.66 0.47 0.47 1 1364 '06-07
203457 8 51 0.69 0.46 0.49 4 26 0.66 0.47 0.47 1 1364 '06-07
203526 7 51 0.57 0.5 0.28 4 28 0.61 0.49 0.26 1 1364 '06-07
203526 1 51 0.58 0.49 0.29 4 28 0.61 0.49 0.26 1 1364 '06-07
203543 7 38 0.46 0.5 0.4 1 36 0.47 0.5 0.39 1 1364 '06-07
203543 1 38 0.44 0.5 0.42 7 36 0.46 0.5 0.4 1 1364 '06-07

Appendix D Equating Report 2007-08 NECAP Technical Report 68
Equating Math Grade 06
Item number oldform
Old position oldmean oldstd oldcorrwtotal form position mean std corrwtotal MAX
Old Contract
Old TestYear
225180 9 51 0.46 0.5 0.47 3 26 0.42 0.49 0.48 1 1364 '06-07
225180 3 51 0.46 0.5 0.47 9 26 0.46 0.5 0.47 1 1364 '06-07
225267 0 31 0.6 0.49 0.46 3 28 0.52 0.5 0.45 1 1364 '06-07
225267 0 31 0.6 0.49 0.46 9 28 0.55 0.5 0.42 1 1364 '06-07
225300 0 54 0.14 0.34 0.26 6 49 0.12 0.32 0.28 1 1364 '06-07
225318 0 25 0.46 0.5 0.53 3 49 0.48 0.5 0.54 1 1364 '06-07
225318 0 25 0.46 0.5 0.53 9 49 0.49 0.5 0.57 1 1364 '06-07
225334 5 20 1.41 1.47 0.71 4 20 1.4 1.46 0.73 4 1364 '06-07
225345 7 49 0.41 0.49 0.25 1 51 0.49 0.5 0.31 1 1364 '06-07
225345 1 49 0.4 0.49 0.25 7 51 0.51 0.5 0.31 1 1364 '06-07
225351 0 24 0.5 0.5 0.27 3 7 0.49 0.5 0.25 1 1364 '06-07
225351 0 24 0.5 0.5 0.27 9 7 0.51 0.5 0.25 1 1364 '06-07
225363 0 60 0.36 0.48 0.29 6 16 0.4 0.49 0.32 1 1364 '06-07
225376 0 5 0.49 0.5 0.38 6 9 0.49 0.5 0.38 1 1364 '06-07
225377 2 36 0.58 0.49 0.5 6 36 0.6 0.49 0.49 1 1364 '06-07
225377 8 36 0.58 0.49 0.54 6 36 0.6 0.49 0.49 1 1364 '06-07
225381 0 18 1.33 1.38 0.63 3 20 1.41 1.45 0.65 4 1364 '06-07
225381 0 18 1.33 1.38 0.63 9 20 1.45 1.49 0.64 4 1364 '06-07
225427 8 49 0.4 0.49 0.25 4 49 0.39 0.49 0.28 1 1364 '06-07
225427 2 49 0.4 0.49 0.23 4 49 0.39 0.49 0.28 1 1364 '06-07
228669 0 37 0.67 0.47 0.61 3 36 0.67 0.47 0.58 1 1364 '06-07
228669 0 37 0.67 0.47 0.61 9 36 0.71 0.45 0.59 1 1364 '06-07
233588 0 40 1.59 1.39 0.7 5 64 1.63 1.41 0.69 4 1364 '06-07
234406 3 39 1.09 0.8 0.59 2 19 1.13 0.8 0.57 2 1364 '06-07
234406 9 39 1.1 0.79 0.6 8 19 1.13 0.81 0.58 2 1364 '06-07
234411 6 51 0.54 0.5 0.43 5 49 0.53 0.5 0.47 1 1364 '06-07
234416 6 9 0.45 0.5 0.21 2 28 0.52 0.5 0.26 1 1364 '06-07
234416 6 9 0.45 0.5 0.21 8 28 0.53 0.5 0.28 1 1364 '06-07
234417 3 64 1.69 1.72 0.69 2 64 1.66 1.7 0.65 4 1364 '06-07
234417 9 64 1.73 1.73 0.67 8 64 1.68 1.72 0.66 4 1364 '06-07
242302 0 47 0.57 0.5 0.53 1 49 0.58 0.49 0.5 1 1364 '06-07
242302 0 47 0.57 0.5 0.53 7 49 0.61 0.49 0.5 1 1364 '06-07
255359 4 50 0.3 0.46 0.47 2 49 0.31 0.46 0.5 1 1364 '06-07
255359 4 50 0.3 0.46 0.47 8 49 0.33 0.47 0.5 1 1364 '06-07
255569 1 16 0.56 0.5 0.55 4 36 0.61 0.49 0.55 1 1364 '06-07

Appendix D Equating Report 2007-08 NECAP Technical Report 69
Equating Math Grade 07
Item number oldform
Old position oldmean oldstd oldcorrwtotal form position mean std corrwtotal MAX
Old Contract
Old TestYear
199870 0 25 0.52 0.5 0.37 2 26 0.51 0.5 0.38 1 1364 '06-07
199870 0 25 0.52 0.5 0.37 8 26 0.51 0.5 0.38 1 1364 '06-07
199898 6 28 0.87 0.33 0.25 4 51 0.87 0.33 0.29 1 1364 '06-07
199918 4 51 0.57 0.5 0.42 4 26 0.64 0.48 0.38 1 1364 '06-07
199925 0 47 0.51 0.5 0.36 5 28 0.55 0.5 0.36 1 1364 '06-07
199947 0 48 0.7 0.46 0.39 5 51 0.66 0.47 0.39 1 1364 '06-07
199950 0 60 0.71 0.46 0.42 5 36 0.62 0.48 0.41 1 1364 '06-07
206097 8 9 0.51 0.5 0.29 5 7 0.47 0.5 0.27 1 1364 '06-07
206097 2 9 0.5 0.5 0.26 5 7 0.47 0.5 0.27 1 1364 '06-07
206098 6 9 0.8 0.4 0.22 2 7 0.8 0.4 0.24 1 1364 '06-07
206098 6 9 0.8 0.4 0.22 8 7 0.81 0.39 0.2 1 1364 '06-07
206102 4 9 0.34 0.47 0.45 6 7 0.4 0.49 0.46 1 1364 '06-07
206103 6 7 0.59 0.49 0.45 1 7 0.56 0.5 0.45 1 1364 '06-07
206103 6 7 0.59 0.49 0.45 7 7 0.57 0.49 0.46 1 1364 '06-07
206104 4 7 0.53 0.5 0.46 3 7 0.54 0.5 0.47 1 1364 '06-07
206104 4 7 0.53 0.5 0.46 9 7 0.54 0.5 0.46 1 1364 '06-07
206127 3 20 1.51 1.12 0.69 4 20 1.59 1.17 0.71 4 1364 '06-07
206127 9 20 1.52 1.15 0.69 4 20 1.59 1.17 0.71 4 1364 '06-07
206135 4 26 0.4 0.49 0.26 4 28 0.45 0.5 0.29 1 1364 '06-07
206141 1 51 0.52 0.5 0.52 3 49 0.5 0.5 0.52 1 1364 '06-07
206141 7 51 0.53 0.5 0.51 9 49 0.5 0.5 0.5 1 1364 '06-07
206144 2 49 0.56 0.5 0.36 6 28 0.62 0.49 0.36 1 1364 '06-07
206144 8 49 0.57 0.49 0.36 6 28 0.62 0.49 0.36 1 1364 '06-07
206152 5 61 0.34 0.59 0.49 5 39 0.47 0.68 0.51 2 1364 '06-07
206158 0 44 0.74 0.44 0.45 1 49 0.74 0.44 0.47 1 1364 '06-07
206158 0 44 0.74 0.44 0.45 7 49 0.76 0.43 0.44 1 1364 '06-07
206164 6 51 0.61 0.49 0.34 1 26 0.55 0.5 0.31 1 1364 '06-07
206164 6 51 0.61 0.49 0.34 7 26 0.54 0.5 0.27 1 1364 '06-07
206172 5 7 0.52 0.5 0.4 1 9 0.56 0.5 0.43 1 1364 '06-07
206172 5 7 0.52 0.5 0.4 7 9 0.57 0.5 0.4 1 1364 '06-07
206177 0 55 0.73 0.44 0.44 2 28 0.77 0.42 0.45 1 1364 '06-07
206177 0 55 0.73 0.44 0.44 8 28 0.78 0.41 0.42 1 1364 '06-07
206181 5 36 0.48 0.5 0.38 1 38 0.34 0.47 0.34 1 1364 '06-07
206181 5 36 0.48 0.5 0.38 7 38 0.36 0.48 0.35 1 1364 '06-07
206189 2 61 0.86 0.89 0.44 6 61 0.81 0.89 0.42 2 1364 '06-07
206189 8 61 0.87 0.9 0.45 6 61 0.81 0.89 0.42 2 1364 '06-07
206195 0 62 2.27 1.66 0.51 2 64 2.18 1.63 0.53 4 1364 '06-07
206195 0 62 2.27 1.66 0.51 8 64 2.18 1.64 0.54 4 1364 '06-07
206203 3 7 0.24 0.43 0.41 3 9 0.25 0.44 0.43 1 1364 '06-07
206203 9 7 0.23 0.42 0.45 9 9 0.26 0.44 0.46 1 1364 '06-07
206213 7 61 0.94 0.93 0.36 3 39 0.98 0.94 0.32 2 1363 '05-06
206213 1 61 0.93 0.94 0.39 9 39 0.94 0.95 0.32 2 1363 '05-06

Appendix D Equating Report 2007-08 NECAP Technical Report 70
Equating Math Grade 07
Item number oldform
Old position oldmean oldstd oldcorrwtotal form position mean std corrwtotal MAX
Old Contract
Old TestYear
224761 0 31 0.59 0.49 0.38 3 28 0.57 0.49 0.39 1 1364 '06-07
224761 0 31 0.59 0.49 0.38 9 28 0.58 0.49 0.38 1 1364 '06-07
224764 0 2 0.88 0.33 0.31 4 7 0.87 0.34 0.35 1 1364 '06-07
224777 6 49 0.43 0.49 0.39 5 9 0.46 0.5 0.35 1 1364 '06-07
224781 4 28 0.33 0.47 0.46 1 28 0.28 0.45 0.44 1 1364 '06-07
224781 4 28 0.33 0.47 0.46 7 28 0.27 0.44 0.41 1 1364 '06-07
224793 9 51 0.67 0.47 0.37 5 49 0.68 0.47 0.29 1 1364 '06-07
224793 3 51 0.67 0.47 0.34 5 49 0.68 0.47 0.29 1 1364 '06-07
224801 0 13 0.36 0.48 0.36 2 9 0.38 0.49 0.35 1 1364 '06-07
224801 0 13 0.36 0.48 0.36 8 9 0.4 0.49 0.33 1 1364 '06-07
224827 0 15 0.4 0.49 0.44 6 16 0.43 0.5 0.45 1 1364 '06-07
224856 7 61 0.54 0.85 0.47 1 61 0.49 0.83 0.49 2 1364 '06-07
224856 1 61 0.54 0.85 0.48 7 61 0.49 0.83 0.46 2 1364 '06-07
224876 0 40 0.84 1.3 0.63 1 64 0.86 1.32 0.65 4 1364 '06-07
224876 0 40 0.84 1.3 0.63 7 64 0.9 1.31 0.62 4 1364 '06-07
224924 5 64 1.4 1.28 0.67 6 64 1.36 1.28 0.66 4 1364 '06-07
225078 0 52 0.38 0.49 0.17 2 51 0.41 0.49 0.21 1 1364 '06-07
225078 0 52 0.38 0.49 0.17 8 51 0.42 0.49 0.23 1 1364 '06-07
225135 5 19 0.75 0.82 0.53 6 19 0.69 0.86 0.47 2 1364 '06-07
228094 0 53 0.61 0.49 0.34 6 49 0.58 0.49 0.36 1 1364 '06-07
228103 5 51 0.32 0.46 0.22 1 51 0.33 0.47 0.24 1 1364 '06-07
228103 5 51 0.32 0.46 0.22 7 51 0.34 0.48 0.22 1 1364 '06-07
233831 0 32 0.33 0.47 0.48 6 9 0.35 0.48 0.52 1 1364 '06-07
234445 5 28 0.46 0.5 0.4 3 51 0.45 0.5 0.43 1 1364 '06-07
234445 5 28 0.46 0.5 0.4 9 51 0.46 0.5 0.44 1 1364 '06-07
234452 8 28 0.85 0.36 0.4 2 49 0.88 0.33 0.42 1 1364 '06-07
234452 2 28 0.85 0.36 0.42 8 49 0.87 0.34 0.41 1 1364 '06-07
234455 7 39 0.56 0.56 0.38 5 61 0.56 0.56 0.41 2 1364 '06-07
234455 1 39 0.56 0.57 0.4 5 61 0.56 0.56 0.41 2 1364 '06-07
234459 9 16 0.31 0.46 0.29 2 16 0.55 0.5 0.31 1 1364 '06-07
234459 3 16 0.31 0.46 0.29 8 16 0.56 0.5 0.34 1 1364 '06-07
255899 1 19 0.46 0.68 0.64 8 19 0.5 0.7 0.65 2 1364 '06-07
255974 9 27 0.42 0.49 0.31 3 26 0.44 0.5 0.29 1 1364 '06-07
255974 3 27 0.42 0.49 0.31 9 26 0.43 0.5 0.3 1 1364 '06-07
255994 1 16 0.17 0.38 0.5 4 16 0.2 0.4 0.48 1 1364 '06-07
256055 4 8 0.34 0.47 0.29 4 9 0.34 0.47 0.31 1 1364 '06-07
256091 4 16 0.46 0.5 0.57 3 16 0.53 0.5 0.56 1 1364 '06-07
256091 4 16 0.46 0.5 0.57 9 16 0.54 0.5 0.55 1 1364 '06-07

Appendix D Equating Report 2007-08 NECAP Technical Report 71
Equating Math Grade 08
Item number oldform
Old position oldmean oldstd oldcorrwtotal form position mean std corrwtotal MAX
Old Contract
Old TestYear
199729 6 26 0.44 0.5 0.49 1 26 0.46 0.5 0.49 1 1364 '06-07
199729 6 26 0.44 0.5 0.49 7 26 0.47 0.5 0.5 1 1364 '06-07
199743 4 9 0.53 0.5 0.44 4 7 0.58 0.49 0.45 1 1364 '06-07
199744 8 51 0.44 0.5 0.38 2 7 0.5 0.5 0.36 1 1364 '06-07
199744 2 51 0.46 0.5 0.35 8 7 0.51 0.5 0.37 1 1364 '06-07
199747 0 41 0.33 0.59 0.35 3 61 0.35 0.6 0.34 2 1364 '06-07
199747 0 41 0.33 0.59 0.35 9 61 0.3 0.59 0.34 2 1364 '06-07
199755 0 44 0.8 0.4 0.47 4 49 0.8 0.4 0.5 1 1364 '06-07
199756 4 26 0.61 0.49 0.32 6 51 0.6 0.49 0.32 1 1364 '06-07
199761 1 7 0.59 0.49 0.5 2 9 0.59 0.49 0.5 1 1364 '06-07
199761 7 7 0.6 0.49 0.5 8 9 0.59 0.49 0.52 1 1364 '06-07
199762 4 16 0.68 0.47 0.51 1 16 0.64 0.48 0.52 1 1364 '06-07
199762 4 16 0.68 0.47 0.51 7 16 0.68 0.47 0.51 1 1364 '06-07
199767 8 36 0.62 0.48 0.61 5 36 0.65 0.48 0.59 1 1364 '06-07
199767 2 36 0.65 0.48 0.59 5 36 0.65 0.48 0.59 1 1364 '06-07
199780 0 43 0.95 0.85 0.5 6 39 1.18 0.82 0.49 2 1364 '06-07
199783 4 39 0.64 0.55 0.43 1 61 0.71 0.52 0.41 2 1364 '06-07
199783 4 39 0.64 0.55 0.43 7 61 0.71 0.53 0.36 2 1364 '06-07
206221 8 28 0.52 0.5 0.36 6 49 0.5 0.5 0.34 1 1364 '06-07
206221 2 28 0.51 0.5 0.37 6 49 0.5 0.5 0.34 1 1364 '06-07
206224 3 7 0.49 0.5 0.36 3 7 0.49 0.5 0.41 1 1364 '06-07
206224 9 7 0.48 0.5 0.37 9 7 0.51 0.5 0.39 1 1364 '06-07
206225 4 7 0.43 0.5 0.21 5 9 0.42 0.49 0.2 1 1364 '06-07
206229 0 5 0.44 0.5 0.27 3 9 0.45 0.5 0.24 1 1364 '06-07
206229 0 5 0.44 0.5 0.27 9 9 0.46 0.5 0.23 1 1364 '06-07
206237 9 16 0.63 0.48 0.45 4 16 0.67 0.47 0.47 1 1364 '06-07
206237 3 16 0.64 0.48 0.46 4 16 0.67 0.47 0.47 1 1364 '06-07
206240 8 19 1.25 0.9 0.57 4 19 1.36 0.87 0.56 2 1364 '06-07
206240 2 19 1.25 0.89 0.59 4 19 1.36 0.87 0.56 2 1364 '06-07
206245 0 18 1.19 1.42 0.67 2 20 1.12 1.36 0.65 4 1364 '06-07
206245 0 18 1.19 1.42 0.67 8 20 1.14 1.36 0.65 4 1364 '06-07
206256 3 51 0.33 0.47 0.37 4 28 0.3 0.46 0.41 1 1364 '06-07
206256 9 51 0.32 0.47 0.38 4 28 0.3 0.46 0.41 1 1364 '06-07
206266 3 49 0.41 0.49 0.36 1 49 0.39 0.49 0.33 1 1364 '06-07
206266 9 49 0.42 0.49 0.34 7 49 0.39 0.49 0.32 1 1364 '06-07
206270 1 26 0.21 0.41 0.22 3 49 0.22 0.42 0.28 1 1364 '06-07
206270 7 26 0.2 0.4 0.22 9 49 0.21 0.41 0.28 1 1364 '06-07
206284 0 23 0.52 0.5 0.52 2 28 0.54 0.5 0.55 1 1364 '06-07
206284 0 23 0.52 0.5 0.52 8 28 0.56 0.5 0.54 1 1364 '06-07
206293 5 28 0.72 0.45 0.36 1 28 0.73 0.45 0.4 1 1364 '06-07
206293 5 28 0.72 0.45 0.36 7 28 0.74 0.44 0.36 1 1364 '06-07
206295 0 22 0.83 0.38 0.38 6 26 0.82 0.38 0.4 1 1364 '06-07

Appendix D Equating Report 2007-08 NECAP Technical Report 72
Equating Math Grade 08
Item number oldform
Old position oldmean oldstd oldcorrwtotal form position mean std corrwtotal MAX
Old Contract
Old TestYear
206296 6 9 0.69 0.46 0.52 5 51 0.71 0.46 0.54 1 1364 '06-07
206310 5 49 0.46 0.5 0.38 5 26 0.44 0.5 0.39 1 1364 '06-07
206313 0 37 0.36 0.48 0.52 6 38 0.42 0.49 0.47 1 1364 '06-07
206331 6 20 2.02 1.11 0.63 5 20 2.1 1.16 0.61 4 1364 '06-07
206337 4 51 0.56 0.5 0.35 5 7 0.6 0.49 0.36 1 1364 '06-07
224853 0 24 0.33 0.47 0.18 3 26 0.35 0.48 0.21 1 1364 '06-07
224853 0 24 0.33 0.47 0.18 9 26 0.33 0.47 0.22 1 1364 '06-07
224878 0 2 0.34 0.47 0.24 1 7 0.42 0.49 0.33 1 1364 '06-07
224878 0 2 0.34 0.47 0.24 7 7 0.44 0.5 0.32 1 1364 '06-07
224881 0 53 0.48 0.5 0.26 3 28 0.52 0.5 0.27 1 1364 '06-07
224881 0 53 0.48 0.5 0.26 9 28 0.53 0.5 0.28 1 1364 '06-07
224891 0 29 0.33 0.47 0.43 4 26 0.31 0.46 0.43 1 1364 '06-07
224919 7 9 0.5 0.5 0.49 6 7 0.58 0.49 0.49 1 1364 '06-07
224919 1 9 0.5 0.5 0.49 6 7 0.58 0.49 0.49 1 1364 '06-07
225437 9 38 0.23 0.42 0.52 2 36 0.25 0.43 0.49 1 1364 '06-07
225437 3 38 0.23 0.42 0.49 8 36 0.24 0.43 0.48 1 1364 '06-07
226556 7 28 0.64 0.48 0.49 6 28 0.64 0.48 0.51 1 1364 '06-07
226556 1 28 0.65 0.48 0.47 6 28 0.64 0.48 0.51 1 1364 '06-07
226573 8 49 0.52 0.5 0.41 3 51 0.56 0.5 0.44 1 1364 '06-07
226573 2 49 0.53 0.5 0.39 9 51 0.58 0.49 0.42 1 1364 '06-07
233602 5 51 0.53 0.5 0.4 2 51 0.52 0.5 0.42 1 1364 '06-07
233602 5 51 0.53 0.5 0.4 8 51 0.52 0.5 0.42 1 1364 '06-07
233609 9 64 1.13 0.94 0.6 1 64 1.08 0.96 0.57 4 1364 '06-07
233609 3 64 1.16 0.95 0.6 7 64 1.1 0.92 0.56 4 1364 '06-07
233719 9 61 1.37 0.87 0.54 5 61 1.4 0.84 0.54 2 1364 '06-07
233719 3 61 1.4 0.86 0.52 5 61 1.4 0.84 0.54 2 1364 '06-07
234148 6 61 0.65 0.65 0.61 2 61 0.67 0.6 0.55 2 1364 '06-07
234148 6 61 0.65 0.65 0.61 8 61 0.67 0.6 0.55 2 1364 '06-07
234523 5 7 0.73 0.45 0.45 6 9 0.74 0.44 0.46 1 1364 '06-07
234524 7 49 0.53 0.5 0.37 2 49 0.46 0.5 0.29 1 1364 '06-07
234524 1 49 0.5 0.5 0.36 8 49 0.46 0.5 0.28 1 1364 '06-07
242395 5 26 0.49 0.5 0.43 5 28 0.49 0.5 0.48 1 1364 '06-07
242401 6 51 0.53 0.5 0.43 1 51 0.55 0.5 0.44 1 1364 '06-07
242401 6 51 0.53 0.5 0.43 7 51 0.57 0.5 0.46 1 1364 '06-07
256309 1 16 0.16 0.37 0.4 6 36 0.35 0.48 0.49 1 1364 '06-07
256511 5 27 0.71 0.45 0.28 2 26 0.72 0.45 0.27 1 1364 '06-07
256511 5 27 0.71 0.45 0.28 8 26 0.72 0.45 0.26 1 1364 '06-07
260926 8 64 1.35 1.23 0.69 6 20 1.29 1.19 0.67 4 1364 '06-07
260926 2 64 1.37 1.2 0.69 6 20 1.29 1.19 0.67 4 1364 '06-07

Appendix D Equating Report 2007-08 NECAP Technical Report 73
Equating Reading Grade 03
Item number oldform
Old position oldmean oldstd oldcorrwtotal form position mean std corrwtotal MAX
Old Contract
Old TestYear
201747 3 21 0.8 0.4 0.53 3 21 0.79 0.41 0.53 1 1364 '06-07
201748 3 23 0.71 0.45 0.47 3 23 0.73 0.44 0.44 1 1364 '06-07
201763 3 22 0.84 0.37 0.53 3 22 0.87 0.34 0.53 1 1364 '06-07
201764 3 24 2.07 1.34 0.58 3 24 2.28 1.39 0.61 4 1364 '06-07
201825 1 42 0.56 0.5 0.53 1 42 0.62 0.49 0.53 1 1364 '06-07
201830 1 44 0.66 0.47 0.52 1 44 0.68 0.47 0.5 1 1364 '06-07
201831 1 45 0.88 0.32 0.47 1 45 0.89 0.31 0.46 1 1364 '06-07
201836 1 48 0.66 0.47 0.36 1 48 0.69 0.46 0.36 1 1364 '06-07
202178 2 21 0.76 0.43 0.56 2 21 0.75 0.43 0.54 1 1364 '06-07
202179 2 20 0.82 0.38 0.4 2 20 0.84 0.37 0.4 1 1364 '06-07
202180 2 22 0.71 0.45 0.45 2 22 0.75 0.44 0.43 1 1364 '06-07
202183 2 23 0.77 0.42 0.39 2 23 0.79 0.41 0.39 1 1364 '06-07
202194 3 18 0.89 0.31 0.46 3 18 0.9 0.3 0.5 1 1364 '06-07
205940 1 46 2.29 1.27 0.61 1 46 2.41 1.29 0.57 4 1364 '06-07
225214 3 42 0.7 0.46 0.32 3 42 0.72 0.45 0.32 1 1364 '06-07
225216 3 43 0.75 0.43 0.57 3 43 0.78 0.42 0.6 1 1364 '06-07
225218 3 44 0.8 0.4 0.5 3 44 0.81 0.39 0.53 1 1364 '06-07
225220 3 45 0.77 0.42 0.49 3 45 0.77 0.42 0.52 1 1364 '06-07
225230 3 47 0.49 0.5 0.31 3 47 0.48 0.5 0.32 1 1364 '06-07
225233 3 49 0.73 0.45 0.5 3 49 0.73 0.44 0.5 1 1364 '06-07
225237 3 48 0.7 0.46 0.46 3 48 0.69 0.46 0.44 1 1364 '06-07
225240 3 50 0.67 0.47 0.5 3 50 0.66 0.47 0.52 1 1364 '06-07
225242 3 46 3.47 0.94 0.58 3 46 3.52 0.88 0.58 4 1364 '06-07
225253 3 51 1.93 1.11 0.58 3 51 1.81 1.07 0.58 4 1364 '06-07
226283 3 19 0.84 0.37 0.37 3 19 0.86 0.35 0.41 1 1364 '06-07
226289 2 19 0.85 0.35 0.48 2 19 0.83 0.38 0.49 1 1364 '06-07
226290 1 19 0.87 0.34 0.55 1 19 0.86 0.35 0.56 1 1364 '06-07
230973 2 24 1.77 1.13 0.53 2 24 1.83 1.12 0.51 4 1364 '06-07
230976 1 43 0.6 0.49 0.36 1 43 0.63 0.48 0.38 1 1364 '06-07
230977 1 47 0.58 0.49 0.36 1 47 0.58 0.49 0.36 1 1364 '06-07
230978 1 49 0.56 0.5 0.28 1 49 0.55 0.5 0.27 1 1364 '06-07
230979 1 50 0.77 0.42 0.4 1 50 0.82 0.38 0.41 1 1364 '06-07
230980 1 51 1.48 1.06 0.6 1 51 1.51 1.09 0.58 4 1364 '06-07
230988 3 20 0.74 0.44 0.54 3 20 0.74 0.44 0.52 1 1364 '06-07
255324 6 42 0.73 0.45 0.27 2 42 0.75 0.43 0.24 1 1364 '06-07
255326 6 43 0.66 0.47 0.46 2 43 0.7 0.46 0.47 1 1364 '06-07
255326 4 43 0.65 0.48 0.45 2 43 0.7 0.46 0.47 1 1364 '06-07
255327 6 44 0.76 0.43 0.4 2 44 0.77 0.42 0.35 1 1364 '06-07
255328 6 47 0.79 0.41 0.47 2 47 0.82 0.39 0.45 1 1364 '06-07
255328 4 47 0.78 0.41 0.49 2 47 0.82 0.39 0.45 1 1364 '06-07
255331 6 48 0.6 0.49 0.32 2 48 0.6 0.49 0.3 1 1364 '06-07
255333 6 49 0.57 0.5 0.37 2 49 0.54 0.5 0.33 1 1364 '06-07

Appendix D Equating Report 2007-08 NECAP Technical Report 74
Equating Reading Grade 03
Item number oldform
Old position oldmean oldstd oldcorrwtotal form position mean std corrwtotal MAX
Old Contract
Old TestYear
255334 6 50 0.76 0.43 0.43 2 50 0.69 0.46 0.37 1 1364 '06-07
255334 4 50 0.75 0.44 0.48 2 50 0.69 0.46 0.37 1 1364 '06-07
255335 6 45 0.9 0.3 0.5 2 45 0.9 0.3 0.51 1 1364 '06-07
255335 4 44 0.89 0.31 0.51 2 45 0.9 0.3 0.51 1 1364 '06-07
255336 6 51 2.16 1.2 0.56 2 51 2.22 1.2 0.53 4 1364 '06-07
255338 4 46 3.13 1.33 0.66 2 46 3.11 1.27 0.65 4 1364 '06-07
255536 8 19 0.55 0.5 0.39 1 18 0.57 0.5 0.42 1 1364 '06-07
255545 7 19 0.55 0.5 0.21 2 18 0.54 0.5 0.21 1 1364 '06-07

Appendix D Equating Report 2007-08 NECAP Technical Report 75
Equating Reading Grade 04
Item number oldform
Old position oldmean oldstd oldcorrwtotal form position mean std corrwtotal MAX
Old Contract
Old TestYear
200820 1 20 0.74 0.44 0.46 1 20 0.72 0.45 0.49 1 1364 '06-07
200822 1 21 0.81 0.39 0.41 1 21 0.82 0.39 0.43 1 1364 '06-07
200830 1 22 0.72 0.45 0.5 1 22 0.7 0.46 0.49 1 1364 '06-07
200843 1 24 2.27 1.35 0.56 1 24 2.5 1.32 0.58 4 1364 '06-07
203740 3 42 0.63 0.48 0.47 3 42 0.65 0.48 0.45 1 1364 '06-07
203743 3 44 0.55 0.5 0.39 3 43 0.57 0.49 0.46 1 1364 '06-07
203758 3 48 0.64 0.48 0.4 3 48 0.62 0.48 0.43 1 1364 '06-07
203768 3 51 1.54 1.1 0.48 3 51 1.63 1.14 0.42 4 1364 '06-07
203801 2 20 0.82 0.39 0.35 2 20 0.81 0.39 0.39 1 1364 '06-07
203806 2 22 0.77 0.42 0.46 2 22 0.76 0.43 0.43 1 1364 '06-07
203810 2 24 2.77 1.28 0.61 2 24 2.78 1.26 0.6 4 1364 '06-07
203858 2 43 0.52 0.5 0.28 2 43 0.52 0.5 0.27 1 1364 '06-07
203862 2 42 0.83 0.37 0.53 2 42 0.85 0.36 0.47 1 1364 '06-07
203871 2 50 0.54 0.5 0.3 2 50 0.53 0.5 0.26 1 1364 '06-07
203873 2 51 2.54 0.96 0.53 2 51 2.45 0.94 0.5 4 1364 '06-07
203890 1 23 0.9 0.3 0.4 1 23 0.92 0.28 0.44 1 1364 '06-07
203906 2 18 0.84 0.37 0.43 1 18 0.81 0.39 0.33 1 1364 '06-07
203922 1 18 0.8 0.4 0.34 1 19 0.79 0.4 0.34 1 1364 '06-07
203925 3 19 0.65 0.48 0.37 3 19 0.67 0.47 0.38 1 1364 '06-07
225764 1 42 0.79 0.41 0.5 1 42 0.79 0.41 0.48 1 1364 '06-07
225765 1 43 0.79 0.41 0.41 1 43 0.8 0.4 0.41 1 1364 '06-07
225766 1 44 0.64 0.48 0.38 1 44 0.62 0.48 0.42 1 1364 '06-07
225767 1 45 0.6 0.49 0.53 1 45 0.61 0.49 0.49 1 1364 '06-07
225769 1 47 0.63 0.48 0.51 1 47 0.63 0.48 0.54 1 1364 '06-07
225770 1 48 0.46 0.5 0.35 1 48 0.46 0.5 0.34 1 1364 '06-07
225772 1 49 0.72 0.45 0.51 1 49 0.72 0.45 0.52 1 1364 '06-07
225773 1 50 0.66 0.47 0.42 1 50 0.69 0.46 0.43 1 1364 '06-07
225776 1 46 2.29 1.05 0.43 1 46 2.34 1.07 0.47 4 1364 '06-07
225778 1 51 1.56 0.94 0.58 1 51 1.53 1 0.57 4 1364 '06-07
232524 2 21 0.37 0.48 0.31 2 21 0.4 0.49 0.3 1 1364 '06-07
232526 2 44 0.69 0.46 0.45 2 44 0.7 0.46 0.43 1 1364 '06-07
232528 2 46 2.82 1.42 0.48 2 46 2.67 1.5 0.45 4 1364 '06-07
232529 2 47 0.81 0.39 0.42 2 47 0.8 0.4 0.42 1 1364 '06-07
232530 2 48 0.66 0.47 0.48 2 48 0.66 0.47 0.46 1 1364 '06-07
232542 2 49 0.77 0.42 0.52 2 49 0.78 0.42 0.48 1 1364 '06-07
232569 2 19 0.85 0.35 0.53 2 19 0.85 0.36 0.49 1 1364 '06-07
232589 3 43 0.56 0.5 0.37 3 44 0.57 0.5 0.42 1 1364 '06-07
232592 3 45 0.44 0.5 0.23 3 47 0.48 0.5 0.27 1 1364 '06-07
232595 3 46 2.11 1.16 0.39 3 46 2.25 1.17 0.42 4 1364 '06-07
232647 3 47 0.53 0.5 0.33 3 45 0.51 0.5 0.32 1 1364 '06-07
232657 3 49 0.71 0.45 0.39 3 50 0.7 0.46 0.37 1 1364 '06-07
232664 3 50 0.84 0.37 0.5 3 49 0.83 0.37 0.49 1 1364 '06-07

Appendix D Equating Report 2007-08 NECAP Technical Report 76
Equating Reading Grade 04
Item number oldform
Old position oldmean oldstd oldcorrwtotal form position mean std corrwtotal MAX
Old Contract
Old TestYear
234353 2 23 0.69 0.46 0.42 2 23 0.68 0.46 0.42 1 1364 '06-07
243661 2 45 0.78 0.41 0.41 2 45 0.8 0.4 0.38 1 1364 '06-07
255633 6 18 0.65 0.48 0.36 3 18 0.7 0.46 0.4 1 1364 '06-07
255637 7 19 0.68 0.47 0.36 2 18 0.65 0.48 0.4 1 1364 '06-07

Appendix D Equating Report 2007-08 NECAP Technical Report 77
Equating Reading Grade 05
Item number oldform
Old position oldmean oldstd oldcorrwtotal form position mean std corrwtotal MAX
Old Contract
Old TestYear
201746 1 20 0.89 0.31 0.34 2 20 0.9 0.3 0.26 1 1364 '06-07
201752 1 22 0.46 0.5 0.27 2 22 0.48 0.5 0.26 1 1364 '06-07
201757 1 23 0.64 0.48 0.36 2 23 0.63 0.48 0.37 1 1364 '06-07
201760 1 21 0.48 0.5 0.31 2 21 0.44 0.5 0.33 1 1364 '06-07
201769 1 24 1.9 1.06 0.64 2 24 1.86 1.04 0.66 4 1364 '06-07
201902 3 20 0.64 0.48 0.3 3 20 0.64 0.48 0.28 1 1364 '06-07
201904 3 22 0.77 0.42 0.22 3 22 0.77 0.42 0.24 1 1364 '06-07
201906 3 21 0.74 0.44 0.55 3 21 0.74 0.44 0.48 1 1364 '06-07
201911 3 24 1.68 0.97 0.66 3 24 1.83 0.95 0.66 4 1364 '06-07
201923 2 20 0.81 0.39 0.37 1 20 0.8 0.4 0.37 1 1364 '06-07
201924 2 21 0.76 0.43 0.49 1 21 0.76 0.43 0.49 1 1364 '06-07
201928 2 22 0.65 0.48 0.49 1 22 0.65 0.48 0.47 1 1364 '06-07
201937 2 24 1.75 1.13 0.64 1 24 1.78 1.07 0.65 4 1364 '06-07
202056 1 43 0.68 0.47 0.36 1 43 0.72 0.45 0.36 1 1364 '06-07
202059 1 44 0.72 0.45 0.45 1 44 0.73 0.45 0.44 1 1364 '06-07
202061 1 47 0.52 0.5 0.43 1 47 0.53 0.5 0.44 1 1364 '06-07
202063 1 45 0.74 0.44 0.55 1 45 0.73 0.44 0.51 1 1364 '06-07
202065 1 49 0.61 0.49 0.47 1 49 0.61 0.49 0.46 1 1364 '06-07
202069 1 50 0.56 0.5 0.43 1 50 0.56 0.5 0.4 1 1364 '06-07
202072 1 46 1.56 1 0.68 1 46 1.62 1.01 0.66 4 1364 '06-07
202075 1 51 1.73 0.87 0.59 1 51 1.79 0.91 0.58 4 1364 '06-07
226477 3 42 0.82 0.38 0.42 3 42 0.82 0.39 0.39 1 1364 '06-07
226487 3 43 0.6 0.49 0.41 3 43 0.62 0.49 0.42 1 1364 '06-07
226490 3 44 0.57 0.49 0.19 3 44 0.6 0.49 0.19 1 1364 '06-07
226498 3 45 0.83 0.38 0.38 3 45 0.81 0.39 0.35 1 1364 '06-07
226500 3 47 0.75 0.43 0.48 3 47 0.73 0.44 0.48 1 1364 '06-07
226502 3 48 0.82 0.38 0.54 3 48 0.81 0.39 0.5 1 1364 '06-07
226508 3 50 0.68 0.47 0.34 3 50 0.68 0.47 0.31 1 1364 '06-07
226510 3 49 0.57 0.5 0.27 3 49 0.59 0.49 0.26 1 1364 '06-07
226515 3 46 1.4 1.02 0.66 3 46 1.39 0.99 0.67 4 1364 '06-07
226517 3 51 1.64 0.96 0.63 3 51 1.66 0.91 0.59 4 1364 '06-07
226597 3 19 0.79 0.41 0.43 3 19 0.77 0.42 0.38 1 1364 '06-07
226598 2 19 0.73 0.44 0.37 2 19 0.74 0.44 0.39 1 1364 '06-07
226599 2 18 0.72 0.45 0.44 2 18 0.8 0.4 0.46 1 1364 '06-07
226600 3 18 0.81 0.39 0.42 3 18 0.78 0.41 0.34 1 1364 '06-07
227093 1 42 0.62 0.49 0.33 1 42 0.65 0.48 0.31 1 1364 '06-07
230632 2 23 0.85 0.36 0.44 1 23 0.83 0.38 0.47 1 1364 '06-07
230723 3 23 0.46 0.5 0.34 3 23 0.48 0.5 0.33 1 1364 '06-07
233190 1 48 0.72 0.45 0.48 1 48 0.73 0.44 0.48 1 1364 '06-07
256354 5 44 0.59 0.49 0.25 2 44 0.58 0.49 0.27 1 1364 '06-07
256359 7 45 0.91 0.29 0.4 2 45 0.89 0.31 0.44 1 1364 '06-07
256368 7 49 0.72 0.45 0.41 2 42 0.67 0.47 0.44 1 1364 '06-07
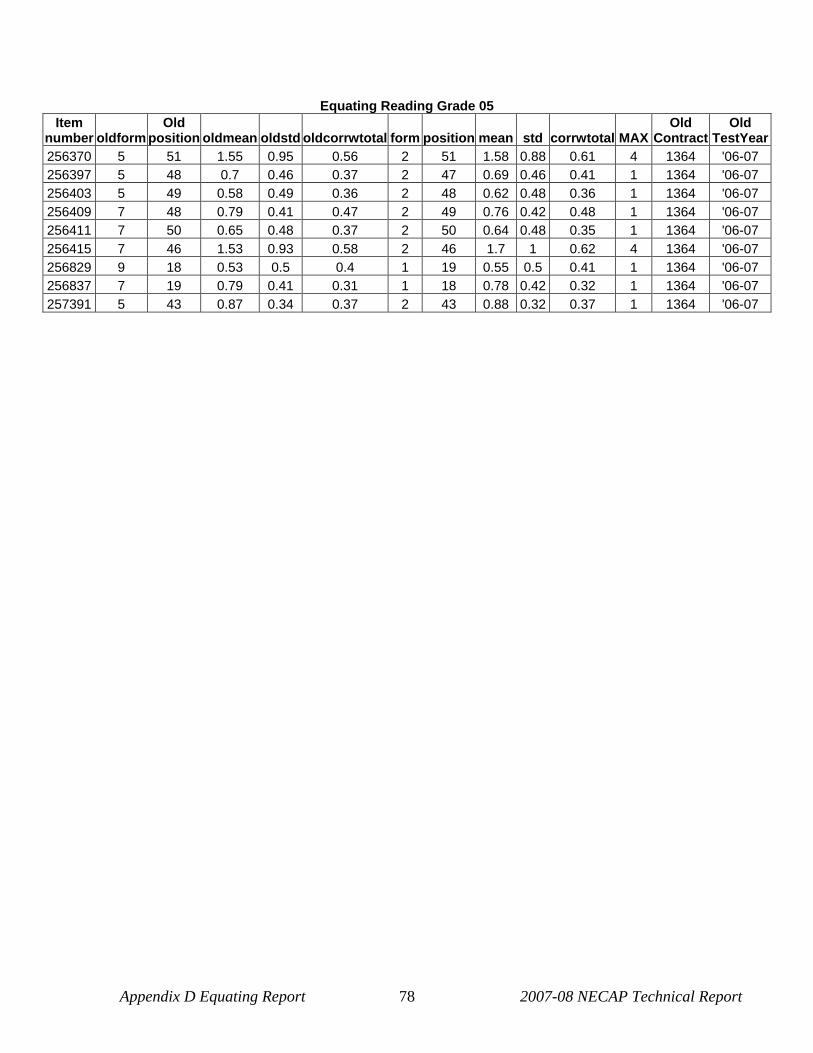
Appendix D Equating Report 2007-08 NECAP Technical Report 78
Equating Reading Grade 05
Item number oldform
Old position oldmean oldstd oldcorrwtotal form position mean std corrwtotal MAX
Old Contract
Old TestYear
256370 5 51 1.55 0.95 0.56 2 51 1.58 0.88 0.61 4 1364 '06-07
256397 5 48 0.7 0.46 0.37 2 47 0.69 0.46 0.41 1 1364 '06-07
256403 5 49 0.58 0.49 0.36 2 48 0.62 0.48 0.36 1 1364 '06-07
256409 7 48 0.79 0.41 0.47 2 49 0.76 0.42 0.48 1 1364 '06-07
256411 7 50 0.65 0.48 0.37 2 50 0.64 0.48 0.35 1 1364 '06-07
256415 7 46 1.53 0.93 0.58 2 46 1.7 1 0.62 4 1364 '06-07
256829 9 18 0.53 0.5 0.4 1 19 0.55 0.5 0.41 1 1364 '06-07
256837 7 19 0.79 0.41 0.31 1 18 0.78 0.42 0.32 1 1364 '06-07
257391 5 43 0.87 0.34 0.37 2 43 0.88 0.32 0.37 1 1364 '06-07

Appendix D Equating Report 2007-08 NECAP Technical Report 79
Equating Reading Grade 06
Item number oldform
Old position oldmean oldstd oldcorrwtotal form position mean std corrwtotal MAX
Old Contract
Old TestYear
200339 1 21 0.51 0.5 0.34 2 21 0.54 0.5 0.33 1 1364 '06-07
200342 1 22 0.65 0.48 0.4 2 22 0.65 0.48 0.38 1 1364 '06-07
200345 1 23 0.76 0.43 0.47 2 23 0.75 0.43 0.44 1 1364 '06-07
200348 1 24 2.03 1.03 0.64 2 24 2.02 1.02 0.64 4 1364 '06-07
204009 2 43 0.85 0.36 0.52 2 43 0.86 0.34 0.52 1 1364 '06-07
204011 2 49 0.9 0.3 0.5 2 49 0.9 0.3 0.46 1 1364 '06-07
204013 2 44 0.76 0.43 0.5 2 44 0.78 0.42 0.48 1 1364 '06-07
204014 2 45 0.86 0.35 0.52 2 45 0.87 0.34 0.48 1 1364 '06-07
204017 2 50 0.93 0.26 0.41 2 50 0.91 0.28 0.4 1 1364 '06-07
204020 2 48 0.75 0.43 0.43 2 48 0.74 0.44 0.44 1 1364 '06-07
204021 2 47 0.55 0.5 0.38 2 47 0.6 0.49 0.36 1 1364 '06-07
204022 2 51 1.85 0.96 0.62 2 51 1.83 0.95 0.64 4 1364 '06-07
204026 2 46 2.05 0.93 0.58 2 46 1.94 0.91 0.65 4 1364 '06-07
204262 1 42 0.65 0.48 0.45 1 42 0.63 0.48 0.43 1 1364 '06-07
204266 1 45 0.71 0.45 0.4 1 45 0.72 0.45 0.4 1 1364 '06-07
204271 1 43 0.5 0.5 0.46 1 43 0.51 0.5 0.42 1 1364 '06-07
204274 1 44 0.71 0.45 0.5 1 44 0.73 0.44 0.52 1 1364 '06-07
204278 1 47 0.65 0.48 0.41 1 47 0.65 0.48 0.39 1 1364 '06-07
204283 1 48 0.61 0.49 0.46 1 48 0.62 0.49 0.45 1 1364 '06-07
204284 1 49 0.71 0.46 0.47 1 49 0.71 0.45 0.46 1 1364 '06-07
204287 1 50 0.6 0.49 0.49 1 50 0.61 0.49 0.49 1 1364 '06-07
204294 1 46 1.53 0.96 0.62 1 46 1.51 0.93 0.66 4 1364 '06-07
204298 1 51 1.47 1.03 0.67 1 51 1.5 1.01 0.64 4 1364 '06-07
204474 3 18 0.7 0.46 0.18 1 18 0.68 0.47 0.19 1 1364 '06-07
204479 1 19 0.57 0.49 0.21 2 18 0.64 0.48 0.19 1 1364 '06-07
204491 3 19 0.6 0.49 0.39 1 19 0.63 0.48 0.41 1 1364 '06-07
226657 3 23 0.69 0.46 0.4 1 23 0.69 0.46 0.43 1 1364 '06-07
226659 3 20 0.7 0.46 0.37 1 20 0.7 0.46 0.39 1 1364 '06-07
226667 3 22 0.94 0.23 0.36 1 22 0.94 0.23 0.29 1 1364 '06-07
226669 3 24 1.83 0.87 0.58 1 24 1.79 0.89 0.61 4 1364 '06-07
226697 3 42 0.7 0.46 0.47 3 42 0.76 0.43 0.46 1 1364 '06-07
226699 3 43 0.87 0.34 0.43 3 43 0.89 0.31 0.4 1 1364 '06-07
226702 3 44 0.79 0.41 0.43 3 44 0.79 0.41 0.39 1 1364 '06-07
226719 3 45 0.84 0.37 0.5 3 45 0.86 0.35 0.47 1 1364 '06-07
226722 3 47 0.66 0.47 0.42 3 47 0.67 0.47 0.37 1 1364 '06-07
226723 3 48 0.89 0.31 0.51 3 48 0.89 0.32 0.45 1 1364 '06-07
226725 3 50 0.76 0.43 0.49 3 50 0.77 0.42 0.48 1 1364 '06-07
226728 3 49 0.78 0.41 0.44 3 49 0.79 0.41 0.43 1 1364 '06-07
226730 3 46 1.8 1 0.62 3 46 1.72 0.99 0.61 4 1364 '06-07
226735 3 51 1.56 1.05 0.63 3 51 1.53 0.95 0.64 4 1364 '06-07
226737 2 18 0.88 0.32 0.42 2 19 0.9 0.3 0.42 1 1364 '06-07
227775 1 20 0.83 0.38 0.41 2 20 0.83 0.38 0.43 1 1364 '06-07

Appendix D Equating Report 2007-08 NECAP Technical Report 80
Equating Reading Grade 06
Item number oldform
Old position oldmean oldstd oldcorrwtotal form position mean std corrwtotal MAX
Old Contract
Old TestYear
227780 2 42 0.84 0.37 0.53 2 42 0.85 0.36 0.53 1 1364 '06-07
230176 3 21 0.89 0.32 0.38 1 21 0.88 0.33 0.37 1 1364 '06-07
256334 5 20 0.71 0.45 0.39 3 20 0.74 0.44 0.41 1 1364 '06-07
256337 7 21 0.86 0.34 0.39 3 21 0.86 0.35 0.37 1 1364 '06-07
256342 5 23 0.82 0.38 0.32 3 22 0.81 0.39 0.31 1 1364 '06-07
256346 7 23 0.54 0.5 0.2 3 23 0.53 0.5 0.2 1 1364 '06-07
256347 5 24 1.62 0.89 0.53 3 24 1.72 0.82 0.55 4 1364 '06-07
256651 7 19 0.54 0.5 0.34 3 19 0.57 0.5 0.31 1 1364 '06-07
256674 4 18 0.61 0.49 0.26 3 18 0.62 0.49 0.26 1 1364 '06-07

Appendix D Equating Report 2007-08 NECAP Technical Report 81
Equating Reading Grade 07
Item number oldform
Old position oldmean oldstd oldcorrwtotal form position mean std corrwtotal MAX
Old Contract
Old TestYear
199526 2 42 0.64 0.48 0.21 2 42 0.66 0.47 0.14 1 1364 '06-07
199527 2 43 0.67 0.47 0.31 2 43 0.7 0.46 0.29 1 1364 '06-07
199528 2 44 0.68 0.47 0.45 2 44 0.67 0.47 0.41 1 1364 '06-07
199529 2 47 0.78 0.42 0.48 2 47 0.77 0.42 0.46 1 1364 '06-07
199530 2 45 0.48 0.5 0.38 2 45 0.52 0.5 0.4 1 1364 '06-07
199531 2 48 0.71 0.45 0.45 2 48 0.74 0.44 0.45 1 1364 '06-07
199532 2 49 0.72 0.45 0.5 2 49 0.76 0.43 0.49 1 1364 '06-07
199533 2 50 0.84 0.37 0.5 2 50 0.86 0.34 0.49 1 1364 '06-07
199535 2 46 1.83 0.96 0.69 2 46 1.86 0.93 0.63 4 1364 '06-07
199536 2 51 1.84 0.92 0.62 2 51 2.07 0.92 0.59 4 1364 '06-07
199562 3 21 0.76 0.43 0.42 3 21 0.79 0.41 0.42 1 1364 '06-07
199563 3 20 0.69 0.46 0.35 3 20 0.7 0.46 0.29 1 1364 '06-07
199565 3 22 0.87 0.33 0.41 3 22 0.87 0.33 0.45 1 1364 '06-07
199568 3 23 0.59 0.49 0.29 3 23 0.59 0.49 0.26 1 1364 '06-07
199569 3 24 2.01 0.91 0.61 3 24 2.16 1 0.6 4 1364 '06-07
199597 1 42 0.45 0.5 0.23 1 42 0.46 0.5 0.25 1 1364 '06-07
199598 1 44 0.85 0.36 0.43 1 43 0.86 0.35 0.42 1 1364 '06-07
199599 1 45 0.86 0.35 0.4 1 44 0.87 0.34 0.41 1 1364 '06-07
199603 1 48 0.54 0.5 0.37 1 47 0.57 0.5 0.35 1 1364 '06-07
199604 1 49 0.81 0.39 0.45 1 48 0.82 0.39 0.51 1 1364 '06-07
199605 1 50 0.78 0.42 0.49 1 49 0.77 0.42 0.51 1 1364 '06-07
199608 1 51 1.81 1.07 0.58 1 51 1.98 1.07 0.61 4 1364 '06-07
199609 1 46 1.71 0.94 0.64 1 46 1.82 0.95 0.63 4 1364 '06-07
201466 3 49 0.7 0.46 0.35 3 49 0.73 0.44 0.4 1 1364 '06-07
201468 3 42 0.82 0.38 0.5 3 42 0.84 0.37 0.5 1 1364 '06-07
201470 3 48 0.89 0.31 0.39 3 48 0.91 0.28 0.42 1 1364 '06-07
201472 3 43 0.79 0.4 0.38 3 43 0.83 0.38 0.4 1 1364 '06-07
201476 3 44 0.84 0.37 0.56 3 44 0.86 0.35 0.55 1 1364 '06-07
201479 3 47 0.74 0.44 0.47 3 47 0.74 0.44 0.49 1 1364 '06-07
201482 3 45 0.6 0.49 0.38 3 45 0.61 0.49 0.35 1 1364 '06-07
201487 3 50 0.89 0.32 0.39 3 50 0.91 0.29 0.41 1 1364 '06-07
201490 3 51 1.86 1 0.68 3 51 2.1 0.93 0.64 4 1364 '06-07
201492 3 46 1.75 1.04 0.69 3 46 1.92 1.01 0.6 4 1364 '06-07
201523 1 20 0.73 0.44 0.4 1 20 0.72 0.45 0.38 1 1364 '06-07
201529 1 21 0.61 0.49 0.37 1 21 0.63 0.48 0.36 1 1364 '06-07
201530 1 23 0.48 0.5 0.35 1 23 0.49 0.5 0.36 1 1364 '06-07
201532 1 22 0.79 0.41 0.43 1 22 0.8 0.4 0.41 1 1364 '06-07
201535 1 24 1.79 1.02 0.7 1 24 1.96 1.02 0.64 4 1364 '06-07
201648 2 18 0.72 0.45 0.31 3 18 0.73 0.45 0.36 1 1364 '06-07
226905 2 19 0.72 0.45 0.36 3 19 0.73 0.45 0.36 1 1364 '06-07
226906 3 18 0.63 0.48 0.35 2 18 0.64 0.48 0.39 1 1364 '06-07
233750 1 47 0.64 0.48 0.35 1 45 0.61 0.49 0.35 1 1364 '06-07

Appendix D Equating Report 2007-08 NECAP Technical Report 82
Equating Reading Grade 07
Item number oldform
Old position oldmean oldstd oldcorrwtotal form position mean std corrwtotal MAX
Old Contract
Old TestYear
256093 4 20 0.74 0.44 0.41 2 20 0.73 0.45 0.44 1 1364 '06-07
256096 4 21 0.87 0.34 0.37 2 21 0.86 0.35 0.4 1 1364 '06-07
256099 4 22 0.86 0.34 0.43 2 22 0.85 0.35 0.44 1 1364 '06-07
256100 6 22 0.47 0.5 0.29 2 23 0.47 0.5 0.29 1 1364 '06-07
256108 4 24 1.56 1.02 0.65 2 24 1.84 1.05 0.64 4 1364 '06-07
256172 6 19 0.89 0.31 0.37 1 19 0.88 0.32 0.41 1 1364 '06-07
256176 5 19 0.82 0.39 0.26 2 19 0.83 0.38 0.34 1 1364 '06-07
256189 5 18 0.91 0.28 0.29 1 18 0.91 0.29 0.34 1 1364 '06-07

Appendix D Equating Report 2007-08 NECAP Technical Report 83
Equating Reading Grade 08
Item number oldform
Old position oldmean oldstd oldcorrwtotal form position mean std corrwtotal MAX
Old Contract
Old TestYear
199665 3 47 0.67 0.47 0.51 3 47 0.68 0.47 0.5 1 1364 '06-07
199666 3 44 0.72 0.45 0.37 3 44 0.69 0.46 0.33 1 1364 '06-07
199668 3 45 0.84 0.37 0.44 3 45 0.84 0.37 0.41 1 1364 '06-07
199670 3 49 0.69 0.46 0.39 3 49 0.67 0.47 0.37 1 1364 '06-07
199671 3 50 0.44 0.5 0.27 3 50 0.46 0.5 0.27 1 1364 '06-07
199674 3 46 2.01 1.05 0.64 3 46 2.2 1.03 0.67 4 1364 '06-07
199675 3 51 2.27 1.05 0.67 3 51 2.33 0.98 0.71 4 1364 '06-07
204093 2 44 0.84 0.37 0.47 1 44 0.82 0.38 0.49 1 1364 '06-07
204095 2 43 0.5 0.5 0.45 1 43 0.4 0.49 0.36 1 1364 '06-07
204100 2 45 0.67 0.47 0.29 1 45 0.68 0.47 0.35 1 1364 '06-07
204102 2 49 0.76 0.43 0.39 1 49 0.75 0.44 0.39 1 1364 '06-07
204106 2 47 0.67 0.47 0.32 1 47 0.64 0.48 0.32 1 1364 '06-07
204122 2 50 0.78 0.41 0.39 1 50 0.76 0.43 0.44 1 1364 '06-07
204128 2 46 1.76 0.99 0.63 1 46 1.85 1.12 0.67 4 1364 '06-07
204133 2 51 2.14 0.98 0.64 1 51 2.15 0.98 0.7 4 1364 '06-07
204140 1 20 0.71 0.46 0.48 1 20 0.7 0.46 0.48 1 1364 '06-07
204144 1 22 0.74 0.44 0.52 1 22 0.73 0.44 0.54 1 1364 '06-07
204147 1 23 0.74 0.44 0.5 1 23 0.74 0.44 0.53 1 1364 '06-07
204155 1 24 1.9 1.05 0.67 1 24 1.98 1.09 0.7 4 1364 '06-07
226240 2 22 0.82 0.39 0.52 2 22 0.8 0.4 0.51 1 1364 '06-07
226244 2 20 0.86 0.35 0.51 2 20 0.87 0.34 0.49 1 1364 '06-07
226246 2 21 0.89 0.31 0.45 2 21 0.9 0.3 0.43 1 1364 '06-07
226247 2 24 2.12 0.93 0.64 2 24 2.24 0.9 0.66 4 1364 '06-07
230175 2 23 0.81 0.39 0.51 2 23 0.79 0.41 0.47 1 1364 '06-07
233566 2 42 0.91 0.29 0.41 1 42 0.89 0.31 0.46 1 1364 '06-07
233567 2 48 0.84 0.36 0.41 1 48 0.83 0.38 0.43 1 1364 '06-07
233690 3 42 0.82 0.38 0.5 3 42 0.83 0.38 0.49 1 1364 '06-07
233691 3 43 0.77 0.42 0.44 3 43 0.79 0.4 0.43 1 1364 '06-07
233958 3 18 0.83 0.37 0.39 3 18 0.81 0.39 0.38 1 1364 '06-07
234521 3 48 0.74 0.44 0.49 3 48 0.73 0.44 0.48 1 1364 '06-07
243072 1 18 0.59 0.49 0.35 1 19 0.61 0.49 0.34 1 1364 '06-07
255934 6 42 0.64 0.48 0.18 2 42 0.62 0.49 0.16 1 1364 '06-07
255938 6 43 0.79 0.41 0.29 2 43 0.8 0.4 0.33 1 1364 '06-07
255939 6 44 0.78 0.42 0.37 2 44 0.8 0.4 0.36 1 1364 '06-07
255939 4 44 0.79 0.41 0.37 2 44 0.8 0.4 0.36 1 1364 '06-07
255942 4 45 0.73 0.44 0.4 2 45 0.73 0.44 0.41 1 1364 '06-07
255944 6 45 0.84 0.36 0.34 2 47 0.85 0.35 0.31 1 1364 '06-07
255944 4 47 0.86 0.34 0.3 2 47 0.85 0.35 0.31 1 1364 '06-07
255946 6 48 0.77 0.42 0.33 2 48 0.8 0.4 0.32 1 1364 '06-07
255947 4 48 0.43 0.49 0.32 2 49 0.41 0.49 0.32 1 1364 '06-07
255960 6 50 0.84 0.37 0.44 2 50 0.87 0.34 0.41 1 1364 '06-07
255960 4 50 0.87 0.33 0.43 2 50 0.87 0.34 0.41 1 1364 '06-07

Appendix D Equating Report 2007-08 NECAP Technical Report 84
Equating Reading Grade 08
Item number oldform
Old position oldmean oldstd oldcorrwtotal form position mean std corrwtotal MAX
Old Contract
Old TestYear
255965 6 51 2.04 1 0.62 2 51 2.16 1 0.65 4 1364 '06-07
255976 4 46 1.7 0.99 0.62 2 46 1.96 0.98 0.66 4 1364 '06-07
256257 5 19 0.62 0.48 0.33 2 19 0.66 0.47 0.32 1 1364 '06-07
256279 7 18 0.86 0.35 0.34 3 19 0.86 0.35 0.31 1 1364 '06-07
256280 4 18 0.87 0.34 0.25 1 18 0.86 0.35 0.23 1 1364 '06-07
256287 7 19 0.88 0.33 0.36 2 18 0.88 0.32 0.35 1 1364 '06-07
260013 1 21 0.32 0.47 0.3 1 21 0.32 0.47 0.31 1 1364 '06-07

Appendix D Equating Report 2007-08 NECAP Technical Report 85
SECTION II.E NECAP
Tabled Delta Analysis Results

Appendix D Equating Report 2007-08 NECAP Technical Report 86
Delta Analysis Math Grade 03 IREF OLDP NEWP OLDDELTA NEWDELTA LINE MAXDISCARDSTDEV_FROM_LINE198283 0.82 0.84 9.3385 9.0222 9.0756 1 FALSE -0.1005 198292 0.74 0.76 10.4266 10.1748 10.2567 1 FALSE -0.433 198465 0.59 0.61 12.0898 11.8827 12.0068 1 FALSE -0.7437 198465 0.6 0.61 11.9866 11.8827 12.0068 1 FALSE -0.9678 198468 0.79 0.79 9.7743 9.7743 9.8463 1 FALSE -0.7829 198517 1.46 1.44 10.5487 10.6686 10.7627 2 FALSE -0.2756 198517 1.46 1.48 10.5487 10.4266 10.5147 2 FALSE -0.9186 198521 0.83 0.89 13.8588 13.5532 13.7187 2 FALSE -0.5394 198551 0.85 0.85 8.8543 8.8543 8.9035 1 FALSE -0.8642 198557 0.85 0.87 8.8543 8.4944 8.5348 1 FALSE 0.1014 198557 0.85 0.86 8.8543 8.6787 8.7236 1 FALSE -0.5733 198573 0.81 0.81 9.4884 9.4884 9.5533 1 FALSE -0.8082 198577 0.89 0.88 8.0939 8.3001 8.3356 1 FALSE -0.1766 198577 0.89 0.88 8.0939 8.3001 8.3356 1 FALSE -0.1766 198582 0.49 0.51 13.1003 12.8997 13.049 1 FALSE -0.8569 198582 0.49 0.49 13.1003 13.1003 13.2545 1 FALSE -0.4891 198636 1.4 1.36 10.9024 11.1292 11.2347 2 FALSE 0.1471 201312 0.84 0.85 9.0222 8.8543 8.9035 1 FALSE -0.6161 201312 0.84 0.86 9.0222 8.6787 8.7236 1 FALSE 0.0266 201401 0.86 0.83 8.6787 9.1833 9.2407 1 FALSE 0.9678 201401 0.86 0.84 8.6787 9.0222 9.0756 1 FALSE 0.3777 201404 0.74 0.76 10.4266 10.1748 10.2567 1 FALSE -0.433 201404 0.74 0.74 10.4266 10.4266 10.5147 1 FALSE -0.7253 201416 0.71 0.65 10.7865 11.4587 11.5724 1 FALSE 1.7678 201416 0.71 0.64 10.7865 11.5662 11.6825 1 FALSE 2.1612 201446 0.52 0.52 12.7994 12.7994 12.9462 1 FALSE -0.5156 201446 0.52 0.51 12.7994 12.8997 13.049 1 FALSE -0.1483 201459 0.51 0.49 12.8997 13.1003 13.2545 1 FALSE 0.2275 201459 0.51 0.5 12.8997 13 13.1518 1 FALSE -0.1396 201477 0.74 0.73 10.4266 10.5487 10.6399 1 FALSE -0.2781 201477 0.74 0.72 10.4266 10.6686 10.7627 1 FALSE 0.1608 201481 0.77 0.78 10.0446 9.9112 9.9866 1 FALSE -0.8329 201481 0.77 0.79 10.0446 9.7743 9.8463 1 FALSE -0.3316 201520 0.7 0.68 10.9024 11.1292 11.2347 1 FALSE 0.1471 201520 0.7 0.66 10.9024 11.3501 11.4611 1 FALSE 0.9561 201581 0.69 0.6 11.0166 11.9866 12.1133 1 FALSE 2.8783 201604 0.57 0.55 12.2945 12.4974 12.6367 1 FALSE 0.1824 201604 0.56 0.55 12.3961 12.4974 12.6367 1 FALSE -0.1806 201614 0.81 0.82 9.4884 9.3385 9.3998 1 FALSE -0.7233 201614 0.81 0.82 9.4884 9.3385 9.3998 1 FALSE -0.7233 201619 0.8 0.85 9.6335 8.8543 8.9035 1 FALSE 1.5682 201619 0.8 0.85 9.6335 8.8543 8.9035 1 FALSE 1.5682 201754 1.32 1.36 11.3501 11.1292 11.2347 2 FALSE -0.6276 201754 1.32 1.34 11.3501 11.2403 11.3486 2 FALSE -1.0346

Appendix D Equating Report 2007-08 NECAP Technical Report 87
Delta Analysis Math Grade 03 IREF OLDP NEWP OLDDELTA NEWDELTA LINE MAXDISCARDSTDEV_FROM_LINE201800 0.85 0.88 8.8543 8.3001 8.3356 1 FALSE 0.8131 201811 0.77 0.75 10.0446 10.302 10.3871 1 FALSE 0.1835 201811 0.77 0.76 10.0446 10.1748 10.2567 1 FALSE -0.2824 201851 0.65 0.65 11.4587 11.4587 11.5724 1 FALSE -0.6341 201890 0.86 0.88 8.6787 8.3001 8.3356 1 FALSE 0.1859 201890 0.86 0.89 8.6787 8.0939 8.1243 1 FALSE 0.9407 202089 0.83 0.93 13.8588 13.3514 13.5118 2 FALSE 0.1996 202089 0.83 0.92 13.8588 13.4017 13.5634 2 FALSE 0.0152 205957 0.34 0.53 14.6499 12.6989 12.8432 1 TRUE 5.4148 223879 0.84 0.84 9.0222 9.0222 9.0756 1 FALSE -0.8494 223883 0.76 0.75 10.1748 10.302 10.3871 1 FALSE -0.2816 223883 0.76 0.75 10.1748 10.302 10.3871 1 FALSE -0.2816 223892 0.82 0.78 9.3385 9.9112 9.9866 1 FALSE 1.2753 223896 0.82 0.8 9.3385 9.6335 9.702 1 FALSE 0.2586 223920 0.65 0.68 11.4587 11.1292 11.2347 1 FALSE -0.2397 223920 0.65 0.71 11.4587 10.7865 10.8835 1 FALSE 1.0152 223923 0.68 0.72 14.6499 14.4338 14.621 2 FALSE -0.9372 226696 0.71 0.73 10.7865 10.5487 10.6399 1 FALSE -0.5164 226937 0.6 0.63 11.9866 11.6726 11.7915 1 FALSE -0.3431 226937 0.6 0.63 11.9866 11.6726 11.7915 1 FALSE -0.3431 226943 0.69 0.72 11.0166 10.6686 10.7627 1 FALSE -0.1331 226943 0.7 0.72 10.9024 10.6686 10.7627 1 FALSE -0.5411 226945 0.58 0.62 12.1924 11.7781 11.8996 1 FALSE 0.0061 226945 0.58 0.62 12.1924 11.7781 11.8996 1 FALSE 0.0061 226965 0.62 0.63 11.7781 11.6726 11.7915 1 FALSE -0.9921 226979 0.54 0.6 12.5983 11.9866 12.1133 1 FALSE 0.6926 227039 0.52 0.46 12.7994 13.4017 13.5634 1 FALSE 1.6897 227127 0.87 0.94 13.6546 13.3011 13.4603 2 FALSE -0.3457 227127 0.88 0.88 13.6039 13.6039 13.7706 2 FALSE -0.4446 231017 0.68 0.71 14.6499 14.4874 14.676 2 FALSE -0.9468 231017 0.68 0.68 14.6499 14.6499 14.8424 2 FALSE -0.3522 242779 0.9 0.95 13.5026 13.2508 13.4088 2 FALSE -0.7048 242782 1.42 1.51 10.7865 10.2388 10.3222 2 FALSE 0.6185 255686 0.76 0.76 10.1748 10.1748 10.2567 1 FALSE -0.7475 255686 0.75 0.76 10.302 10.1748 10.2567 1 FALSE -0.8781 255983 0.5 0.55 13 12.4974 12.6367 1 FALSE 0.258

Appendix D Equating Report 2007-08 NECAP Technical Report 88
Delta Analysis Math Grade 04
IREF OLDP NEWP OLDDELTANEWDELTA LINE MAX DISCARD STDEV_FROM_LINE198327 0.93 0.92 7.0968 7.3797 7.3697 1 FALSE -0.2553 198327 0.93 0.93 7.0968 7.0968 7.0776 1 FALSE -0.9445 198328 0.35 0.4 14.5413 14.0134 14.2201 1 FALSE -0.1239 198328 0.35 0.39 14.5413 14.1173 14.3274 1 FALSE -0.4155 198381 0.69 0.72 11.0166 10.6686 10.7661 1 FALSE -0.316 198381 0.7 0.72 10.9024 10.6686 10.7661 1 FALSE -0.6263 198384 0.52 0.52 12.7994 12.7994 12.9664 1 FALSE -0.5429 198400 0.74 0.7 10.4266 10.9024 11.0075 1 FALSE 0.5817 198400 0.74 0.71 10.4266 10.7865 10.8877 1 FALSE 0.2563 198401 0.76 0.7 10.1748 10.9024 11.0075 1 FALSE 1.266 198401 0.76 0.71 10.1748 10.7865 10.8877 1 FALSE 0.9407 198411 0.32 0.47 14.8708 13.3011 13.4845 1 FALSE 2.7705 198426 0.77 0.8 10.0446 9.6335 9.6971 1 FALSE -0.0525 198426 0.77 0.8 10.0446 9.6335 9.6971 1 FALSE -0.0525 198430 0.87 0.86 8.4944 8.6787 8.7112 1 FALSE -0.4079 198430 0.87 0.85 8.4944 8.8543 8.8924 1 FALSE 0.0847 198431 0.84 0.76 13.8076 14.2219 14.4354 2 FALSE 0.7094 198442 1.29 1.17 11.5126 12.1412 12.2867 2 FALSE 1.107 198442 1.29 1.17 11.5126 12.1412 12.2867 2 FALSE 1.107 202322 0.86 0.85 8.6787 8.8543 8.8924 1 FALSE -0.4161 202322 0.85 0.85 8.8543 8.8543 8.8924 1 FALSE -0.8931 202331 0.8 0.8 9.6335 9.6335 9.6971 1 FALSE -0.824 202331 0.8 0.8 9.6335 9.6335 9.6971 1 FALSE -0.824 202347 0.7 0.73 10.9024 10.5487 10.6423 1 FALSE -0.2899 202354 0.5 0.52 13 12.7994 12.9664 1 FALSE -0.9056 202368 1.19 1.11 12.0383 12.4468 12.6023 2 FALSE 0.5359 202377 1.58 1.54 9.7743 10.0446 10.1217 2 FALSE -0.0529 202384 0.79 0.79 9.7743 9.7743 9.8425 1 FALSE -0.8115 202388 0.73 0.7 10.5487 10.9024 11.0075 1 FALSE 0.2498 202388 0.73 0.71 10.5487 10.7865 10.8877 1 FALSE -0.0756 202396 0.86 0.86 8.6787 8.6787 8.7112 1 FALSE -0.9087 202484 0.21 0.28 16.2257 15.3314 15.5811 1 FALSE 0.7549 202484 0.21 0.3 16.2257 15.0976 15.3397 1 FALSE 1.4109 202489 1.23 1.23 11.8305 11.8305 11.9659 2 FALSE -0.6289 202500 0.85 0.83 8.8543 9.1833 9.2323 1 FALSE 0.0304 202500 0.85 0.83 8.8543 9.1833 9.2323 1 FALSE 0.0304 223956 0.76 0.8 10.1748 9.6335 9.6971 1 FALSE 0.3012 223956 0.76 0.81 10.1748 9.4884 9.5473 1 FALSE 0.7084 223960 0.84 0.85 9.0222 8.8543 8.8924 1 FALSE -0.6443 223960 0.84 0.85 9.0222 8.8543 8.8924 1 FALSE -0.6443 223966 0.51 0.57 12.8997 12.2945 12.445 1 FALSE 0.2388 223968 0.2 0.2 16.3665 16.3665 16.65 1 FALSE -0.2263 223968 0.2 0.21 16.3665 16.2257 16.5046 1 FALSE -0.6214

Appendix D Equating Report 2007-08 NECAP Technical Report 89
Delta Analysis Math Grade 04 IREF OLDP NEWP OLDDELTANEWDELTA LINE MAX DISCARD STDEV_FROM_LINE
224032 0.61 0.63 11.8827 11.6726 11.8028 1 FALSE -0.7797 224096 0.99 1.05 13.0501 12.7492 12.9146 2 FALSE -0.6284 224096 0.99 1.06 13.0501 12.6989 12.8627 2 FALSE -0.4874 224099 1.59 1.55 9.7044 9.9783 10.0532 2 FALSE -0.049 224099 1.6 1.58 9.6335 9.7743 9.8425 2 FALSE -0.4288 227035 0.73 0.85 10.5487 8.8543 8.8924 1 TRUE 3.5044 227035 0.72 0.85 10.6686 8.8543 8.8924 1 TRUE 3.8302 227058 0.87 0.88 8.4944 8.3001 8.3201 1 FALSE -0.5231 227060 0.85 0.83 8.8543 9.1833 9.2323 1 FALSE 0.0304 227070 0.36 0.36 14.4338 14.4338 14.6543 1 FALSE -0.3978 227070 0.36 0.36 14.4338 14.4338 14.6543 1 FALSE -0.3978 227082 1.37 1.38 11.0731 11.0166 11.1254 2 FALSE -0.8547 227082 1.35 1.38 11.185 11.0166 11.1254 2 FALSE -0.835 227088 0.19 0.19 16.5116 16.5116 16.7999 1 FALSE -0.2134 227088 0.19 0.17 16.5116 16.8167 17.1149 1 FALSE 0.6428 227089 0.66 0.76 11.3501 10.1748 10.2561 1 FALSE 1.9764 227089 0.66 0.76 11.3501 10.1748 10.2561 1 FALSE 1.9764 227096 0.83 0.81 13.8588 13.9617 14.1667 2 FALSE -0.1601 227098 0.65 0.66 11.4587 11.3501 11.4698 1 FALSE -0.9666 227107 0.81 0.8 9.4884 9.6335 9.6971 1 FALSE -0.4296 227107 0.81 0.82 9.4884 9.3385 9.3925 1 FALSE -0.7362 232429 1.18 1.17 12.0898 12.1412 12.2867 2 FALSE -0.4617 232429 1.18 1.18 12.0898 12.0898 12.2337 2 FALSE -0.6059 232445 0.81 0.81 9.4884 9.4884 9.5473 1 FALSE -0.8368 232445 0.81 0.81 9.4884 9.4884 9.5473 1 FALSE -0.8368 232534 0.55 0.57 12.4974 12.2945 12.445 1 FALSE -0.8547 232534 0.55 0.56 12.4974 12.3961 12.55 1 FALSE -0.8538 232535 0.56 0.56 12.3961 12.3961 12.55 1 FALSE -0.5787 232535 0.56 0.56 12.3961 12.3961 12.55 1 FALSE -0.5787 232537 0.72 0.74 10.6686 10.4266 10.5161 1 FALSE -0.5824 232537 0.72 0.76 10.6686 10.1748 10.2561 1 FALSE 0.1243 232543 0.71 0.59 10.7865 12.0898 12.2337 1 FALSE 2.9361 232594 0.48 0.49 13.2006 13.1003 13.2771 1 FALSE -0.7889 232594 0.46 0.49 13.4017 13.1003 13.2771 1 FALSE -0.6582 232599 0.49 0.47 13.1003 13.3011 13.4845 1 FALSE 0.0473 232604 0.46 0.5 13.4017 13 13.1736 1 FALSE -0.3768 255732 0.59 0.59 12.0898 12.0898 12.2337 1 FALSE -0.6059

Appendix D Equating Report 2007-08 NECAP Technical Report 90
Delta Analysis Math Grade 05
IREF OLDP NEWP OLDDELTANEWDELTA LINE MAX DISCARD STDEV_FROM_LINE198487 0.73 0.72 10.5487 10.6686 10.6945 1 FALSE -0.566 198487 0.73 0.72 10.5487 10.6686 10.6945 1 FALSE -0.566 198548 0.5 0.49 13 13.1003 13.1362 1 FALSE -0.6169 198548 0.49 0.51 13.1003 12.8997 12.9348 1 FALSE -0.4606 198585 0.65 0.63 11.4587 11.6726 11.7026 1 FALSE -0.0413 198585 0.66 0.63 11.3501 11.6726 11.7026 1 FALSE 0.539 198603 1.39 1.32 10.9597 11.3501 11.3788 2 FALSE 0.8953 198603 1.44 1.31 10.6686 11.4046 11.4335 2 FALSE 2.7434 203258 0.85 0.87 8.8543 8.4944 8.5113 1 FALSE 0.4885 203258 0.85 0.87 8.8543 8.4944 8.5113 1 FALSE 0.4885 203280 0.7 0.69 10.9024 11.0166 11.0439 1 FALSE -0.5887 203293 0.49 0.51 13.1003 12.8997 12.9348 1 FALSE -0.4606 203293 0.49 0.51 13.1003 12.8997 12.9348 1 FALSE -0.4606 203298 0.35 0.42 14.5413 13.8076 13.8464 1 FALSE 2.3691 203298 0.35 0.41 14.5413 13.9102 13.9495 1 FALSE 1.8184 203299 0.46 0.52 13.4017 12.7994 12.8341 1 FALSE 1.6894 203299 0.46 0.51 13.4017 12.8997 12.9348 1 FALSE 1.1508 203356 0.5 0.52 13 12.7994 12.8341 1 FALSE -0.4581 203356 0.5 0.54 13 12.5983 12.6321 1 FALSE 0.6215 203358 0.71 0.72 10.7865 10.6686 10.6945 1 FALSE -0.8533 203367 0.4 0.42 14.0134 13.8076 13.8464 1 FALSE -0.4526 203367 0.43 0.42 13.7055 13.8076 13.8464 1 FALSE -0.5915 203378 0.61 0.63 11.8827 11.6726 11.7026 1 FALSE -0.3821 203556 0.59 0.63 12.0898 11.6726 11.7026 1 FALSE 0.7249 203559 0.55 0.6 12.4974 11.9866 12.0179 1 FALSE 1.2177 203584 0.53 0.54 12.6989 12.5983 12.6321 1 FALSE -0.9879 203606 0.45 0.46 13.5026 13.4017 13.4389 1 FALSE -1.0044 203606 0.45 0.46 13.5026 13.4017 13.4389 1 FALSE -1.0044 203893 0.75 0.76 10.302 10.1748 10.1986 1 FALSE -0.792 203893 0.75 0.77 10.302 10.0446 10.0679 1 FALSE -0.0932 203898 0.6 0.57 11.9866 12.2945 12.3271 1 FALSE 0.475 203914 0.55 0.54 12.4974 12.5983 12.6321 1 FALSE -0.6246 203914 0.52 0.53 12.7994 12.6989 12.7332 1 FALSE -0.9912 203933 0.84 0.84 9.0222 9.0222 9.0412 1 FALSE -1.2434 203938 0.71 0.66 10.7865 11.3501 11.3788 1 FALSE 1.8214 203938 0.72 0.66 10.6686 11.3501 11.3788 1 FALSE 2.4512 203941 0.81 0.79 9.4884 9.7743 9.7964 1 FALSE 0.3016 203949 0.66 0.74 14.7597 14.3274 14.3684 2 FALSE 0.7462 203949 0.66 0.74 14.7597 14.3274 14.3684 2 FALSE 0.7462 203977 0.51 0.49 12.8997 13.1003 13.1362 1 FALSE -0.0809 203997 0.38 0.38 14.2219 14.2219 14.2625 1 FALSE -1.128 203997 0.38 0.38 14.2219 14.2219 14.2625 1 FALSE -1.128 225011 0.42 0.43 13.8076 13.7055 13.7439 1 FALSE -1.0049

Appendix D Equating Report 2007-08 NECAP Technical Report 91
Delta Analysis Math Grade 05 IREF OLDP NEWP OLDDELTANEWDELTA LINE MAX DISCARD STDEV_FROM_LINE
225025 0.8 0.9 14.0134 13.5026 13.5403 2 FALSE 1.1841 225025 0.8 0.91 14.0134 13.4522 13.4896 2 FALSE 1.4551 225028 1.58 1.67 14.0652 13.8332 13.8722 4 FALSE -0.3129 225032 0.48 0.52 13.2006 12.7994 12.8341 1 FALSE 0.6143 225032 0.48 0.52 13.2006 12.7994 12.8341 1 FALSE 0.6143 225295 0.48 0.47 13.2006 13.3011 13.3379 1 FALSE -0.6114 225295 0.48 0.47 13.2006 13.3011 13.3379 1 FALSE -0.6114 225298 0.57 0.59 12.2945 12.0898 12.1216 1 FALSE -0.4206 225298 0.56 0.61 12.3961 11.8827 11.9136 1 FALSE 1.2342 225316 0.54 0.49 12.5983 13.1003 13.1362 1 FALSE 1.5305 225333 0.5 0.5 13 13 13.0355 1 FALSE -1.1551 225333 0.5 0.51 13 12.8997 12.9348 1 FALSE -0.9966 225346 1.18 1.18 12.0898 12.0898 12.1216 2 FALSE -1.1753 225389 0.55 0.54 15.391 15.4513 15.4969 2 FALSE -0.7789 225389 0.54 0.54 15.4513 15.4513 15.4969 2 FALSE -1.1007 225404 0.69 0.7 11.0166 10.9024 10.9292 1 FALSE -0.8779 225404 0.69 0.71 11.0166 10.7865 10.8128 1 FALSE -0.2556 225408 0.36 0.36 14.4338 14.4338 14.4753 1 FALSE -1.1233 225408 0.36 0.35 14.4338 14.5413 14.5832 1 FALSE -0.5466 225453 1.08 1.06 15.4513 15.512 15.558 4 FALSE -0.7745 226715 0.34 0.33 14.6499 14.7597 14.8025 1 FALSE -0.5291 226715 0.33 0.33 14.7597 14.7597 14.8025 1 FALSE -1.116 226814 0.36 0.34 14.4338 14.6499 14.6922 1 FALSE 0.0362 226814 0.36 0.34 14.4338 14.6499 14.6922 1 FALSE 0.0362 230748 1.01 1.02 15.6666 15.6354 15.6818 4 FALSE -1.2635 230748 1.01 0.98 15.6666 15.7612 15.8082 4 FALSE -0.5878 234368 0.88 0.77 13.6039 14.1695 14.2099 2 FALSE 1.8943 234368 0.88 0.79 13.6039 14.0652 14.1052 2 FALSE 1.3347 234370 0.75 0.77 10.302 10.0446 10.0679 1 FALSE -0.0932 234370 0.75 0.77 10.302 10.0446 10.0679 1 FALSE -0.0932 234393 0.49 0.47 13.1003 13.3011 13.3379 1 FALSE -0.075 234393 0.49 0.48 13.1003 13.2006 13.237 1 FALSE -0.6143 241932 1.96 1.93 13.1003 13.1755 13.2118 4 FALSE -0.749 241932 1.96 1.97 13.1003 13.0752 13.111 4 FALSE -1.2874 255763 0.51 0.47 12.8997 13.3011 13.3379 1 FALSE 0.997 255763 0.5 0.47 13 13.3011 13.3379 1 FALSE 0.461 260931 0.42 0.39 13.8076 14.1173 14.1574 1 FALSE 0.5252 260931 0.42 0.39 13.8076 14.1173 14.1574 1 FALSE 0.5252

Appendix D Equating Report 2007-08 NECAP Technical Report 92
Delta Analysis Math Grade 06
IREF OLDP NEWP OLDDELTANEWDELTA LINE MAX DISCARD STDEV_FROM_LINE198609 0.48 0.48 13.2006 13.2006 13.3175 1 FALSE -0.5691 198610 0.78 0.78 9.9112 9.9112 9.9725 1 FALSE -0.8387 198610 0.78 0.78 9.9112 9.9112 9.9725 1 FALSE -0.8387 198612 0.38 0.38 14.2219 14.2219 14.3561 1 FALSE -0.4854 198632 0.82 0.79 13.9102 14.0652 14.1968 2 FALSE 0.253 198632 0.8 0.87 14.0134 13.6546 13.7792 2 FALSE -0.0009 198649 0.47 0.49 13.3011 13.1003 13.2155 1 FALSE -0.7207 198650 0.63 0.66 11.6726 11.3501 11.4357 1 FALSE 0.012 198713 0.61 0.58 11.8827 12.1924 12.2923 1 FALSE 0.8487 198713 0.61 0.61 11.8827 11.8827 11.9773 1 FALSE -0.6771 198716 0.89 0.92 13.5532 13.4017 13.522 2 FALSE -0.9844 198716 0.89 0.91 13.5532 13.4522 13.5733 2 FALSE -1.0381 198722 0.62 0.63 11.7781 11.6726 11.7636 1 FALSE -1.0655 198722 0.63 0.65 11.6726 11.4587 11.5461 1 FALSE -0.5229 198726 0.75 0.73 14.2746 14.3805 14.5174 2 FALSE 0.0409 198727 0.52 0.63 15.5734 14.9269 15.073 2 FALSE 1.2888 198727 0.52 0.62 15.5734 14.9834 15.1305 2 FALSE 1.0104 203167 0.4 0.39 14.0134 14.1173 14.2497 1 FALSE 0.0094 203167 0.4 0.41 14.0134 13.9102 14.0391 1 FALSE -1.0109 203173 0.46 0.46 13.4017 13.4017 13.522 1 FALSE -0.5526 203173 0.46 0.48 13.4017 13.2006 13.3175 1 FALSE -0.7274 203188 0.63 0.64 11.6726 11.5662 11.6554 1 FALSE -1.0522 203188 0.63 0.66 11.6726 11.3501 11.4357 1 FALSE 0.012 203204 0.62 0.64 11.7781 11.5662 11.6554 1 FALSE -0.5411 203204 0.62 0.65 11.7781 11.4587 11.5461 1 FALSE -0.0118 203217 0.65 0.65 11.4587 11.4587 11.5461 1 FALSE -0.7118 203279 1.37 1.39 11.0731 10.9597 11.0387 2 FALSE -0.9688 203350 0.61 0.64 11.8827 11.5662 11.6554 1 FALSE -0.0341 203379 0.33 0.33 14.7597 14.7597 14.9029 1 FALSE -0.4413 203381 0.79 0.77 9.7743 10.0446 10.1081 1 FALSE 0.4818 203393 0.5 0.48 13 13.2006 13.3175 1 FALSE 0.4029 203393 0.5 0.47 13 13.3011 13.4197 1 FALSE 0.8978 203452 0.52 0.54 12.7994 12.5983 12.705 1 FALSE -0.678 203452 0.52 0.55 12.7994 12.4974 12.6024 1 FALSE -0.1809 203453 0.59 0.57 12.0898 12.2945 12.3961 1 FALSE 0.3483 203453 0.6 0.58 11.9866 12.1924 12.2923 1 FALSE 0.3454 203457 0.68 0.66 11.1292 11.3501 11.4357 1 FALSE 0.3497 203457 0.69 0.66 11.0166 11.3501 11.4357 1 FALSE 0.8952 203526 0.57 0.61 12.2945 11.8827 11.9773 1 FALSE 0.4012 203526 0.58 0.61 12.1924 11.8827 11.9773 1 FALSE -0.0933 203543 0.46 0.47 13.4017 13.3011 13.4197 1 FALSE -1.0485 203543 0.44 0.46 13.6039 13.4017 13.522 1 FALSE -0.7389 225180 0.46 0.42 13.4017 13.8076 13.9347 1 FALSE 1.4469

Appendix D Equating Report 2007-08 NECAP Technical Report 93
Delta Analysis Math Grade 06 IREF OLDP NEWP OLDDELTANEWDELTA LINE MAX DISCARD STDEV_FROM_LINE
225180 0.46 0.46 13.4017 13.4017 13.522 1 FALSE -0.5526 225267 0.6 0.52 11.9866 12.7994 12.9095 1 TRUE 3.3357 225267 0.6 0.55 11.9866 12.4974 12.6024 1 TRUE 1.8477 225300 0.14 0.12 17.3213 17.6999 17.893 1 FALSE 1.6343 225318 0.46 0.48 13.4017 13.2006 13.3175 1 FALSE -0.7274 225318 0.46 0.49 13.4017 13.1003 13.2155 1 FALSE -0.233 225334 1.41 1.4 14.5143 14.5413 14.6809 4 FALSE -0.3286 225345 0.41 0.49 13.9102 13.1003 13.2155 1 FALSE 2.2303 225345 0.4 0.51 14.0134 12.8997 13.0115 1 TRUE 3.7183 225351 0.5 0.49 13 13.1003 13.2155 1 FALSE -0.0915 225351 0.5 0.51 13 12.8997 13.0115 1 FALSE -1.0795 225363 0.36 0.4 14.4338 14.0134 14.144 1 FALSE 0.2686 225376 0.49 0.49 13.1003 13.1003 13.2155 1 FALSE -0.5773 225377 0.58 0.6 12.1924 11.9866 12.083 1 FALSE -0.6051 225377 0.58 0.6 12.1924 11.9866 12.083 1 FALSE -0.6051 225381 1.33 1.41 14.7321 14.5143 14.6534 4 FALSE -0.7544 225381 1.33 1.45 14.7321 14.4071 14.5444 4 FALSE -0.2264 225427 0.4 0.39 14.0134 14.1173 14.2497 1 FALSE 0.0094 225427 0.4 0.39 14.0134 14.1173 14.2497 1 FALSE 0.0094 228669 0.67 0.67 11.2403 11.2403 11.3241 1 FALSE -0.7297 228669 0.67 0.71 11.2403 10.7865 10.8625 1 FALSE 0.6951 233588 1.59 1.63 14.0393 13.9359 14.0653 4 FALSE -1.0096 234406 1.09 1.13 12.5478 12.3454 12.4478 2 FALSE -0.6507 234406 1.1 1.13 12.4974 12.3454 12.4478 2 FALSE -0.8953 234411 0.54 0.53 12.5983 12.6989 12.8073 1 FALSE -0.1225 234416 0.45 0.52 13.5026 12.7994 12.9095 1 FALSE 1.7382 234416 0.45 0.53 13.5026 12.6989 12.8073 1 FALSE 2.2332 234417 1.69 1.66 13.782 13.8588 13.9868 4 FALSE -0.1431 234417 1.73 1.68 13.6801 13.8076 13.9347 4 FALSE 0.0985 242302 0.57 0.58 12.2945 12.1924 12.2923 1 FALSE -1.1246 242302 0.57 0.61 12.2945 11.8827 11.9773 1 FALSE 0.4012 255359 0.3 0.31 15.0976 14.9834 15.1305 1 FALSE -0.9762 255359 0.3 0.33 15.0976 14.7597 14.9029 1 FALSE -0.1923 255569 0.56 0.61 12.3961 11.8827 11.9773 1 FALSE 0.8935

Appendix D Equating Report 2007-08 NECAP Technical Report 94
Delta Analysis Math Grade 07
IREF OLDP NEWP OLDDELTA NEWDELTA LINE MAX DISCARD STDEV_FROM_LINE199870 0.52 0.51 12.7994 12.8997 12.9991 1 FALSE -0.4174 199870 0.52 0.51 12.7994 12.8997 12.9991 1 FALSE -0.4174 199898 0.87 0.87 8.4944 8.4944 8.561 1 FALSE -0.7195 199918 0.57 0.64 12.2945 11.5662 11.6556 1 FALSE 0.5786 199925 0.51 0.55 12.8997 12.4974 12.5938 1 FALSE -0.1765 199947 0.7 0.66 10.9024 11.3501 11.438 1 FALSE 0.3443 199950 0.71 0.62 10.7865 11.7781 11.8691 1 FALSE 1.5852 206097 0.51 0.47 12.8997 13.3011 13.4035 1 FALSE 0.2721 206097 0.5 0.47 13 13.3011 13.4035 1 FALSE 0.0447 206098 0.8 0.8 9.6335 9.6335 9.7086 1 FALSE -0.7003 206098 0.8 0.81 9.6335 9.4884 9.5624 1 FALSE -0.7092 206102 0.34 0.4 14.6499 14.0134 14.1211 1 FALSE 0.3288 206103 0.59 0.56 12.0898 12.3961 12.4918 1 FALSE 0.0412 206103 0.59 0.57 12.0898 12.2945 12.3894 1 FALSE -0.191 206104 0.53 0.54 12.6989 12.5983 12.6954 1 FALSE -0.8626 206104 0.53 0.54 12.6989 12.5983 12.6954 1 FALSE -0.8626 206127 1.51 1.59 14.2482 14.0393 14.1472 4 FALSE -0.6414 206127 1.52 1.59 14.2219 14.0393 14.1472 4 FALSE -0.701 206135 0.4 0.45 14.0134 13.5026 13.6066 1 FALSE 0.0523 206141 0.52 0.5 12.7994 13 13.1002 1 FALSE -0.1883 206141 0.53 0.5 12.6989 13 13.1002 1 FALSE 0.0396 206144 0.56 0.62 12.3961 11.7781 11.8691 1 FALSE 0.3248 206144 0.57 0.62 12.2945 11.7781 11.8691 1 FALSE 0.0943 206152 0.34 0.47 16.8167 15.8899 16.0116 2 FALSE 0.9554 206158 0.74 0.74 10.4266 10.4266 10.5076 1 FALSE -0.6869 206158 0.74 0.76 10.4266 10.1748 10.2539 1 FALSE -0.4787 206164 0.61 0.55 11.8827 12.4974 12.5938 1 FALSE 0.7423 206164 0.61 0.54 11.8827 12.5983 12.6954 1 FALSE 0.9728 206172 0.52 0.56 12.7994 12.3961 12.4918 1 FALSE -0.1728 206172 0.52 0.57 12.7994 12.2945 12.3894 1 FALSE 0.0594 206177 0.73 0.77 10.5487 10.0446 10.1227 1 FALSE 0.0958 206177 0.73 0.78 10.5487 9.9112 9.9884 1 FALSE 0.4006 206181 0.48 0.34 13.2006 14.6499 14.7623 1 FALSE 2.6717 206181 0.48 0.36 13.2006 14.4338 14.5447 1 FALSE 2.1781 206189 0.86 0.81 13.7055 13.9617 14.069 2 FALSE -0.0459 206189 0.87 0.81 13.6546 13.9617 14.069 2 FALSE 0.0694 206195 2.27 2.18 12.3199 12.5478 12.6446 4 FALSE -0.1341 206195 2.27 2.18 12.3199 12.5478 12.6446 4 FALSE -0.1341 206203 0.24 0.25 15.8252 15.698 15.8182 1 FALSE -0.8547 206203 0.23 0.26 15.9554 15.5734 15.6927 1 FALSE -0.2748 206213 0.94 0.98 13.3011 13.1003 13.2012 2 FALSE -0.6439 206213 0.93 0.94 13.3514 13.3011 13.4035 2 FALSE -0.7523 224761 0.59 0.57 12.0898 12.2945 12.3894 1 FALSE -0.191

Appendix D Equating Report 2007-08 NECAP Technical Report 95
Delta Analysis Math Grade 07 IREF OLDP NEWP OLDDELTA NEWDELTA LINE MAX DISCARD STDEV_FROM_LINE
224761 0.59 0.58 12.0898 12.1924 12.2866 1 FALSE -0.4243 224764 0.88 0.87 8.3001 8.4944 8.561 1 FALSE -0.2786 224777 0.43 0.46 13.7055 13.4017 13.5049 1 FALSE -0.4155 224781 0.33 0.28 14.7597 15.3314 15.4489 1 FALSE 0.6928 224781 0.33 0.27 14.7597 15.4513 15.5697 1 FALSE 0.9668 224793 0.67 0.68 11.2403 11.1292 11.2154 1 FALSE -0.8139 224793 0.67 0.68 11.2403 11.1292 11.2154 1 FALSE -0.8139 224801 0.36 0.38 14.4338 14.2219 14.3312 1 FALSE -0.6377 224801 0.36 0.4 14.4338 14.0134 14.1211 1 FALSE -0.1612 224827 0.4 0.43 14.0134 13.7055 13.8109 1 FALSE -0.4113 224856 0.54 0.49 15.4513 15.7612 15.882 2 FALSE 0.1065 224856 0.54 0.49 15.4513 15.7612 15.882 2 FALSE 0.1065 224876 0.84 0.86 16.2257 16.1568 16.2805 4 FALSE -0.7462 224876 0.84 0.9 16.2257 16.0217 16.1444 4 FALSE -0.686 224924 1.4 1.36 14.5413 14.6499 14.7623 4 FALSE -0.3692 225078 0.38 0.41 14.2219 13.9102 14.0171 1 FALSE -0.406 225078 0.38 0.42 14.2219 13.8076 13.9138 1 FALSE -0.1715 225135 0.75 0.69 14.2746 14.5954 14.7075 2 FALSE 0.1114 228094 0.61 0.58 11.8827 12.1924 12.2866 1 FALSE 0.0455 228103 0.32 0.33 14.8708 14.7597 14.8729 1 FALSE -0.8657 228103 0.32 0.34 14.8708 14.6499 14.7623 1 FALSE -0.6245 233831 0.33 0.35 14.7597 14.5413 14.6529 1 FALSE -0.6285 234445 0.46 0.45 13.4017 13.5026 13.6066 1 FALSE -0.4059 234445 0.46 0.46 13.4017 13.4017 13.5049 1 FALSE -0.6365 234452 0.85 0.88 8.8543 8.3001 8.3652 1 FALSE 0.2389 234452 0.85 0.87 8.8543 8.4944 8.561 1 FALSE -0.2053 234455 0.56 0.56 15.3314 15.3314 15.4489 2 FALSE -0.6039 234455 0.56 0.56 15.3314 15.3314 15.4489 2 FALSE -0.6039 234459 0.31 0.55 14.9834 12.4974 12.5938 1 TRUE 4.5496 234459 0.31 0.56 14.9834 12.3961 12.4918 1 TRUE 4.7809 255899 0.46 0.5 15.9554 15.698 15.8182 2 FALSE -0.5594 255974 0.42 0.44 13.8076 13.6039 13.7085 1 FALSE -0.6459 255974 0.42 0.43 13.8076 13.7055 13.8109 1 FALSE -0.8629 255994 0.17 0.2 16.8167 16.3665 16.4918 1 FALSE -0.1336 256055 0.34 0.34 14.6499 14.6499 14.7623 1 FALSE -0.6154 256091 0.46 0.53 13.4017 12.6989 12.7968 1 FALSE 0.5015 256091 0.46 0.54 13.4017 12.5983 12.6954 1 FALSE 0.7315
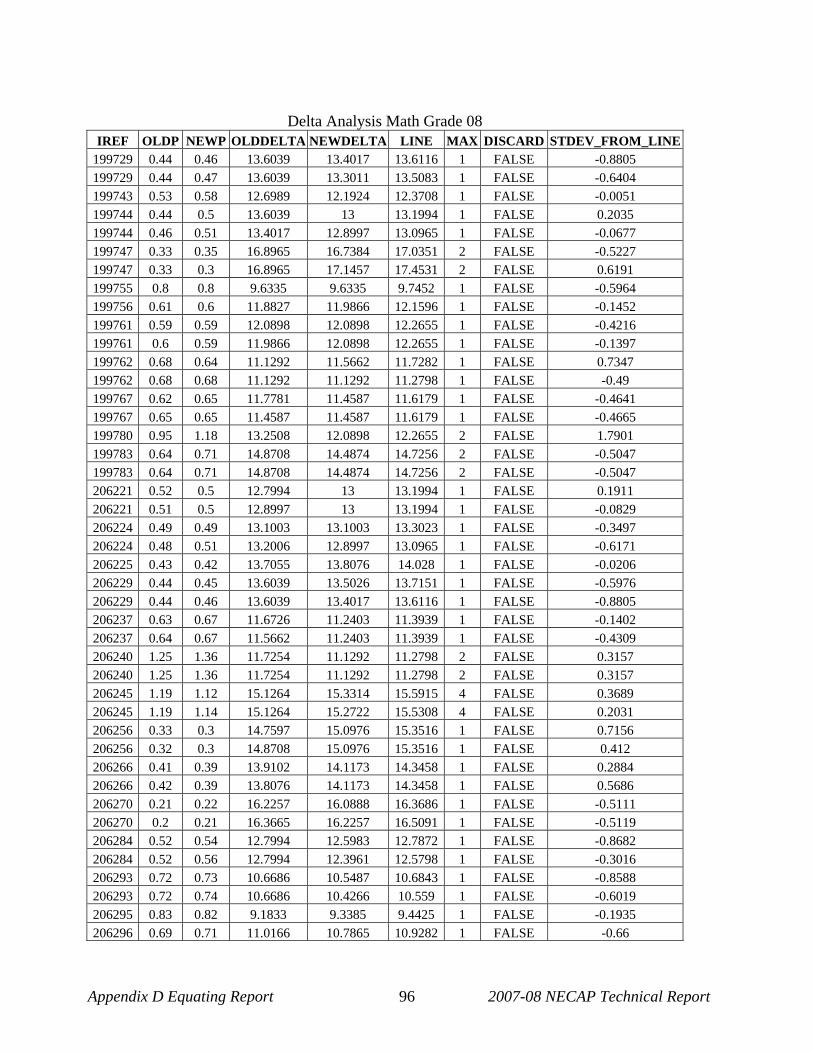
Appendix D Equating Report 2007-08 NECAP Technical Report 96
Delta Analysis Math Grade 08
IREF OLDP NEWP OLDDELTA NEWDELTA LINE MAX DISCARD STDEV_FROM_LINE199729 0.44 0.46 13.6039 13.4017 13.6116 1 FALSE -0.8805 199729 0.44 0.47 13.6039 13.3011 13.5083 1 FALSE -0.6404 199743 0.53 0.58 12.6989 12.1924 12.3708 1 FALSE -0.0051 199744 0.44 0.5 13.6039 13 13.1994 1 FALSE 0.2035 199744 0.46 0.51 13.4017 12.8997 13.0965 1 FALSE -0.0677 199747 0.33 0.35 16.8965 16.7384 17.0351 2 FALSE -0.5227 199747 0.33 0.3 16.8965 17.1457 17.4531 2 FALSE 0.6191 199755 0.8 0.8 9.6335 9.6335 9.7452 1 FALSE -0.5964 199756 0.61 0.6 11.8827 11.9866 12.1596 1 FALSE -0.1452 199761 0.59 0.59 12.0898 12.0898 12.2655 1 FALSE -0.4216 199761 0.6 0.59 11.9866 12.0898 12.2655 1 FALSE -0.1397 199762 0.68 0.64 11.1292 11.5662 11.7282 1 FALSE 0.7347 199762 0.68 0.68 11.1292 11.1292 11.2798 1 FALSE -0.49 199767 0.62 0.65 11.7781 11.4587 11.6179 1 FALSE -0.4641 199767 0.65 0.65 11.4587 11.4587 11.6179 1 FALSE -0.4665 199780 0.95 1.18 13.2508 12.0898 12.2655 2 FALSE 1.7901 199783 0.64 0.71 14.8708 14.4874 14.7256 2 FALSE -0.5047 199783 0.64 0.71 14.8708 14.4874 14.7256 2 FALSE -0.5047 206221 0.52 0.5 12.7994 13 13.1994 1 FALSE 0.1911 206221 0.51 0.5 12.8997 13 13.1994 1 FALSE -0.0829 206224 0.49 0.49 13.1003 13.1003 13.3023 1 FALSE -0.3497 206224 0.48 0.51 13.2006 12.8997 13.0965 1 FALSE -0.6171 206225 0.43 0.42 13.7055 13.8076 14.028 1 FALSE -0.0206 206229 0.44 0.45 13.6039 13.5026 13.7151 1 FALSE -0.5976 206229 0.44 0.46 13.6039 13.4017 13.6116 1 FALSE -0.8805 206237 0.63 0.67 11.6726 11.2403 11.3939 1 FALSE -0.1402 206237 0.64 0.67 11.5662 11.2403 11.3939 1 FALSE -0.4309 206240 1.25 1.36 11.7254 11.1292 11.2798 2 FALSE 0.3157 206240 1.25 1.36 11.7254 11.1292 11.2798 2 FALSE 0.3157 206245 1.19 1.12 15.1264 15.3314 15.5915 4 FALSE 0.3689 206245 1.19 1.14 15.1264 15.2722 15.5308 4 FALSE 0.2031 206256 0.33 0.3 14.7597 15.0976 15.3516 1 FALSE 0.7156 206256 0.32 0.3 14.8708 15.0976 15.3516 1 FALSE 0.412 206266 0.41 0.39 13.9102 14.1173 14.3458 1 FALSE 0.2884 206266 0.42 0.39 13.8076 14.1173 14.3458 1 FALSE 0.5686 206270 0.21 0.22 16.2257 16.0888 16.3686 1 FALSE -0.5111 206270 0.2 0.21 16.3665 16.2257 16.5091 1 FALSE -0.5119 206284 0.52 0.54 12.7994 12.5983 12.7872 1 FALSE -0.8682 206284 0.52 0.56 12.7994 12.3961 12.5798 1 FALSE -0.3016 206293 0.72 0.73 10.6686 10.5487 10.6843 1 FALSE -0.8588 206293 0.72 0.74 10.6686 10.4266 10.559 1 FALSE -0.6019 206295 0.83 0.82 9.1833 9.3385 9.4425 1 FALSE -0.1935 206296 0.69 0.71 11.0166 10.7865 10.9282 1 FALSE -0.66

Appendix D Equating Report 2007-08 NECAP Technical Report 97
Delta Analysis Math Grade 08 IREF OLDP NEWP OLDDELTA NEWDELTA LINE MAX DISCARD STDEV_FROM_LINE
206310 0.46 0.44 13.4017 13.6039 13.819 1 FALSE 0.2383 206313 0.36 0.42 14.4338 13.8076 14.028 1 FALSE 0.2071 206331 2.02 2.1 12.9499 12.7492 12.942 4 FALSE -0.8801 206337 0.56 0.6 12.3961 11.9866 12.1596 1 FALSE -0.2554 224853 0.33 0.35 14.7597 14.5413 14.7808 1 FALSE -0.8437 224853 0.33 0.33 14.7597 14.7597 15.0049 1 FALSE -0.2316 224878 0.34 0.42 14.6499 13.8076 14.028 1 FALSE 0.7972 224878 0.34 0.44 14.6499 13.6039 13.819 1 FALSE 1.3681 224881 0.48 0.52 13.2006 12.7994 12.9935 1 FALSE -0.3358 224881 0.48 0.53 13.2006 12.6989 12.8905 1 FALSE -0.0543 224891 0.33 0.31 14.7597 14.9834 15.2344 1 FALSE 0.3955 224919 0.5 0.58 13 12.1924 12.3708 1 FALSE 0.8174 224919 0.5 0.58 13 12.1924 12.3708 1 FALSE 0.8174 225437 0.23 0.25 15.9554 15.698 15.9676 1 FALSE -0.8681 225437 0.23 0.24 15.9554 15.8252 16.0982 1 FALSE -0.5114 226556 0.64 0.64 11.5662 11.5662 11.7282 1 FALSE -0.4589 226556 0.65 0.64 11.4587 11.5662 11.7282 1 FALSE -0.1654 226573 0.52 0.56 12.7994 12.3961 12.5798 1 FALSE -0.3016 226573 0.53 0.58 12.6989 12.1924 12.3708 1 FALSE -0.0051 233602 0.53 0.52 12.6989 12.7994 12.9935 1 FALSE -0.0967 233602 0.53 0.52 12.6989 12.7994 12.9935 1 FALSE -0.0967 233609 1.13 1.08 15.3017 15.4513 15.7145 4 FALSE 0.226 233609 1.16 1.1 15.2135 15.391 15.6527 4 FALSE 0.2982 233719 1.37 1.4 11.0731 10.9024 11.0471 2 FALSE -0.8306 233719 1.4 1.4 10.9024 10.9024 11.0471 2 FALSE -0.5061 234148 0.65 0.67 14.815 14.7046 14.9484 2 FALSE -0.5373 234148 0.65 0.67 14.815 14.7046 14.9484 2 FALSE -0.5373 234523 0.73 0.74 10.5487 10.4266 10.559 1 FALSE -0.8736 234524 0.53 0.46 12.6989 13.4017 13.6116 1 FALSE 1.5916 234524 0.5 0.46 13 13.4017 13.6116 1 FALSE 0.7691 242395 0.49 0.49 13.1003 13.1003 13.3023 1 FALSE -0.3497 242401 0.53 0.55 12.6989 12.4974 12.6836 1 FALSE -0.8598 242401 0.53 0.57 12.6989 12.2945 12.4755 1 FALSE -0.2912 256309 0.16 0.35 16.9778 14.5413 14.7808 1 TRUE 5.1 256309 0.16 0.35 16.9778 14.5413 14.7808 1 TRUE 5.1 256511 0.71 0.72 10.7865 10.6686 10.8073 1 FALSE -0.8446 256511 0.71 0.72 10.7865 10.6686 10.8073 1 FALSE -0.8446 260926 1.35 1.29 14.6772 14.8429 15.0903 4 FALSE 0.2269 260926 1.37 1.29 14.6226 14.8429 15.0903 4 FALSE 0.376

Appendix D Equating Report 2007-08 NECAP Technical Report 98
Delta Analysis Reading Grade 03
IREF OLDP NEWP OLDDELTA NEWDELTA LINE MAX DISCARD STDEV_FROM_LINE201747 0.8 0.79 9.6335 9.7743 9.9206 1 FALSE 0.2602 201748 0.71 0.73 10.7865 10.5487 10.6766 1 FALSE -0.6465 201763 0.84 0.87 9.0222 8.4944 8.6711 1 FALSE 0.5877 201764 2.07 2.28 12.8245 12.2945 12.381 4 FALSE 1.0606 201825 0.56 0.62 12.3961 11.7781 11.8768 1 FALSE 1.4484 201830 0.66 0.68 11.3501 11.1292 11.2433 1 FALSE -0.6619 201831 0.88 0.89 8.3001 8.0939 8.28 1 FALSE -1.106 201836 0.66 0.69 11.3501 11.0166 11.1334 1 FALSE -0.0995 202178 0.76 0.75 10.1748 10.302 10.4358 1 FALSE 0.1268 202179 0.82 0.84 9.3385 9.0222 9.1863 1 FALSE -0.4295 202180 0.71 0.75 10.7865 10.302 10.4358 1 FALSE 0.5856 202183 0.77 0.79 10.0446 9.7743 9.9206 1 FALSE -0.5739 202194 0.89 0.9 8.0939 7.8738 8.0652 1 FALSE -1.0615 205940 2.29 2.41 12.269 11.9607 12.0551 4 FALSE -0.1139 225214 0.7 0.72 10.9024 10.6686 10.7937 1 FALSE -0.6522 225216 0.75 0.78 10.302 9.9112 10.0543 1 FALSE 0.0593 225218 0.8 0.81 9.6335 9.4884 9.6415 1 FALSE -1.1676 225220 0.77 0.77 10.0446 10.0446 10.1845 1 FALSE -0.4929 225230 0.49 0.48 13.1003 13.2006 13.2656 1 FALSE -0.3628 225233 0.73 0.73 10.5487 10.5487 10.6766 1 FALSE -0.5541 225237 0.7 0.69 10.9024 11.0166 11.1334 1 FALSE -0.0267 225240 0.67 0.66 11.2403 11.3501 11.459 1 FALSE -0.0897 225242 3.47 3.52 8.5414 8.3001 8.4813 4 FALSE -0.901 225253 1.93 1.81 13.1755 13.4774 13.5358 4 FALSE 0.6346 226283 0.84 0.86 9.0222 8.6787 8.851 1 FALSE -0.3327 226289 0.85 0.83 8.8543 9.1833 9.3436 1 FALSE 1.2951 226290 0.87 0.86 8.4944 8.6787 8.851 1 FALSE 0.6157 230973 1.77 1.83 13.5785 13.4269 13.4865 4 FALSE -0.7376 230976 0.6 0.63 11.9866 11.6726 11.7738 1 FALSE -0.1197 230977 0.58 0.58 12.1924 12.1924 12.2813 1 FALSE -0.7537 230978 0.56 0.55 12.3961 12.4974 12.579 1 FALSE -0.2728 230979 0.77 0.82 10.0446 9.3385 9.4952 1 FALSE 1.6025 230980 1.48 1.51 14.3274 14.2482 14.2883 4 FALSE -1.0082 230988 0.74 0.74 10.4266 10.4266 10.5574 1 FALSE -0.5393 255324 0.73 0.75 10.5487 10.302 10.4358 1 FALSE -0.6305 255326 0.66 0.7 11.3501 10.9024 11.0219 1 FALSE 0.4709 255326 0.65 0.7 11.4587 10.9024 11.0219 1 FALSE 1.0263 255327 0.76 0.77 10.1748 10.0446 10.1845 1 FALSE -1.1588 255328 0.79 0.82 9.7743 9.3385 9.4952 1 FALSE 0.2197 255328 0.78 0.82 9.9112 9.3385 9.4952 1 FALSE 0.9201 255331 0.6 0.6 11.9866 11.9866 12.0804 1 FALSE -0.7287 255333 0.57 0.54 12.2945 12.5983 12.6775 1 FALSE 0.751 255334 0.76 0.69 10.1748 11.0166 11.1334 1 TRUE 3.6955

Appendix D Equating Report 2007-08 NECAP Technical Report 99
Delta Analysis Reading Grade 03 IREF OLDP NEWP OLDDELTA NEWDELTA LINE MAX DISCARD STDEV_FROM_LINE
255334 0.75 0.69 10.302 11.0166 11.1334 1 TRUE 3.0446 255335 0.9 0.9 7.8738 7.8738 8.0652 1 FALSE -0.2293 255335 0.89 0.9 8.0939 7.8738 8.0652 1 FALSE -1.0615 255336 2.16 2.22 12.5983 12.4468 12.5296 4 FALSE -0.8572 255338 3.13 3.11 9.8773 9.9449 10.0871 4 FALSE -0.1352 255536 0.55 0.57 12.4974 12.2945 12.381 1 FALSE -0.6129 255545 0.55 0.54 12.4974 12.5983 12.6775 1 FALSE -0.2867

Appendix D Equating Report 2007-08 NECAP Technical Report 100
Delta Analysis Reading Grade 04
IREF OLDP NEWP OLDDELTA NEWDELTA LINE MAX DISCARD STDEV_FROM_LINE200820 0.74 0.72 10.4266 10.6686 10.6968 1 FALSE 0.4799 200822 0.81 0.82 9.4884 9.3385 9.3405 1 FALSE -0.3707 200830 0.72 0.7 10.6686 10.9024 10.9352 1 FALSE 0.4545 200843 2.27 2.5 12.3199 11.7254 11.7745 4 FALSE 2.3941 203740 0.63 0.65 11.6726 11.4587 11.5025 1 FALSE -0.2163 203743 0.55 0.57 12.4974 12.2945 12.3547 1 FALSE -0.4075 203758 0.64 0.62 11.5662 11.7781 11.8281 1 FALSE 0.4226 203768 1.54 1.63 14.1695 13.9359 14.0285 4 FALSE -0.4187 203801 0.82 0.81 9.3385 9.4884 9.4934 1 FALSE -0.3226 203806 0.77 0.76 10.0446 10.1748 10.1933 1 FALSE -0.3655 203810 2.77 2.78 10.9882 10.9597 10.9936 4 FALSE -1.3614 203858 0.52 0.52 12.7994 12.7994 12.8696 1 FALSE -0.9111 203862 0.83 0.85 9.1833 8.8543 8.8467 1 FALSE 0.9418 203871 0.54 0.53 12.5983 12.6989 12.7671 1 FALSE -0.2249 203873 2.54 2.45 11.6195 11.8566 11.9082 4 FALSE 0.6088 203890 0.9 0.92 7.8738 7.3797 7.3431 1 FALSE 2.2913 203906 0.84 0.81 9.0222 9.4884 9.4934 1 FALSE 1.8775 203922 0.8 0.79 9.6335 9.7743 9.7849 1 FALSE -0.3465 203925 0.65 0.67 11.4587 11.2403 11.2798 1 FALSE -0.1551 225764 0.79 0.79 9.7743 9.7743 9.7849 1 FALSE -1.3257 225765 0.79 0.8 9.7743 9.6335 9.6413 1 FALSE -0.4743 225766 0.64 0.62 11.5662 11.7781 11.8281 1 FALSE 0.4226 225767 0.6 0.61 11.9866 11.8827 11.9348 1 FALSE -1.0392 225769 0.63 0.63 11.6726 11.6726 11.7206 1 FALSE -1.0655 225770 0.46 0.46 13.4017 13.4017 13.4838 1 FALSE -0.8285 225772 0.72 0.72 10.6686 10.6686 10.6968 1 FALSE -1.2031 225773 0.66 0.69 11.3501 11.0166 11.0517 1 FALSE 0.6766 225776 2.29 2.34 12.269 12.1412 12.1984 4 FALSE -0.9081 225778 1.56 1.53 14.1173 14.1957 14.2934 4 FALSE -0.1745 232524 0.37 0.4 14.3274 14.0134 14.1075 1 FALSE 0.1301 232526 0.69 0.7 11.0166 10.9024 10.9352 1 FALSE -0.8331 232528 2.82 2.67 10.8447 11.2679 11.3079 4 FALSE 1.8224 232529 0.81 0.8 9.4884 9.6335 9.6413 1 FALSE -0.3359 232530 0.66 0.66 11.3501 11.3501 11.3918 1 FALSE -1.1097 232542 0.77 0.78 10.0446 9.9112 9.9245 1 FALSE -0.5639 232569 0.85 0.85 8.8543 8.8543 8.8467 1 FALSE -1.3466 232589 0.56 0.57 12.3961 12.2945 12.3547 1 FALSE -1.1114 232592 0.44 0.48 13.6039 13.2006 13.2787 1 FALSE 0.862 232595 2.11 2.25 12.7241 12.3708 12.4325 4 FALSE 0.6283 232647 0.53 0.51 12.6989 12.8997 12.9719 1 FALSE 0.4991 232657 0.71 0.7 10.7865 10.9024 10.9352 1 FALSE -0.3648 232664 0.84 0.83 9.0222 9.1833 9.1823 1 FALSE -0.2859 234353 0.69 0.68 11.0166 11.1292 11.1665 1 FALSE -0.3569

Appendix D Equating Report 2007-08 NECAP Technical Report 101
Delta Analysis Reading Grade 04 IREF OLDP NEWP OLDDELTA NEWDELTA LINE MAX DISCARD STDEV_FROM_LINE
243661 0.78 0.8 9.9112 9.6335 9.6413 1 FALSE 0.4778 255633 0.65 0.7 11.4587 10.9024 10.9352 1 FALSE 2.2414 255637 0.68 0.65 11.1292 11.4587 11.5025 1 FALSE 1.1966

Appendix D Equating Report 2007-08 NECAP Technical Report 102
Delta Analysis Reading Grade 05
IREF OLDP NEWP OLDDELTA NEWDELTA LINE MAX DISCARD STDEV_FROM_LINE201746 0.89 0.9 8.0939 7.8738 7.7302 1 FALSE 0.8949 201752 0.46 0.48 13.4017 13.2006 13.3135 1 FALSE -0.5563 201757 0.64 0.63 11.5662 11.6726 11.7119 1 FALSE -0.253 201760 0.48 0.44 13.2006 13.6039 13.7362 1 FALSE 1.8008 201769 1.9 1.86 13.2508 13.3514 13.4716 4 FALSE 0.142 201902 0.64 0.64 11.5662 11.5662 11.6004 1 FALSE -0.8406 201904 0.77 0.77 10.0446 10.0446 10.0056 1 FALSE -0.8152 201906 0.74 0.74 10.4266 10.4266 10.406 1 FALSE -0.9121 201911 1.68 1.83 13.8076 13.4269 13.5508 4 FALSE 0.332 201923 0.81 0.8 9.4884 9.6335 9.5747 1 FALSE -0.5665 201924 0.76 0.76 10.1748 10.1748 10.142 1 FALSE -0.8482 201928 0.65 0.65 11.4587 11.4587 11.4878 1 FALSE -0.8679 201937 1.75 1.78 13.6292 13.5532 13.6831 4 FALSE -0.7371 202056 0.68 0.72 11.1292 10.6686 10.6596 1 FALSE 1.4528 202059 0.72 0.73 10.6686 10.5487 10.534 1 FALSE -0.3115 202061 0.52 0.53 12.7994 12.6989 12.7877 1 FALSE -0.9593 202063 0.74 0.73 10.4266 10.5487 10.534 1 FALSE -0.4553 202065 0.61 0.61 11.8827 11.8827 11.9322 1 FALSE -0.7603 202069 0.56 0.56 12.3961 12.3961 12.4703 1 FALSE -0.6301 202072 1.56 1.62 14.1173 13.9617 14.1113 4 FALSE -0.9893 202075 1.73 1.79 13.6801 13.5279 13.6566 4 FALSE -0.8974 226477 0.82 0.82 9.3385 9.3385 9.2655 1 FALSE -0.6361 226487 0.6 0.62 11.9866 11.7781 11.8225 1 FALSE -0.1564 226490 0.57 0.6 12.2945 11.9866 12.0411 1 FALSE 0.3142 226498 0.83 0.81 9.1833 9.4884 9.4226 1 FALSE 0.2395 226500 0.75 0.73 10.302 10.5487 10.534 1 FALSE 0.201 226502 0.82 0.81 9.3385 9.4884 9.4226 1 FALSE -0.5781 226508 0.68 0.68 11.1292 11.1292 11.1424 1 FALSE -0.9515 226510 0.57 0.59 12.2945 12.0898 12.1493 1 FALSE -0.2557 226515 1.4 1.39 14.5413 14.5683 14.7471 4 FALSE 0.0634 226517 1.64 1.66 13.9102 13.8588 14.0034 4 FALSE -0.5297 226597 0.79 0.77 9.7743 10.0446 10.0056 1 FALSE 0.1974 226598 0.73 0.74 10.5487 10.4266 10.406 1 FALSE -0.2687 226599 0.72 0.8 10.6686 9.6335 9.5747 1 TRUE 4.7422 226600 0.81 0.78 9.4884 9.9112 9.8658 1 FALSE 0.967 227093 0.62 0.65 11.7781 11.4587 11.4878 1 FALSE 0.5085 230632 0.85 0.83 8.8543 9.1833 9.1028 1 FALSE 0.2885 230723 0.46 0.48 13.4017 13.2006 13.3135 1 FALSE -0.5563 233190 0.72 0.73 10.6686 10.5487 10.534 1 FALSE -0.3115 256354 0.59 0.58 12.0898 12.1924 12.2568 1 FALSE -0.1412 256359 0.91 0.89 7.637 8.0939 7.9609 1 FALSE 0.6856 256368 0.72 0.67 10.6686 11.2403 11.2589 1 FALSE 2.0886 256370 1.55 1.58 14.1434 14.0652 14.2198 4 FALSE -0.6182
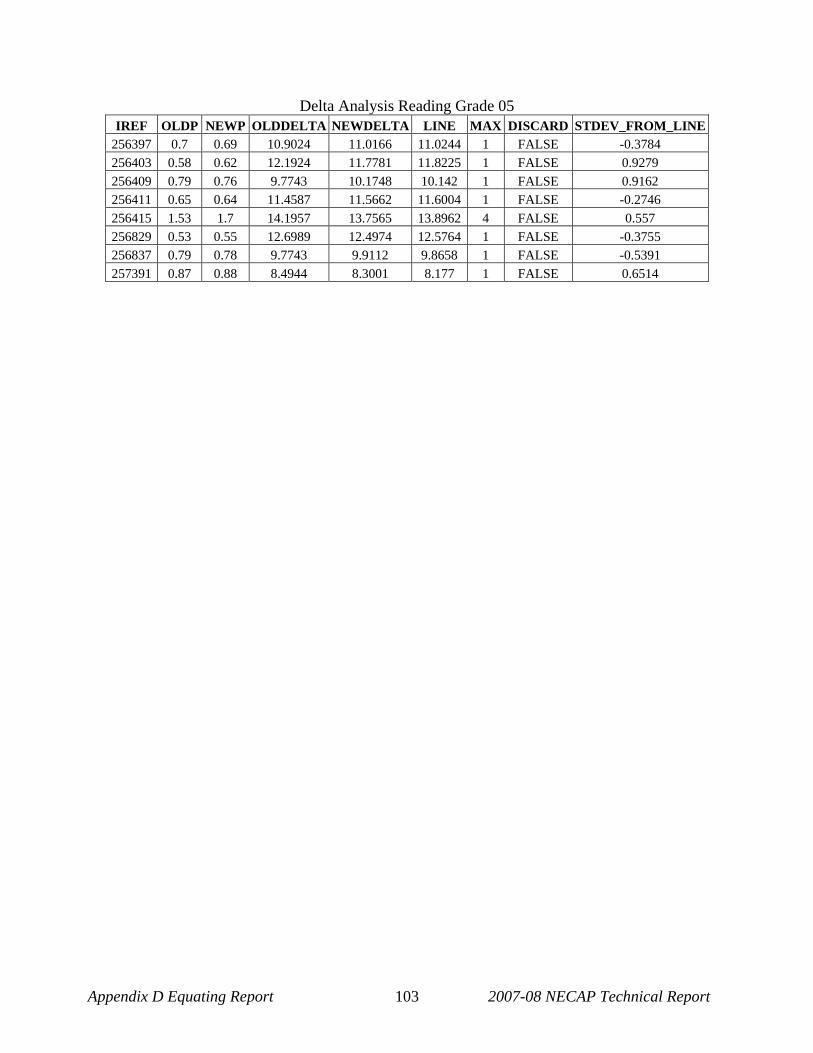
Appendix D Equating Report 2007-08 NECAP Technical Report 103
Delta Analysis Reading Grade 05 IREF OLDP NEWP OLDDELTA NEWDELTA LINE MAX DISCARD STDEV_FROM_LINE
256397 0.7 0.69 10.9024 11.0166 11.0244 1 FALSE -0.3784 256403 0.58 0.62 12.1924 11.7781 11.8225 1 FALSE 0.9279 256409 0.79 0.76 9.7743 10.1748 10.142 1 FALSE 0.9162 256411 0.65 0.64 11.4587 11.5662 11.6004 1 FALSE -0.2746 256415 1.53 1.7 14.1957 13.7565 13.8962 4 FALSE 0.557 256829 0.53 0.55 12.6989 12.4974 12.5764 1 FALSE -0.3755 256837 0.79 0.78 9.7743 9.9112 9.8658 1 FALSE -0.5391 257391 0.87 0.88 8.4944 8.3001 8.177 1 FALSE 0.6514

Appendix D Equating Report 2007-08 NECAP Technical Report 104
Delta Analysis Reading Grade 06
IREF OLDP NEWP OLDDELTA NEWDELTA LINE MAX DISCARD STDEV_FROM_LINE200339 0.51 0.54 12.8997 12.5983 12.6801 1 FALSE 0.2474 200342 0.65 0.65 11.4587 11.4587 11.5411 1 FALSE -0.6403 200345 0.76 0.75 10.1748 10.302 10.3849 1 FALSE 0.1859 200348 2.03 2.02 12.9248 12.9499 13.0316 4 FALSE -0.4824 204009 0.85 0.86 8.8543 8.6787 8.7623 1 FALSE -0.578 204011 0.9 0.9 7.8738 7.8738 7.9577 1 FALSE -0.6301 204013 0.76 0.78 10.1748 9.9112 9.9942 1 FALSE -0.0053 204014 0.86 0.87 8.6787 8.4944 8.5781 1 FALSE -0.5219 204017 0.93 0.91 7.0968 7.637 7.721 1 FALSE 2.8634 204020 0.75 0.74 10.302 10.4266 10.5094 1 FALSE 0.1682 204021 0.55 0.6 12.4974 11.9866 12.0687 1 FALSE 1.599 204022 1.85 1.83 13.3765 13.4269 13.5084 4 FALSE -0.32 204026 2.05 1.94 12.8746 13.1504 13.232 4 FALSE 1.1383 204262 0.65 0.63 11.4587 11.6726 11.7548 1 FALSE 0.7421 204266 0.71 0.72 10.7865 10.6686 10.7513 1 FALSE -0.9455 204271 0.5 0.51 13 12.8997 12.9814 1 FALSE -1.0527 204274 0.71 0.73 10.7865 10.5487 10.6315 1 FALSE -0.1706 204278 0.65 0.65 11.4587 11.4587 11.5411 1 FALSE -0.6403 204283 0.61 0.62 11.8827 11.7781 11.8603 1 FALSE -1.0276 204284 0.71 0.71 10.7865 10.7865 10.8691 1 FALSE -0.6384 204287 0.6 0.61 11.9866 11.8827 11.9649 1 FALSE -1.0322 204294 1.53 1.51 14.1957 14.2482 14.3293 4 FALSE -0.3085 204298 1.47 1.5 14.3539 14.2746 14.3557 4 FALSE -1.1615 204474 0.7 0.68 10.9024 11.1292 11.2117 1 FALSE 0.8273 204479 0.57 0.64 12.2945 11.5662 11.6485 1 TRUE 3.0049 204491 0.6 0.63 11.9866 11.6726 11.7548 1 FALSE 0.326 226657 0.69 0.69 11.0166 11.0166 11.0991 1 FALSE -0.639 226659 0.7 0.7 10.9024 10.9024 10.985 1 FALSE -0.6387 226667 0.94 0.94 6.7809 6.7809 6.8653 1 FALSE -0.627 226669 1.83 1.79 13.4269 13.5279 13.6094 4 FALSE 0.0069 226697 0.7 0.76 10.9024 10.1748 10.2577 1 FALSE 2.9962 226699 0.87 0.89 8.4944 8.0939 8.1777 1 FALSE 0.8754 226702 0.79 0.79 9.7743 9.7743 9.8574 1 FALSE -0.6355 226719 0.84 0.86 9.0222 8.6787 8.7623 1 FALSE 0.5078 226722 0.66 0.67 11.3501 11.2403 11.3228 1 FALSE -0.9958 226723 0.89 0.89 8.0939 8.0939 8.1777 1 FALSE -0.6307 226725 0.76 0.77 10.1748 10.0446 10.1276 1 FALSE -0.8675 226728 0.78 0.79 9.9112 9.7743 9.8574 1 FALSE -0.8247 226730 1.8 1.72 13.5026 13.7055 13.7869 4 FALSE 0.6651 226735 1.56 1.53 14.1173 14.1957 14.2768 4 FALSE -0.141 226737 0.88 0.9 8.3001 7.8738 7.9577 1 FALSE 1.041 227775 0.83 0.83 9.1833 9.1833 9.2667 1 FALSE -0.6338 227780 0.84 0.85 9.0222 8.8543 8.9378 1 FALSE -0.6269

Appendix D Equating Report 2007-08 NECAP Technical Report 105
Delta Analysis Reading Grade 06 IREF OLDP NEWP OLDDELTA NEWDELTA LINE MAX DISCARD STDEV_FROM_LINE
230176 0.89 0.88 8.0939 8.3001 8.3838 1 FALSE 0.7018 256334 0.71 0.74 10.7865 10.4266 10.5094 1 FALSE 0.6188 256337 0.86 0.86 8.6787 8.6787 8.7623 1 FALSE -0.6324 256342 0.82 0.81 9.3385 9.4884 9.5716 1 FALSE 0.3345 256346 0.54 0.53 12.5983 12.6989 12.7807 1 FALSE 0.0071 256347 1.62 1.72 13.9617 13.7055 13.7869 4 FALSE -0.0421 256651 0.54 0.57 12.5983 12.2945 12.3765 1 FALSE 0.2614 256674 0.61 0.62 11.8827 11.7781 11.8603 1 FALSE -1.0276

Appendix D Equating Report 2007-08 NECAP Technical Report 106
Delta Analysis Reading Grade 07
IREF OLDP NEWP OLDDELTA NEWDELTA LINE MAX DISCARD STDEV_FROM_LINE199526 0.64 0.66 11.5662 11.3501 11.5619 1 FALSE -1.4816 199527 0.67 0.7 11.2403 10.9024 11.0986 1 FALSE -0.4252 199528 0.68 0.67 11.1292 11.2403 11.4483 1 FALSE 0.9376 199529 0.78 0.77 9.9112 10.0446 10.2111 1 FALSE 0.7897 199530 0.48 0.52 13.2006 12.7994 13.0614 1 FALSE -0.4446 199531 0.71 0.74 10.7865 10.4266 10.6063 1 FALSE -0.1301 199532 0.72 0.76 10.6686 10.1748 10.3458 1 FALSE 0.9668 199533 0.84 0.86 9.0222 8.6787 8.7978 1 FALSE 0.2099 199535 1.83 1.86 13.4269 13.3514 13.6325 4 FALSE 0.0656 199536 1.84 2.07 13.4017 12.8245 13.0874 4 FALSE 0.9014 199562 0.76 0.79 10.1748 9.7743 9.9314 1 FALSE 0.356 199563 0.69 0.7 11.0166 10.9024 11.0986 1 FALSE -0.8843 199565 0.87 0.87 8.4944 8.4944 8.6071 1 FALSE -0.6486 199568 0.59 0.59 12.0898 12.0898 12.3272 1 FALSE 0.3099 199569 2.01 2.16 12.9749 12.5983 12.8533 4 FALSE -0.5798 199597 0.45 0.46 13.5026 13.4017 13.6846 1 FALSE -0.1158 199598 0.85 0.86 8.8543 8.6787 8.7978 1 FALSE -1.0804 199599 0.86 0.87 8.6787 8.4944 8.6071 1 FALSE -0.9641 199603 0.54 0.57 12.5983 12.2945 12.539 1 FALSE -1.0591 199604 0.81 0.82 9.4884 9.3385 9.4805 1 FALSE -1.4536 199605 0.78 0.77 9.9112 10.0446 10.2111 1 FALSE 0.7897 199608 1.81 1.98 13.4774 13.0501 13.3208 4 FALSE -0.3115 199609 1.71 1.82 13.731 13.4522 13.7368 4 FALSE -1.4696 201466 0.7 0.73 10.9024 10.5487 10.7327 1 FALSE -0.2103 201468 0.82 0.84 9.3385 9.0222 9.1531 1 FALSE -0.0898 201470 0.89 0.91 8.0939 7.637 7.7199 1 FALSE 1.3595 201472 0.79 0.83 9.7743 9.1833 9.3199 1 FALSE 1.9776 201476 0.84 0.86 9.0222 8.6787 8.7978 1 FALSE 0.2099 201479 0.74 0.74 10.4266 10.4266 10.6063 1 FALSE -0.1335 201482 0.6 0.61 11.9866 11.8827 12.1129 1 FALSE -0.5437 201487 0.89 0.91 8.0939 7.637 7.7199 1 FALSE 1.3595 201490 1.86 2.1 13.3514 12.7492 13.0094 4 FALSE 1.1132 201492 1.75 1.92 13.6292 13.2006 13.4765 4 FALSE -0.341 201523 0.73 0.72 10.5487 10.6686 10.8567 1 FALSE 0.8523 201529 0.61 0.63 11.8827 11.6726 11.8955 1 FALSE -1.4162 201530 0.48 0.49 13.2006 13.1003 13.3727 1 FALSE -0.1918 201532 0.79 0.8 9.7743 9.6335 9.7857 1 FALSE -1.427 201535 1.79 1.96 13.5279 13.1003 13.3727 4 FALSE -0.3218 201648 0.72 0.73 10.6686 10.5487 10.7327 1 FALSE -1.0222 226905 0.72 0.73 10.6686 10.5487 10.7327 1 FALSE -1.0222 226906 0.63 0.64 11.6726 11.5662 11.7854 1 FALSE -0.6475 233750 0.64 0.61 11.5662 11.8827 12.1129 1 FALSE 2.6874 256093 0.74 0.73 10.4266 10.5487 10.7327 1 FALSE 0.8376 256096 0.87 0.86 8.4944 8.6787 8.7978 1 FALSE 0.8167 256099 0.86 0.85 8.6787 8.8543 8.9794 1 FALSE 0.7963 256100 0.47 0.47 13.3011 13.3011 13.5805 1 FALSE 0.6328 256108 1.56 1.84 14.1173 13.4017 13.6846 4 FALSE 1.8102
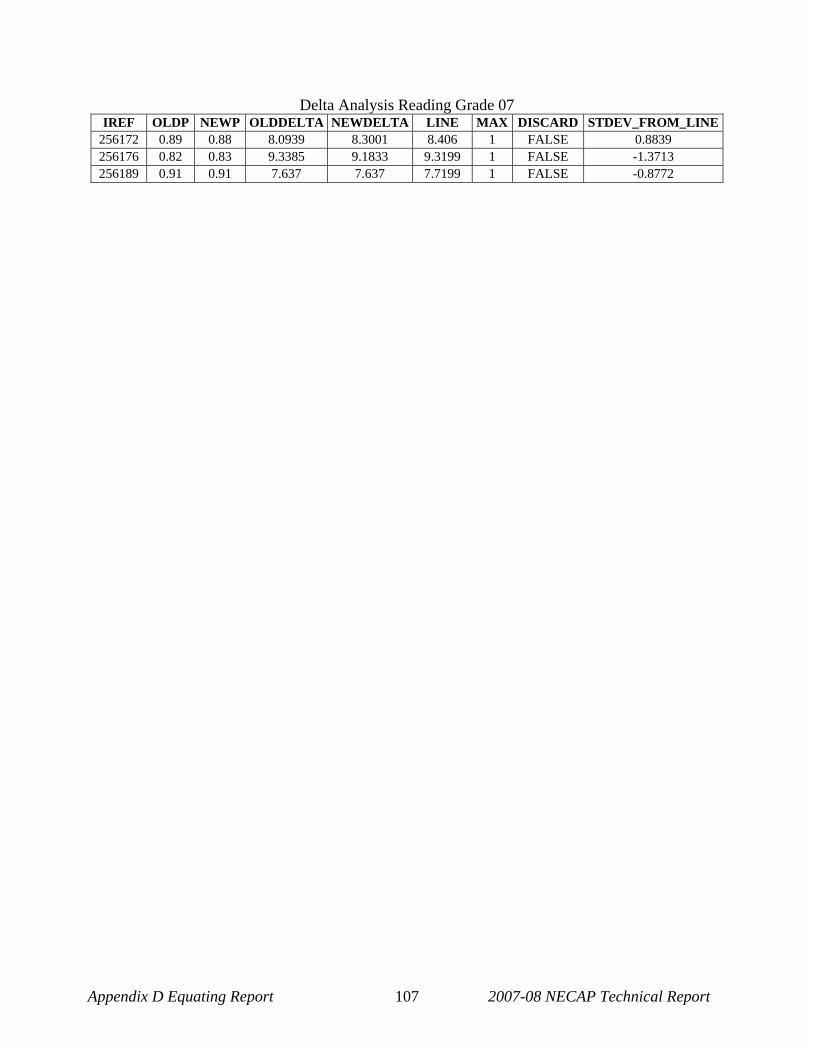
Appendix D Equating Report 2007-08 NECAP Technical Report 107
Delta Analysis Reading Grade 07 IREF OLDP NEWP OLDDELTA NEWDELTA LINE MAX DISCARD STDEV_FROM_LINE
256172 0.89 0.88 8.0939 8.3001 8.406 1 FALSE 0.8839 256176 0.82 0.83 9.3385 9.1833 9.3199 1 FALSE -1.3713 256189 0.91 0.91 7.637 7.637 7.7199 1 FALSE -0.8772

Appendix D Equating Report 2007-08 NECAP Technical Report 108
Delta Analysis Reading Grade 08
IREF OLDP NEWP OLDDELTA NEWDELTA LINE MAX DISCARD STDEV_FROM_LINE199665 0.67 0.68 11.2403 11.1292 11.1521 1 FALSE -0.7521 199666 0.72 0.69 10.6686 11.0166 11.0373 1 FALSE 0.7544 199668 0.84 0.84 9.0222 9.0222 9.0028 1 FALSE -1.1218 199670 0.69 0.67 11.0166 11.2403 11.2655 1 FALSE 0.1112 199671 0.44 0.46 13.6039 13.4017 13.4703 1 FALSE -0.5085 199674 2.01 2.2 12.9749 12.4974 12.5478 4 FALSE 1.0688 199675 2.27 2.33 12.3199 12.1668 12.2106 4 FALSE -0.6386 204093 0.84 0.82 9.0222 9.3385 9.3255 1 FALSE 0.4036 204095 0.5 0.4 13 14.0134 14.0943 1 TRUE 4.6526 204100 0.67 0.68 11.2403 11.1292 11.1521 1 FALSE -0.7521 204102 0.76 0.75 10.1748 10.302 10.3084 1 FALSE -0.5084 204106 0.67 0.64 11.2403 11.5662 11.5979 1 FALSE 0.6947 204122 0.78 0.76 9.9112 10.1748 10.1786 1 FALSE 0.2101 204128 1.76 1.85 13.6039 13.3765 13.4446 4 FALSE -0.3705 204133 2.14 2.15 12.6486 12.6235 12.6764 4 FALSE -1.0768 204140 0.71 0.7 10.7865 10.9024 10.9208 1 FALSE -0.5044 204144 0.74 0.73 10.4266 10.5487 10.56 1 FALSE -0.5093 204147 0.74 0.74 10.4266 10.4266 10.4354 1 FALSE -1.1786 204155 1.9 1.98 13.2508 13.0501 13.1117 4 FALSE -0.4783 226240 0.82 0.8 9.3385 9.6335 9.6264 1 FALSE 0.3205 226244 0.86 0.87 8.6787 8.4944 8.4644 1 FALSE -0.0748 226246 0.89 0.9 8.0939 7.8738 7.8313 1 FALSE 0.1845 226247 2.12 2.24 12.6989 12.3961 12.4445 4 FALSE 0.1408 230175 0.81 0.79 9.4884 9.7743 9.77 1 FALSE 0.2869 233566 0.91 0.89 7.637 8.0939 8.0558 1 FALSE 1.0243 233567 0.84 0.83 9.0222 9.1833 9.1672 1 FALSE -0.4469 233690 0.82 0.83 9.3385 9.1833 9.1672 1 FALSE -0.3054 233691 0.77 0.79 10.0446 9.7743 9.77 1 FALSE 0.2491 233958 0.83 0.81 9.1833 9.4884 9.4784 1 FALSE 0.3591 234521 0.74 0.73 10.4266 10.5487 10.56 1 FALSE -0.5093 243072 0.59 0.61 12.0898 11.8827 11.9208 1 FALSE -0.318 255934 0.64 0.62 11.5662 11.7781 11.814 1 FALSE 0.1057 255938 0.79 0.8 9.7743 9.6335 9.6264 1 FALSE -0.4314 255939 0.78 0.8 9.9112 9.6335 9.6264 1 FALSE 0.3041 255939 0.79 0.8 9.7743 9.6335 9.6264 1 FALSE -0.4314 255942 0.73 0.73 10.5487 10.5487 10.56 1 FALSE -1.1654 255944 0.84 0.85 9.0222 8.8543 8.8315 1 FALSE -0.2017 255944 0.86 0.85 8.6787 8.8543 8.8315 1 FALSE -0.4052 255946 0.77 0.8 10.0446 9.6335 9.6264 1 FALSE 1.0207 255947 0.43 0.41 13.7055 13.9102 13.989 1 FALSE 0.2969 255960 0.84 0.87 9.0222 8.4944 8.4644 1 FALSE 1.7702 255960 0.87 0.87 8.4944 8.4944 8.4644 1 FALSE -1.0649 255965 2.04 2.16 12.8997 12.5983 12.6507 4 FALSE 0.1118 255976 1.7 1.96 13.7565 13.1003 13.1628 4 FALSE 1.9633 256257 0.62 0.66 11.7781 11.3501 11.3775 1 FALSE 0.9259 256279 0.86 0.86 8.6787 8.6787 8.6524 1 FALSE -1.0848 256280 0.87 0.86 8.4944 8.6787 8.6524 1 FALSE -0.3772

Appendix D Equating Report 2007-08 NECAP Technical Report 109
Delta Analysis Reading Grade 08 IREF OLDP NEWP OLDDELTA NEWDELTA LINE MAX DISCARD STDEV_FROM_LINE
256287 0.88 0.88 8.3001 8.3001 8.2662 1 FALSE -1.0439 260013 0.32 0.32 14.8708 14.8708 14.9689 1 FALSE -0.699


Appendix E IRT Calibration Results 1 2007-08 NECAP Technical Report
APPENDIX E—ITEM RESPONSE THEORY
CALIBRATION RESULTS

Appendix E IRT Calibration Results 2 2007-08 NECAP Technical Report
Table E-1. IRT Item Parameters for 2007-08 NECAP: Math Grade 3 Multiple-Choice Items.
Parameters
Item Number a b c
255681 0.7589 -1.6639 0.0319
255679 0.5947 -1.9336 0.0000
255672 0.6028 -0.0720 0.0831
255648 0.9561 -0.6915 0.1518
255925 0.9699 0.6908 0.1236
198315 0.5779 -2.1149 0.0000
255663 1.1534 -1.1318 0.2377
198282 1.4877 0.3570 0.2102
201410 0.4958 -0.5632 0.2011
255911 0.7640 -2.0247 0.1239
201893 0.8192 -1.2513 0.1077
255895 0.6666 0.5125 0.2352
201438 1.0476 -0.9270 0.1704
201806 0.9077 0.3132 0.2095
226954 1.0012 -0.6404 0.1095
226981 0.7826 -1.1244 0.1348
198586 0.7813 0.6477 0.1272
198463 0.8433 -0.5708 0.0849
201289 0.4928 -1.8333 0.0798
198533 0.5661 -1.9921 0.1556
255650 0.8225 -0.5126 0.1489
255905 0.5326 -1.2210 0.0000
255902 0.5391 -2.5929 0.0000
201294 0.8835 -0.5542 0.3373
255693 1.1127 -0.7454 0.1899
255890 0.5021 -0.7201 0.1459
255617 0.8287 -1.3107 0.0800
255697 0.9234 -1.4744 0.2055
255900 1.1574 0.6147 0.0762
201951 1.1799 -0.7368 0.0494
201807 0.8509 0.0842 0.1707
255915 0.8357 -0.5766 0.1070
226962 1.0411 0.2575 0.1023
201302 1.1171 -0.8046 0.1329
227014 0.8205 -0.8833 0.0880
a = discrimination; b = difficulty; c = guessing

Appendix E IRT Calibration Results 3 2007-08 NECAP Technical Report
Table E-2. IRT Item Parameters for 2007-08 NECAP: Math Grade 3 Open-Response Items.
Parameters Item Number a b D1 D2
255932 1.0336 0.3379 N/A N/A
201500 0.5518 0.0900 N/A N/A
201510 0.8184 -1.0141 N/A N/A
201465 0.5361 -1.4245 N/A N/A
223926 0.7483 0.0456 1.7705 -1.7705
242311 0.6795 -0.7151 1.2309 -1.2309
198505 0.6136 -1.2539 0.6384 -0.6384
256001 1.0457 0.3209 0.6288 -0.6288
198504 0.5159 -2.0441 0.9536 -0.9536
202010 0.6051 -0.1595 N/A N/A
255929 0.6150 -2.1296 N/A N/A
255964 0.9702 0.1829 N/A N/A
231019 0.8133 -0.7694 0.4670 -0.4670
223935 0.6428 1.3332 0.5434 -0.5434
223936 0.8781 -0.9100 0.9158 -0.9158
227024 0.8980 0.2763 N/A N/A
255943 0.4213 -2.1981 N/A N/A
231020 0.8997 -0.1894 N/A N/A
256016 0.5995 -2.1725 1.1293 -1.1293
256021 0.7294 0.1688 0.0957 -0.0957
a = discrimination; b = difficulty; D1 = 1st category step parameter; D2 = 2nd category step parameter

Appendix E IRT Calibration Results 4 2007-08 NECAP Technical Report
Figure E-1. Test Characteristic Curve (TCC) for 2007-08 NECAP: Math Grade 3.
0
10
20
30
40
50
60
70
-4 -3 -2 -1 0 1 2 3 4
Theta
Exp
ecte
d R
aw
Sco
re
Figure E-2. Test Information Function (TIF) for 2007-08 NECAP: Math Grade 3.
0
5
10
15
20
-4 -3 -2 -1 0 1 2 3 4
Theta
Te
st
Info
rma
tio
n

Appendix E IRT Calibration Results 5 2007-08 NECAP Technical Report
Table E-3. IRT Item Parameters for 2007-08 NECAP: Math Grade 4 Multiple-Choice Items.
Parameters
Item Number a b c
198387 0.8242 -1.5415 0.0560
255682 0.6695 -0.9324 0.2077
202336 0.4959 0.2484 0.1857
255687 0.4927 -1.6019 0.1287
202348 0.8190 -0.5661 0.1675
198396 0.8808 -0.0770 0.1961
255653 1.3533 -0.1816 0.2557
227853 0.5828 0.3807 0.2453
255685 0.8282 -1.2698 0.0459
255696 0.9655 -1.6721 0.1161
255664 0.9913 -0.8173 0.1888
223963 0.5174 -0.4957 0.2864
255673 0.3971 -1.3571 0.0000
223987 1.0636 0.5064 0.0633
199240 0.5401 -1.1687 0.0519
255717 0.6342 0.6269 0.1426
255694 0.5587 -1.3643 0.0000
242669 0.8604 -0.2742 0.0792
255670 0.5940 -0.8331 0.2981
202501 0.8361 -1.4661 0.0257
227099 1.1199 0.7155 0.0586
227090 0.5259 -2.0615 0.1300
202498 0.7606 -1.4756 0.0376
202326 1.0104 -0.9052 0.1769
255692 0.7067 -1.1885 0.1577
198385 0.5466 -0.0244 0.0828
255705 1.3361 -0.2732 0.1625
202504 0.7283 -0.7251 0.0362
255698 0.7440 1.0606 0.1534
202383 0.7389 -1.0990 0.1617
224038 0.9879 0.3243 0.2538
255666 0.9194 -1.1504 0.1132
198482 0.8061 0.3746 0.2265
202403 0.8792 -0.5318 0.1416
255660 0.7608 -1.7771 0.0513
a = discrimination; b = difficulty; c = guessing

Appendix E IRT Calibration Results 6 2007-08 NECAP Technical Report
Table E-4. IRT Item Parameters for 2007-08 NECAP: Math Grade 4 Open-Response Items.
Parameters Item Number a b D1 D2
198404 1.0137 0.0130 N/A N/A 227080 0.6713 -1.2564 N/A N/A 227073 0.5204 -0.3817 N/A N/A 255728 0.8740 -0.1460 N/A N/A 227116 0.7902 -0.2113 0.7938 -0.7938
224093 0.7464 0.5673 0.9165 -0.9165
255743 0.7279 -0.5496 0.8644 -0.8644
202370 0.9327 -0.0609 0.3172 -0.3172
232607 0.8018 0.0814 0.5666 -0.5666
232631 0.8779 -0.3827 N/A N/A 224040 0.5055 -2.6621 N/A N/A 255737 0.4639 0.2755 N/A N/A 198445 0.5167 -1.0585 0.6663 -0.6663
255741 0.8932 -0.6301 1.6614 -1.6614
198427 0.6134 -1.4125 0.6527 -0.6527
255730 0.5919 -0.0291 N/A N/A 224090 0.9374 -0.5917 N/A N/A 202355 0.9899 -0.2805 N/A N/A 198439 0.7530 -0.2126 0.5923 -0.5923
227102 0.6062 -0.6426 1.1884 -1.1884
a = discrimination; b = difficulty; D1 = 1st category step parameter; D2 = 2nd category step parameter

Appendix E IRT Calibration Results 7 2007-08 NECAP Technical Report
Figure E-3. Test Characteristic Curve (TCC) for 2007-08 NECAP: Math Grade 4.
0
10
20
30
40
50
60
70
-4 -3 -2 -1 0 1 2 3 4
Theta
Ex
pe
cte
d R
aw
Sc
ore
Figure E-4. Test Information Function (TIF) for 2007-08 NECAP: Math Grade 4.
0
5
10
15
20
-4 -3 -2 -1 0 1 2 3 4
Theta
Te
st
Info
rma
tio
n

Appendix E IRT Calibration Results 8 2007-08 NECAP Technical Report
Table E-5. IRT Item Parameters for 2007-08 NECAP: Math Grade 5 Multiple-Choice Items.
Parameters
Item Number a b c
255127 0.9611 -1.4904 0.0397 230682 0.5807 -1.0274 0.0421 198500 0.9462 0.7098 0.2028 198516 0.8403 0.8860 0.2600 255130 0.7630 -0.0653 0.0807 203365 0.4609 -2.1110 0.0000 255104 1.5150 0.1304 0.1451 255144 1.3561 0.7645 0.1439 255134 1.4874 0.4917 0.1527 203368 1.1953 -0.0790 0.1619 225307 0.4740 -2.3490 0.0000 230968 0.7389 -0.2640 0.2286 198492 1.1266 0.5052 0.2476 230820 0.7985 -0.4224 0.2348 203935 1.2201 0.0054 0.4507 198371 0.7526 1.8065 0.1182 203911 0.9032 0.4244 0.3017 203928 0.4645 0.2464 0.0937 255116 0.7511 -0.5049 0.1853 203588 0.5903 0.6973 0.3119 255760 0.6880 -0.9703 0.0440 255761 0.4872 -1.8895 0.0000 255796 0.5226 -0.2061 0.0525 255802 0.9749 -0.3821 0.1329 255232 1.3786 1.7848 0.1358 255226 0.3712 -2.2305 0.0000 225378 0.6886 0.8451 0.2122 227026 0.7645 1.2584 0.1795 255762 1.0349 1.3867 0.3619 226810 1.1468 1.3511 0.1054 198494 0.6700 -1.5890 0.0878 230754 0.7684 0.3669 0.3065
a = discrimination; b = difficulty; c = guessing

Appendix E IRT Calibration Results 9 2007-08 NECAP Technical Report
Table E-6. IRT Item Parameters for 2007-08 NECAP: Math Grade 5 Open-Response Items.
Parameters Item Number a b D1 D2 D3 D4
255145 0.6093 0.6154 N/A N/A N/A N/A 258391 0.6803 -1.1930 N/A N/A N/A N/A 228544 0.9704 1.2944 0.2954 -0.2954 0.0000 0.0000
230712 0.5454 0.5978 1.3198 -1.3198 0.0000 0.0000
225023 0.7307 0.6341 N/A N/A N/A N/A 255178 0.9460 -0.1271 0.5931 -0.5931 0.0000 0.0000
272113 0.7302 0.3451 0.9109 -0.9109 0.0000 0.0000
203612 0.3286 -0.1603 N/A N/A N/A N/A 255818 0.8425 -0.1095 N/A N/A N/A N/A 255765 0.6240 -1.2716 N/A N/A N/A N/A 204019 0.9410 1.2300 0.3044 -0.3044 0.0000 0.0000
230969 0.8300 0.2233 0.8989 -0.8989 0.0000 0.0000
230971 1.0507 -0.0249 0.9926 0.3687 -0.3601 -1.0012
255265 1.0013 1.5448 1.5412 0.7463 -0.6927 -1.5947
198655 1.0132 0.1590 1.1374 0.4747 -0.5951 -1.0170
225430 1.0125 0.7957 2.2470 0.7092 -1.0696 -1.8866
a = discrimination; b = difficulty; D1 = 1st category step parameter; D2 = 2nd category step parameter; D3 = 3rd category step parameter; D4 = 4th category step parameter

Appendix E IRT Calibration Results 10 2007-08 NECAP Technical Report
Figure E-5. Test Characteristic Curve (TCC) for 2007-08 NECAP: Math Grade 5.
0
10
20
30
40
50
60
70
-4 -3 -2 -1 0 1 2 3 4
Theta
Ex
pe
cte
d R
aw
Sc
ore
Figure E-6. Test Information Function (TIF) for 2007-08 NECAP: Math Grade 5.
0
5
10
15
20
-4 -3 -2 -1 0 1 2 3 4
Theta
Te
st
Info
rma
tio
n

Appendix E IRT Calibration Results 11 2007-08 NECAP Technical Report
Table E-7. IRT Item Parameters for 2007-08 NECAP: Math Grade 6 Multiple-Choice Items.
Parameters
Item Number a b c
255360 0.7637 -1.3533 0.0466
203201 1.0836 0.2195 0.1462
255301 1.4381 1.4057 0.0519
255293 1.0338 1.6021 0.0581
203216 1.2516 -0.2698 0.2427
203388 0.5749 -1.6911 0.0000
225177 0.9637 1.1676 0.2102
203202 1.0176 0.3884 0.1676
255508 1.0697 1.6007 0.1940
255369 1.5270 0.6232 0.1653
203364 0.4107 -1.4200 0.1383
255468 0.8701 0.4178 0.2270
255554 0.8803 0.2084 0.1413
198593 1.0053 0.2779 0.0743
255347 0.7290 -0.0087 0.2620
228068 0.5499 -0.4324 0.1059
255551 0.9391 1.3752 0.1546
198709 0.6662 -0.6833 0.1626
203197 0.9179 0.3070 0.3133
255426 0.7513 0.3746 0.1387
255423 0.6228 -0.7010 0.2064
256905 1.0349 0.5678 0.1480
198597 0.4891 -0.2240 0.4490
203461 0.6434 0.4055 0.2618
228071 0.8658 -0.7557 0.0533
225347 0.8974 1.2930 0.2276
255343 0.9391 -0.1038 0.2027
255424 0.8638 0.2123 0.3564
255498 1.0594 1.4725 0.2203
225313 1.3257 0.1616 0.1392
234402 0.8221 0.6890 0.1689
255421 0.7348 0.2560 0.2368
a = discrimination; b = difficulty; c = guessing

Appendix E IRT Calibration Results 12 2007-08 NECAP Technical Report
Table E-8. IRT Item Parameters for 2007-08 NECAP: Math Grade 6 Open-Response Items.
Parameters Item Number a b D1 D2 D3 D4
255989 0.7247 1.2123 N/A N/A N/A N/A 256092 0.8387 -0.2645 N/A N/A N/A N/A 234461 1.0091 0.1696 0.1729 -0.1729 0.0000 0.0000
256095 0.6163 1.4709 1.7188 -1.7188 0.0000 0.0000
272157 0.7980 0.3788 N/A N/A N/A N/A 199933 1.1921 0.5597 0.1256 -0.1256 0.0000 0.0000
256004 0.8627 0.7039 0.4814 -0.4814 0.0000 0.0000
233782 0.9148 0.4020 N/A N/A N/A N/A 206112 0.8333 0.9090 N/A N/A N/A N/A 225091 0.7683 -0.7079 N/A N/A N/A N/A 206215 1.0560 0.4055 0.1487 -0.1487 0.0000 0.0000
225137 1.2546 1.1435 0.2858 -0.2858 0.0000 0.0000
199892 1.0476 0.7440 1.6849 0.7798 -0.9820 -1.4827
234453 0.8456 -0.0620 1.4232 0.5086 -0.5000 -1.4318
256118 0.8857 1.7261 2.2105 1.2607 -1.2652 -2.2060
256015 1.1400 1.2769 1.0895 0.2217 -0.3799 -0.9313a = discrimination; b = difficulty; D1 = 1st category step parameter; D2 = 2nd category step parameter; D3 = 3rd category step parameter; D4 = 4th category step parameter

Appendix E IRT Calibration Results 13 2007-08 NECAP Technical Report
Figure E-7. Test Characteristic Curve (TCC) for 2007-08 NECAP: Math Grade 6.
0
10
20
30
40
50
60
70
-4 -3 -2 -1 0 1 2 3 4
Theta
Ex
pe
cte
d R
aw
Sc
ore
Figure E-8. Test Information Function (TIF) for 2007-08 NECAP: Math Grade 6.
0
5
10
15
20
25
-4 -3 -2 -1 0 1 2 3 4
Theta
Te
st
Info
rma
tio
n

Appendix E IRT Calibration Results 14 2007-08 NECAP Technical Report
Table E-9. IRT Item Parameters for 2007-08 NECAP: Math Grade 7 Multiple-Choice Items.
Parameters
Item Number a b c
199875 0.8516 0.0032 0.1653
206096 0.8225 -1.6370 0.1060
224768 1.0859 0.7968 0.1856
255866 1.4572 2.0969 0.1794
228083 0.6656 0.5544 0.1946
255958 0.6700 1.1890 0.2504
206099 1.4357 0.4444 0.2406
255858 0.8873 1.5467 0.1446
256017 0.7048 -0.2178 0.0593
228085 0.7984 0.8195 0.3329
199868 0.8437 -1.0371 0.1968
199894 0.3674 -0.3698 0.1331
256070 1.0310 -0.3776 0.1998
256152 0.8749 1.4583 0.0937
224789 0.8428 -1.0510 0.0948
255948 0.8843 0.9300 0.1963
255855 0.7529 0.0699 0.1555
256124 0.4926 1.7123 0.1867
199920 0.7393 1.0683 0.1326
206140 0.4166 -0.9743 0.1251
224796 1.3764 0.8359 0.2238
256024 0.8990 0.2338 0.1266
206205 0.7571 2.0285 0.1753
255986 1.1052 -0.3548 0.1677
224799 1.3792 0.3472 0.1358
228093 0.7320 -0.9997 0.0000
228089 0.7491 0.5132 0.1892
256141 0.9563 0.4923 0.1862
206169 1.4562 0.7434 0.2615
199921 0.8661 -0.5203 0.1024
255857 1.0051 -0.2229 0.1271
228091 0.7441 -0.5568 0.1077
a = discrimination; b = difficulty; c = guessing

Appendix E IRT Calibration Results 15 2007-08 NECAP Technical Report
Table E-10. IRT Item Parameters for 2007-08 NECAP: Math Grade 7 Open-Response Items.
Parameters Item Number a b D1 D2 D3 D4
255989 0.7247 1.2123 N/A N/A N/A N/A 256092 0.8387 -0.2645 N/A N/A N/A N/A 234461 1.0091 0.1696 0.173 -0.173 N/A N/A 256095 0.6163 1.4709 1.719 -1.719 N/A N/A 272157 0.7980 0.3788 N/A N/A N/A N/A 199933 1.1921 0.5597 0.126 -0.126 N/A N/A 256004 0.8627 0.7039 0.481 -0.481 N/A N/A 233782 0.9148 0.4020 N/A N/A N/A N/A 206112 0.8333 0.9090 N/A N/A N/A N/A 225091 0.7683 -0.7079 N/A N/A N/A N/A 206215 1.0560 0.4055 0.149 -0.149 N/A N/A 225137 1.2546 1.1435 0.286 -0.286 N/A N/A 199892 1.0476 0.7440 1.685 0.780 -0.982 -1.483 234453 0.8456 -0.0620 1.423 0.509 -0.500 -1.432 256118 0.8857 1.7261 2.211 1.261 -1.265 -2.206 256015 1.1400 1.2769 1.090 0.222 -0.380 -0.931
a = discrimination; b = difficulty; D1 = 1st category step parameter; D2 = 2nd category step parameter; D3 = 3rd category step parameter; D4 = 4th category step parameter

Appendix E IRT Calibration Results 16 2007-08 NECAP Technical Report
Figure E-9. Test Characteristic Curve (TCC) for 2007-08 NECAP: Math Grade 7.
0
10
20
30
40
50
60
70
-4 -3 -2 -1 0 1 2 3 4
Theta
Ex
pe
cte
d R
aw
Sc
ore
Figure E-10. Test Information Function (TIF) for 2007-08 NECAP: Math Grade 7.
0
5
10
15
20
25
-4 -3 -2 -1 0 1 2 3 4
Theta
Te
st
Info
rma
tio
n

Appendix E IRT Calibration Results 17 2007-08 NECAP Technical Report
Table E-11. IRT Item Parameters for 2007-08 NECAP: Math Grade 8 Multiple-Choice Items.
Parameters
Item Number a b c
256401 0.7792 -1.3419 0.0597 256061 1.2889 0.3811 0.1397 206288 1.4115 0.1481 0.2570 199732 1.3699 0.4764 0.0817 256046 0.7562 1.4396 0.0360 206248 1.0553 0.0775 0.1614 256391 0.4596 -0.3504 0.0782 256058 1.1072 1.0382 0.1824 206304 1.1453 1.0067 0.3138 226527 0.8734 1.7754 0.2182 256408 0.7271 0.2127 0.2589 233717 1.3322 -0.1478 0.1387 206257 0.7701 -0.7932 0.0473 224880 1.1293 1.2446 0.1889 226521 0.7934 -0.3756 0.1800 206301 1.1783 -0.1730 0.1606 206307 0.6671 -0.1585 0.1630 224888 1.0231 0.8900 0.1522 256297 1.6242 1.8048 0.2035 206283 1.2490 0.9494 0.3099 256423 0.3661 -0.9681 0.0000 256507 0.8223 0.2581 0.1153 206298 0.7813 -0.0172 0.1286 256299 1.6550 1.4373 0.1046 256425 1.1373 1.1181 0.2354 199730 1.0908 0.1168 0.3053 256121 1.4134 1.1181 0.1916 199759 1.4260 1.6828 0.1145 256414 0.5017 -0.6649 0.0505 242375 1.1426 -0.2930 0.2610 206309 1.1188 0.3531 0.2345 206223 1.0295 0.5871 0.4978
a = discrimination; b = difficulty; c = guessing

Appendix E IRT Calibration Results 18 2007-08 NECAP Technical Report
Table E-12. IRT Item Parameters for 2007-08 NECAP: Math Grade 8 Open-Response Items.
Parameters Item Number a b D1 D2 D3 D4
246387 1.0065 0.6595 N/A N/A N/A N/A 256530 0.7359 -0.1350 N/A N/A N/A N/A 224956 1.0640 0.9317 0.5581 -0.5581 N/A N/A 256314 1.2202 0.5849 0.0835 -0.0835 N/A N/A 206312 1.4075 0.3690 0.0000 0.0000 N/A N/A 256064 1.0864 0.1505 0.5842 -0.5842 N/A N/A 224947 1.1719 0.7939 0.3522 -0.3522 N/A N/A 206317 1.0272 0.2469 N/A N/A N/A N/A 256305 0.3399 2.0061 N/A N/A N/A N/A 224952 0.7058 1.4554 N/A N/A N/A N/A 256320 1.3281 1.4975 0.1638 -0.1638 N/A N/A 242380 0.9967 0.0673 0.2509 -0.2509 N/A N/A 256107 0.9520 0.3065 0.7784 0.3690 -0.3795 -0.7679 256379 1.1343 0.3902 0.5412 0.4522 -0.2806 -0.7128 206352 1.2163 0.9072 1.2980 0.5273 -0.5511 -1.2742 224977 1.2601 -0.2392 0.6036 0.2703 -0.1667 -0.7072
a = discrimination; b = difficulty; D1 = 1st category step parameter; D2 = 2nd category step parameter; D3 = 3rd category step parameter; D4 = 4th category step parameter

Appendix E IRT Calibration Results 19 2007-08 NECAP Technical Report
Figure E-11. Test Characteristic Curve (TCC) for 2007-08 NECAP: Math Grade 8.
0
10
20
30
40
50
60
70
-4 -3 -2 -1 0 1 2 3 4
Theta
Ex
pe
cte
d R
aw
Sc
ore
Figure E-12. Test Information Function (TIF) for 2007-08 NECAP: Math Grade 8.
0
5
10
15
20
25
30
-4 -3 -2 -1 0 1 2 3 4
Theta
Te
st
Info
rma
tio
n

Appendix E IRT Calibration Results 20 2007-08 NECAP Technical Report
Table E-13. IRT Item Parameters for 2007-08 NECAP: Math Grade 11 Multiple-Choice Items.
Parameters
Item Number a b c
259949 0.7293 -0.3058 0.2299 259823 0.8278 0.1788 0.0965 259779 0.8810 1.3020 0.1228 259836 2.2585 1.7289 0.1747 259798 0.7866 0.3371 0.2479 259808 0.0493 0.0000 0.0000 259868 1.1589 1.0895 0.2803 259796 0.8963 0.8859 0.2543 259872 1.4605 1.4756 0.1741 259840 0.6817 -0.5986 0.0262 259917 1.6844 0.5513 0.2696 259805 1.0314 -0.0767 0.1531 259934 1.2805 0.0052 0.2320 259837 0.9915 1.0740 0.1176 259829 1.3066 1.2470 0.2914 259843 1.1431 0.4064 0.1777 259946 0.8836 0.9030 0.1306 259802 1.0459 0.6450 0.1938 259828 1.3038 0.5725 0.1873 259851 1.8865 1.1494 0.1635 259850 0.7914 -0.5524 0.0711 259848 1.5502 1.3971 0.2800 259777 1.0847 1.7371 0.2782 259812 0.9723 0.6822 0.2119
a = discrimination; b = difficulty; c = guessing

Appendix E IRT Calibration Results 21 2007-08 NECAP Technical Report
Table E-14. IRT Item Parameters for 2007-08 NECAP: Math Grade 11 Open-Response Items.
Parameters Item Number a b D1 D2 D3 D4
259855 0.8441 0.3216 N/A N/A N/A N/A 259989 0.8735 0.5667 N/A N/A N/A N/A 259803 1.1391 1.3934 N/A N/A N/A N/A 259881 1.1523 2.0972 N/A N/A N/A N/A 259991 0.9065 -0.2652 N/A N/A N/A N/A 259814 1.1866 0.8141 N/A N/A N/A N/A 260008 0.9903 0.8844 0.6784 -0.6784 N/A N/A 259831 1.0424 2.2781 0.1377 -0.1377 N/A N/A 259895 0.7438 1.8367 1.2228 -1.2228 N/A N/A 259867 1.0777 0.5801 N/A N/A N/A N/A 259995 0.9734 -1.2121 N/A N/A N/A N/A 259876 1.6017 1.1428 N/A N/A N/A N/A 259860 0.6825 -0.0175 N/A N/A N/A N/A 272970 0.8747 1.2949 N/A N/A N/A N/A 259965 0.7879 2.1600 N/A N/A N/A N/A 259928 0.9592 1.8850 0.5375 -0.5375 N/A N/A 260010 0.9365 0.6155 0.2240 -0.2240 N/A N/A 260002 1.3104 1.2208 0.3452 -0.3452 N/A N/A 259849 1.4147 1.0495 0.9260 0.4431 -0.4945 -0.8746 259942 1.1618 0.9559 0.5334 0.3246 -0.3144 -0.5437 260009 1.1977 0.2071 1.3075 0.6660 -0.4619 -1.5116 272064 0.8355 1.0145 1.4015 0.6781 -0.6820 -1.3976
a = discrimination; b = difficulty; D1 = 1st category step parameter; D2 = 2nd category step parameter; D3 = 3rd category step parameter; D4 = 4th category step parameter

Appendix E IRT Calibration Results 22 2007-08 NECAP Technical Report
Figure E-13. Test Characteristic Curve (TCC) for 2007-08 NECAP: Math Grade 11.
0
10
20
30
40
50
60
70
-4 -3 -2 -1 0 1 2 3 4
Theta
Ex
pe
cte
d R
aw
Sc
ore

Appendix E IRT Calibration Results 23 2007-08 NECAP Technical Report
Figure E-14. Test Information Function (TIF) for 2007-08 NECAP: Math Grade 11.
0
5
10
15
20
25
30
-4 -3 -2 -1 0 1 2 3 4
Theta
Te
st
Info
rma
tio
n

Appendix E IRT Calibration Results 24 2007-08 NECAP Technical Report
Table E-15. IRT Item Parameters for 2007-08 NECAP: Reading Grade 3 Multiple-Choice Items.
Parameters
Item Number a b c
255534 1.0063 -1.2255 0.0864 202197 0.7252 -1.4294 0.2642 255394 1.2056 -1.1755 0.2158 255395 1.2083 -0.8753 0.1917 255398 0.7948 0.5004 0.2566 255401 0.6684 -1.9148 0.1083 255450 0.7837 -0.2598 0.1375 255455 0.8541 0.6761 0.2253 255461 0.6841 -1.6060 0.0982 255465 0.9818 0.4917 0.1927 255472 0.9096 -0.7642 0.0929 255474 1.0424 -0.3163 0.2594 255475 0.7626 0.9051 0.1251 255476 1.0593 -1.2562 0.1226 242317 0.4280 0.7930 0.1187 201691 1.4116 -0.3048 0.1288 201692 0.9348 0.0594 0.1297 201694 1.3542 -1.1694 0.2045 201698 0.9334 -0.3600 0.1782 201704 0.4777 -0.6326 0.0854 201702 1.2137 -0.3442 0.1658 242318 1.1243 -0.3606 0.2078 202195 0.6941 -0.8921 0.0000 255549 0.5471 -1.6561 0.0940 255208 1.7321 -0.5938 0.3319 255216 0.4184 -1.6118 0.0000 255221 1.4273 -0.7481 0.1392 255230 1.1671 -1.5220 0.1217
a = discrimination; b = difficulty; c = guessing
Table E-16. IRT Item Parameters for 2007-08 NECAP: Reading Grade 3 Open-Response Items.
Parameters Item Number a b D1 D2 D3 D4
255405 0.6734 -0.0163 1.9375 0.5629 -0.6131 -1.8874 255485 0.8831 -2.4959 1.2459 0.7815 -0.4501 -1.5773 255482 0.7396 1.4963 2.9537 1.0014 -1.0252 -2.9300 201708 1.0169 -0.3527 1.9832 0.4793 -0.5334 -1.9291 201707 0.7508 -0.2512 2.5570 0.8350 -1.1971 -2.1948 255269 0.7217 -1.8694 1.1632 0.6053 -0.2752 -1.4932
a = discrimination; b = difficulty; D1 = 1st category step parameter; D2 = 2nd category step parameter; D3 = 3rd category step parameter; D4 = 4th category step parameter

Appendix E IRT Calibration Results 25 2007-08 NECAP Technical Report
Figure E-15. Test Characteristic Curve (TCC) for 2007-08 NECAP: Reading Grade 3.
0
10
20
30
40
50
60
-4 -3 -2 -1 0 1 2 3 4
Theta
Ex
pe
cte
d R
aw
Sc
ore
Figure E-16. Test Information Function (TIF) for 2007-08 NECAP: Reading Grade 3.
0
5
10
15
20
-4 -3 -2 -1 0 1 2 3 4
Theta
Te
st
Info
rma
tio
n

Appendix E IRT Calibration Results 26 2007-08 NECAP Technical Report
Table E-17. IRT Item Parameters for 2007-08 NECAP: Reading Grade 4 Multiple-Choice Items.
Parameters
Item Number a b c
255622 0.9147 -2.1086 0.0000 255634 0.8986 -0.4906 0.1610 225610 0.7374 -0.5753 0.0542 225611 0.7837 -0.6371 0.2186 225612 0.6717 -2.3876 0.0000 225614 0.5315 -0.0793 0.1083 255236 0.5507 -2.1931 0.0000 255247 1.0505 -1.2635 0.1506 255231 0.7239 -0.1888 0.2331 255239 1.1770 -0.2361 0.1749 255250 1.2246 -0.2986 0.2029 255258 1.2569 -0.7074 0.2704 255254 1.1090 -1.1968 0.1327 255262 0.6160 -2.4049 0.0000 255593 0.9424 -0.6787 0.2425 255595 0.6256 -0.4444 0.1356 255598 0.9009 -0.6669 0.1621 255600 0.7766 -0.9137 0.1587 255602 0.9849 -0.3423 0.2380 255606 0.4116 -0.3371 0.0539 255609 1.1150 -0.6173 0.1799 255613 0.7624 -2.2619 0.0000 226232 0.7373 -0.8549 0.2044 226208 0.4449 -0.3065 0.0485 255493 1.2016 -0.3479 0.2432 255486 1.2921 -0.9333 0.1674 255487 0.8766 -1.0726 0.1016 255505 0.7080 -0.4134 0.1295
a = discrimination; b = difficulty; c = guessing
Table E-18. IRT Item Parameters for 2007-08 NECAP: Reading Grade 4 Open-Response Items.
Parameters Item Number a b D1 D2 D3 D4
225615 0.6442 0.1827 3.1467 1.0105 -1.2305 -2.9266 255272 0.5764 0.0473 2.2158 0.8530 -0.7677 -2.3012 255264 0.9487 1.1841 2.0130 0.5854 -0.6749 -1.9235 255618 0.4618 0.4622 4.9069 3.7514 2.7138 1.7174 255614 0.8766 0.0140 0.5666 0.1229 -0.1847 -0.5048 255520 0.4783 0.7202 3.2003 0.8530 -1.1404 -2.9129
a = discrimination; b = difficulty; D1 = 1st category step parameter; D2 = 2nd category step parameter; D3 = 3rd category step parameter; D4 = 4th category step parameter

Appendix E IRT Calibration Results 27 2007-08 NECAP Technical Report
Figure E-17. Test Characteristic Curve (TCC) for 2007-08 NECAP: Reading Grade 4.
0
10
20
30
40
50
60
-4 -3 -2 -1 0 1 2 3 4
Theta
Ex
pe
cte
d R
aw
Sc
ore
Figure E-18. Test Information Function (TIF) for 2007-08 NECAP: Reading Grade 4.
0
5
10
15
-4 -3 -2 -1 0 1 2 3 4
Theta
Te
st
Info
rma
tio
n

Appendix E IRT Calibration Results 28 2007-08 NECAP Technical Report
Table E-19. IRT Item Parameters for 2007-08 NECAP: Reading Grade 5 Multiple-Choice Items.
Parameters
Item Number a b c
256839 0.811 -1.290 0.319 256832 0.693 -0.812 0.092 256628 0.934 -1.345 0.128 256629 0.811 -1.451 0.089 256637 0.998 -1.202 0.119 256640 0.740 0.041 0.162 230654 0.453 -0.184 0.099 230645 0.916 -1.395 0.067 230656 0.293 -1.942 0.000 201392 0.309 0.570 0.168 201396 0.520 -2.359 0.000 201397 0.566 0.012 0.074 201649 0.937 -0.736 0.151 230676 0.547 -0.246 0.160 256647 0.659 -1.494 0.000 256649 0.595 -0.433 0.105 256652 0.701 -0.203 0.084 256655 0.536 0.523 0.177 256657 0.889 -0.359 0.298 256669 1.029 -0.945 0.147 256666 1.019 -0.369 0.127 256664 0.732 0.383 0.180 256826 0.688 -0.367 0.181 256820 0.555 -1.003 0.098 256253 0.323 -1.517 0.000 256254 0.695 -1.225 0.093 256259 0.266 -0.371 0.000 256264 0.660 -1.922 0.000
a = discrimination; b = difficulty; c = guessing
Table E-20. IRT Item Parameters for 2007-08 NECAP: Reading Grade 5 Open-Response Items.
Parameters Item Number a b D1 D2 D3 D4
256642 0.926 0.694 2.1221 0.7851 -0.8903 -2.0168 230671 0.921 0.152 2.9169 0.6476 -1.0973 -2.4672 233132 1.029 0.581 2.2890 0.6874 -0.9596 -2.0168 256671 1.021 0.365 2.6092 0.6632 -0.9273 -2.3450 256675 1.092 0.590 2.3522 0.6355 -0.9639 -2.0238 256265 0.926 0.414 2.5818 0.6152 -0.9948 -2.2022
a = discrimination; b = difficulty; D1 = 1st category step parameter; D2 = 2nd category step parameter; D3 = 3rd category step parameter; D4 = 4th category step parameter

Appendix E IRT Calibration Results 29 2007-08 NECAP Technical Report
Figure E-19. Test Characteristic Curve (TCC) for 2007-08 NECAP: Reading Grade 5.
0
10
20
30
40
50
60
-4 -3 -2 -1 0 1 2 3 4
Theta
Ex
pe
cte
d R
aw
Sc
ore
Figure E-20. Test Information Function (TIF) for 2007-08 NECAP: Reading Grade 5.
0
5
10
15
-4 -3 -2 -1 0 1 2 3 4
Theta
Te
st
Info
rma
tio
n

Appendix E IRT Calibration Results 30 2007-08 NECAP Technical Report
Table E-21. IRT Item Parameters for 2007-08 NECAP: Reading Grade 6 Multiple-Choice Items.
Parameters
Item Number a b c
256667 0.6749 -1.3755 0.3350 256656 0.6531 -1.0603 0.1316 256355 0.8636 -2.0068 0.0919 256358 0.6032 -1.3592 0.0769 256364 0.7568 -0.3558 0.1218 256367 1.1362 -1.3003 0.2029 256613 0.4980 -1.2273 0.0904 256614 0.4207 -0.4169 0.0933 256616 0.6943 -1.7242 0.1219 256619 0.5741 -1.1507 0.0811 256624 1.0182 -2.1577 0.0000 256622 0.7448 -1.9525 0.0682 256623 0.7150 -2.0877 0.0000 256625 0.6724 -1.0260 0.0597 256426 0.4777 -0.5071 0.0442 256428 0.6237 -0.5207 0.0986 256429 0.5444 -1.8090 0.0866 256431 0.4220 -0.4874 0.0556 256433 0.8953 -1.5983 0.0659 256437 0.4436 -0.7690 0.0661 256435 0.4774 -2.1056 0.0000 256439 0.3893 -2.4966 0.0000 256658 0.6276 -1.5448 0.0718 256316 0.4341 -2.3981 0.0000 256488 0.9471 -1.1462 0.0980 256489 0.7850 0.1876 0.2064 256494 0.8173 -0.4235 0.1613 256496 0.6362 -1.2023 0.0458
a = discrimination; b = difficulty; c = guessing
Table E-22. IRT Item Parameters for 2007-08 NECAP: Reading Grade 6 Open-Response Items.
Parameters Item Number a b D1 D2 D3 D4
256373 0.9713 0.4162 2.5119 0.9436 -0.9574 -2.4980 256626 0.7813 0.6694 3.3902 0.8825 -1.2084 -3.0643 256633 0.8452 0.8337 3.2359 0.6356 -1.1814 -2.6901 256440 0.8963 1.0986 2.8048 0.8755 -0.9794 -2.7008 256445 0.8255 1.1493 2.9855 0.9134 -1.0413 -2.8576 256497 0.9253 0.4355 2.3543 0.8393 -0.8114 -2.3822
a = discrimination; b = difficulty; D1 = 1st category step parameter; D2 = 2nd category step parameter; D3 = 3rd category step parameter; D4 = 4th category step parameter

Appendix E IRT Calibration Results 31 2007-08 NECAP Technical Report
Figure E-21. Test Characteristic Curve (TCC) for 2007-08 NECAP: Reading Grade 6.
0
10
20
30
40
50
60
-4 -3 -2 -1 0 1 2 3 4
Theta
Ex
pe
cte
d R
aw
Sc
ore
Figure E-22. Test Information Function (TIF) for 2007-08 NECAP: Reading Grade 6.
0
5
10
15
-4 -3 -2 -1 0 1 2 3 4
Theta
Te
st
Info
rma
tio
n

Appendix E IRT Calibration Results 32 2007-08 NECAP Technical Report
Table E-23. IRT Item Parameters for 2007-08 NECAP: Reading Grade 7 Multiple-Choice Items.
Parameters
Item Number a b c
256193 0.5567 -2.0690 0.0000 256206 0.6797 -1.2678 0.0811 226158 0.8867 -1.8443 0.0643 226160 0.5417 -1.9205 0.0896 226162 0.7840 -0.9328 0.0836 226164 0.6217 -0.2611 0.0956 255908 0.4020 -0.9199 0.0628 255909 0.6854 -2.1539 0.0000 255912 0.7544 -1.4965 0.0938 255916 0.7931 -0.4727 0.1888 255920 1.0040 -0.3880 0.2079 255918 0.6969 -1.4222 0.0995 255922 0.3241 0.2833 0.0410 255924 0.3165 -1.8065 0.0000 255952 0.8705 -1.7194 0.0000 255961 0.4150 -0.3369 0.0558 255962 0.3629 -0.7445 0.0000 255966 0.7596 -1.2893 0.1141 255967 0.6648 0.2104 0.1503 255972 0.6784 -0.4089 0.0911 255975 0.7881 -0.4075 0.1359 255956 0.3180 -0.3264 0.1453 226919 0.6640 -2.3175 0.0000 201633 0.9625 -1.6087 0.1032 201554 0.4205 -1.4141 0.0000 201556 1.0069 -0.7361 0.1660 234444 0.6031 -0.9009 0.1022 201561 0.5962 -1.4812 0.0000
a = discrimination; b = difficulty; c = guessing
Table E-24. IRT Item Parameters for 2007-08 NECAP: Reading Grade 7 Open-Response Items.
Parameters Item Number a b D1 D2 D3 D4
226169 0.8479 0.1168 2.8054 0.6680 -1.0538 -2.4197 255933 1.0610 -0.0126 2.1678 0.6781 -0.8057 -2.0402 255928 1.0172 0.2106 1.7805 0.5584 -0.5687 -1.7702 255979 0.9671 0.4510 2.3236 0.5385 -0.9122 -1.9498 255981 1.1357 0.6057 2.1143 0.7793 -0.8237 -2.0698 201564 1.0347 -0.4735 1.5270 0.7190 -0.5496 -1.6964
a = discrimination; b = difficulty; D1 = 1st category step parameter; D2 = 2nd category step parameter; D3 = 3rd category step parameter; D4 = 4th category step parameter

Appendix E IRT Calibration Results 33 2007-08 NECAP Technical Report
Figure E-23. Test Characteristic Curve (TCC) for 2007-08 NECAP: Reading Grade 7.
0
10
20
30
40
50
60
-4 -3 -2 -1 0 1 2 3 4
Theta
Ex
pe
cte
d R
aw
Sc
ore
Figure E-24. Test Information Function (TIF) for 2007-08 NECAP: Reading Grade 7.
0
5
10
15
-4 -3 -2 -1 0 1 2 3 4
Theta
Te
st
Info
rma
tio
n

Appendix E IRT Calibration Results 34 2007-08 NECAP Technical Report
Table E-25. IRT Item Parameters for 2007-08 NECAP: Reading Grade 8 Multiple-Choice Items.
Parameters
Item Number a b c
204046 0.5514 -0.7212 0.1346 256289 0.4542 -1.7083 0.0561 256188 0.7482 -1.5508 0.0616 256194 0.5141 -1.5248 0.0409 256200 0.4407 -1.8230 0.0864 256196 0.6351 -2.4540 0.0000 256136 0.6271 -2.5562 0.1055 256140 0.3999 -1.0052 0.0565 256142 0.4766 -0.5430 0.1137 256145 0.7897 -2.2684 0.0000 256147 0.7692 -0.9595 0.1131 256151 0.4548 -0.9050 0.1076 256155 0.4700 -1.0661 0.0385 256157 0.6983 -1.5877 0.0942 255823 0.4230 -0.9543 0.0000 255824 0.6903 -2.1986 0.0000 255829 0.5205 -1.7168 0.0000 255830 1.1440 -1.6735 0.0925 255833 1.1166 -1.5192 0.0746 255834 0.8530 -1.5675 0.0459 255836 0.6816 -1.6051 0.0000 255838 1.0742 -1.4289 0.0630 256306 0.5239 -2.8699 0.0930 226356 0.4505 -1.8273 0.1062 199611 0.9041 -1.8238 0.0844 199614 0.5378 0.4523 0.1513 199616 0.5240 -2.3221 0.0000 199617 0.6305 -1.8335 0.0000
a = discrimination; b = difficulty; c = guessing
Table E-26. IRT Item Parameters for 2007-08 NECAP: Reading Grade 8 Open-Response Items.
Parameters Item Number a b D1 D2 D3 D4
256209 0.9223 -0.0839 2.5968 0.9899 -1.0887 -2.4980 256160 1.0828 -0.1118 1.8037 0.7753 -0.7307 -1.8483 256167 1.0514 -0.2258 2.4832 0.8826 -0.9747 -2.3911 255842 1.1941 -0.2821 2.0136 0.7810 -0.8204 -1.9742 255845 1.3930 -0.2685 1.6146 0.6700 -0.6365 -1.6481 199619 1.0145 -0.4974 2.4685 0.8234 -0.9527 -2.3392
a = discrimination; b = difficulty; D1 = 1st category step parameter; D2 = 2nd category step parameter; D3 = 3rd category step parameter; D4 = 4th category step parameter

Appendix E IRT Calibration Results 35 2007-08 NECAP Technical Report
Figure E-25. Test Characteristic Curve (TCC) for 2007-08 NECAP: Reading Grade 8.
0
10
20
30
40
50
60
-4 -3 -2 -1 0 1 2 3 4
Theta
Ex
pe
cte
d R
aw
Sc
ore
Figure E-26. Test Information Function (TIF) for 2007-08 NECAP: Reading Grade 8.
0
5
10
15
-4 -3 -2 -1 0 1 2 3 4
Theta
Te
st
Info
rma
tio
n

Appendix E IRT Calibration Results 36 2007-08 NECAP Technical Report
Table E-27. IRT Item Parameters for 2007-08 NECAP: Reading Grade 11 Multiple-Choice Items.
Parameters
Item Number a b c
258765 0.8091 -1.3125 0.3302 259528 0.6136 -1.1517 0.2505 258762 0.5825 -0.1417 0.1388 258751 0.4950 0.4432 0.3117 258630 0.6359 -1.7488 0.0818 258633 1.0922 -1.0944 0.1799 258634 1.1161 -1.2985 0.1842 258637 0.8965 0.6450 0.3235 258644 0.4096 -0.2210 0.1466 258651 0.4230 -1.4643 0.0000 258657 0.7955 -0.3579 0.1668 258655 0.5888 -1.0067 0.0639 258725 0.9412 -1.3521 0.0000 258724 0.5824 -1.0311 0.0000 258728 0.4922 -0.5529 0.0475 258737 0.4869 -0.3670 0.0896 258476 0.8667 -1.4219 0.0000 258475 0.8018 -1.7281 0.0000 258479 0.5257 -1.2432 0.0000 258478 0.1969 2.7778 0.0945 258607 0.8220 -0.6888 0.0367 258608 0.7678 -1.4359 0.0604 258610 0.5550 -0.2119 0.1320 258611 0.3665 -1.5010 0.0000 258612 0.9126 -0.0019 0.1938 258614 1.0417 -0.7143 0.1428 258618 0.6833 -0.8610 0.0367 258622 0.6449 -0.6928 0.0653
a = discrimination; b = difficulty; c = guessing
Table E-28. IRT Item Parameters for 2007-08 NECAP: Reading Grade 11 Open-Response Items.
Parameters Item Number a b D1 D2 D3 D4
258663 1.1683 0.1760 1.8227 0.8637 -0.6288 -2.0575 258660 1.2615 0.6792 1.8842 0.7729 -0.7486 -1.9085 258742 1.1800 0.0713 2.2034 0.9026 -0.7859 -2.3201 258481 1.2286 0.7687 1.9587 0.7002 -0.7253 -1.9336 258627 1.2319 0.5704 1.9356 0.7847 -0.7014 -2.0189 258629 1.3396 0.3427 2.0022 0.7364 -0.8216 -1.9170
a = discrimination; b = difficulty; D1 = 1st category step parameter; D2 = 2nd category step parameter; D3 = 3rd category step parameter; D4 = 4th category step parameter

Appendix E IRT Calibration Results 37 2007-08 NECAP Technical Report
Figure E-27. Test Characteristic Curve (TCC) for 2007-08 NECAP: Reading Grade
11.
0
10
20
30
40
50
60
-4 -3 -2 -1 0 1 2 3 4
Theta
Ex
pe
cte
d R
aw
Sc
ore
Figure E-28. Test Information Function (TIF) for 2007-08 NECAP: Reading Grade 11.
0
5
10
15
20
-4 -3 -2 -1 0 1 2 3 4
Theta
Te
st
Info
rma
tio
n

Appendix E IRT Calibration Results 38 2007-08 NECAP Technical Report
Table E-29. IRT Item Parameters for 2007-08 NECAP: Writing Grade 5 Multiple-Choice Items.
Parameters
Item Number a b c
213159 0.6576 -2.1667 0.0844 213385 0.7233 -1.6980 0.0823 202753 0.5223 -1.6258 0.0964 213390 0.8025 -1.5398 0.0500 213407 0.3265 1.1143 0.0868 202850 0.4976 -1.1826 0.0660 213158 0.5566 -1.9768 0.0834 213149 1.0137 -2.2105 0.0738 202822 0.3365 -2.1086 0.1101 213147 0.3291 -0.0536 0.0891
a = discrimination; b = difficulty; c = guessing
Table E-30. IRT Item Parameters for 2007-08 NECAP: Writing Grade 5 Open-Response Items.
Parameters Item Number a b D1 D2 D3 D4 D5 D6 D7 D8 D9 D10
201759 0.6767 0.0000 3.6803 1.7538 -1.2088 -3.5918 N/A N/A N/A N/A N/A N/A 201956 0.7156 0.0000 4.0032 1.5031 -1.2287 -3.8333 N/A N/A N/A N/A N/A N/A 201885 0.7086 0.0000 3.9538 1.2924 -1.0529 -2.8970 N/A N/A N/A N/A N/A N/A 213655 0.4657 0.0000 2.5247 1.6720 -0.6274 -1.3918 -3.7713 -4.5134 -6.5205 -7.0577 -8.5472 -9.6320 a = discrimination; b = difficulty; D1 = 1st category step parameter; D2 = 2nd category step parameter; D3 = 3rd category step parameter; D4 = 4th category step parameter; …; D10 = 10th category step parameter Note: Short-answer items are not included in this table because they were not part of the final calibration.

Appendix E IRT Calibration Results 39 2007-08 NECAP Technical Report
Figure E-29. Test Characteristic Curve (TCC) for 2007-08 NECAP: Writing Grade 5.
0
5
10
15
20
25
30
35
-4 -3 -2 -1 0 1 2 3 4
Theta
Ex
pe
cte
d R
aw
Sc
ore
Figure E-30. Test Information Function (TIF) for 2007-08 NECAP: Writing Grade 5.
0
5
-4 -3 -2 -1 0 1 2 3 4
Theta
Te
st
Info
rma
tio
n

Appendix E IRT Calibration Results 40 2007-08 NECAP Technical Report
Table E-31. IRT Item Parameters for 2007-08 NECAP: Writing Grade 8 Multiple-Choice Items.
Parameters
Item Number a b c
212972 1.0467 -1.2662 0.0729 213031 0.5423 -2.2060 0.0000 212973 0.7552 -1.2751 0.2200 202649 0.5718 -0.7907 0.0385 202601 0.4685 -1.5190 0.1290 212977 0.9481 -1.1532 0.0281 212950 0.2071 1.2797 0.1078 202644 0.4193 0.3191 0.1071 202633 0.6001 -0.2479 0.0740 202600 0.3571 0.4299 0.1051
a = discrimination; b = difficulty; c = guessing
Table E-32. IRT Item Parameters for 2007-08 NECAP: Writing Grade 8 Open-Response Items.
Parameters Item Number a b D1 D2 D3 D4 D5 D6 D7 D8 D9 D10
202431 1.1115 0.0000 2.7115 1.4330 -0.5509 -2.1302 N/A N/A N/A N/A N/A N/A 202475 1.1216 0.0000 2.5398 1.6010 -0.7291 -3.0394 N/A N/A N/A N/A N/A N/A 201892 0.9982 0.0000 2.5141 0.7807 -0.7853 -2.2983 N/A N/A N/A N/A N/A N/A 213706 0.6042 0.0000 2.7912 2.2536 1.1666 0.6750 -0.2718 -0.7907 -2.1105 -2.9594 -5.1264 -5.8296
a = discrimination; b = difficulty; D1 = 1st category step parameter; D2 = 2nd category step parameter; D3 = 3rd category step parameter; D4 = 4th category step parameter; …; D10 = 10th category step parameter Note: Short-answer items are not included in this table because they were not part of the final calibration.
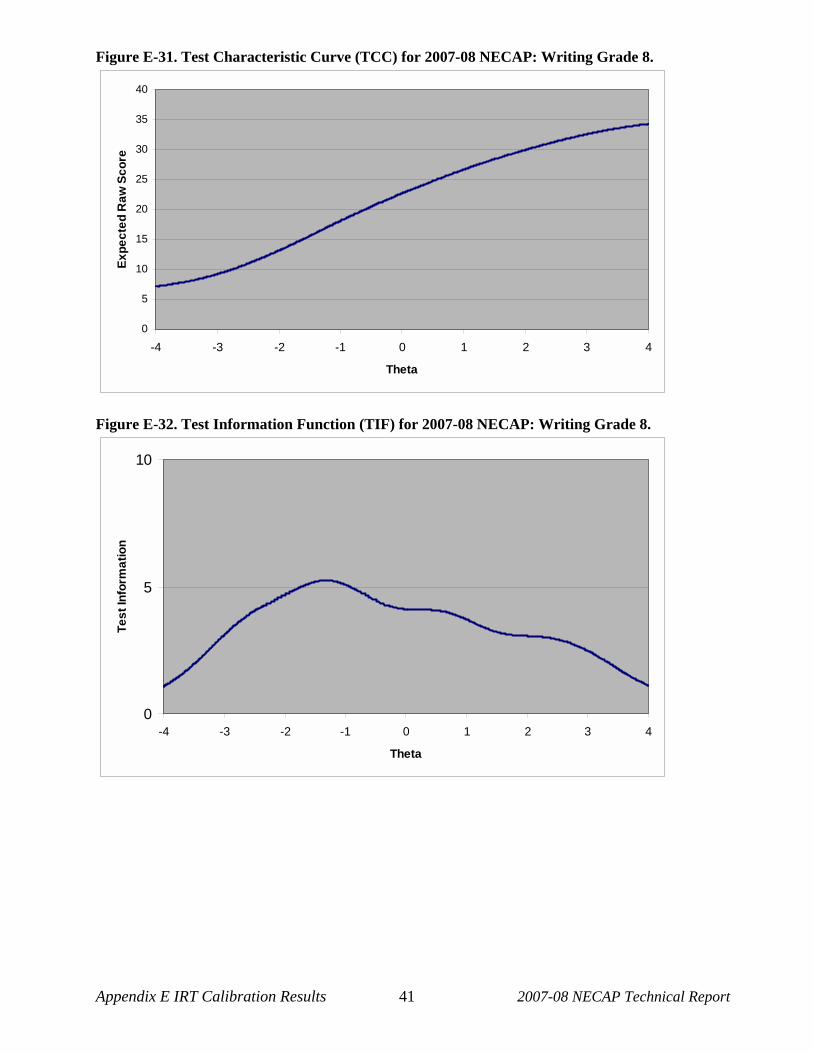
Appendix E IRT Calibration Results 41 2007-08 NECAP Technical Report
Figure E-31. Test Characteristic Curve (TCC) for 2007-08 NECAP: Writing Grade 8.
0
5
10
15
20
25
30
35
40
-4 -3 -2 -1 0 1 2 3 4
Theta
Ex
pe
cte
d R
aw
Sc
ore
Figure E-32. Test Information Function (TIF) for 2007-08 NECAP: Writing Grade 8.
0
5
10
-4 -3 -2 -1 0 1 2 3 4
Theta
Te
st
Info
rma
tio
n


Appendix F Standard Setting Report 1 2007-08 NECAP Technical Report
APPENDIX F—STANDARD SETTING REPORT

Appendix F Standard Setting Report 2 2007-08 NECAP Technical Report
2008
New England Common Assessment Program
Grade 11 Standard-Setting Report
January 9 & 10, 2008
Portsmouth, New Hampshire

Appendix F Standard Setting Report 3 2007-08 NECAP Technical Report

Appendix F Standard Setting Report 4 2007-08 NECAP Technical Report
Appendix F—Standard Setting Report ............................................................................... 1 Overview of Process............................................................................................................................ 7 1. Tasks Completed Prior to the Standard-Setting Meeting....................................................... 9
1.1 Creation of Achievement Level Descriptions (ALDs) ................................................. 9 1.2 Collection and Analysis of Existing Performance Data ............................................... 9 1.3 Establishing Starting Cut-points for Writing .............................................................. 10 1.4 Preparation of Materials for Panelists......................................................................... 10 1.5 Preparation of Presentation Materials......................................................................... 10 1.6 Preparation of Instructions for Facilitators Documents .............................................. 11 1.7 Preparation of Systems and Materials for Analysis During the Meeting ................... 11 1.8 Selection of Panelists .................................................................................................. 11
2. Tasks Completed During the Standard-Setting Meeting ...................................................... 13 2.1 Orientation .................................................................................................................. 13 2.2 Mathematics and Reading........................................................................................... 13
2.2.1 Review of Assessment Materials .......................................................................... 13 2.2.2 Completion of Item Map....................................................................................... 13 2.2.3 Review of ALDs and Definition of Borderline Students...................................... 14 2.2.4 Round 1 Judgments—Mathematics ...................................................................... 14 2.2.5 Tabulation of Round 1 Results—Mathematics..................................................... 14 2.2.6 Round 2 Judgments—Mathematics ...................................................................... 14 2.2.7 Tabulation of Round 2 Results—Mathematics..................................................... 15 2.2.8 Round 3 Judgments—Mathematics ...................................................................... 15 2.2.9 Round 1 Judgments—Reading ............................................................................. 15 2.2.10 Tabulation of Round 1 Results—Reading ............................................................ 16 2.2.11 Round 2 Judgments—Reading ............................................................................. 16
2.3 Writing ........................................................................................................................ 16 2.3.1 Discussion of Writing Scoring Rubrics and Anchor Papers................................. 16 2.3.2 Review of General ALDs...................................................................................... 16 2.3.3 Review and Discussion of Starting Cut-Points..................................................... 16 2.3.4 Writing to the Common Prompt ........................................................................... 17 2.3.5 Round 1 Judgments—Common Prompt ............................................................... 17 2.3.6 Tabulation of Round 1 Results ............................................................................. 17 2.3.7 Round 2 Judgments—Common Prompt ............................................................... 17 2.3.8 Repeat Rounds 1 and 2 for Each Matrix Prompt .................................................. 17 2.3.9 Round 3 Judgments............................................................................................... 18
2.4 Evaluation ................................................................................................................... 18 3. Tasks completed after the Standard-Setting meeting............................................................ 19
3.1 Analysis and Review of Panelists’ Feedback ............................................................. 19 3.2 Preparation of Recommended Cut Scores .................................................................. 19 3.3 Preparation of Standard-Setting Report ...................................................................... 20
Appendices......................................................................................................................................... 21 APPENDIX A: NECAP Standard Setting Achievement Level Desctriptions
(ALDs) ................................................................................................ 22 APPENDIX B: NECAP Standard Setting Opening Session Powerpoint........................ 26 APPENDIX C: NECAP Standard Setting General Instructions for Group
Facilitators - Reading -........................................................................ 40 APPENDIX D: NECAP Standard Setting General Directions for Group
Facilitators - Mathematics –................................................................ 48 APPENDIX E: NECAP Standard Setting General Directions for Group
Facilitators - Writing –........................................................................ 57 APPENDIX F: NECAP Standard Setting Grade 11 Rating Form -

Appendix F Standard Setting Report 5 2007-08 NECAP Technical Report
Reading/Mathematics - ....................................................................... 61 APPENDIX G: NECAP Grade 11 Final Writing Rubrics............................................... 65 APPENDIX H: NECAP Standard Setting Grade 11 Rating Forms -
Writing Rounds 1 and 2 -.................................................................... 71 APPENDIX J: NECAP Standard Setting Evaluation Summaries ................................... 75 APPENDIX K: NECAP Standard Setting Panelists........................................................ 87

Appendix F Standard Setting Report 6 2007-08 NECAP Technical Report

Appendix F Standard Setting Report 7 2007-08 NECAP Technical Report
Standard-Setting Process
The standard-setting meeting, to establish cut scores for the grade 11 NECAP in reading, writing, and mathematics, was held on Wednesday and Thursday, January 9 & 10. Each content area panel consisted of 16 or 17 participants. A modified version of the Bookmark standard-setting method was implemented for all grades in mathematics and reading. A modified version of the Body of Work method was used for writing. An overview of the methods is described below. To help ensure consistency of procedures between panels, each panel was led through the standard-setting process by a trained facilitator from Measured Progress.
OVERVIEW OF PROCESS
This section of the report provides an overview of the standard-setting process as implemented for NECAP. The process was divided into three stages, each with a number of constituent tasks. 1. Tasks completed prior to the standard-setting meeting
! Creation of achievement level descriptions ! Collection and analysis of existing performance data ! Calculation of starting cut-points for writing ! Preparation of materials for panelists ! Preparation of presentation materials ! Preparation of Instructions for Facilitators Documents ! Preparation of systems and materials for analysis during the meeting ! Selection of panelists
2. Tasks completed during the standard-setting meeting ! Orientation ! Reading and mathematics:
• Review of assessment materials • Completion of item map • Review of achievement level descriptions (ALDs) and definition of borderline
students • Round 1 judgments—mathematics • Tabulation of Round 1 results—mathematics • Round 2 judgments—mathematics • Tabulation of Round 2 results—mathematics • Round 3 judgments—mathematics • Round 1 judgments—Reading • Tabulation of Round 1 results—Reading • Round 2 judgments—Reading

Appendix F Standard Setting Report 8 2007-08 NECAP Technical Report
! Writing
• Discussion of writing scoring rubrics and anchor papers • Review of general achievement level descriptions • Review and discussion of starting cut-points • Writing to the common prompt • Round 1 judgments—common prompt • Tabulation of Round 1 results • Round 2 judgments—common prompt • Repeat Rounds 1 and 2 for each matrix prompt • Round 3 judgments • Evaluation
3. Tasks completed after the standard-setting meeting ! Analysis and review of panelists’ feedback ! Preparation of recommended cut scores ! Preparation of standard-setting report

Appendix F Standard Setting Report 9 2007-08 NECAP Technical Report
1. TASKS COMPLETED PRIOR TO THE STANDARD-SETTING
MEETING
1.1 Creation of Achievement Level Descriptions (ALDs)
The ALDs presented to panelists provided the official description of the set of knowledge, skills, and abilities that students are expected to display in order to be classified into each achievement level. The descriptions are provided as Appendix A of this document.
1.2 Collection and Analysis of Existing Performance Data
Prior to standard setting, a variety of data was gathered and examined for possible use in establishing starting cut-points for reading and mathematics. (A different method was used for writing; see the section that follows.) These data sources included:
! Teacher judgment data, collected from the students’ grade 10 teachers prior to the administration of the assessment in the fall;
! Performance of students on the reading and mathematics tests in grades 6 through 8 and ! Performance on high school-level tests given in prior years
Teacher Judgment Data. In the spring of 2007, teachers of grade 10 students were asked to review the descriptions of the four achievement levels and to rate their students based on classroom performance. A web site was created for teachers to enter their ratings. While this method of collecting the data is not ideal, it was not feasible to record the ratings directly on the students’ test booklets, as was done in 2006 for grades 3 through 8, primarily because grade 11 teachers would not have been familiar enough with the students to rate them accurately. Because of this data collection method and because of difficulties encountered in matching teacher judgment data to students’ test scores, data were only obtained for approximately 10% of the students tested. This amount of data was considered too sparse for starting cut-points, and so was not used. Existing Test Data. Two categories of existing test data were examined: 1) fall 2007 scores in grades 6 through 8 and 2) historical performance on other high school-level tests (for example, NAEP). For reading, starting cut-points were calculated from the existing test data as follows: the pattern of performance on the fall 2007 NECAP reading tests in grades 6, 7, and 8, was determined (specifically, the percentage of students in each achievement level category). Predicted grade 11 scores were then calculated by extrapolation. The resulting cuts were found to be in line with other high school-level testing data and to represent reasonable starting points. Therefore, they were adopted as starting cuts for standard setting. The starting cuts were presented to panelists as placements in the ordered item booklet (see below for complete details), and panelists were asked to either validate the placements or recommend modifications. For mathematics, potential starting cuts were calculated in the same way as for reading, but were not used for standard setting. The purposes of using starting cuts are to streamline and simplify the standard-setting process and to make use of any other relevant sources of available information. However, the grade 11 mathematics test was quite difficult for the students, and the extrapolated starting placements for the lower two cuts appeared very early in the ordered item booklet (specifically, between ordered items 1 and 2 and between ordered items 6 and 7). This anomaly
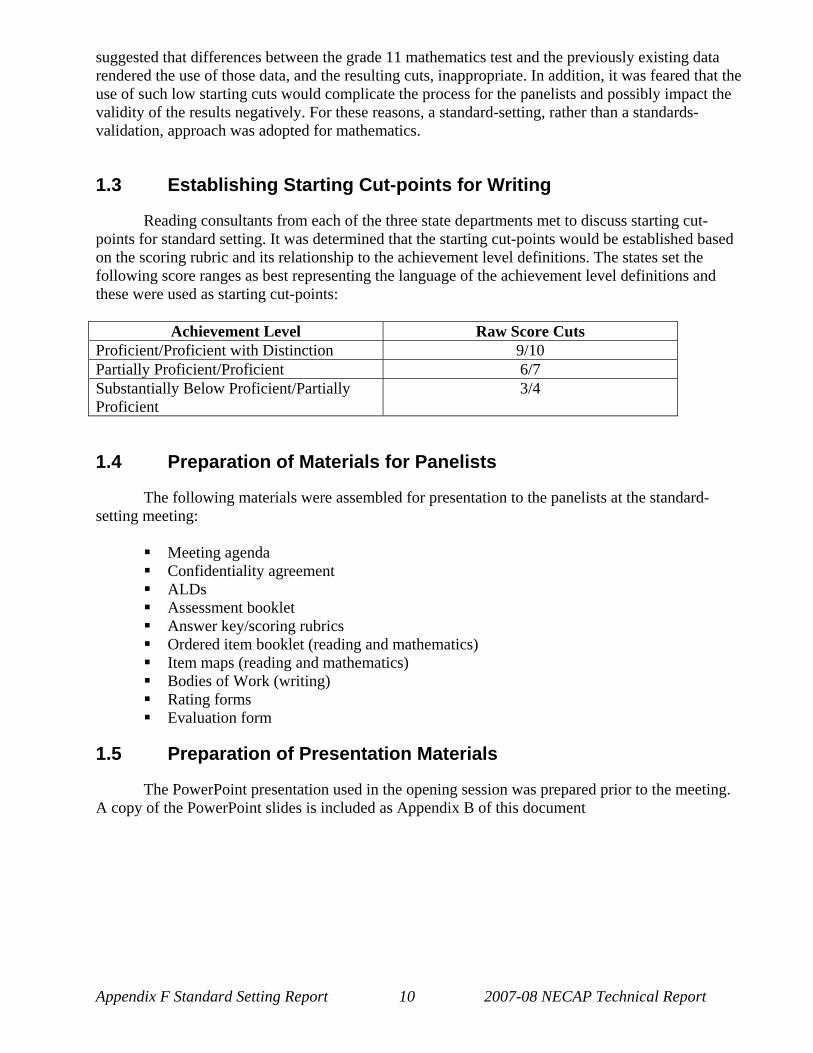
Appendix F Standard Setting Report 10 2007-08 NECAP Technical Report
suggested that differences between the grade 11 mathematics test and the previously existing data rendered the use of those data, and the resulting cuts, inappropriate. In addition, it was feared that the use of such low starting cuts would complicate the process for the panelists and possibly impact the validity of the results negatively. For these reasons, a standard-setting, rather than a standards-validation, approach was adopted for mathematics.
1.3 Establishing Starting Cut-points for Writing
Reading consultants from each of the three state departments met to discuss starting cut-points for standard setting. It was determined that the starting cut-points would be established based on the scoring rubric and its relationship to the achievement level definitions. The states set the following score ranges as best representing the language of the achievement level definitions and these were used as starting cut-points:
Achievement Level Raw Score Cuts Proficient/Proficient with Distinction 9/10 Partially Proficient/Proficient 6/7 Substantially Below Proficient/Partially Proficient
3/4
1.4 Preparation of Materials for Panelists
The following materials were assembled for presentation to the panelists at the standard-setting meeting:
! Meeting agenda ! Confidentiality agreement ! ALDs ! Assessment booklet ! Answer key/scoring rubrics ! Ordered item booklet (reading and mathematics) ! Item maps (reading and mathematics) ! Bodies of Work (writing) ! Rating forms ! Evaluation form
1.5 Preparation of Presentation Materials
The PowerPoint presentation used in the opening session was prepared prior to the meeting. A copy of the PowerPoint slides is included as Appendix B of this document

Appendix F Standard Setting Report 11 2007-08 NECAP Technical Report
1.6 Preparation of Instructions for Facilitators Documents
For each content area, a document was created for the group facilitator to refer to while working through the process. The version for reading is included as Appendix C, the version for mathematics as Appendix D, and the version for writing as Appendix E.
1.7 Preparation of Systems and Materials for Analysis During the Meeting
The computational programming to carry out all analyses during the standard-setting meeting was completed and thoroughly tested prior to the standard-setting meeting.
1.8 Selection of Panelists
Panelists were selected prior to the standard-setting meeting by the client states. The goal was to recruit 18 teachers for each panel, six from each state. Because NECAP is administered in the fall and is designed to measure grade level expectations for the end of the previous grade, it was decided that four of the six from each state should be from grade 11 and two should be from grade 10. These criteria were followed as closely as possible in recruiting and selecting the panelists. The majority of the panelists were general education teachers, but some special education and ESL teachers were recruited as well. The actual number of panelists who participated was 49, 16 each in the reading and writing groups, and 17 in the mathematics group. Of these, 18 were from New Hampshire, 17 were from Vermont, and 14 were from Rhode Island. Panelists from each state were distributed fairly uniformly across the different panels. (List of panelists is included as Appendix K.)

Appendix F Standard Setting Report 12 2007-08 NECAP Technical Report

Appendix F Standard Setting Report 13 2007-08 NECAP Technical Report
2. TASKS COMPLETED DURING THE STANDARD-SETTING MEETING
2.1 Orientation
The standard-setting meeting began with a general orientation session that was attended by all panelists. The purpose of the orientation was to provide background information, an introduction to the issues of standard setting, and a brief overview of the activities that would occur during the standard-setting meeting. Once the general orientation was complete, the writing panelists reconvened into their breakout room, where they received training specific to the Body of Work method and began the rating process. The reading and mathematics groups remained together and were given an overview of the bookmark process, after which they reconvened in their breakout rooms. Because the process followed by writing was somewhat different than that followed by reading and mathematics, the remainder of this section of the report is presented by content area. In addition, there are some differences between the processes followed by the reading and mathematics groups, so some subsections are further broken out by the two areas.
2.2 Mathematics and Reading
2.2.1 Review of Assessment Materials
Once the reading and mathematics panels convened in their breakout rooms, the first step was to take the test for their content area. The purpose of this step was to make sure the panelists were thoroughly familiar with what the assessment asks of students. Once panelists completed the test an answer key was distributed. At this point, panelists were encouraged to discuss any issues that came to mind regarding items or scoring.
2.2.2 Completion of Item Map
The purpose of the next step was to ensure that panelists became very familiar with the ordered item booklet and understood the relationships among the ordered items. The ordered item booklet contained one item (or item-score category) per page, ordered from the easiest to the most difficult. The ordered item booklet was created by sorting items by their IRT-based difficulty values (b corresponding to RP0.67 was used). A three-parameter logistic IRT model was used for the dichotomous items and the graded response IRT model was used for the polytomous items. The group facilitators explained to the panelists that each open-response item would appear multiple times in the ordered item booklet, once for each possible score point. The item map listed the items in the same order they were presented in the ordered item booklet and had spaces for the panelists to write in the knowledge, skills, and abilities required to answer correctly (or earn a particular score point). There was also a space for the panelists to write in why they felt the current ordered item was more difficult than the previous one.

Appendix F Standard Setting Report 14 2007-08 NECAP Technical Report
Because starting cuts were used for reading, and because the item mapping process can be very time-consuming, the task was narrowed for reading panelists by instructing them to start approximately five ordered items prior to each starting cut-point and stop approximately five ordered items after the cut. The range of plus or minus five ordered items was a guideline only, and panelists were free to expand that range as appropriate. For the mathematics panel, where no starting cuts were used, it was necessary for panelists to complete the item map for the full item set. Each panelist stepped through the ordered item booklet, item by item, considering the knowledge, skills, and abilities students needed to complete each one. They recorded this information onto the item map along with reasons why an item was more difficult than the previous one. After they were finished working individually, panelists had an opportunity to discuss the item map as a group and make necessary additions or adjustments.
2.2.3 Review of ALDs and Definition of Borderline Students
Next, panelists reviewed the ALDs. This important step of the process was designed to ensure that panelists thoroughly understood the needed knowledge, skills, and abilities to be classified as Partially Proficient, Proficient, and Proficient with Distinction. Panelists began individually then discussed the descriptions as a group, clarifying each level. Afterwards, panelists developed consensus definitions of borderline students, i.e., students who are “just able enough” to be categorized into an achievement level. Bulleted lists of characteristics for each level were generated based on the whole group discussion and posted in the room for reference throughout the bookmark process.
2.2.4 Round 1 Judgments—Mathematics
In the first round, panelists worked individually with the ALDs, the item map they completed earlier, and the ordered item booklet. Beginning with the first ordered item, and considering the skills and abilities needed to complete it, they asked themselves the question, “Would at least 2 out of 3 students performing at the borderline of Partially Proficient answer this question correctly (or earn this score point)?” Panelists considered each ordered item in turn, asking themselves the same question until their answer changed from “yes” (or predominantly “yes”) to “no” (or predominantly “no”). A bookmark was placed there. Panelists then repeated the process for the other two cuts and used the provided rating form to record his/her ratings for each cut (see Appendix F).
2.2.5 Tabulation of Round 1 Results—Mathematics
After the Round 1 ratings were complete, Measured Progress staff calculated the average cut-points for the room based on Round 1 bookmark placements. This information was shared with the group to assist them in Round 2.
2.2.6 Round 2 Judgments—Mathematics
The purpose of Round 2 was for panelists to discuss their Round 1 placements and revise their ratings, if necessary. Panelists shared their individual rationales for their bookmark placements in terms of the necessary knowledge and skills for each classification. Panelists were asked to pay particular attention to how their individual ratings compared to those of the others and get a sense for

Appendix F Standard Setting Report 15 2007-08 NECAP Technical Report
whether they were unusually stringent or lenient within the group. Room average cut-points were to be considered as well. Although the panelists worked as a group, the facilitators made sure it was understood that they should set the bookmark according to their individual best judgments, and that they need not come to consensus. They were encouraged to listen to the points made by their colleagues but not feel compelled to change their bookmark placements. Finally, panelists were given the opportunity to revise their Round 1 ratings on the rating form.
2.2.7 Tabulation of Round 2 Results—Mathematics
When Round 2 ratings were complete, Measured Progress staff calculated the average cut-points for the room and associated impact data. Impact data gave the percentage of students across the three states that would fall into each achievement level category according to the cut-points. This information was shared with the group to assist them in Round 3.
2.2.8 Round 3 Judgments—Mathematics
The purpose of Round 3 was to give panelists a final opportunity to discuss and, if necessary, modify their bookmark placements. Panelists were asked to consider all Round 2 results and the input of their colleagues. Once again, facilitators made sure panelists understood they were providing individual bookmark placements and not coming to consensus. After the group discussions, panelists once again recorded bookmark placements on the rating form.
2.2.9 Round 1 Judgments—Reading
For reading, starting cut-points were provided to panelists, This effectively took the place of the final, individual, round of ratings as implemented for mathematics. Reading panelists worked as a group in their first round, evaluating and (if necessary) revising the starting cut-points. Using the ALDs, the item map they completed in the previous step, and the ordered item booklet, they began with the ordered item approximately five items before the Partially Proficient starting cut-point, and considering the skills and abilities needed to complete it, asked themselves the question, “Would at least 2 out of 3 students performing at the borderline of Partially Proficient answer this question correctly (or earn this score point)?” Panelists considered each ordered item in turn, asking themselves the same question until their answer changed from “yes” (or predominantly “yes”) to “no” (or predominantly “no”). A bookmark was placed there. Panelists then repeated the process for the other two cuts and used the provided rating form to record his/her ratings for each cut (see Appendix F). Although the panelists worked as a group, the facilitators made sure it was understood that they should set the bookmark according to their individual best judgments, and that they need not come to consensus. They were encouraged to listen to the points made by their colleagues but not feel compelled to change their bookmark placements.

Appendix F Standard Setting Report 16 2007-08 NECAP Technical Report
2.2.10 Tabulation of Round 1 Results—Reading
When Round 1 ratings were complete, Measured Progress staff calculated the average cut-points for the room and associated impact data. Impact data gave the percentage of students across the three states that would fall into each achievement level category according to the cut-points. This information was shared with the group to assist them in Round 2.
2.2.11 Round 2 Judgments—Reading
The purpose of Round 2 was to give panelists an opportunity to discuss and, if necessary, modify their Round 1 bookmark placements. Panelists shared their individual rationales for their bookmark placements in terms of the necessary knowledge and skills for each classification. Panelists were asked to pay particular attention to how their individual ratings compared to those of the others and get a sense for whether they were unusually stringent or lenient within the group. Room average cut-points were to be considered as well. Finally, panelists were given the opportunity to revise their Round 1 ratings on the rating form.
2.3 Writing
2.3.1 Discussion of Writing Scoring Rubrics and Anchor Papers
The writing panelists began by reviewing the five writing scoring rubrics: Response to Literary or Informational Text, Reflective Essay, Persuasive Essay, Report, and Procedure (see Appendix G). Particular attention was paid to the rubric for Response to Informational Text, since that was the genre for the common prompt.
2.3.2 Review of General ALDs
Next, panelists reviewed the general ALDs. This important step of the process was designed to ensure that panelists thoroughly understood the needed knowledge, skills, and abilities to be classified as Partially Proficient, Proficient, and Proficient with Distinction. Panelists began individually and afterwards discussed the descriptions as a group, clarifying each level. Consensus definitions of students at each level were made into bulleted lists that were kept posted in the room for reference throughout the process.
2.3.3 Review and Discussion of Starting Cut-Points
Next, the facilitator described the process used to determine the starting cut-points, after which panelists discussed then and provided feedback or proposed alternatives.

Appendix F Standard Setting Report 17 2007-08 NECAP Technical Report
2.3.4 Writing to the Common Prompt
Next, panelists wrote to the common prompt. The purpose of this step was to make sure they were thoroughly familiar with what the prompt asked students to do.
2.3.5 Round 1 Judgments—Common Prompt
The panelists were given a set of 16 student papers (responses to the common prompt) to for making their ratings. The papers were presented in order (from lowest scoring to highest), but the scores themselves were not revealed during the Round. Working individually, panelists reviewed each paper for the skills and abilities demonstrated and their relationship to the ALDs. Panelists categorized each paper into one of the four levels, recording them on the rating sheet. (A sample of the rating sheets used for writing Rounds 1 and 2 is included as Appendix H.)
2.3.6 Tabulation of Round 1 Results
When Round 1 ratings were complete, Measured Progress staff calculated the average cut-points for the room. This information was shared with the group to assist them in Round 2.
2.3.7 Round 2 Judgments—Common Prompt
The purpose of Round 2 was for the panelists to discuss and, if necessary, revise their Round 1 ratings. They were provided with the room average cut-points from Round 1 and the scores awarded to each paper. Prior to beginning the Round 2 discussions, using a show of hands, the room facilitator indicated on chart paper how many panelists assigned each paper to the achievement levels. The facilitator also indicated on the chart paper how each paper would be categorized based on the Round 1 room average cut-points. Beginning with the first paper for which there was disagreement on categorization, panelists shared their individual rationales for categorization. The panelists were asked to pay particular attention to how their ratings compared to those of the others and get a sense for whether they were unusually stringent or lenient within the group. After the discussion, panelists were given the opportunity to revise their Round 1 ratings in the Round 2 column on the rating form. Facilitators reminded panelists that their best individual judgment was wanted, and that no one should feel compelled to change their ratings.
2.3.8 Repeat Rounds 1 and 2 for Each Matrix Prompt
After completing Rounds 1 and 2 for the common prompt, the panel followed virtually the same process for each of the five matrix prompts one by one, completing both rounds of ratings for one before proceeding to the next. The process differed from that used for the common prompt in two ways: first, panelists were asked to rate a set of 11 papers (one per score point, from 2 through 12) rather than the 16 used for the common prompt; and, second, the panelists knew the score awarded to each paper prior to doing their Round 1 ratings.

Appendix F Standard Setting Report 18 2007-08 NECAP Technical Report
2.3.9 Round 3 Judgments
After Rounds 1 and 2 were complete for the common and all five matrix prompts, panelists were given one last opportunity to discuss the placement of the cuts or any remaining issues. Then they were asked to recommend a single set of raw score cut-points to be used for all prompts on the Round 3 rating form (See Appendix I).
2.4 Evaluation
As the last step in the standard-setting process, panelists in all three groups anonymously completed an evaluation form. The results of the evaluations are presented as Appendix J.

Appendix F Standard Setting Report 19 2007-08 NECAP Technical Report
3. TASKS COMPLETED AFTER THE STANDARD-SETTING MEETING
Upon conclusion of the standard-setting meeting, several important tasks were completed. These tasks centered on reviewing the standard-setting meeting and addressing anomalies that may have occurred in the process or in the results.
3.1 Analysis and Review of Panelists’ Feedback
Upon completion of the evaluation forms, panelists’ responses were reviewed. This review did not reveal any anomalies in the standard-setting process or indicate any reason that a particular panelist’s data should not be included when the final cut-points were calculated. It appeared that all panelists understood the rating task and attended to it appropriately.
3.2 Preparation of Recommended Cut Scores
After the standard setting was completed, the cut-points on the ordered item scale and on the theta (θ) scale were calculated for mathematics based on the panelists’ Round 3 ratings, and for reading based on the Round 2 ratings. In addition, the percentages of students who would be classified into each achievement level were determined. These results are presented in Tables 1 and 2 below in the columns labeled “Standard Setting Recommended Cuts." Table 1 also shows the corresponding information for the starting cuts used for reading.
Table 1: Summary of NECAP Standard-Setting Results—Reading
Starting Cut Points Standard Setting Recommended Cuts Achievement Level Raw Score
Range % in
Category Raw Score
Range Theta Cut
% in Category
Proficient with Distinction 40-52 13.7 39-52 1.0038 17.4 Proficient 29-39 47.8 28-38 -0.3099 47.8 Partially Proficient 19-28 25.9 19-27 -1.2071 22.3 Substantially Below Proficient 0-18 12.5 0-18 12.5
Table 2: Summary of NECAP Standard-Setting Results—
Mathematics
Standard Setting Recommended Cuts Achievement Level Raw Score
Range Theta Cut % in CategoryProficient with Distinction 53-64 2.0586 1.5 Proficient 29-52 0.6190 24.5 Partially Proficient 18-28 -0.1169 27.5 Substantially Below Proficient 0-17 46.5
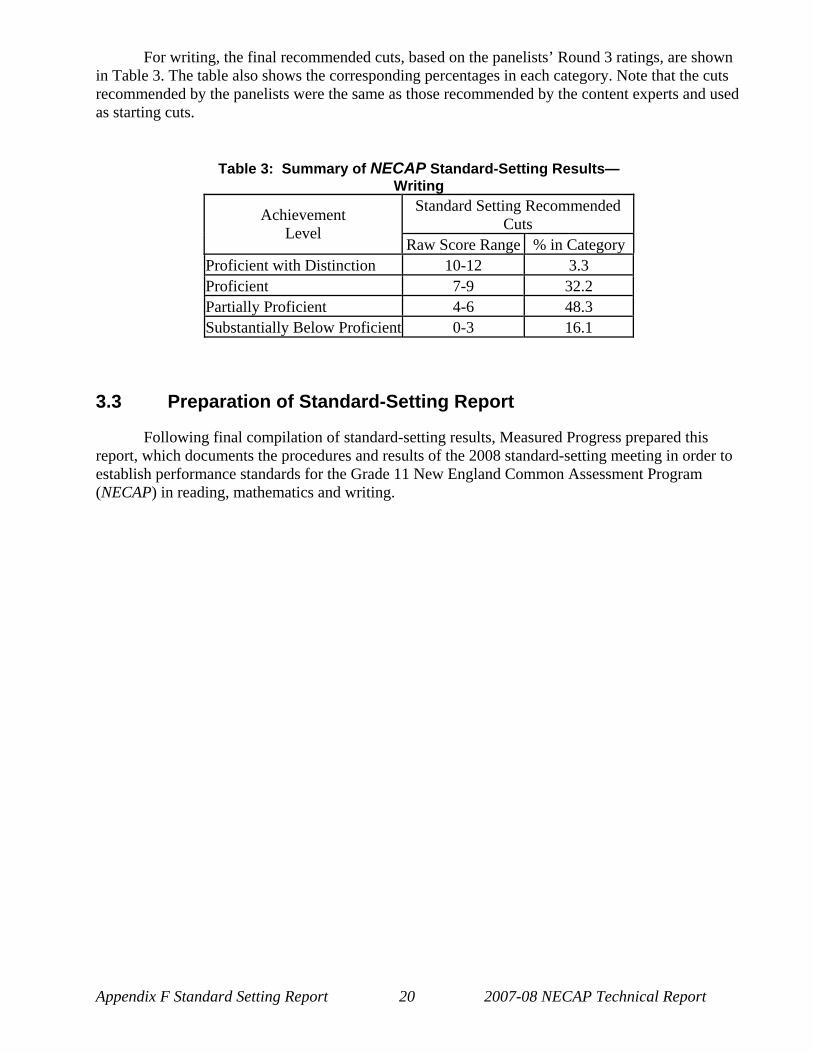
Appendix F Standard Setting Report 20 2007-08 NECAP Technical Report
For writing, the final recommended cuts, based on the panelists’ Round 3 ratings, are shown in Table 3. The table also shows the corresponding percentages in each category. Note that the cuts recommended by the panelists were the same as those recommended by the content experts and used as starting cuts.
Table 3: Summary of NECAP Standard-Setting Results—
Writing
Standard Setting Recommended Cuts Achievement
Level Raw Score Range % in Category
Proficient with Distinction 10-12 3.3 Proficient 7-9 32.2 Partially Proficient 4-6 48.3 Substantially Below Proficient 0-3 16.1
3.3 Preparation of Standard-Setting Report
Following final compilation of standard-setting results, Measured Progress prepared this report, which documents the procedures and results of the 2008 standard-setting meeting in order to establish performance standards for the Grade 11 New England Common Assessment Program (NECAP) in reading, mathematics and writing.

Appendix F Standard Setting Report 21 2007-08 NECAP Technical Report
APPENDICES

Appendix F Standard Setting Report 22 2007-08 NECAP Technical Report
APPENDIX A: NECAP STANDARD SETTING
ACHIEVEMENT LEVEL DESCTRIPTIONS (ALDS)

Appendix F Standard Setting Report 23 2007-08 NECAP Technical Report
NECAP Grade 11 General Achievement Level Descriptions
Substantially Below Proficient
Students performing at this level demonstrate extensive and significant gaps in the prerequisite knowledge and skills needed to participate and perform successfully in instructional activities aligned with the grade 9-10 GSEs. Additional instruction and support is necessary for these students to meet the grade 9-10 GSEs.
Partially Proficient
Students performing at this level demonstrate gaps in the knowledge and skills needed to participate and perform successfully in instructional activities aligned with the grade 9-10 GSEs. Additional instructional support may be necessary for these students to perform successfully in courses aligned with grade 11-12 expectations.
Proficient
Students performing at this level demonstrate minor gaps in the knowledge and skills needed to participate and perform successfully in instructional activities aligned with the grade 9-10 GSEs. It is likely that any gaps in the prerequisite knowledge and skills demonstrated by these students can be addressed by the classroom teacher during the course of classroom instruction aligned with grade 11-12 expectations.
Proficient with Distinction
Students performing at this level demonstrate the prerequisite knowledge and skills needed to participate and excel in instructional activities aligned with the grade 9-10 GSEs. Errors made by these students are few and minor and do not reflect gaps in prerequisite knowledge and skills. These students are prepared to perform successfully in classroom instruction aligned with grade 11-12 expectations.

Appendix F Standard Setting Report 24 2007-08 NECAP Technical Report
Mathematics Achievement Level Descriptions
Substantially Below Proficient
Student’s problem solving is often incomplete, lacks logical reasoning and accuracy, and shows little conceptual understanding in most aspects of the grade span expectations. Student is able to start some problems but computational errors and lack of conceptual understanding interfere with solving problems successfully.
Partially Proficient
Student’s problem solving demonstrates logical reasoning and conceptual understanding in some, but not all, aspects of the grade span expectations. Many problems are started correctly, but computational errors may get in the way of completing some aspects of the problem. Student uses some effective strategies. Student’s work demonstrates that he or she is generally stronger with concrete than abstract situations.
Proficient
Student’s problem solving demonstrates logical reasoning with appropriate explanations that include both words and proper mathematical notation. Student uses a variety of strategies that are often systematic. Computational errors do not interfere with communicating understanding. Student demonstrates conceptual understanding of most aspects of the grade span expectations.
Proficient with Distinction
Student’s problem solving demonstrates logical reasoning with strong explanations that include both words and proper mathematical notation. Student’s work exhibits a high level of accuracy, effective use of a variety of strategies, and an understanding of mathematical concepts within and across grade span expectations. Student demonstrates the ability to move from concrete to abstract representations.
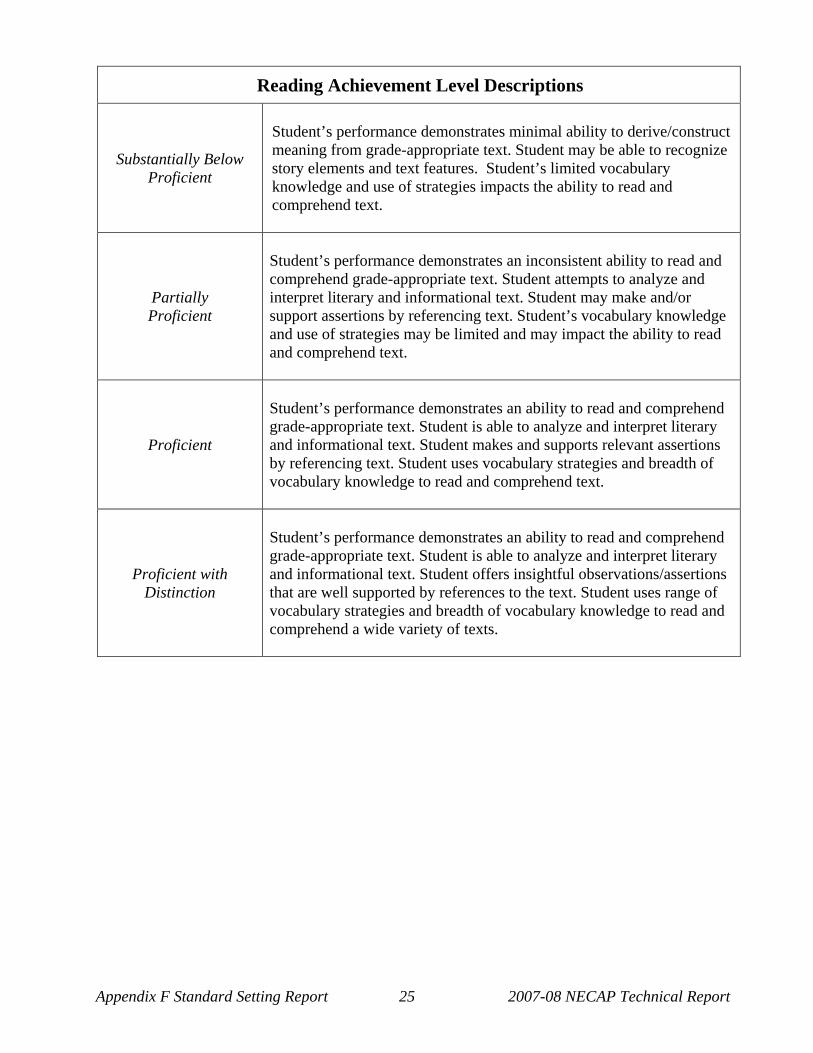
Appendix F Standard Setting Report 25 2007-08 NECAP Technical Report
Reading Achievement Level Descriptions
Substantially Below Proficient
Student’s performance demonstrates minimal ability to derive/construct meaning from grade-appropriate text. Student may be able to recognize story elements and text features. Student’s limited vocabulary knowledge and use of strategies impacts the ability to read and comprehend text.
Partially Proficient
Student’s performance demonstrates an inconsistent ability to read and comprehend grade-appropriate text. Student attempts to analyze and interpret literary and informational text. Student may make and/or support assertions by referencing text. Student’s vocabulary knowledge and use of strategies may be limited and may impact the ability to read and comprehend text.
Proficient
Student’s performance demonstrates an ability to read and comprehend grade-appropriate text. Student is able to analyze and interpret literary and informational text. Student makes and supports relevant assertions by referencing text. Student uses vocabulary strategies and breadth of vocabulary knowledge to read and comprehend text.
Proficient with Distinction
Student’s performance demonstrates an ability to read and comprehend grade-appropriate text. Student is able to analyze and interpret literary and informational text. Student offers insightful observations/assertions that are well supported by references to the text. Student uses range of vocabulary strategies and breadth of vocabulary knowledge to read and comprehend a wide variety of texts.

Appendix F Standard Setting Report 26 2007-08 NECAP Technical Report
APPENDIX B: NECAP STANDARD SETTING
OPENING SESSION POWERPOINT

Appendix F Standard Setting Report 27 2007-08 NECAP Technical Report
Slide 1
1
New EnglandCommon Assessment Program
(NECAP)Setting Performance Standards
January 9 & 10, 2008Portsmouth, NH
Slide 2
2
Purpose
• Provide data to establish the following cut scores for Reading, Math, and Writing, Grade 11:– Proficient with Distinction– Proficient– Partially Proficient– Substantially Below Proficient
Cut Score
Cut Score
Cut Score
Slide 3

Appendix F Standard Setting Report 28 2007-08 NECAP Technical Report
3
What is Standard Setting?
• Set of activities that result in the determination of threshold or cut scores on an assessment
• We are trying to answer the question:– How much is enough?
Slide 4
4
What is Standard Setting
• Data collection phase– Collection of other performance data– Standard-setting meeting
• Policy/Decision making phase– Review of data collected and final decision
about placement of cut points

Appendix F Standard Setting Report 29 2007-08 NECAP Technical Report
Slide 5
5
Many Standard Setting Methods
• Angoff• Body of Work• Bookmark
Slide 6
6
Choice of Method is Based on Many Factors
• Prior usage/history• Recommendation/requirement by some
policy making authority• Type of assessment

Appendix F Standard Setting Report 30 2007-08 NECAP Technical Report
Slide 7
7
Choice of Method is Based on Many Factors
• Weighing all these factors, it was determined that the methods to be used are:– Reading & Math: Bookmark Method– Writing: modified Body of Work Method
• Both Bookmark and Body of Work are well-established procedures that have been successfully used on many assessments
• Both have produced defensible results
Slide 8
8
Choice of Method is Based on Many Factors
• Bookmark is appropriate for assessments that consist primarily of multiple-choice items but also include some constructed-response items
• Body of Work method works well for assessments that consist primarily or entirely of constructed-response items

Appendix F Standard Setting Report 31 2007-08 NECAP Technical Report
Slide 9
9
What Next?
• Writing group will move to their breakout room; Reading and Math groups will stay here (for now)– Writing group will receive specific training on
BOW method– Reading & Math groups will receive training on
Bookmark method
Slide 10
10
What Next?
• Then, Reading and Math groups will move to their breakout rooms, and all three groups will begin standard-setting activities:– Take the test– Complete the item map (Reading & Math)– Discuss Achievement Level Descriptions (Reading &
Math) or Rubric (Writing)– Do ratings– Complete evaluation

Appendix F Standard Setting Report 32 2007-08 NECAP Technical Report
Slide 11
11
Details for Standard Setting using the Bookmark Procedure
Slide 12
12
What is the bookmark procedure?
• A standard setting procedure that uses a book of items (ordered from easiest to hardest)
• Panelists place bookmarks in that book of items

Appendix F Standard Setting Report 33 2007-08 NECAP Technical Report
Slide 13
13
What is the bookmark procedure?
Slide 14
14
A Technical Detail regarding the Bookmark Procedure
• What you need to know is that the ordered item cut point for a given cut does not equal the raw score a student must obtain to be categorized into the higher achievement level
• For example, if the Substantially Below Proficient/ Partially Proficient cut is set between ordered items 3 and 4, this does not mean that a student only needs to get 4 points on the test in order to be classified into the Partially Proficient level

Appendix F Standard Setting Report 34 2007-08 NECAP Technical Report
Slide 15
15
How to Place a Bookmark
• A few concepts you will need to know:– The achievement level descriptions– ‘Borderline’ students– What knowledge, skills, and abilities (KSAs)
are needed to answer each question
Slide 16
16
How to Place a Bookmark
• Start at the beginning of the ordered item book• Evaluate whether at least 2 out of 3 students
demonstrating skills at the ‘borderline’ of Partially Proficient would correctly answer item 1
• Moving through the book, make this evaluation of each item
• The bookmark should go where you no longer think 2 out of 3 Partially Proficient ‘borderline’students would correctly answer the question.

Appendix F Standard Setting Report 35 2007-08 NECAP Technical Report
Slide 17
17
How to Place a Bookmark
No…
No15
No14
No13
No12
No11
No10
No9
Yes8
Yes7
Yes6
Yes5
Yes4
Yes3
Yes2
Yes1
Would at least 2 out of 3 students who demonstrate skills at the Partially Proficient 'borderline' correctly answer this question?Item Number
Slide 18
18
How to Place a Bookmark
• In the example, the bookmark would go between items 8 and 9
• However, it won’t be that easy; there will be gray areas
• You will have the opportunity to discuss your bookmark placements and change them if desired
• Place one bookmark for each cut score
Slide 19

Appendix F Standard Setting Report 36 2007-08 NECAP Technical Report
19
How to Place a Bookmark
• To place your bookmarks you will need to be familiar with the achievement level descriptions and the assessment items
Slide 20
20
How to Place a Bookmark
• Don’t worry, we have procedures, materials and staff to assist you in this process.
Slide 21

Appendix F Standard Setting Report 37 2007-08 NECAP Technical Report
21
Any questions about the Bookmark Procedure?
Slide 22
22
What Next?
• After this session, you will break into grade-level groups, where you will:– take the assessment to familiarize yourself with
the test items– discuss the Achievement Level Descriptions
and develop definitions of “borderline”Partially Proficient, Proficient, and Proficient with Distinction students
Slide 23

Appendix F Standard Setting Report 38 2007-08 NECAP Technical Report
23
What Next?
• You will:– complete the Item Map, which is a document
that will help you with the bookmark placement process, and
– do the rounds of ratings
Slide 24
24
What Next?
• As the final step, we will ask you to complete an evaluation of the standard setting process
Slide 25
Appendix F Standard Setting Report 39 2007-08 NECAP Technical Report
25
Good Luck!

Appendix F Standard Setting Report 40 2007-08 NECAP Technical Report
APPENDIX C: NECAP STANDARD SETTING
GENERAL INSTRUCTIONS FOR GROUP FACILITATORS
- READING -

Appendix F Standard Setting Report 41 2007-08 NECAP Technical Report
GENERAL INSTRUCTIONS FOR NECAP STANDARD SETTING GROUP
FACILITATORS
READING GRADE 11
! Prior to Round 1 Ratings Introductions: 1. Welcome group, introduce yourself (name, affiliation, a little selected background information). 2. Have each participant introduce him/herself.
! Take the Test Overview: In order to establish an understanding of the NECAP test items and for panelists to gain an understanding of the experience of the students who take the test, each participant will take the test. Panelists may wish to discuss or take issue with the items in the test. Tell them we will gladly take their feedback to the DOE. However, this is the actual assessment that students took and it is the set of items on which we must set standards. Activities:
1) Introduce NECAP and convey/do each of the following: a. Tell panelists that they are about to take the actual NECAP assessment; b. The purpose of the exercise is to help them establish a good understanding of the
test items and to gain an understanding of the experience of the students who take the assessment;
2) Give each panelist a test booklet; 3) Tell panelists to try to take on the perspective of a student as they complete the test. 4) When the majority of the panelists have finished, pass out answer key

Appendix F Standard Setting Report 42 2007-08 NECAP Technical Report
Fill Out Item Map Overview: The primary purpose of filling out the item map is for panelists to think about and document the knowledge, skills, and abilities students need to answer each question. Panelists should have an understanding of what makes one test item harder or easier than another. The notes panelists take here will be useful in helping them place their bookmarks and in discussions during the two rounds of ratings. Activities:
1. Make sure panelists have the following materials: a. Item map b. Ordered item book
2. Review the ordered item book and item map with the panelists. Explain what each is, and point out the correspondence of the ordered items between the two. Explain that the items are ordered from easiest to hardest, and that items worth more than 1 point will appear once for each possible score point.
3. Provide an overview of the task paraphrasing the following: a. The primary purpose of this activity is for panelists to think about what makes one
question harder or easier than another. For example, it may be that the concept tested is a difficult concept, or that the concept isn’t difficult but that the particular wording of the question makes it a difficult question. Similarly, the concept may be a difficult one, but the wording of the question makes it easier.
b. Panelists should take notes about their thoughts regarding each question. These will be useful in the rating activities and later discussions.
4. Tell panelists to work individually at first. After they complete the item map they will have the opportunity to discuss it with their colleagues.
5. Note that, for the bottom cut, panelists will begin the item mapping process with the first ordered item. For the remaining two cuts, they should start five ordered items before the starting cut.
6. Each panelist will begin with the first ordered item and compare it to the next ordered item. What makes the second item harder than the first? Panelists should not agonize over these decisions. It may be that the second item is only slightly harder than the first.
7. Panelists should work their way through the item map, stopping about five ordered items after the Substantially Below Proficient/Partially Proficient starting cut.
8. Panelists will then do the same process for the Partially Proficient/Proficient and Proficient/Proficient with Distinction cuts, each time starting approximately five ordered items before the cut and ending approximately five ordered items after the cut.
9. Note that panelists may feel that they need to expand the range of items they consider in one direction or the other. Five ordered items before and after the starting cuts is a guideline, but they may consider more items if necessary.
10. Once panelists have completed the item map, they should discuss them as a group. 11. Based on the group discussion, the panelists should modify their own item map (make
additional notes, cross things out, etc…) Discuss Achievement Level Descriptions & Describe Characteristics of the “Borderline” Student Overview: In order to establish an understanding of the expected performance of borderline students

Appendix F Standard Setting Report 43 2007-08 NECAP Technical Report
on the test, panelists must have a clear understanding of:
1) The definition of the four achievement levels, and 2) Characteristics of students who are “just able enough” to be classified into each
achievement level. These students will be referred to as borderline students, since they are right on the border between achievement levels.
The purpose of this activity is for the panelists to obtain an understanding of the Achievement Level Descriptions with an emphasis on characteristics that describe students at the borderline -- both what these students can and cannot do. This activity is critical since the ratings panelists will be making in Rounds 1 and 2 will be based on these understandings. Activities:
1) Introduce task. In this activity they will: a. Individually review the Achievement Level Descriptions; b. discuss Descriptions as a group; and c. generate whole group descriptions of borderline Partially Proficient, Proficient and
Proficient with Distinction students. The facilitator should compile the descriptions as bulleted lists on chart paper; the chart paper will then be posted so the panelists can refer to the lists as they go through the bookmark process.
2) Pass out the Achievement Level Descriptions and have panelists individually review them. Panelists can make notes if they like.
3) After individually reviewing the Descriptions, have panelists discuss each one as a whole group, starting with Partially Proficient, and provide clarification. The goal here is for the panelists to have a collegial discussion in which to bring up/clarify any issues or questions, and to come to a common understanding of what it means to be in each achievement level. It is not unusual for panelists to disagree with the descriptions they will see; almost certainly there will be some panelists who will want to change them. However, the task at hand is for panelists to have a common understanding of what knowledge, skills, and abilities are described by each Achievement Level Description.
4) Once panelists have a solid understanding of the Achievement Level Descriptions, have them focus their discussion on the knowledge, skills, and abilities of students who are in the Partially Proficient category, but just barely. The focus should be on those characteristics and KSAs that best describe the lowest level of performance necessary to warrant a Partially Proficient classification.
5) After discussing Partially Proficient, have the panelists discuss characteristics of the borderline Proficient student and then characteristics of the borderline Proficient with Distinction student. Panelists should be made aware of the importance of the Proficient cut.
6) Using chart paper, generate a bulleted list of characteristics for each of the levels based on the entire room discussion. Post these on the wall of the room.
! Round 1
Overview of Round 1: The primary purpose of Round 1 is to ask the panelists to evaluate and, if necessary, revise the starting cut points. For this round, panelists will work as a group. Beginning

Appendix F Standard Setting Report 44 2007-08 NECAP Technical Report
with the starting Substantially Below Proficient/Partially Proficient cut point, panelists will evaluate each item, starting approximately five ordered items before the cut and ending approximately five ordered items after the cut (or as appropriate). (Note, again, that panelists may feel that they need to expand the range of items they consider in one direction or the other. Five ordered items before and after the starting cuts is a guideline, but they may consider more items if necessary.) The panelists will gauge the level of difficulty of each of the items for those students who barely meet the definition of Partially Proficient. The task that panelists are asked to do is to estimate whether a borderline Partially Proficient student would answer each question correctly. More specifically panelists should answer:
• Would at least 2 out of 3 students performing at the borderline answer the question correctly?
In the case of open-response questions, panelists should ask:
• Would at least 2 out of 3 students performing at the borderline get this score point or higher? This same process is then repeated for the starting Partially Proficient/Proficient cut and the starting Proficient/Proficient with Distinction cut. Activities:
1. Make sure panelists have the following materials: a. Round 1 rating form b. Ordered Item Book c. Item Map d. Achievement Level Descriptions e. Starting cut points
2. Have panelists write round number 1 and their ID number on the rating form. The ID number is on their name tags.
3. Provide an overview of Round 1. Paraphrase the following: a. Orient panelists to the ordered-item book. Explain that the items are ordered from
easiest to hardest; for constructed-response items, explain that each item appears once for each possible score point.
b. Orient panelists to the starting cut points. Make sure panelists understand that the ordered item cut point for SBP/PP is not the same as the raw score a student must obtain in order to be classified into Partially Proficient. For example, if a starting cut point is between ordered items 6 and 7, that does not mean that a student only needs 7 points to be classified as Partially Proficient.
c. The primary purpose of this activity is for the panelists to discuss whether students whose performance is barely Partially Proficient would correctly answer each item, beginning approximately five positions prior to the starting Substantially Below Proficient/Partially Proficient cut, and to place their bookmark where they believe the answer of ‘yes’ turns to ‘no’. Remind panelists that they should be thinking about two-thirds of the borderline students. Once they have completed the process for the Substantially Below Proficient/Partially Proficient cut, they will proceed to the remaining two cut points.
d. Each panelist needs to base their judgments on his/her experience with the content, understanding of students, and the definitions of the borderline students generated previously.
e. One bookmark will be placed for each cut point.

Appendix F Standard Setting Report 45 2007-08 NECAP Technical Report
f. If panelists are struggling with placing a particular bookmark they should use their best judgment and move on. They will have an opportunity to revise their ratings.
g. Panelists should feel free to take notes if there are particular points about where they placed their bookmarks that they think are worthy of discussion in Round 2.
4. Tell panelists that they will be discussing each cut point with the other panelists, but that they will be placing the bookmarks individually. It is not necessary for the panelists to come to consensus about whether and how the cut points should be revised.
5. Go over the rating form with panelists. a. Lead panelists through a step-by-step demonstration of how to fill in the rating form. b. Answer questions the panelists may have about the work in Round 1. c. Once everyone understands what they are to do in Round 1, tell them to begin.
6. Using the ordered item book, the panelists begin approximately five ordered items prior to the starting Substantially Below Proficient/Partially Proficient cut, or as appropriate.
7. After they have placed the first bookmark, they will proceed to the Partially Proficient/ Proficient cut, beginning approximately five ordered items prior to the starting cut.
8. After they have placed the second bookmark, they will proceed to the Proficient/ Proficient with Distinction cut, again beginning approximately five ordered items prior to the starting cut.
9. After they have placed all three bookmarks, have panelists fill out their rating forms. Ask them to carefully inspect their rating forms to ensure they are filled out properly.
a. The round number and ID number must be filled in. b. The item numbers identifying each cut score must be adjacent. c. Check each panelist’s rating form before you allow them to leave for a short break. d. When all the rating forms have been collected, the group will take a break.
Immediately bring the rating forms to the R&A work room for tabulation.
! Tabulation of Round 1 Results Tabulation of Round 1 results will be completed as quickly as possible after receipt of the rating forms.

Appendix F Standard Setting Report 46 2007-08 NECAP Technical Report
! Round 2 Overview of Round 2: The primary purpose of Round 2 is to ask the panelists to discuss their Round 1 placements as a whole group and to revise their ratings on the basis of that discussion. They will discuss their ratings in the context of the ratings made by other members of the group. The panelists with the highest and lowest ratings should comment on why they gave the ratings they did. The group should get a sense of how much variation there is in the ratings. Panelists should also consider the question, “How tough or easy a panelist are you?” The purpose here is to allow panelists to examine their individual expectations (in terms of their experiences) and to share these expectations and experiences in order to attain a better understanding of how their experiences impact their decision-making. To aid with the discussion, panelists will also be given impact data, showing the approximate percentage of students who would be classified into each achievement level category based on the room average bookmark placements from Round 1. Once panelists have reviewed and discussed their bookmark placements, they will be given the opportunity to change or revise their Round 1 ratings. Activities:
1. Make sure panelists have the following materials: a. The Round 2 rating forms b. Ordered item booklets c. Item maps d. Achievement Level Descriptions
2. Have panelists write round number 2 and their ID number on the rating form. 3. A psychometrician will present and explain the following information to the panelists:
a. The average bookmark placement for the whole group based on the Round 1 ratings. Based on their Round 1 ratings, panelists will know where they fall relative to the group average.
b. Impact data, showing the approximate percentage of students across the three states that would be classified into each achievement level category based on the room average bookmark placements from Round 1.
4. Provide an overview of Round 2. Paraphrase the following: a. As in Round 1, the primary purpose is to place bookmarks where you feel the
achievement levels are best distinguished, considering the additional information and further discussion.
b. Each panelist needs to base his/her judgments on his/her experience with the content area, understanding of students, the definitions of the borderline students generated previously, discussions with other panelists and the knowledge, skills, and abilities required to answer each item.
5. Panelists should be given a few minutes to review the Round 1 average cut points and impact data.
6. Once they have reviewed the information, the panelists will discuss their Round 1 ratings, beginning with the first cut point.
a. The discussion should focus on differences in where individual panelists placed their cutpoints.
b. Panelists should be encouraged to listen to their colleagues as well as express their own points of view.
c. If the panelists hear a logic/rationale/argument that they did not consider and that they feel is compelling, then they may adjust their ratings to incorporate that information.

Appendix F Standard Setting Report 47 2007-08 NECAP Technical Report
d. On the basis of the discussions and the feedback presented, panelists should make a second round of ratings.
e. When placing their Round 2 bookmarks, panelists should not feel compelled to change their ratings.
f. The group does not have to achieve consensus. If panelists honestly disagree, that is fine. We are trying to get the best judgment of each panelist. Panelists should not feel compelled or coerced into making a rating they disagree with.
Encourage the panelists to use the discussion and feedback to assess how stringent or lenient a judge they are. If a panelist is consistently higher or lower than the group, they may have a different understanding of the borderline student than the rest of the group, or a different understanding of the Achievement Level Descriptions, or both. It is O.K. for panelists to disagree, but that disagreement should be based on a common understanding of the Achievement Level Descriptions.
7. When the group has completed their second ratings, collect the rating forms. When you collect the rating forms carefully inspect them to ensure they are filled out properly.
a. The round number and panelist ID number must be filled in. b. The item numbers identifying each cut score must be adjacent. c. Check each panelist’s rating form before you allow them to leave for a short break. d. When all the rating forms have been collected, the group will take a break.
Immediately bring the rating forms to the R&A work room for tabulation.
! Complete Evaluation Form Upon completion of Round 2, have panelists fill out the evaluation form. Emphasize that their honest feedback is important.

Appendix F Standard Setting Report 48 2007-08 NECAP Technical Report
APPENDIX D: NECAP STANDARD SETTING
GENERAL DIRECTIONS FOR GROUP FACILITATORS - MATHEMATICS –

Appendix F Standard Setting Report 49 2007-08 NECAP Technical Report
GENERAL INSTRUCTIONS FOR NECAP STANDARD SETTING GROUP FACILITATORS
MATHEMATICS GRADE 11
! Prior to Round 1 Ratings
Introductions: 3. Welcome group, introduce yourself (name, affiliation, a little selected background information). 4. Have each participant introduce him/herself.
! Take the Test Overview: In order to establish an understanding of the NECAP test items and for panelists to gain an understanding of the experience of the students who take the test, each participant will take the test. Panelists may wish to discuss or take issue with the items in the test. Tell them we will gladly take their feedback to the DOE. However, this is the actual assessment that students took and it is the set of items on which we must set standards. Activities:
5) Introduce NECAP and convey/do each of the following: a. Tell panelists that they are about to take the actual NECAP assessment; b. The purpose of the exercise is to help them establish a good understanding of the
test items and to gain an understanding of the experience of the students who take the assessment;
6) Give each panelist a test booklet; 7) Tell panelists to try to take on the perspective of a student as they complete the test. 8) When the majority of the panelists have finished, pass out answer key
Fill Out Item Map Overview: The primary purpose of filling out the item map is for panelists to think about and document the knowledge, skills, and abilities students need to answer each question. Panelists should have an understanding of what makes one test item harder or easier than another. The notes panelists take here will be useful in helping them place their bookmarks and in discussions during the three rounds of ratings. Activities:
12. Make sure panelists have the following materials: a. Item map b. Ordered item book
13. Review the ordered item book and item map with the panelists. Explain what each is, and point out the correspondence of the ordered items between the two. Explain that the items are ordered from easiest to hardest, and that items worth more than 1 point will appear once for each possible score point.
14. Provide an overview of the task paraphrasing the following: a. The primary purpose of this activity is for panelists to think about what makes one
question harder or easier than another. For example, it may be that the concept tested is a difficult concept, or that the concept isn’t difficult but that the

Appendix F Standard Setting Report 50 2007-08 NECAP Technical Report
particular wording of the question makes it a difficult question. Similarly, the concept may be a difficult one, but the wording of the question makes it easier.
b. Panelists should take notes about their thoughts regarding each question. These will be useful in the rating activities and later discussions.
15. Tell panelists to work individually at first. After they complete the item map they will have the opportunity to discuss with their colleagues.
16. Each panelist will begin with the ordered item number one and compare it to the next ordered item. What makes the second item harder than the first? Panelists should not agonize over these decisions. It may be that the second item is only slightly harder than the first.
17. Panelists will continue this process, working their way through the item map and ordered item booklet.
18. Once panelists have completed their item maps, they should discuss them as a group. 19. Based on the group discussion, the panelists should modify their own item map (make
additional notes, cross things out, etc…) Discuss Achievement Level Descriptions & Describe Characteristics of the “Borderline” Student Overview: In order to establish an understanding of the expected performance of borderline students on the test, panelists must have a clear understanding of:
3) The definition of the four achievement levels, and 4) Characteristics of students who are “just able enough” to be classified into each
achievement level. These students will be referred to as borderline students, since they are right on the border between achievement levels.
The purpose of this activity is for the panelists to obtain an understanding of the Achievement Level Descriptions with an emphasis on characteristics that describe students at the borderline -- both what these students can and cannot do. This activity is critical since the ratings panelists will be making in Rounds 1 through 3 will be based on these understandings. Activities:
7) Introduce task. In this activity they will: a. Individually review the Achievement Level Descriptions; b. discuss Descriptions as a group; and c. generate whole group descriptions of borderline Partially Proficient, Proficient and
Proficient with Distinction students. The facilitator should compile the descriptions as bulleted lists on chart paper; the chart paper will then be posted so the panelists can refer to the lists as they go through the bookmark process.
8) Pass out the Achievement Level Descriptions and have panelists individually review them. Panelists can make notes if they like.
9) After individually reviewing the Descriptions, have panelists discuss each one as a whole group, starting with Partially Proficient, and provide clarification. The goal here is for

Appendix F Standard Setting Report 51 2007-08 NECAP Technical Report
the panelists to have a collegial discussion in which to bring up/clarify any issues or questions, and to come to a common understanding of what it means to be in each achievement level. It is not unusual for panelists to disagree with the descriptions they will see; almost certainly there will be some panelists who will want to change them. However, the task at hand is for panelists to have a common understanding of what knowledge, skills, and abilities are described by each Achievement Level Description.
10) Once panelists have a solid understanding of the Achievement Level Descriptions, have them focus their discussion on the knowledge, skills, and abilities of students who are in the Partially Proficient category, but just barely. The focus should be on those characteristics and KSAs that best describe the lowest level of performance necessary to warrant a Partially Proficient classification.
11) After discussing Partially Proficient, have the panelists discuss characteristics of the borderline Proficient student and then characteristics of the borderline Proficient with Distinction student. Panelists should be made aware of the importance of the Proficient cut.
12) Using chart paper, generate a bulleted list of characteristics for each of the levels based on the entire room discussion. Post these on the wall of the room.
! Round 1 Overview of Round 1: The purpose of Round 1 is for the panelists to make their initial judgments as to where the bookmarks should be placed. For this round, panelists will work individually, without consulting with their colleagues. Beginning with the first ordered item and the Substantially Below Proficient/Partially Proficient cut point, panelists will evaluate each item in turn. The panelists will gauge the level of difficulty of each of the items for those students who barely meet the definition of Partially Proficient. The task that panelists are asked to do is to estimate whether a borderline Partially Proficient student would answer each question correctly. More specifically panelists should answer:
• Would at least 2 out of 3 students performing at the borderline answer the question correctly?
In the case of open-response questions, panelists should ask:
• Would at least 2 out of 3 students performing at the borderline get this score point or higher? This same process is then repeated for the starting Partially Proficient/Proficient cut and the starting Proficient/Proficient with Distinction cut. Activities:
10. Make sure panelists have the following materials: a. Round 1 rating form b. Ordered Item Book c. Item Map d. Achievement Level Descriptions
11. Have panelists write round number 1 and their ID number on the rating form. The ID number is on their name tags.
12. Provide an overview of Round 1, covering each of the following:
Appendix F Standard Setting Report 52 2007-08 NECAP Technical Report
a. Orient panelists to the ordered-item book. Explain that the items are ordered from easiest to hardest; for open-response items, explain that each item appears once for each possible score point.
b. The primary purpose of this activity is for the panelists to discuss whether students whose performance is barely Partially Proficient would correctly answer each item, and to place their bookmark where they believe the answer of ‘yes’ turns to ‘no’. Remind panelists that they should be thinking about two-thirds of the borderline students. Once they have completed the process for the Substantially Below Proficient/Partially Proficient cut, they will proceed to the remaining two cut points.
c. Each panelist needs to base his/her judgments on his/her experience with the content, understanding of students, and the definitions of the borderline students generated previously.
d. One bookmark will be placed for each cut point. e. If panelists are struggling with placing a particular bookmark they should use their
best judgment and move on. They will have an opportunity to revise their ratings in Rounds 2 and 3.
f. Panelists should feel free to take notes if there are particular points about where they placed their bookmarks that they think are worthy of discussion in Round 2.
13. Go over the rating form with panelists. a. Lead panelists through a step-by-step demonstration of how to fill in the rating form. b. Answer questions the panelists may have about the work in Round 1. c. Once everyone understands what they are to do in Round 1, tell them to begin.
14. The panelists begin with ordered item number 1and proceed through the ordered item booklet, each time asking whether at least two out of three borderline students would correctly answer the question. They will place their first bookmark at the point where the answer changes from “yes” to “no.”
15. After they have placed the first bookmark, they will continue through the ordered item booklet, making the same judgments for the Partially Proficient/Proficient cut, and the Proficient/Proficient with Distinction cut.
16. After they have placed all three bookmarks, have panelists fill out their rating forms. Ask them to carefully inspect their rating forms to ensure they are filled out properly.
a. The round number and ID number must be filled in. b. The item numbers identifying each cut score must be adjacent. c. Check each panelist’s rating form before you allow them to leave for a short break. d. When all the rating forms have been collected, the group will take a break.
Immediately bring the rating forms to the R&A work room for tabulation.
! Tabulation of Round 1 Results Tabulation of Round 1 results will be completed as quickly as possible after receipt of the rating forms.
! Round 2 Overview of Round 2: The primary purpose of Round 2 is to ask the panelists to discuss their Round 1 placements as a whole group and to revise their ratings on the basis of that discussion. They will discuss their ratings in the context of the ratings made by other members of the group. The panelists with the highest and lowest ratings should comment on why they gave the ratings they did. The group should get a sense of how much variation there is in the ratings. Panelists should also consider the question, “How tough or easy a panelist are you?” The purpose here is to allow panelists to examine their individual expectations (in terms of their experiences) and to share these expectations and experiences in order to attain a better understanding of how their experiences

Appendix F Standard Setting Report 53 2007-08 NECAP Technical Report
impact their decision-making. To aid with the discussion, a psychometrician will present the group with the room average bookmark placements from Round 1. Once panelists have reviewed and discussed their bookmark placements, they will be given the opportunity to change or revise their Round 1 ratings. Activities:
8. Make sure panelists have the following materials: a. The Round 2 rating forms b. Ordered item booklets c. Item maps d. Achievement Level Descriptions
9. Have panelists write round number 2 and their ID number on the rating form. 10. A psychometrician will present and explain the average bookmark placement for the whole
group based on the Round 1 ratings. Based on their Round 1 ratings, panelists will know where they fall relative to the group average. This information is useful so that panelists get a sense if they are more stringent or more lenient than other panelists.
11. Provide an overview of Round 2. Paraphrase the following: a. As in Round 1, the primary purpose is to place bookmarks where you feel the
achievement levels are best distinguished, considering the additional information and further discussion.
b. Each panelist needs to base his/her judgments on his/her experience with the content area, understanding of students, the definitions of the borderline students generated previously, discussions with other panelists and the knowledge, skills, and abilities required to answer each item.
12. Panelists should be given a few minutes to review the bookmark placements based on the room average cut points from Round 1.
13. Once they have reviewed the information, the panelists will discuss their Round 1 ratings, beginning with the first cut point.
g. The discussion should focus on differences in where individual panelists placed their cutpoints.
h. Panelists should be encouraged to listen to their colleagues as well as express their own points of view.
i. If the panelists hear a logic/rationale/argument that they did not consider and that they feel is compelling, then they may adjust their ratings to incorporate that information.
j. On the basis of the discussions and the feedback presented, panelists should make a second round of ratings.
k. When placing their Round 2 bookmarks, panelists should not feel compelled to change their ratings.
l. The group does not have to achieve consensus. If panelists honestly disagree, that is fine. We are trying to get the best judgment of each panelist. Panelists should not feel compelled or coerced into making a rating they disagree with.
Encourage the panelists to use the discussion and feedback to assess how stringent or lenient a judge they are. If a panelist is consistently higher or lower than the group, they may have a different understanding of the borderline student than the rest of the group, or a different understanding of the Achievement Level Descriptions, or both. It is O.K. for panelists to disagree, but that disagreement should be based on a common

Appendix F Standard Setting Report 54 2007-08 NECAP Technical Report
understanding of the Achievement Level Descriptions.
14. When the group has completed their second ratings, collect the rating forms. When you collect the rating forms carefully inspect them to ensure they are filled out properly.
a. The round number and panelist ID number must be filled in. b. The item numbers identifying each cut score must be adjacent. c. Check each panelist’s rating form before you allow them to leave for a short break. d. When all the rating forms have been collected, the group will take a break.
Immediately bring the rating forms to the R&A work room for tabulation.
! Tabulation of Round 2 Results Round 2 results will be tabulated as soon as possible upon receipt of the rating forms.
! Round 3 Overview of Round 3: In Round 3, the panelists will discuss their Round 2 ratings as a whole group and have another opportunity to revise their ratings on the basis of that discussion. Again, they will discuss their ratings in the context of the ratings made by other members of the group. To aid with the discussion, a psychometrician may present impact data to each group (this decision will be made at the standard-setting meeting). The impact data shows the approximate percentage of students across the three states that would be classified into each achievement level category based on the room average bookmark placements from Round 2. Once panelists have reviewed and discussed their bookmark placements, they will be given the opportunity to revise their Round 2 ratings. Activities:
1. Make sure panelists have the following materials: a. The Round 3 rating forms b. Ordered item booklets c. Item maps d. Achievement Level Descriptions
2. Have panelists write round number 3 and their ID number on the rating form.
3. A psychometrician will present and explain the average bookmark placement for the whole
group based on the Round 2 ratings. Again, based on their Round 2 ratings, panelists will know where they fall relative to the group average. The psychometrician may also present impact data, showing the approximate percentage of students across the three states that would be classified into each achievement level category based on the room average bookmark placements from Round 2.
4. Provide an overview of Round 3. Paraphrase the following:
a. As in Rounds 1 and 2, the primary purpose is to place bookmarks where you feel the achievement levels are best distinguished, considering the additional information and further discussion.
b. Each panelist needs to base his/her judgments on his/her experience with the content
area, understanding of students, the definitions of the borderline students generated

Appendix F Standard Setting Report 55 2007-08 NECAP Technical Report
previously, discussions with other panelists and the knowledge, skills, and abilities required to answer each item.
5. Panelists should be given a few minutes to review the Round 2 average cut points and impact
data (if presented). 6. Once they have reviewed the materials, the panelists will discuss their Round 2 ratings,
beginning with the first cut point. a. The discussion should focus on differences in where individual panelists placed their
cutpoints.
b. Panelists should be encouraged to listen to their colleagues as well as express their own points of view.
c. If the panelists hear a logic/rationale/argument that they did not consider and that they
feel is compelling, then they may adjust their ratings to incorporate that information.
d. On the basis of the discussions and the feedback presented, panelists should make a third round of ratings.
e. When placing their Round 3 bookmarks, panelists should not feel compelled to
change their ratings.
f. The group does not have to achieve consensus. If panelists honestly disagree, that is fine. We are trying to get the best judgment of each panelist. Panelists should not feel compelled or coerced into making a rating they disagree with.
Encourage the panelists to use the discussion and feedback to assess how stringent or lenient a judge they are. If a panelist is consistently higher or lower than the group, they may have a different understanding of the borderline student than the rest of the group, or a different understanding of the Achievement Level Definitions, or both. It is O.K. for panelists to disagree, but that disagreement should be based on a common understanding of the Achievement Level Definitions.
7. When the group has completed their third round of ratings, collect the rating forms. When you collect the rating forms carefully inspect them to ensure they are filled out properly.
a. The round number and panelist ID number must be filled in. b. The item numbers identifying each cut score must be adjacent. c. Immediately provide the completed rating forms to R&A. The panelists will not see
the results from this round.
! Complete Evaluation Form Upon completion of Round 3, have panelists fill out the evaluation form. Emphasize that their honest feedback is important.

Appendix F Standard Setting Report 56 2007-08 NECAP Technical Report

Appendix F Standard Setting Report 57 2007-08 NECAP Technical Report
APPENDIX E: NECAP STANDARD SETTING
GENERAL DIRECTIONS FOR GROUP FACILITATORS - WRITING –

Appendix F Standard Setting Report 58 2007-08 NECAP Technical Report
NECAP Grade 11 Writing
Standards Validation Procedures for Writing Standards Validation Panel Meetings 1.) Introductions, purpose of standards validation panel meeting, and overview of the writing test
design (Tim) ~15-30 minutes 2.) Discussion of the five (5) writing scoring rubrics for grade 11. The common prompt this year is
“Response to Informational Text”, the rubrics for “Response to Literary Text”, “Reflective Essay”, “Persuasive Essay”, “Report”, and “Procedure” will also be reviewed and discussed. Each rubric is essentially the same, with some bullets specific to the type of writing. (DOE content specialists) ~30 minutes
3.) Discussion of common prompt anchor papers and scores assigned to the papers. Intent of this
section is to ensure that panelists are comfortable with the scoring process and understand the relationship between the rubrics and student work. (DOE Content Specialists) ~45 minutes
Note to Specialists: We’ve packaged all of the anchor papers and will let you choose the ones you want to highlight (total of 14 papers, two per score point).
4.) Overview and discussion of the general NECAP grade 11 Achievement Level Descriptors. These
are the descriptors that were used during teacher judgment ratings. (Tim) ~15 minutes 5.) Overview of achievement level definitions and cut scores. Explanation of the process and steps
taken by state content specialists to arrive at the starting achievement level definitions, which will be validated by the panelists. (Tim) ~5 minutes
Note to Specialists: This will be a very short description connecting the rubric language to the general descriptors.
6.) Rationale for the starting cut points and current achievement level definition based on the
descriptions contained in the rubrics. The starting cuts are as follows: Substantially Below Proficient/Partially Proficient = 3/4, Partially Proficient/Proficient = 6/7, Proficient/Proficient with Distinction = 9/10.
Panelists will discuss the rationale for the cuts and the details of the definitions and may propose alternatives—with rationale. The common anchor papers and rubrics from Step #3 will help guide discussion. Notes of discussion will be recorded. (DOE Content Specialists) ~30-45 minutes
Note to Specialists: This should be around lunch time.
7.) Panelists will take 5-7 minutes to write to the common prompt. This will help familiarize them with the prompt and understand how students may have answered. Next, panelists will examine of a set of student responses from the common prompt. This set will consist of approximately 16 papers distributed across the score range 2-12. (For example, a possible score distribution is 1 each for score points 2-4, 2 papers each for score points 5-9, and 1 paper each for score points 10-12.) The papers will be rank ordered lowest to highest, labeled with letters as an identifier, and will not have scores displayed.

Appendix F Standard Setting Report 59 2007-08 NECAP Technical Report
Note to Specialists: You’ll be picking these this afternoon on your call with Amanda.
• Panelists will be asked to read through the papers and place them in each of the 4 achievement levels. Does this level of work fit the description of proficiency in the definition? Panelists will use a rating form similar to one for a Body of Work standard setting.
• The facilitator will tally the panelists’ placements and present the results to the group. Group discussion will focus on disagreements regarding the achievement level for specific papers. Discussion will be focused in reference to the rubric. Group consensus is not needed.
• The group will then be told the scores of each paper, so as not to influence their first rating and discussion. Panelists will then do a second rating of the set of papers.
• This should bring the group to the end of day one. 3-3 ½ hours 8.) Examination of student responses from the matrix prompts one at a time. This set of responses
will consist of 11 papers across the 2-12 score range. This set will display the score for each paper. Panelists repeat step 7 for each of the 5 prompts. ~45-60 minutes per prompt
9.) Final discussion at the end of the process across all prompts. Final rating of the achievement
level definition (cut scores). ~30 minutes Selection of student work samples Common prompt: papers for even score points will be selected from the scoring training pack since these have already been approved by the DOE. (The anchor papers will have already been used in step 3). Papers for odd score points (adjacent scores when double scored) will be identified by R&A. A selection will be made by Measured Progress and sent to the DOE content specialists for approval. The selection will include MP’s recommendations and extra papers in case the DOE is in disagreement. A chart will be provided to organize the papers and facilitate discussion. Matrix prompts: papers for even score points will be selected from the anchor pack and training pack, if necessary. Odd score points will be selected in the same way as the common prompt. Measured Progress will send the selected odd score point papers to the DOE content specialists on January 2 (for delivery January 3). A conference call will be held on January 4th to come to agreement on which papers will be used. Schedule The DOE content specialists will meet at Measured Progress the afternoon of January 8th to finalize their role as facilitators. They will also meet with Tim at 7:30AM on January 9th. January 9th: The entire group will start together at 9:00AM for a quick welcome and overview. The writing group will leave to start their work, while the reading and mathematics panelists stay for training on the bookmark method. Work will end around 4:00-4:30PM January 10th: Work will start at 8:30AM., and the day should conclude by 4:00PM.

Appendix F Standard Setting Report 60 2007-08 NECAP Technical Report

Appendix F Standard Setting Report 61 2007-08 NECAP Technical Report
APPENDIX F: NECAP STANDARD SETTING
GRADE 11 RATING FORM - READING/MATHEMATICS -

Appendix F Standard Setting Report 62 2007-08 NECAP Technical Report
NECAP Reading Grade 11 Rating Form
Round _________________ ID ____________________
Substantially Below Proficient
Ordered Item Numbers
First Last 1 ___
Partially Proficient
Ordered Item Numbers
First Last ___ ___
Proficient
Ordered Item Numbers
First Last ___ ___
Proficient with Distinction
Ordered Item Numbers
First Last ___ 52
Directions: Please enter the range of ordered item numbers that fall into each achievement level category according to where you placed your cutpoints. Note: The ranges must be adjacent to each other. For example: Substantially Below Proficient: 1-13, Partially Proficient: 14-26, Proficient: 27-39, Proficient with Distinction: 40-52.

Appendix F Standard Setting Report 63 2007-08 NECAP Technical Report
NECAP Mathematics Grade 11 Rating Form
Round _________________ ID ____________________
Substantially Below Proficient
Ordered Item Numbers
First Last 1 ___
Partially Proficient
Ordered Item Numbers
First Last ___ ___
Proficient
Ordered Item Numbers
First Last ___ ___
Proficient with Distinction
Ordered Item Numbers
First Last ___ 64
Directions: Please enter the range of ordered item numbers that fall into each achievement level category according to where you placed your cutpoints. Note: The ranges must be adjacent to each other. For example: Substantially Below Proficient: 1-16, Partially Proficient: 17-32, Proficient: 33-48, Proficient with Distinction: 49-64.
Appendix F Standard Setting Report 64 2007-08 NECAP Technical Report

Appendix F Standard Setting Report 65 2007-08 NECAP Technical Report
APPENDIX G: NECAP GRADE 11 FINAL WRITING
RUBRICS

Appendix F Standard Setting Report 66 2007-08 NECAP Technical Report
Grade 11 Writing Rubric - Response to Literary or Informational Text 6
• purpose is clear throughout; strong focus/controlling idea OR strongly stated purpose focuses the writing • intentionally organized for effect • fully developed details; rich and/or insightful elaboration supports purpose • distinctive voice, tone, and style enhance meaning • consistent application of the rules of grade-level grammar, usage, and mechanics
5
• purpose is clear; focus/controlling idea is maintained throughout • well-organized and coherent throughout • details are relevant and support purpose; details are sufficiently/purposely elaborated • strong command of sentence structure; uses language to enhance meaning • consistent application of the rules of grade-level grammar, usage, and mechanics
4
• purpose is evident; focus/controlling idea may not be maintained • generally organized and coherent • details are generally relevant and appropriately developed • well-constructed sentences; uses language well • may have some errors in grammar, usage, and mechanics
3
• writing has a general purpose • some sense of organization; may have lapses in coherence • some relevant details support purpose • uses language adequately; may show little variety of sentence structures • may have some errors in grammar, usage, and mechanics
2
• attempted or vague purpose • attempted organization; lapses in coherence • generalized, listed, or undeveloped details • may lack sentence control or may use language poorly • may have errors in grammar, usage, and mechanics that interfere with meaning
1
• minimal evidence of purpose • little or no organization • minimal or random information • rudimentary or deficient use of language • may have errors in grammar, usage, and mechanics that interfere with meaning
0
• response is totally incorrect or irrelevant

Appendix F Standard Setting Report 67 2007-08 NECAP Technical Report
Grade 11 Writing Rubric – Reflective Essay
6 • purpose and context are engaging • intentionally organized, with a progression of ideas • analyzes a condition or situation using rich and insightful elaboration • distinctive voice, tone, and style enhance meaning • consistent application of the rules of grade-level grammar, usage, and mechanics
5
• purpose and context are clear • well organized and coherent throughout, with a progression of ideas • analyzes a condition or situation using meaningful details/elaboration • uses language effectively; uses a variety of sentence structures • consistent application of the rules of grade-level grammar, usage, and mechanics
4
• purpose and context are evident • generally organized and coherent • explains a condition or situation using relevant details • uses language adequately; uses correct sentence structures • may have some errors in grammar, usage, and mechanics
3
• writing has a general purpose • some sense of organization; may have lapses in coherence • addresses a condition or situation; some relevant details support purpose • uses language adequately; may show little variety of sentence structures • may have some errors in grammar, usage, and mechanics
2
• attempted or vague purpose • attempted organization; lapses in coherence • may state a condition or situation; generalized, listed, or undeveloped details • may lack sentence control or may use language poorly • may have errors in grammar, usage, and mechanics that interfere with meaning
1
• minimal evidence of purpose • little or no organization • few or random details • rudimentary or deficient use of language • may have errors in grammar, usage, and mechanics that interfere with meaning
0
• response is totally irrelevant

Appendix F Standard Setting Report 68 2007-08 NECAP Technical Report
Grade 11 Writing Rubric –Report Writing
6 • purpose is clear throughout; strong focus/controlling idea OR strongly stated purpose focuses the writing • intentionally organized for effect • fully developed details, rich and/or insightful elaboration supports purpose • distinctive voice, tone, and style enhance meaning • consistent application of the rules of grade-level grammar, usage, and mechanics
5
• purpose is clear; focus/controlling idea is maintained throughout • well organized and coherent throughout • details are relevant and support purpose; details are sufficiently elaborated • strong command of sentence structure; uses language to enhance meaning • consistent application of the rules of grade-level grammar, usage, and mechanics
4
• purpose is evident; focus/controlling idea may not be maintained • generally organized and coherent • details are relevant and mostly support purpose • well-constructed sentences; uses language well • may have some errors in grammar, usage, and mechanics
3
• writing has a general purpose • some sense of organization; may have lapses in coherence • some relevant details support purpose • uses language adequately; may show little variety of sentence structures • may have some errors in grammar, usage, and mechanics
2
• attempted or vague purpose • attempted organization; lapses in coherence • generalized, listed, or undeveloped details • may lack sentence control or may use language poorly • may have errors in grammar, usage, and mechanics that interfere with meaning
1
• minimal evidence of purpose • little or no organization • random or minimal details • rudimentary or deficient use of language • may have errors in grammar, usage, and mechanics that interfere with meaning
0
• response is totally incorrect or irrelevant

Appendix F Standard Setting Report 69 2007-08 NECAP Technical Report
Grade 11 Writing Rubric – Persuasive Writing 6
• purpose/position is clear throughout; strong focus/position; OR strongly stated purpose/opinion focuses the writing • intentionally organized for effect • fully developed arguments and reasons; rich, insightful elaboration supports purpose/opinion • distinctive voice, tone, and style effectively support position • consistent application of the rules of grade-level grammar, usage, and mechanics
5
• purpose/position is clear; stated focus/opinion maintained consistently throughout • well organized and coherent throughout • arguments/reasons are relevant and support purpose/opinion; arguments/reasons are sufficiently elaborated • strong command of sentence structure; uses language to support position • consistent application of the rules of grade-level grammar, usage, and mechanics
4
• purpose/position and focus are evident, but may not be maintained • generally well organized and coherent • arguments are appropriate and mostly support purpose/opinion • well-constructed sentences; uses language well • may contain some errors in grammar, usage, and mechanics
3
• purpose/position may be general • some sense of organization; may have lapses in coherence • some relevant details support purpose; arguments are thinly developed • generally correct sentence structure; uses language adequately • may contain some errors in grammar, usage, and mechanics
2
• attempted or vague purpose/position • attempted organization; lapses in coherence • generalized, listed, or undeveloped details/reasons • may lack sentence control or may use language poorly • may have errors in grammar, usage, and mechanics that interfere with meaning
1
• minimal evidence of purpose/position • little or no organization • random or minimal details • rudimentary or deficient use of language • may have errors in grammar, usage, and mechanics that interfere with meaning
0
• response is totally irrelevant

Appendix F Standard Setting Report 70 2007-08 NECAP Technical Report
Grade 11 Writing Rubric –Procedure
Text features can serve as organizational devices or as details that enhance meaning. 6
• purpose and context are clear; strong focus/controlling idea maintained throughout • intentionally organized for effect • fully developed details and elaborated steps support purpose • distinctive voice, tone, and style enhance reader’s understanding • consistent application of the rules of grade-level grammar, usage, and mechanics
5
• purpose and context are clear; focus/controlling idea is maintained throughout • well organized and coherent throughout • details are relevant and support purpose; steps are sufficiently explained • precise word choice; sentence structure/phrasing is appropriate • consistent application of the rules of grade-level grammar, usage, and mechanics
4
• purpose and context are evident; • generally organized and coherent • details are relevant, clear, and mostly support purpose; steps are explained • specific word choice; sentence structure/phrasing is appropriate • may have some errors in grammar, usage, and mechanics
3
• purpose is general • some sense of organization; may have lapses in coherence • some relevant details support purpose; some steps are identified • may use nonspecific language; sentences/ phrases may be unclear • may have some errors in grammar, usage, and mechanics
2
• attempted or vague purpose • attempted organization; lapses in coherence • generalized, list or undeveloped details; may identify steps • may use language poorly; sentence/phrasing may cause confusion • may have errors in grammar, usage, and mechanics that interfere with meaning
1
• minimal evidence of purpose • little or no organization • random or minimal details • rudimentary or deficient use of language • may have errors in grammar, usage, and mechanics that interfere with meaning
0
• response is totally incorrect or irrelevant

Appendix F Standard Setting Report 71 2007-08 NECAP Technical Report
APPENDIX H: NECAP STANDARD SETTING
GRADE 11 RATING FORMS -WRITING ROUNDS 1 AND
2 -

Appendix F Standard Setting Report 72 2007-08 NECAP Technical Report
NECAP WRITING GRADE 11
Rating Form
Common Prompt: Working
ID ____________
Round 1 Round 2
SBP PP P PWD SBP PP P PWD
A
B
C
D
E
F
G
H
I
J
K
L
M
N
O
P

Appendix F Standard Setting Report 73 2007-08 NECAP Technical Report
APPENDIX I NECAP STANDARD SETTING GRADE 11 RATING FORM -WRITING FINAL ROUND -

Appendix F Standard Setting Report 74 2007-08 NECAP Technical Report
NECAP Writing Grade 11 Final Round
ID ____________________ Starting Cutpoints
Substantially Below
Proficient Score Points
First Last 2 3
Partially Proficient
Score Points
First Last 4 6
Proficient
Score Points
First Last 7 9
Proficient
with Distinction Score Points
First Last 10 12
Final Round Directions: Please enter the range of score points that fall into each achievement level category according to where you believe the cutpoints should be placed.
Substantially Below
Proficient Score Points
First Last 2 ___
Partially Proficient
Score Points
First Last ___ ___
Proficient
Score Points
First Last ___ ___
Proficient
with Distinction Score Points
First Last ___ 12

Appendix F Standard Setting Report 75 2007-08 NECAP Technical Report
APPENDIX J: NECAP STANDARD SETTING
EVALUATION SUMMARIES

Appendix F Standard Setting Report 76 2007-08 NECAP Technical Report
NECAP Grade 11 Standard Setting—Mathematics 17 Evaluations completed January 9-10, 2008 Sheraton Harborside Portsmouth Hotel, Portsmouth, NH
1. How would you rate the training you received? Rating Scale Appropriate Somewhat Appropriate Not Appropriate
Tally 17 0 0
2. How clear were you with the achievement level definitions? Rating Scale Very Clear Clear Somewhat Clear Not Clear
Tally 8 7 2 0
3. How do you feel about the length of time of this meeting for setting achievement standards?
Rating Scale About Right Too little time Too much time Tally 17 0 0
Comment: Try to do more on day 1
4. What factors influenced the standards you set? (Circle the most appropriate rating from 1 = Not at all Influential to 5 = Very Influential)
Rating Scale: 1 2 3 4 5 The achievement level definitions 3 8 6
The assessment items 1 5 11 Other panelists Comment: Excellent discussions!
1 7 8 1
Impact Data 4 2 7 3 1 My experience in the field 1 4 12 Other (please explain)
or each statement below, please circle the rating that best represents your judgment.
5. The training was:
Rating scale 1 Not Useful
2 3 4 5 Very Useful
Tally 4 13
6. The achievement level definitions were:
Rating scale 1 Not Clear
2 3 4 5 Very Clear
Tally 1 5 5 6

Appendix F Standard Setting Report 77 2007-08 NECAP Technical Report
For each statement below, please circle the rating that best represents your judgment.
7. Reviewing the assessment materials was:
Rating scale 1 Not Useful
2 3 4 5 Very Useful
Tally 1 2 14
8. The discussion with other panelists was:
Rating scale 1 Not Useful
2 3 4 5 Very Useful
Tally 1 6 10
9. The standard setting task was:
Rating scale 1 Not Clear
2 3 4 5 Very Clear
Tally 2 7 8 Comment: Clearer as time went on.
10. My level of confidence in setting cut-points is:
Rating scale 1 Very Low
2 3 4 5 Very High
Tally 1 10 5 *one panelist did not answer
11. How could the standard setting process have been improved? - Some discussions were too long and off-track - I calibrated with my special-ed chair before coming by looking at student work. (I wanted her
perspective, in my mind’s eye). - Change the standards for special-ed. That’s a big issue that affects the scores quite a bit. - Everything was superb. - If I did it again, it would be much easier. - Maybe a “mock training” first with pilot data or grade 8 data - More open process that allows for participants to spend more time with different aspects of the
program, (allow more time for discussion or item rating, as needed by individual) - I’m not sure the process could be improved. The facilitators were fabulous. Everyone was
focused on leading us through with a thorough understanding. - Validation with another, similar group of teachers. - I would start by setting the cut points for Proficient, then worry about Substantially Below to
Partially Proficient later. - Quickly review the GSEs - Whipping around to hear quick opinions on different topics from all members (some chose not to
share) - A bit more time to talk. - Reviewing the GSEs before taking the test and setting standards.
12. Please use the space below to provide any additional comments or suggestions about the standard setting process

Appendix F Standard Setting Report 78 2007-08 NECAP Technical Report
Achievement Level Definitions - Achievement Level Definitions need measurable benchmarks/goals. They are too subjective in
their present form. - It seemed (very much) as though our feedback on Achievement Level Definitions was not well
received or sincerely wanted. - The Achievement Level Definitions [discussion] should have been typed up and put back to the
group before the first run through cut points because our definitions of the 4 “buckets” were not totally clear.
Facilitators/Presenters - Great group, Phil was fun & a good facilitator. - Phil was a great facilitator, very helpful, informative, and knowledgeable. - A very helpful conference to attend. Interaction with colleagues from my state and other
two states is invaluable. - Phil was terrific in maintaining climate & focus. - Excellent task facilitator and great moderators from each state. - People from Measured Progress were extremely professional and informed. I have almost
unlimited positive things to say about the people from Measured Progress, they were all awesome.
Other - Organization of the activities was good. - Small group & whole group mixtures may be rich. - A very helpful conference to attend. - Interaction with colleagues from my state and other two states is invaluable. - I would encourage more people to become involved in the process. - Excellent accommodations. - Good test, besides the special-ed issue, I think things are going in the right direction. We do need
teachers that are qualified and do their job correctly.

Appendix F Standard Setting Report 79 2007-08 NECAP Technical Report
NECAP Grade 11 Standard Setting—Reading - 15 Evaluations completed January 9-10, 2008 Sheraton Harborside Portsmouth Hotel, Portsmouth, NH 1. How would you rate the training you received?
Rating Scale Appropriate Somewhat Appropriate Not Appropriate Tally 15
2. How clear were you with the achievement level definitions?
Rating Scale Very Clear Clear Somewhat Clear Not Clear Tally 5 8 2
3. How do you feel about the length of time of this meeting for setting achievement
standards? Rating Scale About Right Too little time Too much time
Tally 14 1 4. What factors influenced the standards you set?
(Circle the most appropriate rating from 1 = Not at all Influential to 5 = Very Influential)
Rating Scale: 1 2 3 4 5 The achievement level definitions 1 3 4 7 The assessment items 8 7 Other panelists 3 10 2
Impact Data 1 6 8 My experience in the field 6 9 Other (please explain)
For each statement below, please circle the rating that best represents your judgment. 5. The training was:
Rating scale 1 Not Useful
2 3 4 5 Very Useful
Tally 6 9 6. The achievement level definitions were:
Rating scale 1 Not Clear
2 3 4 5 Very Clear
Tally 2 8 5 Comment: rated a 4 only after our elaboration of the definitions
For each statement below, please circle the rating that best represents your judgment.

Appendix F Standard Setting Report 80 2007-08 NECAP Technical Report
7. Reviewing the assessment materials was:
Rating scale 1 Not Useful
2 3 4 5 Very Useful
Tally 1 14
8. The discussion with other panelists was:
Rating scale 1 Not Useful
2 3 4 5 Very Useful
Tally 1 4 10 9. The standard setting task was:
Rating scale 1 Not Clear
2 3 4 5 Very Clear
Tally 2 9 4
10. My level of confidence in setting cut-points is:
Rating scale 1 Very Low
2 3 4 5 Very High
Tally 1 12 2 11. How could the standard setting process have been improved? - Perhaps matching the items with our elaboration of the Achievement Level Definitions.
(Although, I understand that this might have been too time consuming). - I’d like to see the data while making my bookmarks. - I was unclear about the big picture and what was expected of me. - I think a clearer outline of the tasks would have been helpful prior to beginning the process. I
was very confused about how the bookmark process worked, however it did become clear over time.
- People need more information up front, before attending and at the beginning of the process, the big picture.
- Up front outline off entire process, maybe a rough outline of time frame to keep discussion focused.
- Fewer tangential conversations, discussions, and arguments which were not relevant to the task. - Fewer people coming in and out of the room. - Process went very smoothly. David was very diplomatic as a facilitator and did an excellent job
clarifying what was sometimes a gray area. - Facilitators needed to respect the situation and not talk (even in whispers) during the time we
were taking the test. - Reduce noise from adjacent room (3 comments)

Appendix F Standard Setting Report 81 2007-08 NECAP Technical Report
12. Please use the space below to provide any additional comments or suggestions about the standard setting process Process - Keep one test the whole time - There should be an outlet for discussion of test items. Very frustrating and unnatural to push it out
of discussion. - I would have liked to have seen an item-by-item analysis of students’ performance on all 52
questions (percentages of right/wrong for MC items or 1-4 score percentages on CR items) - It would be interesting to see how we would rank the skill difficulty of the items with how the
students actually performed. Involvement in standard setting - I was very happy to have participated in the standard setting process. - Very interesting professionally. - This process was extremely helpful to me as an educator. One crucial piece of information that I
now have is the way that data is used to assess my students. - Overall I really enjoyed the process and am looking forward to hearing the results. I appreciate that
classroom teachers are so actively involved. Other - David did an excellent job leading us through the process. - Our instructor needed to stop discussions that were getting off task. Too much time spent arguing
the test itself. - Accommodations were lovely - The venue and support were outstanding. - Less noisy setting. - Closer proximity of participants when discussing - Less interruptions during meetings (fewer people entering /leaving, i.e. observers) - People were friendly and the professionals extremely knowledgeable.

Appendix F Standard Setting Report 82 2007-08 NECAP Technical Report
NECAP Grade 11 Standard Setting –Writing - 16 Evaluations completed January 9-10, 2008 Sheraton Harborside Portsmouth Hotel, Portsmouth, NH
1. How would you rate the training you received? Rating Scale Appropriate Somewhat Appropriate Not Appropriate
Tally 15 1
2. How do you feel about the length of time of this meeting for setting achievement standards?
Rating Scale About Right Too little time Too much time Tally 14 2
Comments: Time within the 2 days could have been better structured. (rated About Right) Day 2 process should be set up so there is less waiting around. (rated Too much time)
3. What factors influenced the standards you set? (Circle the most appropriate rating from 1 = Not at all Influential to 5 = Very Influential)
Rating Scale: 1 2 3 4 5 The achievement level definitions 7 9 The writing prompts *one panelist did not answer
1 5 7 2
The student responses 1 6 9
Other panelists 3 1 8 4 My experience in the field 6 10 Other (please explain) 1 1 Explanations of Other ratings: 3 = The rubrics 5 = Grade 11 writing rubric, because it is the standard for what is best and what is not acceptable. Helped me gauge writing quality. Other comment (with no rating): the group process
For each statement below, please circle the rating that best represents your judgment.
4. The training was:
Rating scale 1 Not Useful
2 3 4 5 Very Useful
Tally 6 10

Appendix F Standard Setting Report 83 2007-08 NECAP Technical Report
5. The scoring rubrics were:
Rating scale 1 Not Clear
2 3 4 5 Very Clear
Tally 1 3 12
For each statement below, please circle the rating that best represents your judgment.
6. Reviewing the assessment materials was:
Rating scale 1 Not Useful
2 3 4 5 Very Useful
Tally 6 10
7. The discussion with other panelists was:
Rating scale 1 Not Useful
2 3 4 5 Very Useful
Tally 2 5 9
8. The standard setting task was:
Rating scale 1 Not Clear
2 3 4 5 Very Clear
Tally 2 5 9 Comment: became more so as we progressed (rated 4)
9. My level of confidence in setting cut-points is:
Rating scale 1 Very Low
2 3 4 5 Very High
Tally 3 11 2 10. How could the standard setting process have been improved? Process - Do not give the scores or rank the papers, it really influenced the work. (5 comments) - Downtime, waiting between matrix pieces feels wasted. (3 comments) - Consider not giving in advance what the ELA folks had set for their cut points. I feel like it may
have influenced the group. - By doing 4 essays on day 2 I really lost steam. - It was clearly explained, executed efficiently, and gave us the sense that what we think matters.
In short, little needs improvement. - I felt the time allotted for each task was sufficient. - Spacing/enough time to do task and more breaks to rest/refresh. Scoring - It seems that discrepancies in scores could have been discussed further to glean the reasons
between the various scores. Allow more discussion in this area. - I would spend more time on authentic scoring rather than providing the scores while we read the
pieces. It biases the reader.

Appendix F Standard Setting Report 84 2007-08 NECAP Technical Report
Other - I felt Measured Progress really tried to hear and answer our concerns. - Talk at meals helped make me feel comfortable with others so I could share my opinions in
sessions. - Some discussions went on too long - Would have like to have the schedule before coming - Impressed with the whole process. The info and work done prior to our meeting was well
thought out and professional and grounded in the right values to challenge and support good student learning and promote the process we came here for.
- The very loud fan made it difficult to hear comments from some folks across the room. 11. Please use the space below to provide any additional comments or suggestions about the standard setting process Cut points and Process - I am still uncomfortable with 7 as a cut score for proficient. I would be more comfortable with a definition corresponding to a score point—even if it were 3.5 - While I understand that ours is not the only factor in determining the cut points, the facilitator’s comments about the process have led me to feel that we are merely validating points that have already been a t least mentally established by Measured Progress. I’ve not been pressured to change my rating, but I’ve been given the impression that I also won’t influence the decision that will be made (at least not much). - Some concern over the Partially Proficient and Proficient cut. If this were only about improving students skills, then it would be fine. However, we all know the repercussions of poor test scores. Perhaps erring on the side of generosity would help the big picture and not really hurt the students’ progress. - Do this before papers are scored. - Provide work samples/prompts for participants to bring back to their schools/districts Overall concerns - My concern goes back to the scoring that was already completed before we came to this task. Just with the number of pieces we saw, several of us saw papers “on the cusp”. In some cases, that 6/7 rated piece could be making/breaking a school district. With the stakes so high, I’m still not completely comfortable with scoring. I appreciate Linda’s [NH DOE] explanation, and I trust her, but I’m still uneasy. - I hope the DOE folks from the three states will hear our concerns about what may influence the way students prepare for and see the test. Teachers’ language in the classroom (prompt vs task, essay vs response) will be lenses for how students tackle assignments. The language of John Collins, Nancy Atwell, Peter Elbow (sp?) impacts how teachers teach and students respond. - We have heard repeatedly that NECAP is a snapshot, and no where is this more applicable than in the writing portion. Continue to stress this point in all discussions of results with state and local education officials. It’s imperative that parents and press understand this fact. - Work on the word “prompt” Facilitators and facility - The facilitators were excellent and I enjoyed working with them. - Tim did a fantastic job of leading us all through quite a complicated process. - I applaud the work of the representatives from the three states. - MP staff was friendly and very helpful. - The facility was outstanding.

Appendix F Standard Setting Report 85 2007-08 NECAP Technical Report
Other - This was a valuable experience for me and I enjoyed it. - Thank you for believing that classroom teachers actually have something valuable to contribute to the process. - Interesting, helped me understand the NECAP testing process and scoring. I will be armed with this new found knowledge when I assess my classroom instruction. - I have never participated in an exercise quite like this, but I feel as though the process was valid. - Have more SPED folks involved. - Overall this was a useful experience. - I attended standard setting for grade 8 and had a terrible go of it. This was much better. We had clear directions and a clear task. I really enjoyed the process.

Appendix F Standard Setting Report 86 2007-08 NECAP Technical Report
Appendix F Standard Setting Report 87 2007-08 NECAP Technical Report
APPENDIX K: NECAP STANDARD SETTING
PANELISTS

Appendix F Standard Setting Report 88 2007-08 NECAP Technical Report
New Hampshire
Reading
First Name Last Name School/Association Affiliation Position
Susan Dean-Olsen Kingswood Regional High School English Language Arts Teacher/Coordinator
Jack Finley Franklin High School English Language Arts Teacher
Joanne O'Connor Pinkerton Academy Special Education Teacher
Jeanne Provender Nashua (retired) English Language Arts Teacher
Chris Saunders Nashua High School English Language Arts Teacher
Michael Williamson Hollis/Brookline High School English Language Arts Teacher
Mathematics
First Name Last Name School/Association Affiliation Position
Linda Belmonte Bedford High School Dean
Tracy Bricchi Kearsarge School District Mathematics Coordinator
Marina Capen Souhegan High School Mathematics Teacher
Robert Comey Memorial High School Mathematics Teacher
Matt Cygan Memorial High School Mathematics Teacher
Rob Lukasiak Independent Consultant Mathematics Consultant for CEIL
Writing
First Name Last Name School/Association Affiliation Position
Carrie Costello Conway High School English Language Arts Teacher
Kim Lindley-Soucy Londonderry High School English Language Arts Curriculum Coordinator
Meg Petersen Plymouth University Plymouth Writing Project
Jean Shankle Milford High School English Language Arts Teacher
Ruth Ellen Vaughn Farmington English Language Arts Curriculum Coordinator
Ann West Pinkerton Academy English Department Chair

Appendix F Standard Setting Report 89 2007-08 NECAP Technical Report
Rhode Island Reading
First Name Last Name School/Association Affiliation Position
Patricia Armstrong East Providence High School Department Chair
Jill Burke Chariho High School English Language Arts Teacher
Jean Dietrich Community College of Rhode Island English Language Arts Teacher
Rebecca Moore Mt. Hope High School English Language Arts Teacher
Sharon Solway Mt. Hope High School English Language Learner Teacher
Mathematics
First Name Last Name School/Association Affiliation Position
Michelle Brousseau-Cavallaro East Providence High School Department Chair
Linda Curtin Hope Arts High School Mathematics Teacher
Jean Mollicone Mt. Hope High School Department Chair
Suzanne Ross Walker Woonsocket High School AP Calculus Teacher
Monique Rousselle-Condon West Warwick High School Mathematics Teacher
Writing
First Name Last Name School/Association Affiliation Position
David Groccia North Providence High School English Language Arts Teacher
Emmanuel Vincent E-Cubed Academy Special Education Teacher
Jeff Miner Toll Gate High School Department Chair
David Schofield Lincoln Senior High School Department Chair

Appendix F Standard Setting Report 90 2007-08 NECAP Technical Report
Vermont Reading
First Name Last Name School/Association Affiliation Position
Alan Crowley Missisquoi Valley Union English Language Arts Teacher and Department Leader
Sue Boardman Brattleboro Union High School English Language Arts Teacher
Colleen Fiore Long Trail School English Language Arts Teacher and Special Services Director
Sandy Frizzell North Country Union High School English Language Arts Teacher
Katie Lenox Colchester High School English Language Arts Teacher
Marilyn Woodard Mt. Anthony Union High School English Language Arts Teacher and Department Chair
Mathematics
First Name Last Name School/Association Affiliation Position
Laurie Camelio Mt. Anthony Union High School Mathematics Teacher and Department Chair
Mike Caraco Burr and Burton Academy Mathematics Teacher and Department Chair
Nancy Disenhaus U-32 High School English Language Arts Teacher
Sharon Fadden Danville High School Mathematics Teacher
Erik Jacobson Windham Northeast Supervisory Union Mathematics Teacher
John Pandolfo Spaulding High School Mathematics Teacher & Department Head
Writing
First Name Last Name School/Association Affiliation Position
Teri Appel Brattleboro Union High School English Language Arts Teacher and Literacy Network Leader
Renee Berthiaume North Country Union High School Literacy Coach & Language Arts Department Liaison
Erin McGuire Colchester High School English Humanities Teacher
Peter Riegelman St. Albans English Language Arts Teacher
Susan Soltau Essex High School Mathematics Teacher & Co-chair Mathematics Department

Appendix G Raw to Scaled Score Conv. 1 2007-08 NECAP Technical Report
APPENDIX G�RAW TO SCALED SCORE
CONVERSIONS

Appendix G Raw to Scaled Score Conv. 2 2007-08 NECAP Technical Report
Table G-1. 2007-08 NECAP Scale Conversion: Math Grade 3.
Error Band
Raw Score θ Scaled Score
Lower Bound
Upper Bound
Performance Level
0 -4.00 300 300 310 1 1 -4.00 300 300 310 1 2 -4.00 300 300 310 1 3 -4.00 300 300 310 1 4 -4.00 300 300 310 1 5 -4.00 300 300 310 1 6 -4.00 300 300 309 1 7 -4.00 300 300 308 1 8 -3.67 304 300 311 1 9 -3.37 307 301 313 1 10 -3.13 309 303 315 1 11 -2.92 312 307 317 1 12 -2.74 313 308 318 1 13 -2.58 315 311 320 1 14 -2.44 317 313 321 1 15 -2.30 318 314 322 1 16 -2.18 320 316 324 1 17 -2.07 321 317 325 1 18 -1.96 322 318 326 1 19 -1.86 323 320 326 1 20 -1.76 324 321 327 1 21 -1.67 325 322 328 1 22 -1.58 326 323 329 1 23 -1.49 327 324 330 1 24 -1.41 328 325 331 1 25 -1.33 329 326 332 1 26 -1.25 329 326 332 1 27 -1.18 330 327 333 1 28 -1.10 331 328 334 1 29 -1.03 332 329 335 2 30 -0.96 333 330 336 2 31 -0.89 333 330 336 2 32 -0.82 334 331 337 2 33 -0.75 335 332 338 2 34 -0.68 336 333 339 2 35 -0.61 336 333 339 2 36 -0.54 337 334 340 2 37 -0.47 338 335 341 2 38 -0.41 338 337 342 2 39 -0.34 339 337 342 2
(cont’d)

Appendix G Raw to Scaled Score Conv. 3 2007-08 NECAP Technical Report
Table G-1. 2007-08 NECAP Scale Conversion: Math Grade 3 (cont�d).
Error Band
Raw Score θ Scaled Score
Lower Bound
Upper Bound
Performance Level
40 -0.27 340 338 343 3 41 -0.20 341 338 344 3 42 -0.13 342 339 345 3 43 -0.06 342 339 345 3 44 0.01 343 340 346 3 45 0.09 344 341 347 3 46 0.16 345 342 348 3 47 0.24 345 342 348 3 48 0.32 346 343 349 3 49 0.40 347 344 350 3 50 0.48 348 345 351 3 51 0.56 349 346 352 3 52 0.65 350 347 353 3 53 0.75 351 348 354 3 54 0.85 352 349 355 3 55 0.96 352 349 355 3 56 1.07 354 351 357 4 57 1.20 356 353 359 4 58 1.34 357 353 361 4 59 1.50 359 355 363 4 60 1.68 361 357 365 4 61 1.90 363 358 368 4 62 2.19 366 360 372 4 63 2.58 371 364 378 4 64 3.23 378 368 380 4 65 4.00 380 370 380 4

Appendix G Raw to Scaled Score Conv. 4 2007-08 NECAP Technical Report
Table G-2. 2007-08 NECAP Scale Conversion: Math Grade 4.
Error Band
Raw Score θ Scaled Score
Lower Bound
Upper Bound
Performance Level
0 -4.00 400 400 400 1 1 -4.00 400 400 400 1 2 -4.00 400 400 400 1 3 -4.00 400 400 400 1 4 -4.00 400 400 400 1 5 -4.00 400 400 404 1 6 -4.00 400 400 408 1 7 -3.80 402 400 411 1 8 -3.42 406 400 413 1 9 -3.13 410 404 416 1 10 -2.90 412 407 417 1 11 -2.71 414 409 419 1 12 -2.54 416 411 421 1 13 -2.39 418 414 422 1 14 -2.25 419 415 423 1 15 -2.13 421 417 425 1 16 -2.02 422 418 426 1 17 -1.91 423 419 427 1 18 -1.81 424 421 428 1 19 -1.71 425 422 428 1 20 -1.62 426 423 429 1 21 -1.53 427 424 430 1 22 -1.45 428 425 431 1 23 -1.36 429 426 432 1 24 -1.28 430 427 433 1 25 -1.21 430 427 433 1 26 -1.13 432 429 435 2 27 -1.06 432 429 435 2 28 -0.99 433 430 436 2 29 -0.92 434 431 437 2 30 -0.85 435 432 438 2 31 -0.78 436 433 439 2 32 -0.71 436 433 439 2 33 -0.64 437 434 440 2 34 -0.58 438 435 441 2 35 -0.51 439 436 442 2 36 -0.44 439 436 442 2 37 -0.38 439 436 442 2
(cont’d)

Appendix G Raw to Scaled Score Conv. 5 2007-08 NECAP Technical Report
Table G-2. 2007-08 NECAP Scale Conversion: Math Grade 4 (cont�d).
Error Band
Raw Score θ Scaled Score
Lower Bound
Upper Bound
Performance Level
38 -0.31 441 438 444 3 39 -0.25 441 438 444 3 40 -0.18 442 439 445 3 41 -0.11 443 440 446 3 42 -0.04 444 441 447 3 43 0.02 444 441 447 3 44 0.09 445 442 448 3 45 0.17 446 443 449 3 46 0.24 447 444 450 3 47 0.31 448 445 451 3 48 0.39 448 445 451 3 49 0.47 449 446 452 3 50 0.55 450 447 453 3 51 0.64 451 448 454 3 52 0.73 452 449 455 3 53 0.82 453 450 456 3 54 0.92 454 451 457 3 55 1.03 456 453 459 4 56 1.14 457 454 461 4 57 1.27 458 454 462 4 58 1.41 460 456 464 4 59 1.57 462 458 466 4 60 1.75 464 460 469 4 61 1.97 466 461 471 4 62 2.25 469 463 475 4 63 2.64 473 466 480 4 64 3.30 480 470 480 4 65 4.00 480 470 480 4

Appendix G Raw to Scaled Score Conv. 6 2007-08 NECAP Technical Report
Table G-3. 2007-08 NECAP Scale Conversion: Math Grade 5.
Error Band
Raw Score θ Scaled Score
Lower Bound
Upper Bound
Performance Level
0 -4.00 500 500 510 1 1 -4.00 500 500 510 1 2 -4.00 500 500 510 1 3 -4.00 500 500 510 1 4 -4.00 500 500 510 1 5 -4.00 500 500 510 1 6 -4.00 500 500 510 1 7 -3.51 505 500 515 1 8 -2.99 511 504 519 1 9 -2.63 515 509 521 1 10 -2.35 518 513 524 1 11 -2.13 520 515 525 1 12 -1.94 522 517 527 1 13 -1.77 524 520 528 1 14 -1.62 526 522 530 1 15 -1.48 527 523 531 1 16 -1.36 528 524 532 1 17 -1.24 530 526 534 1 18 -1.13 531 528 535 1 19 -1.03 532 529 535 1 20 -0.93 532 529 535 1 21 -0.83 534 531 537 2 22 -0.74 535 532 538 2 23 -0.66 536 533 539 2 24 -0.57 537 534 540 2 25 -0.49 538 535 541 2 26 -0.41 539 536 542 2 27 -0.33 539 536 542 2
(cont’d)

Appendix G Raw to Scaled Score Conv. 7 2007-08 NECAP Technical Report
Table G-3. 2007-08 NECAP Scale Conversion: Math Grade 5 (cont�d).
Error Band
Raw Score θ Scaled Score
Lower Bound
Upper Bound
Performance Level
28 -0.26 540 537 543 3 29 -0.18 541 538 544 3 30 -0.11 542 539 545 3 31 -0.04 543 540 546 3 32 0.03 543 540 546 3 33 0.10 544 541 547 3 34 0.17 545 542 548 3 35 0.24 546 543 549 3 36 0.30 546 543 549 3 37 0.37 547 544 550 3 38 0.44 548 545 551 3 39 0.51 549 546 552 3 40 0.58 549 546 552 3 41 0.64 550 547 553 3 42 0.71 551 548 554 3 43 0.78 552 549 555 3 44 0.86 552 549 555 3 45 0.93 553 550 556 3 46 1.00 553 550 556 3 47 1.08 555 552 558 4 48 1.16 555 552 558 4 49 1.23 556 553 559 4 50 1.32 557 554 560 4 51 1.40 558 555 561 4 52 1.49 559 556 562 4 53 1.58 560 557 563 4 54 1.68 561 558 564 4 55 1.78 562 559 565 4 56 1.89 563 560 566 4 57 2.01 565 562 568 4 58 2.14 566 562 570 4 59 2.28 568 564 572 4 60 2.44 569 565 573 4 61 2.62 571 567 575 4 62 2.83 574 569 579 4 63 3.10 576 571 580 4 64 3.46 580 574 580 4 65 4.00 580 571 580 4 66 4.00 580 571 580 4

Appendix G Raw to Scaled Score Conv. 8 2007-08 NECAP Technical Report
Table G-4. 2007-08 NECAP Scale Conversion: Math Grade 6.
Error Band
Raw Score θ Scaled Score
Lower Bound
Upper Bound
Performance Level
0 -4.00 600 600 600 1 1 -4.00 600 600 600 1 2 -4.00 600 600 600 1 3 -4.00 600 600 600 1 4 -4.00 600 600 600 1 5 -4.00 600 600 609 1 6 -4.00 600 600 615 1 7 -3.47 606 600 616 1 8 -2.88 612 605 620 1 9 -2.50 616 610 622 1 10 -2.21 619 614 625 1 11 -1.98 621 616 626 1 12 -1.79 623 618 628 1 13 -1.62 625 621 629 1 14 -1.47 627 623 631 1 15 -1.34 628 624 632 1 16 -1.21 630 626 634 1 17 -1.10 631 628 635 1 18 -0.99 632 629 635 1 19 -0.89 632 629 635 1 20 -0.80 634 631 637 2 21 -0.71 635 632 638 2 22 -0.62 636 633 639 2 23 -0.54 637 634 640 2 24 -0.46 637 634 640 2 25 -0.38 638 635 641 2 26 -0.31 639 636 642 2 27 -0.24 639 636 642 2
(cont’d)

Appendix G Raw to Scaled Score Conv. 9 2007-08 NECAP Technical Report
Table G-4. 2007-08 NECAP Scale Conversion: Math Grade 6 (cont�d).
Error Band
Raw Score θ Scaled Score
Lower Bound
Upper Bound
Performance Level
28 -0.17 641 638 644 3 29 -0.10 641 638 644 3 30 -0.03 642 639 645 3 31 0.04 643 641 646 3 32 0.11 644 642 647 3 33 0.17 644 642 647 3 34 0.24 645 643 648 3 35 0.30 646 644 648 3 36 0.37 646 644 648 3 37 0.43 647 645 649 3 38 0.50 648 646 650 3 39 0.56 648 646 650 3 40 0.62 649 647 651 3 41 0.69 650 648 652 3 42 0.75 650 648 652 3 43 0.81 651 649 653 3 44 0.88 652 650 654 3 45 0.94 652 650 654 3 46 1.01 652 650 654 3 47 1.08 654 652 656 4 48 1.15 655 653 657 4 49 1.22 655 653 658 4 50 1.29 656 654 659 4 51 1.36 657 655 660 4 52 1.44 658 655 661 4 53 1.52 658 655 661 4 54 1.60 659 656 662 4 55 1.69 660 657 663 4 56 1.78 661 658 664 4 57 1.88 662 659 665 4 58 1.99 663 660 666 4 59 2.12 665 662 668 4 60 2.25 666 663 670 4 61 2.42 668 664 672 4 62 2.61 670 666 674 4 63 2.87 673 668 678 4 64 3.23 677 671 680 4 65 3.87 680 670 680 4 66 4.00 680 670 680 4

Appendix G Raw to Scaled Score Conv. 10 2007-08 NECAP Technical Report
Table G-5. 2007-08 NECAP Scale Conversion: Math Grade 7.
Error Band
Raw Score θ Scaled Score
Lower Bound
Upper Bound
Performance Level
0 -4.00 700 700 710 1 1 -4.00 700 700 710 1 2 -4.00 700 700 710 1 3 -4.00 700 700 710 1 4 -4.00 700 700 710 1 5 -4.00 700 700 710 1 6 -3.33 707 700 717 1 7 -2.61 714 706 722 1 8 -2.21 718 712 724 1 9 -1.94 721 716 726 1 10 -1.72 723 718 728 1 11 -1.54 725 721 729 1 12 -1.38 727 723 731 1 13 -1.24 728 724 732 1 14 -1.11 729 726 733 1 15 -1.00 731 728 734 1 16 -0.89 732 729 735 1 17 -0.79 733 730 736 1 18 -0.70 734 731 737 2 19 -0.61 735 732 738 2 20 -0.53 735 732 738 2 21 -0.45 736 733 739 2 22 -0.37 737 734 740 2 23 -0.29 738 735 741 2 24 -0.22 739 736 742 2 25 -0.15 739 737 742 2 26 -0.08 739 737 742 2
(cont’d)

Appendix G Raw to Scaled Score Conv. 11 2007-08 NECAP Technical Report
Table G-5. 2007-08 NECAP Scale Conversion: Math Grade 7 (cont�d).
Error Band
Raw Score θ Scaled Score
Lower Bound
Upper Bound
Performance Level
27 -0.02 741 739 743 3 28 0.05 741 739 743 3 29 0.11 742 740 744 3 30 0.17 743 741 745 3 31 0.24 743 741 745 3 32 0.30 744 742 746 3 33 0.36 744 742 746 3 34 0.42 745 743 747 3 35 0.48 746 744 748 3 36 0.54 746 744 748 3 37 0.60 747 745 749 3 38 0.66 748 746 750 3 39 0.72 748 746 750 3 40 0.78 749 747 751 3 41 0.84 749 747 751 3 42 0.91 750 748 752 3 43 0.97 751 749 753 3 44 1.04 751 749 753 3 45 1.11 752 750 754 4 46 1.18 753 751 755 4 47 1.25 754 752 757 4 48 1.32 754 752 757 4 49 1.40 755 752 758 4 50 1.48 756 753 759 4 51 1.56 757 754 760 4 52 1.65 758 755 761 4 53 1.74 759 756 762 4 54 1.84 760 757 763 4 55 1.94 761 758 764 4 56 2.05 762 759 765 4 57 2.17 763 760 766 4 58 2.30 764 761 767 4 59 2.45 766 762 770 4 60 2.62 768 764 772 4 61 2.81 770 766 774 4 62 3.05 772 767 777 4 63 3.36 775 769 780 4 64 3.78 779 772 780 4 65 4.00 780 773 780 4 66 4.00 780 773 780 4

Appendix G Raw to Scaled Score Conv. 12 2007-08 NECAP Technical Report
Table G-6. 2007-08 NECAP Scale Conversion: Math Grade 8.
Error Band
Raw Score θ Scaled Score
Lower Bound
Upper Bound
Performance Level
0 -4.00 800 800 810 1 1 -4.00 800 800 810 1 2 -4.00 800 800 810 1 3 -4.00 800 800 810 1 4 -4.00 800 800 810 1 5 -4.00 800 800 810 1 6 -3.79 802 800 812 1 7 -2.50 815 806 824 1 8 -2.00 820 814 827 1 9 -1.69 823 818 828 1 10 -1.47 825 821 830 1 11 -1.29 827 823 831 1 12 -1.15 829 825 833 1 13 -1.02 830 827 833 1 14 -0.91 831 828 834 1 15 -0.81 832 829 835 1 16 -0.72 833 830 836 1 17 -0.63 834 831 837 2 18 -0.56 835 832 838 2 19 -0.48 835 832 838 2 20 -0.41 836 834 839 2 21 -0.34 837 835 839 2 22 -0.28 837 835 839 2 23 -0.21 838 836 840 2 24 -0.15 839 837 841 2 25 -0.09 839 837 841 2 26 -0.04 839 837 841 2
(cont’d)

Appendix G Raw to Scaled Score Conv. 13 2007-08 NECAP Technical Report
Table G-6. 2007-08 NECAP Scale Conversion: Math Grade 8 (cont�d).
Error Band
Raw Score θ Scaled Score
Lower Bound
Upper Bound
Performance Level
27 0.02 840 838 842 3 28 0.07 841 839 843 3 29 0.13 842 840 844 3 30 0.18 842 840 844 3 31 0.24 843 841 845 3 32 0.29 843 841 845 3 33 0.34 844 842 846 3 34 0.39 844 842 846 3 35 0.44 845 843 847 3 36 0.50 845 843 847 3 37 0.55 846 844 848 3 38 0.60 846 844 848 3 39 0.65 847 845 849 3 40 0.70 847 845 849 3 41 0.76 848 846 850 3 42 0.81 848 846 850 3 43 0.87 849 847 851 3 44 0.92 850 848 852 3 45 0.98 850 848 852 3 46 1.03 851 849 853 3 47 1.09 851 849 853 3 48 1.15 852 850 854 4 49 1.21 852 850 854 4 50 1.27 853 851 855 4 51 1.34 854 852 856 4 52 1.40 854 852 856 4 53 1.47 855 853 857 4 54 1.55 856 854 858 4 55 1.62 857 855 859 4 56 1.70 857 855 859 4 57 1.79 858 856 860 4 58 1.88 859 857 862 4 59 1.99 860 857 863 4 60 2.11 861 858 864 4 61 2.24 863 860 866 4 62 2.40 865 862 868 4 63 2.62 867 863 871 4 64 2.92 870 865 875 4 65 3.49 875 867 880 4 66 4.00 880 870 880 4

Appendix G Raw to Scaled Score Conv. 14 2007-08 NECAP Technical Report
Table G-7. 2007-08 NECAP Scale Conversion: Math Grade 11.
Error Band
Raw Score θ Scaled Score
Lower Bound
Upper Bound
Performance Level
0 -4.00 1100 1100 1110 1 1 -4.00 1100 1100 1110 1 2 -4.00 1100 1100 1110 1 3 -4.00 1100 1100 1110 1 4 -4.00 1100 1100 1110 1 5 -3.38 1105 1100 1115 1 6 -2.14 1116 1110 1122 1 7 -1.69 1120 1115 1125 1 8 -1.40 1123 1119 1127 1 9 -1.17 1124 1120 1128 1 10 -0.99 1126 1123 1129 1 11 -0.84 1127 1124 1130 1 12 -0.70 1129 1126 1132 1 13 -0.58 1130 1127 1133 1 14 -0.46 1131 1128 1134 1 15 -0.36 1132 1130 1135 1 16 -0.27 1132 1130 1134 1 17 -0.18 1133 1131 1135 1 18 -0.09 1134 1132 1136 2 19 -0.02 1135 1133 1137 2 20 0.06 1135 1133 1137 2 21 0.13 1136 1134 1138 2 22 0.20 1136 1134 1138 2 23 0.27 1137 1135 1139 2 24 0.33 1138 1136 1140 2 25 0.39 1138 1136 1140 2 26 0.46 1139 1137 1141 2 27 0.52 1139 1137 1141 2 28 0.57 1139 1137 1141 2
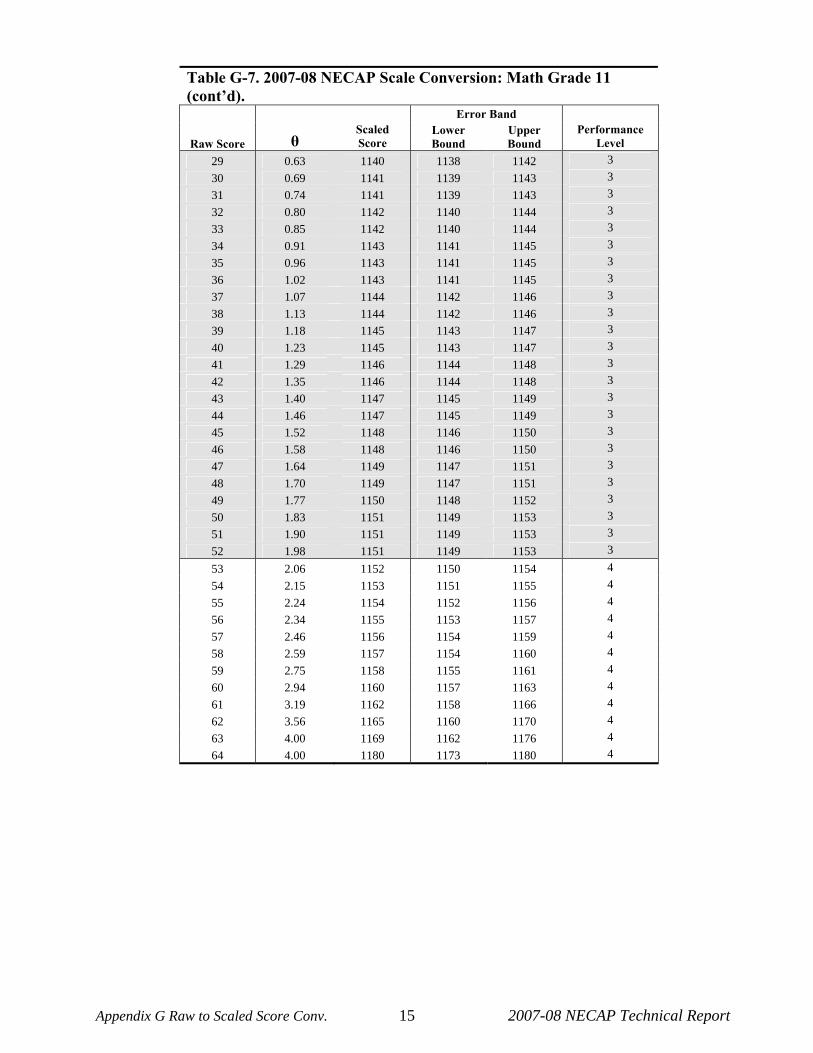
Appendix G Raw to Scaled Score Conv. 15 2007-08 NECAP Technical Report
Table G-7. 2007-08 NECAP Scale Conversion: Math Grade 11 (cont�d).
Error Band
Raw Score θ Scaled Score
Lower Bound
Upper Bound
Performance Level
29 0.63 1140 1138 1142 3 30 0.69 1141 1139 1143 3 31 0.74 1141 1139 1143 3 32 0.80 1142 1140 1144 3 33 0.85 1142 1140 1144 3 34 0.91 1143 1141 1145 3 35 0.96 1143 1141 1145 3 36 1.02 1143 1141 1145 3 37 1.07 1144 1142 1146 3 38 1.13 1144 1142 1146 3 39 1.18 1145 1143 1147 3 40 1.23 1145 1143 1147 3 41 1.29 1146 1144 1148 3 42 1.35 1146 1144 1148 3 43 1.40 1147 1145 1149 3 44 1.46 1147 1145 1149 3 45 1.52 1148 1146 1150 3 46 1.58 1148 1146 1150 3 47 1.64 1149 1147 1151 3 48 1.70 1149 1147 1151 3 49 1.77 1150 1148 1152 3 50 1.83 1151 1149 1153 3 51 1.90 1151 1149 1153 3 52 1.98 1151 1149 1153 3 53 2.06 1152 1150 1154 4 54 2.15 1153 1151 1155 4 55 2.24 1154 1152 1156 4 56 2.34 1155 1153 1157 4 57 2.46 1156 1154 1159 4 58 2.59 1157 1154 1160 4 59 2.75 1158 1155 1161 4 60 2.94 1160 1157 1163 4 61 3.19 1162 1158 1166 4 62 3.56 1165 1160 1170 4 63 4.00 1169 1162 1176 4 64 4.00 1180 1173 1180 4

Appendix G Raw to Scaled Score Conv. 16 2007-08 NECAP Technical Report
Table G-8. 2007-08 NECAP Scale Conversion: Reading Grade 3.
Error Band
Raw Score θ Scaled Score
Lower Bound
Upper Bound
Performance Level
0 -4.00 300 300 310 1 1 -4.00 300 300 310 1 2 -4.00 300 300 310 1 3 -4.00 300 300 310 1 4 -4.00 300 300 310 1 5 -4.00 300 300 310 1 6 -4.00 300 300 309 1 7 -3.75 303 300 311 1 8 -3.42 307 300 314 1 9 -3.14 310 303 317 1 10 -2.91 312 306 318 1 11 -2.70 315 309 321 1 12 -2.52 317 312 322 1 13 -2.35 319 314 324 1 14 -2.19 321 316 326 1 15 -2.05 322 317 327 1 16 -1.92 324 320 328 1 17 -1.79 325 321 329 1 18 -1.67 327 323 331 1 19 -1.56 328 324 332 1 20 -1.46 329 325 333 1 21 -1.35 330 327 334 1 22 -1.26 331 328 334 2 23 -1.16 332 329 335 2 24 -1.07 333 330 336 2 25 -0.98 334 332 338 2 26 -0.89 335 333 339 2 27 -0.80 336 334 340 2 28 -0.71 337 335 341 2 29 -0.62 337 336 342 2 30 -0.53 339 336 342 2
(cont’d)

Appendix G Raw to Scaled Score Conv. 17 2007-08 NECAP Technical Report
Table G-8. 2007-08 NECAP Scale Conversion: Reading Grade 3 (cont�d).
Error Band
Raw Score θ Scaled Score
Lower Bound
Upper Bound
Performance Level
31 -0.44 341 338 344 3 32 -0.35 342 339 345 3 33 -0.25 343 340 346 3 34 -0.16 344 341 347 3 35 -0.05 345 342 348 3 36 0.05 346 343 349 3 37 0.16 348 345 351 3 38 0.28 349 345 353 3 39 0.41 350 346 354 3 40 0.54 352 348 356 3 41 0.68 353 349 357 3 42 0.84 355 351 359 3 43 1.01 356 352 361 3 44 1.20 359 354 364 4 45 1.41 362 357 367 4 46 1.64 364 359 370 4 47 1.91 367 361 373 4 48 2.24 371 364 378 4 49 2.65 376 368 380 4 50 3.23 380 370 380 4 51 4.00 380 370 380 4 52 4.00 380 370 380 4

Appendix G Raw to Scaled Score Conv. 18 2007-08 NECAP Technical Report
Table G-9. 2007-08 NECAP Scale Conversion: Reading Grade 4.
Error Band
Raw Score θ Scaled Score
Lower Bound
Upper Bound
Performance Level
0 -4.00 400 400 410 1 1 -4.00 400 400 410 1 2 -4.00 400 400 410 1 3 -4.00 400 400 410 1 4 -4.00 400 400 410 1 5 -4.00 400 400 410 1 6 -4.00 400 400 410 1 7 -3.85 402 400 411 1 8 -3.46 406 400 414 1 9 -3.15 409 402 416 1 10 -2.88 412 406 418 1 11 -2.66 415 409 421 1 12 -2.45 417 412 423 1 13 -2.27 419 414 424 1 14 -2.11 421 416 426 1 15 -1.96 422 417 427 1 16 -1.82 424 420 428 1 17 -1.69 425 421 429 1 18 -1.56 426 422 430 1 19 -1.45 428 424 432 1 20 -1.34 429 425 433 1 21 -1.23 430 427 434 1 22 -1.13 431 428 434 2 23 -1.04 432 429 435 2 24 -0.94 433 430 436 2 25 -0.85 434 431 437 2 26 -0.76 435 432 438 2 27 -0.66 436 433 439 2 28 -0.57 437 434 440 2 29 -0.48 438 435 441 2 30 -0.39 439 436 442 2
(cont’d)

Appendix G Raw to Scaled Score Conv. 19 2007-08 NECAP Technical Report
Table G-9. 2007-08 NECAP Scale Conversion: Reading Grade 4 (cont�d).
Error Band
Raw Score θ Scaled Score
Lower Bound
Upper Bound
Performance Level
31 -0.30 440 437 443 3 32 -0.20 441 438 444 3 33 -0.10 442 439 445 3 34 0.00 443 440 446 3 35 0.11 445 442 448 3 36 0.22 446 443 450 3 37 0.33 447 443 451 3 38 0.46 448 444 452 3 39 0.59 450 446 454 3 40 0.74 451 447 455 3 41 0.90 453 448 458 3 42 1.08 455 450 460 3 43 1.27 457 452 462 4 44 1.49 460 454 466 4 45 1.74 462 456 468 4 46 2.02 465 458 472 4 47 2.34 469 462 476 4 48 2.71 473 465 480 4 49 3.14 477 469 480 4 50 3.69 480 471 480 4 51 4.00 480 470 480 4 52 4.00 480 470 480 4

Appendix G Raw to Scaled Score Conv. 20 2007-08 NECAP Technical Report
Table G-10. 2007-08 NECAP Scale Conversion: Reading Grade 5.
Error Band
Raw Score θ Scaled Score
Lower Bound
Upper Bound
Performance Level
0 -4.00 500 500 510 1 1 -4.00 500 500 510 1 2 -4.00 500 500 510 1 3 -4.00 500 500 510 1 4 -4.00 500 500 510 1 5 -3.86 502 500 512 1 6 -3.37 507 500 514 1 7 -3.03 511 505 517 1 8 -2.77 514 509 519 1 9 -2.56 516 511 521 1 10 -2.37 518 514 523 1 11 -2.21 520 516 524 1 12 -2.06 522 518 526 1 13 -1.92 523 519 527 1 14 -1.78 525 521 529 1 15 -1.66 526 522 530 1 16 -1.54 528 524 532 1 17 -1.42 529 525 533 1 18 -1.31 530 527 534 2 19 -1.20 531 528 535 2 20 -1.09 533 530 536 2 21 -0.98 534 531 537 2 22 -0.87 535 532 538 2 23 -0.77 536 533 539 2 24 -0.66 537 534 540 2 25 -0.56 539 536 542 2 26 -0.45 539 536 542 2
(cont’d)

Appendix G Raw to Scaled Score Conv. 21 2007-08 NECAP Technical Report
Table G-10. 2007-08 NECAP Scale Conversion: Reading Grade 5 (cont�d).
Error Band
Raw Score θ Scaled Score
Lower Bound
Upper Bound
Performance Level
27 -0.34 541 538 544 3 28 -0.24 542 539 545 3 29 -0.12 543 540 546 3 30 -0.01 545 542 549 3 31 0.11 546 542 550 3 32 0.23 547 543 551 3 33 0.35 549 545 553 3 34 0.48 550 546 554 3 35 0.61 552 548 556 3 36 0.75 553 549 557 3 37 0.90 555 551 559 3 38 1.05 557 553 561 4 39 1.20 558 554 562 4 40 1.36 560 556 564 4 41 1.52 562 558 566 4 42 1.69 564 560 568 4 43 1.86 566 562 571 4 44 2.04 568 564 573 4 45 2.22 570 565 575 4 46 2.42 572 567 577 4 47 2.64 574 569 579 4 48 2.87 577 572 580 4 49 3.15 580 574 580 4 50 3.52 580 573 580 4 51 4.00 580 571 580 4 52 4.00 580 571 580 4

Appendix G Raw to Scaled Score Conv. 22 2007-08 NECAP Technical Report
Table G-11. 2007-08 NECAP Scale Conversion: Reading Grade 6.
Error Band
Raw Score θ Scaled Score
Lower Bound
Upper Bound
Performance Level
0 -4.00 600 600 610 1 1 -4.00 600 600 610 1 2 -4.00 600 600 610 1 3 -4.00 600 600 610 1 4 -4.00 600 600 610 1 5 -3.87 602 600 610 1 6 -3.50 606 600 613 1 7 -3.23 609 603 615 1 8 -3.00 611 606 616 1 9 -2.81 614 609 619 1 10 -2.64 616 612 621 1 11 -2.49 617 613 621 1 12 -2.35 619 615 623 1 13 -2.22 621 617 625 1 14 -2.09 622 618 626 1 15 -1.97 623 619 627 1 16 -1.85 625 621 629 1 17 -1.74 626 622 630 1 18 -1.62 627 623 631 1 19 -1.51 628 624 632 1 20 -1.40 630 626 634 2 21 -1.29 631 627 635 2 22 -1.18 632 628 636 2 23 -1.07 634 630 638 2 24 -0.96 635 631 639 2 25 -0.84 636 632 640 2 26 -0.73 638 634 642 2 27 -0.61 639 635 643 2
(cont’d)

Appendix G Raw to Scaled Score Conv. 23 2007-08 NECAP Technical Report
Table G-11. 2007-08 NECAP Scale Conversion: Reading Grade 6 (cont�d).
Error Band
Raw Score θ Scaled Score
Lower Bound
Upper Bound
Performance Level
28 -0.49 640 636 644 3 29 -0.36 642 638 646 3 30 -0.24 643 639 647 3 31 -0.10 645 641 649 3 32 0.03 646 642 650 3 33 0.18 648 644 652 3 34 0.33 650 646 654 3 35 0.48 651 647 655 3 36 0.65 653 648 658 3 37 0.82 655 650 660 3 38 1.00 657 652 662 3 39 1.20 660 655 665 4 40 1.40 662 657 667 4 41 1.61 664 659 669 4 42 1.83 667 662 672 4 43 2.06 670 665 675 4 44 2.30 672 667 678 4 45 2.56 675 669 680 4 46 2.82 678 672 680 4 47 3.11 680 674 680 4 48 3.42 680 674 680 4 49 3.77 680 674 680 4 50 4.00 680 673 680 4 51 4.00 680 673 680 4 52 4.00 680 673 680 4

Appendix G Raw to Scaled Score Conv. 24 2007-08 NECAP Technical Report
Table G-12. 2007-08 NECAP Scale Conversion: Reading Grade 7.
Error Band
Raw Score θ Scaled Score
Lower Bound
Upper Bound
Performance Level
0 -4.00 700 700 710 1 1 -4.00 700 700 710 1 2 -4.00 700 700 710 1 3 -4.00 700 700 710 1 4 -4.00 700 700 710 1 5 -3.61 704 700 712 1 6 -3.28 708 702 714 1 7 -3.02 711 706 717 1 8 -2.81 714 709 719 1 9 -2.63 716 711 721 1 10 -2.47 718 714 722 1 11 -2.32 719 715 723 1 12 -2.19 721 717 725 1 13 -2.06 722 718 726 1 14 -1.94 724 720 728 1 15 -1.83 725 721 729 1 16 -1.72 726 722 730 1 17 -1.61 727 724 731 1 18 -1.51 728 725 732 1 19 -1.41 730 727 734 2 20 -1.31 731 728 735 2 21 -1.21 732 729 735 2 22 -1.11 733 730 736 2 23 -1.01 734 731 737 2 24 -0.91 736 733 739 2 25 -0.81 737 734 740 2 26 -0.71 738 735 741 2 27 -0.61 739 736 743 2
(cont’d)

Appendix G Raw to Scaled Score Conv. 25 2007-08 NECAP Technical Report
Table G-12. 2007-08 NECAP Scale Conversion: Reading Grade 7 (cont�d).
Error Band
Raw Score θ Scaled Score
Lower Bound
Upper Bound
Performance Level
28 -0.50 740 737 744 3 29 -0.40 741 738 745 3 30 -0.29 743 740 747 3 31 -0.18 744 740 748 3 32 -0.07 745 741 749 3 33 0.04 746 742 750 3 34 0.16 748 744 752 3 35 0.28 749 745 753 3 36 0.41 751 747 755 3 37 0.54 752 748 756 3 38 0.67 754 750 758 3 39 0.82 755 751 759 3 40 0.96 757 753 761 3 41 1.12 759 755 763 3 42 1.27 761 757 765 4 43 1.44 763 759 768 4 44 1.62 765 760 770 4 45 1.80 767 762 772 4 46 2.01 769 764 774 4 47 2.23 772 767 777 4 48 2.47 774 769 779 4 49 2.77 778 772 780 4 50 3.15 780 773 780 4 51 3.78 780 770 780 4 52 4.00 780 770 780 4

Appendix G Raw to Scaled Score Conv. 26 2007-08 NECAP Technical Report
Table G-13. 2007-08 NECAP Scale Conversion: Reading Grade 8.
Error Band
Raw Score θ Scaled Score
Lower Bound
Upper Bound
Performance Level
0 -4.00 800 800 810 1 1 -4.00 800 800 810 1 2 -4.00 800 800 810 1 3 -4.00 800 800 809 1 4 -4.00 800 800 808 1 5 -3.84 802 800 809 1 6 -3.56 805 800 811 1 7 -3.33 808 803 813 1 8 -3.14 810 805 815 1 9 -2.97 812 808 816 1 10 -2.82 814 810 818 1 11 -2.69 815 811 819 1 12 -2.56 817 813 821 1 13 -2.44 818 814 822 1 14 -2.33 819 816 823 1 15 -2.22 820 817 823 1 16 -2.12 822 819 825 1 17 -2.02 823 820 826 1 18 -1.92 824 821 827 1 19 -1.82 825 822 828 1 20 -1.73 826 823 829 1 21 -1.64 827 824 830 1 22 -1.54 827 824 830 1 23 -1.45 829 826 832 2 24 -1.36 830 827 833 2 25 -1.27 831 828 834 2 26 -1.17 833 830 836 2 27 -1.07 834 831 837 2 28 -0.97 835 832 838 2 29 -0.87 836 833 839 2 30 -0.77 837 834 840 2 31 -0.65 838 835 842 2 32 -0.54 839 835 843 2
(cont’d)

Appendix G Raw to Scaled Score Conv. 27 2007-08 NECAP Technical Report
Table G-13. 2007-08 NECAP Scale Conversion: Reading Grade 8 (cont�d).
Error Band
Raw Score θ Scaled Score
Lower Bound
Upper Bound
Performance Level
33 -0.42 841 837 845 3 34 -0.29 843 839 847 3 35 -0.16 844 840 848 3 36 -0.02 846 842 850 3 37 0.12 847 843 851 3 38 0.27 849 845 853 3 39 0.42 851 847 855 3 40 0.57 853 849 857 3 41 0.73 854 850 858 3 42 0.89 856 852 860 3 43 1.05 858 854 862 3 44 1.22 860 856 864 4 45 1.41 862 858 866 4 46 1.60 864 860 868 4 47 1.80 867 862 872 4 48 2.04 869 864 874 4 49 2.31 873 868 878 4 50 2.67 877 871 880 4 51 3.24 880 871 880 4 52 4.00 880 870 880 4

Appendix G Raw to Scaled Score Conv. 28 2007-08 NECAP Technical Report
Table G-14. 2007-08 NECAP Scale Conversion: Reading Grade 11.
Error Band
Raw Score θ Scaled Score
Lower Bound
Upper Bound
Performance Level
0 -4.00 1100 1100 1110 1 1 -4.00 1100 1100 1110 1 2 -4.00 1100 1100 1110 1 3 -4.00 1100 1100 1110 1 4 -4.00 1100 1100 1110 1 5 -3.43 1106 1100 1115 1 6 -2.99 1111 1105 1117 1 7 -2.70 1114 1109 1119 1 8 -2.47 1117 1113 1122 1 9 -2.29 1119 1115 1123 1 10 -2.13 1120 1116 1124 1 11 -1.99 1122 1119 1126 1 12 -1.86 1123 1120 1126 1 13 -1.74 1124 1121 1127 1 14 -1.63 1126 1123 1129 1 15 -1.53 1127 1124 1130 1 16 -1.43 1128 1125 1131 1 17 -1.33 1129 1126 1132 1 18 -1.24 1129 1126 1132 1 19 -1.14 1131 1128 1134 2 20 -1.05 1132 1129 1135 2 21 -0.96 1133 1130 1136 2 22 -0.86 1134 1131 1137 2 23 -0.77 1135 1132 1138 2 24 -0.68 1136 1133 1139 2 25 -0.59 1137 1134 1140 2 26 -0.49 1138 1135 1141 2 27 -0.39 1139 1136 1142 2

Appendix G Raw to Scaled Score Conv. 29 2007-08 NECAP Technical Report
Table G-14. 2007-08 NECAP Scale Conversion: Reading Grade 11 (cont�d).
Error Band
Raw Score θ Scaled Score
Lower Bound
Upper Bound
Performance Level
28 -0.29 1140 1137 1143 3 29 -0.19 1141 1138 1144 3 30 -0.08 1142 1139 1145 3 31 0.02 1144 1141 1147 3 32 0.14 1145 1142 1148 3 33 0.26 1146 1143 1149 3 34 0.38 1147 1144 1150 3 35 0.50 1149 1146 1152 3 36 0.64 1150 1147 1153 3 37 0.77 1152 1149 1155 3 38 0.91 1153 1150 1157 3 39 1.06 1155 1152 1159 4 40 1.21 1156 1153 1160 4 41 1.36 1158 1154 1162 4 42 1.52 1160 1156 1164 4 43 1.68 1162 1158 1166 4 44 1.86 1163 1159 1167 4 45 2.04 1165 1161 1169 4 46 2.22 1167 1163 1171 4 47 2.42 1170 1166 1174 4 48 2.64 1172 1168 1176 4 49 2.90 1175 1171 1180 4 50 3.24 1178 1173 1180 4 51 3.86 1180 1171 1180 4 52 4.00 1180 1170 1180 4

Appendix G Raw to Scaled Score Conv. 30 2007-08 NECAP Technical Report
Table G-15. 2007-08 NECAP Scale Conversion: Writing Grade 5.
Error Band
Raw Score θ Scaled Score
Lower Bound
Upper Bound
Performance Level
0 -4.00 500 500 510 1 1 -4.00 500 500 510 1 2 -4.00 500 500 510 1 3 -4.00 500 500 510 1 4 -4.00 500 500 510 1 5 -4.00 500 500 510 1 6 -4.00 500 500 510 1 7 -4.00 500 500 510 1 8 -4.00 500 500 509 1 9 -3.85 502 500 510 1 10 -3.42 506 500 513 1 11 -3.06 509 503 516 1 12 -2.73 513 507 519 1 13 -2.44 516 510 522 1 14 -2.17 518 513 524 1 15 -1.90 521 516 526 1 16 -1.64 524 519 529 1 17 -1.38 526 521 532 1 18 -1.11 529 523 535 2 19 -0.82 532 526 538 2 20 -0.51 535 529 541 2 21 -0.17 538 531 545 2 22 0.19 542 535 549 3 23 0.56 546 539 553 3 24 0.96 550 543 557 3 25 1.36 554 546 562 3 26 1.78 558 550 566 4 27 2.22 563 555 571 4 28 2.69 567 559 575 4 29 3.18 572 564 580 4 30 3.69 577 568 580 4 31 4.00 580 571 580 4 32 4.00 580 571 580 4 33 4.00 580 571 580 4 34 4.00 580 571 580 4 35 4.00 580 571 580 4 36 4.00 580 571 580 4 37 4.00 580 571 580 4

Appendix G Raw to Scaled Score Conv. 31 2007-08 NECAP Technical Report
Table G-16. 2007-08 NECAP Scale Conversion: Writing Grade 8.
Error Band
Raw Score θ Scaled Score
Lower Bound
Upper Bound
Performance Level
0 -4.00 800 800 810 1 1 -4.00 800 800 810 1 2 -4.00 800 800 810 1 3 -4.00 800 800 810 1 4 -4.00 800 800 810 1 5 -4.00 800 800 810 1 6 -4.00 800 800 810 1 7 -4.00 800 800 810 1 8 -3.48 805 800 812 1 9 -3.07 809 803 815 1 10 -2.76 812 807 817 1 11 -2.49 815 810 820 1 12 -2.25 817 812 822 1 13 -2.03 819 815 824 1 14 -1.82 821 817 825 1 15 -1.62 823 819 827 1 16 -1.42 825 821 829 1 17 -1.22 827 823 831 1 18 -1.02 829 825 833 2 19 -0.82 831 827 835 2 20 -0.60 833 828 838 2 21 -0.38 835 830 840 2 22 -0.15 838 833 843 2 23 0.09 839 834 844 2 24 0.33 842 837 847 3 25 0.58 845 840 850 3 26 0.83 847 842 852 3 27 1.10 850 845 855 3 28 1.39 853 848 858 3 29 1.70 855 850 862 3 30 2.03 859 853 865 4 31 2.38 862 856 868 4 32 2.77 866 860 872 4 33 3.22 871 864 878 4 34 3.81 876 868 880 4 35 4.00 878 869 880 4 36 4.00 878 869 880 4 37 4.00 880 871 880 4

Appendix H Scaled Score Cum. Density Function 1 2007-08 NECAP Technical Report
APPENDIX H—SCALED SCORE CUMULATIVE
DENSITY FUNCTIONS

Appendix H Scaled Score Cum. Density Function 2 2007-08 NECAP Technical Report
Table H-1. 2007-08 NECAP Scaled Score Cumulative Density Function: Math Grade 3.
Scale Score Percentage Cumulative
Percentage Scale Score Percentage Cumulative
Percentage 300 0.3% 0.3% 340 2.2% 34.7% 301 0.0% 0.3% 341 2.3% 36.9% 302 0.0% 0.3% 342 5.2% 42.1% 303 0.0% 0.3% 343 2.8% 44.9% 304 0.1% 0.5% 344 2.8% 47.7% 305 0.0% 0.5% 345 6.0% 53.6% 306 0.0% 0.5% 346 3.3% 56.9% 307 0.2% 0.7% 347 3.1% 60.0% 308 0.0% 0.7% 348 3.3% 63.3% 309 0.3% 0.9% 349 3.4% 66.7% 310 0.0% 0.9% 350 3.6% 70.3% 311 0.0% 0.9% 351 3.7% 74.0% 312 0.3% 1.2% 352 7.3% 81.3% 313 0.3% 1.5% 353 0.0% 81.3% 314 0.0% 1.5% 354 3.3% 84.6% 315 0.4% 1.9% 355 0.0% 84.6% 316 0.0% 1.9% 356 3.2% 87.8% 317 0.4% 2.3% 357 2.9% 90.7% 318 0.5% 2.8% 358 0.0% 90.7% 319 0.0% 2.8% 359 2.6% 93.3% 320 0.5% 3.3% 360 0.0% 93.3% 321 0.6% 3.9% 361 2.3% 95.7% 322 0.6% 4.5% 362 0.0% 95.7% 323 0.7% 5.2% 363 1.8% 97.5% 324 0.7% 5.9% 364 0.0% 97.5% 325 0.7% 6.6% 365 0.0% 97.5% 326 0.8% 7.4% 366 1.3% 98.8% 327 0.9% 8.3% 367 0.0% 98.8% 328 0.9% 9.2% 368 0.0% 98.8% 329 2.2% 11.4% 369 0.0% 98.8% 330 1.2% 12.6% 370 0.0% 98.8% 331 1.2% 13.9% 371 0.8% 99.6% 332 1.2% 15.1% 372 0.0% 99.6% 333 2.6% 17.7% 373 0.0% 99.6% 334 1.5% 19.1% 374 0.0% 99.6% 335 1.5% 20.7% 375 0.0% 99.6% 336 3.7% 24.4% 376 0.0% 99.6% 337 1.8% 26.2% 377 0.0% 99.6% 338 1.9% 28.2% 378 0.3% 99.9% 339 4.3% 32.4% 379 0.0% 99.9%
380 0.1% 100.0%

Appendix H Scaled Score Cum. Density Function 3 2007-08 NECAP Technical Report
Table H-2. 2007-08 NECAP Scaled Score Cumulative Density Function: Math Grade 4.
Scale Score Percentage Cumulative
Percentage Scale Score Percentage Cumulative
Percentage 400 0.3% 0.3% 440 0.0% 38.2% 401 0.0% 0.3% 441 5.0% 43.2% 402 0.2% 0.5% 442 2.7% 45.9% 403 0.0% 0.5% 443 2.7% 48.6% 404 0.0% 0.5% 444 5.4% 54.0% 405 0.0% 0.5% 445 2.6% 56.6% 406 0.3% 0.8% 446 2.8% 59.4% 407 0.0% 0.8% 447 2.7% 62.1% 408 0.0% 0.8% 448 5.9% 68.0% 409 0.0% 0.8% 449 2.8% 70.7% 410 0.3% 1.1% 450 2.9% 73.6% 411 0.0% 1.1% 451 2.7% 76.3% 412 0.4% 1.6% 452 2.7% 79.1% 413 0.0% 1.6% 453 2.6% 81.7% 414 0.5% 2.1% 454 2.6% 84.3% 415 0.0% 2.1% 455 0.0% 84.3% 416 0.5% 2.7% 456 2.5% 86.9% 417 0.0% 2.7% 457 2.6% 89.5% 418 0.6% 3.3% 458 2.3% 91.7% 419 0.7% 4.0% 459 0.0% 91.7% 420 0.0% 4.0% 460 2.1% 93.8% 421 0.8% 4.8% 461 0.0% 93.8% 422 0.8% 5.6% 462 1.9% 95.7% 423 0.8% 6.5% 463 0.0% 95.7% 424 0.9% 7.3% 464 1.4% 97.1% 425 1.0% 8.3% 465 0.0% 97.1% 426 1.0% 9.3% 466 1.3% 98.4% 427 1.1% 10.4% 467 0.0% 98.4% 428 1.2% 11.6% 468 0.0% 98.4% 429 1.2% 12.8% 469 0.8% 99.1% 430 2.7% 15.5% 470 0.0% 99.1% 431 0.0% 15.5% 471 0.0% 99.1% 432 3.0% 18.5% 472 0.0% 99.1% 433 1.7% 20.1% 473 0.5% 99.6% 434 1.7% 21.8% 474 0.0% 99.6% 435 1.7% 23.5% 475 0.0% 99.6% 436 3.8% 27.3% 476 0.0% 99.6% 437 1.9% 29.3% 477 0.0% 99.6% 438 2.1% 31.3% 478 0.0% 99.6% 439 6.9% 38.2% 479 0.0% 99.6%
480 0.4% 100.0%

Appendix H Scaled Score Cum. Density Function 4 2007-08 NECAP Technical Report
Table H-3. 2007-08 NECAP Scaled Score Cumulative Density Function: Math Grade 5.
Scale Score Percentage Cumulative
Percentage Scale Score Percentage Cumulative
Percentage 500 0.6% 0.6% 540 2.5% 38.8% 501 0.0% 0.6% 541 2.5% 41.3% 502 0.0% 0.6% 542 2.5% 43.9% 503 0.0% 0.6% 543 5.0% 48.9% 504 0.0% 0.6% 544 2.5% 51.4% 505 0.4% 1.0% 545 2.6% 54.0% 506 0.0% 1.0% 546 5.2% 59.3% 507 0.0% 1.0% 547 2.5% 61.8% 508 0.0% 1.0% 548 2.5% 64.3% 509 0.0% 1.0% 549 5.1% 69.4% 510 0.0% 1.0% 550 2.5% 71.9% 511 0.5% 1.5% 551 2.3% 74.2% 512 0.0% 1.5% 552 4.6% 78.8% 513 0.0% 1.5% 553 4.2% 83.0% 514 0.0% 1.5% 554 0.0% 83.0% 515 0.7% 2.2% 555 3.9% 87.0% 516 0.0% 2.2% 556 1.8% 88.8% 517 0.0% 2.2% 557 1.7% 90.5% 518 0.9% 3.1% 558 1.6% 92.1% 519 0.0% 3.1% 559 1.3% 93.4% 520 1.0% 4.1% 560 1.2% 94.6% 521 0.0% 4.1% 561 1.2% 95.8% 522 1.3% 5.4% 562 0.9% 96.8% 523 0.0% 5.4% 563 0.8% 97.5% 524 1.3% 6.7% 564 0.0% 97.5% 525 0.0% 6.7% 565 0.7% 98.3% 526 1.6% 8.3% 566 0.5% 98.8% 527 1.6% 9.9% 567 0.0% 98.8% 528 1.8% 11.7% 568 0.4% 99.2% 529 0.0% 11.7% 569 0.3% 99.5% 530 1.7% 13.4% 570 0.0% 99.5% 531 1.9% 15.3% 571 0.2% 99.7% 532 4.2% 19.5% 572 0.0% 99.7% 533 0.0% 19.5% 573 0.0% 99.7% 534 2.2% 21.7% 574 0.1% 99.9% 535 2.2% 23.9% 575 0.0% 99.9% 536 2.4% 26.3% 576 0.1% 99.9% 537 2.4% 28.7% 577 0.0% 99.9% 538 2.5% 31.2% 578 0.0% 99.9% 539 5.2% 36.3% 579 0.0% 99.9%
580 0.1% 100.0%

Appendix H Scaled Score Cum. Density Function 5 2007-08 NECAP Technical Report
Table H-4. 2007-08 NECAP Scaled Score Cumulative Density Function: Math Grade 6.
Scale Score Percentage Cumulative
Percentage Scale Score Percentage Cumulative
Percentage 600 1.1% 1.1% 640 0.0% 37.5% 601 0.0% 1.1% 641 4.9% 42.4% 602 0.0% 1.1% 642 2.5% 44.9% 603 0.0% 1.1% 643 2.4% 47.3% 604 0.0% 1.1% 644 5.1% 52.5% 605 0.0% 1.1% 645 2.5% 54.9% 606 0.7% 1.8% 646 4.7% 59.7% 607 0.0% 1.8% 647 2.2% 61.9% 608 0.0% 1.8% 648 4.5% 66.4% 609 0.0% 1.8% 649 2.3% 68.6% 610 0.0% 1.8% 650 4.1% 72.7% 611 0.0% 1.8% 651 2.2% 74.9% 612 0.9% 2.7% 652 6.0% 80.9% 613 0.0% 2.7% 653 0.0% 80.9% 614 0.0% 2.7% 654 1.7% 82.6% 615 0.0% 2.7% 655 3.6% 86.2% 616 1.0% 3.7% 656 1.7% 87.9% 617 0.0% 3.7% 657 1.4% 89.3% 618 0.0% 3.7% 658 2.8% 92.1% 619 1.1% 4.7% 659 1.3% 93.3% 620 0.0% 4.7% 660 1.1% 94.4% 621 1.2% 5.9% 661 1.0% 95.5% 622 0.0% 5.9% 662 1.0% 96.4% 623 1.3% 7.2% 663 0.9% 97.3% 624 0.0% 7.2% 664 0.0% 97.3% 625 1.5% 8.7% 665 0.7% 98.0% 626 0.0% 8.7% 666 0.6% 98.7% 627 1.7% 10.4% 667 0.0% 98.7% 628 1.6% 12.0% 668 0.5% 99.2% 629 0.0% 12.0% 669 0.0% 99.2% 630 1.6% 13.6% 670 0.4% 99.6% 631 2.1% 15.7% 671 0.0% 99.6% 632 3.9% 19.6% 672 0.0% 99.6% 633 0.0% 19.6% 673 0.2% 99.8% 634 2.0% 21.6% 674 0.0% 99.8% 635 2.1% 23.7% 675 0.0% 99.8% 636 2.2% 25.8% 676 0.0% 99.8% 637 4.5% 30.3% 677 0.1% 99.9% 638 2.4% 32.7% 678 0.0% 99.9% 639 4.8% 37.5% 679 0.0% 99.9%
680 0.1% 100.0%

Appendix H Scaled Score Cum. Density Function 6 2007-08 NECAP Technical Report
Table H-5. 2007-08 NECAP Scaled Score Cumulative Density Function: Math Grade 7.
Scale Score Percentage Cumulative
Percentage Scale Score Percentage Cumulative
Percentage 700 1.0% 1.0% 740 0.0% 42.5% 701 0.0% 1.0% 741 4.9% 47.4% 702 0.0% 1.0% 742 2.3% 49.8% 703 0.0% 1.0% 743 5.0% 54.8% 704 0.0% 1.0% 744 4.9% 59.6% 705 0.0% 1.0% 745 2.5% 62.2% 706 0.0% 1.0% 746 4.6% 66.8% 707 0.7% 1.7% 747 2.3% 69.1% 708 0.0% 1.7% 748 4.1% 73.2% 709 0.0% 1.7% 749 4.2% 77.4% 710 0.0% 1.7% 750 2.0% 79.4% 711 0.0% 1.7% 751 3.7% 83.1% 712 0.0% 1.7% 752 1.7% 84.8% 713 0.0% 1.7% 753 1.7% 86.5% 714 0.9% 2.6% 754 3.2% 89.7% 715 0.0% 2.6% 755 1.4% 91.1% 716 0.0% 2.6% 756 1.4% 92.5% 717 0.0% 2.6% 757 1.1% 93.5% 718 1.2% 3.8% 758 1.2% 94.7% 719 0.0% 3.8% 759 1.0% 95.7% 720 0.0% 3.8% 760 1.0% 96.7% 721 1.4% 5.2% 761 0.7% 97.4% 722 0.0% 5.2% 762 0.7% 98.1% 723 1.6% 6.8% 763 0.5% 98.6% 724 0.0% 6.8% 764 0.4% 99.0% 725 1.7% 8.5% 765 0.0% 99.0% 726 0.0% 8.5% 766 0.3% 99.4% 727 1.7% 10.2% 767 0.0% 99.4% 728 1.8% 12.0% 768 0.3% 99.6% 729 2.0% 14.0% 769 0.0% 99.6% 730 0.0% 14.0% 770 0.1% 99.8% 731 2.2% 16.2% 771 0.0% 99.8% 732 2.2% 18.3% 772 0.1% 99.8% 733 2.2% 20.6% 773 0.0% 99.8% 734 2.4% 23.0% 774 0.0% 99.8% 735 4.8% 27.8% 775 0.1% 99.9% 736 2.6% 30.4% 776 0.0% 99.9% 737 2.4% 32.7% 777 0.0% 99.9% 738 2.3% 35.1% 778 0.0% 99.9% 739 7.4% 42.5% 779 0.0% 100.0%
780 0.0% 100.0%

Appendix H Scaled Score Cum. Density Function 7 2007-08 NECAP Technical Report
Table H-6. 2007-08 NECAP Scaled Score Cumulative Density Function: Math Grade 8.
Scale Score Percentage Cumulative
Percentage Scale Score Percentage Cumulative
Percentage 800 1.4% 1.4% 840 2.3% 47.4% 801 0.0% 1.4% 841 2.1% 49.5% 802 0.9% 2.3% 842 4.5% 53.9% 803 0.0% 2.3% 843 4.2% 58.2% 804 0.0% 2.3% 844 4.3% 62.5% 805 0.0% 2.3% 845 4.0% 66.5% 806 0.0% 2.3% 846 3.8% 70.3% 807 0.0% 2.3% 847 3.7% 74.0% 808 0.0% 2.3% 848 3.6% 77.6% 809 0.0% 2.3% 849 1.6% 79.2% 810 0.0% 2.3% 850 3.3% 82.5% 811 0.0% 2.3% 851 3.1% 85.6% 812 0.0% 2.3% 852 3.0% 88.5% 813 0.0% 2.3% 853 1.3% 89.8% 814 0.0% 2.3% 854 2.4% 92.2% 815 1.3% 3.6% 855 1.2% 93.4% 816 0.0% 3.6% 856 1.1% 94.4% 817 0.0% 3.6% 857 1.8% 96.2% 818 0.0% 3.6% 858 0.8% 97.1% 819 0.0% 3.6% 859 0.7% 97.8% 820 1.6% 5.2% 860 0.6% 98.4% 821 0.0% 5.2% 861 0.4% 98.9% 822 0.0% 5.2% 862 0.0% 98.9% 823 1.7% 6.9% 863 0.4% 99.2% 824 0.0% 6.9% 864 0.0% 99.2% 825 2.1% 9.0% 865 0.2% 99.5% 826 0.0% 9.0% 866 0.0% 99.5% 827 2.1% 11.1% 867 0.3% 99.7% 828 0.0% 11.1% 868 0.0% 99.7% 829 2.2% 13.3% 869 0.0% 99.7% 830 2.1% 15.5% 870 0.2% 99.9% 831 2.2% 17.6% 871 0.0% 99.9% 832 2.3% 20.0% 872 0.0% 99.9% 833 2.2% 22.2% 873 0.0% 99.9% 834 2.3% 24.5% 874 0.0% 99.9% 835 4.3% 28.8% 875 0.1% 100.0% 836 2.3% 31.1% 876 0.0% 100.0% 837 4.6% 35.7% 877 0.0% 100.0% 838 2.4% 38.1% 878 0.0% 100.0% 839 7.0% 45.1% 879 0.0% 100.0%
880 0.0% 100.0%

Appendix H Scaled Score Cum. Density Function 8 2007-08 NECAP Technical Report
Table H-7. 2007-08 NECAP Scaled Score Cumulative Density Function: Math Grade 11.
Scale Score Percentage Cumulative
Percentage Scale Score Percentage Cumulative
Percentage 1100 3.0% 3.0% 1140 1.9% 75.9% 1101 0.0% 3.0% 1141 3.6% 79.5% 1102 0.0% 3.0% 1142 3.2% 82.7% 1103 0.0% 3.0% 1143 4.0% 86.6% 1104 0.0% 3.0% 1144 2.5% 89.1% 1105 2.0% 5.0% 1145 2.2% 91.4% 1106 0.0% 5.0% 1146 1.7% 93.0% 1107 0.0% 5.0% 1147 1.5% 94.6% 1108 0.0% 5.0% 1148 1.3% 95.9% 1109 0.0% 5.0% 1149 1.1% 97.0% 1110 0.0% 5.0% 1150 0.5% 97.5% 1111 0.0% 5.0% 1151 1.1% 98.5% 1112 0.0% 5.0% 1152 0.3% 98.9% 1113 0.0% 5.0% 1153 0.3% 99.1% 1114 0.0% 5.0% 1154 0.2% 99.4% 1115 0.0% 5.0% 1155 0.2% 99.6% 1116 2.5% 7.5% 1156 0.1% 99.7% 1117 0.0% 7.5% 1157 0.1% 99.8% 1118 0.0% 7.5% 1158 0.1% 99.9% 1119 0.0% 7.5% 1159 0.0% 99.9% 1120 3.1% 10.6% 1160 0.1% 99.9% 1121 0.0% 10.6% 1161 0.0% 99.9% 1122 0.0% 10.6% 1162 0.0% 100.0% 1123 3.5% 14.1% 1163 0.0% 100.0% 1124 3.7% 17.8% 1164 0.0% 100.0% 1125 0.0% 17.8% 1165 0.0% 100.0% 1126 3.8% 21.7% 1166 0.0% 100.0% 1127 3.8% 25.4% 1167 0.0% 100.0% 1128 0.0% 25.4% 1168 0.0% 100.0% 1129 3.8% 29.3% 1169 0.0% 100.0% 1130 3.7% 33.0% 1170 0.0% 100.0% 1131 3.7% 36.6% 1171 0.0% 100.0% 1132 6.8% 43.4% 1172 0.0% 100.0% 1133 3.1% 46.5% 1173 0.0% 100.0% 1134 3.1% 49.6% 1174 0.0% 100.0% 1135 5.6% 55.3% 1175 0.0% 100.0% 1136 5.3% 60.5% 1176 0.0% 100.0% 1137 2.4% 62.9% 1177 0.0% 100.0% 1138 4.9% 67.8% 1178 0.0% 100.0% 1139 6.2% 74.0% 1179 0.0% 100.0%
1180 0.0% 100.0%
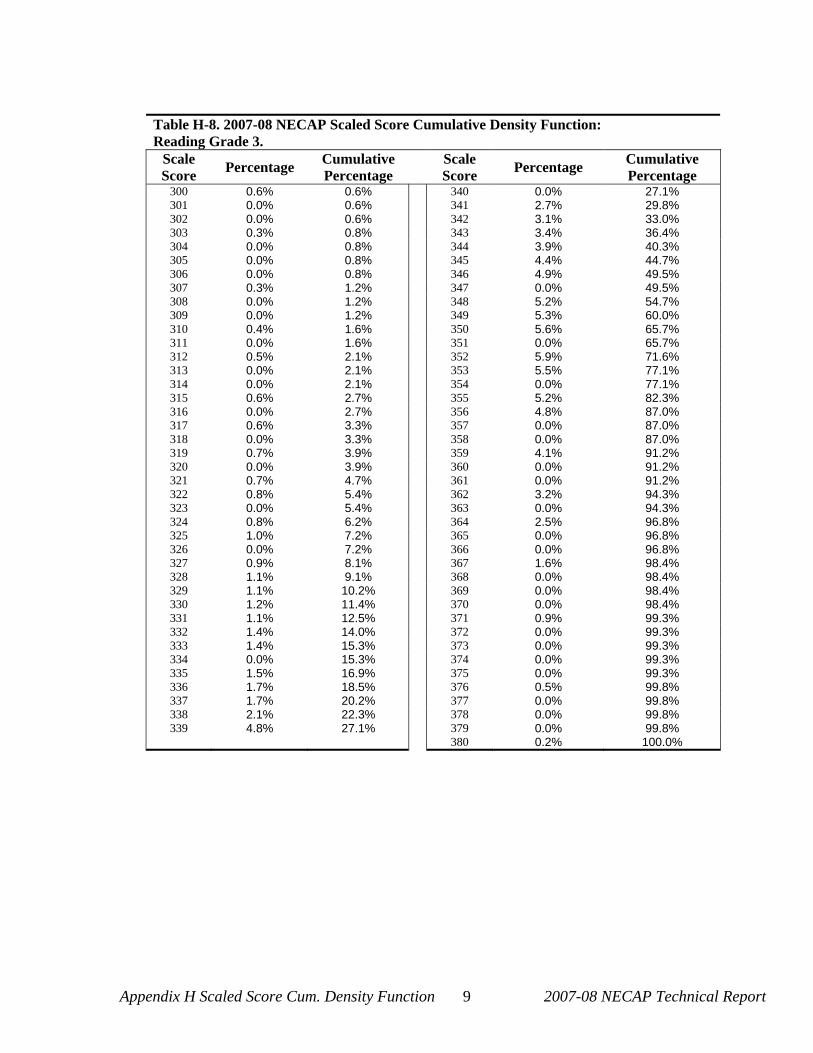
Appendix H Scaled Score Cum. Density Function 9 2007-08 NECAP Technical Report
Table H-8. 2007-08 NECAP Scaled Score Cumulative Density Function: Reading Grade 3.
Scale Score Percentage Cumulative
Percentage Scale Score Percentage Cumulative
Percentage 300 0.6% 0.6% 340 0.0% 27.1% 301 0.0% 0.6% 341 2.7% 29.8% 302 0.0% 0.6% 342 3.1% 33.0% 303 0.3% 0.8% 343 3.4% 36.4% 304 0.0% 0.8% 344 3.9% 40.3% 305 0.0% 0.8% 345 4.4% 44.7% 306 0.0% 0.8% 346 4.9% 49.5% 307 0.3% 1.2% 347 0.0% 49.5% 308 0.0% 1.2% 348 5.2% 54.7% 309 0.0% 1.2% 349 5.3% 60.0% 310 0.4% 1.6% 350 5.6% 65.7% 311 0.0% 1.6% 351 0.0% 65.7% 312 0.5% 2.1% 352 5.9% 71.6% 313 0.0% 2.1% 353 5.5% 77.1% 314 0.0% 2.1% 354 0.0% 77.1% 315 0.6% 2.7% 355 5.2% 82.3% 316 0.0% 2.7% 356 4.8% 87.0% 317 0.6% 3.3% 357 0.0% 87.0% 318 0.0% 3.3% 358 0.0% 87.0% 319 0.7% 3.9% 359 4.1% 91.2% 320 0.0% 3.9% 360 0.0% 91.2% 321 0.7% 4.7% 361 0.0% 91.2% 322 0.8% 5.4% 362 3.2% 94.3% 323 0.0% 5.4% 363 0.0% 94.3% 324 0.8% 6.2% 364 2.5% 96.8% 325 1.0% 7.2% 365 0.0% 96.8% 326 0.0% 7.2% 366 0.0% 96.8% 327 0.9% 8.1% 367 1.6% 98.4% 328 1.1% 9.1% 368 0.0% 98.4% 329 1.1% 10.2% 369 0.0% 98.4% 330 1.2% 11.4% 370 0.0% 98.4% 331 1.1% 12.5% 371 0.9% 99.3% 332 1.4% 14.0% 372 0.0% 99.3% 333 1.4% 15.3% 373 0.0% 99.3% 334 0.0% 15.3% 374 0.0% 99.3% 335 1.5% 16.9% 375 0.0% 99.3% 336 1.7% 18.5% 376 0.5% 99.8% 337 1.7% 20.2% 377 0.0% 99.8% 338 2.1% 22.3% 378 0.0% 99.8% 339 4.8% 27.1% 379 0.0% 99.8%
380 0.2% 100.0%

Appendix H Scaled Score Cum. Density Function 10 2007-08 NECAP Technical Report
Table H-9. 2007-08 NECAP Scaled Score Cumulative Density Function: Reading Grade 4.
Scale Score Percentage Cumulative
Percentage Scale Score Percentage Cumulative
Percentage 400 0.4% 0.4% 440 3.0% 33.7% 401 0.0% 0.4% 441 3.3% 37.0% 402 0.2% 0.7% 442 3.6% 40.6% 403 0.0% 0.7% 443 4.0% 44.6% 404 0.0% 0.7% 444 0.0% 44.6% 405 0.0% 0.7% 445 4.2% 48.8% 406 0.3% 1.0% 446 4.3% 53.0% 407 0.0% 1.0% 447 4.5% 57.5% 408 0.0% 1.0% 448 4.7% 62.2% 409 0.4% 1.3% 449 0.0% 62.2% 410 0.0% 1.3% 450 4.9% 67.1% 411 0.0% 1.3% 451 5.1% 72.2% 412 0.5% 1.8% 452 0.0% 72.2% 413 0.0% 1.8% 453 4.9% 77.1% 414 0.0% 1.8% 454 0.0% 77.1% 415 0.6% 2.4% 455 4.9% 82.0% 416 0.0% 2.4% 456 0.0% 82.0% 417 0.6% 3.0% 457 4.5% 86.4% 418 0.0% 3.0% 458 0.0% 86.4% 419 0.7% 3.7% 459 0.0% 86.4% 420 0.0% 3.7% 460 3.9% 90.4% 421 0.6% 4.3% 461 0.0% 90.4% 422 0.7% 5.1% 462 3.2% 93.6% 423 0.0% 5.1% 463 0.0% 93.6% 424 0.8% 5.9% 464 0.0% 93.6% 425 1.0% 6.9% 465 2.6% 96.2% 426 1.0% 7.9% 466 0.0% 96.2% 427 0.0% 7.9% 467 0.0% 96.2% 428 1.1% 9.0% 468 0.0% 96.2% 429 1.3% 10.3% 469 1.6% 97.8% 430 1.4% 11.7% 470 0.0% 97.8% 431 1.4% 13.1% 471 0.0% 97.8% 432 1.6% 14.6% 472 0.0% 97.8% 433 1.8% 16.5% 473 1.2% 98.9% 434 2.0% 18.4% 474 0.0% 98.9% 435 2.0% 20.4% 475 0.0% 98.9% 436 2.3% 22.7% 476 0.0% 98.9% 437 2.4% 25.1% 477 0.7% 99.6% 438 2.6% 27.8% 478 0.0% 99.6% 439 2.9% 30.7% 479 0.0% 99.6%
480 0.4% 100.0%

Appendix H Scaled Score Cum. Density Function 11 2007-08 NECAP Technical Report
Table H-10. 2007-08 NECAP Scaled Score Cumulative Density Function: Reading Grade 5.
Scale Score Percentage Cumulative
Percentage Scale Score Percentage Cumulative
Percentage 500 0.0% 0.2% 540 3.8% 35.2% 501 0.1% 0.4% 541 4.0% 39.2% 502 0.0% 0.4% 542 4.5% 43.7% 503 0.0% 0.4% 543 0.0% 43.7% 504 0.0% 0.4% 544 4.6% 48.3% 505 0.0% 0.4% 545 5.0% 53.3% 506 0.3% 0.7% 546 5.0% 58.3% 507 0.0% 0.7% 547 0.0% 58.3% 508 0.0% 0.7% 548 5.2% 63.4% 509 0.0% 0.7% 549 5.1% 68.5% 510 0.3% 1.0% 550 0.0% 68.5% 511 0.0% 1.0% 551 4.7% 73.3% 512 0.0% 1.0% 552 4.6% 77.8% 513 0.4% 1.4% 553 0.0% 77.8% 514 0.0% 1.4% 554 4.2% 82.1% 515 0.5% 1.9% 555 0.0% 82.1% 516 0.0% 1.9% 556 3.8% 85.9% 517 0.6% 2.5% 557 3.1% 89.0% 518 0.0% 2.5% 558 0.0% 89.0% 519 0.7% 3.2% 559 2.5% 91.5% 520 0.0% 3.2% 560 0.0% 91.5% 521 0.8% 4.0% 561 2.2% 93.7% 522 0.9% 4.9% 562 0.0% 93.7% 523 0.0% 4.9% 563 1.8% 95.5% 524 1.0% 6.0% 564 0.0% 95.5% 525 1.0% 7.0% 565 1.3% 96.8% 526 0.0% 7.0% 566 0.0% 96.8% 527 1.2% 8.2% 567 1.0% 97.8% 528 1.3% 9.5% 568 0.0% 97.8% 529 1.5% 11.0% 569 0.8% 98.5% 530 1.6% 12.6% 570 0.0% 98.5% 531 0.0% 12.6% 571 0.6% 99.1% 532 2.1% 14.7% 572 0.0% 99.1% 533 2.4% 17.1% 573 0.4% 99.5% 534 2.4% 19.4% 574 0.0% 99.5% 535 2.6% 22.0% 575 0.0% 99.5% 536 3.0% 25.0% 576 0.2% 99.7% 537 0.0% 25.0% 577 0.0% 99.7% 538 6.4% 31.4% 578 0.0% 99.7% 539 0.0% 31.4% 579 0.3% 100.0%
580 0.0% 100.0%

Appendix H Scaled Score Cum. Density Function 12 2007-08 NECAP Technical Report
Table H-11. 2007-08 NECAP Scaled Score Cumulative Density Function: Reading Grade 6.
Scale Score Percentage Cumulative
Percentage Scale Score Percentage Cumulative
Percentage 600 0.2% 0.2% 640 4.1% 35.0% 601 0.0% 0.2% 641 0.0% 35.0% 602 0.1% 0.4% 642 4.5% 39.5% 603 0.0% 0.4% 643 4.7% 44.3% 604 0.0% 0.4% 644 0.0% 44.3% 605 0.0% 0.4% 645 5.0% 49.3% 606 0.2% 0.5% 646 5.6% 54.9% 607 0.0% 0.5% 647 0.0% 54.9% 608 0.0% 0.5% 648 5.5% 60.3% 609 0.2% 0.8% 649 0.0% 60.3% 610 0.0% 0.8% 650 5.4% 65.8% 611 0.3% 1.1% 651 5.5% 71.3% 612 0.0% 1.1% 652 0.0% 71.3% 613 0.0% 1.1% 653 5.3% 76.6% 614 0.4% 1.5% 654 0.0% 76.6% 615 0.0% 1.5% 655 4.9% 81.5% 616 0.4% 2.0% 656 0.0% 81.5% 617 0.6% 2.5% 657 4.3% 85.8% 618 0.0% 2.5% 658 0.0% 85.8% 619 0.6% 3.2% 659 0.0% 85.8% 620 0.0% 3.2% 660 3.8% 89.6% 621 0.7% 3.9% 661 0.0% 89.6% 622 0.8% 4.6% 662 2.9% 92.5% 623 0.9% 5.6% 663 0.0% 92.5% 624 0.0% 5.6% 664 2.2% 94.7% 625 0.9% 6.5% 665 0.0% 94.7% 626 1.2% 7.7% 666 0.0% 94.7% 627 1.2% 8.9% 667 1.6% 96.3% 628 1.4% 10.3% 668 0.0% 96.3% 629 0.0% 10.3% 669 0.0% 96.3% 630 1.6% 11.9% 670 1.3% 97.6% 631 1.9% 13.8% 671 0.0% 97.6% 632 2.1% 15.8% 672 0.9% 98.5% 633 0.0% 15.8% 673 0.0% 98.5% 634 2.3% 18.2% 674 0.0% 98.5% 635 2.7% 20.9% 675 0.6% 99.1% 636 3.0% 23.9% 676 0.0% 99.1% 637 0.0% 23.9% 677 0.0% 99.1% 638 3.4% 27.2% 678 0.4% 99.5% 639 3.7% 30.9% 679 0.0% 99.5%
680 0.5% 100.0%

Appendix H Scaled Score Cum. Density Function 13 2007-08 NECAP Technical Report
Table H-12. 2007-08 NECAP Scaled Score Cumulative Density Function: Reading Grade 7.
Scale Score Percentage Cumulative
Percentage Scale Score Percentage Cumulative
Percentage 700 0.2% 0.2% 740 3.0% 31.5% 701 0.0% 0.2% 741 3.4% 34.9% 702 0.0% 0.2% 742 0.0% 34.9% 703 0.0% 0.2% 743 3.4% 38.3% 704 0.1% 0.3% 744 3.7% 42.1% 705 0.0% 0.3% 745 3.9% 46.0% 706 0.0% 0.3% 746 4.1% 50.1% 707 0.0% 0.3% 747 0.0% 50.1% 708 0.2% 0.6% 748 4.5% 54.5% 709 0.0% 0.6% 749 4.6% 59.1% 710 0.0% 0.6% 750 0.0% 59.1% 711 0.3% 0.9% 751 4.5% 63.6% 712 0.0% 0.9% 752 4.6% 68.2% 713 0.0% 0.9% 753 0.0% 68.2% 714 0.4% 1.3% 754 4.6% 72.8% 715 0.0% 1.3% 755 4.5% 77.3% 716 0.4% 1.7% 756 0.0% 77.3% 717 0.0% 1.7% 757 4.1% 81.4% 718 0.6% 2.3% 758 0.0% 81.4% 719 0.5% 2.8% 759 3.7% 85.2% 720 0.0% 2.8% 760 0.0% 85.2% 721 0.7% 3.5% 761 3.4% 88.5% 722 0.8% 4.3% 762 0.0% 88.5% 723 0.0% 4.3% 763 2.9% 91.4% 724 0.9% 5.2% 764 0.0% 91.4% 725 0.9% 6.1% 765 2.3% 93.7% 726 1.0% 7.0% 766 0.0% 93.7% 727 1.1% 8.2% 767 2.0% 95.7% 728 1.3% 9.5% 768 0.0% 95.7% 729 0.0% 9.5% 769 1.5% 97.2% 730 1.4% 10.9% 770 0.0% 97.2% 731 1.5% 12.5% 771 0.0% 97.2% 732 1.9% 14.3% 772 1.2% 98.4% 733 2.0% 16.3% 773 0.0% 98.4% 734 2.0% 18.3% 774 0.8% 99.2% 735 0.0% 18.3% 775 0.0% 99.2% 736 2.4% 20.7% 776 0.0% 99.2% 737 2.3% 23.0% 777 0.0% 99.2% 738 2.6% 25.6% 778 0.5% 99.6% 739 2.9% 28.5% 779 0.0% 99.6%
780 0.4% 100.0%

Appendix H Scaled Score Cum. Density Function 14 2007-08 NECAP Technical Report
Table H-13. 2007-08 NECAP Scaled Score Cumulative Density Function: Reading Grade 8.
Scale Score Percentage Cumulative
Percentage Scale Score Percentage Cumulative
Percentage 800 0.0% 0.0% 840 0.0% 34.2% 801 0.0% 0.0% 841 4.0% 38.2% 802 0.1% 0.1% 842 0.0% 38.2% 803 0.0% 0.1% 843 4.6% 42.9% 804 0.0% 0.1% 844 4.8% 47.6% 805 0.2% 0.3% 845 0.0% 47.6% 806 0.0% 0.3% 846 5.0% 52.6% 807 0.0% 0.3% 847 5.2% 57.8% 808 0.3% 0.6% 848 0.0% 57.8% 809 0.0% 0.6% 849 5.3% 63.1% 810 0.3% 0.8% 850 0.0% 63.1% 811 0.0% 0.8% 851 5.2% 68.4% 812 0.4% 1.2% 852 0.0% 68.4% 813 0.0% 1.2% 853 5.0% 73.4% 814 0.5% 1.7% 854 4.5% 77.9% 815 0.5% 2.2% 855 0.0% 77.9% 816 0.0% 2.2% 856 4.1% 82.0% 817 0.6% 2.7% 857 0.0% 82.0% 818 0.5% 3.3% 858 3.9% 85.9% 819 0.6% 3.9% 859 0.0% 85.9% 820 0.6% 4.5% 860 3.2% 89.1% 821 0.0% 4.5% 861 0.0% 89.1% 822 0.8% 5.4% 862 2.8% 92.0% 823 0.7% 6.1% 863 0.0% 92.0% 824 0.9% 6.9% 864 2.3% 94.3% 825 1.0% 8.0% 865 0.0% 94.3% 826 1.1% 9.0% 866 0.0% 94.3% 827 2.4% 11.4% 867 1.9% 96.2% 828 0.0% 11.4% 868 0.0% 96.2% 829 1.3% 12.7% 869 1.5% 97.7% 830 1.4% 14.2% 870 0.0% 97.7% 831 1.7% 15.8% 871 0.0% 97.7% 832 0.0% 15.8% 872 0.0% 97.7% 833 1.9% 17.7% 873 1.0% 98.7% 834 2.1% 19.8% 874 0.0% 98.7% 835 2.3% 22.1% 875 0.0% 98.7% 836 2.5% 24.6% 876 0.0% 98.7% 837 3.0% 27.6% 877 0.7% 99.5% 838 3.2% 30.8% 878 0.0% 99.5% 839 3.4% 34.2% 879 0.0% 99.5%
880 0.5% 100.0%

Appendix H Scaled Score Cum. Density Function 15 2007-08 NECAP Technical Report
Table H-14. 2007-08 NECAP Scaled Score Cumulative Density Function: Reading Grade 11.
Scale Score Percentage Cumulative
Percentage Scale Score Percentage Cumulative
Percentage 1100 0.4% 0.4% 1140 3.7% 38.5% 1101 0.0% 0.4% 1141 3.8% 42.3% 1102 0.0% 0.4% 1142 4.2% 46.5% 1103 0.0% 0.4% 1143 0.0% 46.5% 1104 0.0% 0.4% 1144 4.3% 50.8% 1105 0.0% 0.4% 1145 4.6% 55.4% 1106 0.2% 0.6% 1146 4.7% 60.1% 1107 0.0% 0.6% 1147 4.7% 64.8% 1108 0.0% 0.6% 1148 0.0% 64.8% 1109 0.0% 0.6% 1149 4.7% 69.5% 1110 0.0% 0.6% 1150 4.6% 74.1% 1111 0.4% 1.0% 1151 0.0% 74.1% 1112 0.0% 1.0% 1152 4.3% 78.3% 1113 0.0% 1.0% 1153 4.3% 82.6% 1114 0.5% 1.5% 1154 0.0% 82.6% 1115 0.0% 1.5% 1155 3.6% 86.3% 1116 0.0% 1.5% 1156 3.2% 89.5% 1117 0.5% 2.0% 1157 0.0% 89.5% 1118 0.0% 2.0% 1158 2.5% 92.0% 1119 0.7% 2.7% 1159 0.0% 92.0% 1120 0.8% 3.5% 1160 2.1% 94.1% 1121 0.0% 3.5% 1161 0.0% 94.1% 1122 0.8% 4.4% 1162 1.7% 95.8% 1123 0.9% 5.3% 1163 1.4% 97.2% 1124 1.0% 6.3% 1164 0.0% 97.2% 1125 0.0% 6.3% 1165 1.0% 98.3% 1126 0.9% 7.2% 1166 0.0% 98.3% 1127 1.2% 8.4% 1167 0.8% 99.0% 1128 1.2% 9.6% 1168 0.0% 99.0% 1129 2.9% 12.5% 1169 0.0% 99.0% 1130 0.0% 12.5% 1170 0.5% 99.5% 1131 1.6% 14.2% 1171 0.0% 99.5% 1132 1.8% 15.9% 1172 0.2% 99.7% 1133 2.1% 18.0% 1173 0.0% 99.7% 1134 2.2% 20.2% 1174 0.0% 99.7% 1135 2.4% 22.7% 1175 0.2% 99.9% 1136 2.6% 25.3% 1176 0.0% 99.9% 1137 2.8% 28.1% 1177 0.0% 99.9% 1138 3.3% 31.4% 1178 0.1% 100.0% 1139 3.4% 34.8% 1179 0.0% 100.0%
1180 0.0% 100.0%

Appendix H Scaled Score Cum. Density Function 16 2007-08 NECAP Technical Report
Table H-15. 2007-08 NECAP Scaled Score Cumulative Density Function: Writing Grade 5.
Scale Score Percentage Cumulative
Percentage Scale Score Percentage Cumulative
Percentage 500 1.2% 1.2% 540 0.0% 48.1%
501 0.0% 1.2% 541 0.0% 48.1%
502 0.5% 1.7% 542 9.5% 57.6%
503 0.0% 1.7% 543 0.0% 57.6%
504 0.0% 1.7% 544 0.0% 57.6%
505 0.0% 1.7% 545 0.0% 57.6%
506 0.7% 2.4% 546 9.3% 66.9%
507 0.0% 2.4% 547 0.0% 66.9%
508 0.0% 2.4% 548 0.0% 66.9%
509 0.9% 3.3% 549 0.0% 66.9%
510 0.0% 3.3% 550 8.6% 75.5%
511 0.0% 3.3% 551 0.0% 75.5%
512 0.0% 3.3% 552 0.0% 75.5%
513 1.2% 4.5% 553 0.0% 75.5%
514 0.0% 4.5% 554 7.5% 83.0%
515 0.0% 4.5% 555 0.0% 83.0%
516 1.6% 6.1% 556 0.0% 83.0%
517 0.0% 6.1% 557 0.0% 83.0%
518 2.1% 8.2% 558 5.6% 88.6%
519 0.0% 8.2% 559 0.0% 88.6%
520 0.0% 8.2% 560 0.0% 88.6%
521 2.8% 11.0% 561 0.0% 88.6%
522 0.0% 11.0% 562 0.0% 88.6%
523 0.0% 11.0% 563 4.2% 92.7%
524 3.6% 14.5% 564 0.0% 92.7%
525 0.0% 14.5% 565 0.0% 92.7%
526 4.6% 19.1% 566 0.0% 92.7%
527 0.0% 19.1% 567 2.8% 95.5%
528 0.0% 19.1% 568 0.0% 95.5%
529 5.7% 24.8% 569 0.0% 95.5%
530 0.0% 24.8% 570 0.0% 95.5%
531 0.0% 24.8% 571 0.0% 95.5%
532 6.7% 31.5% 572 2.0% 97.5%
533 0.0% 31.5% 573 0.0% 97.5%
534 0.0% 31.5% 574 0.0% 97.5%
535 7.8% 39.3% 575 0.0% 97.5%
536 0.0% 39.3% 576 0.0% 97.5%
537 0.0% 39.3% 577 1.1% 98.7%
538 8.8% 48.1% 578 0.0% 98.7%
539 0.0% 48.1% 579 0.0% 98.7%
580 1.3% 100.0%

Appendix H Scaled Score Cum. Density Function 17 2007-08 NECAP Technical Report
Table H-16. 2007-08 NECAP Scaled Score Cumulative Density Function: Writing Grade 8.
Scale Score Percentage Cumulative
Percentage Scale Score Percentage Cumulative
Percentage 800 1.1% 1.1% 840 0.0% 56.7% 801 0.0% 1.1% 841 0.0% 56.7% 802 0.0% 1.1% 842 7.6% 64.3% 803 0.0% 1.1% 843 0.0% 64.3% 804 0.0% 1.1% 844 0.0% 64.3% 805 0.3% 1.4% 845 7.2% 71.5% 806 0.0% 1.4% 846 0.0% 71.5% 807 0.0% 1.4% 847 6.5% 78.0% 808 0.0% 1.4% 848 0.0% 78.0% 809 0.5% 1.9% 849 0.0% 78.0% 810 0.0% 1.9% 1850 5.7% 83.7% 811 0.0% 1.9% 851 0.0% 83.7% 812 0.7% 2.5% 852 0.0% 83.7% 813 0.0% 2.5% 853 4.6% 88.4% 814 0.0% 2.5% 854 0.0% 88.4% 815 0.9% 3.4% 855 0.0% 88.4% 816 0.0% 3.4% 856 3.8% 92.1% 817 1.2% 4.6% 857 0.0% 92.1% 818 0.0% 4.6% 858 0.0% 92.1% 819 1.5% 6.1% 859 2.9% 95.1% 820 0.0% 6.1% 860 0.0% 95.1% 821 1.8% 7.9% 861 0.0% 95.1% 822 0.0% 7.9% 862 2.0% 97.1% 823 2.4% 10.3% 863 0.0% 97.1% 824 0.0% 10.3% 864 0.0% 97.1% 825 3.3% 13.6% 865 0.0% 97.1% 826 0.0% 13.6% 866 1.5% 98.6% 827 4.0% 17.6% 867 0.0% 98.6% 828 0.0% 17.6% 868 0.0% 98.6% 829 4.7% 22.3% 869 0.0% 98.6% 830 0.0% 22.3% 870 0.0% 98.6% 831 5.7% 28.0% 871 0.8% 99.4% 832 0.0% 28.0% 872 0.0% 99.4% 833 6.4% 34.4% 873 0.0% 99.4% 834 0.0% 34.4% 874 0.0% 99.4% 835 7.2% 41.6% 875 0.0% 99.4% 836 0.0% 41.6% 876 0.4% 99.8% 837 0.0% 41.6% 877 0.0% 99.8% 838 7.5% 49.1% 878 0.2% 100.0% 839 7.6% 56.7% 879 0.0% 100.0%
880 0.0% 100.0%
1 Scaled scores are not computed for writing in grade 11.


Appendix I Summary Stats of Diff/Discr. 1 2007-08 NECAP Technical Report
APPENDIX I—SUMMARY STATISTICS OF DIFFICULTY
AND DISCRIMINATION INDICES

Appendix I Summary Stats of Diff/Discr. 2007-08 NECAP Technical Report 2
Table I-1. 2007-08 NECAP Item Difficulty and Discrimination Indices by Grade, Subject, and Test Form.
Difficulty Discrimination Grade Subject Form
N Items Mean SD Mean SD
00 55 0.69 0.16 0.43 0.08 01 10 0.67 0.15 0.47 0.05 02 10 0.66 0.11 0.45 0.06 03 10 0.69 0.2 0.44 0.09 04 10 0.71 0.14 0.48 0.05 05 10 0.69 0.13 0.45 0.12 06 10 0.67 0.15 0.43 0.07 07 10 0.67 0.16 0.46 0.06 08 10 0.66 0.11 0.46 0.05
Math
09 10 0.69 0.20 0.43 0.09 00 34 0.69 0.16 0.45 0.10 01 17 0.66 0.17 0.46 0.10 02 17 0.71 0.13 0.42 0.12
3
Reading
03 17 0.73 0.13 0.50 0.09 00 55 0.63 0.14 0.43 0.08 01 10 0.63 0.18 0.48 0.10 02 10 0.66 0.20 0.42 0.10 03 10 0.68 0.24 0.38 0.12 04 10 0.65 0.11 0.45 0.08 05 10 0.65 0.20 0.44 0.05 06 10 0.63 0.16 0.42 0.13 07 10 0.64 0.18 0.47 0.09 08 10 0.67 0.20 0.42 0.10
Math
09 10 0.68 0.25 0.37 0.14 00 34 0.72 0.14 0.43 0.07 01 17 0.69 0.14 0.46 0.08 02 17 0.69 0.13 0.42 0.09
4
Reading
03 17 0.63 0.14 0.42 0.07 00 48 0.54 0.18 0.40 0.12 01 11 0.48 0.20 0.43 0.13 02 11 0.55 0.15 0.43 0.08 03 11 0.50 0.18 0.44 0.09 04 11 0.54 0.17 0.45 0.12 05 11 0.52 0.20 0.48 0.09 06 11 0.50 0.17 0.45 0.09 07 11 0.49 0.20 0.42 0.13 08 11 0.55 0.15 0.42 0.08
Math
09 11 0.50 0.18 0.45 0.09 00 34 0.65 0.15 0.40 0.11 01 17 0.64 0.13 0.46 0.10 02 17 0.65 0.17 0.42 0.12
Reading
03 17 0.65 0.15 0.40 0.14
5
Writing 01 17 0.73 0.20 0.36 0.14
cont’d

Appendix I Summary Stats of Diff/Discr. 2007-08 NECAP Technical Report 3
Table I-1. 2007-08 NECAP Item Difficulty and Discrimination Indices by Grade, Subject, and Test Form.
Difficulty Discrimination Grade Subject Form
N Items Mean SD Mean SD
00 11 0.51 0.14 0.48 0.10 01 11 0.49 0.18 0.49 0.10 02 11 0.46 0.12 0.49 0.13 03 11 0.48 0.15 0.50 0.13 04 11 0.51 0.19 0.45 0.13 05 11 0.46 0.18 0.44 0.10 06 11 0.52 0.14 0.47 0.09 07 11 0.50 0.18 0.49 0.09 08 11 0.48 0.12 0.49 0.13
Math
09 34 0.69 0.17 0.40 0.09 00 17 0.64 0.15 0.44 0.12 01 17 0.72 0.16 0.46 0.12 02 17 0.69 0.17 0.42 0.12
6
Reading
03 48 0.50 0.17 0.42 0.12 00 11 0.40 0.17 0.44 0.11 01 11 0.54 0.20 0.41 0.14 02 11 0.46 0.14 0.44 0.09 03 11 0.46 0.23 0.43 0.17 04 11 0.47 0.19 0.38 0.09 05 11 0.44 0.12 0.43 0.12 06 11 0.41 0.17 0.42 0.11 07 11 0.54 0.20 0.41 0.14 08 11 0.46 0.14 0.44 0.08
Math
09 34 0.69 0.14 0.42 0.12 00 17 0.69 0.17 0.43 0.11 01 17 0.68 0.14 0.43 0.13 02 17 0.73 0.14 0.44 0.11
7
Reading
03 48 0.47 0.17 0.43 0.13
cont’d

Appendix I Summary Stats of Diff/Discr. 2007-08 NECAP Technical Report 4
Table I-1. 2007-08 NECAP Item Difficulty and Discrimination Indices by Grade, Subject, and Test Form.
Difficulty Discrimination Grade Subject Form N Items Mean SD Mean SD
00 11 0.47 0.15 0.46 0.09 01 11 0.45 0.15 0.47 0.12 02 11 0.42 0.18 0.40 0.15 03 11 0.52 0.24 0.47 0.07 04 11 0.54 0.15 0.47 0.13 05 11 0.54 0.16 0.48 0.10 06 11 0.49 0.16 0.45 0.10 07 11 0.45 0.15 0.47 0.12 08 11 0.42 0.19 0.39 0.14
Math
09 34 0.73 0.13 0.44 0.12 00 17 0.66 0.17 0.46 0.14 01 17 0.73 0.15 0.42 0.14 02 17 0.70 0.12 0.45 0.13
Reading
03 17 0.71 0.19 0.37 0.17
8
Writing 01 11 0.51 0.14 0.48 0.10 00 46 0.36 0.18 0.42 0.13 01 8 0.31 0.17 0.41 0.11 02 8 0.29 0.22 0.44 0.12 03 8 0.26 0.14 0.43 0.13 04 8 0.34 0.20 0.40 0.21 05 8 0.30 0.15 0.52 0.12 06 8 0.27 0.16 0.39 0.16 07 8 0.32 0.17 0.41 0.13
Math
08 8 0.29 0.22 0.43 0.12 00 34 0.66 0.15 0.42 0.13 01 17 0.64 0.16 0.47 0.14
11
Reading 02 17 0.65 0.14 0.48 0.12

Appendix I Summary Stats of Diff/Discr. 2007-08 NECAP Technical Report 5
Table I-2. 2007-08 NECAP Item Difficulty and Discrimination Index Means and Standard Deviations by Grade, Subject, and Item Type.
Grade Subject Statistic1 All2 MC2 OR2 Diff 0.68 ( 0.15) 0.72 ( 0.14) 0.63 ( 0.16) Disc 0.45 ( 0.08) 0.43 ( 0.07) 0.47 ( 0.08) Math
N 145 89 56 Diff 0.7 ( 0.15) 0.72 ( 0.13) 0.58 ( 0.19) Disc 0.45 ( 0.1) 0.43 ( 0.1) 0.56 ( 0.05)
3
Reading N 85 70 15
Diff 0.65 ( 0.17) 0.68 ( 0.18) 0.59 ( 0.13) Disc 0.43 ( 0.1) 0.4 ( 0.09) 0.48 ( 0.09) Math
N 145 89 56 Diff 0.69 ( 0.14) 0.72 ( 0.12) 0.54 ( 0.15) Disc 0.43 ( 0.07) 0.42 ( 0.07) 0.49 ( 0.07)
4
Reading N 85 70 15
Diff 0.52 ( 0.18) 0.59 ( 0.16) 0.43 ( 0.16) Disc 0.43 ( 0.11) 0.38 ( 0.08) 0.49 ( 0.11) Math
N 147 86 61 Diff 0.65 ( 0.15) 0.7 ( 0.11) 0.42 ( 0.03) Disc 0.42 ( 0.12) 0.37 ( 0.08) 0.61 ( 0.04) Reading
N 85 70 15 Diff 0.73 ( 0.2) 0.76 ( 0.15) 0.68 ( 0.27) Disc 0.36 ( 0.14) 0.31 ( 0.07) 0.43 ( 0.18)
5
Writing N 17 10 7
Diff 0.5 ( 0.16) 0.54 ( 0.15) 0.44 ( 0.16) Disc 0.46 ( 0.11) 0.41 ( 0.09) 0.54 ( 0.1) Math
N 147 86 61 Diff 0.69 ( 0.16) 0.75 ( 0.11) 0.42 ( 0.05) Disc 0.43 ( 0.11) 0.39 ( 0.08) 0.6 ( 0.05)
6
Reading N 85 70 15
Diff 0.48 ( 0.17) 0.54 ( 0.17) 0.38 ( 0.13) Disc 0.42 ( 0.12) 0.36 ( 0.09) 0.51 ( 0.09) Math
N 147 86 61 Diff 0.69 ( 0.15) 0.74 ( 0.12) 0.49 ( 0.05) Disc 0.43 ( 0.12) 0.39 ( 0.08) 0.62 ( 0.03)
7
Reading N 85 70 15
1Diff = Difficulty (p-value); Disc = Discrimination (point-biserial correlation); N = number of items 2All = MC and OR; MC = multiple-choice; OR = open response

Appendix I Summary Stats of Diff/Discr. 2007-08 NECAP Technical Report 6
Table I-2. 2007-08 NECAP Item Difficulty and Discrimination Index Means and Standard Deviations by Grade, Subject, and Item Type.
Diff 0.47 ( 0.17) 0.53 ( 0.15) 0.4 ( 0.17) Disc 0.44 ( 0.12) 0.38 ( 0.09) 0.53 ( 0.1) Math
N 147 86 61 Diff 0.71 ( 0.14) 0.75 ( 0.12) 0.53 ( 0.03) Disc 0.44 ( 0.13) 0.39 ( 0.08) 0.67 ( 0.03) Reading
N 85 70 15 Diff 0.71 ( 0.19) 0.69 ( 0.17) 0.73 ( 0.24) Disc 0.37 ( 0.17) 0.28 ( 0.08) 0.5 ( 0.2)
8
Writing N 17 10 7
Diff 0.32 ( 0.17) 0.41 ( 0.13) 0.23 ( 0.16) Disc 0.42 ( 0.13) 0.34 ( 0.10) 0.51 ( 0.11) Math
N 110 56 54 Diff 0.65 ( 0.15) 0.7 ( 0.11) 0.43 ( 0.05) Disc 0.45 ( 0.13) 0.4 ( 0.09) 0.67 ( 0.02)
11
Reading N 68 56 12
1Diff = Difficulty (p-value); Disc = Discrimination (point-biserial correlation); N = number of items 2All = MC and OR; MC = multiple-choice; OR = open response

Appendix I Summary Stats of Diff/Discr. 2007-08 NECAP Technical Report 7
Table I-3: 2007-08 NECAP Frequencies, Relative Percentages, and Cumulative Percentages of Difficulty and Discrimination Indices by Grade, Subject, and Index Range.
Difficulty Discrimination Grade Subject Range N % Cum% N % Cum%
< -0.30 0 0.0 0.0 0 0.0 0.0 -0.30 - -0.21 0 0.0 0.0 0 0.0 0.0 -0.20 - -0.11 0 0.0 0.0 0 0.0 0.0 -0.10 - -0.01 0 0.0 0.0 0 0.0 0.0 0.00 - 0.09 0 0.0 0.0 0 0.0 0.0 0.10 - 0.19 0 0.0 0.0 0 0.0 0.0 0.20 - 0.29 10 1.6 1.6 24 3.8 3.8 0.30 - 0.39 3 0.5 2.0 182 28.4 32.2 0.40 - 0.49 91 14.2 16.3 294 45.9 78.1 0.50 - 0.59 110 17.2 33.4 129 20.2 98.3 0.60 - 0.69 30 4.7 38.1 11 1.7 100.0 0.70 - 0.79 203 31.7 69.8 0 0.0 100.0 0.80 - 0.89 182 28.4 98.3 0 0.0 100.0 0.90 - 0.99 11 1.7 100.0 0 0.0 100.0
3 Math
>= 1.00 0 0.0 100.0 0 0.0 100.0 < -0.30 0 0.0 0.0 0 0.0 0.0
-0.30 - -0.21 0 0.0 0.0 0 0.0 0.0 -0.20 - -0.11 0 0.0 0.0 0 0.0 0.0 -0.10 - -0.01 0 0.0 0.0 0 0.0 0.0 0.00 - 0.09 0 0.0 0.0 0 0.0 0.0 0.10 - 0.19 0 0.0 0.0 0 0.0 0.0 0.20 - 0.29 0 0.0 0.0 13 3.3 3.3 0.30 - 0.39 22 5.6 5.6 111 28.4 31.7 0.40 - 0.49 33 8.4 14.1 82 21.0 52.7 0.50 - 0.59 58 14.8 28.9 172 44.0 96.7 0.60 - 0.69 59 15.1 44.0 13 3.3 100.0 0.70 - 0.79 74 18.9 62.9 0 0.0 100.0 0.80 - 0.89 133 34.0 96.9 0 0.0 100.0 0.90 - 0.99 12 3.1 100.0 0 0.0 100.0
3 Reading
>= 1.00 0 0.0 100.0 0 0.0 100.0 cont’d

Appendix I Summary Stats of Diff/Discr. 2007-08 NECAP Technical Report 8
Table I-3: 2007-08 NECAP Frequencies, Relative Percentages, and Cumulative Percentages of Difficulty and Discrimination Indices by Grade, Subject, and Index Range.
Difficulty Discrimination Grade Subject Range N % Cum% N % Cum%
< -0.30 0 0.0 0.0 0 0.0 0.0 -0.30 - -0.21 0 0.0 0.0 0 0.0 0.0 -0.20 - -0.11 0 0.0 0.0 0 0.0 0.0 -0.10 - -0.01 0 0.0 0.0 0 0.0 0.0 0.00 - 0.09 0 0.0 0.0 1 0.2 0.2 0.10 - 0.19 2 0.3 0.3 1 0.2 0.3 0.20 - 0.29 3 0.5 0.8 49 7.7 8.0 0.30 - 0.39 46 7.2 8.0 151 23.6 31.6 0.40 - 0.49 55 8.6 16.6 293 45.8 77.3 0.50 - 0.59 169 26.4 43.0 140 21.9 99.2 0.60 - 0.69 107 16.7 59.7 5 0.8 100.0 0.70 - 0.79 161 25.2 84.8 0 0.0 100.0 0.80 - 0.89 95 14.8 99.7 0 0.0 100.0 0.90 - 0.99 2 0.3 100.0 0 0.0 100.0
4 Math
>= 1.00 0 0.0 100.0 0 0.0 100.0 < -0.30 0 0.0 0.0 0 0.0 0.0
-0.30 - -0.21 0 0.0 0.0 0 0.0 0.0 -0.20 - -0.11 0 0.0 0.0 0 0.0 0.0 -0.10 - -0.01 0 0.0 0.0 0 0.0 0.0 0.00 - 0.09 0 0.0 0.0 0 0.0 0.0 0.10 - 0.19 0 0.0 0.0 13 3.3 3.3 0.20 - 0.29 0 0.0 0.0 90 23.0 26.3 0.30 - 0.39 11 2.8 2.8 230 58.8 85.2 0.40 - 0.49 25 6.4 9.2 57 14.6 99.7 0.50 - 0.59 47 12.0 21.2 1 0.3 100.0 0.60 - 0.69 74 18.9 40.2 0 0.0 100.0 0.70 - 0.79 112 28.6 68.8 0 0.0 100.0 0.80 - 0.89 100 25.6 94.4 0 0.0 100.0 0.90 - 0.99 22 5.6 100.0 0 0.0 100.0
4 Reading
>= 1.00 0 0.0 100.0 0 0.0 0.0 cont’d

Appendix I Summary Stats of Diff/Discr. 2007-08 NECAP Technical Report 9
Table I-3: 2007-08 NECAP Frequencies, Relative Percentages, and Cumulative Percentages of Difficulty and Discrimination Indices by Grade, Subject, and Index Range.
Difficulty Discrimination Grade Subject Range N % Cum% N % Cum%
< -0.30 0 0.0 0.0 0 0.0 0.0 -0.30 - -0.21 0 0.0 0.0 0 0.0 0.0 -0.20 - -0.11 0 0.0 0.0 0 0.0 0.0 -0.10 - -0.01 0 0.0 0.0 0 0.0 0.0 0.00 - 0.09 0 0.0 0.0 0 0.0 0.0 0.10 - 0.19 2 0.3 0.3 2 0.3 0.3 0.20 - 0.29 73 12.6 13.0 83 14.3 14.7 0.30 - 0.39 61 10.5 23.5 185 32.0 46.6 0.40 - 0.49 112 19.3 42.8 171 29.5 76.2 0.50 - 0.59 128 22.1 64.9 81 14.0 90.2 0.60 - 0.69 57 9.8 74.8 57 9.8 100.0 0.70 - 0.79 110 19.0 93.8 0 0.0 100.0 0.80 - 0.89 36 6.2 100.0 0 0.0 100.0 0.90 - 0.99 0 0.0 100.0 0 0.0 100.0
5 Math
>= 1.00 0 0.0 100.0 0 0.0 100.0 < -0.30 0 0.0 0.0 0 0.0 0.0
-0.30 - -0.21 0 0.0 0.0 0 0.0 0.0 -0.20 - -0.11 0 0.0 0.0 0 0.0 0.0 -0.10 - -0.01 0 0.0 0.0 0 0.0 0.0 0.00 - 0.09 0 0.0 0.0 0 0.0 0.0 0.10 - 0.19 0 0.0 0.0 11 2.8 2.8 0.20 - 0.29 0 0.0 0.0 66 16.9 19.7 0.30 - 0.39 11 2.8 2.8 136 34.8 54.5 0.40 - 0.49 61 15.6 18.4 107 27.4 81.8 0.50 - 0.59 75 19.2 37.6 44 11.3 93.1 0.60 - 0.69 72 18.4 56.0 27 6.9 100.0 0.70 - 0.79 73 18.7 74.7 0 0.0 100.0 0.80 - 0.89 98 25.1 99.7 0 0.0 100.0 0.90 - 0.99 1 0.3 100.0 0 0.0 100.0
5 Reading
>= 1.00 0 0.0 100.0 0 0.0 100.0 < -0.30 0 0.0 0.0 0 0.0 0.0
-0.30 - -0.21 0 0.0 0.0 0 0.0 0.0 -0.20 - -0.11 0 0.0 0.0 0 0.0 0.0 -0.10 - -0.01 0 0.0 0.0 0 0.0 0.0 0.00 - 0.09 0 0.0 0.0 0 0.0 0.0 0.10 - 0.19 0 0.0 0.0 1 5.9 5.9 0.20 - 0.29 0 0.0 0.0 5 29.4 35.3 0.30 - 0.39 0 0.0 0.0 7 41.2 76.5 0.40 - 0.49 4 23.5 23.5 0 0.0 76.5 0.50 - 0.59 2 11.8 35.3 3 17.6 94.1 0.60 - 0.69 0 0.0 35.3 1 5.9 100.0 0.70 - 0.79 1 5.9 41.2 0 0.0 100.0 0.80 - 0.89 6 35.3 76.5 0 0.0 100.0 0.90 - 0.99 4 23.5 100.0 0 0.0 100.0
5 Writing
>= 1.00 0 0.0 100.0 0 0.0 100.0 cont’d

Appendix I Summary Stats of Diff/Discr. 2007-08 NECAP Technical Report 10
Table I-3: 2007-08 NECAP Frequencies, Relative Percentages, and Cumulative Percentages of Difficulty and Discrimination Indices by Grade, Subject, and Index Range.
Difficulty Discrimination Grade Subject Range N % Cum% N % Cum%
< -0.30 0 0.0 0.0 0 0.0 0.0 -0.30 - -0.21 0 0.0 0.0 0 0.0 0.0 -0.20 - -0.11 0 0.0 0.0 0 0.0 0.0 -0.10 - -0.01 0 0.0 0.0 0 0.0 0.0 0.00 - 0.09 0 0.0 0.0 0 0.0 0.0 0.10 - 0.19 14 2.4 2.4 0 0.0 0.0 0.20 - 0.29 58 10.0 12.4 58 10.0 10.0 0.30 - 0.39 65 11.2 23.7 154 26.6 36.6 0.40 - 0.49 105 18.1 41.8 173 29.9 66.5 0.50 - 0.59 151 26.1 67.9 122 21.1 87.6 0.60 - 0.69 77 13.3 81.2 61 10.5 98.1 0.70 - 0.79 99 17.1 98.3 11 1.9 100.0 0.80 - 0.89 10 1.7 100.0 0 0.0 100.0 0.90 - 0.99 0 0.0 100.0 0 0.0 100.0
6 Math
>= 1.00 0 0.0 100.0 0 0.0 100.0 < -0.30 0 0.0 0.0 0 0.0 0.0
-0.30 - -0.21 0 0.0 0.0 0 0.0 0.0 -0.20 - -0.11 0 0.0 0.0 0 0.0 0.0 -0.10 - -0.01 0 0.0 0.0 0 0.0 0.0 0.00 - 0.09 0 0.0 0.0 0 0.0 0.0 0.10 - 0.19 0 0.0 0.0 2 0.5 0.5 0.20 - 0.29 0 0.0 0.0 33 8.4 9.0 0.30 - 0.39 33 8.4 8.4 172 44.0 52.9 0.40 - 0.49 35 9.0 17.4 112 28.6 81.6 0.50 - 0.59 25 6.4 23.8 54 13.8 95.4 0.60 - 0.69 72 18.4 42.2 18 4.6 100.0 0.70 - 0.79 82 21.0 63.2 0 0.0 100.0 0.80 - 0.89 120 30.7 93.9 0 0.0 100.0 0.90 - 0.99 24 6.1 100.0 0 0.0 100.0
6 Reading
>= 1.00 0 0.0 100.0 0 0.0 100.0 cont’d

Appendix I Summary Stats of Diff/Discr. 2007-08 NECAP Technical Report 11
Table I-3: 2007-08 NECAP Frequencies, Relative Percentages, and Cumulative Percentages of Difficulty and Discrimination Indices by Grade, Subject, and Index Range.
Difficulty Discrimination Grade Subject Range N % Cum% N % Cum%
< -0.30 0 0.0 0.0 0 0.0 0.0 -0.30 - -0.21 0 0.0 0.0 0 0.0 0.0 -0.20 - -0.11 0 0.0 0.0 0 0.0 0.0 -0.10 - -0.01 0 0.0 0.0 0 0.0 0.0 0.00 - 0.09 0 0.0 0.0 0 0.0 0.0 0.10 - 0.19 0 0.0 0.0 10 1.7 1.7 0.20 - 0.29 102 17.6 17.6 86 14.9 16.6 0.30 - 0.39 86 14.9 32.5 92 15.9 32.5 0.40 - 0.49 109 18.8 51.3 258 44.6 77.0 0.50 - 0.59 113 19.5 70.8 95 16.4 93.4 0.60 - 0.69 77 13.3 84.1 37 6.4 99.8 0.70 - 0.79 66 11.4 95.5 1 0.2 100.0 0.80 - 0.89 26 4.5 100.0 0 0.0 100.0 0.90 - 0.99 0 0.0 100.0 0 0.0 100.0
7 Math
>= 1.00 0 0.0 100.0 0 0.0 100.0 < -0.30 0 0.0 0.0 0 0.0 0.0
-0.30 - -0.21 0 0.0 0.0 0 0.0 0.0 -0.20 - -0.11 0 0.0 0.0 0 0.0 0.0 -0.10 - -0.01 0 0.0 0.0 0 0.0 0.0 0.00 - 0.09 0 0.0 0.0 0 0.0 0.0 0.10 - 0.19 0 0.0 0.0 1 0.3 0.3 0.20 - 0.29 0 0.0 0.0 55 14.1 14.3 0.30 - 0.39 0 0.0 0.0 102 26.1 40.4 0.40 - 0.49 58 14.8 14.8 160 40.9 81.3 0.50 - 0.59 37 9.5 24.3 15 3.8 85.2 0.60 - 0.69 76 19.4 43.7 58 14.8 100.0 0.70 - 0.79 103 26.3 70.1 0 0.0 100.0 0.80 - 0.89 114 29.2 99.2 0 0.0 100.0 0.90 - 0.99 3 0.8 100.0 0 0.0 100.0
7 Reading
>= 1.00 0 0.0 100.0 0 0.0 100.0 cont’d

Appendix I Summary Stats of Diff/Discr. 2007-08 NECAP Technical Report 12
Table I-3: 2007-08 NECAP Frequencies, Relative Percentages, and Cumulative Percentages of Difficulty and Discrimination Indices by Grade, Subject, and Index Range.
Difficulty Discrimination Grade Subject Range N % Cum% N % Cum%
< -0.30 0 0.0 0.0 0 0.0 0.0 -0.30 - -0.21 0 0.0 0.0 0 0.0 0.0 -0.20 - -0.11 0 0.0 0.0 0 0.0 0.0 -0.10 - -0.01 0 0.0 0.0 0 0.0 0.0 0.00 - 0.09 0 0.0 0.0 0 0.0 0.0 0.10 - 0.19 23 4.0 4.0 10 1.7 1.7 0.20 - 0.29 74 12.8 16.8 73 12.6 14.3 0.30 - 0.39 109 18.8 35.6 158 27.3 41.6 0.40 - 0.49 118 20.4 56.0 139 24.0 65.6 0.50 - 0.59 91 15.7 71.7 109 18.8 84.5 0.60 - 0.69 121 20.9 92.6 90 15.5 100.0 0.70 - 0.79 28 4.8 97.4 0 0.0 100.0 0.80 - 0.89 15 2.6 100.0 0 0.0 100.0 0.90 - 0.99 0 0.0 100.0 0 0.0 100.0
8 Math
>= 1.00 0 0.0 100.0 0 0.0 100.0 < -0.30 0 0.0 0.0 0 0.0 0.0
-0.30 - -0.21 0 0.0 0.0 0 0.0 0.0 -0.20 - -0.11 0 0.0 0.0 0 0.0 0.0 -0.10 - -0.01 0 0.0 0.0 0 0.0 0.0 0.00 - 0.09 0 0.0 0.0 0 0.0 0.0 0.10 - 0.19 0 0.0 0.0 1 0.3 0.3 0.20 - 0.29 0 0.0 0.0 12 3.1 3.3 0.30 - 0.39 1 0.3 0.3 159 40.7 44.0 0.40 - 0.49 15 3.8 4.1 116 29.7 73.7 0.50 - 0.59 67 17.1 21.2 34 8.7 82.4 0.60 - 0.69 69 17.6 38.9 56 14.3 96.7 0.70 - 0.79 82 21.0 59.8 13 3.3 100.0 0.80 - 0.89 126 32.2 92.1 0 0.0 100.0 0.90 - 0.99 31 7.9 100.0 0 0.0 100.0
8 Reading
>= 1.00 0 0.0 100.0 0 0.0 100.0 < -0.30 0 0.0 0.0 0 0.0 0.0
-0.30 - -0.21 0 0.0 0.0 0 0.0 0.0 -0.20 - -0.11 0 0.0 0.0 0 0.0 0.0 -0.10 - -0.01 0 0.0 0.0 0 0.0 0.0 0.00 - 0.09 0 0.0 0.0 0 0.0 0.0 0.10 - 0.19 0 0.0 0.0 1 5.9 5.9 0.20 - 0.29 0 0.0 0.0 5 29.4 35.3 0.30 - 0.39 0 0.0 0.0 7 41.2 76.5 0.40 - 0.49 3 17.6 17.6 0 0.0 76.5 0.50 - 0.59 4 23.5 41.2 0 0.0 76.5 0.60 - 0.69 1 5.9 47.1 4 23.5 100.0 0.70 - 0.79 2 11.8 58.8 0 0.0 100.0 0.80 - 0.89 4 23.5 82.4 0 0.0 100.0 0.90 - 0.99 3 17.6 100.0 0 0.0 100.0
8 Writing
>= 1.00 0 0.0 100.0 0 0.0 100.0 Difficulty = p-value; Discrimination = point-biserial correlation
cont’d

Appendix I Summary Stats of Diff/Discr. 2007-08 NECAP Technical Report 13
Table I-3. 2007-08 NECAP Frequencies, Relative Percentages, and Cumulative Percentages of Difficulty and Discrimination Indices by Grade, Subject, and Index Range.
Difficulty Discrimination Grade Subject Range N % Cum% N % Cum%
< -0.30 0 0.0 0.0 0 0.0 0.0 -0.30 - -0.21 0 0.0 0.0 0 0.0 0.0 -0.20 - -0.11 0 0.0 0.0 0 0.0 0.0 -0.10 - -0.01 0 0.0 0.0 0 0.0 0.0 0.00 - 0.09 34 7.1 7.1 9 1.9 1.9 0.10 - 0.19 68 14.2 21.3 22 4.6 6.5 0.20 - 0.29 93 19.5 40.8 31 6.5 13.0 0.30 - 0.39 90 18.8 59.6 138 28.9 41.8 0.40 - 0.49 105 22.0 81.6 169 35.4 77.2 0.50 - 0.59 40 8.4 90.0 66 13.8 91.0 0.60 - 0.69 36 7.5 97.5 32 6.7 97.7 0.70 - 0.79 12 2.5 100.0 11 2.3 100.0 0.80 - 0.89 0 0.0 100.0 0 0.0 100.0 0.90 - 0.99 0 0.0 100.0 0 0.0 100.0
11 Math
>= 1.00 0 0.0 100.0 0 0.0 100.0 < -0.30 0 0.0 0.0 0 0.0 0.0
-0.30 - -0.21 0 0.0 0.0 0 0.0 0.0 -0.20 - -0.11 0 0.0 0.0 0 0.0 0.0 -0.10 - -0.01 0 0.0 0.0 0 0.0 0.0 0.00 - 0.09 0 0.0 0.0 0 0.0 0.0 0.10 - 0.19 0 0.0 0.0 9 2.6 2.6 0.20 - 0.29 0 0.0 0.0 28 8.2 10.9 0.30 - 0.39 29 8.5 8.5 114 33.5 44.4 0.40 - 0.49 31 9.1 17.6 113 33.2 77.6 0.50 - 0.59 21 6.2 23.8 16 4.7 82.4 0.60 - 0.69 101 29.7 53.5 58 17.1 99.4 0.70 - 0.79 71 20.9 74.4 2 0.6 100.0 0.80 - 0.89 87 25.6 100.0 0 0.0 100.0 0.90 - 0.99 0 0.0 100.0 0 0.0 100.0
11 Reading
>= 1.00 0 0.0 100.0 0 0.0 100.0 Difficulty = p-value; Discrimination = point-biserial correlation


Appendix J Subgroup Reliabilities 2007-08 NECAP Technical Report 1
APPENDIX J—SUBGROUP RELIABILITY

Appendix J Subgroup Reliabilities 2007-08 NECAP Technical Report 2
Table J-1. Reliabilities of Subgroups by Grade and Subject. Grade Subject Subgroup N (α)
White 25823 0.92 Native Hawaiian or Pacific Islander 11 0.75 Hispanic or Latino 2339 0.93 Black or African American 1239 0.93 Asian 776 0.93 American Indian or Alaskan Native 123 0.94 LEP 1408 0.94 IEP 4171 0.94
Math
Low SES 9163 0.93 White 25820 0.89 Native Hawaiian or Pacific Islander 11 0.64 Hispanic or Latino 2271 0.89 Black or African American 1221 0.89 Asian 766 0.88 American Indian or Alaskan Native 122 0.89 LEP 1301 0.90 IEP 4170 0.90
3
Reading
Low SES 9113 0.90 White 26940 0.92 Native Hawaiian or Pacific Islander 10 0.95 Hispanic or Latino 2787 0.92 Black or African American 1401 0.93 Asian 782 0.94 American Indian or Alaskan Native 230 0.93 LEP 1524 0.93 IEP 4724 0.93
Math
Low SES 10004 0.93 White 26935 0.86 Native Hawaiian or Pacific Islander 10 0.83 Hispanic or Latino 2717 0.88 Black or African American 1389 0.88 Asian 762 0.85 American Indian or Alaskan Native 231 0.88 LEP 1408 0.88 IEP 4724 0.88
4
Reading
Low SES 9941 0.88 (cont�d)

Appendix J Subgroup Reliabilities 2007-08 NECAP Technical Report 3
Table J-1. Reliabilities of Subgroups by Grade and Subject Grade Subject Subgroup N (α)
White 27352 0.91 Native Hawaiian or Pacific Islander 11 0.86 Hispanic or Latino 2518 0.89 Black or African American 1370 0.90 Asian 836 0.92 American Indian or Alaskan Native 214 0.91 LEP 1356 0.91 IEP 5289 0.90
Math
Low SES 9638 0.90 White 27353 0.88 Native Hawaiian or Pacific Islander 11 0.65 Hispanic or Latino 2467 0.87 Black or African American 1354 0.88 Asian 818 0.87 American Indian or Alaskan Native 213 0.88 LEP 1265 0.88 IEP 5288 0.88
Reading
Low SES 9596 0.88 White 27290 0.74 Native Hawaiian or Pacific Islander 11 0.53 Hispanic or Latino 2465 0.76 Black or African American 1347 0.76 Asian 819 0.73 American Indian or Alaskan Native 213 0.76 LEP 1263 0.78 IEP 5253 0.77
5
Writing
Low SES 9553 0.76 White 27921 0.92 Native Hawaiian or Pacific Islander 9 0.95 Hispanic or Latino 2476 0.91 Black or African American 1374 0.91 Asian 794 0.93 American Indian or Alaskan Native 222 0.93 LEP 1196 0.91 IEP 5377 0.89
Math
Low SES 9596 0.91 White 27921 0.87 Native Hawaiian or Pacific Islander 9 0.92 Hispanic or Latino 2421 0.87 Black or African American 1358 0.88 Asian 786 0.87 American Indian or Alaskan Native 223 0.91 LEP 1100 0.87 IEP 5388 0.87
6
Reading
Low SES 9550 0.88 (cont�d)
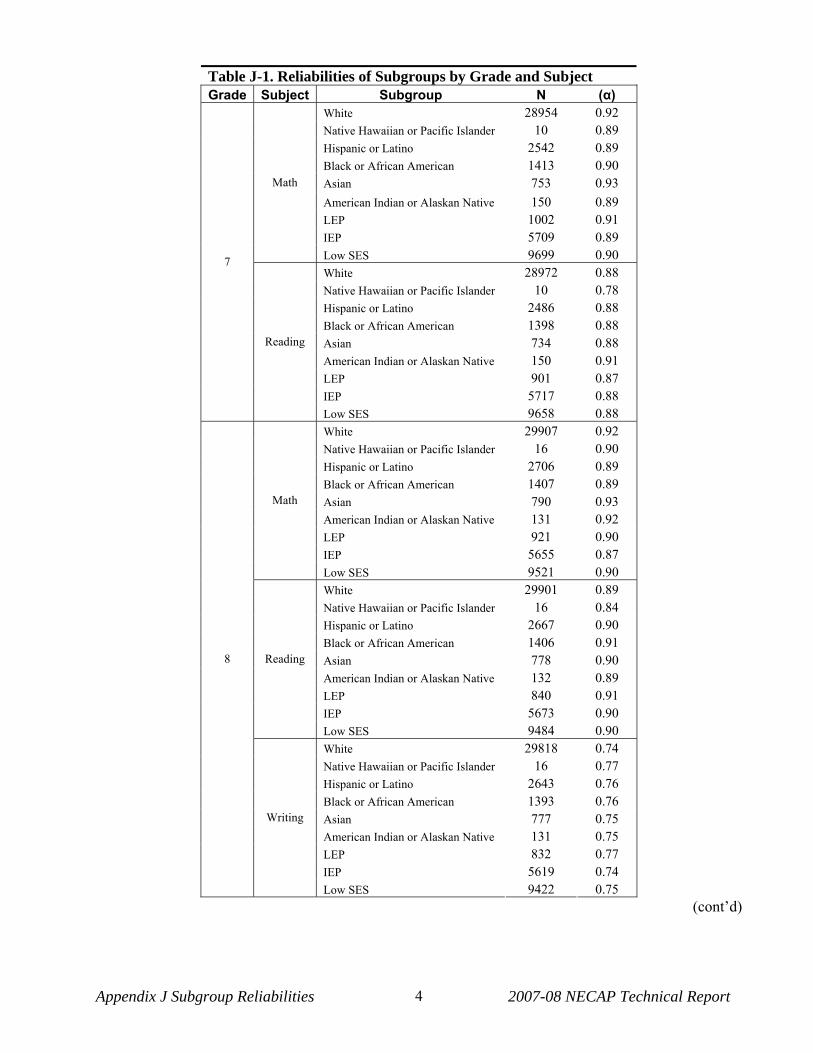
Appendix J Subgroup Reliabilities 2007-08 NECAP Technical Report 4
Table J-1. Reliabilities of Subgroups by Grade and Subject Grade Subject Subgroup N (α)
White 28954 0.92 Native Hawaiian or Pacific Islander 10 0.89 Hispanic or Latino 2542 0.89 Black or African American 1413 0.90 Asian 753 0.93 American Indian or Alaskan Native 150 0.89 LEP 1002 0.91 IEP 5709 0.89
Math
Low SES 9699 0.90 White 28972 0.88 Native Hawaiian or Pacific Islander 10 0.78 Hispanic or Latino 2486 0.88 Black or African American 1398 0.88 Asian 734 0.88 American Indian or Alaskan Native 150 0.91 LEP 901 0.87 IEP 5717 0.88
7
Reading
Low SES 9658 0.88 White 29907 0.92 Native Hawaiian or Pacific Islander 16 0.90 Hispanic or Latino 2706 0.89 Black or African American 1407 0.89 Asian 790 0.93 American Indian or Alaskan Native 131 0.92 LEP 921 0.90 IEP 5655 0.87
Math
Low SES 9521 0.90 White 29901 0.89 Native Hawaiian or Pacific Islander 16 0.84 Hispanic or Latino 2667 0.90 Black or African American 1406 0.91 Asian 778 0.90 American Indian or Alaskan Native 132 0.89 LEP 840 0.91 IEP 5673 0.90
Reading
Low SES 9484 0.90 White 29818 0.74 Native Hawaiian or Pacific Islander 16 0.77 Hispanic or Latino 2643 0.76 Black or African American 1393 0.76 Asian 777 0.75 American Indian or Alaskan Native 131 0.75 LEP 832 0.77 IEP 5619 0.74
8
Writing
Low SES 9422 0.75 (cont�d)

Appendix J Subgroup Reliabilities 2007-08 NECAP Technical Report 5
Table J-1. Reliabilities of Subgroups by Grade and Subject Grade Subject Subgroup N (α)
White 29562 0.91 Native Hawaiian or Pacific Islander 15 0.90 Hispanic or Latino 2207 0.86 Black or African American 1231 0.87 Asian 669 0.93 American Indian or Alaskan Native 148 0.88 LEP 692 0.88 IEP 4926 0.83
Math
Low SES 6762 0.88 White 29691 0.89 Native Hawaiian or Pacific Islander 15 0.63 Hispanic or Latino 2171 0.87 Black or African American 1231 0.89 Asian 661 0.90 American Indian or Alaskan Native 150 0.90 LEP 639 0.85 IEP 4970 0.88
11
Reading
Low SES 6771 0.89 1Only subgroups with sample size ≥10 reported


Appendix K Decision Accuracy & Consist. 2007-08 NECAP Technical Report 1
APPENDIX K—DECISION ACCURACY AND
CONSISTENCY RESULTS

Appendix K Decision Accuracy & Consist. 2007-08 NECAP Technical Report 2
Table K-1a. 2007-08 NECAP Decision Accuracy -- Cross-Tabulation of True and Observed
Achievement Level Proportions: Math, Grade 3 True Achievement Level Observed
Achievement Level SBP PP P PWD Total
SBP 0.105 0.020 0.000 0.000 0.126 PP 0.022 0.152 0.041 0.000 0.215 P 0.000 0.033 0.390 0.047 0.470
PWD 0.000 0.000 0.021 0.169 0.190 Total 0.127 0.206 0.451 0.216 1.000
Overall Accuracy (sum of diagonal) = 0.816 SBP = Substantially Below Proficient; PP = Partially Proficient; P = Proficient; PWD = Proficient with Distinction
Table K-1b. 2007-08 NECAP Decision Consistency -- Cross-Tabulation of Observed Achievement Level Proportions for Two Parallel Forms: Math, Grade 3
Form 1 Achievement Level Form 2 Achievement
Level SBP PP P PWD Total
SBP 0.097 0.029 0.001 0.000 0.127 PP 0.029 0.127 0.051 0.000 0.206 P 0.001 0.051 0.353 0.047 0.451
PWD 0.000 0.000 0.047 0.169 0.216 Total 0.127 0.206 0.451 0.216 1.000
Overall Consistency (sum of diagonal) = 0.746 SBP = Substantially Below Proficient; PP = Partially Proficient; P = Proficient; PWD = Proficient with Distinction
Table K-1c. 2007-08 NECAP Summary of Overall Accuracy and Consistency Indices: Math, Grade 3
Accuracy 0.816 Consistency 0.746 Kappa (k) 0.633
Table K-1d. 2007-08 NECAP Indices Conditional On Achievement Level: Math, Grade 3
Achievement Level Accuracy Consistency SBP 0.838 0.766 PP 0.709 0.614 P 0.830 0.783
PWD 0.889 0.784
SBP = Substantially Below Proficient; PP = Partially Proficient; P = Proficient; PWD = Proficient with Distinction
Table K-1e. 2007-08 NECAP Accuracy and Consistency Indices at Cutpoints: Math, Grade 3 Cutpoint Accuracy False
Positive False
Negative Consistency
SBP:PP 0.958 0.020 0.022 0.941 PP:P 0.926 0.041 0.033 0.897
P:PWD 0.932 0.047 0.021 0.907
SBP = Substantially Below Proficient; PP = Partially Proficient; P = Proficient; PWD = Proficient with Distinction False Positive = proportion of students with observed score above cutpoint and true score below cutpoint False Negative = proportion of students with observed score below cutpoint and true score above cutpoint

Appendix K Decision Accuracy & Consist. 2007-08 NECAP Technical Report 3
Table K-2a. 2007-08 NECAP Decision Accuracy -- Cross-Tabulation of True and Observed
Achievement Level Proportions: Math, Grade 4 True Achievement Level Observed
Achievement Level SBP PP P PWD Total
SBP 0.121 0.023 0.000 0.000 0.144 PP 0.024 0.181 0.044 0.000 0.249 P 0.000 0.034 0.381 0.041 0.457
PWD 0.000 0.000 0.018 0.133 0.151 Total 0.145 0.238 0.442 0.174 1.000
Overall Accuracy (sum of diagonal) = 0.816 SBP = Substantially Below Proficient; PP = Partially Proficient; P = Proficient; PWD = Proficient with Distinction
Table K-2b. 2007-08 NECAP Decision Consistency -- Cross-Tabulation of Observed Achievement Level Proportions for Two Parallel Forms: Math, Grade 4
Form 1 Achievement Level Form 2 Achievement
Level SBP PP P PWD Total
SBP 0.112 0.032 0.001 0.000 0.145 PP 0.032 0.153 0.054 0.000 0.238 P 0.001 0.054 0.348 0.041 0.442
PWD 0.000 0.000 0.041 0.134 0.174 Total 0.145 0.238 0.442 0.174 1.000
Overall Consistency (sum of diagonal) = 0.746 SBP = Substantially Below Proficient; PP = Partially Proficient; P = Proficient; PWD = Proficient with Distinction
Table K-2c. 2007-08 NECAP Summary of Overall Accuracy and Consistency Indices: Math, Grade 4
Accuracy 0.816 Consistency 0.746 Kappa (k) 0.635
Table K-2d. 2007-08 NECAP Indices Conditional On Achievement Level: Math, Grade 4
Achievement Level Accuracy Consistency SBP 0.841 0.773 PP 0.729 0.640 P 0.835 0.785
PWD 0.883 0.767
SBP = Substantially Below Proficient; PP = Partially Proficient; P = Proficient; PWD = Proficient with Distinction
Table K-2e. 2007-08 NECAP Accuracy and Consistency Indices at Cutpoints: Math, Grade 4 Cutpoint Accuracy False
Positive False
Negative Consistency
SBP:PP 0.953 0.023 0.024 0.934 PP:P 0.922 0.044 0.034 0.892
P:PWD 0.941 0.041 0.018 0.919
SBP = Substantially Below Proficient; PP = Partially Proficient; P = Proficient; PWD = Proficient with Distinction False Positive = proportion of students with observed score above cutpoint and true score below cutpoint False Negative = proportion of students with observed score below cutpoint and true score above cutpoint

Appendix K Decision Accuracy & Consist. 2007-08 NECAP Technical Report 4
Table K-3a. 2007-08 NECAP Decision Accuracy -- Cross-Tabulation of True and Observed
Achievement Level Proportions: Math, Grade 5 True Achievement Level Observed
Achievement Level SBP PP P PWD Total
SBP 0.151 0.031 0.002 0.000 0.184 PP 0.031 0.095 0.045 0.000 0.171 P 0.002 0.037 0.404 0.043 0.485
PWD 0.000 0.000 0.022 0.139 0.160 Total 0.183 0.163 0.472 0.182 1.000
Overall Accuracy (sum of diagonal) = 0.789 SBP = Substantially Below Proficient; PP = Partially Proficient; P = Proficient; PWD = Proficient with Distinction
Table K-3b. 2007-08 NECAP Decision Consistency -- Cross-Tabulation of Observed Achievement Level Proportions for Two Parallel Forms: Math, Grade 5
Form 1 Achievement Level Form 2 Achievement
Level SBP PP P PWD Total
SBP 0.138 0.039 0.007 0.000 0.183 PP 0.039 0.073 0.052 0.000 0.163 P 0.007 0.052 0.368 0.045 0.472
PWD 0.000 0.000 0.045 0.137 0.182 Total 0.183 0.163 0.472 0.182 1.000
Overall Consistency (sum of diagonal) = 0.715 SBP = Substantially Below Proficient; PP = Partially Proficient; P = Proficient; PWD = Proficient with Distinction
Table K-3c. 2007-08 NECAP Summary of Overall Accuracy and Consistency Indices: Math, Grade 5
Accuracy 0.789 Consistency 0.715 Kappa (k) 0.583
Table K-3d. 2007-08 NECAP Indices Conditional On Achievement Level: Math, Grade 5
Achievement Level Accuracy Consistency SBP 0.821 0.750 PP 0.557 0.446 P 0.832 0.780
PWD 0.866 0.753
SBP = Substantially Below Proficient; PP = Partially Proficient; P = Proficient; PWD = Proficient with Distinction
Table K-3e. 2007-08 NECAP Accuracy and Consistency Indices at Cutpoints: Math, Grade 5 Cutpoint Accuracy False
Positive False
Negative Consistency
SBP:PP 0.9346 0.0329 0.0325 0.9084
PP:P 0.9155 0.0462 0.0382 0.8823
P:PWD 0.9353 0.0432 0.0215 0.9101
SBP = Substantially Below Proficient; PP = Partially Proficient; P = Proficient; PWD = Proficient with Distinction False Positive = proportion of students with observed score above cutpoint and true score below cutpoint False Negative = proportion of students with observed score below cutpoint and true score above cutpoint

Appendix K Decision Accuracy & Consist. 2007-08 NECAP Technical Report 5
Table K-4a. 2007-08 NECAP Decision Accuracy -- Cross-Tabulation of True and Observed
Achievement Level Proportions: Math, Grade 6 True Achievement Level Observed
Achievement Level SBP PP P PWD Total
SBP 0.154 0.028 0.001 0.000 0.182 PP 0.028 0.112 0.041 0.000 0.181 P 0.001 0.035 0.386 0.039 0.460
PWD 0.000 0.000 0.020 0.157 0.177 Total 0.182 0.174 0.448 0.196 1.000
Overall Accuracy (sum of diagonal) = 0.809
SBP = Substantially Below Proficient; PP = Partially Proficient; P = Proficient; PWD = Proficient with Distinction
Table K-4b. 2007-08 NECAP Decision Consistency -- Cross-Tabulation of Observed Achievement Level Proportions for Two Parallel Forms: Math, Grade 6
Form 1 Achievement Level Form 2 Achievement
Level SBP PP P PWD Total
SBP 0.142 0.036 0.004 0.000 0.182 PP 0.036 0.089 0.050 0.000 0.174 P 0.004 0.050 0.354 0.041 0.448
PWD 0.000 0.000 0.041 0.155 0.196 Total 0.182 0.174 0.448 0.196 1.000
Overall Consistency (sum of diagonal) = 0.740
SBP = Substantially Below Proficient; PP = Partially Proficient; P = Proficient; PWD = Proficient with Distinction
Table K-4c. 2007-08 NECAP Summary of Overall Accuracy and Consistency Indices: Math, Grade 6
Accuracy 0.809 Consistency 0.740 Kappa (k) 0.627
Table K-4d. 2007-08 NECAP Indices Conditional On Achievement Level: Math, Grade 6
Achievement Level Accuracy Consistency SBP 0.846 0.784
PP 0.619 0.509
P 0.840 0.789
PWD 0.887 0.791
SBP = Substantially Below Proficient; PP = Partially Proficient; P = Proficient; PWD = Proficient with Distinction
Table K-4e. 2007-08 NECAP Accuracy and Consistency Indices at Cutpoints: Math, Grade 6
Cutpoint Accuracy False Positive
False Negative Consistency
SBP:PP 0.944 0.028 0.028 0.922 PP:P 0.923 0.042 0.035 0.893
P:PWD 0.941 0.039 0.020 0.918
SBP = Substantially Below Proficient; PP = Partially Proficient; P = Proficient; PWD = Proficient with Distinction False Positive = proportion of students with observed score above cutpoint and true score below cutpoint False Negative = proportion of students with observed score below cutpoint and true score above cutpoint

Appendix K Decision Accuracy & Consist. 2007-08 NECAP Technical Report 6
Table K-5a. 2007-08 NECAP Decision Accuracy -- Cross-Tabulation of True and Observed
Achievement Level Proportions: Math, Grade 7 True Achievement Level Observed
Achievement Level SBP PP P PWD Total
SBP 0.162 0.034 0.000 0.000 0.197 PP 0.032 0.147 0.047 0.000 0.226 P 0.000 0.036 0.342 0.039 0.416
PWD 0.000 0.000 0.020 0.141 0.161 Total 0.195 0.218 0.409 0.179 1.000
Overall Accuracy (sum of diagonal) = 0.792 SBP = Substantially Below Proficient; PP = Partially Proficient; P = Proficient; PWD = Proficient with Distinction
Table K-5b. 2007-08 NECAP Decision Consistency -- Cross-Tabulation of Observed Achievement Level Proportions for Two Parallel Forms: Math, Grade 7
Form 1 Achievement Level Form 2 Achievement
Level SBP PP P PWD Total
SBP 0.148 0.044 0.003 0.000 0.195 PP 0.044 0.119 0.055 0.000 0.218 P 0.003 0.055 0.310 0.041 0.409
PWD 0.000 0.000 0.041 0.139 0.179 Total 0.195 0.218 0.409 0.179 1.000
Overall Consistency (sum of diagonal) = 0.715
SBP = Substantially Below Proficient; PP = Partially Proficient; P = Proficient; PWD = Proficient with Distinction
Table K-5c. 2007-08 NECAP Summary of Overall Accuracy and Consistency Indices: Math, Grade 7
Accuracy 0.792 Consistency 0.715 Kappa (k) 0.602
Table K-5d. 2007-08 NECAP Indices Conditional On Achievement Level: Math, Grade 7
Achievement Level Accuracy Consistency SBP 0.824 0.759 PP 0.652 0.546 P 0.820 0.758
PWD 0.876 0.773
SBP = Substantially Below Proficient; PP = Partially Proficient; P = Proficient; PWD = Proficient with Distinction
Table K-5e. 2007-08 NECAP Accuracy and Consistency Indices at Cutpoints: Math, Grade 7 Cutpoint Accuracy False
Positive False
Negative Consistency
SBP:PP 0.933 0.035 0.032 0.906 PP:P 0.917 0.047 0.036 0.884
P:PWD 0.942 0.039 0.020 0.919
SBP = Substantially Below Proficient; PP = Partially Proficient; P = Proficient; PWD = Proficient with Distinction False Positive = proportion of students with observed score above cutpoint and true score below cutpoint False Negative = proportion of students with observed score below cutpoint and true score above cutpoint

Appendix K Decision Accuracy & Consist. 2007-08 NECAP Technical Report 7
Table K-6a. 2007-08 NECAP Decision Accuracy -- Cross-Tabulation of True and Observed
Achievement Level Proportions: Math, Grade 8 True Achievement Level Observed
Achievement Level SBP PP P PWD Total
SBP 0.173 0.039 0.000 0.000 0.212 PP 0.033 0.157 0.048 0.000 0.238 P 0.000 0.034 0.345 0.035 0.415
PWD 0.000 0.000 0.017 0.119 0.135 Total 0.206 0.231 0.409 0.154 1.000
Overall Accuracy (sum of diagonal) = 0.794 SBP = Substantially Below Proficient; PP = Partially Proficient; P = Proficient; PWD = Proficient with Distinction
Table K-6b. 2007-08 NECAP Decision Consistency -- Cross-Tabulation of Observed Achievement Level Proportions for Two Parallel Forms: Math, Grade 8
Form 1 Achievement Level Form 2 Achievement
Level SBP PP P PWD Total
SBP 0.155 0.048 0.003 0.000 0.206 PP 0.048 0.128 0.055 0.000 0.231 P 0.003 0.055 0.316 0.036 0.409
PWD 0.000 0.000 0.036 0.118 0.154 Total 0.206 0.231 0.409 0.154 1.000
Overall Consistency (sum of diagonal) = 0.717 SBP = Substantially Below Proficient; PP = Partially Proficient; P = Proficient; PWD = Proficient with Distinction
Table K-6c. 2007-08 NECAP Summary of Overall Accuracy and Consistency Indices: Math, Grade 8
Accuracy 0.794 Consistency 0.717 Kappa (k) 0.603
Table K-6d. 2007-08 NECAP Indices Conditional On Achievement Level: Math, Grade 8
Achievement Level Accuracy Consistency SBP 0.814 0.753 PP 0.660 0.554 P 0.832 0.772
PWD 0.878 0.767
SBP = Substantially Below Proficient; PP = Partially Proficient; P = Proficient; PWD = Proficient with Distinction
Table K-6e. 2007-08 NECAP Accuracy and Consistency Indices at Cutpoints: Math, Grade 8 Cutpoint Accuracy False
Positive False
Negative Consistency
SBP:PP 0.927 0.040 0.034 0.898 PP:P 0.917 0.048 0.035 0.885
P:PWD 0.949 0.035 0.017 0.928 SBP = Substantially Below Proficient; PP = Partially Proficient; P = Proficient; PWD = Proficient with Distinction False Positive = proportion of students with observed score above cutpoint and true score below cutpoint False Negative = proportion of students with observed score below cutpoint and true score above cutpoint

Appendix K Decision Accuracy & Consist. 2007-08 NECAP Technical Report 8
Table K-7a. 2007-08 NECAP Decision Accuracy -- Cross-Tabulation of True and Observed
Achievement Level Proportions: Math, Grade 11 True Achievement Level Observed
Achievement Level SBP PP P PWD Total
SBP 0.372 0.050 0.000 0.000 0.422 PP 0.040 0.224 0.047 0.000 0.310 P 0.000 0.028 0.229 0.005 0.262
PWD 0.000 0.000 0.001 0.005 0.006 Total 0.412 0.302 0.276 0.009 1.000
Overall Accuracy (sum of diagonal) = 0.794 SBP = Substantially Below Proficient; PP = Partially Proficient; P = Proficient; PWD = Proficient with Distinction
Table K-7b. 2007-08 NECAP Decision Consistency -- Cross-Tabulation of Observed Achievement Level Proportions for Two Parallel Forms: Math, Grade 11
Form 1 Achievement Level Form 2 Achievement
Level SBP PP P PWD Total
SBP 0.350 0.061 0.001 0.000 0.412 PP 0.061 0.190 0.051 0.000 0.302 P 0.001 0.051 0.220 0.004 0.276
PWD 0.000 0.000 0.004 0.005 0.009 Total 0.412 0.302 0.276 0.009 1.000
Overall Consistency (sum of diagonal) = 0.717 SBP = Substantially Below Proficient; PP = Partially Proficient; P = Proficient; PWD = Proficient with Distinction
Table K-7c. 2007-08 NECAP Summary of Overall Accuracy and Consistency Indices: Math, Grade 11
Accuracy 0.830 Consistency 0.765 Kappa (k) 0.645
Table K-7d. 2007-08 NECAP Indices Conditional On Achievement Level: Math, Grade 11
Achievement Level Accuracy Consistency SBP 0.882 0.849 PP 0.722 0.629 P 0.874 0.796
PWD 0.807 0.539 SBP = Substantially Below Proficient; PP = Partially Proficient; P = Proficient; PWD = Proficient with Distinction
Table K-7e. 2007-08 NECAP Accuracy and Consistency Indices at Cutpoints: Math, Grade 11 Cutpoint Accuracy False
Positive False
Negative Consistency
SBP:PP 0.910 0.050 0.040 0.875 PP:P 0.925 0.047 0.028 0.896
P:PWD 0.994 0.005 0.001 0.991 SBP = Substantially Below Proficient; PP = Partially Proficient; P = Proficient; PWD = Proficient with Distinction False Positive = proportion of students with observed score above cutpoint and true score below cutpoint False Negative = proportion of students with observed score below cutpoint and true score above cutpoint

Appendix K Decision Accuracy & Consist. 2007-08 NECAP Technical Report 9
Table K-8a. 2007-08 NECAP Decision Accuracy -- Cross-Tabulation of True and Observed
Achievement Level Proportions: Reading, Grade 3 True Achievement Level Observed
Achievement Level SBP PP P PWD Total
SBP 0.071 0.018 0.000 0.000 0.090 PP 0.023 0.158 0.047 0.000 0.228 P 0.000 0.040 0.427 0.054 0.521
PWD 0.000 0.000 0.021 0.140 0.161 Total 0.094 0.217 0.496 0.193 1.000
Overall Accuracy (sum of diagonal) = 0.796 SBP = Substantially Below Proficient; PP = Partially Proficient; P = Proficient; PWD = Proficient with Distinction
Table K-8b. 2007-08 NECAP Decision Consistency -- Cross-Tabulation of Observed Achievement Level Proportions for Two Parallel Forms: Reading, Grade 3
Form 1 Achievement Level Form 2 Achievement
Level SBP PP P PWD Total
SBP 0.065 0.028 0.001 0.000 0.094 PP 0.028 0.130 0.060 0.000 0.217 P 0.001 0.060 0.383 0.052 0.496
PWD 0.000 0.000 0.052 0.142 0.193 Total 0.094 0.217 0.496 0.193 1.000
Overall Consistency (sum of diagonal) = 0.720 SBP = Substantially Below Proficient; PP = Partially Proficient; P = Proficient; PWD = Proficient with Distinction
Table K-8c. 2007-08 NECAP Summary of Overall Accuracy and Consistency Indices: Reading, Grade 3
Accuracy 0.796 Consistency 0.720 Kappa (k) 0.576
Table K-8d. 2007-08 NECAP Indices Conditional On Achievement Level: Reading, Grade 3
Achievement Level Accuracy Consistency SBP 0.794 0.691 PP 0.694 0.597 P 0.820 0.773
PWD 0.868 0.734 SBP = Substantially Below Proficient; PP = Partially Proficient; P = Proficient; PWD = Proficient with Distinction
Table K-8e.2007-08 NECAP Accuracy and Consistency Indices at Cutpoints: Reading, Grade 3
Cutpoint Accuracy False Positive
False Negative Consistency
SBP:PP 0.959 0.019 0.023 0.942 PP:P 0.912 0.047 0.040 0.878
P:PWD 0.925 0.054 0.021 0.897
SBP = Substantially Below Proficient; PP = Partially Proficient; P = Proficient; PWD = Proficient with Distinction False Positive = proportion of students with observed score above cutpoint and true score below cutpoint False Negative = proportion of students with observed score below cutpoint and true score above cutpoint

Appendix K Decision Accuracy & Consist. 2007-08 NECAP Technical Report 10
Table K-9a. 2007-08 NECAP Decision Accuracy -- Cross-Tabulation of True and Observed
Achievement Level Proportions: Reading, Grade 4 True Achievement Level Observed
Achievement Level SBP PP P PWD Total
SBP 0.072 0.021 0.000 0.000 0.093 PP 0.027 0.163 0.055 0.000 0.244 P 0.000 0.045 0.384 0.063 0.493
PWD 0.000 0.000 0.024 0.146 0.170 Total 0.099 0.229 0.464 0.209 1.000
Overall Accuracy (sum of diagonal) = 0.765 SBP = Substantially Below Proficient; PP = Partially Proficient; P = Proficient; PWD = Proficient with Distinction
Table K-9b. 2007-08 NECAP Decision Consistency -- Cross-Tabulation of Observed Achievement Level Proportions for Two Parallel Forms: Reading, Grade 4
Form 1 Achievement Level Form 2 Achievement
Level SBP PP P PWD Total
SBP 0.065 0.031 0.002 0.000 0.099 PP 0.031 0.130 0.067 0.000 0.229 P 0.002 0.067 0.335 0.060 0.464
PWD 0.000 0.000 0.060 0.149 0.209 Total 0.099 0.229 0.464 0.209 1.000
Overall Consistency (sum of diagonal) = 0.678 SBP = Substantially Below Proficient; PP = Partially Proficient; P = Proficient; PWD = Proficient with Distinction
Table K-9c. 2007-08 NECAP Summary of Overall Accuracy and Consistency Indices: Reading, Grade 4
Accuracy 0.765 Consistency 0.678 Kappa (k) 0.527
Table K-9d. 2007-08 NECAP Indices Conditional On Achievement Level: Reading, Grade 4
Achievement Level Accuracy Consistency SBP 0.774 0.660 PP 0.667 0.568 P 0.780 0.722
PWD 0.858 0.712
SBP = Substantially Below Proficient; PP = Partially Proficient; P = Proficient; PWD = Proficient with Distinction
Table K-9e. 2007-08 NECAP Accuracy and Consistency Indices at Cutpoints: Reading, Grade 4
Cutpoint Accuracy False Positive
False Negative Consistency
SBP:PP 0.952 0.021 0.027 0.933 PP:P 0.899 0.055 0.046 0.861
P:PWD 0.913 0.063 0.024 0.880
SBP = Substantially Below Proficient; PP = Partially Proficient; P = Proficient; PWD = Proficient with Distinction False Positive = proportion of students with observed score above cutpoint and true score below cutpoint False Negative = proportion of students with observed score below cutpoint and true score above cutpoint

Appendix K Decision Accuracy & Consist. 2007-08 NECAP Technical Report 11
Table K-10a. 2007-08 NECAP Decision Accuracy -- Cross-Tabulation of True and Observed Achievement Level Proportions: Reading, Grade 5
True Achievement Level Observed Achievement
Level SBP PP P PWD Total
SBP 0.058 0.016 0.000 0.000 0.074 PP 0.022 0.199 0.048 0.000 0.269 P 0.000 0.043 0.379 0.050 0.472
PWD 0.000 0.000 0.025 0.161 0.185 Total 0.080 0.258 0.452 0.210 1.000
Overall Accuracy (sum of diagonal) = 0.797 SBP = Substantially Below Proficient; PP = Partially Proficient; P = Proficient; PWD = Proficient with Distinction
Table K-10b. 2007-08 NECAP Decision Consistency -- Cross-Tabulation of Observed Achievement Level Proportions for Two Parallel Forms: Reading, Grade 5
Form 1 Achievement Level Form 2 Achievement
Level SBP PP P PWD Total
SBP 0.053 0.026 0.001 0.000 0.080 PP 0.026 0.169 0.063 0.000 0.258 P 0.001 0.063 0.337 0.052 0.452
PWD 0.000 0.000 0.052 0.158 0.210 Total 0.080 0.258 0.452 0.210 1.000
Overall Consistency (sum of diagonal) = 0.717 SBP = Substantially Below Proficient; PP = Partially Proficient; P = Proficient; PWD = Proficient with Distinction
Table K-10c. 2007-08 NECAP Summary of Overall Accuracy and Consistency Indices: Reading, Grade 5
Accuracy 0.797 Consistency 0.717 Kappa (k) 0.583
Table K-10d. 2007-08 NECAP Indices Conditional On Achievement Level: Reading, Grade 5
Achievement Level Accuracy Consistency SBP 0.787 0.669 PP 0.740 0.654 P 0.803 0.745
PWD 0.867 0.753 SBP = Substantially Below Proficient; PP = Partially Proficient; P = Proficient; PWD = Proficient with Distinction
Table K-10e. 2007-08 NECAP Accuracy and Consistency Indices at Cutpoints: Reading, Grade 5
Cutpoint Accuracy False Positive
False Negative Consistency
SBP:PP 0.963 0.016 0.022 0.947 PP:P 0.909 0.048 0.043 0.873
P:PWD 0.926 0.050 0.025 0.896
SBP = Substantially Below Proficient; PP = Partially Proficient; P = Proficient; PWD = Proficient with Distinction False Positive = proportion of students with observed score above cutpoint and true score below cutpoint False Negative = proportion of students with observed score below cutpoint and true score above cutpoint
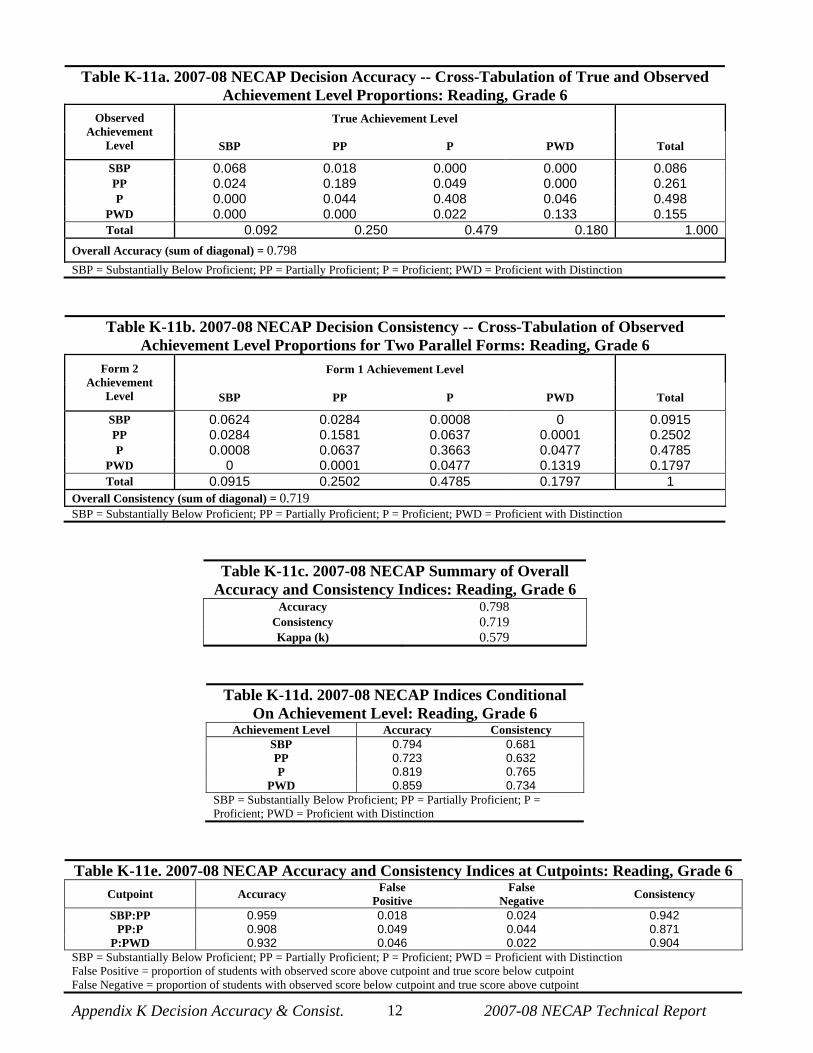
Appendix K Decision Accuracy & Consist. 2007-08 NECAP Technical Report 12
Table K-11a. 2007-08 NECAP Decision Accuracy -- Cross-Tabulation of True and Observed
Achievement Level Proportions: Reading, Grade 6 True Achievement Level Observed
Achievement Level SBP PP P PWD Total
SBP 0.068 0.018 0.000 0.000 0.086 PP 0.024 0.189 0.049 0.000 0.261 P 0.000 0.044 0.408 0.046 0.498
PWD 0.000 0.000 0.022 0.133 0.155 Total 0.092 0.250 0.479 0.180 1.000
Overall Accuracy (sum of diagonal) = 0.798 SBP = Substantially Below Proficient; PP = Partially Proficient; P = Proficient; PWD = Proficient with Distinction
Table K-11b. 2007-08 NECAP Decision Consistency -- Cross-Tabulation of Observed Achievement Level Proportions for Two Parallel Forms: Reading, Grade 6
Form 1 Achievement Level Form 2 Achievement
Level SBP PP P PWD Total
SBP 0.0624 0.0284 0.0008 0 0.0915 PP 0.0284 0.1581 0.0637 0.0001 0.2502 P 0.0008 0.0637 0.3663 0.0477 0.4785
PWD 0 0.0001 0.0477 0.1319 0.1797 Total 0.0915 0.2502 0.4785 0.1797 1
Overall Consistency (sum of diagonal) = 0.719 SBP = Substantially Below Proficient; PP = Partially Proficient; P = Proficient; PWD = Proficient with Distinction
Table K-11c. 2007-08 NECAP Summary of Overall Accuracy and Consistency Indices: Reading, Grade 6
Accuracy 0.798 Consistency 0.719 Kappa (k) 0.579
Table K-11d. 2007-08 NECAP Indices Conditional On Achievement Level: Reading, Grade 6
Achievement Level Accuracy Consistency SBP 0.794 0.681 PP 0.723 0.632 P 0.819 0.765
PWD 0.859 0.734
SBP = Substantially Below Proficient; PP = Partially Proficient; P = Proficient; PWD = Proficient with Distinction
Table K-11e. 2007-08 NECAP Accuracy and Consistency Indices at Cutpoints: Reading, Grade 6 Cutpoint Accuracy False
Positive False
Negative Consistency
SBP:PP 0.959 0.018 0.024 0.942 PP:P 0.908 0.049 0.044 0.871
P:PWD 0.932 0.046 0.022 0.904
SBP = Substantially Below Proficient; PP = Partially Proficient; P = Proficient; PWD = Proficient with Distinction False Positive = proportion of students with observed score above cutpoint and true score below cutpoint False Negative = proportion of students with observed score below cutpoint and true score above cutpoint

Appendix K Decision Accuracy & Consist. 2007-08 NECAP Technical Report 13
Table K-12a. 2007-08 NECAP Decision Accuracy -- Cross-Tabulation of True and Observed
Achievement Level Proportions: Reading, Grade 7 True Achievement Level Observed
Achievement Level SBP PP P PWD Total
SBP 0.061 0.016 0.000 0.000 0.077 PP 0.020 0.163 0.043 0.000 0.226 P 0.000 0.038 0.458 0.047 0.542
PWD 0.000 0.000 0.021 0.135 0.155 Total 0.081 0.217 0.521 0.181 1.000
Overall Accuracy (sum of diagonal) = 0.816 SBP = Substantially Below Proficient; PP = Partially Proficient; P = Proficient; PWD = Proficient with Distinction
Table K-12b. 2007-08 NECAP Decision Consistency -- Cross-Tabulation of Observed Achievement Level Proportions for Two Parallel Forms: Reading, Grade 7
Form 1 Achievement Level Form 2 Achievement
Level SBP PP P PWD Total
SBP 0.056 0.025 0.001 0.000 0.081 PP 0.025 0.136 0.056 0.000 0.217 P 0.001 0.056 0.418 0.047 0.521
PWD 0.000 0.000 0.047 0.135 0.181 Total 0.081 0.217 0.521 0.181 1.000
Overall Consistency (sum of diagonal) = 0.744 SBP = Substantially Below Proficient; PP = Partially Proficient; P = Proficient; PWD = Proficient with Distinction
Table K-12c. 2007-08 NECAP Summary of Overall Accuracy and Consistency Indices: Reading, Grade 7
Accuracy 0.816 Consistency 0.744 Kappa (k) 0.602
Table K-12d. 2007-08 NECAP Indices Conditional On Achievement Level: Reading, Grade 7
Achievement Level Accuracy Consistency SBP 0.796 0.689 PP 0.721 0.628 P 0.844 0.802
PWD 0.868 0.743
SBP = Substantially Below Proficient; PP = Partially Proficient; P = Proficient; PWD = Proficient with Distinction
Table K-12e. 2007-08 NECAP Accuracy and Consistency Indices at Cutpoints: Reading, Grade 7 Cutpoint Accuracy False
Positive False
Negative Consistency
SBP:PP 0.964 0.016 0.020 0.950 PP:P 0.919 0.043 0.038 0.887
P:PWD 0.933 0.047 0.021 0.907
SBP = Substantially Below Proficient; PP = Partially Proficient; P = Proficient; PWD = Proficient with Distinction False Positive = proportion of students with observed score above cutpoint and true score below cutpoint False Negative = proportion of students with observed score below cutpoint and true score above cutpoint

Appendix K Decision Accuracy & Consist. 2007-08 NECAP Technical Report 14
Table K-13a. 2007-08 NECAP Decision Accuracy -- Cross-Tabulation of True and Observed
Achievement Level Proportions: Reading, Grade 8 True Achievement Level Observed
Achievement Level SBP PP P PWD Total
SBP 0.087 0.019 0.000 0.000 0.106 PP 0.022 0.216 0.047 0.000 0.284 P 0.000 0.038 0.367 0.045 0.449
PWD 0.000 0.000 0.020 0.141 0.161 Total 0.109 0.272 0.433 0.186 1.000
Overall Accuracy (sum of diagonal) = 0.809 SBP = Substantially Below Proficient; PP = Partially Proficient; P = Proficient; PWD = Proficient with Distinction
Table K-13b. 2007-08 NECAP Decision Consistency -- Cross-Tabulation of Observed Achievement Level Proportions for Two Parallel Forms: Reading, Grade 8
Form 1 Achievement Level Form 2 Achievement
Level SBP PP P PWD Total
SBP 0.080 0.028 0.000 0.000 0.109 PP 0.028 0.185 0.058 0.000 0.272 P 0.000 0.058 0.330 0.045 0.433
PWD 0.000 0.000 0.045 0.141 0.186 Total 0.109 0.272 0.433 0.186 1.000
Overall Consistency (sum of diagonal) = 0.735 SBP = Substantially Below Proficient; PP = Partially Proficient; P = Proficient; PWD = Proficient with Distinction
Table K-13c. 2007-08 NECAP Summary of Overall Accuracy and Consistency Indices: Reading, Grade 8
Accuracy 0.809 Consistency 0.735 Kappa (k) 0.618
Table K-13d. 2007-08 NECAP Indices Conditional On Achievement Level: Reading, Grade 8
Achievement Level Accuracy Consistency SBP 0.821 0.736 PP 0.758 0.681 P 0.815 0.761
PWD 0.875 0.757
SBP = Substantially Below Proficient; PP = Partially Proficient; P = Proficient; PWD = Proficient with Distinction
Table K-13e. 2007-08 NECAP Accuracy and Consistency Indices at Cutpoints: Reading, Grade 8 Cutpoint Accuracy False
Positive False
Negative Consistency
SBP:PP 0.959 0.019 0.022 0.943 PP:P 0.916 0.047 0.038 0.882
P:PWD 0.935 0.045 0.020 0.910
SBP = Substantially Below Proficient; PP = Partially Proficient; P = Proficient; PWD = Proficient with Distinction False Positive = proportion of students with observed score above cutpoint and true score below cutpoint False Negative = proportion of students with observed score below cutpoint and true score above cutpoint
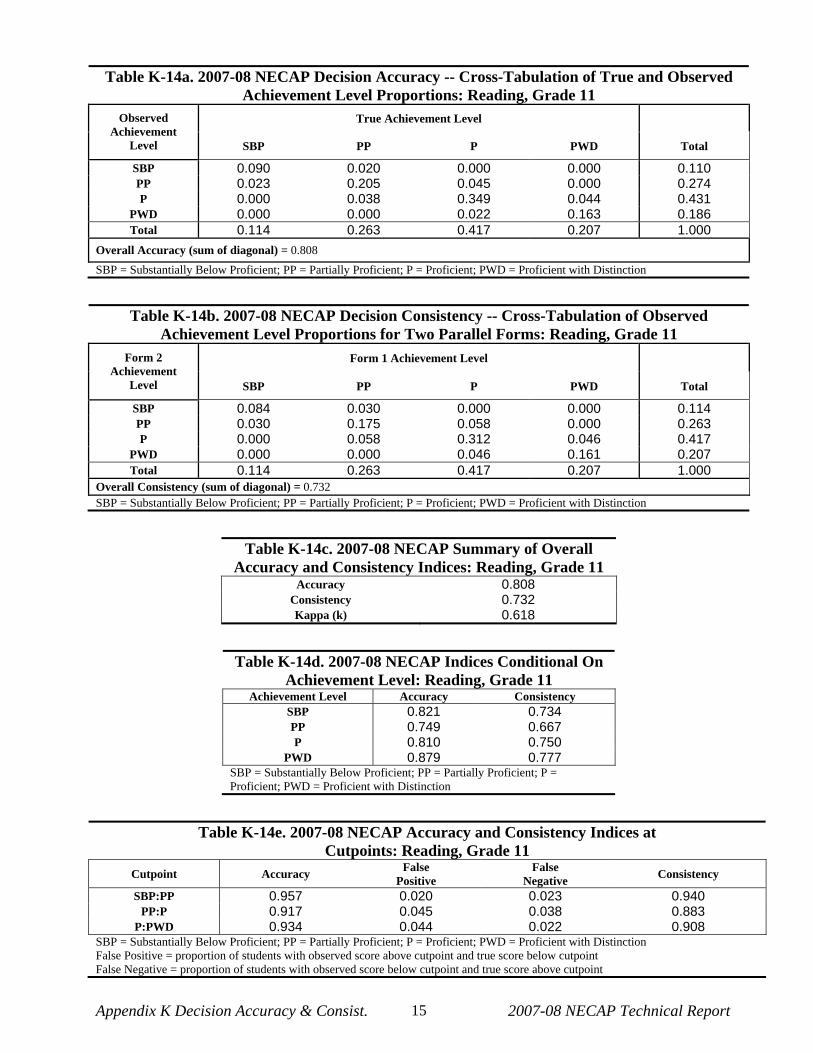
Appendix K Decision Accuracy & Consist. 2007-08 NECAP Technical Report 15
Table K-14a. 2007-08 NECAP Decision Accuracy -- Cross-Tabulation of True and Observed
Achievement Level Proportions: Reading, Grade 11 True Achievement Level Observed
Achievement Level SBP PP P PWD Total
SBP 0.090 0.020 0.000 0.000 0.110 PP 0.023 0.205 0.045 0.000 0.274 P 0.000 0.038 0.349 0.044 0.431
PWD 0.000 0.000 0.022 0.163 0.186 Total 0.114 0.263 0.417 0.207 1.000
Overall Accuracy (sum of diagonal) = 0.808 SBP = Substantially Below Proficient; PP = Partially Proficient; P = Proficient; PWD = Proficient with Distinction
Table K-14b. 2007-08 NECAP Decision Consistency -- Cross-Tabulation of Observed Achievement Level Proportions for Two Parallel Forms: Reading, Grade 11
Form 1 Achievement Level Form 2 Achievement
Level SBP PP P PWD Total
SBP 0.084 0.030 0.000 0.000 0.114 PP 0.030 0.175 0.058 0.000 0.263 P 0.000 0.058 0.312 0.046 0.417
PWD 0.000 0.000 0.046 0.161 0.207 Total 0.114 0.263 0.417 0.207 1.000
Overall Consistency (sum of diagonal) = 0.732 SBP = Substantially Below Proficient; PP = Partially Proficient; P = Proficient; PWD = Proficient with Distinction
Table K-14c. 2007-08 NECAP Summary of Overall Accuracy and Consistency Indices: Reading, Grade 11
Accuracy 0.808 Consistency 0.732 Kappa (k) 0.618
Table K-14d. 2007-08 NECAP Indices Conditional On Achievement Level: Reading, Grade 11
Achievement Level Accuracy Consistency SBP 0.821 0.734 PP 0.749 0.667 P 0.810 0.750
PWD 0.879 0.777 SBP = Substantially Below Proficient; PP = Partially Proficient; P = Proficient; PWD = Proficient with Distinction
Table K-14e. 2007-08 NECAP Accuracy and Consistency Indices at Cutpoints: Reading, Grade 11
Cutpoint Accuracy False Positive
False Negative Consistency
SBP:PP 0.957 0.020 0.023 0.940 PP:P 0.917 0.045 0.038 0.883
P:PWD 0.934 0.044 0.022 0.908 SBP = Substantially Below Proficient; PP = Partially Proficient; P = Proficient; PWD = Proficient with Distinction False Positive = proportion of students with observed score above cutpoint and true score below cutpoint False Negative = proportion of students with observed score below cutpoint and true score above cutpoint
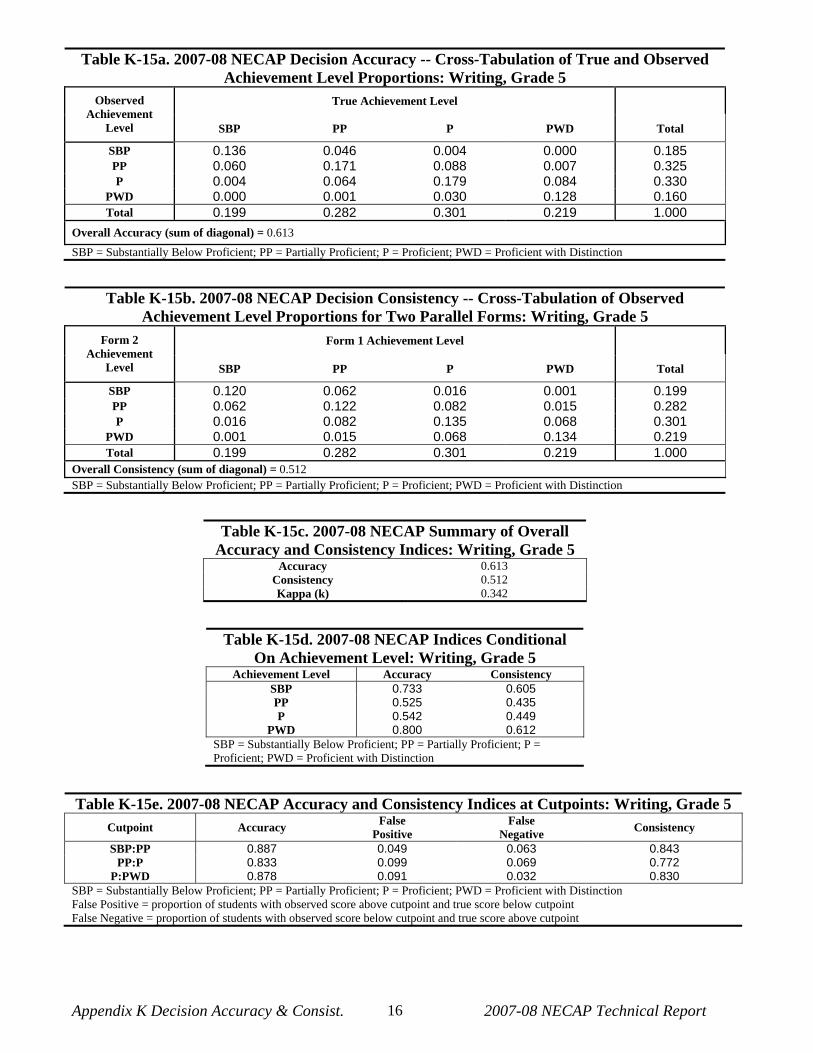
Appendix K Decision Accuracy & Consist. 2007-08 NECAP Technical Report 16
Table K-15a. 2007-08 NECAP Decision Accuracy -- Cross-Tabulation of True and Observed Achievement Level Proportions: Writing, Grade 5
True Achievement Level Observed Achievement
Level SBP PP P PWD Total
SBP 0.136 0.046 0.004 0.000 0.185 PP 0.060 0.171 0.088 0.007 0.325 P 0.004 0.064 0.179 0.084 0.330
PWD 0.000 0.001 0.030 0.128 0.160 Total 0.199 0.282 0.301 0.219 1.000
Overall Accuracy (sum of diagonal) = 0.613 SBP = Substantially Below Proficient; PP = Partially Proficient; P = Proficient; PWD = Proficient with Distinction
Table K-15b. 2007-08 NECAP Decision Consistency -- Cross-Tabulation of Observed Achievement Level Proportions for Two Parallel Forms: Writing, Grade 5
Form 1 Achievement Level Form 2 Achievement
Level SBP PP P PWD Total
SBP 0.120 0.062 0.016 0.001 0.199 PP 0.062 0.122 0.082 0.015 0.282 P 0.016 0.082 0.135 0.068 0.301
PWD 0.001 0.015 0.068 0.134 0.219 Total 0.199 0.282 0.301 0.219 1.000
Overall Consistency (sum of diagonal) = 0.512 SBP = Substantially Below Proficient; PP = Partially Proficient; P = Proficient; PWD = Proficient with Distinction
Table K-15c. 2007-08 NECAP Summary of Overall Accuracy and Consistency Indices: Writing, Grade 5
Accuracy 0.613 Consistency 0.512 Kappa (k) 0.342
Table K-15d. 2007-08 NECAP Indices Conditional On Achievement Level: Writing, Grade 5
Achievement Level Accuracy Consistency SBP 0.733 0.605 PP 0.525 0.435 P 0.542 0.449
PWD 0.800 0.612
SBP = Substantially Below Proficient; PP = Partially Proficient; P = Proficient; PWD = Proficient with Distinction
Table K-15e. 2007-08 NECAP Accuracy and Consistency Indices at Cutpoints: Writing, Grade 5 Cutpoint Accuracy False
Positive False
Negative Consistency
SBP:PP 0.887 0.049 0.063 0.843 PP:P 0.833 0.099 0.069 0.772
P:PWD 0.878 0.091 0.032 0.830
SBP = Substantially Below Proficient; PP = Partially Proficient; P = Proficient; PWD = Proficient with Distinction False Positive = proportion of students with observed score above cutpoint and true score below cutpoint False Negative = proportion of students with observed score below cutpoint and true score above cutpoint

Appendix K Decision Accuracy & Consist. 2007-08 NECAP Technical Report 17
Table K-16a. 2007-08 NECAP Decision Accuracy -- Cross-Tabulation of True and Observed
Achievement Level Proportions: Writing, Grade 8 True Achievement Level Observed
Achievement Level SBP PP P PWD Total
SBP 0.118 0.044 0.001 0.000 0.163 PP 0.057 0.259 0.102 0.002 0.420 P 0.001 0.060 0.238 0.062 0.361
PWD 0.000 0.000 0.012 0.044 0.056 Total 0.175 0.363 0.354 0.107 1.000
Overall Accuracy (sum of diagonal) = 0.659 SBP = Substantially Below Proficient; PP = Partially Proficient; P = Proficient; PWD = Proficient with Distinction
Table K-16b. 2007-08 NECAP Decision Consistency -- Cross-Tabulation of Observed Achievement Level Proportions for Two Parallel Forms: Writing, Grade 8
Form 1 Achievement Level Form 2 Achievement
Level SBP PP P PWD Total
SBP 0.104 0.063 0.008 0.000 0.175 PP 0.063 0.195 0.100 0.005 0.363 P 0.008 0.100 0.199 0.048 0.354
PWD 0.000 0.005 0.048 0.054 0.107 Total 0.175 0.363 0.354 0.107 1.000
Overall Consistency (sum of diagonal) = 0.551 SBP = Substantially Below Proficient; PP = Partially Proficient; P = Proficient; PWD = Proficient with Distinction
Table K-16c. 2007-08 NECAP Summary of Overall Accuracy and Consistency Indices: Writing, Grade 8
Accuracy 0.659 Consistency 0.551 Kappa (k) 0.359
Table K-16d. 2007-08 NECAP Indices Conditional On Achievement Level: Writing, Grade 8
Achievement Level Accuracy Consistency SBP 0.724 0.593 PP 0.617 0.537 P 0.660 0.561
PWD 0.780 0.503
SBP = Substantially Below Proficient; PP = Partially Proficient; P = Proficient; PWD = Proficient with Distinction
Table K-16e. 2007-08 NECAP Accuracy and Consistency Indices at Cutpoints: Writing, Grade 8
Cutpoint Accuracy False Positive
False Negative Consistency
SBP:PP 0.898 0.045 0.058 0.857 PP:P 0.834 0.105 0.061 0.774
P:PWD 0.924 0.063 0.012 0.893
SBP = Substantially Below Proficient; PP = Partially Proficient; P = Proficient; PWD = Proficient with Distinction False Positive = proportion of students with observed score above cutpoint and true score below cutpoint False Negative = proportion of students with observed score below cutpoint and true score above cutpoint

Appendix L Student Questionnaire 2007-08 NECAP Technical Report 1
APPENDIX L—STUDENT QUESTIONNAIRE DATA

Appendix L Student Questionnaire 2007-08 NECAP Technical Report 2
Table L-1. 2007-08 NECAP Average Scaled Score, and Counts and Percentages within Performance Levels, of Responses to Student Survey Questions 1-9 – Reading: Grade 3
Question Resp NResp %Resp AvgSS NSBP NPP NP NPWD %SBP %PP %P %PWD (blank) 3896 13 343 650 673 2120 453 17 17 54 12
A 8672 29 343 1408 1645 4822 797 16 19 56 9
B 12527 41 348 761 1583 8116 2067 6 13 65 17 1
C 5306 17 345 652 877 3156 621 12 17 59 12
(blank) 3927 13 343 665 679 2127 456 17 17 54 12
A 7784 26 345 971 1403 4597 813 12 18 59 10
B 10929 36 348 808 1404 6968 1749 7 13 64 16
C 3908 13 347 377 577 2349 605 10 15 60 15
2
D 3853 13 342 650 715 2173 315 17 19 56 8
(blank) 4022 13 343 688 707 2160 467 17 18 54 12
A 17235 57 346 1795 2683 10540 2217 10 16 61 13
B 8174 27 347 711 1194 5068 1201 9 15 62 15 3
C 970 3 338 277 194 446 53 29 20 46 5
(blank) 4060 13 343 710 698 2183 469 17 17 54 12
A 7512 25 342 1326 1581 4115 490 18 21 55 7
B 11565 38 348 756 1500 7501 1808 7 13 65 16 4
C 7264 24 347 679 999 4415 1171 9 14 61 16
(blank) 3904 13 343 654 668 2123 459 17 17 54 12
A 20939 69 347 1943 2970 12975 3051 9 14 62 15
B 2922 10 344 374 564 1734 250 13 19 59 9
C 1976 6 342 316 417 1096 147 16 21 55 7
5
D 660 2 338 184 159 286 31 28 24 43 5
(blank) 3951 13 343 656 687 2144 464 17 17 54 12
A 16225 53 346 1676 2489 9830 2230 10 15 61 14
B 6672 22 346 651 987 4165 869 10 15 62 13
C 1322 4 345 184 215 774 149 14 16 59 11
6
D 2231 7 344 304 400 1301 226 14 18 58 10
(blank) 3957 13 343 658 671 2158 470 17 17 55 12
A 16999 56 348 1265 2303 10782 2649 7 14 63 16
B 5772 19 344 822 1065 3371 514 14 18 58 9
C 3148 10 343 528 612 1723 285 17 19 55 9
7
D 525 2 335 198 127 180 20 38 24 34 4
(blank) 3954 13 343 663 685 2145 461 17 17 54 12
A 14801 49 347 1336 2171 9011 2283 9 15 61 15
B 7520 25 346 720 1090 4768 942 10 14 63 13
C 1689 6 343 255 312 981 141 15 18 58 8
8
D 2437 8 340 497 520 1309 111 20 21 54 5
(blank) 4062 13 343 660 714 2211 477 16 18 54 12
A 9247 30 345 1035 1567 5592 1053 11 17 60 11
B 8516 28 348 655 1091 5296 1474 8 13 62 17
C 4250 14 346 456 671 2545 578 11 16 60 14
9
D 4326 14 343 665 735 2570 356 15 17 59 8
SBP = Substantially Below Proficient; PP = Partially Proficient; P = Proficient; PWD = Proficient with Distinction.
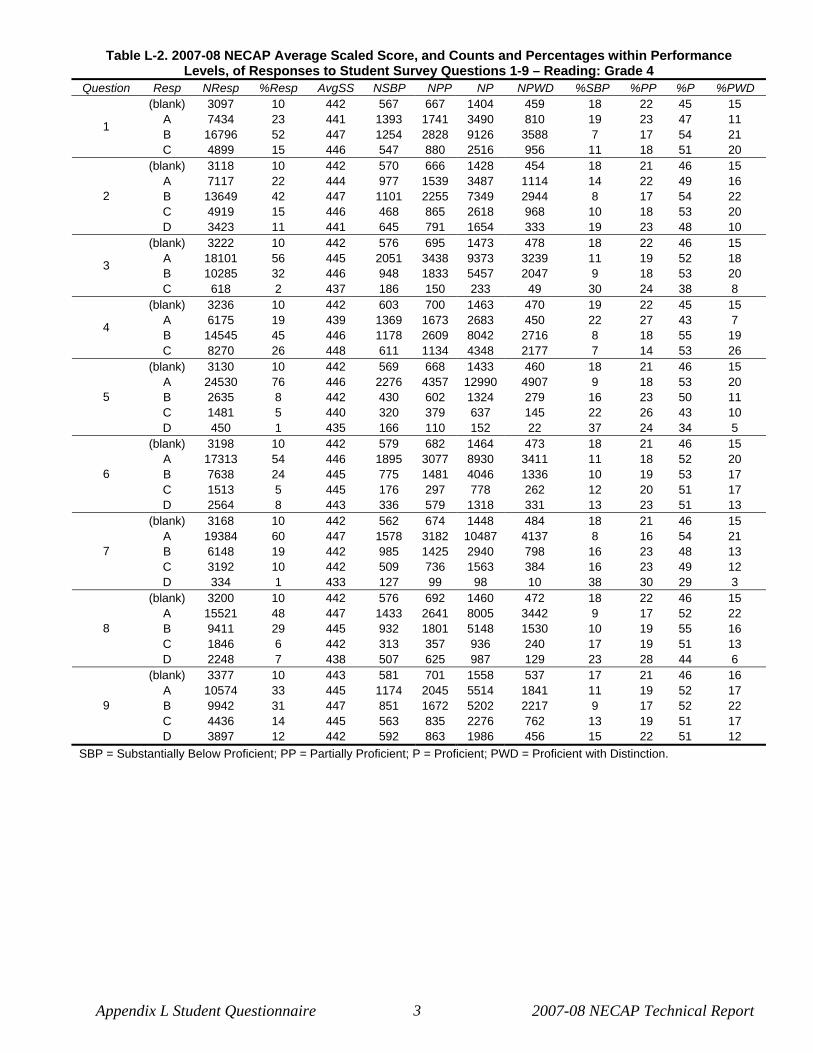
Appendix L Student Questionnaire 2007-08 NECAP Technical Report 3
Table L-2. 2007-08 NECAP Average Scaled Score, and Counts and Percentages within Performance Levels, of Responses to Student Survey Questions 1-9 – Reading: Grade 4
Question Resp NResp %Resp AvgSS NSBP NPP NP NPWD %SBP %PP %P %PWD (blank) 3097 10 442 567 667 1404 459 18 22 45 15
A 7434 23 441 1393 1741 3490 810 19 23 47 11
B 16796 52 447 1254 2828 9126 3588 7 17 54 21 1
C 4899 15 446 547 880 2516 956 11 18 51 20
(blank) 3118 10 442 570 666 1428 454 18 21 46 15
A 7117 22 444 977 1539 3487 1114 14 22 49 16
B 13649 42 447 1101 2255 7349 2944 8 17 54 22
C 4919 15 446 468 865 2618 968 10 18 53 20
2
D 3423 11 441 645 791 1654 333 19 23 48 10
(blank) 3222 10 442 576 695 1473 478 18 22 46 15
A 18101 56 445 2051 3438 9373 3239 11 19 52 18
B 10285 32 446 948 1833 5457 2047 9 18 53 20 3
C 618 2 437 186 150 233 49 30 24 38 8
(blank) 3236 10 442 603 700 1463 470 19 22 45 15
A 6175 19 439 1369 1673 2683 450 22 27 43 7
B 14545 45 446 1178 2609 8042 2716 8 18 55 19 4
C 8270 26 448 611 1134 4348 2177 7 14 53 26
(blank) 3130 10 442 569 668 1433 460 18 21 46 15
A 24530 76 446 2276 4357 12990 4907 9 18 53 20
B 2635 8 442 430 602 1324 279 16 23 50 11
C 1481 5 440 320 379 637 145 22 26 43 10
5
D 450 1 435 166 110 152 22 37 24 34 5
(blank) 3198 10 442 579 682 1464 473 18 21 46 15
A 17313 54 446 1895 3077 8930 3411 11 18 52 20
B 7638 24 445 775 1481 4046 1336 10 19 53 17
C 1513 5 445 176 297 778 262 12 20 51 17
6
D 2564 8 443 336 579 1318 331 13 23 51 13
(blank) 3168 10 442 562 674 1448 484 18 21 46 15
A 19384 60 447 1578 3182 10487 4137 8 16 54 21
B 6148 19 442 985 1425 2940 798 16 23 48 13
C 3192 10 442 509 736 1563 384 16 23 49 12
7
D 334 1 433 127 99 98 10 38 30 29 3
(blank) 3200 10 442 576 692 1460 472 18 22 46 15
A 15521 48 447 1433 2641 8005 3442 9 17 52 22
B 9411 29 445 932 1801 5148 1530 10 19 55 16
C 1846 6 442 313 357 936 240 17 19 51 13
8
D 2248 7 438 507 625 987 129 23 28 44 6
(blank) 3377 10 443 581 701 1558 537 17 21 46 16
A 10574 33 445 1174 2045 5514 1841 11 19 52 17
B 9942 31 447 851 1672 5202 2217 9 17 52 22
C 4436 14 445 563 835 2276 762 13 19 51 17
9
D 3897 12 442 592 863 1986 456 15 22 51 12
SBP = Substantially Below Proficient; PP = Partially Proficient; P = Proficient; PWD = Proficient with Distinction.

Appendix L Student Questionnaire 2007-08 NECAP Technical Report 4
Table L-3. 2007-08 NECAP Average Scaled Score, and Counts and Percentages within Performance Levels, of Responses to Student Survey Questions 1-9 – Reading: Grade 5
Question Resp NResp %Resp AvgSS NSBP NPP NP NPWD %SBP %PP %P %PWD (blank) 3090 10 542 520 768 1357 445 17 25 44 14
A 8439 26 543 1152 2044 4037 1206 14 24 48 14
B 17487 54 547 1085 3578 9300 3524 6 20 53 20 1
C 3337 10 545 329 673 1709 626 10 20 51 19
(blank) 3095 10 542 523 771 1347 454 17 25 44 15
A 4830 15 544 597 1160 2305 768 12 24 48 16
B 14614 45 547 932 2865 7810 3007 6 20 53 21
C 6315 20 546 525 1331 3265 1194 8 21 52 19
2
D 3499 11 542 509 936 1676 378 15 27 48 11
(blank) 3213 10 542 539 801 1409 464 17 25 44 14
A 16612 51 545 1500 3710 8424 2978 9 22 51 18
B 11915 37 546 857 2382 6355 2321 7 20 53 19 3
C 613 2 536 190 170 215 38 31 28 35 6
(blank) 3255 10 542 557 815 1409 474 17 25 43 15
A 5455 17 539 1027 1719 2306 403 19 32 42 7
B 15886 49 546 1061 3378 8545 2902 7 21 54 18 4
C 7757 24 549 441 1151 4143 2022 6 15 53 26
(blank) 3113 10 542 528 777 1358 450 17 25 44 14
A 24339 75 546 1860 5046 12782 4651 8 21 53 19
B 2971 9 544 355 713 1454 449 12 24 49 15
C 1301 4 542 223 355 556 167 17 27 43 13
5
D 629 2 541 120 172 253 84 19 27 40 13
(blank) 3144 10 542 527 787 1378 452 17 25 44 14
A 16254 50 546 1317 3270 8297 3370 8 20 51 21
B 8693 27 545 704 1945 4572 1472 8 22 53 17
C 1791 6 545 179 385 962 265 10 21 54 15
6
D 2471 8 542 359 676 1194 242 15 27 48 10
(blank) 3166 10 542 522 786 1387 471 16 25 44 15
A 19313 60 547 1143 3569 10424 4177 6 18 54 22
B 6371 20 542 859 1730 3011 771 13 27 47 12
C 3196 10 542 451 862 1511 372 14 27 47 12
7
D 307 1 533 111 116 70 10 36 38 23 3
(blank) 3162 10 542 525 789 1387 461 17 25 44 15
A 14410 45 548 983 2566 7466 3395 7 18 52 24
B 10206 32 545 841 2308 5463 1594 8 23 54 16
C 2193 7 542 270 601 1094 228 12 27 50 10
8
D 2382 7 539 467 799 993 123 20 34 42 5
(blank) 3393 10 542 546 827 1498 522 16 24 44 15
A 12003 37 546 985 2571 6291 2156 8 21 52 18
B 9208 28 547 651 1750 4744 2063 7 19 52 22
C 3953 12 545 387 894 1966 706 10 23 50 18
9
D 3796 12 542 517 1021 1904 354 14 27 50 9
SBP = Substantially Below Proficient; PP = Partially Proficient; P = Proficient; PWD = Proficient with Distinction.

Appendix L Student Questionnaire 2007-08 NECAP Technical Report 5
Table L-4. 2007-08 NECAP Average Scaled Score, and Counts and Percentages within Performance Levels, of Responses to Student Survey Questions 1-9 – Reading: Grade 6
Question Resp NResp %Resp AvgSS NSBP NPP NP NPWD %SBP %PP %P %PWD (blank) 3571 11 642 682 824 1644 421 19 23 46 12
A 6766 21 642 1079 1623 3325 739 16 24 49 11
B 19088 58 647 1321 3763 11016 2988 7 20 58 16 1
C 3425 10 647 308 563 2031 523 9 16 59 15
(blank) 3581 11 642 687 834 1641 419 19 23 46 12
A 3426 10 643 524 747 1738 417 15 22 51 12
B 13842 42 647 1002 2631 7924 2285 7 19 57 17
C 7965 24 647 587 1499 4646 1233 7 19 58 15
2
D 4036 12 642 590 1062 2067 317 15 26 51 8
(blank) 3766 11 642 726 881 1723 436 19 23 46 12
A 15921 48 645 1526 3319 8760 2316 10 21 55 15
B 12602 38 646 980 2423 7309 1890 8 19 58 15 3
C 561 2 637 158 150 224 29 28 27 40 5
(blank) 3814 12 642 736 882 1762 434 19 23 46 11
A 4183 13 638 961 1281 1715 226 23 31 41 5
B 16811 51 646 1243 3478 9706 2384 7 21 58 14 4
C 8042 24 649 450 1132 4833 1627 6 14 60 20
(blank) 3715 11 642 702 855 1720 438 19 23 46 12
A 24892 76 646 1966 4859 14327 3740 8 20 58 15
B 2815 9 643 400 697 1395 323 14 25 50 11
C 960 3 641 193 238 408 121 20 25 43 13
5
D 468 1 638 129 124 166 49 28 26 35 10
(blank) 3723 11 642 709 873 1699 442 19 23 46 12
A 15265 46 647 1252 2831 8710 2472 8 19 57 16
B 10835 33 646 910 2285 6155 1485 8 21 57 14
C 1263 4 643 185 306 622 150 15 24 49 12
6
D 1764 5 640 334 478 830 122 19 27 47 7
(blank) 3773 11 642 715 863 1752 443 19 23 46 12
A 20203 62 647 1308 3607 11908 3380 6 18 59 17
B 5234 16 642 761 1351 2571 551 15 26 49 11
C 3344 10 642 471 867 1711 295 14 26 51 9
7
D 296 1 631 135 85 74 2 46 29 25 1
(blank) 3744 11 642 714 871 1727 432 19 23 46 12
A 11347 35 649 786 1669 6420 2472 7 15 57 22
B 11167 34 645 953 2400 6464 1350 9 21 58 12
C 3387 10 643 384 827 1893 283 11 24 56 8
8
D 3205 10 639 553 1006 1512 134 17 31 47 4
(blank) 3963 12 642 717 911 1854 481 18 23 47 12
A 14451 44 646 1168 2861 8307 2115 8 20 57 15
B 7472 23 647 628 1402 4134 1308 8 19 55 18
C 3457 11 645 378 703 1846 530 11 20 53 15
9
D 3507 11 642 499 896 1875 237 14 26 53 7
SBP = Substantially Below Proficient; PP = Partially Proficient; P = Proficient; PWD = Proficient with Distinction.

Appendix L Student Questionnaire 2007-08 NECAP Technical Report 6
Table L-5. 2007-08 NECAP Average Scaled Score, and Counts and Percentages within Performance Levels, of Responses to Student Survey Questions 1-9 – Reading: Grade 7
Question Resp NResp %Resp AvgSS NSBP NPP NP NPWD %SBP %PP %P %PWD (blank) 3747 11 742 720 848 1755 424 19 23 47 11
A 6675 20 743 977 1514 3466 718 15 23 52 11
B 19648 58 748 1290 3495 11655 3208 7 18 59 16 1
C 3809 11 749 241 577 2313 678 6 15 61 18
(blank) 3743 11 742 718 855 1746 424 19 23 47 11
A 2188 6 743 330 527 1070 261 15 24 49 12
B 11745 35 748 754 1967 6954 2070 6 17 59 18
C 10143 30 748 681 1695 6077 1690 7 17 60 17
2
D 6060 18 744 745 1390 3342 583 12 23 55 10
(blank) 3842 11 742 744 887 1781 430 19 23 46 11
A 14228 42 747 1247 2798 8009 2174 9 20 56 15
B 14821 44 748 1019 2505 8930 2367 7 17 60 16 3
C 988 3 740 218 244 469 57 22 25 47 6
(blank) 3965 12 742 769 900 1851 445 19 23 47 11
A 3813 11 739 814 1120 1682 197 21 29 44 5
B 17860 53 747 1221 3382 10610 2647 7 19 59 15 4
C 8241 24 750 424 1032 5046 1739 5 13 61 21
(blank) 3744 11 742 721 855 1744 424 19 23 47 11
A 25903 76 748 1844 4622 15457 3980 7 18 60 15
B 2839 8 745 357 600 1455 427 13 21 51 15
C 888 3 742 189 218 348 133 21 25 39 15
5
D 505 1 740 117 139 185 64 23 28 37 13
(blank) 3772 11 742 721 869 1764 418 19 23 47 11
A 14366 42 748 1009 2406 8504 2447 7 17 59 17
B 12821 38 747 996 2323 7571 1931 8 18 59 15
C 1272 4 744 169 330 633 140 13 26 50 11
6
D 1648 5 739 333 506 717 92 20 31 44 6
(blank) 3792 11 742 718 876 1771 427 19 23 47 11
A 21012 62 749 1182 3400 12710 3720 6 16 60 18
B 4885 14 744 693 1137 2528 527 14 23 52 11
C 3808 11 743 506 910 2045 347 13 24 54 9
7
D 382 1 734 129 111 135 7 34 29 35 2
(blank) 3805 11 742 737 883 1763 422 19 23 46 11
A 9501 28 751 508 1071 5548 2374 5 11 58 25
B 11220 33 747 813 2093 6692 1622 7 19 60 14
C 4555 13 745 436 1043 2664 412 10 23 58 9
8
D 4798 14 741 734 1344 2522 198 15 28 53 4
(blank) 4181 12 743 751 964 1983 483 18 23 47 12
A 17441 51 748 1175 3060 10441 2765 7 18 60 16
B 5754 17 747 489 1059 3215 991 8 18 56 17
C 3121 9 746 397 564 1691 469 13 18 54 15
9
D 3382 10 744 416 787 1859 320 12 23 55 9
SBP = Substantially Below Proficient; PP = Partially Proficient; P = Proficient; PWD = Proficient with Distinction.

Appendix L Student Questionnaire 2007-08 NECAP Technical Report 7
Table L-6. 2007-08 NECAP Average Scaled Score, and Counts and Percentages within Performance Levels, of Responses to Student Survey Questions 1-9 – Reading: Grade 8
Question Resp NResp %Resp AvgSS NSBP NPP NP NPWD %SBP %PP %P %PWD (blank) 3369 10 840 795 848 1331 395 24 25 40 12
A 5831 17 841 1113 1583 2580 555 19 27 44 10
B 20807 59 846 1751 4611 11383 3062 8 22 55 15 1
C 5045 14 848 396 941 2796 912 8 19 55 18
(blank) 3332 10 840 801 862 1304 365 24 26 39 11
A 1696 5 841 321 478 736 161 19 28 43 9
B 11960 34 847 1021 2365 6612 1962 9 20 55 16
C 11282 32 847 905 2320 6212 1845 8 21 55 16
2
D 6782 19 842 1007 1958 3226 591 15 29 48 9
(blank) 3425 10 840 831 883 1329 382 24 26 39 11
A 14073 40 846 1470 3153 7385 2065 10 22 52 15
B 16094 46 846 1409 3493 8801 2391 9 22 55 15 3
C 1460 4 838 345 454 575 86 24 31 39 6
(blank) 3637 10 840 875 950 1413 399 24 26 39 11
A 3357 10 837 965 999 1223 170 29 30 36 5
B 18003 51 845 1600 4380 9679 2344 9 24 54 13 4
C 10055 29 849 615 1654 5775 2011 6 16 57 20
(blank) 3379 10 840 810 868 1335 366 24 26 40 11
A 27900 80 846 2425 6159 15255 4061 9 22 55 15
B 2451 7 842 472 616 1035 328 19 25 42 13
C 897 3 840 226 216 337 118 25 24 38 13
5
D 425 1 838 122 124 128 51 29 29 30 12
(blank) 3387 10 840 805 873 1335 374 24 26 39 11
A 13484 38 846 1210 2880 7280 2114 9 21 54 16
B 14492 41 846 1294 3217 7855 2126 9 22 54 15
C 1742 5 843 255 434 858 195 15 25 49 11
6
D 1947 6 838 491 579 762 115 25 30 39 6
(blank) 3415 10 840 816 874 1342 383 24 26 39 11
A 21826 62 847 1504 4338 12306 3678 7 20 56 17
B 5215 15 842 898 1380 2383 554 17 26 46 11
C 4056 12 841 658 1214 1890 294 16 30 47 7
7
D 540 2 834 179 177 169 15 33 33 31 3
(blank) 3412 10 840 825 871 1344 372 24 26 39 11
A 8904 25 850 506 1231 4998 2169 6 14 56 24
B 10796 31 846 970 2290 5954 1582 9 21 55 15
C 5481 16 843 629 1454 2906 492 11 27 53 9
8
D 6459 18 840 1125 2137 2888 309 17 33 45 5
(blank) 3791 11 840 847 975 1561 408 22 26 41 11
A 19833 57 846 1696 4304 10869 2964 9 22 55 15
B 5064 14 846 596 1061 2569 838 12 21 51 17
C 3003 9 845 405 660 1495 443 13 22 50 15
9
D 3361 10 842 511 983 1596 271 15 29 47 8
SBP = Substantially Below Proficient; PP = Partially Proficient; P = Proficient; PWD = Proficient with Distinction.

Appendix L Student Questionnaire 2007-08 NECAP Technical Report 8
Table L-7. 2007-08 NECAP Average Scaled Score, and Counts and Percentages within Performance Levels, of Responses to Student Survey Questions 13-23 – Reading: Grade 11
Question Resp NResp %Resp AvgSS NSBP NPP NP NPWD %SBP %PP %P %PWD (blank) 8098 24 1141 1610 1900 3380 1208 20 23 42 15
A 4939 15 1139 995 1484 2050 410 20 30 42 8
B 14236 42 1144 1192 3252 7535 2257 8 23 53 16 13
C 6723 20 1148 454 936 3303 2030 7 14 49 30
(blank) 7730 23 1141 1496 1793 3260 1181 19 23 42 15
A 1387 4 1139 330 349 567 141 24 25 41 10
B 7477 22 1145 697 1421 3709 1650 9 19 50 22
C 9712 29 1145 739 1889 5131 1953 8 19 53 20
14
D 7690 23 1142 989 2120 3601 980 13 28 47 13
(blank) 8210 24 1141 1635 1962 3421 1192 20 24 42 15
A 4874 14 1142 698 1238 2304 634 14 25 47 13
B 15554 46 1146 1102 2956 8132 3364 7 19 52 22 15
C 5358 16 1142 816 1416 2411 715 15 26 45 13
(blank) 8295 24 1141 1655 1961 3460 1219 20 24 42 15
A 3336 10 1137 812 1096 1242 186 24 33 37 6
B 13478 40 1143 1183 3288 7212 1795 9 24 54 13 16
C 8887 26 1148 601 1227 4354 2705 7 14 49 30
(blank) 7799 23 1141 1516 1816 3273 1194 19 23 42 15
A 17355 51 1145 1486 3717 9046 3106 9 21 52 18
B 5222 15 1144 613 1221 2430 958 12 23 47 18
C 2627 8 1144 385 557 1161 524 15 21 44 20
17
D 993 3 1139 251 261 358 123 25 26 36 12
(blank) 7840 23 1141 1513 1834 3292 1201 19 23 42 15
A 12328 36 1146 844 2218 6369 2897 7 18 52 23
B 9486 28 1144 925 2153 4910 1498 10 23 52 16
C 2282 7 1140 408 684 983 207 18 30 43 9
18
D 2060 6 1137 561 683 714 102 27 33 35 5
(blank) 7808 23 1141 1514 1810 3280 1204 19 23 42 15
A 6326 19 1146 547 1193 3014 1572 9 19 48 25
B 12484 37 1145 1050 2555 6530 2349 8 20 52 19
C 4581 13 1142 561 1155 2287 578 12 25 50 13
19
D 2797 8 1139 579 859 1157 202 21 31 41 7
(blank) 7900 23 1141 1520 1839 3319 1222 19 23 42 15
A 12315 36 1146 878 2394 6544 2499 7 19 53 20
B 8638 25 1143 1007 2119 4180 1332 12 25 48 15
C 3436 10 1144 470 738 1546 682 14 21 45 20
20
D 1707 5 1139 376 482 679 170 22 28 40 10
(blank) 7890 23 1141 1532 1838 3303 1217 19 23 42 15
A 5597 16 1147 456 883 2790 1468 8 16 50 26
B 7303 21 1145 694 1381 3633 1595 10 19 50 22
C 6144 18 1144 572 1342 3216 1014 9 22 52 17
21
D 7062 21 1141 997 2128 3326 611 14 30 47 9
(blank) 8397 25 1141 1572 1974 3557 1294 19 24 42 15
A 15623 46 1145 1199 3101 8215 3108 8 20 53 20
B 4963 15 1144 564 1136 2345 918 11 23 47 18
C 2464 7 1141 440 634 1054 336 18 26 43 14
22
D 2549 7 1140 476 727 1097 249 19 29 43 10
(blank) 8007 24 1141 1539 1861 3374 1233 19 23 42 15
A 8309 24 1150 475 896 3925 3013 6 11 47 36
B 11406 34 1143 1053 2686 6235 1432 9 24 55 13
C 4383 13 1139 749 1452 2019 163 17 33 46 4
23
D 1891 6 1137 435 677 715 64 23 36 38 3
SBP = Substantially Below Proficient; PP = Partially Proficient; P = Proficient; PWD = Proficient with Distinction.

Appendix L Student Questionnaire 2007-08 NECAP Technical Report 9
Table L-8. 2007-08 NECAP Average Scaled Score, and Counts and Percentages within Performance Levels, of Responses to Student Survey Questions 10-19 – Math: Grade 3
Question Resp NResp %Resp AvgSS NSBP NPP NP NPWD %SBP %PP %P %PWD (blank) 4114 13 341 839 811 1876 588 20 20 46 14
A 8422 28 341 1581 1995 3860 986 19 24 46 12
B 11876 39 346 943 1861 6304 2768 8 16 53 23 10
C 6091 20 345 847 996 2892 1356 14 16 47 22
(blank) 4127 14 341 843 791 1895 598 20 19 46 14
A 16412 54 344 2114 3131 8199 2968 13 19 50 18
B 8787 29 345 959 1501 4363 1964 11 17 50 22 11
C 1177 4 340 294 240 475 168 25 20 40 14
(blank) 4127 14 342 805 786 1912 624 20 19 46 15
A 2293 8 338 597 594 929 173 26 26 41 8
B 4132 14 342 708 908 1983 533 17 22 48 13
C 11652 38 346 1018 1838 6007 2789 9 16 52 24
12
D 8299 27 344 1082 1537 4101 1579 13 19 49 19
(blank) 3900 13 342 776 763 1787 574 20 20 46 15
A 21525 71 345 2521 3725 10728 4551 12 17 50 21
B 3013 10 342 445 681 1499 388 15 23 50 13
C 1491 5 341 279 337 725 150 19 23 49 10
13
D 574 2 336 189 157 193 35 33 27 34 6
(blank) 4028 13 342 791 801 1851 585 20 20 46 15
A 5548 18 340 1241 1273 2345 689 22 23 42 12
B 11311 37 345 1231 2072 5730 2278 11 18 51 20
C 4857 16 347 411 671 2558 1217 8 14 53 25
14
D 4759 16 345 536 846 2448 929 11 18 51 20
(blank) 3992 13 342 784 785 1847 576 20 20 46 14
A 13818 45 345 1683 2490 6758 2887 12 18 49 21
B 9139 30 345 1072 1667 4664 1736 12 18 51 19
C 1750 6 343 268 323 863 296 15 18 49 17
15
D 1804 6 340 403 398 800 203 22 22 44 11
(blank) 4104 13 342 809 812 1893 590 20 20 46 14
A 5230 17 341 1072 1212 2343 603 20 23 45 12
B 10821 35 344 1282 2022 5433 2084 12 19 50 19
C 6590 22 347 527 967 3394 1702 8 15 52 26
16
D 3758 12 344 520 650 1869 719 14 17 50 19
(blank) 4237 14 342 842 829 1951 615 20 20 46 15
A 2606 9 339 653 695 1062 196 25 27 41 8
B 8553 28 345 834 1529 4428 1762 10 18 52 21
C 7241 24 346 683 1059 3742 1757 9 15 52 24
17
D 7866 26 343 1198 1551 3749 1368 15 20 48 17
(blank) 4221 14 342 840 824 1935 622 20 20 46 15
A 9539 31 345 1029 1686 4879 1945 11 18 51 20
B 3094 10 341 621 733 1399 341 20 24 45 11
C 10435 34 346 1087 1758 5238 2352 10 17 50 23
18
D 3214 11 341 633 662 1481 438 20 21 46 14
(blank) 4538 15 341 905 892 2082 659 20 20 46 15
A 12885 42 344 1750 2487 6353 2295 14 19 49 18
B 9335 31 346 923 1594 4745 2073 10 17 51 22
C 2414 8 345 327 380 1177 530 14 16 49 22
19
D 1331 4 340 305 310 575 141 23 23 43 11
SBP = Substantially Below Proficient; PP = Partially Proficient; P = Proficient; PWD = Proficient with Distinction.

Appendix L Student Questionnaire 2007-08 NECAP Technical Report 10
Table L-9. 2007-08 NECAP Average Scaled Score, and Counts and Percentages within Performance Levels, of Responses to Student Survey Questions 10-19 – Math: Grade 4
Question Resp NResp %Resp AvgSS NSBP NPP NP NPWD %SBP %PP %P %PWD (blank) 3280 10 440 788 816 1269 407 24 25 39 12
A 7859 24 439 1827 2161 3190 681 23 27 41 9
B 15459 48 445 1679 3306 7738 2736 11 21 50 18 10
C 5736 18 445 702 1066 2726 1242 12 19 48 22
(blank) 3307 10 440 771 824 1291 421 23 25 39 13
A 17401 54 443 2588 4032 8204 2577 15 23 47 15
B 10736 33 444 1379 2288 5118 1951 13 21 48 18 11
C 890 3 439 258 205 310 117 29 23 35 13
(blank) 3372 10 440 758 822 1330 462 22 24 39 14
A 2127 7 438 623 538 793 173 29 25 37 8
B 5145 16 441 990 1379 2268 508 19 27 44 10
C 15371 48 445 1780 3236 7477 2878 12 21 49 19
12
D 6319 20 444 845 1374 3055 1045 13 22 48 17
(blank) 3128 10 440 732 783 1216 397 23 25 39 13
A 24603 76 444 3169 5322 11818 4294 13 22 48 17
B 2802 9 440 581 747 1230 244 21 27 44 9
C 1285 4 438 339 348 495 103 26 27 39 8
13
D 516 2 435 175 149 164 28 34 29 32 5
(blank) 3257 10 440 754 815 1279 409 23 25 39 13
A 4881 15 439 1309 1210 1853 509 27 25 38 10
B 12270 38 443 1659 2881 5851 1879 14 23 48 15
C 6803 21 446 609 1271 3498 1425 9 19 51 21
14
D 5123 16 444 665 1172 2442 844 13 23 48 16
(blank) 3211 10 440 759 803 1247 402 24 25 39 13
A 16824 52 444 2241 3663 8049 2871 13 22 48 17
B 9502 29 443 1333 2217 4522 1430 14 23 48 15
C 1515 5 442 306 323 641 245 20 21 42 16
15
D 1282 4 438 357 343 464 118 28 27 36 9
(blank) 3462 11 440 785 866 1370 441 23 25 40 13
A 3740 12 438 993 1020 1408 319 27 27 38 9
B 10113 31 443 1521 2469 4705 1418 15 24 47 14
C 9742 30 446 889 1817 5004 2032 9 19 51 21
16
D 5277 16 443 808 1177 2436 856 15 22 46 16
(blank) 3431 11 440 802 871 1327 431 23 25 39 13
A 1766 5 435 634 495 549 88 36 28 31 5
B 8446 26 442 1363 2164 3853 1066 16 26 46 13
C 10634 33 446 989 2070 5504 2071 9 19 52 19
17
D 8057 25 444 1208 1749 3690 1410 15 22 46 18
(blank) 3459 11 440 793 846 1365 455 23 24 39 13
A 11314 35 444 1337 2437 5561 1979 12 22 49 17
B 3659 11 439 885 1055 1456 263 24 29 40 7
C 10648 33 445 1312 2209 5176 1951 12 21 49 18
18
D 3254 10 441 669 802 1365 418 21 25 42 13
(blank) 3709 11 440 848 924 1476 461 23 25 40 12
A 13460 42 443 2111 3089 6131 2129 16 23 46 16
B 11623 36 444 1346 2556 5750 1971 12 22 49 17
C 2529 8 444 364 512 1231 422 14 20 49 17
19
D 1013 3 437 327 268 335 83 32 26 33 8
SBP = Substantially Below Proficient; PP = Partially Proficient; P = Proficient; PWD = Proficient with Distinction.

Appendix L Student Questionnaire 2007-08 NECAP Technical Report 11
Table L-10. 2007-08 NECAP Average Scaled Score, and Counts and Percentages within Performance Levels, of Responses to Student Survey Questions 10-19 – Math: Grade 5
Question Resp NResp %Resp AvgSS NSBP NPP NP NPWD %SBP %PP %P %PWD (blank) 3285 10 540 948 536 1375 426 29 16 42 13
A 9511 29 541 2396 1872 4190 1053 25 20 44 11
B 15775 49 545 2373 2536 7785 3081 15 16 49 20 10
C 3867 12 546 603 504 1808 952 16 13 47 25
(blank) 3382 10 540 962 552 1426 442 28 16 42 13
A 16088 50 543 3100 2843 7649 2496 19 18 48 16
B 12008 37 545 1931 1889 5748 2440 16 16 48 20 11
C 960 3 538 327 164 335 134 34 17 35 14
(blank) 3363 10 541 910 535 1424 494 27 16 42 15
A 2347 7 539 658 480 1011 198 28 20 43 8
B 6150 19 542 1353 1178 2889 730 22 19 47 12
C 15928 49 545 2499 2488 7729 3212 16 16 49 20
12
D 4650 14 543 900 767 2105 878 19 16 45 19
(blank) 3172 10 540 886 517 1343 426 28 16 42 13
A 23444 72 544 4069 3875 11142 4358 17 17 48 19
B 3623 11 542 809 632 1725 457 22 17 48 13
C 1292 4 540 340 243 550 159 26 19 43 12
13
D 907 3 541 216 181 398 112 24 20 44 12
(blank) 3249 10 540 912 539 1365 433 28 17 42 13
A 4665 14 541 1213 858 1935 659 26 18 41 14
B 12793 39 544 2311 2205 6043 2234 18 17 47 17
C 7151 22 546 906 1053 3664 1528 13 15 51 21
14
D 4580 14 542 978 793 2151 658 21 17 47 14
(blank) 3194 10 540 908 526 1343 417 28 16 42 13
A 17978 55 544 2911 2849 8781 3437 16 16 49 19
B 8921 28 543 1825 1655 4056 1385 20 19 45 16
C 1355 4 542 314 245 605 191 23 18 45 14
15
D 990 3 537 362 173 373 82 37 17 38 8
(blank) 3457 11 540 962 569 1473 453 28 16 43 13
A 2281 7 538 796 437 834 214 35 19 37 9
B 8657 27 542 1822 1665 3899 1271 21 19 45 15
C 11693 36 546 1492 1712 5997 2492 13 15 51 21
16
D 6350 20 543 1248 1065 2955 1082 20 17 47 17
(blank) 3368 10 540 951 566 1413 438 28 17 42 13
A 1890 6 538 624 373 717 176 33 20 38 9
B 10486 32 543 1992 1910 4933 1651 19 18 47 16
C 10493 32 545 1370 1593 5329 2201 13 15 51 21
17
D 6201 19 543 1383 1006 2766 1046 22 16 45 17
(blank) 3326 10 540 928 544 1407 447 28 16 42 13
A 11211 35 544 1827 1815 5467 2102 16 16 49 19
B 4355 13 540 1247 896 1804 408 29 21 41 9
C 10516 32 545 1622 1658 5123 2113 15 16 49 20
18
D 3030 9 542 696 535 1357 442 23 18 45 15
(blank) 3269 10 540 923 533 1385 428 28 16 42 13
A 15507 48 544 2685 2511 7500 2811 17 16 48 18
B 10624 33 544 1921 1833 5005 1865 18 17 47 18
C 2286 7 542 478 434 1029 345 21 19 45 15
19
D 752 2 536 313 137 239 63 42 18 32 8
SBP = Substantially Below Proficient; PP = Partially Proficient; P = Proficient; PWD = Proficient with Distinction.

Appendix L Student Questionnaire 2007-08 NECAP Technical Report 12
Table L-11. 2007-08 NECAP Average Scaled Score, and Counts and Percentages within Performance Levels, of Responses to Student Survey Questions 10-19 – Math: Grade 6
Question Resp NResp %Resp AvgSS NSBP NPP NP NPWD %SBP %PP %P %PWD (blank) 3754 11 639 1146 695 1384 529 31 19 37 14
A 9438 29 640 2301 2045 4025 1067 24 22 43 11
B 16189 49 644 2479 2741 7434 3535 15 17 46 22 10
C 3549 11 647 504 430 1453 1162 14 12 41 33
(blank) 3892 12 639 1183 720 1435 554 30 18 37 14
A 16046 49 643 3006 3015 7171 2854 19 19 45 18
B 12074 37 644 1942 2006 5380 2746 16 17 45 23 11
C 918 3 639 299 170 310 139 33 19 34 15
(blank) 3787 12 640 1110 699 1423 555 29 18 38 15
A 4029 12 642 872 761 1767 629 22 19 44 16
B 10434 32 644 1747 1832 4852 2003 17 18 47 19
C 13192 40 644 2364 2350 5634 2844 18 18 43 22
12
D 1488 5 641 337 269 620 262 23 18 42 18
(blank) 3683 11 639 1092 673 1377 541 30 18 37 15
A 23710 72 644 3964 4159 10572 5015 17 18 45 21
B 3645 11 641 865 709 1589 482 24 19 44 13
C 1178 4 640 316 227 470 165 27 19 40 14
13
D 714 2 640 193 143 288 90 27 20 40 13
(blank) 3812 12 639 1120 712 1417 563 29 19 37 15
A 4770 14 641 1215 847 1913 795 25 18 40 17
B 12029 37 644 2078 2185 5375 2391 17 18 45 20
C 7103 22 646 920 1146 3340 1697 13 16 47 24
14
D 5216 16 642 1097 1021 2251 847 21 20 43 16
(blank) 3779 11 639 1129 710 1399 541 30 19 37 14
A 17797 54 645 2709 2999 8146 3943 15 17 46 22
B 9376 28 642 1927 1830 4017 1602 21 20 43 17
C 1049 3 640 257 189 464 139 24 18 44 13
15
D 929 3 634 408 183 270 68 44 20 29 7
(blank) 4243 13 640 1216 804 1611 612 29 19 38 14
B 6331 19 641 1476 1311 2611 933 23 21 41 15
C 11542 35 645 1437 1904 5536 2665 12 16 48 23 16
D 9265 28 644 1645 1585 4080 1955 18 17 44 21
(blank) 4030 12 639 1195 759 1500 576 30 19 37 14
A 2519 8 640 688 492 978 361 27 20 39 14
B 10315 31 643 2075 1910 4472 1858 20 19 43 18
C 10248 31 645 1302 1718 4814 2414 13 17 47 24
17
D 5818 18 643 1170 1032 2532 1084 20 18 44 19
(blank) 4021 12 639 1174 763 1503 581 29 19 37 14
A 11489 35 644 1950 2023 5175 2341 17 18 45 20
B 5156 16 640 1337 1125 2129 565 26 22 41 11
C 9153 28 645 1252 1459 4203 2239 14 16 46 24
18
D 3111 9 642 717 541 1286 567 23 17 41 18
(blank) 4496 14 640 1261 826 1738 671 28 18 39 15
A 16512 50 644 2574 2812 7499 3627 16 17 45 22
B 9286 28 643 1840 1767 4065 1614 20 19 44 17
C 1938 6 641 461 379 780 318 24 20 40 16
19
D 698 2 635 294 127 214 63 42 18 31 9
SBP = Substantially Below Proficient; PP = Partially Proficient; P = Proficient; PWD = Proficient with Distinction.
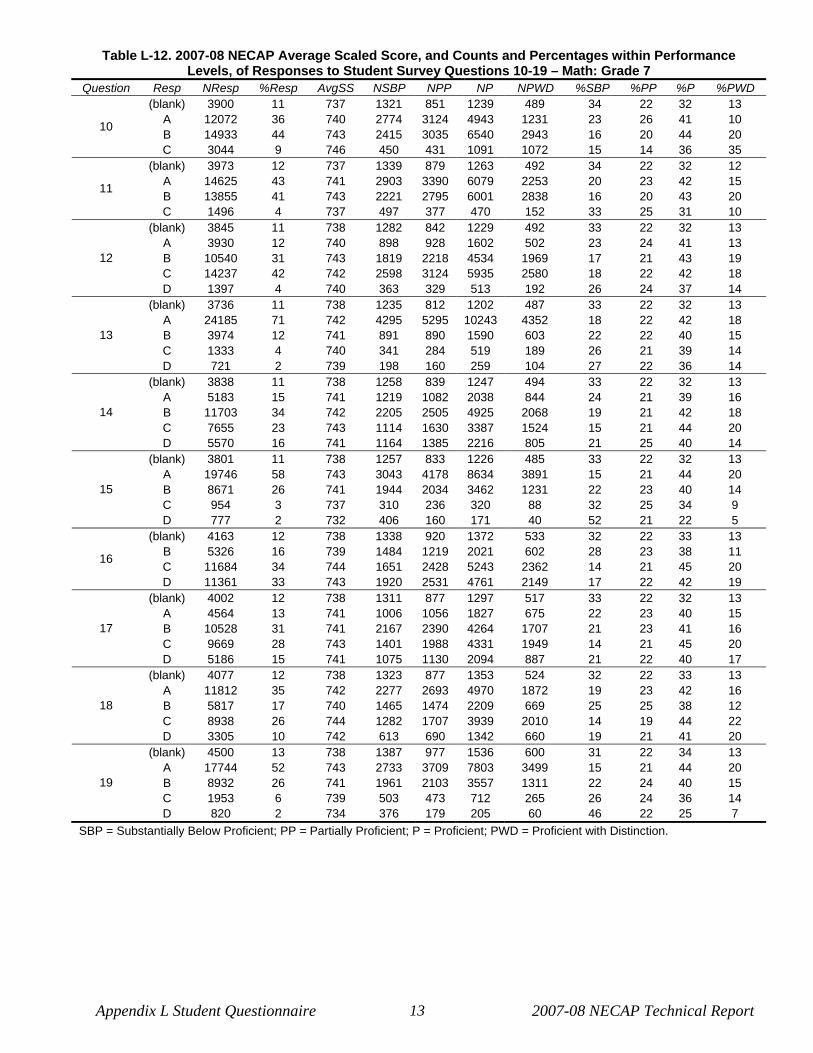
Appendix L Student Questionnaire 2007-08 NECAP Technical Report 13
Table L-12. 2007-08 NECAP Average Scaled Score, and Counts and Percentages within Performance Levels, of Responses to Student Survey Questions 10-19 – Math: Grade 7
Question Resp NResp %Resp AvgSS NSBP NPP NP NPWD %SBP %PP %P %PWD (blank) 3900 11 737 1321 851 1239 489 34 22 32 13
A 12072 36 740 2774 3124 4943 1231 23 26 41 10
B 14933 44 743 2415 3035 6540 2943 16 20 44 20 10
C 3044 9 746 450 431 1091 1072 15 14 36 35
(blank) 3973 12 737 1339 879 1263 492 34 22 32 12
A 14625 43 741 2903 3390 6079 2253 20 23 42 15
B 13855 41 743 2221 2795 6001 2838 16 20 43 20 11
C 1496 4 737 497 377 470 152 33 25 31 10
(blank) 3845 11 738 1282 842 1229 492 33 22 32 13
A 3930 12 740 898 928 1602 502 23 24 41 13
B 10540 31 743 1819 2218 4534 1969 17 21 43 19
C 14237 42 742 2598 3124 5935 2580 18 22 42 18
12
D 1397 4 740 363 329 513 192 26 24 37 14
(blank) 3736 11 738 1235 812 1202 487 33 22 32 13
A 24185 71 742 4295 5295 10243 4352 18 22 42 18
B 3974 12 741 891 890 1590 603 22 22 40 15
C 1333 4 740 341 284 519 189 26 21 39 14
13
D 721 2 739 198 160 259 104 27 22 36 14
(blank) 3838 11 738 1258 839 1247 494 33 22 32 13
A 5183 15 741 1219 1082 2038 844 24 21 39 16
B 11703 34 742 2205 2505 4925 2068 19 21 42 18
C 7655 23 743 1114 1630 3387 1524 15 21 44 20
14
D 5570 16 741 1164 1385 2216 805 21 25 40 14
(blank) 3801 11 738 1257 833 1226 485 33 22 32 13
A 19746 58 743 3043 4178 8634 3891 15 21 44 20
B 8671 26 741 1944 2034 3462 1231 22 23 40 14
C 954 3 737 310 236 320 88 32 25 34 9
15
D 777 2 732 406 160 171 40 52 21 22 5
(blank) 4163 12 738 1338 920 1372 533 32 22 33 13
B 5326 16 739 1484 1219 2021 602 28 23 38 11
C 11684 34 744 1651 2428 5243 2362 14 21 45 20 16
D 11361 33 743 1920 2531 4761 2149 17 22 42 19
(blank) 4002 12 738 1311 877 1297 517 33 22 32 13
A 4564 13 741 1006 1056 1827 675 22 23 40 15
B 10528 31 741 2167 2390 4264 1707 21 23 41 16
C 9669 28 743 1401 1988 4331 1949 14 21 45 20
17
D 5186 15 741 1075 1130 2094 887 21 22 40 17
(blank) 4077 12 738 1323 877 1353 524 32 22 33 13
A 11812 35 742 2277 2693 4970 1872 19 23 42 16
B 5817 17 740 1465 1474 2209 669 25 25 38 12
C 8938 26 744 1282 1707 3939 2010 14 19 44 22
18
D 3305 10 742 613 690 1342 660 19 21 41 20
(blank) 4500 13 738 1387 977 1536 600 31 22 34 13
A 17744 52 743 2733 3709 7803 3499 15 21 44 20
B 8932 26 741 1961 2103 3557 1311 22 24 40 15
C 1953 6 739 503 473 712 265 26 24 36 14
19
D 820 2 734 376 179 205 60 46 22 25 7
SBP = Substantially Below Proficient; PP = Partially Proficient; P = Proficient; PWD = Proficient with Distinction.

Appendix L Student Questionnaire 2007-08 NECAP Technical Report 14
Table L-13. 2007-08 NECAP Average Scaled Score, and Counts and Percentages within Performance Levels, of Responses to Student Survey Questions 10-19 – Math: Grade 8
Question Resp NResp %Resp AvgSS NSBP NPP NP NPWD %SBP %PP %P %PWD (blank) 3616 10 836 1353 840 1052 371 37 23 29 10
A 11608 33 837 3285 3313 4334 676 28 29 37 6
B 15972 45 842 2656 3467 7325 2524 17 22 46 16 10
C 3913 11 847 465 434 1511 1503 12 11 39 38
(blank) 3655 10 836 1365 858 1066 366 37 23 29 10
A 13961 40 840 3030 3464 5735 1732 22 25 41 12
B 15558 44 842 2658 3258 6853 2789 17 21 44 18 11
C 1935 6 836 706 474 568 187 36 24 29 10
(blank) 3508 10 836 1278 819 1048 363 36 23 30 10
A 4406 13 839 1085 1054 1794 473 25 24 41 11
B 11433 33 842 2029 2539 5035 1830 18 22 44 16
C 13934 40 841 2768 3188 5735 2243 20 23 41 16
12
D 1828 5 837 599 454 610 165 33 25 33 9
(blank) 3420 10 836 1242 792 1026 360 36 23 30 11
A 25875 74 841 4885 5923 11026 4041 19 23 43 16
B 3736 11 839 993 866 1420 457 27 23 38 12
C 1343 4 838 390 311 493 149 29 23 37 11
13
D 735 2 837 249 162 257 67 34 22 35 9
(blank) 3527 10 836 1273 816 1062 376 36 23 30 11
A 5309 15 840 1250 1203 2130 726 24 23 40 14
B 11200 32 841 2398 2646 4649 1507 21 24 42 13
C 8389 24 842 1407 1837 3684 1461 17 22 44 17
14
D 6684 19 841 1431 1552 2697 1004 21 23 40 15
(blank) 3495 10 836 1273 810 1038 374 36 23 30 11
A 21216 60 842 3422 4520 9403 3871 16 21 44 18
B 8373 24 839 2154 2248 3251 720 26 27 39 9
C 1110 3 835 429 287 328 66 39 26 30 6
15
D 915 3 831 481 189 202 43 53 21 22 5
(blank) 3749 11 836 1353 875 1131 390 36 23 30 10
A 1268 4 834 554 297 359 58 44 23 28 5
B 4590 13 838 1354 1227 1635 374 29 27 36 8
C 11797 34 842 2066 2742 5225 1764 18 23 44 15
16
D 13705 39 842 2432 2913 5872 2488 18 21 43 18
(blank) 3579 10 836 1314 833 1060 372 37 23 30 10
A 7421 21 841 1474 1593 3092 1262 20 21 42 17
B 12457 35 841 2518 2840 5263 1836 20 23 42 15
C 7570 22 841 1407 1807 3215 1141 19 24 42 15
17
D 4082 12 839 1046 981 1592 463 26 24 39 11
(blank) 3656 10 836 1308 866 1092 390 36 24 30 11
A 11928 34 841 2577 2735 4898 1718 22 23 41 14
B 5766 16 838 1539 1534 2174 519 27 27 38 9
C 9759 28 842 1566 2100 4391 1702 16 22 45 17
18
D 4000 11 842 769 819 1667 745 19 20 42 19
(blank) 3553 10 836 1298 833 1054 368 37 23 30 10
A 19051 54 842 3117 4221 8496 3217 16 22 45 17
B 9177 26 840 2238 2177 3609 1153 24 24 39 13
C 2390 7 838 687 591 830 282 29 25 35 12
19
D 938 3 833 419 232 233 54 45 25 25 6
SBP = Substantially Below Proficient; PP = Partially Proficient; P = Proficient; PWD = Proficient with Distinction.

Appendix L Student Questionnaire 2007-08 NECAP Technical Report 15
Table L-14. 2007-08 NECAP Average Scaled Score, and Counts and Percentages within Performance Levels, of Responses to Student Survey Questions 24-36 – Math: Grade 11
Question Resp NResp %Resp AvgSS NSBP NPP NP NPWD %SBP %PP %P %PWD (blank) 7714 23 1131 4033 1894 1692 95 52 25 22 1
A 2867 8 1125 2444 321 102 0 85 11 4 0
B 4732 14 1129 3377 1056 298 1 71 22 6 0
C 11709 35 1135 4523 4374 2779 33 39 37 24 0
D 5874 17 1140 1106 1535 2986 247 19 26 51 4
24
E 1011 3 1139 257 163 474 117 25 16 47 12
(blank) 7933 23 1131 4163 1959 1715 96 52 25 22 1
A 2550 8 1125 2010 384 155 1 79 15 6 0
B 2663 8 1127 2059 446 157 1 77 17 6 0
C 4152 12 1129 2995 923 231 3 72 22 6 0
D 10486 31 1135 3938 4213 2323 12 38 40 22 0
25
E 6123 18 1142 575 1418 3750 380 9 23 61 6
(blank) 8265 24 1131 4396 1989 1780 100 53 24 22 1
A 12964 38 1131 7203 3922 1828 11 56 30 14 0
B 8510 25 1135 3078 2645 2708 79 36 31 32 1 26
C 4168 12 1139 1063 787 2015 303 26 19 48 7
(blank) 8269 24 1131 4434 1987 1752 96 54 24 21 1
A 6542 19 1132 3437 1895 1176 34 53 29 18 1
B 12173 36 1136 4335 3492 4066 280 36 29 33 2 27
C 6923 20 1132 3534 1969 1337 83 51 28 19 1
(blank) 7806 23 1131 4096 1905 1711 94 52 24 22 1
A 5769 17 1133 2721 1747 1256 45 47 30 22 1
B 11026 33 1135 4182 3332 3327 185 38 30 30 2
C 7176 21 1134 3237 1931 1848 160 45 27 26 2
28
D 2130 6 1128 1504 428 189 9 71 20 9 0
(blank) 7911 23 1131 4147 1931 1735 98 52 24 22 1
A 12214 36 1133 6102 3224 2662 226 50 26 22 2
B 6085 18 1134 2623 1794 1590 78 43 29 26 1
C 4169 12 1135 1676 1235 1200 58 40 30 29 1
29
D 3528 10 1135 1192 1159 1144 33 34 33 32 1
(blank) 7965 23 1131 4184 1943 1742 96 53 24 22 1
A 4556 13 1133 2147 1308 1039 62 47 29 23 1
B 8747 26 1134 3916 2448 2232 151 45 28 26 2
C 6408 19 1135 2628 1843 1812 125 41 29 28 2
30
D 6231 18 1133 2865 1801 1506 59 46 29 24 1
(blank) 7975 24 1131 4193 1953 1732 97 53 24 22 1
A 18051 53 1136 6572 5597 5537 345 36 31 31 2
B 4805 14 1131 2725 1215 822 43 57 25 17 1
C 1441 4 1128 1009 296 133 3 70 21 9 0
31
D 1635 5 1126 1241 282 107 5 76 17 7 0
(blank) 8172 24 1131 4272 2003 1795 102 52 25 22 1
A 1994 6 1130 1242 462 286 4 62 23 14 0
B 3853 11 1130 2361 936 532 24 61 24 14 1
C 6637 20 1134 3017 1914 1611 95 45 29 24 1
32
D 13251 39 1136 4848 4028 4107 268 37 30 31 2
(blank) 8038 24 1131 4223 1972 1744 99 53 25 22 1
A 14320 42 1136 5248 4337 4428 307 37 30 31 2
B 6901 20 1133 3398 1940 1495 68 49 28 22 1
C 2852 8 1131 1658 740 444 10 58 26 16 0
33
D 1796 5 1129 1213 354 220 9 68 20 12 1
(blank) 8127 24 1131 4272 1987 1769 99 53 24 22 1
A 9724 29 1134 4382 2768 2452 122 45 28 25 1
B 4958 15 1132 2670 1338 910 40 54 27 18 1
C 7390 22 1135 2980 2178 2084 148 40 29 28 2
34
D 3708 11 1135 1436 1072 1116 84 39 29 30 2
(cont’d.)

Appendix L Student Questionnaire 2007-08 NECAP Technical Report 16
Question Resp NResp %Resp AvgSS NSBP NPP NP NPWD %SBP %PP %P %PWD (blank) 8053 24 1131 4241 1967 1746 99 53 24 22 1
A 12131 36 1134 5221 3634 3098 178 43 30 26 1
B 8517 25 1134 3668 2449 2263 137 43 29 27 2
C 3513 10 1133 1627 924 897 65 46 26 26 2
35
D 1693 5 1130 983 369 327 14 58 22 19 1
(blank) 8099 24 1131 4266 1973 1762 98 53 24 22 1
A 7109 21 1138 1824 1819 3146 320 26 26 44 5
B 10295 30 1134 4206 3394 2630 65 41 33 26 1
C 5670 17 1131 3428 1591 642 9 60 28 11 0
36
D 2734 8 1128 2016 566 151 1 74 21 6 0
SBP = Substantially Below Proficient; PP = Partially Proficient; P = Proficient; PWD = Proficient with Distinction.

Appendix L Student Questionnaire 2007-08 NECAP Technical Report 17
Table L-15. 2007-08 NECAP Average Scaled Score, and Counts and Percentages within Performance Levels, of Responses to Student Survey Questions 20-31 – Writing: Grade 5
Question Resp NResp %Resp AvgSS NSBP NPP NP NPWD %SBP %PP %P %PWD (blank) 3173 10 536 963 897 905 408 30 28 29 13
A 10878 34 540 2198 3241 3757 1682 20 30 35 15
B 14474 45 543 2174 4057 5398 2845 15 28 37 20
C 3573 11 540 741 1111 1167 554 21 31 33 16
20
D 183 1 526 105 45 26 7 57 25 14 4
(blank) 3196 10 537 954 904 926 412 30 28 29 13
A 16209 50 542 2757 4773 5832 2847 17 29 36 18
B 11897 37 542 2033 3384 4294 2186 17 28 36 18
C 830 3 531 338 260 186 46 41 31 22 6
21
D 149 0 522 99 30 15 5 66 20 10 3
(blank) 3189 10 536 964 909 911 405 30 29 29 13
A 23294 72 542 3789 6759 8510 4236 16 29 37 18
B 3783 12 540 851 1122 1252 558 22 30 33 15
C 1386 4 538 383 393 396 214 28 28 29 15
22
D 629 2 536 194 168 184 83 31 27 29 13
(blank) 3363 10 537 986 965 977 435 29 29 29 13
A 3864 12 538 1026 1198 1138 502 27 31 29 13
B 6760 21 541 1376 1967 2302 1115 20 29 34 16
C 14000 43 543 2003 3962 5274 2761 14 28 38 20
23
D 4294 13 541 790 1259 1562 683 18 29 36 16
(blank) 3856 12 537 1091 1109 1129 527 28 29 29 14
A 1526 5 533 584 483 356 103 38 32 23 7
B 3351 10 538 882 1031 1004 434 26 31 30 13
C 10547 33 542 1712 3048 3853 1934 16 29 37 18
24
D 13001 40 543 1912 3680 4911 2498 15 28 38 19
(blank) 3326 10 537 986 962 953 425 30 29 29 13
A 5597 17 539 1293 1676 1845 783 23 30 33 14
B 7292 23 541 1347 2166 2489 1290 18 30 34 18
C 12230 38 543 1789 3409 4633 2399 15 28 38 20
25
D 3836 12 540 766 1138 1333 599 20 30 35 16
(blank) 3385 10 537 1001 971 975 438 30 29 29 13
A 6411 20 540 1322 1973 2121 995 21 31 33 16
B 6269 19 540 1309 1832 2148 980 21 29 34 16
C 9348 29 543 1409 2597 3479 1863 15 28 37 20
26
D 6868 21 542 1140 1978 2530 1220 17 29 37 18
(blank) 3461 11 537 1001 992 1009 459 29 29 29 13
A 12972 40 544 1724 3519 4965 2764 13 27 38 21
B 7650 24 537 1913 2513 2458 766 25 33 32 10
C 2338 7 538 581 740 718 299 25 32 31 13
D 4745 15 545 651 1209 1775 1110 14 25 37 23
27
E 1115 3 536 311 378 328 98 28 34 29 9
(blank) 3451 11 536 1031 996 994 430 30 29 29 12
A 10139 31 544 1518 2727 3778 2116 15 27 37 21
B 6253 19 541 1257 1875 2109 1012 20 30 34 16
C 7088 22 541 1280 2135 2556 1117 18 30 36 16
28
D 5350 17 540 1095 1618 1816 821 20 30 34 15
(blank) 3424 11 537 1017 981 990 436 30 29 29 13
A 9845 30 541 1883 2785 3427 1750 19 28 35 18
B 5949 18 541 1126 1730 2033 1060 19 29 34 18
C 7031 22 542 1113 2058 2587 1273 16 29 37 18
29
D 6032 19 541 1042 1797 2216 977 17 30 37 16
(blank) 3513 11 537 1031 1018 1021 443 29 29 29 13
A 3586 11 540 807 1002 1165 612 23 28 32 17
B 3978 12 541 868 1082 1342 686 22 27 34 17
C 7300 23 543 1126 2065 2674 1435 15 28 37 20
30
D 13904 43 542 2349 4184 5051 2320 17 30 36 17
(cont’d.)

Appendix L Student Questionnaire 2007-08 NECAP Technical Report 18
Question Resp NResp %Resp AvgSS NSBP NPP NP NPWD %SBP %PP %P %PWD (blank) 3850 12 537 1095 1122 1122 511 28 29 29 13
A 6161 19 539 1296 1959 2107 799 21 32 34 13
B 2860 9 538 655 941 935 329 23 33 33 12
C 3018 9 540 632 888 1049 449 21 29 35 15
31
D 16392 51 543 2503 4441 6040 3408 15 27 37 21
SBP = Substantially Below Proficient; PP = Partially Proficient; P = Proficient; PWD = Proficient with Distinction.

Appendix L Student Questionnaire 2007-08 NECAP Technical Report 19
Table L-16. 2007-08 NECAP Average Scaled Score, and Counts and Percentages within Performance Levels, of Responses to Student Survey Questions 20-31 – Writing: Grade 8
Question Resp NResp %Resp AvgSS NSBP NPP NP NPWD %SBP %PP %P %PWD (blank) 3443 10 834 1174 1200 862 207 34 35 25 6
A 6993 20 837 1516 2852 2193 432 22 41 31 6
B 19148 55 841 2425 7538 7495 1690 13 39 39 9
C 5028 14 839 864 1982 1770 412 17 39 35 8
20
D 317 1 828 164 103 41 9 52 32 13 3
(blank) 3492 10 834 1167 1228 899 198 33 35 26 6
A 13578 39 840 2056 5471 5003 1048 15 40 37 8
B 15873 45 841 2136 6207 6082 1448 13 39 38 9
C 1706 5 832 627 676 350 53 37 40 21 3
21
D 280 1 825 157 93 27 3 56 33 10 1
(blank) 3500 10 834 1186 1222 893 199 34 35 26 6
A 26417 76 840 3546 10559 10135 2177 13 40 38 8
B 3211 9 837 830 1250 903 228 26 39 28 7
C 1285 4 836 382 465 327 111 30 36 25 9
22
D 516 1 832 199 179 103 35 39 35 20 7
(blank) 3586 10 834 1199 1263 928 196 33 35 26 5
A 3337 10 836 840 1354 944 199 25 41 28 6
B 7804 22 839 1289 3114 2797 604 17 40 36 8
C 15941 46 841 1986 6199 6275 1481 12 39 39 9
23
D 4261 12 838 829 1745 1417 270 19 41 33 6
(blank) 3783 11 834 1245 1346 982 210 33 36 26 6
A 1660 5 834 545 661 394 60 33 40 24 4
B 3831 11 837 909 1553 1157 212 24 41 30 6
C 13056 37 841 1760 5095 5023 1178 13 39 38 9
24
D 12599 36 841 1684 5020 4805 1090 13 40 38 9
(blank) 3592 10 834 1187 1270 924 211 33 35 26 6
A 5704 16 838 1209 2371 1762 362 21 42 31 6
B 6282 18 838 1182 2622 2114 364 19 42 34 6
C 11749 34 841 1556 4658 4524 1011 13 40 39 9
25
D 7602 22 841 1009 2754 3037 802 13 36 40 11
(blank) 3551 10 834 1195 1246 911 199 34 35 26 6
A 4714 13 837 1002 1984 1456 272 21 42 31 6
B 7333 21 839 1312 2977 2540 504 18 41 35 7
C 11589 33 841 1549 4462 4572 1006 13 39 39 9
26
D 7742 22 841 1085 3006 2882 769 14 39 37 10
(blank) 3537 10 834 1171 1248 914 204 33 35 26 6
A 12570 36 841 1537 4872 5025 1136 12 39 40 9
B 5972 17 834 1684 2800 1366 122 28 47 23 2
C 2823 8 836 652 1243 814 114 23 44 29 4
D 8562 25 844 701 2848 3894 1119 8 33 45 13
27
E 1465 4 835 398 664 348 55 27 45 24 4
(blank) 3628 10 834 1214 1278 929 207 33 35 26 6
A 11016 32 842 1260 4105 4489 1162 11 37 41 11
B 6983 20 839 1220 2750 2484 529 17 39 36 8
C 7459 21 839 1277 3122 2558 502 17 42 34 7
28
D 5843 17 838 1172 2420 1901 350 20 41 33 6
(blank) 3649 10 834 1217 1272 949 211 33 35 26 6
A 6799 19 838 1296 2748 2274 481 19 40 33 7
B 6435 18 839 1114 2588 2232 501 17 40 35 8
C 8721 25 840 1276 3370 3325 750 15 39 38 9
29
D 9325 27 841 1240 3697 3581 807 13 40 38 9
(blank) 3701 11 834 1232 1303 960 206 33 35 26 6
A 4612 13 840 726 1798 1711 377 16 39 37 8
B 5518 16 840 973 2054 2027 464 18 37 37 8
C 8429 24 840 1157 3286 3236 750 14 39 38 9
30
D 12669 36 839 2055 5234 4427 953 16 41 35 8
(cont’d.)
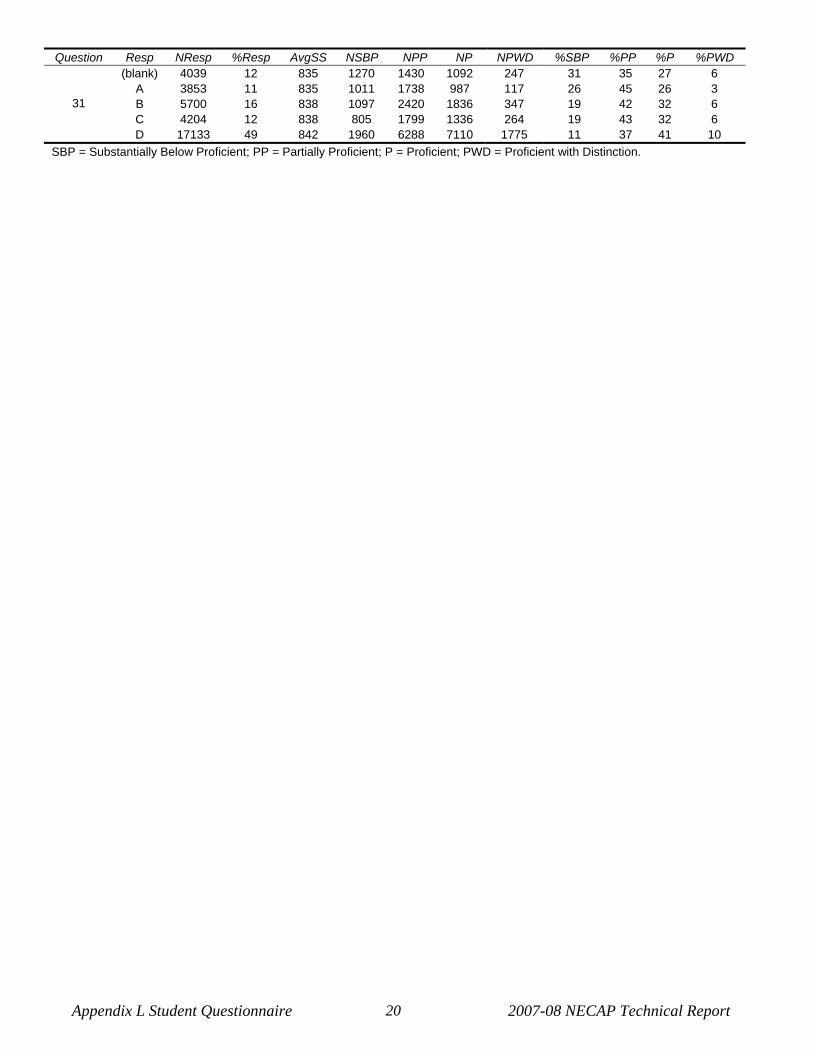
Appendix L Student Questionnaire 2007-08 NECAP Technical Report 20
Question Resp NResp %Resp AvgSS NSBP NPP NP NPWD %SBP %PP %P %PWD (blank) 4039 12 835 1270 1430 1092 247 31 35 27 6
A 3853 11 835 1011 1738 987 117 26 45 26 3
B 5700 16 838 1097 2420 1836 347 19 42 32 6
C 4204 12 838 805 1799 1336 264 19 43 32 6
31
D 17133 49 842 1960 6288 7110 1775 11 37 41 10
SBP = Substantially Below Proficient; PP = Partially Proficient; P = Proficient; PWD = Proficient with Distinction.

Appendix L Student Questionnaire 2007-08 NECAP Technical Report 21
Table L-17. 2007-08 NECAP Average Scaled Score, and Counts and Percentages within Performance Levels, of Responses to Student Survey Questions 1-12 – Writing: Grade 11
Question Resp NResp %Resp AvgSS NSBP NPP NP NPWD %SBP %PP %P %PWD (blank) 7494 22 5.3 1647 3456 2144 247 22 46 29 3
A 5770 17 4.7 1629 3056 1040 45 28 53 18 1
B 14455 43 5.8 1703 7510 4879 363 12 52 34 3 1
C 6167 18 6.6 498 2351 2863 455 8 38 46 7
(blank) 7518 22 5.3 1660 3471 2142 245 22 46 28 3
A 4958 15 5.5 761 2553 1534 110 15 51 31 2
B 15666 46 6 1740 7529 5819 578 11 48 37 4 2
C 5744 17 5.2 1316 2820 1431 177 23 49 25 3
(blank) 7432 22 5.3 1633 3429 2128 242 22 46 29 3
A 19557 58 5.8 2643 9685 6611 618 14 50 34 3
B 4072 12 5.7 623 1933 1369 147 15 47 34 4
C 2146 6 5.6 370 1019 665 92 17 47 31 4
3
D 679 2 4.8 208 307 153 11 31 45 23 2
(blank) 7537 22 5.3 1670 3477 2144 246 22 46 28 3
A 3460 10 5.7 573 1602 1152 133 17 46 33 4
B 6808 20 5.8 925 3219 2385 279 14 47 35 4
C 12715 38 5.8 1605 6298 4422 390 13 50 35 3
4
D 3366 10 5.1 704 1777 823 62 21 53 24 2
(blank) 7689 23 5.3 1708 3550 2186 245 22 46 28 3
A 3549 10 5.3 648 1872 959 70 18 53 27 2
B 3800 11 5.4 697 1956 1065 82 18 51 28 2
C 8476 25 5.8 1125 4123 2959 269 13 49 35 3
5
D 10372 31 5.9 1299 4872 3757 444 13 47 36 4
(blank) 8077 24 5.3 1812 3753 2262 250 22 46 28 3
A 1805 5 5.2 388 909 471 37 21 50 26 2
B 3931 12 5.6 624 1913 1268 126 16 49 32 3
C 10378 31 6 1180 4871 3942 385 11 47 38 4
6
D 9695 29 5.6 1473 4927 2983 312 15 51 31 3
(blank) 7570 22 5.3 1664 3490 2173 243 22 46 29 3
A 2758 8 5 705 1385 600 68 26 50 22 2
B 4670 14 5.4 843 2431 1293 103 18 52 28 2
C 9470 28 5.8 1222 4673 3273 302 13 49 35 3
7
D 9418 28 6 1043 4394 3587 394 11 47 38 4
(blank) 7410 22 5.3 1594 3418 2155 243 22 46 29 3
A 8645 26 5.8 1151 4259 2941 294 13 49 34 3
B 4488 13 4.8 1106 2500 842 40 25 56 19 1
C 1733 5 4.9 386 968 358 21 22 56 21 1
D 10033 30 6.3 804 4426 4317 486 8 44 43 5
8
E 1577 5 4.8 436 802 313 26 28 51 20 2
(blank) 7563 22 5.3 1672 3487 2161 243 22 46 29 3
A 8455 25 6 927 3938 3243 347 11 47 38 4
B 5636 17 5.7 804 2790 1874 168 14 50 33 3
C 6493 19 5.6 980 3334 1995 184 15 51 31 3
9
D 5739 17 5.4 1094 2824 1653 168 19 49 29 3
(blank) 7673 23 5.3 1706 3537 2182 248 22 46 28 3
A 4907 14 5.5 871 2444 1469 123 18 50 30 3
B 4961 15 5.6 769 2443 1592 157 16 49 32 3
C 6925 20 5.8 913 3409 2371 232 13 49 34 3
10
D 9420 28 5.8 1218 4540 3312 350 13 48 35 4
(blank) 7757 23 5.3 1734 3581 2198 244 22 46 28 3
A 2845 8 5.8 437 1262 1026 120 15 44 36 4
B 3849 11 5.8 516 1852 1326 155 13 48 34 4
C 6370 19 5.9 816 3094 2242 218 13 49 35 3
11
D 13065 39 5.6 1974 6584 4134 373 15 50 32 3
(cont’d.)

Appendix L Student Questionnaire 2007-08 NECAP Technical Report 22
Question Resp NResp %Resp AvgSS NSBP NPP NP NPWD %SBP %PP %P %PWD (blank) 7846 23 5.3 1739 3621 2237 249 22 46 29 3
A 1493 4 4.8 400 762 314 17 27 51 21 1
B 7718 23 5.8 1001 3901 2585 231 13 51 33 3
C 4204 12 5.5 748 2064 1242 150 18 49 30 4
12
D 12625 37 5.9 1589 6025 4548 463 13 48 36 4
SBP = Substantially Below Proficient; PP = Partially Proficient; P = Proficient; PWD = Proficient with Distinction.

Appendix L Student Questionnaire 2007-08 NECAP Technical Report 23
Grades 3 – 8 NECAP Student Questionnaire Reading Questions 1. How difficult was the reading test?
A. harder than my regular reading schoolwork B. about the same as my regular reading schoolwork C. easier than my regular reading schoolwork
2. How interesting were the reading passages?
A. All of the passages were interesting to me. B. Most of the passages were interesting to me. C. Most of the passages were not interesting to me. D. None of the passages were interesting to me.
3. How hard did you try on the reading test?
A. I tried harder on this test than I do on my regular reading schoolwork. B. I tried about the same as I do on my regular reading schoolwork. C. I did not try as hard on this test as I do on my regular reading schoolwork.
4. How difficult were the reading passages on the test?
A. Most of the passages were more difficult than what I normally read for school. B. Most of the passages were about the same as what I normally read for school. C. Most of the passages were easier than what I normally read for school.
5. Did you have enough time to answer all of the questions on the reading test?
A. I had enough time to answer all of the questions and check my work. B. I had enough time to answer all of the questions, but I did not have time to check my work. C. I felt rushed, but I was able to answer all of the questions. D. I did not have enough time to answer all of the questions.
6. How often do you have Language Arts/Reading homework? A. almost every day B. a few times a week C. a few times a month D. I usually don’t have homework in Language Arts/Reading.
7. When I am reading and come to a word I do not know, I usually
A. figure it out myself. B. ask someone what the word is. C. skip the word. D. stop reading.
8. How often do you choose to read in your free time?
A. almost every day B. a few times a week C. a few times a month D. I almost never read.
9. How do you most often find information about things that interest you? A. I use a computer. B. I look in books, magazines, or newspapers. C. I ask someone. D. I watch TV or videos.

Appendix L Student Questionnaire 2007-08 NECAP Technical Report 24
Mathematics Questions 10. How difficult was the mathematics test?
A. harder than my regular mathematics schoolwork B. about the same as my regular mathematics schoolwork C. easier than my regular mathematics schoolwork
11. How hard did you try on the mathematics test?
A. I tried harder on this test than I do on my regular mathematics schoolwork. B. I tried about the same as I do on my regular mathematics schoolwork. C. I did not try as hard on this test as I do on my regular mathematics schoolwork.
12. How much did you use a calculator on the test?
A. If it was allowed, I used it on most questions. B. If it was allowed, I used it on some questions. C. I didn’t use it on very many questions. D. I didn’t have a calculator.
13. Did you have enough time to answer all of the questions on the mathematics test?
A. I had enough time to answer all of the questions and check my work. B. I had enough time to answer all of the questions, but I did not have time to check my work. C. I felt rushed, but I was able to answer all of the questions. D. I did not have enough time to answer all of the questions.
14. How often do you work with other students in small groups on problem-solving in mathematics class?
A. almost every day B. a few times a week C. a few times a month D. never or almost never
15. How often do you have mathematics homework?
A. almost every day B. a few times a week C. a few times a month D. I usually don’t have homework in mathematics.
16. How often do you use hands-on materials such as base-ten blocks, cubes, rods, counters, geoboards, and tangrams in mathematics class?
A. almost every day B. a few times a week C. a few times a month D. a few times a year or less
17. How often do you use a calculator in mathematics class?
A. almost every day B. a few times a week C. a few times a month D. a few times a year or less
18. How do you spend most of your time in mathematics class? A. I work by myself. B. I work in small groups. C. I do some work myself and some in small groups. D. The whole class works together.
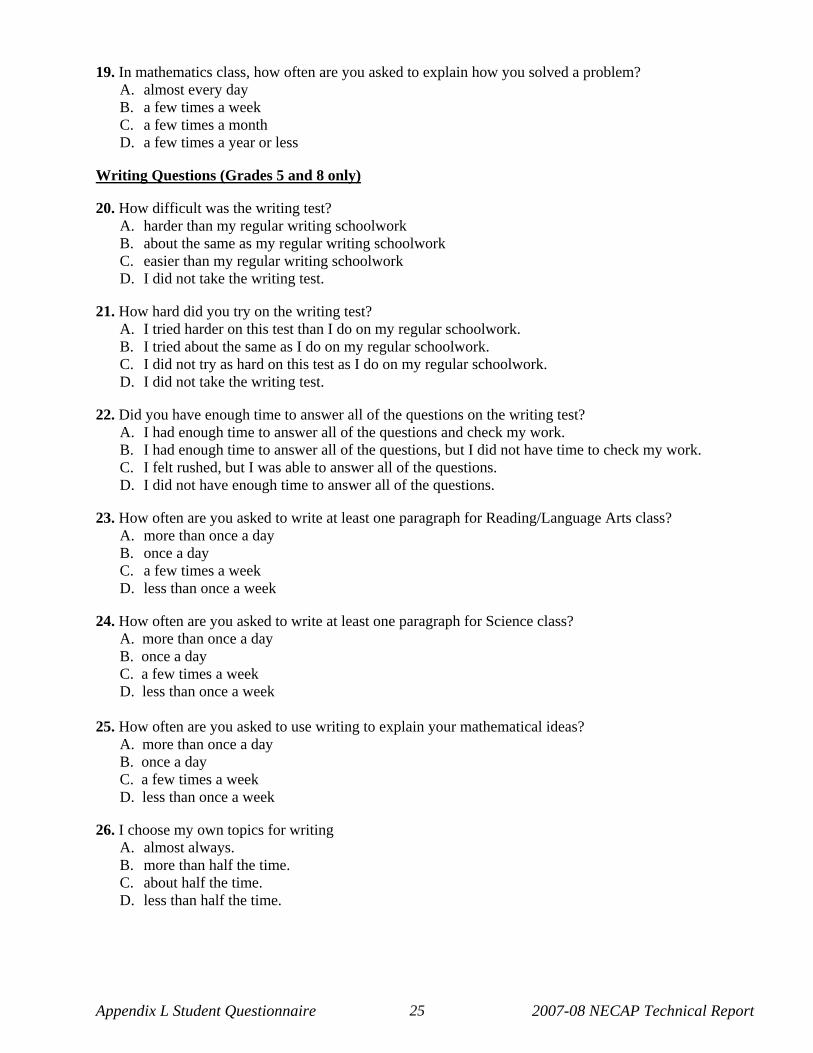
Appendix L Student Questionnaire 2007-08 NECAP Technical Report 25
19. In mathematics class, how often are you asked to explain how you solved a problem?
A. almost every day B. a few times a week C. a few times a month D. a few times a year or less
Writing Questions (Grades 5 and 8 only) 20. How difficult was the writing test?
A. harder than my regular writing schoolwork B. about the same as my regular writing schoolwork C. easier than my regular writing schoolwork D. I did not take the writing test.
21. How hard did you try on the writing test?
A. I tried harder on this test than I do on my regular schoolwork. B. I tried about the same as I do on my regular schoolwork. C. I did not try as hard on this test as I do on my regular schoolwork. D. I did not take the writing test.
22. Did you have enough time to answer all of the questions on the writing test?
A. I had enough time to answer all of the questions and check my work. B. I had enough time to answer all of the questions, but I did not have time to check my work. C. I felt rushed, but I was able to answer all of the questions. D. I did not have enough time to answer all of the questions.
23. How often are you asked to write at least one paragraph for Reading/Language Arts class?
A. more than once a day B. once a day C. a few times a week D. less than once a week
24. How often are you asked to write at least one paragraph for Science class?
A. more than once a day B. once a day C. a few times a week D. less than once a week
25. How often are you asked to use writing to explain your mathematical ideas?
A. more than once a day B. once a day C. a few times a week D. less than once a week
26. I choose my own topics for writing
A. almost always. B. more than half the time. C. about half the time. D. less than half the time.

Appendix L Student Questionnaire 2007-08 NECAP Technical Report 26
27. I know how to revise my writing to improve it A. on my own. B. with my teacher's help. C. with help from my family or friends. D. by using all of the above. E. but I rarely revise my writing.
28. I write more than one draft
A. almost always. B. more than half the time. C. about half the time. D. less than half the time.
29. I discuss my rough drafts with the teacher
A. almost always. B. more than half the time. C. about half the time. D. less than half the time.
30. I discuss my rough drafts with other students
A. almost always. B. more than half the time. C. about half the time. D. less than half the time.
31. What kinds of writing do you do most in school?
A. I mostly write stories. B. I mostly write reports. C. I mostly write about things I’ve read. D. I do all kinds of writing.
Thank you very much for all of your hard work during testing and for answering these questions.

Appendix L Student Questionnaire 2007-08 NECAP Technical Report 27
Grade 11 NECAP Student Questionnaire Writing Questions 1. How difficult was the writing test?
E. harder than my regular writing schoolwork F. about the same as my regular writing schoolwork G. easier than my regular writing schoolwork
2. How hard did you try on the writing test?
E. I tried harder on this test than I do on my regular schoolwork. F. I tried about the same as I do on my regular schoolwork. G. I did not try as hard on this test as I do on my regular schoolwork.
3. Did you have enough time to complete the prompts on the writing test?
E. I had enough time to complete the prompts and check my work. F. I had enough time to complete the prompts, but I did not have time to check my work. G. I felt rushed, but I was able to complete the prompts. H. I did not have enough time to complete the prompts.
4. How often are you asked to write at least one paragraph in English class?
E. more than once a day F. once a day G. a few times a week H. less than once a week
5. How often are you asked to use writing to explain your mathematical ideas?
A. more than once a day B. once a day C. a few times a week D. less than once a week
6. How often are you asked to write at least one paragraph in Science class?
A. more than once a day B. once a day C. a few times a week D. less than once a week
7. I choose my own topics for writing
E. almost always. F. more than half the time. G. about half the time. H. less than half the time.
8. I know how to revise my writing to improve it
F. on my own. G. with my teacher's help. H. with help from my family or friends. I. by using all of the above. J. but I rarely revise my writing.
9. I write more than one draft
A. almost always. B. more than half the time. C. about half the time. D. less than half the time.

Appendix L Student Questionnaire 2007-08 NECAP Technical Report 28
10. I discuss my rough drafts with the teacher A. almost always. B. more than half the time. C. about half the time. D. less than half the time.
11. I discuss my rough drafts with other students
E. almost always. F. more than half the time. G. about half the time. H. less than half the time.
12. What kinds of writing do you do most in school?
E. I mostly write narratives/poems. F. I mostly write reports/persuasive pieces. G. I mostly write about things I’ve read. H. I do all kinds of writing.
Reading Questions 13. How difficult was the reading test?
A. harder than my regular reading work B. about the same as my regular reading work C. easier than my regular reading work
14. How interesting were the reading passages?
A. All of the passages were interesting to me. B. Most of the passages were interesting to me. C. Most of the passages were not interesting to me. D. None of the passages were interesting to me.
15. How hard did you try on the reading test?
D. I tried harder on this test than I do on my regular reading work. E. I tried about the same as I do on my regular reading work. F. I did not try as hard on this test as I do on my regular reading work.
16. How difficult were the reading passages on the test?
D. Most of the passages were more difficult than what I normally read for school. E. Most of the passages were about the same as what I normally read for school. F. Most of the passages were easier than what I normally read for school.
17. Did you have enough time to answer all of the questions on the reading test?
E. I had enough time to answer all of the questions and check my work. F. I had enough time to answer all of the questions, but I did not have time to check my work. G. I felt rushed, but I was able to answer all of the questions. H. I did not have enough time to answer all of the questions.
18. How often do you have reading homework in English class?
E. almost every day F. a few times a week G. a few times a month H. I usually don’t have reading homework in English class.

Appendix L Student Questionnaire 2007-08 NECAP Technical Report 29
19. How often do you have reading homework in other subject areas? A. almost every day B. a few times a week C. a few times a month D. I usually don’t have reading homework in other subject areas.
20. How do you most often learn new vocabulary words?
E. I am taught new vocabulary words in most of my courses. F. I am taught new vocabulary words mostly in my English class. G. I learn new vocabulary words on my own using a dictionary or computer. H. I rarely learn new vocabulary words.
21. How often do you choose to read in your free time?
E. almost every day F. a few times a week G. a few times a month H. I almost never read.
22. How do you most often find information about things that interest you?
A. I use a computer. B. I look in books, magazines, or newspapers. C. I ask someone. D. I watch TV or videos.
23. What grade did you receive in the last English course you completed?
A. A B. B C. C D. lower than C
Mathematics Questions 24. What best describes the last mathematics course you completed?
D. General Math or Pre-Algebra E. Algebra I or Integrated Mathematics I F. Geometry or Integrated Mathematics II G. Algebra II or Integrated Mathematics III H. Pre-Calculus/Advanced Mathematics or Higher
25. What best describes the mathematics course you are currently taking or will be taking this year?
A. General Math or Pre-Algebra B. Algebra I or Integrated Mathematics I C. Geometry or Integrated Mathematics II D. Algebra II or Integrated Mathematics III E. Pre-Calculus/Advanced Mathematics or Higher
26. How difficult was the mathematics test compared to your current or most recent mathematics class?
A. more difficult B. about the same C. less difficult
27. How hard did you try on the mathematics test compared to your current or most recent mathematics
class? D. I tried harder on this test. E. I tried about the same. F. I did not try as hard on this test.

Appendix L Student Questionnaire 2007-08 NECAP Technical Report 30
28. How much did you use a calculator on the test? E. When it was allowed, I used it on most questions. F. When it was allowed, I used it on some questions. G. I didn’t use it on very many questions. H. I didn’t have a calculator.
29. Did you have enough time to answer all of the questions on the mathematics test? E. I had enough time to answer all of the questions and check my work. F. I had enough time to answer all of the questions, but I did not have time to check my work. G. I felt rushed, but I was able to answer all of the questions. H. I did not have enough time to answer all of the questions.
30. How often do you work in groups with other students on problem solving tasks in mathematics?
E. almost every day F. a few times a week G. a few times a month H. never or almost never
31. How often do you have mathematics homework assignments?
E. almost every day F. a few times a week G. a few times a month H. I usually don’t have homework in mathematics.
32. How often do you use hands-on materials such as algebra tiles or blocks, geoboards, geometric
solids, or software applications such as spreadsheets in mathematics class? E. almost every day F. a few times a week G. a few times a month H. a few times a year or less
33. How often do you use a calculator in mathematics class?
E. almost every day F. a few times a week G. a few times a month H. a few times a year or less
34. How do you spend most of your time in mathematics class?
E. I work by myself. F. I work in small groups. G. I do some work myself and some in small groups. H. The whole class works together.
35. In mathematics class, how often are you asked to explain how you solved a problem?
E. almost every day F. a few times a week G. a few times a month H. a few times a year or less
36. What grade did you receive in the last mathematics course you completed?
A. A B. B C. C D. lower than C
Thank you very much for all of your hard work during testing and for answering these questions.

Appendix M Sample Reports 2007-08 NECAP Technical Report 505
APPENDIX M—SAMPLE REPORTS

Technical Report — Appendix M: Sample Reports
Report Grades Available Teaching Year & Testing Year
Sample Report Included
Student Report 3-8, 11 No Grade 5 & 11, testing year
Item Analysis: Reading 3-8, 11 Yes Grade 11,
testing year Item Analysis: Mathematics 3-8, 11 Yes Grade 5,
testing year Item Analysis:
Writing 5, 8, 11 Yes Grade 5 & 11, testing year
School Results Report 3-8, 11 Yes Grade 11,
testing year School Summary
Report One summary of all grades in a school Yes All grades, testing
year District Results
Report 3-8, 11 Yes Grade 5, testing year
District Summary Report
One summary of all grades in a school Yes All grades, testing
year

NECAP Student Report - Fall 2007This report contains results from the Fall 2007 New England Common Assessment Program (NECAP) tests. The NECAP tests are administered to students in New Hampshire, Rhode Island, and Vermont as part of each state’s statewide assessment program. The NECAP tests are designed to measure student performance on grade level expectations (GLE) developed and adopted by the three states. Specifi cally, the tests are designed to measure the content and skills that students are expected to have as they begin the current enrolled grade. In other words, content and skills which students have learned
through the end of the previous grade. NECAP test results are used primarily for school improvement and accountability. Achievement
level results are used in the state accountability system required under No Child Left Behind. More detailed school and district results are used by schools to help improve curriculum and instruction. Individual student
results are used to support information gathered through classroom instruction and assessments. Contact the school for more information on this student’s overall achievement.
Achievement Levels and Corresponding Score Ranges Student performance on the NECAP tests is classifi ed into one of four achievement levels describing students’ level of profi ciency on the content and skills required through the end of the previous grade. Performance at Profi cient or Profi cient with Distinction indicates that the student has a level of profi ciency necessary to begin working successfully on current grade content and skills. Performance below Profi cient suggests that additional instruction and student work may be needed on the previous grade content and skills as the student is introduced to new content and skills at the current grade. Refer to the Achievement Level Descriptions contained in this report for a more detailed description of the achievement levels. There is a wide range of student profi ciency within each achievement level. NECAP test results are also reported as scaled scores to provide additional information about the location of student performance within each achievement level. NECAP scores are reported as three-digit scores in which the fi rst digit represents the grade level. The remaining digits range from 00 to 80. Scores of 40 and higher indicate a level of profi ciency at or above the Profi cient level. Scores below 40 indicate profi ciency below the Profi cient level. For example, scores of 340 at grade 3, 540 at grade 5, and 740 at grade 7 each indicate Profi cient performance at each grade level.
Comparisons to Other Beginning of Grade Students The tables in the middle section of the report provide the percentage of students performing at each achievement level in the student’s school, district, and statewide. Note that one or two students can have a large impact on percentages in small schools and districts. Results are not reported for schools or districts with nine (9) or fewer students.
Performance in Content Area Subcategories This section of the report provides information about student performance on sets of items measuring particular content and skills within each test. These results can provide a general idea of relative strengths and weaknesses in comparison to other students. However, results in this section are based on small numbers of test items and should be interpreted cautiously.
Students at Profi cient Level This column shows the average performance on these items of students who performed near the beginning of the Profi cient achievement level on the overall test. Students whose performance in a category falls within the range shown performed similarly to those students. This comparison can provide some information about the level of performance needed to perform at the Profi cient level.
Comments about this student’s writing performance Students in grades 5 and 8 took the NECAP writing test which included a writing prompt that required students to produce a written response up to three pages long. Student responses were scored independently by two scorers. Each scorer was able to choose up to three comments from a prepared list to provide feedback about each student’s performance on the writing prompt. If both scorers selected the same comment, it is listed only once.
Achievement Level DescriptionsProfi cient with Distinction (Level 4) - Students performing at this level demonstrate the prerequisite knowledge and skills needed to
participate and excel in instructional activities aligned with the GLE at the current grade level. Errors made by these students are few and minor and do not refl ect gaps in prerequisite knowledge and skills.
Profi cient (Level 3) - Students performing at this level demonstrate minor gaps in the prerequisite knowledge and skills needed to participate and perform successfully in instructional activities aligned with the GLE at the current grade level. It is likely that any gaps in prerequisite knowledge and skills demonstrated by these students can be addressed during the course of typical classroom instruction.
Partially Profi cient (Level 2) - Students performing at this level demonstrate gaps in prerequisite knowledge and skills needed to participate and perform successfully in instructional activities aligned with the GLE at the current grade level. Additional instructional support may be necessary for these students to meet grade level expectations.
Substantially Below Profi cient (Level 1) - Students performing at this level demonstrate extensive and signifi cant gaps in prerequisite knowledge and skills needed to participate and perform successfully in instructional activities aligned with the GLE at the current grade level. Additional instructional support is necessary for these students to meet grade level expectations.

Content Area Achievement LevelScaled Score
This Student’s Achievement Level and Score
Reading
Content Area Achievement LevelScaled Score
This Student’s Achievement Level and Score
Mathematics
Content Area Achievement LevelScaled Score
This Student’s Achievement Level and Score
Writing
ReadingReading Possible Points
Student
Average Points Earned
School District StateStudents at Profi cient
Level
Word ID/ Vocabulary 9
Type of Text*
Literary 22
Informational 21
Level ofComprehension*
Initial Understanding 19
Analysis and Interpretation 24
Student Grade05
School District State
MathematicsMathematics Possible Points
Student
Average Points Earned
School District StateStudents at Profi cient
Level
Numbers and Operations
30
Geometry and Measurement
13
Functions and Algebra
13
Data, Statistics, and Probability
10
This Student’s Performance in Content Area SubcategoriesThis Student’s Performance in Content Area Subcategories
This Student’s Achievement Level Compared to Other This Student’s Achievement Level Compared to Other Beginning of Grade Beginning of Grade X5 Students by School, District, and State Students by School, District, and State
Comments about this student’s writing performance:
WritingWriting Possible Points
Student
Average Points Earned
School District StateStudents at Profi cient
Level
Structures of Language & Writing Conventions
10
Short Responses 12
Extended Response 15
*With the exception of Word ID/Vocabulary items, reading items are reported in two ways - Type of Text and Level of Comprehension.
000-000-0000012/13/2007
Reading Mathematics WritingStudent School District State Student School District State Student School District State
Profi cient with Distinction
Profi cient
Partially Profi cient
Substantially Below Profi cient
DistinctionProficient
500 530 540
Below Partial
580
DistinctionProficientBelow Partial
500
DistinctionProficient
533 540 580554
Partial
500 528 540 580555
Fall 2007 - Beginning of Grade 5 NECAP Test Results
Interpretation of Graphic DisplayThe line (I) represents the student’s score. The bar ( ) surrounding the score represents the probable range of scores for the student if he or she
were to be tested many times. This statistic is called the standard error of measurement. See the reverse side for the achievement level descriptions.
Below
556

NECAP Student Report - Fall 2007This report contains results from the Fall 2007 New England Common Assessment Program (NECAP) tests. The NECAP tests are administered to students in New Hampshire, Rhode Island, and Vermont as part of each state’s statewide assessment program. The NECAP tests are designed to measure student performance on grade span expectations (GSE) developed and adopted by the three states. Specifi cally, the tests are designed to measure the content and skills that students are expected to have as they begin the current enrolled grade. In other words, content and skills which students have learned through the
end of the previous grade. NECAP test results are used primarily for school improvement and accountability. Achievement
level results are used in the state accountability system required under No Child Left Behind. More detailed school and district results are used by schools to help improve curriculum and instruction. Individual student
results are used to support information gathered through classroom instruction and assessments. Contact the school for more information on this student’s overall achievement.
Achievement Levels and Corresponding Score Ranges Student performance on the NECAP tests is classifi ed into one of four achievement levels describing students’ level of profi ciency on the content and skills required through the end of the previous grade. Performance at Profi cient or Profi cient with Distinction indicates that the student has a level of profi ciency necessary to begin working successfully on current grade content and skills. Performance below Profi cient suggests that additional instruction and student work may be needed on the previous grade content and skills as the student is introduced to new content and skills at the current grade. Refer to the Achievement Level Descriptions contained in this report for a more detailed description of the achievement levels. There is a wide range of student profi ciency within each achievement level. NECAP test results are also reported as scaled scores to provide additional information about the location of student performance within each achievement level. Grade 11 NECAP scores are reported as four-digit scores in which the fi rst two digits represent the grade level. The remaining digits range from 00 to 80. Scores of 40 and higher indicate a level of profi ciency at or above the Profi cient level. Scores below 40 indicate profi ciency below the Profi cient level. For example, a score of 1140 indicates Profi cient performance at the grade level. Because writing scores are based on a single writing prompt, a raw score is reported instead of a scaled score.
Comparisons to Other Beginning of Grade Students The tables in the middle section of the report provide the percentage of students performing at each achievement level in the student’s school, district, and statewide. Note that one or two students can have a large impact on percentages in small schools and districts. Results are not reported for schools or districts with nine (9) or fewer students.
Performance in Content Area Subcategories This section of the report provides information about student performance on sets of items measuring particular content and skills within each test. These results can provide a general idea of relative strengths and weaknesses in comparison to other students. However, results in this section are based on small numbers of test items and should be interpreted cautiously.
Students at Profi cient Level This column shows the average performance on these items of students who performed near the beginning of the Profi cient achievement level on the overall test. Students whose performance in a category falls within the range shown performed similarly to those students. This comparison can provide some information about the level of performance needed to perform at the Profi cient level.
Comments about this student’s writing performance Students in grade 11 took the NECAP writing test which required students to produce a written response up to three pages long. Student responses were scored independently by two scorers. Each scorer was able to choose up to three comments from a prepared list to provide feedback about each student’s performance on the writing prompt. If both scorers selected the same comment, it is listed only once.
Achievement Level DescriptionsProfi cient with Distinction (Level 4) - Students performing at this level demonstrate the prerequisite knowledge and skills needed to
participate and excel in instructional activities aligned with the grade 9-10 GSEs. Errors made by these students are few and minor and do not refl ect gaps in prerequisite knowledge and skills.
These students are prepared to perform successfully in classroom instruction aligned with grade 11-12 expectations.
Profi cient (Level 3) - Students performing at this level demonstrate minor gaps in the knowledge and skills needed to participate and perform successfully in instructional activities aligned with the grade 9-10 GSEs.
It is likely that any gaps in the prerequisite knowledge and skills demonstrated by these students can be addressed by the classroom teacher during the course of classroom instruction aligned with grade 11-12 expectations.
Partially Profi cient (Level 2) - Students performing at this level demonstrate gaps in the knowledge and skills needed to participate and perform successfully in instructional activities aligned with the grade 9-10 GSEs.
Additional instructional support may be necessary for these students to perform successfully in courses aligned with grade 11-12 expectations.
Substantially Below Profi cient (Level 1) - Students performing at this level demonstrate extensive and signifi cant gaps in the prerequisite knowledge and skills needed to participate and perform successfully in instructional activities aligned with the grade 9-10 GSEs.
Additional instruction and support is necessary for these students to meet the grade 9-10 GSEs.

ReadingReading Possible Points
Student
Average Points Earned
School District StateStudents at Profi cient
Level
Word ID/ Vocabulary 10
Type of Text*
Literary 21
Informational 21
Level ofComprehension*
Initial Understanding 18
Analysis and Interpretation 24
Student Grade11
School District State
MathematicsMathematics Possible Points
Student
Average Points Earned
School District StateStudents at Profi cient
Level
Numbers and Operations
10
Geometry and Measurement
19
Functions and Algebra
25
Data, Statistics, and Probability
10
This Student’s Performance in Content Area SubcategoriesThis Student’s Performance in Content Area Subcategories
This Student’s Achievement Level Compared to Other This Student’s Achievement Level Compared to Other Beginning of Grade Beginning of Grade 1111 Students by School, District, and State Students by School, District, and State
000-000-000001/24/2008
Reading Mathematics WritingStudent School District State Student School District State Student School District State
Profi cient with Distinction
Profi cient
Partially Profi cient
Substantially Below Profi cient
Fall 2007 - Beginning of Grade 11 NECAP Test Results
Interpretation of Graphic DisplayThe line (I) represents the student’s score. The bar ( ) surrounding the score represents the probable range of scores for the student if he or she
were to be tested many times. This statistic is called the standard error of measurement. See the reverse side for the achievement level descriptions.
WritingWriting Possible Points
Student
Average Points Earned
School District StateStudents at Profi cient
Level
Extended Response
12
Comments about this student’s writing performance:
Content Area Achievement LevelScaled Score
This Student’s Achievement Level and Score
Reading
Content Area Achievement LevelScaled Score
This Student’s Achievement Level and Score
Mathematics
Content Area Achievement LevelScaled Score
This Student’s Achievement Level and Score
Writing
DistinctionProficient
1100 1130 1140
Below Partial
1180
DistinctionProficientBelow Partial
1100
DistinctionProficient
1134 1140 11801152
Partial
2 4 7 1210
Below
1154
*With the exception of Word ID/Vocabulary items, reading items are reported in two ways - Type of Text and Level of Comprehension.
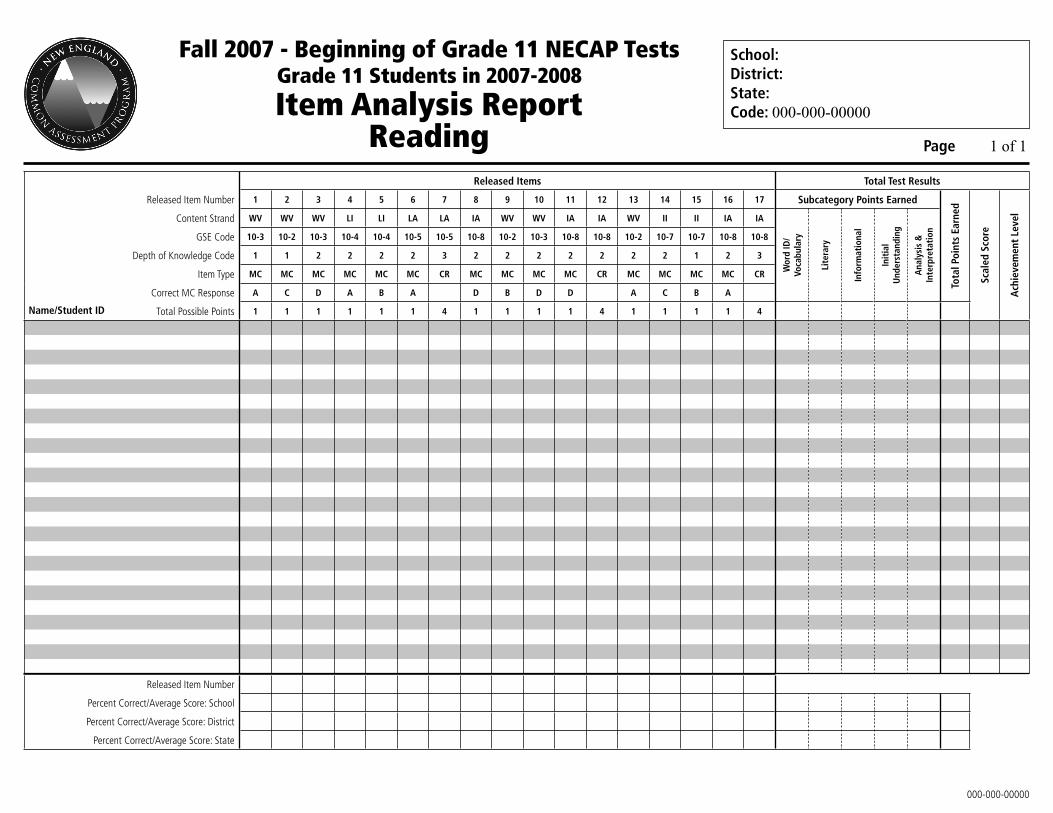
School: District: State: Code: 000-000-00000
Page 1 of 1
Fall 2007 - Beginning of Grade 11 NECAP TestsGrade 11 Students in 2007-2008
Item Analysis ReportReading
000-000-00000
Released Item Number
Percent Correct/Average Score: School
Percent Correct/Average Score: District
Percent Correct/Average Score: State
Name/Student ID
Released Items Total Test Results
Released Item Number 1
WV
10-3
1
MC
A
1
2
WV
10-2
1
MC
C
1
3
WV
10-3
2
MC
D
1
4
LI
10-4
2
MC
A
1
5
LI
10-4
2
MC
B
1
6
LA
10-5
2
MC
A
1
7
LA
10-5
3
CR
4
8
IA
10-8
2
MC
D
1
9
WV
10-2
2
MC
B
1
10
WV
10-3
2
MC
D
1
11
IA
10-8
2
MC
D
1
12
IA
10-8
2
CR
4
13
WV
10-2
2
MC
A
1
14
II
10-7
2
MC
C
1
15
II
10-7
1
MC
B
1
16
IA
10-8
2
MC
A
1
17
IA
10-8
3
CR
4
Subcategory Points Earned
Tota
l Poi
nts
Earn
ed
Scal
ed S
core
Ach
ieve
men
t Le
velContent Strand
Wor
d ID
/Vo
cabu
lary
Lite
rary
Info
rmat
iona
l
Init
ial
Und
erst
andi
ng
Ana
lysi
s &
Inte
rpre
tati
onGSE Code
Depth of Knowledge Code
Item Type
Correct MC Response
Total Possible Points

LEGEND FOR THE ITEM ANALYSIS REPORT - GRADE 11 READING
Released Items SectionReleased Item Number: This number corresponds to the item number in the released item documents. This report provides complete data on items that are being released, which are approximately 25% of the items used to calculate scores.
Content Strand: The letters indicate the content strand with which the item is aligned: Word ID/Vocabulary (WV), Literary/Initial Understanding (LI), Literary/Analysis & Interpretation (LA), Informational/Initial Understanding (II), or Informational/Analysis & Interpretation (IA).
GSE Code: The fi rst two digits indicate the grade of the GSE tested. The third digit indicates the GSE measured by the item.
Depth of Knowledge Code: This number indicates the Depth of Knowledge to which the item is coded.
Item Type: This indicates whether the question is multiple choice (MC) or constructed response (CR).
Correct MC Response: This is the correct letter response for multiple-choice questions.
Total Possible Points: The number indicates the maximum points awarded for the item: 1 point for a multiple-choice question and 4 points for a constructed-response question.
Student Item Results: Each student’s name and state assigned student identifi cation number are listed, followed by a score for each released item on the test included in this report.
• For multiple-choice (MC) questions only, a plus sign (+) indicates a correct response. If the student answered incorrectly, the letter of his or her response is indicated. An asterisk (*) indicates that the student selected more than one response.• For all other item types, a number indicates how many points a student earned for that item. • For all item types, a blank space indicates that the student left the question blank. A dash (–) means that the score was invalidated and that the student received no credit for parts of the test that were administered under non-standard conditions.
Total Test Results SectionSubcategory Points Earned: These columns show the points the student earned in each content strand. The content strand points earned are based on all common items in the test and not just the released items.
Total Points Earned: This column shows the total number of points the student earned on all common items. If the row is blank in this column, it means that the student was classifi ed as Not Tested.
Scaled Score: This column shows the scaled score reported as a 4-digit number. The fi rst 2 digits ares the grade and the next two digits are a score of 00-80. If the row is blank in this column, it means that the student was classifi ed as Not Tested. (See Achievement Level below.)
Achievement Level: For Tested students, this column shows the achievement level into which the student’s scores fall: 4 = Profi cient with Distinction, 3 = Profi cient, 2 = Partially Profi cient, and 1 = Substantially Below Profi cient. For Not Tested students, there are six reasons why a student did not participate: A = student participated in an alternate assessment in 2006-07, L = student is fi rst year LEP, W = student withdrew from school after Oct. 1, 2007, E = student enrolled in school after Oct. 1, 2007, S = state approved special consideration, and N = other reason.
School/District/State Percent Correct/Average Score:• Released Items: Percent correct refers to the percent of tested students who answered a multiple-choice item correctly. Average score refers to the average number of points awarded to all tested students for that constructed-response item. • Subcategory Points Earned: Average score refers to the average number of points awarded to all tested students for that subcategory.
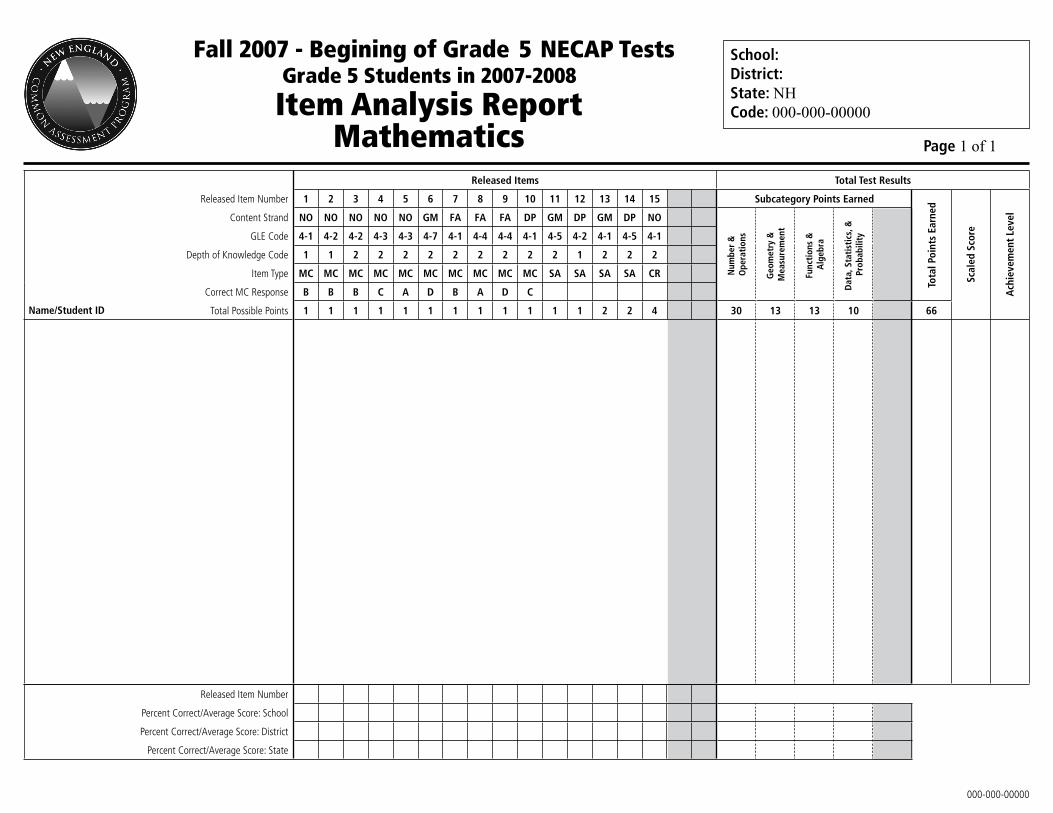
School: District: State: NHCode: 000-000-00000
Page 1 of 1
Fall 2007 - Begining of Grade 5 NECAP TestsGrade 5 Students in 2007-2008
Item Analysis ReportMathematics
000-000-00000
Released Item Number
Percent Correct/Average Score: School
Percent Correct/Average Score: District
Percent Correct/Average Score: State
Released Items Total Test Results
Released Item Number 1
NO
4-1
1
MC
B
1
2
NO
4-2
1
MC
B
1
3
NO
4-2
2
MC
B
1
4
NO
4-3
2
MC
C
1
5
NO
4-3
2
MC
A
1
6
GM
4-7
2
MC
D
1
7
FA
4-1
2
MC
B
1
8
FA
4-4
2
MC
A
1
9
FA
4-4
2
MC
D
1
10
DP
4-1
2
MC
C
1
11
GM
4-5
2
SA
1
12
DP
4-2
1
SA
1
13
GM
4-1
2
SA
2
14
DP
4-5
2
SA
2
15
NO
4-1
2
CR
4
Subcategory Points Earned
Tota
l Poi
nts
Earn
ed
Scal
ed S
core
Ach
ieve
men
t Le
velContent Strand
Num
ber
&
Ope
rati
ons
Geo
met
ry &
M
easu
rem
ent
Func
tion
s &
A
lgeb
ra
Dat
a, S
tati
stic
s, &
Pr
obab
ilityGLE Code
Depth of Knowledge Code
Item Type
Correct MC Response
Total Possible Points 30 13 13 10 66
Name/Student ID

LEGEND FOR THE ITEM ANALYSIS REPORT - MATHEMATICS
Released Items SectionReleased Item Number: This number corresponds to the item number in the released item documents. This report provides complete data on items that are being released, which are approximately 25% of the items used to calculate scores.
Content Strand: The letters indicate the content strand with which the item is aligned: Numbers & Operations (NO), Geometry & Measurement (GM), Functions & Algebra (FA), or Data, Statistics, & Probability (DP).
GLE Code: The fi rst digit indicates the grade of the GLE tested. The second number digit indicates the GLE measured by the item.
Depth of Knowledge Code: This number indicates the Depth of Knowledge to which the item is coded.
Item Type: This indicates whether the question is multiple choice (MC), short answer (SA), or constructed response (CR).
Correct MC Response: This is the correct letter response for multiple-choice questions.
Total Possible Points: The number indicates the maximum points awarded for the item: 1 point for a multiple-choice question; 0-2 points for a short-answer question; and 0-4 points for a constructed-response question (grades 5-8 only).
Student Item Results: Each student’s name and state assigned student identifi cation number are listed, followed by a score for each released item on the test included in this report.
• For multiple-choice (MC) questions only, a plus sign (+) indicates a correct response. If the student answered incorrectly, the letter of his or her response is indicated. An asterisk (*) indicates that the student selected more than one response.• For all other item types, a number indicates how many points a student earned for that item. • For all item types, a blank space indicates that the student left the question blank. A dash (–) means that the score was invalidated and that the student received no credit for parts of the test that were administered under non-standard conditions.
Total Test Results SectionSubcategory Points Earned: These columns show the points the student earned in each content strand. The content strand points earned are based on all common items in the test and not just the released items.
Total Points Earned: This column shows the total number of points the student earned on all common items. If the row is blank in this column, it means that the student was classifi ed as Not Tested.
Scaled Score: This column shows the scaled score reported as a 3-digit number. The fi rst digit is the grade and the next two digits are a score of 00-80. If the row is blank in this column, it means that the student was classifi ed as Not Tested. (See Achievement Level below.)
Achievement Level: For Tested students, this column shows the achievement level into which the student’s scores fall: 4 = Profi cient with Distinction, 3 = Profi cient, 2 = Partially Profi cient, and 1 = Substantially Below Profi cient. For Not Tested students, there are six reasons why a student did not participate: A = student participated in an alternate assessment in 2006-07, L = student is fi rst year LEP, W = student withdrew from school after Oct. 1, 2007, E = student enrolled in school after Oct. 1, 2007, S = state approved special consideration, and N = other reason.
School/District/State Percent Correct/Average Score:• Released Items: Percent correct refers to the percent of tested students who answered a multiple-choice item correctly. Average score refers to the average number of points awarded to all tested students for that short-answer or constructed-response item. • Subcategory Points Earned: Average score refers to the average number of points awarded to all tested students for that subcategory.

School: District: State: NHCode: 000-000-00000
Page 1 of 1
Fall 2007 - Begining of Grade 5 NECAP TestsGrade 5 Students in 2007-2008
Item Analysis ReportWriting
000-000-00000
Released Item Number
Percent Correct/Average Score: School
Percent Correct/Average Score: District
Percent Correct/Average Score: State
Released Items Total Test Results
Released Item Number 1
SC
4-9
1
MC
C
1
2
SC
4-9
1
MC
A
1
3
SC
4-1
2
MC
B
1
4
SC
4-9
1
MC
D
1
5
SC
4-9
1
MC
A
1
6
SC
4-1
2
MC
D
1
7
SC
4-9
1
MC
A
1
8
SC
4-9
1
MC
D
1
9
SC
4-1
2
MC
A
1
10
SC
4-9
1
MC
C
1
11
LR
4-3
2
CR
4
12
RW
4-8
2
CR
4
13
NW
4-4
2
CR
4
14
IR
4-3
3
SA
1
15
IR
4-3
3
SA
1
16
IR
4-3
3
SA
1
17
IR
4-3
3
ER
12
Subcategory Points Earned
Tota
l Poi
nts
Earn
ed
Scal
ed S
core
Ach
ieve
men
t Le
velContent Strand
Stru
ctur
es o
f Lan
guag
e &
Wri
ting
Con
vent
ions
Shor
t Re
spon
ses
Exte
nded
Re
spon
seGLE Code
Depth of Knowledge Code
Item Type
Correct MC Response
Total Possible Points 10 12 15 37
Name/Student ID

LEGEND FOR THE ITEM ANALYSIS REPORT - GRADE 5 WRITING
Released Items SectionReleased Item Number: This number corresponds to the item number in the released item documents. The complete writing test, which is made up entirely of common items, is being released. This report provides complete data on those items.
Content Strand: The letters indicate the content strand with which the item is aligned: Structures of Language & Writing Conventions (SC), Short Responses — Response to Literary Text (LR), Report Writing (RW), Narrative Writing (NW), Extended Response — Response to Informational Text (IR).
GLE Code: The fi rst digit indicates the grade of the GLE tested. The second number digit indicates the GLE measured by the item.
Depth of Knowledge Code: This number indicates the Depth of Knowledge to which the item is coded.
Item Type: This indicates whether the question is multiple choice (MC), constructed response (CR), short answer (SA), or writing prompt (ER).
Correct MC Response: This is the correct letter response for multiple-choice questions.
Total Possible Points: The number indicates the maximum points awarded for the item: 1 point for a multiple-choice question, 1 point for a short-answer question, 0-4 points for a constructed-response question, and 0-12 points for the writing prompt.
Student Item Results: Each student’s name and state assigned student identifi cation number are listed, followed by a score for each released item on the test included in this report.
• For multiple-choice (MC) questions only, a plus sign (+) indicates a correct response. If the student answered incorrectly, the letter of his or her response is indicated. An asterisk (*) indicates that the student selected more than one response.• For all other item types, a number indicates how many points a student earned for that item. • For all item types, a blank space indicates that the student left the question blank. A dash (–) means that the score was invalidated and that the student received no credit for parts of the test that were administered under non-standard conditions.
Total Test Results SectionSubcategory Points Earned: These columns show the points the student earned in each content strand. The content strand points earned are based on all items in the test.
Total Points Earned: This column shows the total number of points the student earned on all common items. If the row is blank in this column, it means that the student was classifi ed as Not Tested.
Scaled Score: This column shows the scaled score reported as a 3-digit number. The fi rst digit is the grade and the next two digits are a score of 00-80. If the row is blank in this column, it means that the student was classifi ed as Not Tested. (See Achievement Level below.)
Achievement Level: For Tested students, this column shows the achievement level into which the student’s scores fall: 4 = Profi cient with Distinction, 3 = Profi cient, 2 = Partially Profi cient, and 1 = Substantially Below Profi cient. For Not Tested students, there are six reasons why a student did not participate: A = student participated in an alternate assessment in 2006-07, L = student is fi rst year LEP, W = student withdrew from school after Oct. 1, 2007, E = student enrolled in school after Oct. 1, 2007, S = state approved special consideration, and N = other reason.
School/District/State Percent Correct/Average Score:• Released Items: Percent correct refers to the percent of tested students who answered a multiple-choice item correctly. Average score refers to the average number of points awarded to all tested students for that short-answer or constructed-response item or the writing prompt. • Subcategory Points Earned: Average score refers to the average number of points awarded to all tested students for that subcategory.

Name/Student ID
Total Test Results
Total Points Earned Achievement Level
Name/Student ID
Total Test Results
Total Points Earned Achievement Level
SummarySchoolDistrictState
School: District: State: NHCode: 000-000-00000
Page 1 of 1
Fall 2007 - Beginning of Grade 11 NECAP TestsGrade 11 Students in 2007-2008
Item Analysis ReportWriting
Content Strand GSE Codes Depth of Knowledge Code Item Type Total Possible Points
Response to Informational Text 10-2, 10-3, 10-1, 10-9 3 Extended Response 12

LEGEND FOR THE ITEM ANALYSIS REPORT - GRADE 11 WRITING
Released Items SectionContent Strand: This indicates the genre of the writing prompt: Response to Informational Text.
GSE Code: The fi rst two digits indicate the grade of the GSE tested. The third digit indicates the GSE measured by the item.
Depth of Knowledge Code: This number indicates the Depth of Knowledge to which the item is coded.
Item Type: This indicates the type of question: Writing Prompt.
Total Possible Points: The number indicates the maximum points awarded for the item: 0-12 points for the writing prompt.
Total Test Results SectionTotal Points Earned: This column shows the total number of points the student earned on all common items. If the row is blank in this column, it means that the student was classifi ed as Not Tested.
Achievement Level: For Tested students, this column shows the achievement level into which the student’s scores fall: 4 = Profi cient with Distinction, 3 = Profi cient, 2 = Partially Profi cient, and 1 = Substantially Below Profi cient. For Not Tested students, there are six reasons why a student did not participate: A = student participated in an alternate assessment in 2006-07, L = student is fi rst year LEP, W = student withdrew from school after Oct. 1, 2007, E = student enrolled in school after Oct. 1, 2007, S = state approved special consideration, and N = other reason.
School/District/State/Average Points:The numbers in these rows indicate the average number of points earned on the writing test for the school, district, and state.

This report highlights results from the Fall 2007 New England Common Assessment Program (NECAP) tests. The NECAP tests are administered to students in New Hampshire, Rhode Island, and Vermont as part of each state’s statewide assessment program. NECAP test results are used primarily for school improvement and accountability. Achievement level results are used in the state accountability system required under No Child Left Behind (NCLB). More detailed school and district results are used by schools to help improve curriculum and instruction. Individual student results are used to support information gathered through classroom instruction and assessments.
NECAP tests in reading and mathematics are administered to students in grades 3 through 8 and 11 and writing tests are administered to students in grades 5, 8, and 11. The NECAP grade 11 tests are designed to measure student performance on grade span expectations (GSE) developed and adopted by the three states. Specifi cally, the tests are designed to measure the content and skills that students are expected to have as they begin the school year in their current grade – in other words, the content and skills which students have learned through the end of the previous grade.
Each test contains a mix of multiple-choice and constructed-response questions. Constructed-response questions require
students to develop their own answers to questions. On
the mathematics test, students may be required to provide the correct answer to a computation or word problem, draw or interpret a chart or graph, or explain how they solved a problem. On the reading test,
students may be required to make a list or write a
few paragraphs to answer a question related to a literary or
informational passage. On the writing test, students are required to provide two extended responses of 1-3 pages.
This report contains a variety of school- and/or district-, and state-level assessment results for the NECAP tests administered at a grade level. Achievement level distributions and mean scaled scores are provided for all students tested as well as for subgroups of students classifi ed by demographics or program participation. The report also contains comparative information on school and district performance on subtopics within each content area tested.
In addition to this report of grade 11 results, schools and districts will also receive Item Analysis Reports, Released Item support materials, and student-level data fi les containing NECAP results. Together, these reports and data constitute a rich source of information to support local decisions in curriculum, instruction, assessment, and professional development. Over time, this information can also strengthen school’s and district’s evaluation of their ongoing improvement efforts.
About The New England Common Assessment Program
Fall 2007Beginning of Grade 11
NECAP Tests
Grade 11 Students in 2007-2008
School ResultsSchool:
District:
Code: 000-000-00000
000-000-00000XX

Page 2 of 8
Fall 2007 - Beginning of Grade 11 NECAP TestsGrade 11 Students in 2007-2008
Grade Level Summary Report Schools and districts administered all NECAP tests to every enrolled student with the following exceptions: students who participated in the alternate assessment for the 2006-07 school year, fi rst year LEP students, students who withdrew from the school after October 1, 2007, students who enrolled
in the school after October 1, 2007, students for whom a special consideration was granted through the state Department of Education, and other students for reasons not approved. On this page, and throughout this report, results are only reported for groups of students that are larger than nine (9).
PARTICIPATION in NECAPNumber Percentage
School District State School District State
Students enrolled on or after October 1
Students tested
Students not tested in NECAPState Approved
Alternate AssessmentFirst Year LEPWithdrew After October 1Enrolled After October 1Special Consideration
Other
Reading Math Writing Reading Math Writing Reading Math Writing Reading Math Writing Reading Math Writing Reading Math Writing
Note: Throughout this report, percentages may not total 100 since each percentage is rounded to the nearest whole number.
Level 4 = Profi cient with Distinction; Level 3 = Profi cient; Level 2 = Partially Profi cient; Level 1 = Substantially Below Profi cient
School District State
Enrolled NT
Approved NT
Other Tested Level 4 Level 3 Level 2 Level 1 Mean
Score
TestedLevel
4Level
3Level
2Level
1 Mean Score
TestedLevel
4Level
3Level
2Level
1 Mean Score
N N N N N % N % N % N % N % % % % N % % % %
REA
DIN
GM
ATH
WRI
TIN
G
NECAP RESULTS
School: District: State: Code: 000-000-00000
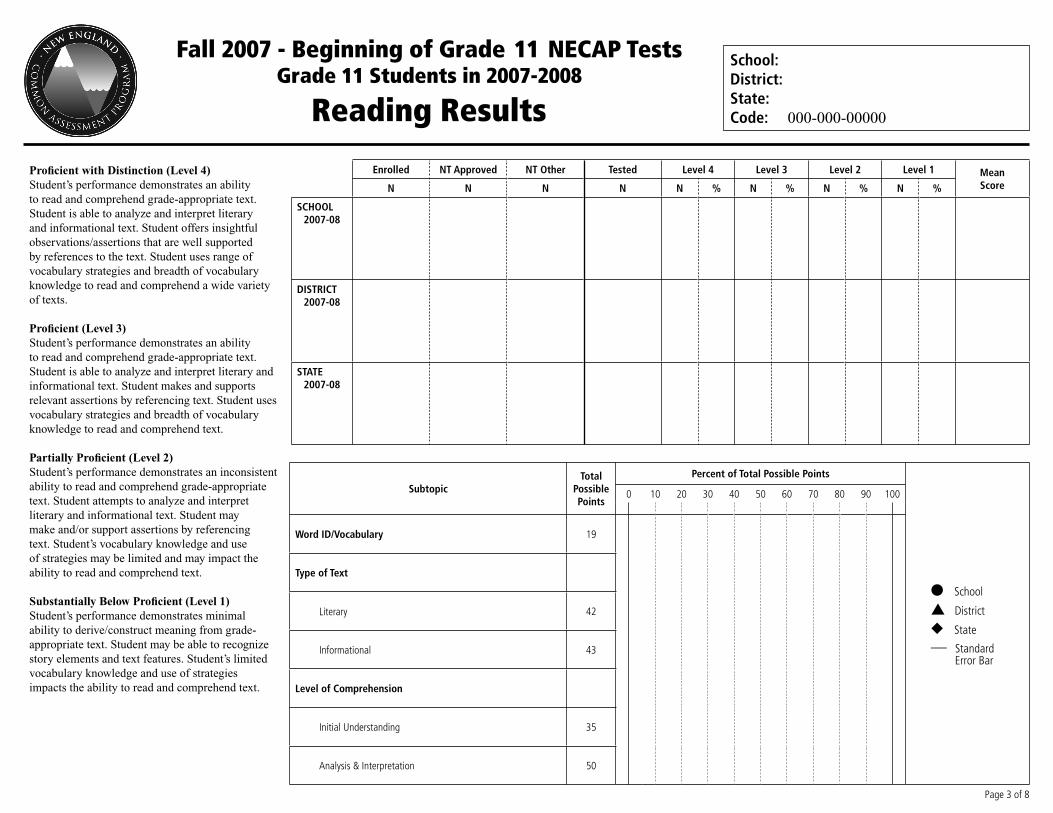
Page 3 of 8
Fall 2007 - Beginning of Grade 11 NECAP TestsGrade 11 Students in 2007-2008
Enrolled NT Approved NT Other Tested Level 4 Level 3 Level 2 Level 1 Mean ScoreN N N N N % N % N % N %
SCHOOL2007-08
DISTRICT2007-08
STATE2007-08
Reading Results
School: District: State: Code: 000-000-00000
SubtopicTotal
Possible Points
Percent of Total Possible Points
● School
▲ District
◆ State
— Standard Error Bar
0 10 20 30 40 50 60 70 80 90 100
Word ID/Vocabulary 19
42
43
35
50
Type of Text
Literary
Informational
Level of Comprehension
Initial Understanding
Analysis & Interpretation
Profi cient with Distinction (Level 4)Student’s performance demonstrates an ability to read and comprehend grade-appropriate text. Student is able to analyze and interpret literary and informational text. Student offers insightful observations/assertions that are well supported by references to the text. Student uses range of vocabulary strategies and breadth of vocabulary knowledge to read and comprehend a wide variety of texts.
Profi cient (Level 3)Student’s performance demonstrates an ability to read and comprehend grade-appropriate text. Student is able to analyze and interpret literary and informational text. Student makes and supports relevant assertions by referencing text. Student uses vocabulary strategies and breadth of vocabulary knowledge to read and comprehend text.
Partially Profi cient (Level 2)Student’s performance demonstrates an inconsistent ability to read and comprehend grade-appropriate text. Student attempts to analyze and interpret literary and informational text. Student may make and/or support assertions by referencing text. Student’s vocabulary knowledge and use of strategies may be limited and may impact the ability to read and comprehend text.
Substantially Below Profi cient (Level 1)Student’s performance demonstrates minimal ability to derive/construct meaning from grade-appropriate text. Student may be able to recognize story elements and text features. Student’s limited vocabulary knowledge and use of strategies impacts the ability to read and comprehend text.

Page 4 of 8
Fall 2007 - Beginning of Grade 11 NECAP TestsGrade 11 Students in 2007-2008
Disaggregated Reading Results
REPORTING CATEGORIES
School District State
EnrolledNT
ApprovedNT
OtherTested Level 4 Level 3 Level 2 Level 1
Mean Score
TestedLevel
4Level
3Level
2Level
1Mean Score
TestedLevel
4Level
3Level
2Level
1Mean Score
N N N N N % N % N % N % N N % % % % N N % % % % N
All Students
GenderMaleFemaleNot Reported
Primary Race/EthnicityAmerican Indian or Alaskan NativeAsianBlack or African AmericanHispanic or LatinoNative Hawaiian or Pacifi c IslanderWhite (non-Hispanic)No Primary Race/Ethnicity Reported
LEP StatusCurrently receiving LEP servicesFormer LEP student - monitoring year 1Former LEP student - monitoring year 2All Other Students
IEPStudents with an IEPAll Other Students
SESEconomically Disadvantaged StudentsAll Other Students
MigrantMigrant StudentsAll Other Students
Title IStudents Receiving Title I ServicesAll Other Students
Level 4 = Profi cient with Distinction; Level 3 = Profi cient; Level 2 = Partially Profi cient; Level 1 = Substantially Below Profi cient
NOTE: Some numbers may have been left blank because fewer than ten (10) students were tested.
School: District: State: Code: 000-000-00000

Page 5 of 8
Fall 2007 - Beginning of Grade 11 NECAP TestsGrade 11 Students in 2007-2008
Enrolled NT Approved NT Other Tested Level 4 Level 3 Level 2 Level 1 Mean ScoreN N N N N % N % N % N %
SCHOOL2007-08
DISTRICT2007-08
STATE2007-08
Mathematics Results
School: District: State: Code: 000-000-00000
SubtopicTotal
Possible Points
Percent of Total Possible Points
● School
▲ District
◆ State
— Standard Error Bar
0 10 20 30 40 50 60 70 80 90 100
Numbers and Operations 20
42
55
19
Geometry and Measurement
Functions and Algebra
Data, Statistics, and Probability
Profi cient with Distinction (Level 4)Student’s problem solving demonstrates logical reasoning with strong explanations that include both words and proper mathematical notation. Student’s work exhibits a high level of accuracy, effective use of a variety of strategies, and an understanding of mathematical concepts within and across grade level expectations. Student demonstrates the ability to move from concrete to abstract representations.
Profi cient (Level 3)Student’s problem solving demonstrates logical reasoning with appropriate explanations that include both words and proper mathematical notation. Student uses a variety of strategies that are often systematic. Computational errors do not interfere with communicating understanding. Student demonstrates conceptual understanding of most aspects of the grade level expectations.
Partially Profi cient (Level 2)Student’s problem solving demonstrates logical reasoning and conceptual understanding in some, but not all, aspects of the grade level expectations. Many problems are started correctly, but computational errors may get in the way of completing some aspects of the problem. Student uses some effective strategies. Student’s work demonstrates that he or she is generally stronger with concrete than abstract situations.
Substantially Below Profi cient (Level 1)Student’s problem solving is often incomplete, lacks logical reasoning and accuracy, and shows little conceptual understanding in most aspects of the grade level expectations. Student is able to start some problems but computational errors and lack of conceptual understanding interfere with solving problems successfully.

Page 6 of 8
Fall 2007 - Beginning of Grade 11 NECAP TestsGrade 11 Students in 2007-2008
Disaggregated Mathematics Results
REPORTING CATEGORIES
School District State
EnrolledNT
ApprovedNT
OtherTested Level 4 Level 3 Level 2 Level 1
Mean Score
TestedLevel
4Level
3Level
2Level
1Mean Score
TestedLevel
4Level
3Level
2Level
1Mean Score
N N N N N % N % N % N % N N % % % % N N % % % % N
All Students
GenderMaleFemaleNot Reported
Primary Race/EthnicityAmerican Indian or Alaskan NativeAsianBlack or African AmericanHispanic or LatinoNative Hawaiian or Pacifi c IslanderWhite (non-Hispanic)No Primary Race/Ethnicity Reported
LEP StatusCurrently receiving LEP servicesFormer LEP student - monitoring year 1Former LEP student - monitoring year 2All Other Students
IEPStudents with an IEPAll Other Students
SESEconomically Disadvantaged StudentsAll Other Students
MigrantMigrant StudentsAll Other Students
Title IStudents Receiving Title I ServicesAll Other Students
Level 4 = Profi cient with Distinction; Level 3 = Profi cient; Level 2 = Partially Profi cient; Level 1 = Substantially Below Profi cient
NOTE: Some numbers may have been left blank because fewer than ten (10) students were tested.
School: District: State: Code: 000-000-00000

Page 7 of 8
Fall 2007 - Beginning of Grade 11 NECAP TestsGrade 11 Students in 2007-2008
Writing Results
School: District: State: Code: 000-000-00000
Profi cient with Distinction (Level 4)Student’s writing demonstrates an ability to respond to prompt/task with clarity and insight. Focus is well developed and maintained throughout response. Response demonstrates use of strong organizational structures. A variety of elaboration strategies is evident. Sentence structures and language choices are varied and used effectively. Response demonstrates control of conventions; minor errors may occur.
Profi cient (Level 3)Student’s writing demonstrates an ability to respond to prompt/task. Focus is clear and maintained throughout the response. Response is organized with a beginning, middle and end with appropriate transitions. Details are suffi ciently elaborated to support focus. Sentence structures and language use are varied. Response demonstrates control of conventions; errors may occur but do not interfere with meaning.
Partially Profi cient (Level 2)Student’s writing demonstrates an attempt to respond to prompt/task. Focus may be present but not maintained. Organizational structure is inconsistent with limited use of transitions. Details may be listed and lack elaboration. Sentence structures and language use are unsophisticated and may be repetitive. Response demonstrates inconsistent control of conventions.
Substantially Below Profi cient (Level 1)Student’s writing demonstrates a minimal response to prompt/task. Focus is unclear or lacking. Little or no organizational structure is evident. Details are minimal and/or random. Sentence structures and language use are minimal or absent. Frequent errors in conventions may interfere with meaning.
StrandTotal
Possible Points
Percent of Total Possible Points Numberof
Prompts
Distribution of Score Points Across Prompts
0 10 20 30 40 50 60 70 80 90 100 0 1 2 3 4 5 6
% % % % % % %
Writing in Response to Text• Response to Informational Text• Response to Literary Text
12
6
18
2
3
1
SchoolDistrictState
Informational Writing• Report• Procedure• Persuasive Essay
SchoolDistrictState
Expressive Writing• Refl ective Essay
SchoolDistrictState
● School ▲ District ◆ State — Standard Error Bar
Enrolled NT Approved NT Other Tested Level 4 Level 3 Level 2 Level 1 Mean ScoreN N N N N % N % N % N %
SCHOOL2007-08
DISTRICT2007-08
STATE2007-08

Page 8 of 8
Fall 2007 - Beginning of Grade 11 NECAP TestsGrade 11 Students in 2007-2008
Disaggregated Writing Results
REPORTING CATEGORIES
School District State
EnrolledNT
ApprovedNT
OtherTested Level 4 Level 3 Level 2 Level 1
Mean Score
TestedLevel
4Level
3Level
2Level
1Mean Score
TestedLevel
4Level
3Level
2Level
1Mean Score
N N N N N % N % N % N % N N % % % % N N % % % % N
All Students
GenderMaleFemaleNot Reported
Primary Race/EthnicityAmerican Indian or Alaskan NativeAsianBlack or African AmericanHispanic or LatinoNative Hawaiian or Pacifi c IslanderWhite (non-Hispanic)No Primary Race/Ethnicity Reported
LEP StatusCurrently receiving LEP servicesFormer LEP student - monitoring year 1Former LEP student - monitoring year 2All Other Students
IEPStudents with an IEPAll Other Students
SESEconomically Disadvantaged StudentsAll Other Students
MigrantMigrant StudentsAll Other Students
Title IStudents Receiving Title I ServicesAll Other Students
Level 4 = Profi cient with Distinction; Level 3 = Profi cient; Level 2 = Partially Profi cient; Level 1 = Substantially Below Profi cient
NOTE: Some numbers may have been left blank because fewer than ten (10) students were tested.
School: District: State: Code: 000-000-00000

ReadingEnrolled
NT Approved
NT Other Tested Achievement Level
N N N NLevel 4 Level 3 Level 2 Level 1 Mean
Scaled ScoreN % N % N % N %
School:District:State: Code: 00-00000
School Summary2007-2008 Students
Level 4 = Profi cient with Distinction; Level 3 = Profi cient; Level 2 = Partially Profi cient; Level 1 = Substantially Below Profi cient
MathematicsEnrolled
NT Approved
NT Other Tested Achievement Level
N N N NLevel 4 Level 3 Level 2 Level 1 Mean
Scaled ScoreN % N % N % N %
WritingEnrolled
NT Approved
NT Other Tested Achievement Level
N N N NLevel 4 Level 3 Level 2 Level 1 Mean
Scaled ScoreN % N % N % N %

This report highlights results from the Fall 2007 Beginning of Grade New England Common Assessment Program (NECAP) tests. The NECAP tests are administered to students in New Hampshire, Rhode Island, and Vermont as part of each state’s statewide assessment program. NECAP test results are used primarily for school improvement and accountability. Achievement level results are used in the state accountability system required under No Child Left Behind (NCLB). More detailed school and district results are used by schools to help improve curriculum and instruction. Individual student results are used to support information gathered through classroom instruction and assessments.
NECAP tests in reading and mathematics are administered to students in grades 3 through 8 and writing tests are administered to students in grades 5 and 8. The NECAP tests are designed to measure student performance on grade level expectations (GLE) developed and adopted by the three states. Speci cally, the tests are designed to measure the content and skills that students are expected to have as they begin the school year in their current grade – in other words, the content and skills which students have learned through the end of the previous grade.
Each test contains a mix of multiple-choice and constructed-response questions. Constructed-response questions require students to develop their own answers to questions. On the mathematics test,
students may be required to provide the correct answer
to a computation or word problem, draw or interpret a chart or graph, or explain how they solved a problem. On the reading test, students may be required to make a list or write a few paragraphs to answer
a question related to a literary or informational
passage. On the writing test, students are required to provide a
single extended response of 1-3 pages and three shorter responses to questions measuring different types of writing.
This report contains a variety of school- and/or district-, and state-level assessment results for the NECAP tests administered at a grade level. Achievement level distributions and mean scaled scores are provided for all students tested as well as for subgroups of students classi ed by demographics or program participation. The report also contains comparative information on school and district performance on subtopics within each content area tested.
In addition to this report of grade level results, schools and districts will also receive Summary Reports, Item Analysis Reports, Released Item support materials, and student-level data les containing NECAP results. Together, these reports and data constitute a rich source of information to support local decisions in curriculum, instruction, assessment, and professional development. Over time, this information can also strengthen school’s and district’s evaluation of their ongoing improvement efforts.
About The New England Common Assessment Program
Fall 2007Beginning of Grade 5
NECAP Tests
Grade 5 Students in 2007-2008
District Results
District: Code: 000-000
000-000

Page 2 of 8
Fall 2007 - Beginning of Grade 5 NECAP TestsGrade 5 Students in 2007-2008
Grade Level Summary Report Schools and districts administered all NECAP tests to every enrolled student with the following exceptions: students who participated in the alternate assessment for the 2006-07 school year, rst year LEP students, students who withdrew from the school after October 1, 2007, students who enrolled
in the school after October 1, 2007, students for whom a special consideration was granted through the state Department of Education, and other students for reasons not approved. On this page, and throughout this report, results are only reported for groups of students that are larger than nine (9).
PARTICIPATION in NECAPNumber Percentage
School District State School District State
Students enrolled on or after October 1
Students tested
Students not tested in NECAPState Approved
Alternate AssessmentFirst Year LEPWithdrew After October 1Enrolled After October 1Special Consideration
Other
Reading Math Writing Reading Math Writing Reading Math Writing Reading Math Writing Reading Math Writing Reading Math Writing
Note: Throughout this report, percentages may not total 100 since each percentage is rounded to the nearest whole number.
Level 4 = Profi cient with Distinction; Level 3 = Profi cient; Level 2 = Partially Profi cient; Level 1 = Substantially Below Profi cient
District State
Enrolled NT
Approved NT
Other Tested Level 4 Level 3 Level 2 Level 1 Mean
Scaled Score
TestedLevel
4Level
3Level
2Level
1Mean Scaled Score
TestedLevel
4Level
3Level
2Level
1Mean Scaled Score
N N N N N % N % N % N % N % % % % N % % % %
REA
DIN
GM
ATH
WRI
TIN
G
NECAP RESULTS
District: State: Code: 000-000

Profi cient with Distinction (Level 4)Student’s performance demonstrates an ability to read and comprehend grade-appropriate text. Student is able to analyze and interpret literary and informational text. Student offers insightful observations/assertions that are well supported by references to the text. Student uses range of vocabulary strategies and breadth of vocabulary knowledge to read and comprehend a wide variety of texts.
Profi cient (Level 3)Student’s performance demonstrates an ability to read and comprehend grade-appropriate text. Student is able to analyze and interpret literary and informational text. Student makes and supports relevant assertions by referencing text. Student uses vocabulary strategies and breadth of vocabulary knowledge to read and comprehend text.
Partially Profi cient (Level 2)Student’s performance demonstrates an inconsistent ability to read and comprehend grade-appropriate text. Student attempts to analyze and interpret literary and informational text. Student may make and/or support assertions by referencing text. Student’s vocabulary knowledge and use of strategies may be limited and may impact the ability to read and comprehend text.
Substantially Below Profi cient (Level 1)Student’s performance demonstrates minimal ability to derive/construct meaning from grade-appropriate text. Student may be able to recognize story elements and text features. Student’s limited vocabulary knowledge and use of strategies impacts the ability to read and comprehend text.
Page 3 of 8
Fall 2007 - Beginning of Grade 5 NECAP TestsGrade 5 Students in 2007-2008
Enrolled NT Approved NT Other Tested Level 4 Level 3 Level 2 Level 1 Mean Scaled ScoreN N N N N % N % N % N %
SCHOOL2005-062006-072007-08CumulativeTotal
DISTRICT2005-062006-072007-08CumulativeTotal
STATE2005-062006-072007-08CumulativeTotal
SubtopicTotal
Possible Points
Percent of Total Possible Points
● School
▲ District
◆ State
— Standard Error Bar
0 10 20 30 40 50 60 70 80 90 100
Word ID/Vocabulary
Type of Text
Level of Comprehension
Literary
Informational
Initial Understanding
Analysis & Interpretation
24
57
49
47
59
Reading Results
District: State: Code: 000-000

Page 4 of 8
Fall 2007 - Beginning of Grade 5 NECAP TestsGrade 5 Students in 2007-2008
Disaggregated Reading Results
REPORTING CATEGORIES
District State
EnrolledNT
ApprovedNT
OtherTested Level 4 Level 3 Level 2 Level 1
Mean Scaled Score
TestedLevel
4Level
3Level
2Level
1
Mean Scaled Score
TestedLevel
4Level
3Level
2Level
1
Mean Scaled Score
N N N N N % N % N % N % N N % % % % N N % % % % N
All Students
GenderMaleFemaleNot Reported
Primary Race/EthnicityAmerican Indian or Alaskan NativeAsianBlack or African AmericanHispanic or LatinoNative Hawaiian or Pacifi c IslanderWhite (non-Hispanic)No Primary Race/Ethnicity Reported
LEP StatusCurrently receiving LEP servicesFormer LEP student - monitoring year 1Former LEP student - monitoring year 2All Other Students
IEPStudents with an IEPAll Other Students
SESEconomically Disadvantaged StudentsAll Other Students
MigrantMigrant StudentsAll Other Students
Title IStudents Receiving Title I ServicesAll Other Students
Level 4 = Profi cient with Distinction; Level 3 = Profi cient; Level 2 = Partially Profi cient; Level 1 = Substantially Below Profi cient
NOTE: Some numbers may have been left blank because fewer than ten (10) students were tested.
District: State: Code: 000-000

Profi cient with Distinction (Level 4)Student’s problem solving demonstrates logical reasoning with strong explanations that include both words and proper mathematical notation. Student’s work exhibits a high level of accuracy, effective use of a variety of strategies, and an understanding of mathematical concepts within and across grade level expectations. Student demonstrates the ability to move from concrete to abstract representations.
Profi cient (Level 3)Student’s problem solving demonstrates logical reasoning with appropriate explanations that include both words and proper mathematical notation. Student uses a variety of strategies that are often systematic. Computational errors do not interfere with communicating understanding. Student demonstrates conceptual understanding of most aspects of the grade level expectations.
Partially Profi cient (Level 2)Student’s problem solving demonstrates logical reasoning and conceptual understanding in some, but not all, aspects of the grade level expectations. Many problems are started correctly, but computational errors may get in the way of completing some aspects of the problem. Student uses some effective strategies. Student’s work demonstrates that he or she is generally stronger with concrete than abstract situations.
Substantially Below Profi cient (Level 1)Student’s problem solving is often incomplete, lacks logical reasoning and accuracy, and shows little conceptual understanding in most aspects of the grade level expectations. Student is able to start some problems but computational errors and lack of conceptual understanding interfere with solving problems successfully.
Page 5 of 8
Fall 2007 - Beginning of Grade 5 NECAP TestsGrade 5 Students in 2007-2008
Enrolled NT Approved NT Other Tested Level 4 Level 3 Level 2 Level 1 Mean Scaled ScoreN N N N N % N % N % N %
SCHOOL2005-062006-072007-08CumulativeTotal
DISTRICT2005-062006-072007-08CumulativeTotal
STATE2005-062006-072007-08CumulativeTotal
SubtopicTotal
Possible Points
Percent of Total Possible Points
● School
▲ District
◆ State
— Standard Error Bar
0 10 20 30 40 50 60 70 80 90 100
Number & Operations
Geometry & Measurement
Functions & Algebra
Data, Statistics, & Probability
73
32
32
25
Mathematics Results
District: State: Code: 000-000

Page 6 of 8
Fall 2007 - Beginning of Grade 5 NECAP TestsGrade 5 Students in 2007-2008
Disaggregated Mathematics Results
REPORTING CATEGORIES
District State
EnrolledNT
ApprovedNT
OtherTested Level 4 Level 3 Level 2 Level 1
Mean Scaled Score
TestedLevel
4Level
3Level
2Level
1
Mean Scaled Score
TestedLevel
4Level
3Level
2Level
1
Mean Scaled Score
N N N N N % N % N % N % N N % % % % N N % % % % N
All Students
GenderMaleFemaleNot Reported
Primary Race/EthnicityAmerican Indian or Alaskan NativeAsianBlack or African AmericanHispanic or LatinoNative Hawaiian or Pacifi c IslanderWhite (non-Hispanic)No Primary Race/Ethnicity Reported
LEP StatusCurrently receiving LEP servicesFormer LEP student - monitoring year 1Former LEP student - monitoring year 2All Other Students
IEPStudents with an IEPAll Other Students
SESEconomically Disadvantaged StudentsAll Other Students
MigrantMigrant StudentsAll Other Students
Title IStudents Receiving Title I ServicesAll Other Students
Level 4 = Profi cient with Distinction; Level 3 = Profi cient; Level 2 = Partially Profi cient; Level 1 = Substantially Below Profi cient
NOTE: Some numbers may have been left blank because fewer than ten (10) students were tested.
District: State: Code: 000-000

Profi cient with Distinction (Level 4)Student’s writing demonstrates an ability to respond to prompt/task with clarity and insight. Focus is well developed and maintained throughout response. Response demonstrates use of strong organizational structures. A variety of elaboration strategies is evident. Sentence structures and language choices are varied and used effectively. Response demonstrates control of conventions; minor errors may occur.
Profi cient (Level 3)Student’s writing demonstrates an ability to respond to prompt/task. Focus is clear and maintained throughout the response. Response is organized with a beginning, middle and end with appropriate transitions. Details are suffi ciently elaborated to support focus. Sentence structures and language use are varied. Response demonstrates control of conventions; errors may occur but do not interfere with meaning.
Partially Profi cient (Level 2)Student’s writing demonstrates an attempt to respond to prompt/task. Focus may be present but not maintained. Organizational structure is inconsistent with limited use of transitions. Details may be listed and lack elaboration. Sentence structures and language use are unsophisticated and may be repetitive. Response demonstrates inconsistent control of conventions.
Substantially Below Profi cient (Level 1)Student’s writing demonstrates a minimal response to prompt/task. Focus is unclear or lacking. Little or no organizational structure is evident. Details are minimal and/or random. Sentence structures and language use are minimal or absent. Frequent errors in conventions may interfere with meaning.
Page 7 of 8
Fall 2007 - Beginning of Grade 5 NECAP TestsGrade 5 Students in 2007-2008
Enrolled NT Approved NT Other Tested Level 4 Level 3 Level 2 Level 1 Mean Scaled ScoreN N N N N % N % N % N %
SCHOOL2005-062006-072007-08CumulativeTotal
DISTRICT2005-062006-072007-08CumulativeTotal
STATE2005-062006-072007-08CumulativeTotal
SubtopicTotal
Possible Points
Percent of Total Possible Points
● School
▲ District
◆ State
— Standard Error Bar
0 10 20 30 40 50 60 70 80 90 100
Structures of Language & Writing Conventions
Short Responses
Extended Response
10
12
15
Writing Results
District: State: Code: 000-000
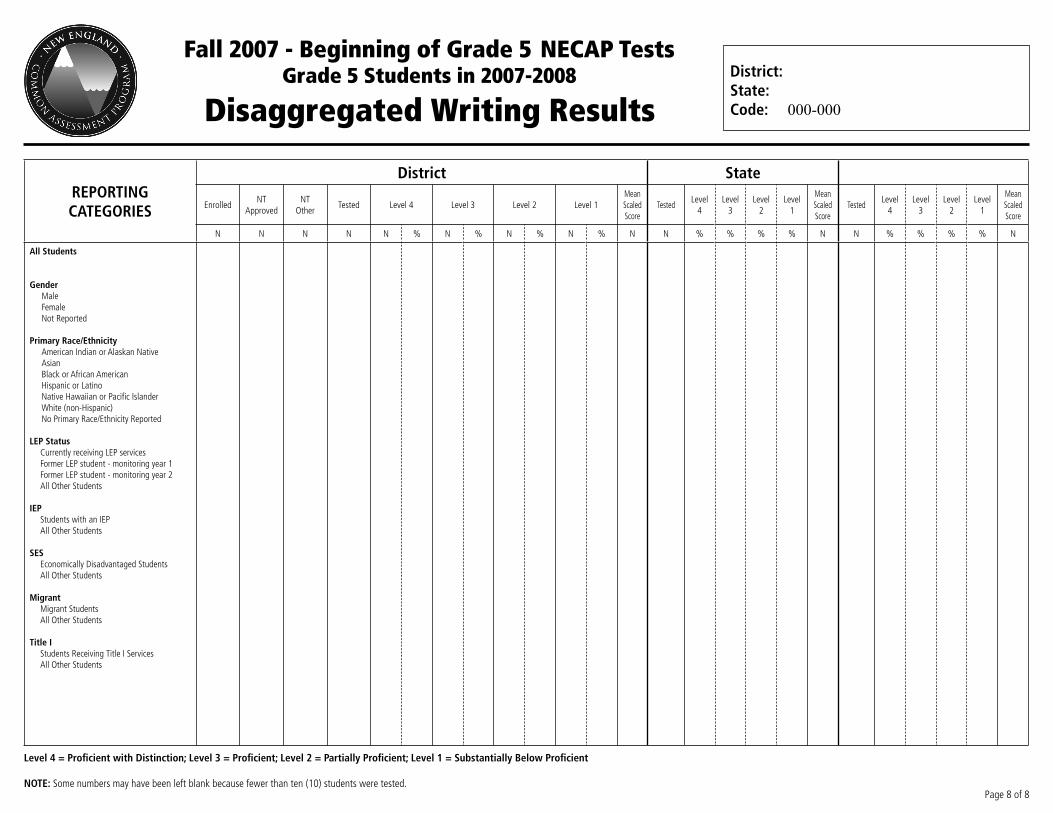
Page 8 of 8
Fall 2007 - Beginning of Grade 5 NECAP TestsGrade 5 Students in 2007-2008
Disaggregated Writing Results
REPORTING CATEGORIES
District State
EnrolledNT
ApprovedNT
OtherTested Level 4 Level 3 Level 2 Level 1
Mean Scaled Score
TestedLevel
4Level
3Level
2Level
1
Mean Scaled Score
TestedLevel
4Level
3Level
2Level
1
Mean Scaled Score
N N N N N % N % N % N % N N % % % % N N % % % % N
All Students
GenderMaleFemaleNot Reported
Primary Race/EthnicityAmerican Indian or Alaskan NativeAsianBlack or African AmericanHispanic or LatinoNative Hawaiian or Pacifi c IslanderWhite (non-Hispanic)No Primary Race/Ethnicity Reported
LEP StatusCurrently receiving LEP servicesFormer LEP student - monitoring year 1Former LEP student - monitoring year 2All Other Students
IEPStudents with an IEPAll Other Students
SESEconomically Disadvantaged StudentsAll Other Students
MigrantMigrant StudentsAll Other Students
Title IStudents Receiving Title I ServicesAll Other Students
Level 4 = Profi cient with Distinction; Level 3 = Profi cient; Level 2 = Partially Profi cient; Level 1 = Substantially Below Profi cient
NOTE: Some numbers may have been left blank because fewer than ten (10) students were tested.
District: State: Code: 000-000
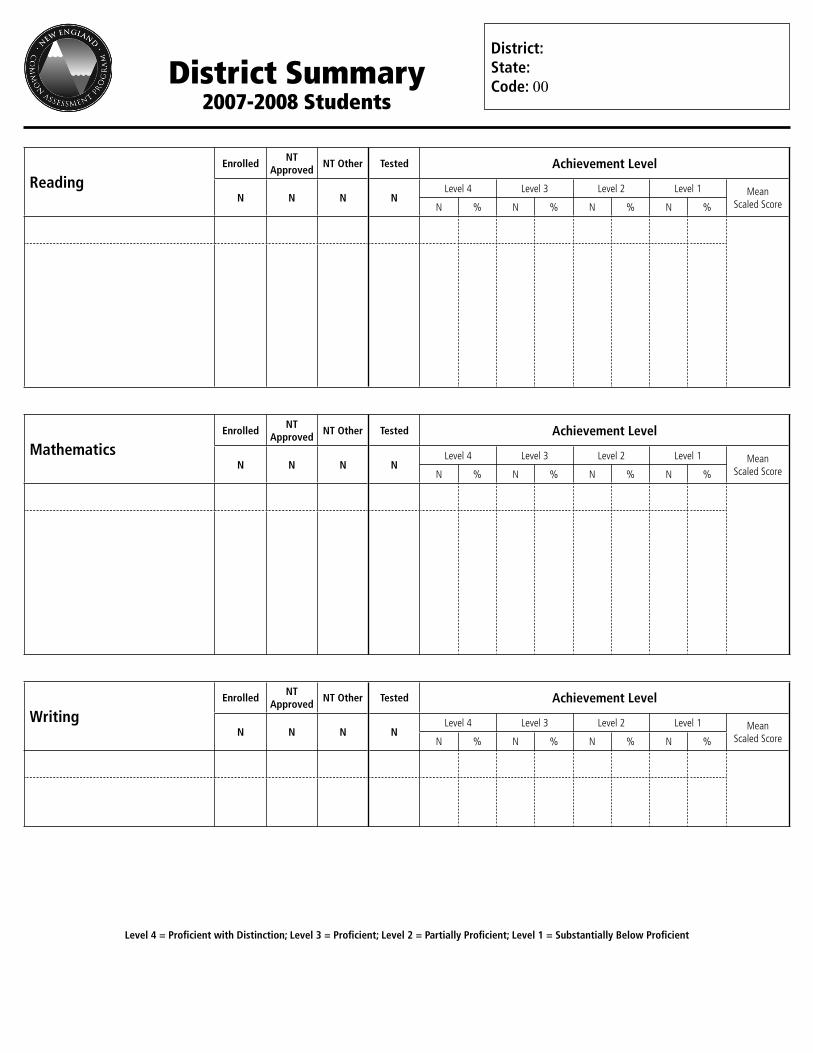
ReadingEnrolled
NT Approved
NT Other Tested Achievement Level
N N N NLevel 4 Level 3 Level 2 Level 1 Mean
Scaled ScoreN % N % N % N %
District:State: Code: 00District Summary
2007-2008 Students
Level 4 = Profi cient with Distinction; Level 3 = Profi cient; Level 2 = Partially Profi cient; Level 1 = Substantially Below Profi cient
MathematicsEnrolled
NT Approved
NT Other Tested Achievement Level
N N N NLevel 4 Level 3 Level 2 Level 1 Mean
Scaled ScoreN % N % N % N %
WritingEnrolled
NT Approved
NT Other Tested Achievement Level
N N N NLevel 4 Level 3 Level 2 Level 1 Mean
Scaled ScoreN % N % N % N %

Appendix N Decision Rules 1 2007-08 NECAP Technical Report
APPENDIX N—DECISION RULES

Appendix N Decision Rules 2 2007-08 NECAP Technical Report
ANALYSIS AND REPORTING DECISION RULES NECAP Fall 07-08 Grades 03-08 Administration
This document details rules for analysis and reporting. The final student level data set used for analysis and reporting is described in the “Data Processing Specifications.” This document is considered a draft until the NECAP State Department of Education (DOE) signs off. If there are rules that need to be added or modified after said sign-off, DOE sign off will be obtained for each rule. Details of these additions and modifications will be in the Addendum section.
I. General Information
A. Tests administered:
Grade Subject Test items used for Scaling
IREF Reporting Categories (Subtopic and Subcategory IREF Source)
03 Reading Common Cat2 03 Math Common Cat1 04 Reading Common Cat2 04 Math Common Cat1 05 Reading Common Cat2 05 Math Common Cat1 05 Writing Common type 06 Reading Common Cat2 06 Math Common Cat1 07 Reading Common Cat2 07 Math Common Cat1 08 Reading Common Cat2 08 Math Common Cat1 08 Writing Common type
B. Reports Produced:
1. Student Report
a. Testing School District
2. School Item Analysis Report by Grade and Subject
a. Testing School District
b. Teaching School District
3. Grade Level School/District/State Results
a. Testing School District
b. Teaching School District – District and School Levels only
4. School/District/State Summary
a. Testing School District
b. Teaching School District – District and School Levels only
C. Files Produced:
1. State Student Cleanup Data
2. Preliminary State Results
3. State Student Released Item Data
4. State Student Raw Data
5. State Student Scored Data

Appendix N Decision Rules 3 2007-08 NECAP Technical Report
6. District Student Data
7. Item Information
8. Grade Level Results Report Disaggregated and Historical Data
9. Grade Level Results Report Participation Category Data
10. Grade Level Results Report Subtopic Data
11. Summary Results Data
12. Released Item Percent Responses Data
13. Invalidated Students Original Score
14. Multiple Choice Response Distribution Data Grades 05-08
15. Block Blank Response Distribution Data Grades 03 & 04
D. School Type:
SchType Source: ICORE SubTypeID
Description
PUB 1,12,13 Public School PRI 3 Private School OOD 4 Out-of-District Private Providers OUT 8 Out Placement CHA 11 Charter School INS 7 Institution OTH 9 Other

Appendix N Decision Rules 4 2007-08 NECAP Technical Report
School Type Impact on Data Analysis and Reporting
Testing Teaching Level
Impact on Analysis Impact on Reporting
Impact on Analysis Impact on Reporting
Student n/a Report students based on testing discode and schcode.
District data will be blank for students tested at PRI, OOD, OUT, INS, or OTH schools.
Always print tested year state data.
n/a n/a
School Include all non-home school students using testing school code for aggregations
Generate a report for each school with at least one student enrolled using the tested school aggregate denominator.
District data will be blank for PRI, OOD, OUT, INS, or OTH schools.
Always print tested year state data.
Include all non-home school students using the teaching school code. Exclude students who do not have a teaching school code.
Generate a report for each school with at least one student enrolled using the teaching school aggregate denominator.
District data will be blank for PRI, OOD, OUT, INS, or OTH schools.
Always print tested year state data.
District For OUT and OOD schools, aggregate using the sending district.
If OUT or OOD student does not have a sending district, do not include in aggregations.
Do not include students tested at PRI, INS, or OTH schools
Do not include home school students.
Generate a report for each district with at least one student enrolled using the tested district aggregate denominator.
Always report tested year state data.
Do not include students taught at PRI, OOD, OUT, INS, or OTH schools.
Do not include students who do not have a teaching district code.
Do not include home school students.
Generate a report for each district with at least one student enrolled using the teaching district aggregate denominator.
Always report tested year state data.
State Do not include students tested at PRI schools for NH and RI. Include all students for VT.
Do not include home school students.
Always report testing year state data.
n/a n/a

Appendix N Decision Rules 5 2007-08 NECAP Technical Report
E. Requirements To Report Aggregate Data(Minimum N)
Calculation Description Rule
Number and Percent at each achievement level, mean score by disaggregated category and aggregate level
If the number of tested students included in the denominator is less than 10, then do not report.
Content Area Subcategories Average Points Earned based on common items only by aggregate level
If the number of tested students included in the denominator is less than 10, then do not report.
Aggregate data on Item Analysis report No required minimum number of students
Number and Percent of students in a participation category by aggregate level
No required minimum number of students
Content Area Subtopic Percent of Total Possible Points and Standard Error Bar
If any item was not administered to at least one tested student included in the denominator or the number of tested students included in the denominator is less than 10, then do not report
F. Special Forms:
1. Form 00 is created for students whose matrix scores will be ignored for analysis. Such students include Braille or administration issues resolved by program management.
G. Other Information
1. Home school students are excluded from all school, district, and state level aggregations. Home school students receive a parent letter based on the testing school. Print aggregate data based on the testing school. Print tested year state data. Home school students are not listed on the item analysis report.
2. Plan504 data not available for NH and VT; therefore 504 Plan section will be suppressed for NH and VT.
3. To calculate Title1 data for writing using Title1rea variable.
4. Title 1 data are not available for VT; therefore Title 1 section will be suppressed for VT.
5. Only students with a testing year school type of OUT or OOD are allowed to have a sending district code. Non-public sending district codes will be ignored. For RI, senddiscode of 88 is ignored. For NH, senddiscode of 000 is ignored.
6. Several reports and data files are provided by testing and teaching school district levels. Testing level is defined to be the school and district where the student tested (discode and schcode). Teaching level is defined to be where the student was enrolled last year (sprdiscode and sprschcode). Every student will have testing district and school codes. Some students will have a teaching school code. Some students will have a teaching district code.
II. Student Participation / Exclusions
A. Test Attempt Rules by content area
1. A content area was attempted if any multiple choice item or non-field test open response item has been answered. (Use original item responses – see special circumstances section II.F)
2. A multiple choice item has been answered by a student if the response is A, B, C, D, or * (*=multiple responses)
3. An open response item has been answered if it is not scored blank ‘B’
B. Session Attempt Rules by content area
1. A session was attempted if any multiple choice item or non-field test open response item has been answered in the session. (Use original item responses – see special circumstances section II.F)

Appendix N Decision Rules 6 2007-08 NECAP Technical Report
C. Not Tested Reasons by content area
1. Not Tested State Approved Alternate Assessment
a. If content area “Alternate Assessment blank or partially blank reason” is marked, then student is identified as “Not Tested State Approved Alternate Assessment”.
2. Not Tested State Approved First Year LEP (reading and writing only)
a. If content area “First Year LEP blank or partially blank reason” is marked, then student is identified as “Not Tested State Approved First Year LEP”.
3. Not Tested State Approved Special Consideration
a. If content area “Special Consideration blank or partially blank reason” is marked, the student is identified as ”Not Tested State Approved Special Consideration”.
4. Not Tested State Approved Withdrew After October 1
a. If content area “Withdrew After October 1 blank or partially blank reason” is marked and at least one content area session was not attempted, then the student is identified as “Not Tested State Approved Withdrew After October 1”
5. Not Tested State Approved Enrolled After October 1
a. If content area “Enrolled After October 1 blank or partially blank reason” is marked and at least one content area session was not attempted, then the student is identified as “Not Tested State Approved Enrolled After October 1”.
6. Not Tested Other
a. If content area test was not attempted, the student is identified as “Not Tested Other”.
D. Not Tested Reasons Hierarchy by content area: if more than one reason for not testing at a content area is identified then select the first category indicated in the order of the list below.
1. Not Tested State Approved Alternate Assessment
2. Not Tested State Approved First Year LEP (reading and writing only)
3. Not Tested State Approved Special Consideration
4. Not Tested State Approved Withdrew After October 1
5. Not Tested State Approved Enrolled After October 1
6. Not Tested Other
E. Student Participation Status by content area
1. Tested
a. If the student does not have any content area not tested reasons identified, then the student is considered Tested for the content area.
2. Not Tested: State Approved Alternate Assessment
3. Not Tested: State Approved First Year LEP (reading and writing only)
4. Not Tested: State Approved Special Consideration
5. Not Tested: State Approved Withdrew After October 1
6. Not Tested: State Approved Enrolled After October 1
7. Not Tested: Other
F. Special Circumstances by content area
1. Students identified as content area tested and did not attempt all sessions in the test are considered to be “Tested Incomplete.”

Appendix N Decision Rules 7 2007-08 NECAP Technical Report
2. Students identified as content area tested and have at least one of the content area invalidation session flags marked will be treated as “Tested with Non-Standard Accommodations”. Math accommodation F01 also identifies non-standard accommodations for Math.
3. For students identified as “Tested with Non-Standard Accommodations” the content area sessions item responses which are marked for invalidation will be treated as a non-response. For the students with math accommodations F01 marked, the non-calculator session 1 math items will be treated as a non-response.
4. Students identified as tested in a content area will receive released item scores, scaled score, scale score bounds, achievement level, raw total score, subcategory scores, and writing annotations (where applicable).
5. Students identified as not tested in a content area will not receive a scaled score, scaled score bounds, achievement level, writing annotations (where applicable). They will receive released item scores, raw total score, and subcategory scores.
G. Student Participation Summary
Participation Status
Description Raw Score(*)
Scaled Score
Ach. Level
Student Report Ach. Level Text
Roster Ach. Level Text
1 Tested ! ! ! Substantially Below Proficient, Partially Proficient, Proficient, or Proficient with Distinction
1,2,3, or 4
2 Not Tested State Approved Alternate Assessment
! Alternate Assessment A
3 Not Tested State Approved First Year LEP
! First Year LEP L
4 Not Tested State Approved Enrolled After October 1
! Enrolled After October 1 E
5 Not Tested State Approved Withdrew After October 1
! Withdrew After October 1 W
6 Not Tested State Approved Special Consideration
! Special Consideration S
7 Not Tested Other ! Not Tested N
(*) Raw scores are not printed on student report for students with a not tested status.

Appendix N Decision Rules 8 2007-08 NECAP Technical Report
III. Calculations
A. Rounding
1. All percents are rounded to the nearest whole number
2. All mean scaled scores are rounded to the nearest whole number
3. Content Area Subcategories: Average Points Earned (student report): round to the nearest tenth.
4. Round non-multiple choice average item scores to the nearest tenth.
B. Students included in calculations based on participation status
1. For number and percent of students enrolled, tested, and not tested categories include all students not excluded by other decision rules.
2. For number and percent at each achievement level, average scaled score, subtopic percent of total possible points and standard error, subcategories average points earned, percent/correct average score for each released item include all tested students not excluded by other decision rules.
C. Raw scores
1. For all analysis, non-response for an item by a tested student is treated as a score of 0.
2. Content Area Total Points: Sum the pointes earned by the student for the common items.
D. Item Scores
1. For all analysis, non-response for an item by a tested student is treated as a score of 0.
2. For multiple choice released item data store a ‘+’ for correct response, or A,B,C,D,* or blank
3. For open response released items, store the student score. If the score is not numeric (‘B’), then store it as blank.
4. For students identified as content area tested with non-standard accommodations, then store the released item score as ‘-‘ for invalidated items.
E. Scaling
Scaling is done using a look-up table provided by psychometrics and the student’s raw score.
F. SubTopic Item Scores
1. Identify the Subtopic
a. The excel file IREF_ReportingCategories.xls outlines the IREF variables and values for identifying the Content Strand, GLE code, Depth of Knowledge code, subtopics, and subcategories. The variable type in IREF is the source for the Item Type, except the writing prompt item type is reported as “ER”.
2. Student Content Area Subcategories (student report): Subtopic item scores at the student level is the sum of the points earned by the student for the common items in the subtopic.
3. Content Area Subtopic (grade level results report): Subtopic scores are based on all unique common and matrix items. The itemnumber identifies each unique item.
a. Percent of Total Possible Points:
I. For each unique common and matrix item calculate the average student score as follows: (sum student item score/number of tested students administered the item).
II. 100 * (Sum the average score for items in the subtopic)/(Total Possible Points for the subtopic) rounded to the nearest whole number.
b. Standard Error Bar: Before multiplying by 100 and rounding the Percent of Total Possible points (ppe) calculate standard error for school,district and state: 100* (square root ( ((ppe)*(1-ppe)/number of tested students)) ) rounded to the nearest whole number
Percent of Total Possible Points +/- Standard Error

Appendix N Decision Rules 9 2007-08 NECAP Technical Report
G. Cumulative Total
1. Include the yearly results where the number tested is greater than or equal to 10
2. Cumulative total N (Enrolled, Not Tested Approved, Not Tested Other, Tested, at each achievement level) is the sum of the yearly results for each category where the number tested is greater than or equal to 10.
3. Cumulative percent for each achievement level is 100*(Number of students at the achievement level cumulative total / number of students tested cumulative total) rounded to the nearest whole number.
4. Cumulative mean scaled score is a weighted average. For years where the number tested is greater than or equal to 10, (sum of ( yearly number tested * yearly mean scaled score) ) / (sum of yearly number tested) rounded to the nearest whole number.
H. Average Points Earned Students at Proficient Level (Range)
1. Select all students across the states with Y40 scaled score, where Y=grade. Average the content area subcategories across the students and round to the nearest tenth. Add and subtract one standard error of measurement to get the range.
I. Writing Annotations
1. Students with a writing prompt score of 2-12 receive at least one, but up to five statements based on decision rules for annotations as outlined in Final Statements & Decision Rules for NECAP Writing Annotations.doc
IV. Report Specific Rules
A. Student Report
1. Student header Information
a. If “FNAME” or “LNAME” is not missing then print “FNAME MI LNAME”. Otherwise, print “No Name Provided”.
b. Print the student’s tested grade
c. For school and district name, print the abbreviated tested school and district ICORE name based on school type decision rules.
d. Print “NH”,”RI”, or “VT” for state.
2. Test Results by content area
a. For students identified as “Not Tested”, print the not tested reason in the achievement level, leave scaled score and graphic display blank.
b. For students identified as tested for the content area then do the following
I. Print the complete achievement level name the student earned
II. Print the scaled score the student earned
III. Print a vertical black bar for the student scaled score with gray horizontal bounds in the graphic display
IV. For students identified as “Tested with a non-standard accommodation” for a content area, print ‘**’ after the content area earned achievement level and after student points earned for each subcategory.
V. For students identified as “Tested Incomplete” for a content area, place a section symbol after content area earned scaled score.
3. Exclude students based on school type and participation status decision rules for aggregations.

Appendix N Decision Rules 10 2007-08 NECAP Technical Report
4. This Student’s Achievement Compared to Other Students by content area
a. For tested students, print a check mark in the appropriate achievement level in the content area student column. For not tested students leave blank
b. For percent of students with achievement level by school, district and state print aggregate data based on school type and minimum N rules
5. This Student’s Performance in Content Area Subcategories by content area
a. Always print total possible points and students at proficient average points earned range.
b. For students identified as not tested then leave student scores blank
c. For students identified as tested do the following
I. Always print student subcategory scores
II. If the student is identified as tested with a non-standard accommodation for the content area then place ‘**” after the student points earned for each subcategory.
d. Print aggregate data based on school type and minimum N-size rules.
5. Writing Annotations (Grades 05 and 08 only)
a. For students with writing prompt score of 2-12 print at least one, but up to five annotation statements.
B. School Item Analysis Report by Grade and Subject
1. Reports are created for testing school and teaching school independently.
2. School Header Information
a. Use abbreviated ICORE school and district name based on school type decision rules
b. Print “New Hampshire”, “Rhode Island”, or “Vermont” for State.
c. For NH, the code should print SAU code – district code – school code. For RI and VT, the code should print district code – school code.
3. For multiple choice items, print ‘+’ for correct response, or A,B,C,D,* or blank
4. For open response items, print the student score. If the score is not numeric (‘B’), then leave blank.
5. For students identified as content area tested with non-standard accommodations, print ‘-‘ for invalidated items.
6. All students receive subcategory points earned and total points earned.
7. Leave scaled score blank for not tested students and print the not tested reason in the achievement level column.
8. Exclude students based on school type and participation status decision rules for aggregations.
9. Always print aggregated data regardless of N-size based on school type decision rules.
10. For students identified as not tested for the content area print a cross symbol next to students’ name.
11. For students identified as tested incomplete for the content area print a section symbol next to the scaled score.
12. Home school student are not listed on the report.
C. Grade Level School/District/State Results
1. Reports are run by testing state, testing district, testing school, teaching district, and teaching school.
2. Exclude students based on school type and participation status decision rules for aggregations.
3. Report Header Information

Appendix N Decision Rules 11 2007-08 NECAP Technical Report
a. Use abbreviated school and district name from ICORE based on school type decision rules.
b. Print “New Hampshire”, “Rhode Island”, or “Vermont” to reference the state. The state graphic is printed on the first page.
4. Report Section: Participation in NECAP
a. For testing level reports always print number and percent based on school type decision rules.
b. For the teaching level reports leave the section blank.
5. Report Section: NECAP Results by content area
a. For the testing level report always print based on minimum N-size and school type decision rules.
b. For the teaching level report leave Enrolled, NT Approved, and NT Other blank. Print Tested, number and percent at each achievement level, mean scaled score based on minimum N-size and school type decision rules.
6. Report Section: Historical NECAP Results by content area
a. For teaching level report always print current year, prior years, and cumulative total results based on minimum N-size and school type decision rules.
b. For teaching level report leave Enrolled, NT Approved, and NT Other blank. Print Tested, number and percent at each achievement level, mean scaled score based on minimum N-size and school type decision rules.
7. Report Section: Subtopic Results by content area
a. For testing and teaching level reports always print based on minimum N-size and school type decision rules
8. Report Section: Disaggregated Results by content area
a. For testing level report always print based on minimum N-size and school type decision rules.
b. For teaching level report leave Enrolled, NT Approved, and NT Other blank. Print Tested, number and percent at each achievement level, mean scaled score based on minimum N-size and school type decision rules.
D. School/District/State Summary
1. Reports are run by testing state, testing district, testing school, teaching district, and teaching school
2. Exclude students based on school type and participation status decision rules for aggregations.
3. For testing level report print entire aggregate group across grades tested and list grades tested results based on minimum N-size and school type decision rules. Mean scaled score across the grades is not calculated.
4. For the teaching level report leave Enrolled, NT Approved, and NT Other blank. Print Tested, number and percent at each achievement level, mean scaled score based on minimum N-size and school type decision rules. Mean scaled score across the grades is not calculated.

Appendix N Decision Rules 12 2007-08 NECAP Technical Report
V. Data File Rules
In the file names GG refers to the two digit grade (03-08) , YYYY refers to the year 0708, DDDDD refers to the district code, and SS refers to two letter state code.
A. State Student Cleanup Data
1. One CSV file per grade and state will be created based on the file layout NECAPYYYYF Gr 03-08 11 Student Demographic Cleanup File Layout.xls.
2. Refer to NECAPYYYYF Gr 03-08 11 Student Demographic Cleanup Description.doc
3. Session Invalidation Flags are marked as follows.
a. If reaaccF02 or reaaccF03 is marked, then mark reaInvSes1, reaInvSes2, and reaInvSes3
b. If mataccF03 is marked, then mark matInvSes1, matInvSes2, and matInvSes03. MataccF01 is left as marked on booklet.
c. If wriaccF03 is marked, then mark wriInvSes1 and wriInvSes2
B. Preliminary State Results
1. A PDF file will be created for each state containing preliminary state results for each grade and subject and will list historical state data for comparison.
2. The file name will be SSPreliminaryResultsDATE.pdf
C. State Student Released Item Data
1. Students who tested at a private school are excluded from NH and RI student data files.
2. A CSV file will be created for each state and grade following the layout NECAP YYYY Fall Gr 03-08 State Student Data Released Item Layout.xls
3. The CSV file name will be NECAP YYYY Fall State Student Data Released Item Gr GG.csv.
D. State Student Raw Data
1. Students who tested at a private school are excluded from NH and RI student data files.
2. A CSV file will be created for each state and grade following the layout NECAP YYYY Fall Gr 03-08 State Student Raw Data File Layout.xls
3. The CSV file name will be NECAP YYYY Fall State Student Raw Data File Gr GG.csv.
E. State Student Scored Data
1. Students who tested at a private school are excluded from NH and RI student data files.
2. A CSV file will be created for each state and grade following the layout NECAP YYYY Fall Gr 03-08 State Student Scored Data File Layout.xls
3. The CSV file name will be NECAP YYYY Fall State Student Scored Data File Gr GG.csv.
F. District Student Data
1. Students with the Discode or SendDiscode will be in the district grade specific CSV file for the testing year.
2. Students with a sprDiscode will be in the district grade specific CSV file for the teaching year.
3. Home school students are excluded from district student data files. For NH and RI only public school districts will receive district data files. (Districts with at least one school with schoolsubtypeID=1 in ICORE)
4. Testing and teaching CSV files will be created for each state and grade and district following the layout NECAP YYYY Fall Gr 03-08 District Student Data Layout.xls
5. The testing CSV file name will be NECAP YYYY Fall Testing District Slice Gr GG_DDDDD.csv. The teaching CSV file name will be NECAP YYYY Fall Teaching District Slice Gr GG_DDDDD.csv.

Appendix N Decision Rules 13 2007-08 NECAP Technical Report
G. Item Information
1. An excel file will be created containing item information for common items: grade, subject, raw data item name, item type, key, and point value.
2. The file name will be NECAP YYYY Fall Gr 03-08 Item Information.xls
H. Grade Level Results Report Disaggregated and Historical Data
1. Teaching and testing CSV files will be created for each state and grade containing the grade level results disaggregated and historical data following the layout NECAP YYYY Fall Gr 03-08 Results Report Disaggregated and Historical Data Layout.xls.
2. Data will be suppressed based on minimum N-size and report type decision rules.
3. The testing file name will be NECAP YYYY Fall Testing Results Report Disaggregated and Historical Data Gr GG.csv . The teaching file name will be NECAP YYYY Fall Teaching Results Report Disaggregated and Historical Data Gr GG.csv.
I. Grade Level Results Report Participation Category Data
1. Teaching CSV file will be created for each state and grade containing the grade level results participation data following the layout NECAP YYYY Fall Gr 03-08 Results Report Participation Category Data Layout.xls.
2. The testing file name will be NECAP YYYY Fall Testing Results Report Participation Category Data Gr GG.csv
J. Grade Level Results Report Subtopic Data
1. Teaching and testing CSV files will be created for each state and grade containing the grade level results subtopic data following the layout NECAP YYYY Fall Gr 03-08 Results Report Subtopic Data Layout.xls.
2. Data will be suppressed based on minimum N-size and report type decision rules.
3. The testing file name will be NECAP YYYY Fall Testing Results Report Subtopic Data Gr GG.csv . The teaching file name will be NECAP YYYY Fall Teaching Results Report Subtopic Data Gr GG.csv.
K. Summary Results Data
1. Teaching and testing CSV files will be created for each state and grade containing the summary report data following the layout NECAP YYYY Fall Gr 03-08 Summary Results Layout.xls.
2. Data will be suppressed based on minimum N-size and report type decision rules.
3. The testing file name will be NECAP YYYY Fall Testing Summary Results Gr GG.csv . The teaching file name will be NECAP YYYY Fall Teaching Summary Results Gr GG.csv.
L. Released Item Percent Responses Data
1. The CSV files will only contain state level aggregation for released items.
2. Teaching and testing CSV files will be created for each state and grade containing the released item analysis report state data following the layout NECAP YYYY Fall Gr 03-08 Released Item Percent Responses Layout.xls.
3. The testing file name will be NECAP YYYY Fall Testing Released Item Percent Responses.csv . The teaching file name will be NECAP YYYY Fall Teaching Released Item Percent Responses.csv.

Appendix N Decision Rules 14 2007-08 NECAP Technical Report
M. Invalidated Students Original Score
1. Original raw scores for students whose responses were invalidated for reporting will be provided.
2. Students who tested at a private school are excluded from NH and RI student data files.
3. A CSV file will be created for each state and grade following the layout NECAP YYYY Fall Gr 03-08 State Invalidated Student Original Scored Data File Layout.xls.
4. The CSV file name will be NECAP YYYY Fall State Student Scored Data File Gr GG OriScInvStu.csv.
N. Multiple Choice Response Distribution Data Grades 05-08
1. One CSV file will be created containing the frequency of multiple responses (*) for multiple choice items.
2. All students are included in the frequencies.
3. The file will follow the layout NECAP YYYY Fall Multiple MC Responses Freq Layout.xls and will be named NECAP YYYY Fall Multiple MC Responses Freq.xls.
O. Block Blank Response Distribution Data Grades 03 & 04
Addenda
1. 01/04/2008: Grade Level School/District/State Results – Cumulative Total
- Suppress cumulative total data if at least one reported year has fewer than 10 tested students.

Appendix N Decision Rules 15 2007-08 NECAP Technical Report
Analysis and Reporting Decision Rules NECAP Fall 07-08 Grade 11 Administration
This document details rules for analysis and reporting. The final student level data set used for analysis and reporting is described in the “Data Processing Specifications.” This document is considered a draft until the NECAP State Department of Education (DOE) signs off. If there are rules that need to be added or modified after said sign-off, DOE sign off will be obtained for each rule. Details of these additions and modifications will be in the Addendum section.
VI. General Information
A. Tests administered:
Grade Subject Test items used for Scaling
IREF Reporting Categories (Subtopic and Subcategory IREF Source)
11 Reading Common Cat2 11 Math Common Cat1 11 Writing Common form
B. Reports Produced:
1. Student Report
b. Testing School District
2. School Item Analysis Report by Grade and Subject
c. Testing School District
d. Teaching School District
3. Grade Level School/District/State Results
c. Testing School District
d. Teaching School District – District and School Levels only
C. Files Produced:
1. State Student Cleanup Data
2. Preliminary State Results
3. State Student Released Item Data
4. State Student Raw Data
5. State Student Scored Data
6. District Student Data
7. Item Information
8. Grade Level Results Report Disaggregated and Historical Data
9. Grade Level Results Report Participation Category Data
10. Grade Level Results Report Subtopic Data
11. Released Item Percent Responses Data
12. Invalidated Students Original Score
13. Multiple Choice Response Distribution Data Grades 11

Appendix N Decision Rules 16 2007-08 NECAP Technical Report
D. School Type:
SchType Source: ICORE SubTypeID
Description
PUB 1,12,13 Public School PRI 3 Private School OOD 4 Out-of-District Private Providers OUT 8 Out Placement CHA 11 Charter School INS 7 Institution OTH 9 Other
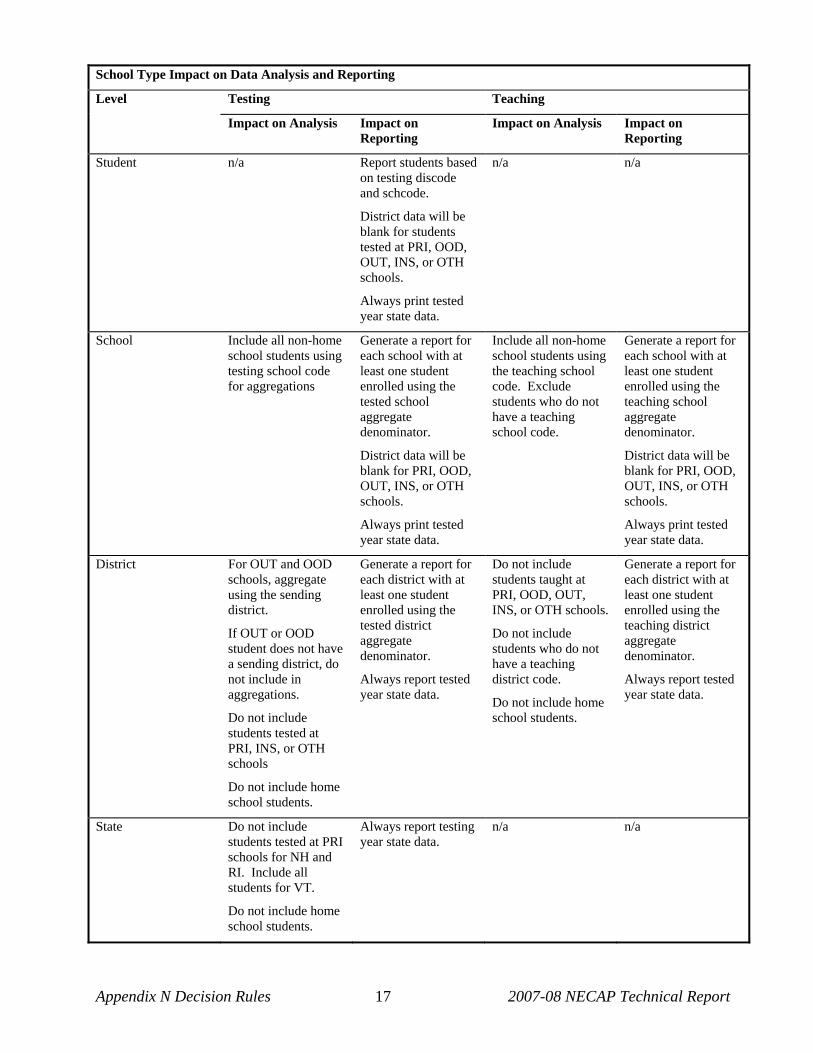
Appendix N Decision Rules 17 2007-08 NECAP Technical Report
School Type Impact on Data Analysis and Reporting
Testing Teaching Level
Impact on Analysis Impact on Reporting
Impact on Analysis Impact on Reporting
Student n/a Report students based on testing discode and schcode.
District data will be blank for students tested at PRI, OOD, OUT, INS, or OTH schools.
Always print tested year state data.
n/a n/a
School Include all non-home school students using testing school code for aggregations
Generate a report for each school with at least one student enrolled using the tested school aggregate denominator.
District data will be blank for PRI, OOD, OUT, INS, or OTH schools.
Always print tested year state data.
Include all non-home school students using the teaching school code. Exclude students who do not have a teaching school code.
Generate a report for each school with at least one student enrolled using the teaching school aggregate denominator.
District data will be blank for PRI, OOD, OUT, INS, or OTH schools.
Always print tested year state data.
District For OUT and OOD schools, aggregate using the sending district.
If OUT or OOD student does not have a sending district, do not include in aggregations.
Do not include students tested at PRI, INS, or OTH schools
Do not include home school students.
Generate a report for each district with at least one student enrolled using the tested district aggregate denominator.
Always report tested year state data.
Do not include students taught at PRI, OOD, OUT, INS, or OTH schools.
Do not include students who do not have a teaching district code.
Do not include home school students.
Generate a report for each district with at least one student enrolled using the teaching district aggregate denominator.
Always report tested year state data.
State Do not include students tested at PRI schools for NH and RI. Include all students for VT.
Do not include home school students.
Always report testing year state data.
n/a n/a

Appendix N Decision Rules 18 2007-08 NECAP Technical Report
E. Requirements To Report Aggregate Data(Minimum N)
Calculation Description Rule
Number and Percent at each achievement level, mean score by disaggregated category and aggregate level
If the number of tested students included in the denominator is less than 10, then do not report.
Content Area Subcategories Average Points Earned based on common items only by aggregate level
If the number of tested students included in the denominator is less than 10, then do not report.
Aggregate data on Item Analysis report No required minimum number of students
Number and Percent of students in a participation category by aggregate level
No required minimum number of students
Content Area Subtopic Percent of Total Possible Points and Standard Error Bar and Grade 11 Writing Distribution of Score Points Across Prompts
If any item was not administered to at least one tested student included in the denominator or the number of tested students included in the denominator is less than 10, then do not report
F. Special Forms:
1. Form 00 is created for students whose matrix scores will be ignored for analysis. Such students include Braille or administration issues resolved by program management.
G. Other Information
1. Home school students are excluded from all school, district, and state level aggregations. Home school students receive a parent letter based on the testing school. Print aggregate data based on the testing school. Print tested year state data. Home school students are not listed on the item analysis report.
2. Plan504 data not available for NH and VT; therefore 504 Plan section will be suppressed for NH and VT.
3. To calculate Title1 data for writing using Title1rea variable.
4. Title 1 data are not available for VT; therefore Title 1 section will be suppressed for VT.
5. Only students with a testing year school type of OUT or OOD are allowed to have a sending district code. Non-public sending district codes will be ignored. For RI, senddiscode of 88 is ignored. For NH, senddiscode of 000 is ignored.
6. Several reports and data files are provided by testing and teaching school district levels. Testing level is defined to be the school and district where the student tested (discode and schcode). Teaching level is defined to be where the student was enrolled last year (sprdiscode and sprschcode). Every student will have testing district and school codes. Some students will have a teaching school code. Some students will have a teaching district code.
VII. Student Participation / Exclusions
A. Test Attempt Rules by content area
1. Grade 11 writing was attempted if the common writing prompt is not scored blank ‘B’. For all other grades and content areas test attempt can be determined as follows. A content area was attempted if any multiple choice item or non-field test open response item has been answered. (Use original item responses – see special circumstances section II.F)
2. A multiple choice item has been answered by a student if the response is A, B, C, D, or * (*=multiple responses)
3. An open response item has been answered if it is not scored blank ‘B’

Appendix N Decision Rules 19 2007-08 NECAP Technical Report
B. Session Attempt Rules by content area
1. A session was attempted if any multiple choice item or non-field test open response item has been answered in the session. (Use original item responses – see special circumstances section II.F)
2. Because of the test design for grade 11 writing, only determine if session 1 was attempted. Session 2 is ignored.
C. Not Tested Reasons by content area
1. Not Tested State Approved Alternate Assessment
b. If content area “Alternate Assessment blank or partially blank reason” is marked, then student is identified as “Not Tested State Approved Alternate Assessment”.
2. Not Tested State Approved First Year LEP (reading and writing only)
a. If content area “First Year LEP blank or partially blank reason” is marked, then student is identified as “Not Tested State Approved First Year LEP”.
3. Not Tested State Approved Special Consideration
a. If content area “Special Consideration blank or partially blank reason” is marked, the student is identified as ”Not Tested State Approved Special Consideration”.
4. Not Tested State Approved Withdrew After October 1
b. If content area “Withdrew After October 1 blank or partially blank reason” is marked and at least one content area session was not attempted, then the student is identified as “Not Tested State Approved Withdrew After October 1”. For grade 11 writing, only use session 1 attempt status.
5. Not Tested State Approved Enrolled After October 1
- If content area “Enrolled After October 1 blank or partially blank reason” is marked and at least one content area session was not attempted, then the student is identified as “Not Tested State Approved Enrolled After October 1”. For grade 11 writing, only use session 1 attempt status.
6. Not Tested Other
a. If content area test was not attempted, the student is identified as “Not Tested Other”.
D. Not Tested Reasons Hierarchy by content area: if more than one reason for not testing at a content area is identified then select the first category indicated in the order of the list below.
7. Not Tested State Approved Alternate Assessment
8. Not Tested State Approved First Year LEP (reading and writing only)
9. Not Tested State Approved Special Consideration
10. Not Tested State Approved Withdrew After October 1
11. Not Tested State Approved Enrolled After October 1
12. Not Tested Other
E. Student Participation Status by content area
1. Tested
a. If the student does not have any content area not tested reasons identified, then the student is considered Tested for the content area.
8. Not Tested: State Approved Alternate Assessment
9. Not Tested: State Approved First Year LEP (reading and writing only)
10. Not Tested: State Approved Special Consideration

Appendix N Decision Rules 20 2007-08 NECAP Technical Report
11. Not Tested: State Approved Withdrew After October 1
12. Not Tested: State Approved Enrolled After October 1
13. Not Tested: Other
F. Special Circumstances by content area
6. Students identified as content area tested and did not attempt all sessions in the test are considered to be “Tested Incomplete.” Not applicable at grade 11 writing.
7. Students identified as content area tested and have at least one of the content area invalidation session flags marked will be treated as “Tested with Non-Standard Accommodations”. Math accommodation F01 also identifies non-standard accommodations for Math.
8. For students identified as “Tested with Non-Standard Accommodations” the content area sessions item responses which are marked for invalidation will be treated as a non-response. For the students with math accommodations F01 marked, the non-calculator session 1 math items will be treated as a non-response.
9. Students identified as tested in a content area will receive released item scores, scaled score, scale score bounds, achievement level, raw total score, subcategory scores, and writing annotations (where applicable).
10. Students identified as not tested in a content area will not receive a scaled score, scaled score bounds, achievement level, writing annotations (where applicable). They will receive released item scores, raw total score, and subcategory scores.
G. Student Participation Summary
Participation Status
Description Raw Score(*)
Scaled Score (**)
Ach. Level
Student Report Ach. Level Text
Roster Ach. Level Text
1 Tested ! ! ! Substantially Below Proficient, Partially Proficient, Proficient, or Proficient with Distinction
1,2,3, or 4
2 Not Tested State Approved Alternate Assessment
! Alternate Assessment A
3 Not Tested State Approved First Year LEP
! First Year LEP L
4 Not Tested State Approved Enrolled After October 1
! Enrolled After October 1 E
5 Not Tested State Approved Withdrew After October 1
! Withdrew After October 1 W
6 Not Tested State Approved Special Consideration
! Special Consideration S
7 Not Tested Other ! Not Tested N
(*) Raw scores are not printed on student report for students with a not tested status.
(**) Grade 11 writing students do not receive a scaled score. The writing achievement level is determined by the total common writing prompt score.

Appendix N Decision Rules 21 2007-08 NECAP Technical Report
VIII. Calculations
A. Rounding
5. All percents are rounded to the nearest whole number
6. All mean scaled scores are rounded to the nearest whole number
7. Grade 11 writing mean (raw) score is rounded to the nearest tenth.
8. Content Area Subcategories: Average Points Earned (student report): round to the nearest tenth.
9. Round non-multiple choice average item scores to the nearest tenth.
B. Students included in calculations based on participation status
3. For number and percent of students enrolled, tested, and not tested categories include all students not excluded by other decision rules.
4. For number and percent at each achievement level, average scaled score, subtopic percent of total possible points and standard error, subtopic distribution across writing prompts, subcategories average points earned, percent/correct average score for each released item include all tested students not excluded by other decision rules.
C. Raw scores
1. For all analysis, non-response for an item by a tested student is treated as a score of 0.
2. Content Area Total Points: Sum the pointes earned by the student for the common items.
D. Item Scores
1. For all analysis, non-response for an item by a tested student is treated as a score of 0.
2. For multiple choice released item data store a ‘+’ for correct response, or A,B,C,D,* or blank
3. For open response released items, store the student score. If the score is not numeric (‘B’), then store it as blank.
4. For students identified as content area tested with non-standard accommodations, then store the released item score as ‘-‘ for invalidated items.
5. For common writing prompt score, the final score of record is the sum of scorer 1 and scorer 2. If both scorers give the student a B(F), then the final score is B(F).
6. For matrix writing prompt score, the final score of record is scorer 1.
E. Scaling
Scaling is done using a look-up table provided by psychometrics and the student’s raw score.
F. SubTopic Item Scores
4. Identify the Subtopic
a. The excel file IREF_ReportingCategories.xls outlines the IREF variables and values for identifying the Content Strand, GLE code, Depth of Knowledge code, subtopics, and subcategories. The variable type in IREF is the source for the Item Type, except the writing prompt item type is reported as “ER”.
5. Student Content Area Subcategories (student report): Subtopic item scores at the student level is the sum of the points earned by the student for the common items in the subtopic. For grade 11 writing, the subtopic score is the final score of record for the common writing prompt.
6. Content Area Subtopic (grade level results report): Subtopic scores are based on all unique common and matrix items. The itemnumber identifies each unique item.
a. Percent of Total Possible Points:
I. For each unique common and matrix item calculate the average student score as follows: (sum student item score/number of tested students administered the item).

Appendix N Decision Rules 22 2007-08 NECAP Technical Report
II. 100 * (Sum the average score for items in the subtopic)/(Total Possible Points for the subtopic) rounded to the nearest whole number.
b. Standard Error Bar: Before multiplying by 100 and rounding the Percent of Total Possible points (ppe) calculate standard error for school,district and state: 100* (square root ( ((ppe)*(1-ppe)/number of tested students)) ) rounded to the nearest whole number
Percent of Total Possible Points +/- Standard Error
G. Grade 11 Writing: Distribution of Score Points Across Prompts.
1. Each prompt is assigned a subtopic based on information provided by program management.
2. The set of items used to calculate the percent at each score point is defined as follows: scorer 1 common prompt score, scorer 2 common prompt score, scorer 1of each matrix prompt. (Note: scores of ‘B’ and ‘F’ are treated as a 0 score for tested students.)
3. Using the set of items do the following to calculate the percent at each score point.
- Step1 A: For each item, calculate the number of students at each score point. Adjust the common item counts by multiplying the common items’ number of students at each score point by 0.5.
- Step 1 B: Calculate the total number of scores by summing up the number of students at each score point across the items in the subtopic
- Step 2: For each score point, sum up the (adjusted) number of students at the score point across the items in the subtopic. Divide the sum by total number of scores for the subtopic. Multiply that by 100 and round to the nearest whole number.

Appendix N Decision Rules 23 2007-08 NECAP Technical Report
4. Example
Common Prompt
Matrix Prompt 1
Matrix Prompt 2
Matrix Prompt 3
Matrix Prompt 4
Matrix Prompt 5
Item C1 C2 M1 M2 M3 M4 M5
Subtopic 1 1 1 2 2 2 3Student Student Item Score
A 3 4 2
B 4 4
C 2 1 3
D 5 2 4
E 3 2 1
F 0 0 2
G 1 2 1
H 6 5 5
I 2 2 1
J 3 2 2
K 5 4 4
Score Point Step 1 Number at each score point
Item C1 C2 M1 M2 M3 M4 M5
Subtopic 1 1 1 2 2 2 30 0.5 0.5 0 0 0 0 0
1 0.5 0.5 1 1 0 1 0
2 1 2.5 1 0 1 1 0
3 1.5 0 1 0 0 0 0
4 0.5 1.5 0 1 0 0 1
5 1 0.5 1 0 0 0 0
6 0.5 0 0 0 0 0 0
Total 15 5 1
Score Point Step 2 Percent at each score point
Subtopic 1 2 3
0 7 0 0
1 13 40 0
2 30 40 0
3 17 0 0
4 13 20 100
5 17 0 0
6 3 0 0
Cumulative Total
5. Include the yearly results where the number tested is greater than or equal to 10
6. Cumulative total N (Enrolled, Not Tested Approved, Not Tested Other, Tested, at each achievement level) is the sum of the yearly results for each category where the number tested is greater than or equal to 10.
7. Cumulative percent for each achievement level is 100*(Number of students at the achievement level cumulative total / number of students tested cumulative total) rounded to the nearest whole number.
8. Cumulative mean scaled score is a weighted average. For years where the number tested is greater than or equal to 10, (sum of ( yearly number tested * yearly mean scaled score) ) / (sum of yearly number tested) rounded to the nearest whole number.

Appendix N Decision Rules 24 2007-08 NECAP Technical Report
H. Average Points Earned Students at Proficient Level (Range)
2. Select all students across the states with Y40 scaled score, where Y=grade. Average the content area subcategories across the students and round to the nearest tenth. Add and subtract one standard error of measurement to get the range.
I. Writing Annotations
2. Students with a writing prompt score of 2-12 receive at least one, but up to five statements based on decision rules for annotations as outlined in Final Statements & Decision Rules for NECAP Writing Annotations.doc. Grade 11 students with the common writing prompt score of F or 0 will also receive annotations.
IX. Report Specific Rules
A. Student Report
1. Student header Information
a. If “FNAME” or “LNAME” is not missing then print “FNAME MI LNAME”. Otherwise, print “No Name Provided”.
b. Print the student’s tested grade
c. For school and district name, print the abbreviated tested school and district ICORE name based on school type decision rules.
d. Print “NH”,”RI”, or “VT” for state.
2. Test Results by content area
c. For students identified as “Not Tested”, print the not tested reason in the achievement level, leave scaled score and graphic display blank.
d. For students identified as tested for the content area then do the following
VI. Print the complete achievement level name the student earned
VII. Print the scaled score the student earned
VIII. Print a vertical black bar for the student scaled score with gray horizontal bounds in the graphic display
IX. For students identified as “Tested with a non-standard accommodation” for a content area, print ‘**’ after the content area earned achievement level and after student points earned for each subcategory.
X. For students identified as “Tested Incomplete” for a content area, place a section symbol after content area earned scaled score.
3. Grade 11 writing graphic display will not have standard error bars. Also, if a student’s total points earned is 0 for writing, do not print the graphic display.
4. Exclude students based on school type and participation status decision rules for aggregations.
5. This Student’s Achievement Compared to Other Students by content area
c. For tested students, print a check mark in the appropriate achievement level in the content area student column. For not tested students leave blank
d. For percent of students with achievement level by school, district and state print aggregate data based on school type and minimum N rules
6. This Student’s Performance in Content Area Subcategories by content area
b. Always print total possible points and students at proficient average points earned range.
c. For students identified as not tested then leave student scores blank
d. For students identified as tested do the following
I. Always print student subcategory scores

Appendix N Decision Rules 25 2007-08 NECAP Technical Report
II. If the student is identified as tested with a non-standard accommodation for the content area then place ‘**” after the student points earned for each subcategory.
e. Print aggregate data based on school type and minimum N-size rules.
5. Writing Annotations
a. For students with writing prompt score of 2-12 print at least one, but up to five annotation statements. Grade 11 students with the common writing prompt score of F or 0 will also receive annotations.
B. School Item Analysis Report by Grade and Subject
13. Reports are created for testing school and teaching school independently.
14. School Header Information
d. Use abbreviated ICORE school and district name based on school type decision rules
e. Print “New Hampshire”, “Rhode Island”, or “Vermont” for State.
f. For NH, the code should print SAU code – district code – school code. For RI and VT, the code should print district code – school code.
15. For multiple choice items, print ‘+’ for correct response, or A,B,C,D,* or blank
16. For open response items, print the student score. If the score is not numeric (‘B’), then leave blank.
17. For students identified as content area tested with non-standard accommodations, print ‘-‘ for invalidated items.
18. All students receive subcategory points earned and total points earned, including grade 11 writing.
19. Leave scaled score blank for not tested students and print the not tested reason in the achievement level column.
20. Exclude students based on school type and participation status decision rules for aggregations.
21. Always print aggregated data regardless of N-size based on school type decision rules.
22. For students identified as not tested for the content area print a cross symbol next to students’ name.
23. For students identified as tested incomplete for the content area print a section symbol next to the scaled score.
24. Home school student are not listed on the report.
C. Grade Level School/District/State Results
9. Reports are run by testing state, testing district, testing school, teaching district, and teaching school using the aggregate school and district codes described in the school type table.
10. Exclude students based on school type and participation status decision rules for aggregations.
11. Report Header Information
c. Use abbreviated school and district name from ICORE based on school type decision rules.
d. Print “New Hampshire”, “Rhode Island”, or “Vermont” to reference the state. The state graphic is printed on the first page.
12. Report Section: Participation in NECAP
c. For testing level reports always print number and percent based on school type decision rules.
d. For the teaching level reports leave the section blank.

Appendix N Decision Rules 26 2007-08 NECAP Technical Report
13. Report Section: NECAP Results by content area
c. For the testing level report always print based on minimum N-size and school type decision rules.
d. For the teaching level report leave Enrolled, NT Approved, and NT Other blank. Print Tested, number and percent at each achievement level, mean scaled score based on minimum N-size and school type decision rules.
14. Report Section: Historical NECAP Results by content area
c. For teaching level report always print current year, prior years, and cumulative total results based on minimum N-size and school type decision rules.
d. For teaching level report leave Enrolled, NT Approved, and NT Other blank. Print Tested, number and percent at each achievement level, mean scaled score based on minimum N-size and school type decision rules.
15. Report Section: Subtopic Results by content area
b. For testing and teaching level reports always print based on minimum N-size and school type decision rules
16. Report Section: Disaggregated Results by content area
c. For testing level report always print based on minimum N-size and school type decision rules.
d. For teaching level report leave Enrolled, NT Approved, and NT Other blank. Print Tested, number and percent at each achievement level, mean scaled score based on minimum N-size and school type decision rules.
D. School/District/State Summary
1. Reports are run by testing state, testing district, testing school, teaching district, and teaching school using the aggregate school and district codes described in the school type table.
2. Exclude students based on school type and participation status decision rules for aggregations.
3. For testing level report print entire aggregate group across grades tested and list grades tested results based on minimum N-size and school type decision rules. Mean scaled score across the grades is not calculated.
4. For the teaching level report leave Enrolled, NT Approved, and NT Other blank. Print Tested, number and percent at each achievement level, mean scaled score based on minimum N-size and school type decision rules. Mean scaled score across the grades is not calculated.
X. Data File Rules
In the file names GG refers to the two digit grade (11) , YYYY refers to the year 0708, DDDDD refers to the district code, and SS refers to two letter state code.
A. State Student Cleanup Data
4. One CSV file per grade and state will be created based on the file layout NECAPYYYYF Gr 03-08 11 Student Demographic Cleanup File Layout.xls.
5. Refer to NECAPYYYYF Gr 03-08 11 Student Demographic Cleanup Description.doc
6. Session Invalidation Flags are marked as follows.
a. If reaaccF02 or reaaccF03 is marked, then mark reaInvSes1, reaInvSes2, and reaInvSes3
b. If mataccF03 is marked, then mark matInvSes1, matInvSes2, and matInvSes03. MataccF01 is left as marked on booklet.
c. If wriaccF03 is marked, then mark wriInvSes1 and wriInvSes2
B. Preliminary State Results
3. A PDF file will be created for each state containing preliminary state results for each grade and subject and will list historical state data for comparison.
4. The file name will be SSPreliminaryResultsDATE.pdf

Appendix N Decision Rules 27 2007-08 NECAP Technical Report
C. State Student Released Item Data
4. Students who tested at a private school are excluded from NH and RI student data files.
5. A CSV file will be created for each state and grade following the layout NECAP YYYY Fall Gr 11 State Student Data Released Item Layout.xls
6. The CSV file name will be NECAP YYYY Fall State Student Data Released Item Gr GG.csv.
D. State Student Raw Data
1. Students who tested at a private school are excluded from NH and RI student data files.
2. A CSV file will be created for each state and grade following the layout NECAP YYYY Fall Gr 11 State Student Raw Data File Layout.xls
3. The CSV file name will be NECAP YYYY Fall State Student Raw Data File Gr GG.csv.
E. State Student Scored Data
1. Students who tested at a private school are excluded from NH and RI student data files.
2. A CSV file will be created for each state and grade following the layout NECAP YYYY Fall Gr 11 State Student Scored Data File Layout.xls
3. The CSV file name will be NECAP YYYY Fall State Student Scored Data File Gr GG.csv.
F. District Student Data
1. Students with the Discode or SendDiscode will be in the district grade specific CSV file for the testing year.
2. Students with a sprDiscode will be in the district grade specific CSV file for the teaching year.
3. Home school students are excluded from district student data files. For NH and RI only public school districts will receive district data files. (Districts with at least one school with schoolsubtypeID=1 in ICORE)
4. Testing and teaching CSV files will be created for each state and grade and district following the layout NECAP YYYY Fall Gr 11 District Student Data Layout.xls
5. The testing CSV file name will be NECAP YYYY Fall Testing District Slice Gr GG_DDDDD.csv. The teaching CSV file name will be NECAP YYYY Fall Teaching District Slice Gr GG_DDDDD.csv.
G. Item Information
1. An excel file will be created containing item information for common items: grade, subject, raw data item name, item type, key, and point value.
2. The file name will be NECAP YYYY Fall Gr 11 Item Information.xls
H. Grade Level Results Report Disaggregated and Historical Data
1. Teaching and testing CSV files will be created for each state and grade containing the grade level results disaggregated and historical data following the layout NECAP YYYY Fall Gr 11 Results Report Disaggregated and Historical Data Layout.xls.
2. Data will be suppressed based on minimum N-size and report type decision rules.
3. The testing file name will be NECAP YYYY Fall Testing Results Report Disaggregated and Historical Data Gr GG.csv . The teaching file name will be NECAP YYYY Fall Teaching Results Report Disaggregated and Historical Data Gr GG.csv.
I. Grade Level Results Report Participation Category Data
1. Teaching CSV file will be created for each state and grade containing the grade level results participation data following the layout NECAP YYYY Fall Gr 11 Results Report Participation Category Data Layout.xls.
2. The testing file name will be NECAP YYYY Fall Testing Results Report Participation Category Data Gr GG.csv

Appendix N Decision Rules 28 2007-08 NECAP Technical Report
J. Grade Level Results Report Subtopic Data
1. Teaching and testing CSV files will be created for each state and grade containing the grade level results subtopic data following the layout NECAP YYYY Fall Gr 11 Results Report Subtopic Data Layout.xls.
2. Data will be suppressed based on minimum N-size and report type decision rules.
3. The testing file name will be NECAP YYYY Fall Testing Results Report Subtopic Data Gr GG.csv . The teaching file name will be NECAP YYYY Fall Teaching Results Report Subtopic Data Gr GG.csv.
K. Released Item Percent Responses Data
1. The CSV files will only contain state level aggregation for released items.
2. Teaching and testing CSV files will be created for each state and grade containing the released item analysis report state data following the layout NECAP YYYY Fall Gr 11 Released Item Percent Responses Layout.xls.
3. The testing file name will be NECAP YYYY Fall Testing Released Item Percent Responses.csv . The teaching file name will be NECAP YYYY Fall Teaching Released Item Percent Responses.csv.
L. Invalidated Students Original Score
1. Original raw scores for students whose responses were invalidated for reporting will be provided.
2. Students who tested at a private school are excluded from NH and RI student data files.
3. A CSV file will be created for each state and grade following the layout NECAP YYYY Fall Gr 11 State Invalidated Student Original Scored Data File Layout.xls.
4. The CSV file name will be NECAP YYYY Fall State Student Scored Data File Gr GG OriScInvStu.csv.
M. Multiple Choice Response Distribution Data Grades 11
1. One CSV file will be created containing the frequency of multiple responses (*) for multiple choice items.
2. All students are included in the frequencies.
3. The file will follow the layout NECAP YYYY Fall Multiple MC Responses Freq Layout.xls and will be named NECAP YYYY Fall Multiple MC Responses Freq.xls.
Addenda
2/4/2008: The writing student’s at proficient extended response range on the student report will be ‘7’.
2/6/2008: Summary results data files will be created as follows:
1. Teaching and testing CSV files will be created for each state and grade containing the summary report data following the layout NECAP YYYY Fall Gr 11 Summary Results Layout.xls.
2. Data will be suppressed based on minimum N-size and report type decision rules.
3. The testing file name will be NECAP YYYY Fall Testing Summary Results Gr GG.csv . The teaching file name will be NECAP YYYY Fall Teaching Summary Results Gr GG.csv.