Embed Size (px)
Citation preview

PREPRINT
Neutronic Analysis of the PSBR Using a Burnup-Coupled MCNPSimulation with MUREDagıstan Sahin,a*† Kenan Unlü,a and Kostadin Ivanovb
aThe Pennsylvania State University, Radiation Science and Engineering Center, University Park,Pennsylvania 16802bThe Pennsylvania State University, Department of Mechanical and Nuclear Engineering, University Park,Pennsylvania 16802
Received August 14, 2015Accepted for Publication November 4, 2015http://dx.doi.org/10.13182/NT15-110
Abstract — The main goal of this study is to verify the accuracy of burnup-coupled neutronic calculations whenemploying the Monte Carlo Utility for Reactor Evolutions (MURE) and MCNP5 codes for modeling TRIGA-typereactors, in this case the Penn State Breazeale Reactor (PSBR) core. Research and educational requirementsmainly direct the PSBR operating schedule. With such operating schedules, one particular area of concern,specifically relating to nuclear analytical applications, is time-dependent changes in the neutronic characteristicsof the reactor, specifically within the irradiation positions. Particular concern exists among scientists performingneutron activation analysis measurements as to whether continuous variations in reactor operations would causesignificant fluctuations in the neutronic characterization parameters of the irradiation positions. A secondaryobjective of this study is to analyze fluctuations in the neutronic characterization parameters and their dependenceon various core conditions as examined by detailed burnup-coupled neutronic simulations. In this study, aburnup-coupled neutronic simulation model of the PSBR is developed using the MURE and MCNP5 codes. Thesimulation results are verified by a series of experiments including measurements of the core excess reactivitystarting from the first core loading in 1965 to 2012, control rod worth, fission product buildup, temperature-dependent reactivity loss, integral control rod worth curves, individual fuel element worth, and neutron flux. Localneutronic calculations of the simulation are confirmed by measuring neutronic characterization parameters forone of the irradiation positions within the PSBR core, namely, dry irradiation tube 1. Analyzing time-dependentdata predicted by the simulation, the neutron temperature and the measure of the nonideal epithermal neutron fluxdistribution are found to be reasonably static. Conversely, the thermal-to-epithermal neutron flux ratio andspectral index are found to be relatively responsive to alterations in the core.
Keywords — Burnup-coupled neutronic analysis, neutron activation analysis, neutron flux characterization.
Note — Some figures may be in color only in the electronic version.
I. BACKGROUND/MOTIVATION
The Penn State Breazeale Reactor (PSBR) is a 1-MWTRIGA Mark III–type reactor. The first core, which was aMaterial Testing Reactor, went critical in 1955 and wasreplaced with a TRIGA Mark II core in 1965. PSBR has
had a well-documented operational history since 1955.The current maximum operating power is 1 MW(thermal).The core power can pulse up to 2000 MW(thermal).PSBR serves as a teaching and research reactor at thePennsylvania State University Radiation Science andEngineering Center (RSEC). In 1998, two additional irra-diation positions were installed in the PSBR core forroutine neutron activation analysis (NAA) research. Thesewere air filled aluminum tubes, called dry irradiation tube1 (DT-1) and dry irradiation tube 2 (DT-2).
*E-mail: [email protected]†Current address: National Institute of Standards and Technology,Center for Neutron Research, Gaithersburg, Maryland 20899
NUCLEAR TECHNOLOGY · VOLUME 194 · 000 –000 · JUNE 2016
1

PREPRINT
The primary goal of this study is to perform a detailedburnup-coupled neutronic analysis of the PSBR core start-ing with the core loading in 1965 to 2012 using a burnup-coupled neutronic analysis simulation developed with theMonte Carlo Utility for Reactor Evolutions (MURE) andMCNP5 (Version 1. 51) codes.1–5 By performing the calcu-lations, the accuracy and applicability of the MURE code fora TRIGA-type reactor, where the operation schedule is quiterandom, were investigated. As far as we know, this is the firstattempt to use the MURE code for burnup-coupled neutronicanalysis of a TRIGA reactor.
Neutron transport equations describe the neutron den-sity distribution in the vicinity of an irradiation position.However, NAA methods, such as a single comparator orabsolute methods, rely on simplified representations of theneutron density distribution, such as the Høgdahl and/orWestcott depictions.6–12 A set of neutron flux character-ization parameters, namely, the thermal-to-epithermalneutron flux ratio f, the measure of the nonideal epither-mal neutron flux distribution �, spectral index (r �Tn/To),and neutron temperature Tn, are defined to reflect theindividual neutronic characteristics of a specific location.
The operating schedule of the PSBR causes fluctua-tions in temperature distribution and fission product con-centrations throughout the core. These fluctuations areknown to cause unknown uncertainty in NAA measure-ments of the PSBR irradiation positions.13,14 It is essentialto evaluate whether changes in the core and reactor oper-ations would affect these parameters. Specifically, whenusing single comparator NAA methods, changes may leadto inaccurate quantification of elemental masses. The sim-ulation results were used to examine the effects of oper-ation schedule and core changes on these neutron fluxcharacterization parameters. Therefore, a secondary objec-tive was to quantify and analyze changes in the neutron fluxcharacterization parameters using the burnup-coupled neu-tronic analysis simulation.
The study in this paper is described in three sectionsfollowed by a summary. Section II describes the newcross-section data that were generated for these simula-tions and modeling details of the PSBR core and externalstructures. Section III reviews burnup-coupled neutronicanalysis results and compares them with measurements.The final section verifies the local neutronic characteriza-tion capabilities of the simulation by analyzing an irradi-ation tube within the PSBR core.
In all figures and tables in this paper except for Sec. IV,error bars are 2� (95% confidence interval, considering cal-culational errors only) and 10% of the measured value for thecalculated values and the measurement results, respectively.In Sec. IV, the measurement results are listed with 1� mea-
surement uncertainty, and the calculated values are given 2�(95% confidence interval) error bars.
II. PSBR BURNUP ANALYSIS USING MURE
The MURE advanced code library is written in C��for nuclear reactor neutronic analysis, including an inte-grated burnup calculation module and coupling mecha-nisms for MCNP and thermal-hydraulic calculation codelibraries.5 MURE consists of four operational modules.The first module deals with the creation of the MCNPinput files for complex geometries. The next module thencreates an abstract nuclear reaction/decay tree followingpossible transmutation reactions and radioactive decayschemes for elements within each cell of the MCNPgeometry. The third module sets up the Bateman’s differ-ential equations for the abundance of each isotope in thesecells and then solves them using an adaptive Runge-Kuttanumerical integration. MURE uses the cell-averaged mul-tigroup neutron flux (F4 tally) and cross-section datadirectly from MCNP5 output in these equations. Thefourth MURE module is for coupling with thermal-hydraulic codes, which can also couple to a simplifiedthermal-hydraulic code or the Coolant Boiling in RodArrays (COBRA-EN) subchannel code.
The change in atom density Ni within fuel elements isgoverned by decay, burnup, and production for isotope ias given by Bateman’s equation (adapted from Ref. 4):
�Ni
�t� ��iNi � Ni �
i��i
r(E) � �(E, t) dE
�j�i
�jj¡iNj � j¡i �
j�iNj ��j
j¡i(E) � �(E, t) dE ,
(1)
where
� � decay constant
E � energy of neutrons
i, j � index numbers for the target andproduct isotopes, respectively
� j¡i � proportion of decay branch of iso-tope j decaying to isotope i
��(E, t) � multigroup cell-averaged neutronflux calculated by MCNP
�ij¡i(E) � multigroup cross section for a cap-
ture reaction transforming isotope jinto i
�ir(E) � removal cross section at cell
temperature.
2 SAHIN et al. · NEUTRONIC CHARACTERIZATION OF THE PSBR IRRADIATION POSITIONS
NUCLEAR TECHNOLOGY · VOLUME 194 · JUNE 2016

PREPRINT
II.A. Temperature-Dependent Cross-SectionGeneration Using ENDFB-VII Data Files with NJOY
The PSBR core has a negative temperature feedbackcoefficient of reactivity. PSBR core fuel elements aredeployed in two enrichment levels of uranium (uraniummass fractions of 8.5% and 12%) in ZrH. At highertemperatures, because of the negative Doppler feedbackeffect, hydrogen in the fuel negatively affects the neutroneconomy due to upscattering. Accurate modeling of thisphenomenon is necessary to have a reasonable neutronicsimulation for the PSBR core. The previously available 50K interval cross-section data were not sufficient to accu-rately predict the excess reactivity loss, especially atpower levels �500 kW (Ref. 15). New cross-section datawere generated using NJOY for an extended list of iso-topes, with 10 K intervals.
ENDF/B-VII incident neutron data files were used toproduce A Compact ENDF (ACE) cross-section data filesfor 86 isotopes (as listed in Table I) at temperatures between293.72 and 900 K with 10 K intervals. The NJOY data-processing code system commands (moder, reconr, broadr,heatr, gaspr, thermr, purr, and acer) were used to manipulatethe data files.16 The resulting ENDF files were then loadedfor each isotope and converted into energy-dependent, point-wise PENDF data files. The PENDF data were then manip-ulated for a given temperature and then linearly interpolatedfor the resonance region. The resulting data were Dopplerbroadened for unresolved resonances, corrected for self-shielding, and saved as ACE formatted files for use in sub-sequent MCNP calculations.
II.B. Implementation of the PSBR CoreSimulation Model
The PSBR core consists of about 100 fuel elements,including 2 instrumented fuel elements, 4 control rods,10 graphite elements, and a detachable D2O tank. Theelevation and plan views of the MCNP model for thePSBR core are shown in Figs. 1 and 2, respectively.Simplifying assumptions were employed to limit thecomputational time. The fuel elements and the controlrod bottom and top latching structures were ignored,due to relatively low importance within neutronic cal-culations. Each fuel element was divided horizontallyinto five homogeneous fuel meat sections. The fuelelement radius remains constant (no swelling occurs)
TABLE I
List of Isotopes for Which Temperature-DependentCross-Section Data Were Generated Using NJOY
1H 54Cr 94Zr 133Cs 151Eu 239Pu2H 55Mn 96Zr 134Cs 152Eu 240Pu10B 54Fe 95Mo 135Cs 153Eu 241Pu11B 56Fe 97Mo 139La 154Eu 242PuC-natural 57Fe 99Tc 141Pr 155Eu 241Am14N 58Fe 101Ru 143Nd 154Gd 242Am24Mg 58Ni 102Ru 144Nd 155Gd25Mg 60Ni 103Rh 145Nd 156Gd26Mg 61Ni 105Rh 148Nd 157Gd27Al 62Ni 105Pd 147Pm 158Gd28Si 64Ni 108Pd 148Pm 234U29Si 83Kr 109Ag 147Sm 235U30Si 90Zr 113Cd 149Sm 236U50Cr 91Zr 129I 150Sm 238U52Cr 92Zr 131Xe 151Sm 237Np53Cr 93Zr 135Xe 152Sm 238Pu
Fig. 1. Elevation view of the MCNP model of the PSBRcore.
Fig. 2. Plan view of the MCNP model of the PSBR corecoupled to the D2O tank.
NEUTRONIC CHARACTERIZATION OF THE PSBR IRRADIATION POSITIONS · SAHIN et al. 3
NUCLEAR TECHNOLOGY · VOLUME 194 · JUNE 2016

PREPRINT
even at higher temperatures. Burnup and decay calcu-lations were also simplified. Only isotopes with a half-life �3 h and concentration at �1010 mol/m3 wererecorded for evolutions to the following step. Onlysignificant neutron interaction probabilities were con-sidered; i.e., the natural log energy-averaged reactioncross section ε for any neutron-induced reaction is�102 b (1 b � 1024 cm2) (Ref. 4), where the naturallog energy-averaged cross section is given as
���(E) log(E) dE
�log(E) dE
. (2)
A total of 17900 energy groups were logarithmicallydistributed within the thermal reactor neutron energyrange (0 to 20 MeV) and used for the MCNP neutron fluxtally (F-4) as listed in Table II.
II.B.1. External Components
The PSBR core resides in a high-purity water poolkept at 300 K. A D2O tank is also coupled to thePSBR core for beam port irradiation experiments asshown in Fig. 2. The D2O tank model was approximatedas an aluminum cylinder container. There is a penetra-tion hole in the D2O tank, for the beam port neutronguides to conjugate.
II.B.2. Fuel Elements
The fuel meat of each fuel element is divided into fivesections. Material information and burnup calculations areperformed separately for each of these sections. A sche-matic drawing of the fuel element elevation view, asimplemented in the simulation, is shown in Fig. 3.
The temperature of each section of the fuel elementmodel was set independently by a linear interpolationusing temperature measurements from the instrumentedfuel elements. Let us define the power generated in a fuel
element section as Pcell and the local power of an instru-mented fuel element center section as Pinst. An averagetemperature in any fuel element section Tcell can be cal-culated by linear interpolation using measured tempera-ture values Tinst and Pinst using
Tcell �Pinst, j1 � Pcell
Pinst, j1 � Pinst, j(Tinst, j1 � Tinst, j) Tinst, j , (3)
where index j and j 1 mark the sections of instrumentedfuel element below and above the cell temperature,respectively.
II.B.3. Control Rod
There are four control rods used to monitor anddrive the PSBR nuclear reactor. Three of them arefuel-follower control rods, where a neutron absorber
TABLE II
Multigroup Energy Intervals Used in Neutronic Simulation
Energy RangeEnergy
Interval (eV)Number of
Groups
1 0 to 1 4002 1 to 10 5003 10 to 104 150004 104 to 105 10005 105 to 2 � 107 1000
Fig. 3. Fuel-follower control rod (left) and fuel element(right) models for the PSBR core, elevation view (dimen-sions in units of centimeters).
4 SAHIN et al. · NEUTRONIC CHARACTERIZATION OF THE PSBR IRRADIATION POSITIONS
NUCLEAR TECHNOLOGY · VOLUME 194 · JUNE 2016

PREPRINT
(B4C) was followed by a fuel element. Fuel-followercontrol rods are called the safety rod (SA), shim rod(SH), and regulating rod (RR). The last control rod isan air-follower control rod, called the transient rod(TR). The fuel meat of the first three fuel-followercontrol rods was divided into five sections as shown inFig. 3. The TR is a B4C rod in an air-filled aluminumrod. All fuel-follower control rods were replaced oncewith new rods, in 1994 (Ref. 17).
II.B.4. Graphite Element
Graphite elements with aluminum cladding were usedat the perimeter of the core starting in 2009 as a reflectorfor the PSBR core. The graphite elements were laterremoved in the recent core loading in 2012.
II.B.5. Dry Irradiation Tubes and PneumaticTransmission System
Dry irradiation tubes and pneumatic transmission sys-tem (PTS) tubes are modeled as air-filled, infinite alumi-num tubes in the simulation as displayed in Fig. 4. ThePTS tube is not stationary; therefore, it was replaced withwater in the model during burnup calculations.
III. MEASUREMENTS AND VERIFICATION OF THENEUTRONIC MODEL
The accuracy of the neutronic simulation usingMCNP depends on careful geometrical and compositionalmodeling, as well as the number of particle historiessimulated, and the effective and ineffective numbers ofcycles used in the computation. One measure of accurateMCNP simulation is to perform a convergence analysis.
III.A. Convergence Analysis for MCNP Simulation ofthe PSBR Core
Convergence analysis of an MCNP simulation is asessential as complete and accurate modeling of the sys-tem. Figure 5 shows the relative entropy for the effectivemultiplication factor keff calculated by MCNP within aburnup step, at 900 kW for the first 150 inactive simula-tion cycles. The numbers of particles per cycle (histories),inactive cycles, and active cycles was 5 � 104, 300, and1000, respectively. Relative entropy was calculated(assuming each cycle has a discrete distribution) using theKullback-Leibler formulation, given as18
Re,i � keff,i1 � log2�keff,i1
keff,i� , (4)
where Re,i is the relative entropy for the i’th cycle and keff
is the calculated effective criticality. Although keff valuesconverge quickly as seen in Fig. 6, this does not neces-sarily mean that the fission source distribution has con-verged. The Shannon entropy source distribution is acritical parameter that is available in the MCNP output,and it is used to validate MCNP simulation sourceconvergence.19 It is possible to have a converged keff with-out having a converged fission source.19 The Shannonsource entropy of the fission source distribution for thesame MCNP simulation is shown in Fig. 7. In Fig. 7, theShannon source entropy value for each cycle is plottedagainst the subsequent cycle value to show the conver-gence of source entropy.
As shown in Figs. 6 and 7, it is clear that the sourceconvergence occurs after the first five MCNP cycles.
III.B. Burnup Calculations for the PSBR SpanningYears 1965–2012
To perform burnup calculations, core loadings since1965 (after the core conversion to TRIGA Mark II) wereidentified by investigating the PSBR operation logbooks.Burnup and decay times, excess reactivity, mean operat-ing power, average critical control rod positions (given in
Fig. 4. Dry irradiation tube and fuel elements, elevationview (dimensions in units of centimeters).
NEUTRONIC CHARACTERIZATION OF THE PSBR IRRADIATION POSITIONS · SAHIN et al. 5
NUCLEAR TECHNOLOGY · VOLUME 194 · JUNE 2016

PREPRINT
Fig. 5. Relative entropy in effective multiplication factor calculated by MCNP.
Fig. 6. Effective criticality constant for 5 � 104 histories/cycle.
Fig. 7. Shannon fission source iterative convergence at each cycle in sequence.
6 SAHIN et al. · NEUTRONIC CHARACTERIZATION OF THE PSBR IRRADIATION POSITIONS
NUCLEAR TECHNOLOGY · VOLUME 194 · JUNE 2016
PREPRINT
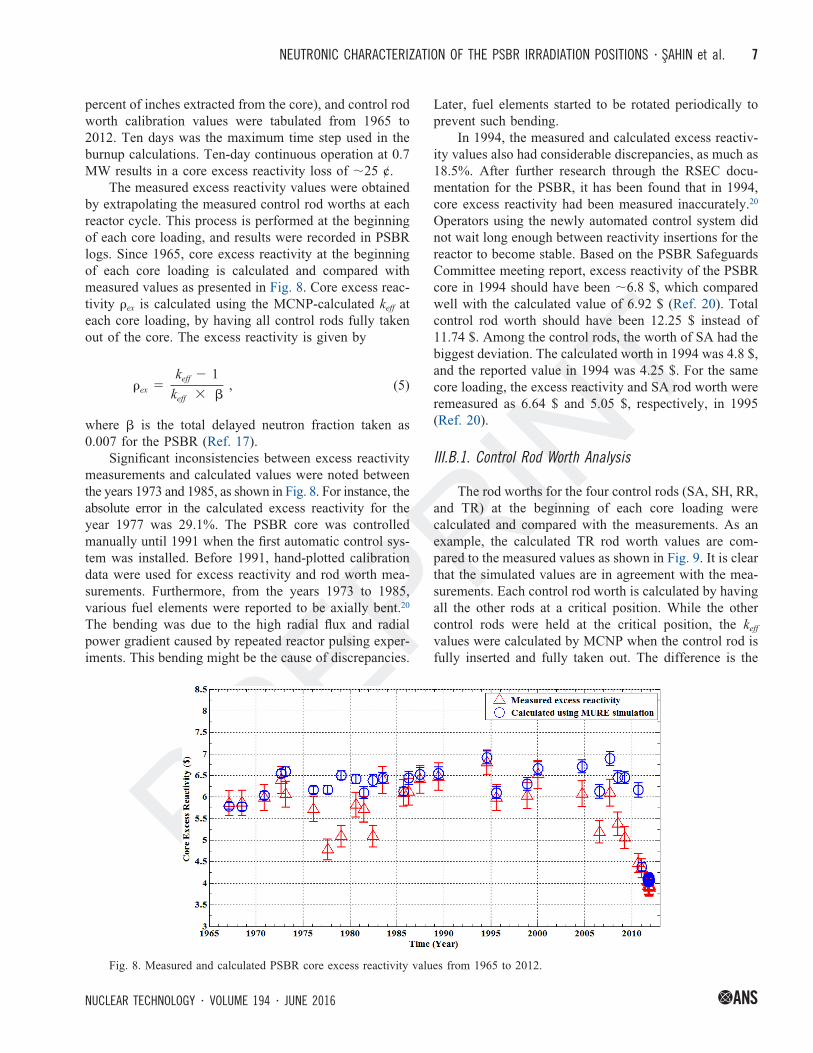
percent of inches extracted from the core), and control rodworth calibration values were tabulated from 1965 to2012. Ten days was the maximum time step used in theburnup calculations. Ten-day continuous operation at 0.7MW results in a core excess reactivity loss of 25 ¢.
The measured excess reactivity values were obtainedby extrapolating the measured control rod worths at eachreactor cycle. This process is performed at the beginningof each core loading, and results were recorded in PSBRlogs. Since 1965, core excess reactivity at the beginningof each core loading is calculated and compared withmeasured values as presented in Fig. 8. Core excess reac-tivity �ex is calculated using the MCNP-calculated keff ateach core loading, by having all control rods fully takenout of the core. The excess reactivity is given by
�ex �keff � 1
keff � �, (5)
where is the total delayed neutron fraction taken as0.007 for the PSBR (Ref. 17).
Significant inconsistencies between excess reactivitymeasurements and calculated values were noted betweenthe years 1973 and 1985, as shown in Fig. 8. For instance, theabsolute error in the calculated excess reactivity for theyear 1977 was 29.1%. The PSBR core was controlledmanually until 1991 when the first automatic control sys-tem was installed. Before 1991, hand-plotted calibrationdata were used for excess reactivity and rod worth mea-surements. Furthermore, from the years 1973 to 1985,various fuel elements were reported to be axially bent.20
The bending was due to the high radial flux and radialpower gradient caused by repeated reactor pulsing exper-iments. This bending might be the cause of discrepancies.
Later, fuel elements started to be rotated periodically toprevent such bending.
In 1994, the measured and calculated excess reactiv-ity values also had considerable discrepancies, as much as18.5%. After further research through the RSEC docu-mentation for the PSBR, it has been found that in 1994,core excess reactivity had been measured inaccurately.20
Operators using the newly automated control system didnot wait long enough between reactivity insertions for thereactor to become stable. Based on the PSBR SafeguardsCommittee meeting report, excess reactivity of the PSBRcore in 1994 should have been 6.8 $, which comparedwell with the calculated value of 6.92 $ (Ref. 20). Totalcontrol rod worth should have been 12.25 $ instead of11.74 $. Among the control rods, the worth of SA had thebiggest deviation. The calculated worth in 1994 was 4.8 $,and the reported value in 1994 was 4.25 $. For the samecore loading, the excess reactivity and SA rod worth wereremeasured as 6.64 $ and 5.05 $, respectively, in 1995(Ref. 20).
III.B.1. Control Rod Worth Analysis
The rod worths for the four control rods (SA, SH, RR,and TR) at the beginning of each core loading werecalculated and compared with the measurements. As anexample, the calculated TR rod worth values are com-pared to the measured values as shown in Fig. 9. It is clearthat the simulated values are in agreement with the mea-surements. Each control rod worth is calculated by havingall the other rods at a critical position. While the othercontrol rods were held at the critical position, the keff
values were calculated by MCNP when the control rod isfully inserted and fully taken out. The difference is the
Fig. 8. Measured and calculated PSBR core excess reactivity values from 1965 to 2012.
NEUTRONIC CHARACTERIZATION OF THE PSBR IRRADIATION POSITIONS · SAHIN et al. 7
NUCLEAR TECHNOLOGY · VOLUME 194 · JUNE 2016

PREPRINTcalculated control rod worth. Measured control rod worths
are taken from PSBR logbooks.
III.B.1.a. Control Rod Model Adjustment
After several attempts analyzing control rod worthcurves and comparing with measurements, it was foundthat the density of the B4C absorber material in the controlrods had to be adjusted. The absolute errors between themeasured rod worth values and the calculation resultswere as much as 21%, specifically toward the upper partsof the rods (after 25 cm). A possible effect is the fact thatthe impact of the fuel composition and neutron spectrawas neglected in the analysis. The control rods were keptat the critical positions of each fuel cycle during long-termburnup calculations, limiting accurate capture in a com-positional change in the fuel portion as well as absorberportions. Furthermore, the control rods were kept inoperation from 1965 to 1994 without replacement. Thelack in accurate composition due to burnup could beeasily simulated by iteratively adjusting the absorberdensity until the calculations are in agreement with themeasurements.17,21 Elemental compositions 1 and 2 aslisted in Table III employ the manufacturer-specifiedelemental compositions and adjusted density valuesfor the fuel-follower and air-follower control rodabsorber materials, respectively. The final densitieswere found by iterative calculations and comparisons tomeasurements.
A control rod calibration was performed as a periodicmeasurement on August 29, 2011. The corresponding
measurement results and calculated values before andafter the density adjustment were compared as shown inTable IV. After the adjustment, the maximum absoluteerror between the measured rod worth and calculatedrod worth values was 4%. In Table IV, the agreementbetween the calculated values with the measured valueswas quantified based on the z-factor. The z-factor isgiven as22
z-factor ��Vmeasured � Vcalculated�
��measured2 � calculated
2, (6)
where
Vmeasured, Vcalculated � measured and calculated values,respectively
�measured, �calculated � uncertainties of the measured andcalculated values, respectively.
Fig. 9. Calculated and measured TR worth from 1965 to 2012.
TABLE III
Elemental Compositions and Densities of Control RodAbsorber Material Used in This Work
Number
10B MassFraction
(%)
11B MassFraction
(%)
CarbonMass
Fraction (%)
Density(g/cm3)
1 3.18 12.82 84 2.52 3.18 12.82 84 1.13
8 SAHIN et al. · NEUTRONIC CHARACTERIZATION OF THE PSBR IRRADIATION POSITIONS
NUCLEAR TECHNOLOGY · VOLUME 194 · JUNE 2016

PREPRINT
The closer the z-factor is to zero, the better is theagreement between the values. If the z-factor is �3, theresult is not acceptable.
For further verification of the adopted densities, theadopted control rod elemental compositions were verifiedagainst an integral control rod worth measurement on July11, 1999. Integral control rod worth curves were calcu-lated and compared with the measurements. As an exam-ple, calculated and measured integral rod worth curves ofthe SA rod were in agreement as shown in Fig. 10.
III.B.1.b. Measured and Calculated Temperature-Dependent Reactivity Loss
A temperature-dependent excess reactivity lossmeasurement was completed for core loading 52 onNovember 15, 2004. Calculated reactivity loss valueswere compared with the measured values as presentedin Fig. 11. Figure 11 clearly demonstrates the ability to
model the temperature reactivity feedback for thePSBR core.
III.B.1.c. Fission Product Buildup
For power reactor applications, changes in neutroncharacteristics related to startup and shutdown are minorcompared to long-term operation. However, for a TRIGA-type, low-power research reactor, such as the PSBR, thesechanges are significant. An experiment was performed toevaluate the impact of fission product buildup/decay in thePSBR core. During the experiment, the PSBR (after along cooldown, when most of the effective fission prod-ucts such as 135Xe have decayed sufficiently) was operatedat a constant power of 700 kW for 45 h. Control rodpositions were used to record core excess reactivity, every5 h. The measured and calculated values were in agree-ment as shown in Fig. 12. The measured excess reactivityvalues are based on extrapolation of measured control rod
TABLE IV
Measured and Calculated Control Rod Worth Values Using Before and After Adjustment of Densities
NameMeasuredWorth ($)
Calculated Worth Using OriginalDensities (z-Factor) ($)a
Calculated Worth Using AdoptedDensities (z-Factor) ($)a
Transient rod 2.78 � 0.28 3.15 � 0.06 (1.3) 2.79 � 0.06 (0.04)Safety rod 3.64 � 0.36 4.42 � 0.06 (2.2) 3.68 � 0.06 (0.1)Shim rod 2.73 � 0.27 3.20 � 0.06 (1.7) 2.83 � 0.06 (0.4)Regulating rod 2.81 � 0.28 3.27 � 0.06 (1.6) 2.84 � 0.06 (0.1)
aWhile keeping other rods at the critical position, each control rod is fully inserted and removed to calculate total rod worth. Thez-factor values are given in parentheses.
Fig. 10. Measured and calculated integral control rod worth for SA.
NEUTRONIC CHARACTERIZATION OF THE PSBR IRRADIATION POSITIONS · SAHIN et al. 9
NUCLEAR TECHNOLOGY · VOLUME 194 · JUNE 2016

PREPRINT
worth values. The calculated excess reactivity values wereobtained by taking all control rods out at each step tocalculate keff. The difference between the keff values at eachstep with the control rods at the critical position andcontrol rods fully out is converted to equivalent reactivityusing Eq. (5).
III.B.1.d. Fuel Element and D2O Tank Worth
Further validation of burnup calculations was com-pleted for individual fuel elements. Four fuel elementswere removed one at a time out of the PSBR core. The
reactivity worths for these fuel elements were measuredon April 26, 2004. Additionally, the D2O tank worth wasmeasured on January 9, 2011. The measured and calcu-lated fuel element and D2O tank worth values are given inTable V.
III.B.1.e. Neutron Flux Measurements at the PSBRIrradiation Positions
Local neutronic calculations were verified againstneutron activation measurements using gold-aluminumwires (AuAl, 0.112% Au). The positioning and dimensions of
Fig. 11. Measured and calculated core excess reactivity loss at operating powers 0.05 to 1000 kW.
Fig. 12. Measured and calculated excess reactivity loss due to fission product buildup in 45 h at 700 kW.
10 SAHIN et al. · NEUTRONIC CHARACTERIZATION OF THE PSBR IRRADIATION POSITIONS
NUCLEAR TECHNOLOGY · VOLUME 194 · JUNE 2016

PREPRINT
the gold aluminum wires in the DT-1 and DT-2 irradiationpositions were as shown in Fig. 4. After irradiation, thewires were cut into 2.54-cm pieces, and gamma spectros-copy was performed using a CanberraTM Model GC1518high-purity germanium detector. Self-shielding, decay,interference, background, and efficiency corrected satura-tion activities were analyzed and compared with simula-tion results. Calculations of saturation activities wereperformed using the burnup-coupled MCNP simulationwith the calculated compositions at the measurement timefor the gold-aluminum wires.
The AuAl wires were irradiated for 2 min at 500 kWfor the first measurement performed on September 16,2011. The measured and calculated saturation activitiesare shown in Fig. 13. Reproducibility of these results wasverified with subsequent measurements in March 2012and on June 15, 2012, at 800 kW.
The final saturation activity measurement was per-formed after the installation of a commercial sample. Thecommercial sample was aligned to the fuel element centerat a position close to the DT-1 position, one fuel elementapart. The sample was 15.2 cm in length and contained anapproximate mass fraction of 22% natural boron. Theneutron flux depression observed in DT-1 due to thiscommercial sample in measured and calculated saturationactivities is presented in Fig. 14.
IV. ANALYSIS OF THE NEUTRONIC CHARACTERIZATIONPARAMETERS FOR THE DRY IRRADIATION TUBES
Once the neutronic simulation was verified by mea-surements, time-dependent analysis of the neutron fluxcharacterization parameters was performed for the PSBRdry irradiation tubes. The neutronic model was first usedto calculate the reaction rate probabilities in the PSBRirradiation position, DT-1, for a set of isotopes. The result-ing reaction rate probabilities were iteratively fitted tomodified Westcott functions to calculate the neutron fluxcharacterization parameters.6–12 The calculated Westcottthermal, resonance, and fission spectrum averaged (fast)neutron flux in DT-1 are given in Table VI. Calculatedthermal-to-epithermal neutron flux ratio f, measure of thenonideal epithermal neutron flux distribution �, spectralindex (r �Tn/To), and neutron temperature Tn are given inTable VII. Normalized values of the measure of nonidealepithermal neutron flux distribution � and thermal-to-epithermal neutron flux ratio f are plotted together in Fig.15 for a 7-month period to visualize the changes in these
TABLE V
Neutronic Simulation Calculated and MeasuredWorth for D2O Tank and Fuel Elements
NameWorth (¢)
Measured Calculated z-Factor
Fuel element 34 11 � 1 15 � 5 0.8Fuel element 203 23 � 2 26 � 5 0.6Fuel element 121 30 � 3 32 � 5 0.3Fuel element 126 45 � 5 42 � 5 0.4D2O tank 66 � 7 69 � 7 0.3
Fig. 13. Measured and calculated saturation activity of gold wire segments along DT-1 (irradiated for 2 min at 500 kW onSeptember 16, 2011).
NEUTRONIC CHARACTERIZATION OF THE PSBR IRRADIATION POSITIONS · SAHIN et al. 11
NUCLEAR TECHNOLOGY · VOLUME 194 · JUNE 2016

PREPRINT
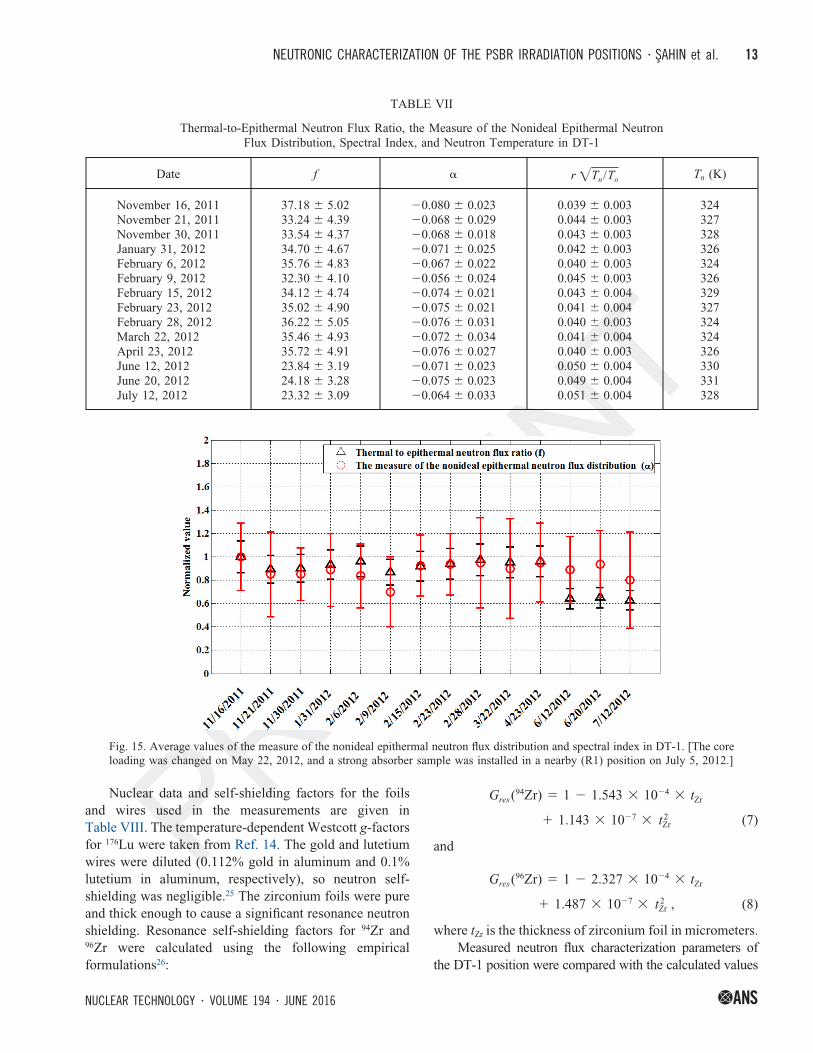
parameters. Even the changes for � mostly remain withinthe uncertainty of the calculations; significant changes inf values (specifically after the core loading change in May2012) are visible as shown in Fig. 15.
The computed neutron flux characterization param-eters were verified against two subsequent measure-ments. Thermal-to-epithermal neutron flux ratio f wasmeasured using the bi-isotropic method.23 The measureof nonideal epithermal neutron flux distribution � was
measured by using the bare triple method.23 Spectralindex r �Tn /To was measured using the bare dual mon-itor method.24 Neutron temperature Tn was measuredusing lutetium wires.24 Uncertainties in the measuredneutron flux characterization parameters f, �, r �Tn /To,and Tn were calculated as the sum of the fixed uncer-tainty from the nuclear data and the experimentaluncertainty due to the measured activities, as explainedin Ref. 23.
Fig. 14. Measured and calculated saturation activity of gold wire segments along DT-1 (irradiated for 2 min at 800 kW on July5, 2012).
TABLE VI
Westcott Thermal, Resonance, and Fast Neutron Flux in DT-1 During IrradiationsPerformed at 800 kW (PSBR Core Coupled to the D2O Tank)
DateWestcott Neutron Flux ( n
cm2·s)Thermal (1012) Resonance (1011) Fast (1012)
November 16, 2011 7.99 � 0.42 3.11 � 0.18 3.72 � 0.87November 21, 2011 7.84 � 0.41 3.41 � 0.19 3.81 � 0.85November 30, 2011 7.87 � 0.39 3.39 � 0.18 3.61 � 0.75January 31, 2012 7.94 � 0.43 3.30 � 0.2 3.20 � 0.92February 6, 2012 8.04 � 0.42 3.25 � 0.19 3.30 � 0.78February 9, 2012 7.82 � 0.35 3.50 � 0.16 3.76 � 0.82February 15, 2012 7.81 � 0.46 3.31 � 0.2 3.72 � 0.15February 23, 2012 7.94 � 0.47 3.28 � 0.21 3.33 � 0.91February 28, 2012 7.92 � 0.47 3.16 � 0.21 3.53 � 0.76March 22, 2012 7.93 � 0.46 3.24 � 0.21 3.23 � 0.85April 23, 2012 7.93 � 0.45 3.20 � 0.2 3.24 � 0.87June 12, 2012 7.47 � 0.41 3.70 � 0.18 4.47 � 0.97June 20, 2012 7.40 � 0.43 3.62 � 0.19 4.26 � 0.9July 12, 2012 6.70 � 0.36 3.39 � 0.16 3.85 � 0.8
12 SAHIN et al. · NEUTRONIC CHARACTERIZATION OF THE PSBR IRRADIATION POSITIONS
NUCLEAR TECHNOLOGY · VOLUME 194 · JUNE 2016
PREPRINT
Nuclear data and self-shielding factors for the foilsand wires used in the measurements are given inTable VIII. The temperature-dependent Westcott g-factorsfor 176Lu were taken from Ref. 14. The gold and lutetiumwires were diluted (0.112% gold in aluminum and 0.1%lutetium in aluminum, respectively), so neutron self-shielding was negligible.25 The zirconium foils were pureand thick enough to cause a significant resonance neutronshielding. Resonance self-shielding factors for 94Zr and96Zr were calculated using the following empiricalformulations26:
Gres(94Zr) � 1 � 1.543 � 10�4 � tZr
1.143 � 10�7 � tZr2 (7)
and
Gres(96Zr) � 1 � 2.327 � 10�4 � tZr
1.487 � 10�7 � tZr2 , (8)
where tZr is the thickness of zirconium foil in micrometers.Measured neutron flux characterization parameters of
the DT-1 position were compared with the calculated values
TABLE VII
Thermal-to-Epithermal Neutron Flux Ratio, the Measure of the Nonideal Epithermal NeutronFlux Distribution, Spectral Index, and Neutron Temperature in DT-1
Date f � r �Tn/To Tn (K)
November 16, 2011 37.18 � 5.02 0.080 � 0.023 0.039 � 0.003 324November 21, 2011 33.24 � 4.39 0.068 � 0.029 0.044 � 0.003 327November 30, 2011 33.54 � 4.37 0.068 � 0.018 0.043 � 0.003 328January 31, 2012 34.70 � 4.67 0.071 � 0.025 0.042 � 0.003 326February 6, 2012 35.76 � 4.83 0.067 � 0.022 0.040 � 0.003 324February 9, 2012 32.30 � 4.10 0.056 � 0.024 0.045 � 0.003 326February 15, 2012 34.12 � 4.74 0.074 � 0.021 0.043 � 0.004 329February 23, 2012 35.02 � 4.90 0.075 � 0.021 0.041 � 0.004 327February 28, 2012 36.22 � 5.05 0.076 � 0.031 0.040 � 0.003 324March 22, 2012 35.46 � 4.93 0.072 � 0.034 0.041 � 0.004 324April 23, 2012 35.72 � 4.91 0.076 � 0.027 0.040 � 0.003 326June 12, 2012 23.84 � 3.19 0.071 � 0.023 0.050 � 0.004 330June 20, 2012 24.18 � 3.28 0.075 � 0.023 0.049 � 0.004 331July 12, 2012 23.32 � 3.09 0.064 � 0.033 0.051 � 0.004 328
Fig. 15. Average values of the measure of the nonideal epithermal neutron flux distribution and spectral index in DT-1. [The coreloading was changed on May 22, 2012, and a strong absorber sample was installed in a nearby (R1) position on July 5, 2012.]
NEUTRONIC CHARACTERIZATION OF THE PSBR IRRADIATION POSITIONS · SAHIN et al. 13
NUCLEAR TECHNOLOGY · VOLUME 194 · JUNE 2016

PREPRINT
in May 2012 (during PSBR core loading 53) as shown inTable IX. A subsequent measurement was performed forverification. The measured and calculated neutron flux char-acterization parameters in August 2012 (during core loading54) were as given in Table X. There are significant differ-ences in the measured and calculated values of thermal-to-epithermal neutron flux ratio f and nonideal epithermalneutron flux distribution � following the new core loading inMay 2012.
V. DISCUSSION OF RESULTS AND CONCLUSIONS
The MURE and MCNP5 codes were used to developa burnup-coupled neutronic simulation of the PSBR. Thereactor fuel elements, control rods, irradiation positions,
and external structures were carefully modeled. Using theMURE libraries, burnup-coupled MCNP calculationswere executed for the PSBR starting from the initialTRIGA reactor core loading in 1965 until 2012.
The new simulation of the PSBR core has been val-idated by core excess reactivity, fuel element worth, inte-gral control rod worth, fission product buildup, andtemperature-dependent excess reactivity loss measure-ments. It was revealed that the MURE libraries andMCNP5 can be successfully applied to predict the neu-tronic behavior of the PSBR core following a daily oper-ational schedule.
Optimum control rod absorber elemental composi-tions were found and validated by integral rod worthmeasurements. The material density for the SA rod wasfound to be higher than the other fuel-follower controlrods. Nevertheless, such variation is extremely unlikelybecause all fuel-follower control rods are set in symmet-rical positions in the PSBR core and manufactured by thesame company. A lower absorber density for the TR rodis expected, due to its extensive service since 1965.
Local neutron flux calculations in the PSBR neutronirradiation positions were compared with gold aluminumwire activation experiments. Specifically, in the region ofDT-1, measured saturation activity values matched withcalculations within the experimental and computationaluncertainties. The measured neutron flux characterizationparameters of the DT-1 position were found to be inagreement with the calculations.
It has been found that the neutron flux characteriza-tion parameters for the PSBR irradiation positions do notvary significantly due to daily operation of the reactor.The neutron temperature and the measure of the nonidealepithermal neutron flux distribution were found to bemoderately static. As expected, changes in some neutroniccharacterization parameters were observed only followingnoteworthy modifications in the core, such as the deploy-ment of a new core loading or the insertion of a strongabsorber within close proximity of an irradiation position.
TABLE IX
Measured and Calculated Neutron FluxCharacterization Parameters in DT-1
ParameterMeasured
ValueCalculated
Valuez-Factor
f 31.4 � 2.4 35.5 � 5 0.7� 0.12 � 0.03 0.081 � 0.03 0.9r �Tn/To
0.046 � 0.004 0.041 � 0.004 0.9Tn (K) Not measured 326 � 20 N/A
TABLE X
Measured and Calculated Neutron Flux CharacterizationParameters in DT-1 (Repeated Measurement)
ParameterMeasured
ValueCalculated
Valuez-Factor
f 23.1 � 1.8 23.3 � 3.1 0.1� 0.067 � 0.02 0.064 � 0.03 0.1r �Tn/To
0.051 � 0.004 0.051 � 0.004 0Tn (K) 308 � 19 328 � 20 0.7
TABLE VIII
Nuclear Data for Reactions Used for Neutron Flux Characterization Measurements
Reaction k0,Au (Ref. 27) Q0 (Ref. 27)s0 (Refs. 24
and 27)Er (dEr)
(Ref. 27) (eV)Westcott g-Factor at 293 K(Ref. 28 and Ref. 29, p. 10)
94Zr(n,�)95Zr 2.0 � 104 (1.3)a 5.31 (3.3) 5.21 6260 (4) 1.000796Zr(n,�)97Zr 1.24 � 105 (0.3)b 251.6 (1.) 279 338 (2.1) 1.0004197Au(n,�)198Au 1 15.7 (1.8) 17.2 5.65 (7.1) 1.005176Lu(n,�)177Lu 4.15 � 102c Use s0 1.67 0.158 1.752
aGamma rays of 724 and 756 keV were combined.bGamma ray of 743 keV.cGamma ray of 112.9 keV.
14 SAHIN et al. · NEUTRONIC CHARACTERIZATION OF THE PSBR IRRADIATION POSITIONS
NUCLEAR TECHNOLOGY · VOLUME 194 · JUNE 2016

PREPRINT
The thermal-to-epithermal neutron flux ratio and spectralindex were found to be relatively more responsive to suchchanges in the core. The major changes in the thermal-to-epithermal neutron flux ratio imply a requirement forrepeated measurements of the neutronic characterizationparameters after core modifications.
Disclaimer
Certain commercial equipment, instruments, codes, ormaterials are identified in this study in order to specify theexperimental procedure adequately. Such identification is notintended to imply recommendation or endorsement by theNational Institute of Standards and Technology, nor is itintended to imply that the materials, codes, or equipment iden-tified are necessarily the best available for the purpose.
References
1. D. SAHIN, K. UNLU, and K. IVANOV, “Neutronic Sim-ulation of Penn State Breazeale Nuclear Reactor UsingMURE,” Trans. Am. Nucl. Soc., 106, 317 (2012).
2. D. SAHIN, K. UNLU, and K. IVANOV, “Modelling Tran-sient Mechanisms for Penn State Breazeale Nuclear ReactorNeutronic Analysis,” Trans. Am. Nucl. Soc., 106, 320(2012).
3. T. E. BOOTH, J. S. BROWN, and J. S. BULL, “MCNP51.50 Release Notes,” Los Alamos National Laboratory(2008).
4. O. MÉPLAN, “MURE, MCNP Utility for Reactor EvolutionUser Guide—Version 1.9” (Nov. 2014); http://lpsc.in2p3.fr/MURE/html/UserGuide/UserGuide.html (current as of Aug.15, 2015).
5. O. MÉPLAN et al., “MURE: MCNP Utility for ReactorEvolution—Description of the Methods, First Applicationsand Results,” Proc. European Nuclear Conference (ENC2005), Versailles, France, Dec. 14–18, 2005, EuropeanNuclear Society (2005).
6. P. SCHUMANN and D. ALBERT, “Investigations of Epi-thermal Neutron Spectra by Means of Thin Resonance Foils(Untersuchung epithermischer neutronenspektren mit dun-nen resonanzsonden),” Kernenergie, 8, 88 (1965).
7. F. CORTE, A. SPEECKE, and J. HOSTE, “Reactor Neu-tron Activation Analysis by a Triple Comparator Method,”J. Radioanal. Chem., 3, 3–4, 205 (1969); http://dx.doi.org/10.1007/BF02513714.
8. T. B. RYVES, “A New Thermal Neutron Flux Conven-tion,” Metrologia, 5, 4, 119 (1969); http://dx.doi.org/10.1088/0026-1394/5/4/004.
9. C. PAPASTERGIOU and J. H. SWANKS, “Neutron-FluxMeasurements Using Monitor Pairs,” Proc. Conf. Reactor
Operating Experience, Myrtle Beach, South Carolina,1972.
10. F. DE CORTE et al., “Modification and Generalization ofSome Methods to Improve the Accuracy of �-Determination in the 1/E(1��) Epithermal Neutron Spec-trum,” J. Radioanal. Nucl. Chem., 52, 2, 305 (1979); http://dx.doi.org/10.1007/BF02521281.
11. F. DE CORTE et al., “Recent Advances in the ko-Standardizationof Neutron Activation Analysis: Extensions, Applications,Prospects,” J. Radioanal. Nucl. Chem., 169, 1, 125 (1993);http://dx.doi.org/10.1007/BF02046790.
12. “Standard Test Method for Determining Thermal NeutronReaction and Fluence Rates by Radioactivation Techniques,Designation: E 262-03: 1-9,” American Society for Testingand Materials International (2003).
13. D. K. HAUCK, “Dendrochemistry: Seeing the ForestThrough the Trees,” PhD Thesis, The Pennsylvania StateUniversity (2008).
14. D. SAHIN, “Activity, Exposure Rate and Gamma SpectrumPrediction for Neutron Irradiated Materials at RadiationScience and Engineering Center,” MS Thesis, The Penn-sylvania State University (2008).
15. D. SAHIN and K. UNLU, “Determination of Self ShieldingFactors and Gamma Attenuation Effects for Tree RingSamples,” J. Radioanal. Nucl. Chem., 291, 2, 549 (2012);http://dx.doi.org/10.1007/s10967-011-1281-x.
16. R. E. MacFARLANE and A. C. KAHLER, “Methods forProcessing ENDF/B-VII with NJOY,” Nucl. Data Sheets,111, 12, 2739 (2010); http://dx.doi.org/10.1016/j.nds.2010.11.001.
17. C. TIPPAYAKUL, “Development of a Practical FuelManagement System for PSBR Based on Advanced Three-Dimensional Monte Carlo Coupled Depletion Methodol-ogy,” PhD Thesis, The Pennsylvania State University(2006).
18. H. QIAN, “Relative Entropy: Free Energy Associated withEquilibrium Fluctuations and Nonequilibrium Deviations,”Phys. Rev. E, 63, 042103 (2001); http://dx.doi.org/10.1103/PhysRevE.63.042103.
19. F. BROWN et al., “Convergence Testing for MCNP5Monte Carlo Eigenvalue Calculations,” Proc. Mathematicsand Computations and Supercomputing in Nuclear Appli-cations (M&C�SNA 2007), Monterey, California, April15–19, 2007, American Nuclear Society (2007).
20. “RSEC Safeguards Committee Meeting,” Agenda, ThePennsylvania State University, Radiation Science and Engi-neering Center (July 1995).
21. Y. KIM, “PSBR Core Monte Carlo Modeling and Analy-sis,” PhD Thesis, The Pennsylvania State University(1995).
22. P. BODE and C. VAN DIJK, “Operational Management ofResults in INAA Utilizing a Versatile System of Control
NEUTRONIC CHARACTERIZATION OF THE PSBR IRRADIATION POSITIONS · SAHIN et al. 15
NUCLEAR TECHNOLOGY · VOLUME 194 · JUNE 2016

PREPRINT
Charts,” J. Radioanal. Nucl. Chem., 215, 1, 87 (1997);http://dx.doi.org/10.1007/BF02109883.
23. F. DE CORTE et al., “The Accuracy and Precision of theExperimental �-Determination in the 1/E1�� EpithermalReactor-Neutron Spectrum,” J. Radioanal. Nucl. Chem., 62,1, 209 (1981); http://dx.doi.org/10.1007/BF02517354.
24. F. DE CORTE et al., “The Use of a Modified Westcott-Formalism in the ko-Standardization of NAA: The State ofAffairs,” J. Radioanal. Nucl. Chem., 179, 1, 93 (1994);http://dx.doi.org/10.1007/BF02037929.
25. L. M. HOWE, R. E. JERVIS, and T. A. EASTWOOD, “TheDevelopment of a Dilute Aluminum-Gold Alloy forThermal and Resonance Neutron Flux Measurements,”Nucl. Sci. Eng., 12, 2, 185 (1962); http://dx.doi.org/10.13182/NSE12-2-185.
26. A. SIMONISTS et al., “Nuclear Data Measurements forZirconium Isotopes Used for Activation Analysis and Neu-tron Metrology,” J. Radioanal. Nucl. Chem., 113, 1, 187(1987); http://dx.doi.org/10.1007/BF02036060.
27. F. DE CORTE and A. SIMONITS, “RecommendedNuclear Data for Use in the k0 Standardization of NeutronActivation Analysis,” At. Data Nucl. Data Tables, 85,1, 47 (2003); http://dx.doi.org/10.1016/S0092-640X(03)00036-6.
28. S. F. MUGHABGHAB, “Thermal Neutron Capture CrossSections Resonance Integrals and g-Factors,” INDC(NDS)-440,International Atomic Energy Agency (2003).
29. H. D. CHOI et al., “Database of Prompt Gamma Rays fromSlow Neutron Capture for Elemental Analysis,” STI/PUB/1263,International Atomic Energy Agency (2007).
16 SAHIN et al. · NEUTRONIC CHARACTERIZATION OF THE PSBR IRRADIATION POSITIONS
NUCLEAR TECHNOLOGY · VOLUME 194 · JUNE 2016