Embed Size (px)
Citation preview
This is a repository copy of Neurovascular coupling preserved in a chronic mouse model of Alzheimer’s disease : methodology is critical.
White Rose Research Online URL for this paper:https://eprints.whiterose.ac.uk/153114/
Version: Published Version
Article:
Sharp, P.S., Ameen-Ali, K.E., Boorman, L. et al. (6 more authors) (2020) Neurovascular coupling preserved in a chronic mouse model of Alzheimer’s disease : methodology is critical. Journal of Cerebral Blood Flow and Metabolism, 40 (11). pp. 2289-2303. ISSN 0271-678X
https://doi.org/10.1177/0271678X19890830
[email protected]://eprints.whiterose.ac.uk/
Reuse
This article is distributed under the terms of the Creative Commons Attribution (CC BY) licence. This licence allows you to distribute, remix, tweak, and build upon the work, even commercially, as long as you credit the authors for the original work. More information and the full terms of the licence here: https://creativecommons.org/licenses/
Takedown
If you consider content in White Rose Research Online to be in breach of UK law, please notify us by emailing [email protected] including the URL of the record and the reason for the withdrawal request.
Original Article
Neurovascular coupling preserved ina chronic mouse model of Alzheimer’sdisease: Methodology is critical
Paul S Sharp1,2, Kamar E Ameen-Ali2,3 , Luke Boorman3 ,
Sam Harris4,2, Stephen Wharton5, Clare Howarth2 ,
Osman Shabir2, Peter Redgrave2 and Jason Berwick2
Abstract
Impaired neurovascular coupling has been suggested as an early pathogenic factor in Alzheimer’s disease (AD), which
could serve as an early biomarker of cerebral pathology. We have established an anaesthetic regime to allow repeated
measurements of neurovascular function over three months in the J20 mouse model of AD (J20-AD) and wild-type(WT) controls. Animals were 9–12months old at the start of the experiment. Mice were chronically prepared with a
cranial window through which 2-Dimensional optical imaging spectroscopy (2D-OIS) was used to generate functional
maps of the cerebral blood volume and saturation changes evoked by whisker stimulation and vascular reactivitychallenges. Unexpectedly, the hemodynamic responses were largely preserved in the J20-AD group. This result failed
to confirm previous investigations using the J20-AD model. However, a final acute electrophysiology and 2D-OIS
experiment was performed to measure both neural and hemodynamic responses concurrently. In this experiment,previously reported deficits in neurovascular coupling in the J20-AD model were observed. This suggests that J20-AD
mice may be more susceptible to the physiologically stressing conditions of an acute experimental procedure compared
to WT animals. These results therefore highlight the importance of experimental procedure when determining thecharacteristics of animal models of human disease.
Keywords
Barrel cortex, electrophysiology, optical imaging, blood flow, J20
Received: 11 July 2019; Revised 19 September 2019; Accepted 2 November 2019
Introduction
Alzheimer’s disease (AD) in humans currently has no
effective treatment. Most of our recent insights into the
causes of AD are linked to the discovery of increased
amounts of beta-amyloid plaques associated with sig-
nificant neuronal loss.1 Despite the large investment in
both clinical and pre-clinical research resources
focussed on the beta-amyloid hypothesis, no effective
preventative or remedial treatment has so far been
found. Consequently, alternative theories regarding
the onset and development of AD have been proposed.
One of the notable rival hypotheses is the neurovascu-
lar degeneration hypothesis (NDH), first proposed by
Zlokovic.2,3 It suggests that a functional deficit within
cells of the neurovascular unit (neurons, glial cells, peri-
cytes and vascular cells) would deprive active neurons
of adequate oxygen and glucose, which could either
be the initial trigger of AD, or significantly add to
the disease burden. If correct, the NDH would offer
the potential for developing new treatments based
on targeting identified dysfunctional cells in the
1Nanomedicine Lab, Division of Pharmacy and Optometry, School of
Health Sciences, Faculty of Biology, Medicine and Health, The University
of Manchester, Manchester, UK2Department of Psychology, University of Sheffield, Sheffield, UK3Institute of Neuroscience, Newcastle University, Newcastle upon
Tyne, UK4UK Dementia Research Institute, UCL Institute of Neurology, University
College London, London, UK5Department of Neuroscience, Sheffield Institute for Translational
Neuroscience, University of Sheffield, Sheffield, UK
Corresponding author:
Jason Berwick, Department of Psychology, University of Sheffield, Floor
D, Cathedral Court, 1 Vicar Lane, Sheffield, South Yorkshire S11HD, UK.
Email [email protected]
Journal of Cerebral Blood Flow &
Metabolism
0(0) 1–15
! The Author(s) 2019
Article reuse guidelines:
sagepub.com/journals-permissions
DOI: 10.1177/0271678X19890830
journals.sagepub.com/home/jcbfm
neurovascular unit. With the aid of modern neuroim-
aging methods (e.g. functional magnetic resonance
imaging – fMRI), measurements of the progressive
breakdown of neurovascular coupling (NVC) could
also act as an early biomarker of AD. A recent study
analysing data from the Alzheimer’s disease neuroim-
aging initiative (ADNI4) suggested that cerebrovascu-
lar dysfunction may be the earliest pathological event
to emerge, possibly marking the beginning of the dis-
ease process. This report alone highlights the need for
more research into the NDH.
A problem facing investigations of the neurovascular
unit is that the technologies currently used with human
subjects do not have the spatial and temporal resolution
required to understand the basic mechanistic processes
involved. To address this issue, transgenic mouse models
of AD have been developed and now play a critical role
in investigating the underlying mechanisms responsible
for the AD-like disease state. A range of models has
been produced which partially mimic different aspects
of human AD (see reviews5,6). These include the
increased Ab plaque load, Tau or combinations of
both. While transgenic mouse models may not perfectly
replicate all aspects of the human condition, the hope is
that they share the critical features that will enable the
underlying mechanisms to be discovered. Pre-clinical
AD mouse models allow the use of more invasive tech-
nologies to measure both hemodynamic and neuronal
variables in more detail throughout disease develop-
ment. Consequently, several groups have reported dis-
ruptions to NVC in transgenic AD mice that
overexpress human amyloid precursor protein
(hAPP).7–11 These studies used laser Doppler flowmetry
(LDF) or Laser speckle imaging to measure cerebral
blood flow (CBF) from a restricted cortical region in
acutely anaesthetised animals. Using the J20-AD
mouse model (used in 3 of the above studies), we have
recently confirmed using an aged match sibling co-hort
to the animals used in this study that the mice suffer
long-term memory deficits and the expected Ab plaque
deposition in the hippocampus and cortex by nine-
months of age12 (see Figure 1(c)). Wright et al.13 have
also confirmed similar behavioural and anatomical
decline at similar time points.
To extend these investigations, we have developed a
chronic mouse preparation that is sufficiently stable to
permit repeated measures of neurovascular function
across a three-month period when the disease state is
present.14 Consequently, in sedated J20-AD mice and
age-matched wild type controls, we used repeated
measures two-dimensional optical imaging spectrosco-
py (2D-OIS) to record neurovascular responses evoked
by sensory stimulation and vascular reactivity chal-
lenges. A final acute experiment was conducted in
which 2D-OIS and multi-channel electrophysiology
were performed simultaneously. Contrary to expecta-
tion, our chronic imaging studies found little or no
difference in the hemodynamic responses between
J20-AD and WT animals across a range of sensory
stimulations and gas challenges. However, in the final
acute experiment, reduced NVC function similar to
that reported in previous investigations7–10 was
observed. This difference suggests that the J20-AD
mice are more susceptible to the physiological stresses
incurred by acute experimental procedures compared
with WT controls. These results indicate that experi-
mental conditions are critical when characterising
mouse models of human disease, and differences in
methodology are likely responsible for the variable
and sometimes incompatible results frequently seen in
mouse pre-clinical neurovascular studies.
Material and methods
Anesthesia and cranial window surgery
All animal procedures were performed in accordance
with the guidelines and regulations of the UK
Government, Animals (Scientific Procedures) Act
1986, the European directive 2010/63/EU, and
approved by the University of Sheffield Ethical
review and licensing committee and in compliance
with the ARRIVE guidelines for animal research.
Two groups of five animals were used: (i) heterozygous
transgenic male C57BL/6 mice that overexpress human
APP (hAPP) carrying the human Swedish and Indiana
familial AD mutations under control of the PDGFb
chain promoter (hAPP-J20 line); and (ii) male wild-
type controls. All animals were between 9 and
12months on the date of surgical preparation.
Animals were anesthetized with fentanyl-fluanisone
(Hypnorm, Vetapharm Ltd), midazolam (Hypnovel,
Roche Ltd) and sterile water (1:1:2 by volume;
7.0ml/kg, i.p.) for surgery, while anaesthesia during
the imaging experiments was further maintained with
isoflurane (0.5–0.8%) in 100% oxygen. A homoeother-
mic blanket (Harvard Apparatus) maintained rectal
temperature at 37�C. Mice were placed in a stereotaxic
frame (Kopf Instruments) and a dental drill was used
to thin the skull overlying the right somatosensory
cortex to translucency thereby forming an optical
window (�4 mm2). A thin layer of clear cyanoacrylate
cement was applied to reinforce and smooth the
window. This reduced specular reflections during imag-
ing and prevented skull regrowth during the three-
month experimental period. A stainless steel imaging
chamber was secured over the thinned cranial window
using dental cement. This chamber was used to stabilise
the head during imaging sessions. After surgery, animals
were left to recover for a minimum of sevendays before
2 Journal of Cerebral Blood Flow & Metabolism 0(0)
chronic experimental imaging sessions commenced.
During this period, animals were monitored regularly
and weighed to ensure they did not fall below 90% of
surgical day body weight. Randomisation and blinding
were not performed in this study.
Experimental design
All animals were imaged using an anaesthetised
condition adapted from our previous published method-
ology.14 All animals underwent four imaging sessions.
-4
-2
0
2
4
Time(s)
-4
-2
0
2
4
Session 2 Session 4 : with Neural Session 3(a)
(b) Session 1 Session 2 Session 4 : with Neural Session 3
Session 1
Hbt Response average over stimulation period
Hbt Response average over stimulation period
Fra
ct
Ch
an
ge
0.95
1
1.05
Hbt
Hbr
Hbo
0 160 160 160 16
0.95
1
1.05
Fra
ct
Ch
an
ge
(c)
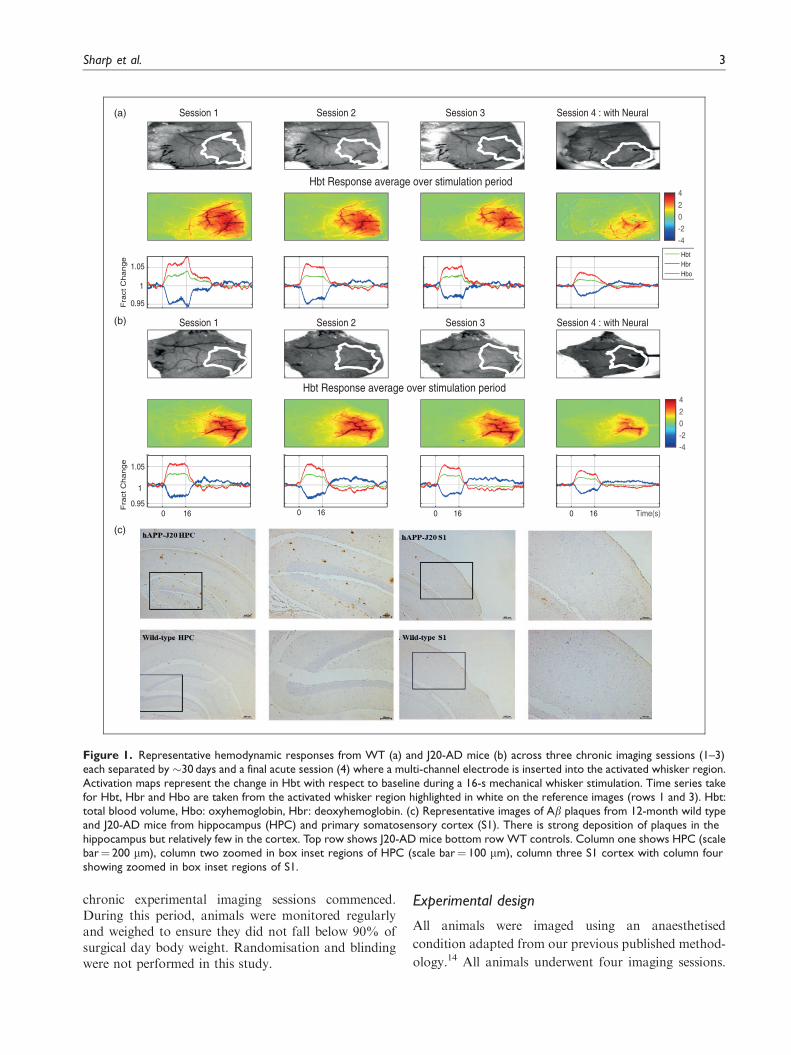
Figure 1. Representative hemodynamic responses from WT (a) and J20-AD mice (b) across three chronic imaging sessions (1–3)each separated by �30 days and a final acute session (4) where a multi-channel electrode is inserted into the activated whisker region.Activation maps represent the change in Hbt with respect to baseline during a 16-s mechanical whisker stimulation. Time series takefor Hbt, Hbr and Hbo are taken from the activated whisker region highlighted in white on the reference images (rows 1 and 3). Hbt:total blood volume, Hbo: oxyhemoglobin, Hbr: deoxyhemoglobin. (c) Representative images of Ab plaques from 12-month wild typeand J20-AD mice from hippocampus (HPC) and primary somatosensory cortex (S1). There is strong deposition of plaques in thehippocampus but relatively few in the cortex. Top row shows J20-AD mice bottom row WT controls. Column one shows HPC (scalebar¼ 200 mm), column two zoomed in box inset regions of HPC (scale bar¼ 100 mm), column three S1 cortex with column fourshowing zoomed in box inset regions of S1.
Sharp et al. 3
The first session occurred 7–10days after cranial
window surgery. The following three sessions were
each separated by �30days. In the last session, a 16-
channel electrode was placed in the active whisker barrel
region (see below for method of localisation) to provide
a measure of concurrent hemodynamic and neural activ-
ity. Each session began with an induction of anaesthesia
(see methods) followed after 1 h by 2D-OIS. In the last
acute (4th) imaging session, imaging started 30min after
the electrode had been inserted. Each 2D-OIS session
comprised eight separate experiments performed in a
set order. Each experiment separated from the previous
one by �3 min during which time we acquired a dark
image used to remove camera noise from the spectros-
copy data.
Exp1: Short duration sensory stimulation breathing
100% oxygen: With the animal breathing oxygen
(100%), there were 30 successive trials of 25 s; 5 s after
the start of each trial, whisker stimulation was adminis-
tered for 2 s. Together, 750 s of continuous data was
collected. For all stimulation experiments, the whiskers
contralateral to the imaging chamber were mechanically
deflected using aplastic T-bar attached to a stepper
motor under computer control. Whiskers were deflected
�1 cm in the rostro-caudal direction at 5Hz.
Exp2: Exp1 was repeated to ensure preparation and
recording stability.
Exp3: Mild gas challenge: while the animal transi-
tioned from breathing oxygen to normal air. 2D-OIS
lasted 750 s with the transition to air occurring after 105 s.
Exp4: Short duration sensory stimulation breathing
air: Used the same paradigm as Exp1 except the animal
was breathing normal air rather than 100% oxygen.
Exp5: Long duration sensory stimulation breathing
air: 15� 70 s consecutive trials with 16-s whisker stim-
ulation (5Hz) presented after 10 s. Total record com-
prised 1050 s of data.
Exp6:Mild gas challenge: while the animal transitioned
from breathing air back to 100% oxygen; 750 s of data
were recorded with the transition occurring after 105 s.
Exp7: Long duration sensory stimulation under
100% oxygen: 15� 70 s consecutive trials, with 16 s
whisker stimulation at 5Hz occurring after 10 s. Total
record comprised 1050 s of data.
Exp8: Major gas challenge in the form of hypercap-
nia: 250 s after starting the record, the animal was
switched from breathing 100% oxygen to 90% and
10% carbon dioxide. The duration of this challenge
was 250 s, after which a further 250 s of data were col-
lected giving a total of 750 s of recorded data.
Statistical analysis
The first question we addressed were whether the
evoked haemodynamic responses changed over time
(sessions 1–3) and were different between the J20-AD
and WT groups. Separate two-way repeated measures
ANOVA’s were performed for Hbt, Hbo and Hbr for
each of the five whisker stimulation experiments
(Exp1,2,4,5,7). A single measure, the mean response
size from the stimulation period was calculated and
used for the analysis. Based on the results of this anal-
ysis (see below), a second repeated measures ANOVA
was performed. In this analysis, we averaged the three
chronic imaging sessions together to create a single
chronic session for both WT and J20-AD mice with
the repeated measurement now being stimulation
experiment (Exp1,2,4,5,7). This same analysis was
also performed for the acute imaging session. This
would show if there were any differences between the
WT and J20-AD animals in the chronic or acute parts
of the study.
2D-OIS
2D-OIS was used to estimate changes in cortical
oxyhemoglobin (Hbo), deoxyhemoglobin (Hbr) and
total hemoglobin concentration (Hbt). To generate
spatial maps of hemodynamic responses, the cortex
was illuminated with four wavelengths of light
(495 nm, 559 nm, 575 nm and 587 nm) using a
Lambda DG-4 high-speed galvanometer (Sutter
Instrument Company, USA). Remitted light was col-
lected using a Dalsa 1M60 CCD camera at 184� 184
pixels (resolution �75 lm), with a frame rate of the
32Hz, and synchronised to filter switching, giving an
effective frame rate of 8Hz.
The analysis approach combined the absorption spec-
tra of Hbo and Hbr with Monte-Carlo simulations of
photons passing through homogeneous tissue to esti-
mate the mean path-length of photons for each wave-
length. Images were then analysed on a pixel-by-pixel
basis using a modified Beer–Lambert law, which used
the generated mean photon path lengths, to convert the
detected attenuation for each wavelength into predicted
absorption. The absorption values were then used to
generate 2D spatiotemporal image-series of the esti-
mates of the changes in Hbt, Hbo and Hbr from base-
line values. All experiments started with the animal
breathing 100% oxygen, and for this condition we
assumed a concentration of hemoglobin in tissue at
100lM and saturation set at 70%. We then used the
gas transition experiment 3 to assess how these baselines
changed when the animal breathed normal air. This was
calculated on an individual animal basis. The baseline
blood volume and saturation values in air were consis-
tent for both WT and J20-AD mice (Hbt concentration
WT¼ 99.3� 0.42sem, AD¼ 99.7� 0.47sem; Saturation
WT¼ 62.6%�0.6, AD¼ 62.6� 0.6). All hemodynamic
4 Journal of Cerebral Blood Flow & Metabolism 0(0)
changes were taken as the fractional changes from these
baseline estimations.
Selection of regions of interest for 2D-OIS data
In each imaging session, we used the 16 s Hbt data from
Exp7 to select the whisker region of interest. During
the stimulation period, all pixels that were 1.5 standard
deviations above the pre-stimulus baseline were
deemed above threshold and a region was drawn
around all these activated pixels (see Figure 1).
Arteries and veins were identified within the activated
region using principal component analyses applied to
the Hbt and Hbr images, respectively (see Figure 7).
Multi-channel electrophysiology
For the final acute imaging session, a 16-channel
microelectrode (100 mm spacing, site area 177 mm2,
1.5–2.7 MX impedance; Neuronexus Technologies,
Ann Arbor, MI, USA) implanted into the right barrel
cortex. The microelectrode was positioned to a depth
of 1500 mm in the centre of the activated whisker region
defined previously by 2D-OIS. The electrode was con-
nected to a preamplifier and data acquisition device
(Medusa BioAmp/RZ5, TDT, Alachua, FL, USA).
Neural data were sampled at 6 kHz and recorded con-
tinuously throughout each of the eight experiments
described above.
Results
Chronic imaging: Sensory stimulation experiments
1,2,4,5 and 7
The thinned cranial window preparation remained
stable throughout the three-month’s duration of the
study with evoked hemodynamic responses remaining
remarkably consistent throughout this period for both
J20-AD and WT animals (see Figure 1). The first ques-
tions we addressed were whether the evoked haemody-
namic responses changed over time (sessions 1–3) and
were different between the J20-AD and WT groups.
Separate two-way repeated measures ANOVA’s were
performed for Hbt, Hbo and Hbr for each of the five
whisker stimulation experiments (Exp1,2,4,5,7, results
shown in Supplementary Table 1). For most experi-
ments, there was no effect of group (WT or J20-AD),
there was only one result that approached significance.
For Hbr in Exp5, there was a difference in the sessions
(F¼ 5.178 and p¼ 0.03) However, after Bonferroni
correction (level needed to be less than p¼ 0.003),
this result was non-significant. Several results did
show an effect of session that approached significance
in which Session 1 was generally larger than sessions 2
and 3 (Hbt- Exp1,7, Hbo – Exp1, 2,7 and Hbr
Exp1,2,4) but all were below the threshold for signifi-
cance after Bonferoni correction apart from Hbo in
Exp7. Thus, in most cases differences between the rel-
evant variables failed to reach acceptable levels of sta-
tistical reliability (p> 0.003, see Supplementary Table
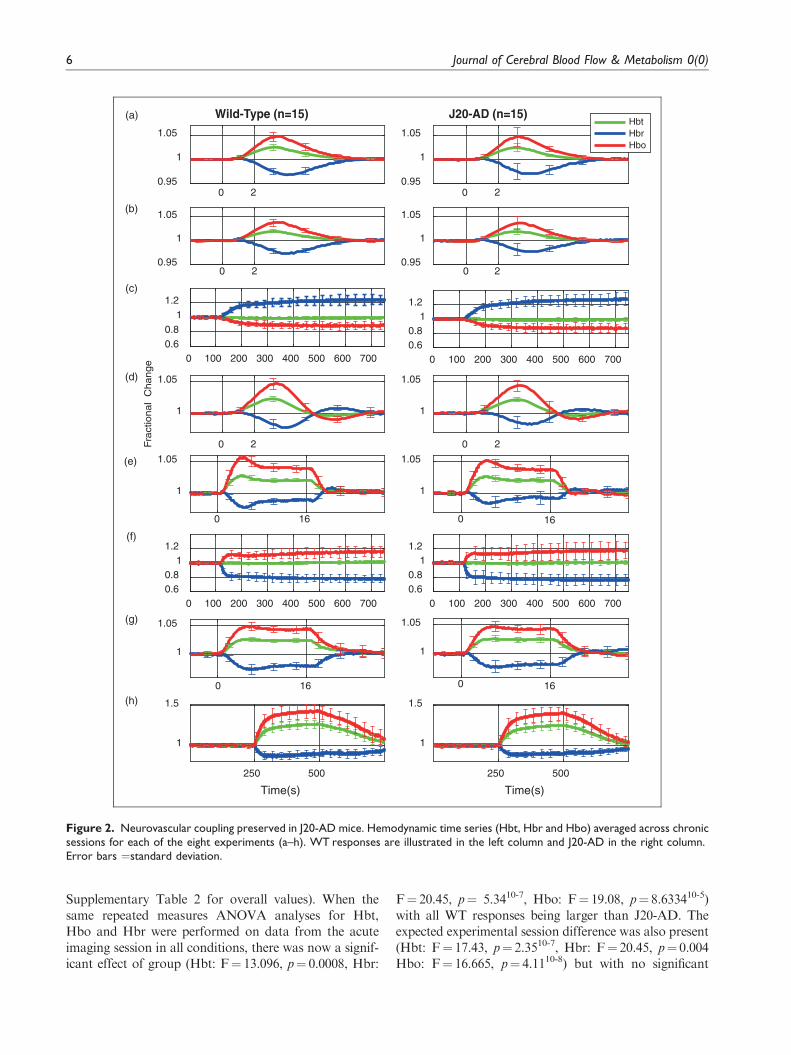
1). The surprising and remarkable extent to which the
haemodynamic responses J20-AD were preserved is
illustrated in Figure 2. The stability of response mag-
nitudes across experimental conditions between WT
and J20 mice is also summarised in Supplementary
Table 2. Because no reliable differences were found in
the results between chronic sessions, we averaged hae-
modynamic time series across chronic to create sessions
for a second analysis to test for differences in the hae-
modynamic responses within experiments (Exp1,2,4,5
and 7) between the WT and J20-AD groups. For
each of the hemodynamic measures (Hbt, Hbr, and
Hbo), a two-way repeated measure ANOVA was con-
ducted which compared responses evoked by the dif-
ferent stimulation conditions and mouse-type (J20-AD
vs. WT). In each of the analyses, the experiment factor
was significant (Hbt: F¼ 16.1, p¼ 6.3210-8; Hbr:
F¼ 5.34, p¼ 0.002; Hbo: F¼ 13.4, p¼ 5.210-7), which
was to be expected as the stimulations were of varying
durations (2 s and 16 s). On the other hand, no reliable
statistical differences were found between the two mouse-
types for (Hbt: F¼ 0.14, p¼ 0.71, Hbr: F¼ 3.39,
p¼ 0.07, Hbo: F¼ 1.25, p¼ 0.26). In each case, the inter-
actions between experimental condition and mouse-type
were also non-significant (Hbt: F¼ 0.03, p¼ 0.99; Hbr:
F¼ 0.27, p¼ 0.89; Hbo: F¼ 0.13, p¼ 0.97). Although
the experiments within a session were always run in the
same order, this time-related confound within these anal-
yses do not obscure the point that the neurovascular
performance of J20-AD and WT controls was, for the
most part, similar. Specifically, using our chronic proce-
dures, we failed to find the large differences reported in
previous studies.
Stimulation experiments 1,2,4,5 and 7 – Acute
imaging sessions
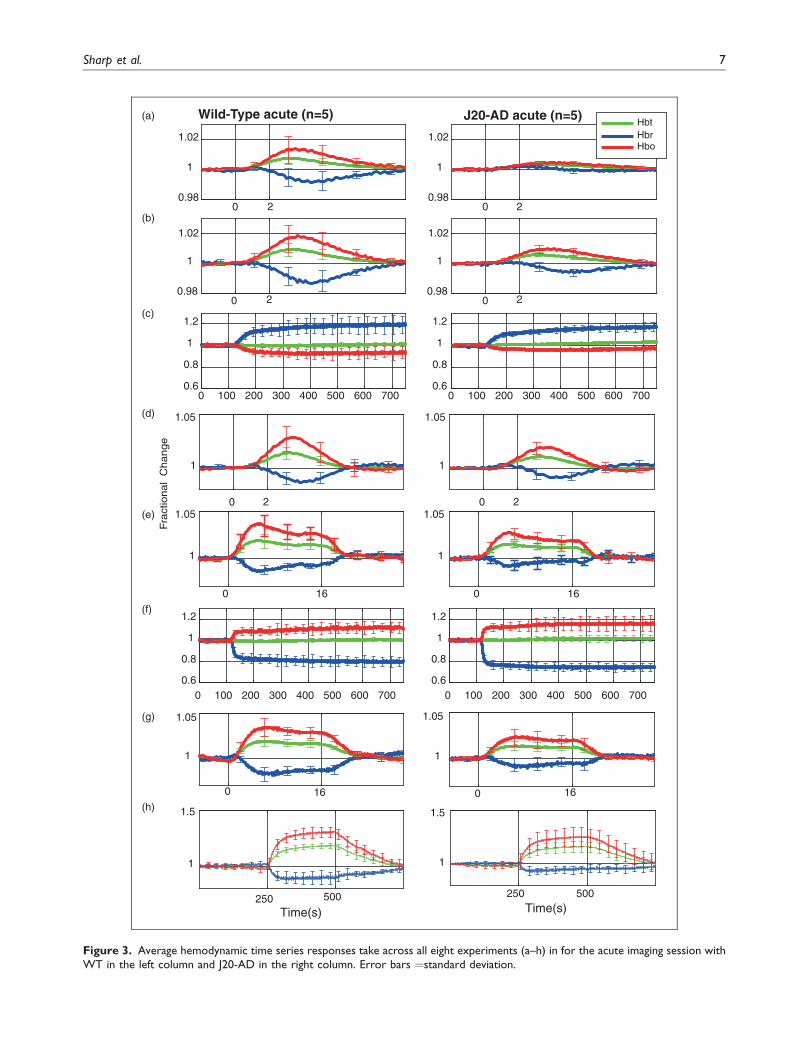
The 4th and final session involved acute surgical proce-
dures in which a multi-channel recording electrode was
implanted prior to the barrel region being imaged. The
concurrent acute recording of electrophysiological and
hemodynamic variables in this session produced results
that were markedly different from previous chronic
imaging sessions (see Figures 3 and 4). First, both WT
and J20-AD fractional time series responses were
reduced compared to the chronic session data.
However, the responses of J20-AD mice were suppressed
compared with the corresponding WT responses, espe-
cially for experiment 1 (see Figures 3 and 4 and
Sharp et al. 5
Supplementary Table 2 for overall values). When the
same repeated measures ANOVA analyses for Hbt,
Hbo and Hbr were performed on data from the acute
imaging session in all conditions, there was now a signif-
icant effect of group (Hbt: F¼ 13.096, p¼ 0.0008, Hbr:
F¼ 20.45, p¼ 5.3410-7, Hbo: F¼ 19.08, p¼ 8.633410-5)
with all WT responses being larger than J20-AD. The
expected experimental session difference was also present
(Hbt: F¼ 17.43, p¼ 2.3510-7, Hbr: F¼ 20.45, p¼ 0.004
Hbo: F¼ 16.665, p¼ 4.1110-8) but with no significant
(a)
(b)
(c)
(d)
(e)
(f)
(g)
(h)
Fra
ctional C
hange
Wild-Type (n=15) J20-AD (n=15)
0 20.95
1
1.05
0 20.95
1
1.05Hbt
Hbr
Hbo
0 20.95
1
1.05
0 20.95
1
1.05
0 100 200 300 400 500 600 700
0.6
0.8
1
1.2
0 100 200 300 400 500 600 700
0.6
0.8
1
1.2
0 2
1
1.05
0 2
1
1.05
0 16
1
1.05
0 16
1
1.05
0 100 200 300 400 500 600 700
0.6
0.8
1
1.2
0 100 200 300 400 500 600 700
0.6
0.8
1
1.2
0 16
1
1.05
0 16
1
1.05
250 500
Time(s)
1
1.5
250 500
Time(s)
1
1.5
Figure 2. Neurovascular coupling preserved in J20-AD mice. Hemodynamic time series (Hbt, Hbr and Hbo) averaged across chronicsessions for each of the eight experiments (a–h). WT responses are illustrated in the left column and J20-AD in the right column.Error bars ¼standard deviation.
6 Journal of Cerebral Blood Flow & Metabolism 0(0)
(a)
(b)
(c)
(d)
(e)
(f)
(g)
(h)
Wild-Type acute (n=5) J20-AD acute (n=5)
0 20.98
1
1.02
0 20.98
1
1.02
Hbt
HbrHbo
0 20.98
1
1.02
0 20.98
1
1.02
0 100 200 300 400 500 600 7000.6
0.8
1
1.2
0 100 200 300 400 500 600 7000.6
0.8
1
1.2
Fra
ctional C
hange
0 2
1
1.05
0 2
1
1.05
0 16
1
1.05
0 16
1
1.05
0 100 200 300 400 500 600 700
0.6
0.8
1
1.2
1.05
0 100 200 300 400 500 600 700
0.6
0.8
1
1.2
1.05
0 16
1
0 16
1
250 500
Time(s)
1
1.5
250 500
Time(s)
1
1.5
Figure 3. Average hemodynamic time series responses take across all eight experiments (a–h) in for the acute imaging session withWT in the left column and J20-AD in the right column. Error bars ¼standard deviation.
Sharp et al. 7
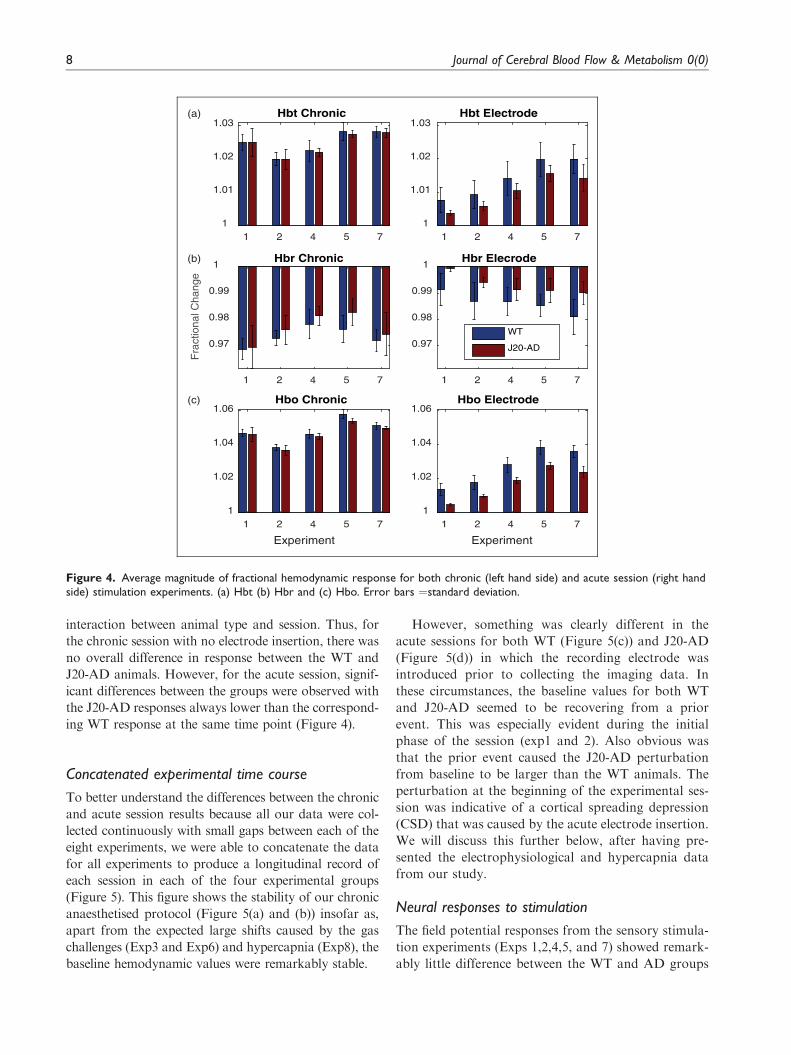
interaction between animal type and session. Thus, for
the chronic session with no electrode insertion, there was
no overall difference in response between the WT and
J20-AD animals. However, for the acute session, signif-
icant differences between the groups were observed with
the J20-AD responses always lower than the correspond-
ing WT response at the same time point (Figure 4).
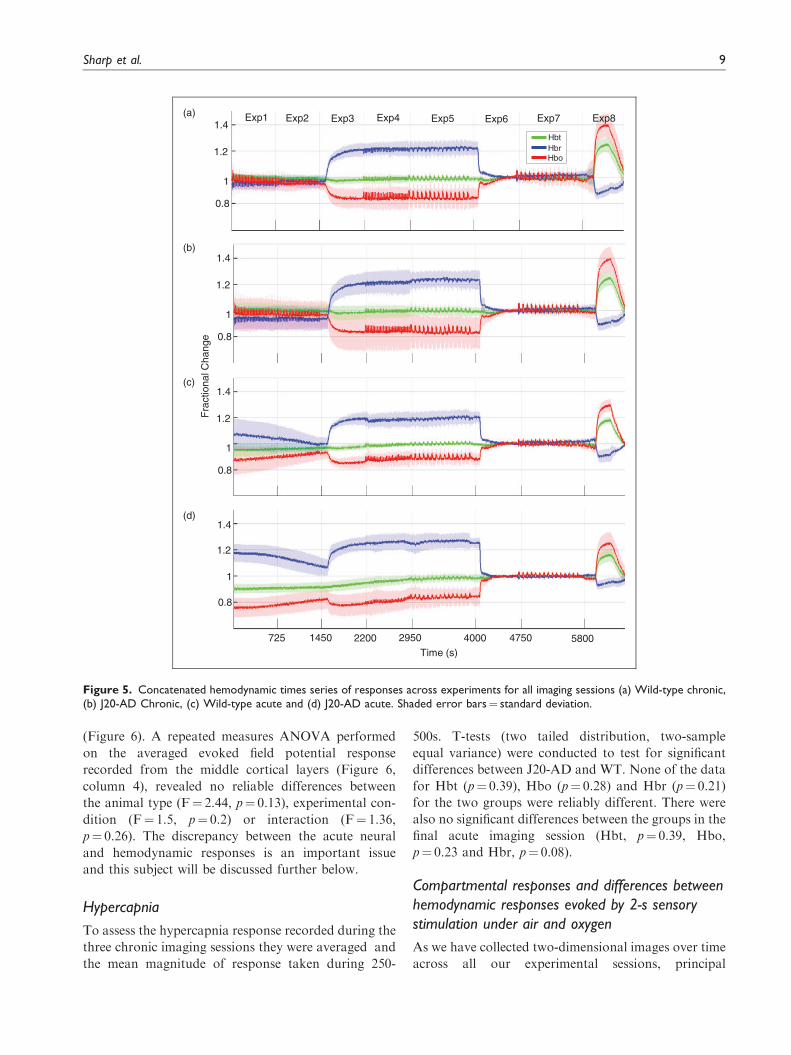
Concatenated experimental time course
To better understand the differences between the chronic
and acute session results because all our data were col-
lected continuously with small gaps between each of the
eight experiments, we were able to concatenate the data
for all experiments to produce a longitudinal record of
each session in each of the four experimental groups
(Figure 5). This figure shows the stability of our chronic
anaesthetised protocol (Figure 5(a) and (b)) insofar as,
apart from the expected large shifts caused by the gas
challenges (Exp3 and Exp6) and hypercapnia (Exp8), the
baseline hemodynamic values were remarkably stable.
However, something was clearly different in the
acute sessions for both WT (Figure 5(c)) and J20-AD
(Figure 5(d)) in which the recording electrode was
introduced prior to collecting the imaging data. In
these circumstances, the baseline values for both WT
and J20-AD seemed to be recovering from a prior
event. This was especially evident during the initial
phase of the session (exp1 and 2). Also obvious was
that the prior event caused the J20-AD perturbation
from baseline to be larger than the WT animals. The
perturbation at the beginning of the experimental ses-
sion was indicative of a cortical spreading depression
(CSD) that was caused by the acute electrode insertion.
We will discuss this further below, after having pre-
sented the electrophysiological and hypercapnia data
from our study.
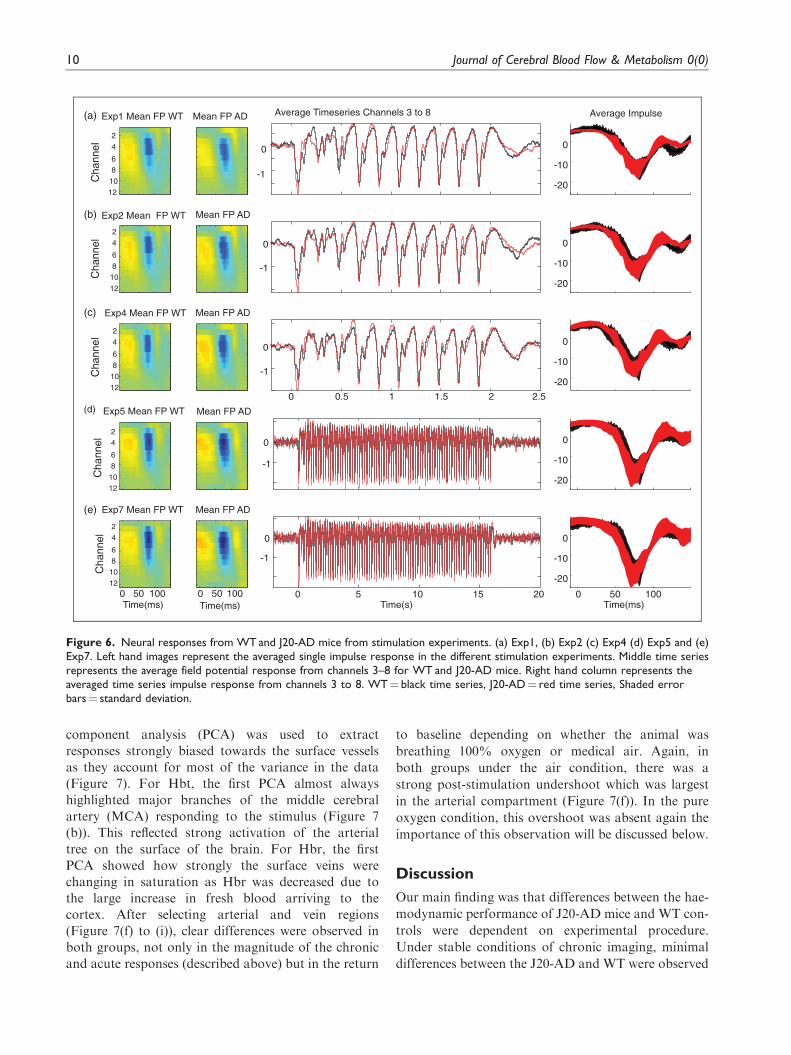
Neural responses to stimulation
The field potential responses from the sensory stimula-
tion experiments (Exps 1,2,4,5, and 7) showed remark-
ably little difference between the WT and AD groups
Fra
ctio
na
l C
ha
ng
e
1 2 4 5 7
1
1.01
1.02
1.03Hbt Chronic
1 2 4 5 7
1
1.01
1.02
1.03Hbt Electrode
1 2 4 5 7
0.97
0.98
0.99
1Hbr Chronic
1 2 4 5 7
0.97
0.98
0.99
1Hbr Elecrode
WT
J20-AD
1 2 4 5 7
Experiment
1
1.02
1.04
1.06Hbo Chronic
1 2 4 5 7
Experiment
1
1.02
1.04
1.06Hbo Electrode
(a)
(b)
(c)
Figure 4. Average magnitude of fractional hemodynamic response for both chronic (left hand side) and acute session (right handside) stimulation experiments. (a) Hbt (b) Hbr and (c) Hbo. Error bars ¼standard deviation.
8 Journal of Cerebral Blood Flow & Metabolism 0(0)
(Figure 6). A repeated measures ANOVA performed
on the averaged evoked field potential response
recorded from the middle cortical layers (Figure 6,
column 4), revealed no reliable differences between
the animal type (F¼ 2.44, p¼ 0.13), experimental con-
dition (F¼ 1.5, p¼ 0.2) or interaction (F¼ 1.36,
p¼ 0.26). The discrepancy between the acute neural
and hemodynamic responses is an important issue
and this subject will be discussed further below.
Hypercapnia
To assess the hypercapnia response recorded during the
three chronic imaging sessions they were averaged and
the mean magnitude of response taken during 250-
500s. T-tests (two tailed distribution, two-sample
equal variance) were conducted to test for significant
differences between J20-AD and WT. None of the data
for Hbt (p¼ 0.39), Hbo (p¼ 0.28) and Hbr (p¼ 0.21)
for the two groups were reliably different. There were
also no significant differences between the groups in the
final acute imaging session (Hbt, p¼ 0.39, Hbo,
p¼ 0.23 and Hbr, p¼ 0.08).
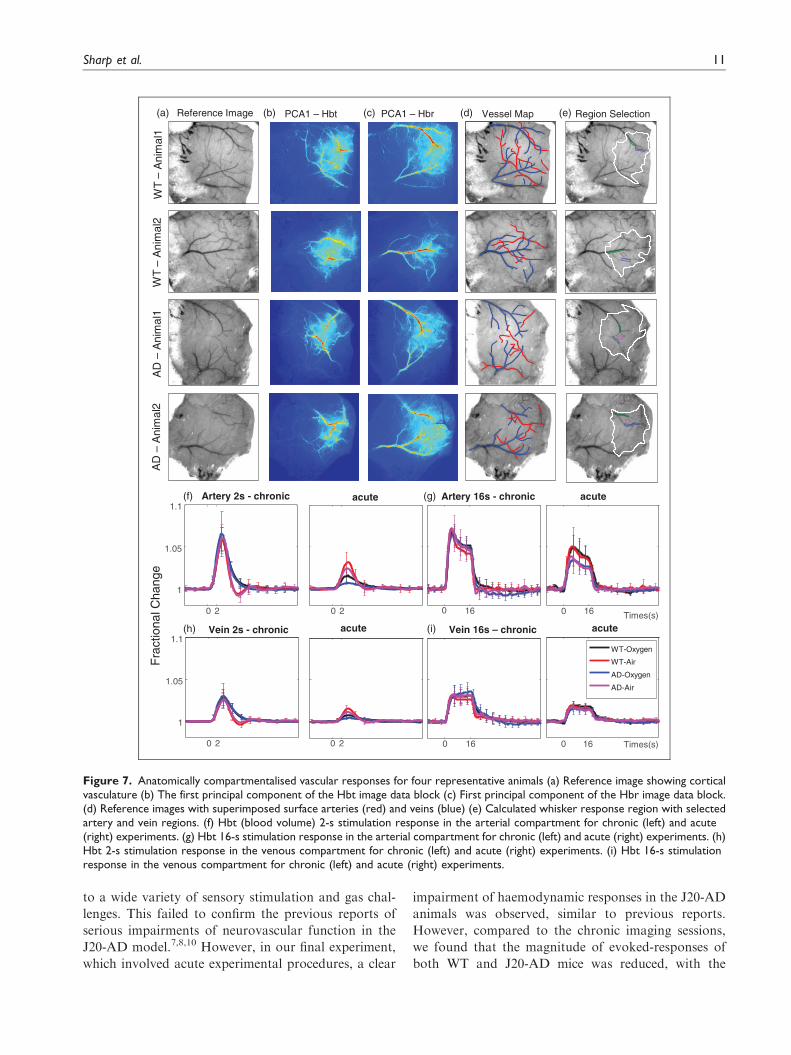
Compartmental responses and differences between
hemodynamic responses evoked by 2-s sensory
stimulation under air and oxygen
As we have collected two-dimensional images over time
across all our experimental sessions, principal
725 1450 2200 2950 4000 4750 5800
Time (s)
1
1.2
1.4
0.8
1
1.2
1.4
0.8
1
1.2
1.4
0.8
1
1.2
1.4
0.8
Exp1 Exp2 Exp3 Exp4 Exp5 Exp6 Exp7 Exp8
Fra
ctiona
l C
hange
(a)
(b)
(c)
(d)
Hbt
HbrHbo
Figure 5. Concatenated hemodynamic times series of responses across experiments for all imaging sessions (a) Wild-type chronic,(b) J20-AD Chronic, (c) Wild-type acute and (d) J20-AD acute. Shaded error bars¼ standard deviation.
Sharp et al. 9
component analysis (PCA) was used to extract
responses strongly biased towards the surface vessels
as they account for most of the variance in the data
(Figure 7). For Hbt, the first PCA almost always
highlighted major branches of the middle cerebral
artery (MCA) responding to the stimulus (Figure 7
(b)). This reflected strong activation of the arterial
tree on the surface of the brain. For Hbr, the first
PCA showed how strongly the surface veins were
changing in saturation as Hbr was decreased due to
the large increase in fresh blood arriving to the
cortex. After selecting arterial and vein regions
(Figure 7(f) to (i)), clear differences were observed in
both groups, not only in the magnitude of the chronic
and acute responses (described above) but in the return
to baseline depending on whether the animal was
breathing 100% oxygen or medical air. Again, in
both groups under the air condition, there was a
strong post-stimulation undershoot which was largest
in the arterial compartment (Figure 7(f)). In the pure
oxygen condition, this overshoot was absent again the
importance of this observation will be discussed below.
Discussion
Our main finding was that differences between the hae-
modynamic performance of J20-AD mice and WT con-
trols were dependent on experimental procedure.
Under stable conditions of chronic imaging, minimal
differences between the J20-AD and WT were observed
Average Impulse
-20
-10
0
Average Timeseries Channels 3 to 8
-1
0
Time(ms)0
-20
-10
0
-20
-10
0
-20
-10
0
-20
-10
0
Time(s)0 5 10 15 20
-1
0
-1
0
0 0.5 1 1.5 2 2.5
-1
0
-1
0
Mean FP AD
Channel
Time(ms)
Exp7 Mean FP WT
0 50
Mean FP AD
Channel
Exp5 Mean FP WT
Mean FP AD
Channel
Exp4 Mean FP WT
Mean FP AD
Channel
Exp2 Mean FP WT
Mean FP AD
Channel
Exp1 Mean FP WT
2
4
6
8
10
12
2
4
6
8
10
12
2
4
6
8
10
12
2
4
6
8
10
12
2
4
6
8
10
12
100
Time(ms)
0 50 100 50 100
(a)
(b)
(c)
(d)
(e)
Figure 6. Neural responses from WTand J20-AD mice from stimulation experiments. (a) Exp1, (b) Exp2 (c) Exp4 (d) Exp5 and (e)Exp7. Left hand images represent the averaged single impulse response in the different stimulation experiments. Middle time seriesrepresents the average field potential response from channels 3–8 for WT and J20-AD mice. Right hand column represents theaveraged time series impulse response from channels 3 to 8. WT¼ black time series, J20-AD¼ red time series, Shaded errorbars¼ standard deviation.
10 Journal of Cerebral Blood Flow & Metabolism 0(0)
to a wide variety of sensory stimulation and gas chal-
lenges. This failed to confirm the previous reports of
serious impairments of neurovascular function in the
J20-AD model.7,8,10 However, in our final experiment,
which involved acute experimental procedures, a clear
impairment of haemodynamic responses in the J20-AD
animals was observed, similar to previous reports.
However, compared to the chronic imaging sessions,
we found that the magnitude of evoked-responses of
both WT and J20-AD mice was reduced, with the
WT
–A
nim
al1
WT
–A
nim
al2
AD
–A
nim
al1
AD
–A
nim
al2
PCA1 – Hbt PCA1 – Hbr Vessel Map Region Selection
Times(s)
eg
na
hC
la
noit
car
F
Reference Image(a) (b) (c) (d) (e)
0 2
1
1.05
1.1Artery 2s - chronic
0 2
acute Artery 16s - chronic
0 16 0 16
acute
0 2
1
1.05
1.1 Vein 2s - chronic acute Vein 16s – chronic
0 2 0 16 0 16
acute
Times(s)
WT-Oxygen
WT-Air
AD-Oxygen
AD-Air
(f)
(h) (i)
(g)
Figure 7. Anatomically compartmentalised vascular responses for four representative animals (a) Reference image showing corticalvasculature (b) The first principal component of the Hbt image data block (c) First principal component of the Hbr image data block.(d) Reference images with superimposed surface arteries (red) and veins (blue) (e) Calculated whisker response region with selectedartery and vein regions. (f) Hbt (blood volume) 2-s stimulation response in the arterial compartment for chronic (left) and acute(right) experiments. (g) Hbt 16-s stimulation response in the arterial compartment for chronic (left) and acute (right) experiments. (h)Hbt 2-s stimulation response in the venous compartment for chronic (left) and acute (right) experiments. (i) Hbt 16-s stimulationresponse in the venous compartment for chronic (left) and acute (right) experiments.
Sharp et al. 11
J20-AD mice affected to a significantly greater extent.
We draw a general conclusion that well-controlled pro-
cedures are necessary to separate the effects of meth-
odological confounds from genuine effects of
pathophysiological changes induced by the disease
state being tested.
Preservation of neurovascular coupling in the J20
mouse model of AD
Why in the stable chronic recording phase of our study
did we fail to replicate the neurovascular deficits
reported previously? First, we used similar whisker
stimulation protocols to the studies that reported 35–
50% reductions in evoked cerebral blood flow
responses of J20-AD mice from sevenmonths of age.
Our subjects were 9–12months old at the start of the
study. Both our and previous experiments were all per-
formed with anaesthetised mice. However, previous
studies7,8,10 conducted few stimulation presentations
(4–6 stimulation trials per animal), in the anaesthetised
mouse immediately following acute procedures to thin
the skull. At the outset, we sought to extend these find-
ings by using 2D-OIS to resolve changes in different
vascular compartments with repeated testing in a
chronic preparation. Informed by our previous work
with an awake head restrained preparation,14 we
adopted a refined anaesthetised protocol that permitted
extended (3 h) imaging sessions repeatedly over weeks.
Under anaesthesia, the haemodynamic responses
evoked by sensory stimulation in this chronic prepara-
tion were comparable to those seen previously with
awake animals.14 Another difference was the present
protocol involved a more detailed set of experimental
variables, i.e. sequences of multiple trials (120) with
different duration whisker stimulations (2 s and 16 s),
with and without vascular reactivity gas challenges. In
addition, our protocol enabled us to generate an aver-
age experimental session by averaging the sequence of
hemodynamic time series from all chronically prepared
subjects (Figure 5). These data show not only that
responses to individual sensory stimulations could be
observed, but that the haemodynamic baseline values
were stable throughout the session. Under our more
stringent chronic conditions and more detailed testing,
we failed to replicate the previously reported haemody-
namic deficits in J20-AD mice. Therefore, our conclu-
sion must be that neurovascular function is still largely
preserved in the J20-AD mouse in this age range. This
observation also fits with the relatively mild cortical
pathology seen in the J20-AD mouse model (Figure 1).
Both our group and others12,13 have shown the strongest
Ab plaque deposition at this age point is in the hippo-
campus, which leads to early deficits in memory and
cognitive function. Neurovascular breakdown may be
more prevalent in mouse models with stronger cortical
pathology, such as the APP/PS1.15
Acute experimental conditions
Given these essentially negative results from the first
three chronic experimental sessions, we looked for cor-
respondences between haemodynamic and neural
responses in a final acute experimental session.
Significantly, this phase of the study involved acute
experimental conditions akin to those used in the previ-
ous investigations.7,8,10 After the electrode insertion, we
noted that baseline hemodynamics were altered.
Specifically, there was a significant reduction in blood
volume and saturation that gradually recovered to
normal stable levels towards the end of the session.
Significantly, the baseline changes were larger for the
AD mice compared with the WT controls. We therefore
suggest that acute procedures, in our case the insertion
of a multi-channel electrode, likely cause a cortical
spreading depression (CSD). This is characterised by
an alternating vasoconstriction and dilation that can
last over 90min, and is known to affect neurovascular
coupling profoundly.16,17 Therefore, differential rates of
recovery from CSD between the J20-AD and WT mice
are the most likely explanation of the differences in hae-
modynamic performance between the groups.
Furthermore, we present data in an AD animal at
the same age (Supplementary Figure 1) where we
imaged the electrode being inserted into the cortex
prior to performing the same experimental protocols
done in this study. The resulting CSD was a direct
effect of electrode insertion and produced the typical
changes in baseline (described above). This effect is
entirely consistent with the baseline changes we saw
in the early stages of our acute experiments.
Also importantly, Chang et al.16 reported that hemo-
dynamic recovery from CSD takes longer than the recov-
ery of neural activity. This could explain the lack of
correspondence between the neural (no differences) and
haemodynamic measures (significant differences)
between the WT and J20-AD groups in the final acute
phase of our study. Supporting this interpretation, elec-
trode insertion in mice induced a robust CSD response
across the whole cortex.18 Why should J20 mice be more
susceptible to its deleterious effects? It is known that J20
mice exhibit hypertrophic astrocytes and activated
microglia in the cortex near beta amyloid plaques.12,13
If these cells were sensitized as part of the disease process,
the CSD event could be more profound in J20-AD ani-
mals. The larger baseline disturbance in the J20-AD ani-
mals at the start of recording in the final acute
experimental session would be consistent with this sug-
gestion (Figure 5).
12 Journal of Cerebral Blood Flow & Metabolism 0(0)
Oxygen vs. air response shape
A further unexpected result was that, regardless of
mouse model, the shape of hemodynamic response
changed according to whether the animal was breath-
ing oxygen or air. The overall response magnitude was
reduced and there was an undershoot in the return
to baseline when the animals were breathing air, com-
pared with when they were breathing oxygen. This was
especially evident following 2-s stimulation, and it was
less marked for 16-s stimulation (Figure 7). This differ-
ence was driven by the arterial response. In contempo-
rary neurovascular research, the prevailing view is that
coupling is more likely to be neurogenic in origin, com-
pared to metabolically driven changes in blood
flow.19,20 However, as the neural responses evoked by
2-s sensory stimulation were remarkably similar
between the air and oxygen conditions (Figure 6), the
observed differences appear to be a direct effect of
inspired oxygen controlling the arterial response, par-
ticularly in the return to baseline. Previous in vitro
experiments21 reported that levels of oxygen could dic-
tate whether an artery dilates or constricts in response
to a stimulus, and that this is mediated by different
responses of astrocytes. Interestingly, a recent 2-
photon microscopy study22 reported similar arterial
responses to mouse sensory stimulation. In some
cases, the responses had a bi-phasic shape (similar to
our air condition) while in others, there was a gradual
return to baseline without overshoot (similar to our
oxygen condition). No reasons were given to why the
same sensory stimulus produced a varying arteriolar
response. However, an important conclusion from
this aspect of our study is that tissue oxygen levels
may be an important determinant of neurovascular
control and warrants further investigation.
Limitations of the study
Our current spectroscopy algorithm requires an estima-
tion of both a level of blood volume and saturation.
Although, previous published research used LDF,
which has a similar weakness, arterial spin labelling
studies suggest that baseline CBF is reduced in J20-
AD mice.23 We mitigated these effects by measuring
changes in baseline volume and saturation in our ani-
mals when switching from breathing oxygen to air. If
there were differences in saturation between the two
groups, this would be evidence that our estimated base-
lines values were inaccurate. However, the consistency
of the results between the WT and AD mice suggests
that under the oxygen condition, our estimates were
appropriate. Moreover, even if estimates of volume
and saturation were wrong, the fractional change in
Hbt response would be unaffected. We have run the
data across a range of assumed Hbt baselines and
this produces no difference in the fractional change in
Hbt response (Supplementary Figure 2). A final con-
sideration between previous studies using LDF and
ours using 2D-OIS is the potential that these methodol-
ogies are sampling from different depths of tissue.
2D-OIS measures predominantly from the first
500mm’s of tissue whereas the LDF can penetrate
deeper.24 In future experiments, we will perform LDF
simultaneous with 2D-OIS to investigate this possibility.
It must also be noted that all our experiments were
performed under light anaesthesia, which of course is a
non-physiological state. To some extent, this is mitigat-
ed by our previous investigation14 that showed the
responses in the present study were comparable to
those seen previously with awake animals. On the pos-
itive side, the current anaesthetised preparation pro-
vides a more stable imaging platform where the
effects of controlled small mechanical stimulations
can be observed. Importantly, baseline perturbations,
such as caused by the insertion of an electrode, are
easier to detect in the absence of uncontrolled motiva-
tional and movement variables that are often inherent
in awake experimental protocols.
The extent to which the current observations may
generalise to other mouse models of AD, and to other
time-points during disease progression, remains uncer-
tain. For example, other mouse models at various time
points have shown neurovascular deficits (see review by
Klohs et al.6) including the triple transgenic APPSwDI9,
Tg2567,25 APP/PS1 and 5FAD mice.26 However, we
note that many of these experiments were conducted
using acutely anaesthetised preparations. Potentially,
this could render them vulnerable to the problem of
short-term acute procedures reported in this study.
Therefore, the current findings with the J20-AD model
should serve as a note of caution that observed deficits
could be a result of experimental approach, rather than
a measure of disease progression.
Conclusions
Contrary to previous reports of neurovascular deficits
J20-AD mice, under the stable chronic imaging condi-
tions, we found that the neurovascular performance of
J20-AD did not differ reliably from that of WT con-
trols. However, the acute phase of the current study
showed the J20-AD mice to be more susceptible to dis-
ruptive interventions, such as the acute experimental
procedures used in the current study. The J20-AD
mouse model may, therefore, represent an ideal
model to explore the effects of mixed pathologies
with conditions such as atherosclerosis that would fur-
ther compromise neurovascular function.
Sharp et al. 13
Funding
The author(s) disclosed receipt of the following financial sup-
port for the research, authorship, and/or publication of this
article: This work was supported by Alzheimer’s Research
UK (grant number ARUK-IRG2014) and the Medical
Research Council UK (grant number MR/M013553/1).
Clare Howarth is funded by a Sir Henry Dale Fellowship
jointly funded by the Wellcome Trust and the Royal
Society (Grant Number 105586/Z/14/Z).
Acknowledgements
We thank Dr. Lennart Mucke (Gladstone Institute of
Neurological Disease and Department of Neurology,
UCSF, CA) and the J. David Gladstone Institutes for the
hAPPSwe, Ind mice. The authors would also like to thank
Michael Port for his technical assistance.
Declaration of conflicting interests
The author(s) declared no potential conflicts of interest with
respect to the research, authorship, and/or publication of this
article.
Authors’ contributions
All authors proofread and edited the manuscript, PS designed
and carried out the study, KA performed histology, LB
designed and built the imaging apparatus, SH performed sta-
tistical analysis, CH performed data analysis, OS performed
data analysis, SW advised on experimental design. PR
advised on data analysis and final drafting of the manuscript.
JB conceived the study, performed data analysis and wrote
the manuscript.
ORCID iDs
Kamar E Ameen-Ali https://orcid.org/0000-0002-7583-
4099
Luke Boorman https://orcid.org/0000-0001-5189-0232
Clare Howarth https://orcid.org/0000-0002-6660-9770
Supplemental material
Supplemental material for this article is available online.
References
1. Hardy J. An ‘anatomical cascade hypothesis’ for
Alzheimer’s disease. Trends Neurosci 1992; 15: 200–201.
2. Zlokovic BV. Neurodegeneration and the neurovascular
unit. Nat Med 2010; 16: 1370–1371.
3. Zlokovic BV. Neurovascular pathways to neurodegener-
ation in Alzheimer’s disease and other disorders. Nat Rev
Neurosci 2011; 12: 723–738.
4. Iturria-Medina Y, Sotero RC, Toussaint PJ, et al. Early
role of vascular dysregulation on late-onset Alzheimer’s
disease based on multifactorial data-driven analysis.
Nat Commun 2016; 7: 11934.
5. Ameen-Ali KE, Wharton SB, Simpson JE, et al. Review:
neuropathology and behavioural features of transgenic
murine models of Alzheimer’s disease. Neuropathol Appl
Neurobiol 2017; 43: 553–570.
6. Klohs J, Rudin M, Shimshek DR, et al. Imaging of cere-
brovascular pathology in animal models of Alzheimer’s
disease. Front Aging Neurosci 2014; 6: 32.
7. Lacoste B, Tong XK, Lahjouji K, et al. Cognitive
and cerebrovascular improvements following kinin B1
receptor blockade in Alzheimer’s disease mice.
J Neuroinflammation 2013; 10: 57.
8. Ongali B, Nicolakakis N, Tong XK, et al. Angiotensin II
type 1 receptor blocker losartan prevents and rescues
cerebrovascular, neuropathological and cognitive deficits
in an Alzheimer’s disease model. Neurobiol Dis 2014; 68:
126–136.
9. Park L, Koizumi K, El Jamal S, et al. Age-dependent
neurovascular dysfunction and damage in a mouse
model of cerebral amyloid angiopathy. Stroke 2014; 45:
1815–1821.
10. Royea J, Zhang L, Tong XK, et al. Angiotensin IV recep-
tors mediate the cognitive and cerebrovascular benefits
of losartan in a mouse model of Alzheimer’s disease.
J Neurosci 2017; 37: 5562–5573.
11. Tarantini S, Fulop GA, Kiss T, et al. Demonstration of
impaired neurovascular coupling responses in TG2576
mouse model of Alzheimer’s disease using functional laser
speckle contrast imaging. Geroscience 2017; 39: 465–473.
12. Ameen-Ali KE, Simpson JE, Wharton SB, et al. The time
course of recognition memory impairment and glial
pathology in the hAPP-J20 mouse model of Alzheimer’s
disease. J Alzheimers Dis 2019; 68: 609–624.
13. Wright AL, Zinn R, Hohensinn B, et al.
Neuroinflammation and neuronal loss precede Abeta
plaque deposition in the hAPP-J20 mouse model of
Alzheimer’s disease. PLoS One 2013; 8: e59586.
14. Sharp PS, Shaw K, Boorman L, et al. Comparison of
stimulus-evoked cerebral hemodynamics in the awake
mouse and under a novel anesthetic regime. Sci Rep
2015; 5: 12621.
15. Reyes-Marin KE and Nunez A. Seizure susceptibility in
the APP/PS1 mouse model of Alzheimer’s disease and
relationship with amyloid beta plaques. Brain Res 2017;
1677: 93–100.
16. Chang JC, Shook LL, Biag J, et al. Biphasic direct cur-
rent shift, haemoglobin desaturation and neurovascular
uncoupling in cortical spreading depression. Brain 2010;
133: 996–1012.
17. Piilgaard H and Lauritzen M. Persistent increase
in oxygen consumption and impaired neurovascular cou-
pling after spreading depression in rat neocortex. J Cereb
Blood Flow Metab 2009; 29: 1517–1527.
18. Eles JR, Vazquez AL, Kozai TDY, et al. In vivo imaging
of neuronal calcium during electrode implantation: spa-
tial and temporal mapping of damage and recovery.
Biomaterials 2018; 174: 79–94.
19. Kennerley AJ, Harris S, Bruyns-Haylett M, et al.
Early and late stimulus-evoked cortical hemodynamic
responses provide insight into the neurogenic nature of
neurovascular coupling J Cereb Blood Flow Metab 2012;
32: 468–480.
14 Journal of Cerebral Blood Flow & Metabolism 0(0)
20. Urban A, Rancillac A, Martinez L, et al. Deciphering the
neuronal circuitry controlling local blood flow in the
cerebral cortex with optogenetics in PV::Cre transgenic
mice. Front Pharmacol 2012; 3: 105.
21. Gordon GR, Choi HB, Rungta RL, et al. Brain metab-
olism dictates the polarity of astrocyte control over arte-
rioles. Nature 2008; 456: 745–749.
22. Uhlirova H, Kilic K, Tian P, et al. Cell type specificity
of neurovascular coupling in cerebral cortex. eLife 2016;
5: e14315.
23. Hebert F, Grand’maison M, Ho MK, et al. Cortical atro-
phy and hypoperfusion in a transgenic mouse model of
Alzheimer’s disease. Neurobiol Aging 2013; 34: 1644–1652.
24. Berwick J, Johnston D, Jones M, et al. Neurovascular
coupling investigated with two-dimensional optical imag-
ing spectroscopy in rat whisker barrel cortex. Eur J
Neurosci 2005; 22: 1655–1666.
25. Han BH, Zhou ML, Abousaleh F, et al. Cerebrovascular
dysfunction in amyloid precursor protein transgenic
mice: contribution of soluble and insoluble amyloid-
beta peptide, partial restoration via gamma-secretase
inhibition. J Neurosci 2008; 28: 13542–13550.
26. Cruz Hernandez JC, Bracko O, Kersbergen CJ, et al.
Neutrophil adhesion in brain capillaries reduces cortical
blood flow and impairs memory function in Alzheimer’s
disease mouse models. Nat Neurosci 2019; 22: 413–420.
Sharp et al. 15