Embed Size (px)
Citation preview
NEUROPATHOGENESIS OF THE ACUTE PHASE RESPONSE TO
INFLUENZA VIRUS IN MICE
By
VICTOR HUGO LEYVA GRADO
A thesis submitted in partial fulfillment of
the requirements for the degree of
Doctor of Philosophy
WASHINGTON STATE UNIVERSITY
College of Veterinary Medicine
AUGUST 2008

To the Faculty of Washington State University
The members of the Committee appointed to examine the thesis of VICTOR
HUGO LEYVA-GRADO find it satisfactory and recommend that it be accepted.
Chair
ii

ACKNOWLEDGMENTS
I would like to explicitly thank all the people who helped to make this thesis
possible, but that would be an impossible task. I will instead express my gratitude to a
small number of individuals who were especially instrumental to my work over the last
few years. Particularly, to my mentor Dr James Krueger who gave me the opportunity to
work in his lab and who taught me many things during this time. The members of my
committee—Drs Lynn Churchill, Mary Sanchez-Lanier and Joseph Harding for their
excellent guidance, patience and support. A special thank to Drs Jeannine Majde, Juan A
Montaraz, Bryan Slinker and Levente Kapas for their support and insight.
I would also like to thank current and former laboratory colleagues including
Stewart Bohnet, Richard Brown, Dr Alok De, Dr Christopher Davis, Dr Ping Taishi, Dr
Eva Szentirmai, Dr Timothy Traynor, Marcus Urza, Lissette Jimenez, Melissa Wu,
Timothy Williams, Samantha Eller and Cora Fix for their help and inputs. To my fellow
graduate students particularly Fan Liao, Sanjib Mukherjee and William Clegern that have
helped to make the workload bearable. In addition, I would like to thank the faculty, staff
and fellow graduate students in the Department of Veterinary and Comparative Anatomy,
Pharmacology and Physiology for helping me in my academic endeavor.
I also want to thank my parents Alberto Leyva and Esperanza Grado for their love
and support, and the rest of my family and friends for all their encouragement and
support in all aspects of my life. This project was made possible through funding
provided by the National Institute of Health and the fellowship that I received from the
iii

Direccion General de Apoyo al personal Academico of the National Autonomous
University of Mexico.
To my wife, Lupita Leyva that has helped me in a lot of ways: she has made me a
better student, a better scientist and a better person.
iv

NEUROPATHOGENESIS OF THE ACUTE PHASE RESPONSE TO
INFLUENZA VIRUS IN MICE
Abstract
By Victor Hugo Leyva Grado PhD
Washington State University
August 2008
Chair: James M. Krueger
Influenza virus infection causes severe systemic clinical signs in infected mice.
Non-neurotropic human strains of influenza virus are believed to be confined to the
respiratory tract following intranasal (IN) infection. Characteristic symptoms of influenza
infection include changes in body temperature, locomotor activity and sleep patterns.
These symptoms are part of the acute phase response (APR), or ‘flu’ syndrome. Such
symptoms are in part regulated by cytokines such as tumor necrosis factor alpha (TNFα)
and interleukin 1 beta (IL1β). However, it remains to be established whether the
cytokines that act on the brain to induce the APR are produced in the brain or if they are
made systemically and then reach the brain through the blood or other routes.
To better understand the pathophysiology of the APR, we have characterized the
presence of extrapulmonary virus in the brain and its effect on cytokine up-regulation.
Furthermore, we characterized the role of the olfactory pathway in the ontogenesis of the
v

APR after intranasal inoculation with influenza virus. We used for all our experiments a
human mouse adapted strain of influenza virus named PR8. Virus was found in the
mouse olfactory bulb (OB) as early as 4 h post-challenge where the virus appeared to go
into partial replication. The virus co-localized in microglia and astrocytes but not in
neurons. An increase in TNFα, IL1β and interferon-induced enzymes was also observed
in the OB after viral challenge. Cytokines were produced by microglia, astrocytes and
neurons in the OB. Surgical transection of the olfactory nerve (ONT) prior to the viral
challenge delayed the virus-induced hypothermia. Additionally, the number of viral
antigen-, TNFα− and IL1β− immunoreactive (IR) cells was reduced in the OBs of mice
that received the ONT. We also examined brain regions that have direct and indirect
connections with the OB. No viral antigen-IR was observed in any of these regions;
however, an increase in the number of TNFα− and IL1β− IR cells was observed in
selected regions along the olfactory pathway. Taken together, these data elucidate in part
some of the possible mechanisms involved in the ontogenesis of the influenza-induced
APR in infected mice.
vi

TABLE OF CONTENTS
ACKNOWLEDGMENTS …………………………………………………… iii
ABSTRACT …………………………………………………………………… v
LIST OF TABLES .…………………………………………………………… x
LIST OF FIGURES ………………………………………………………….. xi
LIST OF ABBREVIATIONS ……………………………………………….. xiv
DEDICATION ……………………………………………………………….. xvi CHAPTERS
I. INTRODUCTION …………………….……………………………… 1
Influenza virus infection …………………………………….......... 1
Neurotropic strains versus non-neurotropic strains of influenza ….. 4
Influenza A/ PR/8/34 H1N1 (PR8) .………………………………... 6
Detection of infection and cytokine production …………………… 6
Tumor necrosis factor-α ................................................................... 9
Interleukin 1β ................................................................................... 12
Production of cytokines in influenza-induced infection ………….. 13
Cytokines and the thermoregulatory response ……………………. 15
Cytokines and sleep …………………………………………….…. 17
Murine olfactory bulb organization and its possible interaction
with the influenza virus …………………………………….……… 19
The olfactory pathway ……………………………………….……. 21
vii

Propagation of the cytokine signals through the brain ………….… 23
References …………………………………………………….….. 25
II. DETECTION OF MOUSE-ADAPTED HUMAN INFLUENZA
VIRUS IN THE OLFACTORY BULBS OF MICE WITHIN
HOURS AFTER INTRANASAL INFECTION ………………….. 41
Abstract …………………………………………………………. 42
Introduction ……………………………………………………… 43
Material and methods …………………………………………… 46
Results ………………………………………………………….. 53
Discussion ……………………………………………………… 59
References ……………………………………………………… 65
III. INFLUENZA VIRUS AND CYTOKINE-IMMUNOREACTIVE
CELLS IN THE MURINE OLFACTORY BULB AFTER
INTRANASAL INOCULATION ………………………………… 78
Abstract ………………………………………………………… 79
Introduction …………………………………………………….. 80
Material and methods …………………………………………… 83
Results ………………………………………………………….. 91
Discussion ……………………………………………………… 96
References ……………………………………………………… 104
viii

IV. THE OLFACTORY NERVE PATHWAY HAS A ROLE
IN THE ACUTE PHASE RESPONSE TO INTRANASAL
INOCULATION WITH INFLUENZA VIRUS ……………………… 126
Abstract ………………………………………………………… 127
Introduction …………………………………………………….. 128
Material and methods ………………………………………….. 131
Results …………………….…………………………………….. 139
Discussion ……………………………………………………… 145
References ……………………………………………………… 152
V. GENERAL DISCUSSION …….…………………………………… 172
References ……………………………………………………… 176
ix

LIST OF TABLES
CHAPTER I
1.1 Influenza A virus gene segments ………………………….……… 1
CHAPTER II
2.1 Frequency of NP detection by nPCR in olfactory bulbs using different anesthesia protocols …………………………......... 69 2.2 Comparison of frequency of PR8 NP detection in various tissues using method 1 or method 2 nPCR ………………………. 70 2.3 Primer sequences for RT-PCR and nPCR analysis ……………… 72
x

LIST OF FIGURES
CHAPTER II
2.1 Body temperature curves of mice unexposed to virus (baseline) or infected IN with influenza virus
PR8 under metofane anesthesia ……………….…………………… 74
2.2 Olfactory bulb cytokine and IFN-induced enzyme mRNA qPCR data from three experiments (corrected
for boiled virus control values) at 4, 7 , and 15 ………... …………………………………………………… 75 2.3 Photomicrographs of OB coronal sections from mice killed 15 hr PI after IN challenge stained either for H1N1 influenza A or for N1 NP ………………………………………… 76
CHAPTER III
3.1 Tumor necrosis factor alpha (TNFα)-IR cells in the OB of non-infected wild-type (WT) and TNFα knockout (KO) mice …................................................................................... 113 3.2 Western blot analysis of TNFα antibody alone and combined with olfactory bulb protein extracts ...........................…………… 114 3.3 Interleukin-1 beta (IL1β)-IR cells in the OB of non-infected IL1β WT and KO mice ………………………………..………… 115 3.4 Western blot analysis of IL1β antibody alone and combined with olfactory bulb protein extracts ..……………………………. 116 3.5 Distribution of viral protein and F4/80 immunoreactivity within cross-sections of the whole olfactory bulb (OB) ………… 117 3.6 Morphological comparison of immunoreactivity in OB sections of mice inoculated with live PR8 using F4/80 antibody,
viral H1N1 antibody and viral nucleoprotein (NP) antibody …………………………………………………………… 118 3.7 Photomicrograph of H1N1-immunoreactivity in the olfactory nerve of a mouse inoculated with live PR8 ………………………. 119
xi

3.8 Photomicrographs of the OB glomerular layer showing coronal sections from boiled and live virus-inoculated mice at 15 h post IN inoculation stained for F4/80 …………………………………. 120 3.9 Confocal photomicrographs of H1N1-IR cells and cellular
markers in the OB of mice inoculated with live PR8 ......... 121
3.10 Tumor necrosis factor alpha (TNFα)-IR cells in the OB of mice inoculated with live PR8 ……………………………….. 122 3.11 The number of TNFα- and IL1β-IR cells in the OBs from mice
Inoculated with live virus in comparison with mice inoculated With boiled virus ……………………………………...…………. 123
3.12 Confocal photomicrographs of cytokines and cellular markers in the OB of PR8-infected mice …………………………………. 124
3.13 IL1β-immunoreactivity in the OB of mice inoculated with
live PR8 virus …………………………………………………… 125
CHAPTER IV
4.1 Photomicrographs of sagital sections of the olfactory epithelium showing their connectivity with the olfactory bulb after sham
surgery or the olfactory nerve transection ………………… 158 4.2 Time course of body temperature changes in mice that received a sham surgery or an olfactory nerve transection 10 d prior to intranasal inoculation with influenza virus ………………… 159 4.3 Locomotor activity responses to PR8 challenge in mice that received a sham surgery or an olfactory nerve transection 10 d prior to intranasal inoculation with influenza virus …………. 160 4.4 Food intake and body weight following intranasal inoculation with influenza virus in mice that received a sham surgery or an olfactory nerve transection 10 d prior to intranasal inoculation with influenza virus ………………….……………………… 161 4.5 Photomicrographs of olfactory bulb coronal sections from mice
with sham surgery or an olfactory nerve transection killed 15 h post intranasal challenge stained for influenza H1N1 …............ 163
4.6 Quantitative analyses of the number of the viral antigen H1N1-immunoreactive (IR) cells in the OB of mice with sham
xii
surgery or an olfactory nerve transection killed 15 h post intranasal challenge with live virus …………………………………..………..… 164 4.7 Quantitative analyses of the number of TNFα- and IL1β-immunoreactive (IR) cells in the OB of mice with sham surgery or an olfactory nerve transection killed 15 h post intranasal challenge with live virus ……………………………………………. 165 4.8 The number of TNFα- immunoreactive (IR) cells in the piriform cortex (Pir), the olfactory tubercle (Tu), the basolateral amygdala (BLA), the central amygdala (CeA) and the hypothalamic arcuate nucleus (Arc) at 10 h and 15 h after intranasal inoculation with influenza virus …………………………………………..…………. 167 4.9 Distribution of the TNFα- and IL1β- immunoreactive (IR) cells in the piriform cortex (Pir), olfactory tubercle (Tu) amygdala (Amy) and the hypothalamic arcuate nucleus (Arc) at 15 h after intranasal inoculation with live PR8 influenza virus …….……………………. 168 4.10 Quantitative analyses of the number of IL-1β- immunoreactive (IR) cells in the piriform cortex (Pir), the olfactory tubercle (Tu), the basolateral amygdala (BLA), the central amygdala (CeA) and the hypothalamic arcuate nucleus (Arc) at 10 h and 15 h after
intranasal inoculation with influenza virus ……..………………….. 170
4.11 Double labeling immunofluorescence photomicrographs of TNFα or IL1β and the neuronal marker (NeuN) in the central
amygdala of PR8-infected mice …………………………….……... 171
xiii

LIST OF FREQUENTLY USED ABBREVIATIONS
APR (acute phase response)
Arc (hypothalamic arcuate nucleus)
ATP (adenosine triphosphate)
BLA (basolateral amygdala)
CeA (central amygdala)
CNS (central nervous system)
CVO (circumventricular organs)
DAB (diaminobenzidine)
EPL (external plexiform layer)
GFAP (glial fibrillary acidic protein)
GL (glomerular layer)
HA (hemagglutinin)
HT (hypothalamus)
ICV (Intracerebroventricular)
IFN (interferon)
IHC (immunohistochemistry)
IL1β (interleukin 1 beta)
IL1R (IL1 receptor)
IN (intranasal)
IP (intraperitoneal)
IR (immunoreactive)
KO (knock out)
xiv
LPS (lipopolysaccharide)
ML (mitral cell layer)
NA (neuraminidase)
NF-kappa B (nuclear factor-kappa B)
NP (nucleoprotein)
NREMS (non-rapid eye movement sleep)
OAS (2'-5' oligoadenylate synthetase)
OB (olfactory bulb)
OEC (olfactory ensheathing cells)
ON (olfactory nerve)
ONT (olfactory nerve transection)
ORN (olfactory receptor neurons)
PI (post-infection)
Pir (piriform cortex)
POA (pre-optic area)
PR8 (influenza A virus PR/8/38 H1N1)
REMS (rapid eye movement sleep)
RNA (ribonucleic acid)
Tb (body temperature)
TLR (toll-like receptors)
TNFα (tumor necrosis factor-alpha)
TNFR (TNF receptor)
Tu (olfactory tubercle)
xv

xvi
DEDICATION
This thesis is dedicated to my beautiful and loving wife Lupita Leyva.
I love you!

CHAPTER I
INTRODUCTION
Influenza virus infection
Influenza viruses are members of the Orthomyxoviridae family which includes 5
genera: Influenza A, Influenza B, Influenza C, Isavirus and Thogovirus (Wright and
Webster, 2001). This thesis is limited to influenza A virus. Influenza particles bear a
lipid envelope from which two different types of glycoprotein spikes radially project:
hemagglutinin (HA) and neuraminidase (NA) (Smith, 1952; White and Fenner, 1994).
The viral genome consist of single-stranded, negative-sense ribonucleic acid (RNA)
divided in eight segments that encode for ten different viral proteins (Baigent and
McCauley, 2003, Steinhauer and Skehel, 2002, Wright and Webster, 2001) (Table 1.1).
Table 1.1 Influenza A virus gene segments
Segment Size Weight Protein Function(s)
1 2341 96 kD Polymerase (PB2) Cap binding /Proapoptosis 2 2341 87 kD Polymerase (PB1) Elongation 3 2233 85.5 kD Polymerase (PA) Genome RNA synthesis 4 1778 220 kD Hemagglutinin (HA) Binding to cell/Main viral antigen
5 1565 55 kD Nucleoprotein (NP) Encapsidates RNA / Transport signaling
6 1413 240 kD Neuraminidase (NA) Release of virus particle 7 1027 28 kD Matrix (M1) Structure/Virus assembly
15 kD Integral membrane (M2) Ion channel
8 890 25kd Non structural (NS1) Splicing/ Response to interferon 14 kD Non structural (NS2) Nuclear export protein
Adapted from Steinhauer and Skehel, 2002.
1

The replication process starts when the virus binds through its HA proteins to the
sialic-acid containing receptors on the target cells and then penetrates the cell via
clathrin-dependent receptor-mediated endocytosis (Sidorenko and Reichl, 2004). Once in
the nucleus, the minus-strand viral RNA (vRNA) is copied by the viral polymerase
complex to produce three types of RNAs: plus-strand viral messenger RNA (mRNA),
minus-strand vRNA, and plus-strand complementary RNA (cRNA) that serves as
template for new vRNA synthesis. Viral mRNAs are produced using the 5’ end cap and
the poly A tail from host mRNA as primers for their synthesis and then are exported to
the cytoplasm to be translated in the ribosomes with previous splicing of M and NS
mRNAs. Envelope proteins (HA, NA, and M2) are directed to the endoplasmic reticulum
where HA and NA are glycosylated before migrating to the cell surface. Meanwhile, the
rest of the synthesized proteins are imported to the nucleus, where they participate in the
synthesis of full length vRNA (-) and cRNA (+) strands. The new viral
ribonucleoproteins (vRNPs) are formed in the nucleus as a result of binding of PB1, PB2,
PA, NP, M1 and NS2 proteins with the newly synthesized vRNAs, and are exported to
the cell membrane to interact with HA, NA and M2. This complex forms the viral
particles which are released by budding from the plasma membrane by cleavage of HA
by the NA protein.
One of the more remarkable characteristics of these viruses is their antigenic
variability which in turn is associated with epidemics almost every year and the more
sporadic appearance of pandemics (Oxford, 2000; Zambon, 2001). Changes in the
structural proteins of the virus produce an antigenic variation that prevent the specific
antibodies produced in previous infections to bind to their antigen, enabling the virus to
2

evade the immune response despite pre-existing specific neutralizing antibodies (Wright
and Webster, 2001; Zambon, 2001). Two mechanisms of antigenic variation have been
identified for Influenza: Antigenic drift and antigenic shift.
Antigenic drift is the consequence of accumulation of individual point mutations
leading to amino acid substitutions in structural glycoproteins on the surface of the virion,
specifically HA and NA (Naeve et al., 1984). Such structural changes are associated with
influenza epidemics because the pre-existed antibodies are not able to control the virus
after the changes in epitopes (Steinhauer and Skehel, 2002; Treanor, 2004).
Antigenic shift implies a major change in the surface proteins of the virus due to
acquisition of novel genes that encode completely new surface glycoproteins and results
in the replacement of HA and sometimes NA, originating new virus subtypes (Flint et al.,
2004; Treanor, 2004). These genotypic changes are facilitated by the segmented nature of
the influenza genome that enables the exchange of genetic information between two
different influenza viruses while co-infecting a host, a genetic process known as
reassortment. Due to the nature of changes in the antigenic structures of the virus,
antigenic shifts have been associated with the presentation of global pandemics (Wright
and Webster, 2001; Zambon, 2001; Flint et al., 2004).
At least 15 non-overlapping subtypes of hemagglutinin (H1-H15) and 9 subtypes of
neuraminidase (N1-N9) have been identified for influenza viruses (Steinhauer and
Skehel, 2002). Only 3 HA subtypes (H1, H2 and H3) and 2 NA subtypes (N1 and N2)
have been prevalent infecting humans since 1918 (Flint et al., 2004, Nicholson et al.,
2003, Wright and Webster, 2001).
3

Infection with influenza virus produces a highly contagious respiratory disease that
can cause mild to severe illness, but seldom leads to death unless pneumonia (viral or
bacterial) ensues (Centers for Disease Control and Prevention, 2005). Clinical
manifestations of infection are associated with the pneumotropic (affinity for the
respiratory tract tissues) nature of the virus in humans and in animals such as chickens,
pigs, and horses (Baigent and McCauley, 2003, Nicholson et al., 2003, Zambon, 2001).
In humans, infection can be asymptomatic or can be a mild to severe respiratory illness
characterized by fever, fatigue, dry cough, sore throat, anorexia and myalgia (Studahl,
2003). Mice are not naturally infected by influenza virus (Ward, 1997); however both
human and avian strains can be adapted to replicate in the mouse and produce clinical
signs of infection and death. When a human-derived strain is adapted to mice by serial
lung passage, some of the clinical signs in the infected mice include pneumonia,
hypothermia, decreased locomotor activity, decreased rapid eye movement sleep (REMS)
and increased non-REMS (Conn et al., 1995; Fang et al., 1995; Toth et al., 1995; Alt et
al., 2003).
Neurotropic strains versus non-neurotropic strains of influenza
Viruses that have a selective affinity for nervous tissue and exert their main effect on
the nervous system are termed neurotropic or neuroinvasive viruses (Flint et al., 2004,
Johnson, 1998). Generally, neurotropic viruses are also neurovirulent (i.e., the virus
replicates in neurons and produces cell death), a classic example being the rabies virus.
Such viruses can spread from neuron to neuron within the brain and cause encephalitis.
Viruses that lack the capacity to invade the brain are termed non-neurotropic viruses or
4

strains. Influenza viruses are not generally recognized as neurotropic in humans.
However, in the last decade influenza virus has been increasingly associated in children
with both occasional cases of post-infection encephalitis and, more frequently, an often-
lethal encephalopathy. Most of these neurological diseases have been reported in
Japanese children (Kawada et al., 2003, Okumura et al., 2005, Sugaya, 2002), but
recently influenza-associated encephalopathy was reported in American children as well
(Maricich et al., 2004), indicating that a tougher screening of pediatric cases of influenza
will probably demonstrate a higher incidence of this clinical manifestation.
In mice, replication of most mouse-adapted human strains of influenza is thought to
be restricted to the respiratory tract (Hennet et al., 1992). Notable exceptions are the
influenza strains A/WSN/33 and A/NWS/33, which have been sequentially passaged in
the brains of mice and which are neurovirulent when inoculated intracerebrally into adult
mice. These strains are also neurotropic when intranasally inoculated in neonatal mice
(Schlesinger et al, 1998). For example, in 7 day-old mice after intranasal (IN) inoculation
with influenza A/WSN/33, the viral antigen-immunoreactivity in the olfactory bulb (OB)
is restricted to neurons and widely distributed through the different layers of the OB
(Aronsson et al., 2003). Avian strains of influenza are generally neurotropic and
neurovirulent in animals (chickens, ferrets, and mice) but have not demonstrated
neurotropism in recent human outbreaks (Maines et al., 2005). After IN inoculation of
mice with an avian strain of influenza, the viral antigen-immunoreactivity is distributed
into different regions of the brain including the OB (Iwasaki et al., 2004) and the viral
antigen is detected mainly in neurons and occasionally in glial cells surrounding areas of
inflammation (Shinya et al., 2000; Iwasaki et al., 2004).
5
Influenza A/ PR/8/34 H1N1 (PR8)
PR8 is a human isolate adapted to produce pneumonitis in mice following IN
inoculation (Johnson and Mims, 1968). Inoculation of mice with this influenza strain will
produce a lethal pneumonitis marked by hypothermia, somnolence and anorexia (Alt et
al., 2003, Fang et al., 1995, Toth et al., 1995, Chen et al., 2004). Furthermore, virological
and pathological studies with this and other H1N1 strains reveal that when the virus is
inoculated IN, the infection is restricted to the respiratory epithelium with no detectable
pathology in the central nervous system (Iwasaki et al., 2004). When PR8 is used to
infect mouse brain cell cultures (21 days old) the results are similar, with no production
of infectious virions when evaluated by plaque-forming unit measurements. However, a
transient increase in HA and NA proteins is seen, suggesting that the virus goes through a
partial replication (Bradshaw et al., 1989). Viral protein (NP and M1) immunoreactivity
is observed in cultured neurons and astrocytes (Bradshaw et al., 1989).
Detection of infection and cytokine production
Cytokines are a diverse group of proteins that are secreted by most nucleated cells
(Dinarello, 2000). Since cytokines have a key role in the regulation of the immune and
inflammatory responses, many cytokines have been discovered and characterized in
association with these pathophysiological events (Opp, 2005). Cytokines such as IL1 and
TNFα promote their own synthesis, stimulate the synthesis of other cytokines including
some anti-inflammatory cytokines, and stimulate the production of glucocorticoids in
autocrine and paracrine manners (Vitkovic et al., 2000; Silverman et al., 2005).
6
The presence of a virus or any other pathogenic microorganism is detected by
immune system cells that initiate the process to control and limit virus replication as well
as to activate the adaptive immune response. A similar mechanism takes place when the
infection targets the CNS where the microglia and astrocytes detect the presence of the
microorganism and are activated to produce an immune response (Konsman et al., 2002,
Owens et al., 2005). Detection of the presence of influenza virus is accomplished through
cell receptors like the mannose receptor and the Toll-like receptors.
The mannose receptor (MR) is a cell membrane-bound receptor expressed in
macrophages, immature dendritic cells, microglia, and astrocytes (Reading et al., 2000;
Regnier-Vigouroux, 2003) that mediates the uptake of glycoproteins containing a
terminal mannose, fucose, or N-acetylglusosamine (Janeway et al., 2001, Olson and
Miller, 2004, Zimmer et al., 2003). These MRs bind both sugar molecules expressed on
the surface of different microorganisms and certain host proteins such as
myeloperoxidases and hydrolases. As mentioned previously, both influenza envelope
proteins HA and NA are glycosylated proteins that can function as ligands for this
receptor (Reading et al., 2000). The mannose-binding protein is a defense mechanism
against influenza virus because it blocks binding of virus to the MR and acts as an
opsonin. Opzonization of the virus by this protein facilitates the antiviral activity of
neutrophils (Hartshorn et al., 1993), one of the non-specific immune defense mechanisms
in the nasal airway (Fokkens and Scheeren, 2000).
The toll-like receptors (TLR) are a family of type I integral transmembrane
glycoproteins located on the cellular membrane or in intracytoplasmic compartments of
various cell types including macrophages, dendritic cells, microglia, and astrocytes. TLR
7

recognize common molecular motifs or pathogen-associated molecular patterns (PAMP)
from different groups of microorganism such as bacteria, fungi, and viruses. In particular,
the TLR associated with viral ligands include TLR3, that recognizes double stranded
RNA (dsRNA), TLR7 in mouse and TLR8 in humans that both recognize single stranded
RNA (ssRNA), and TLR9 which recognizes unmethylated motifs (CpG) in dsDNA
viruses (Prehaud et al., 2005, Kawai and Akira, 2006).
Almost all viruses produce dsRNA during their replication cycle (Applequist et al.,
2002; Majde, 2000; Guillot et al., 2005); recognition of this PAMP by the intracellular
TLR3 appears to be important in the innate immune response against viral infections.
After TLR3 binds its ligand, it uses the Toll-IL-1 receptor resistance (TIR) domain-
containing adaptor inducing IFN-β (TRIF) and culminates with the activation of
transcription factors NF-κB and IFN regulatory element-3 (IRF3). These transcription
factors play a central role in the innate immune response by regulating the expression of
genes for pro-inflammatory cytokines and type I interferons, respectively (Kawai and
Akira, 2006). Mouse microglial cells and astrocytes express TLR3, suggesting that these
cells can be activated by influenza A virus and synthetic dsRNA (Bsibsi et al., 2002;
Scumpia et al., 2005).
Cytokines can be divided in pro- and anti-inflammatory cytokines according to their
function. Some cytokines, such as type I interferons, have both, pro-inflammatory and
anti-inflammatory functions (Taylor and Grossberg, 1998). Pro-inflammatory cytokines
include TNFα, IL1, IL6, and IL12 (Janeway et al., 2001, Kaufmann et al., 2002, Schmitz
et al., 2005). Inflammatory processes are triggered in part by cytokines and are aimed to
localize and control the infection as well as to amplify and target the immune response.
8

The biological activities of these cytokines are usually synergistic and are associated with
the up-regulation of genes coding for molecules that regulate the inflammatory response
(Dinarello, 2000). Additionally, the pro-inflammatory cytokines are associated with the
up-regulation of the acute phase response (APR) observed in response to infection. Pro-
inflammatory cytokines can act in the hypothalamus (HT) to induce fever, sleep, sickness
behavior, and the production of the APR-proteins (e.g. c-reactive protein, ceruloplasmin,
and metallothionine) and complement (Basset et al., 2003, Fang et al., 1995; Krueger and
Majde, 2003).
Anti-inflammatory cytokines include IL4, IL5, IL10, IL13, and transforming growth
factor beta (TGF β). These cytokines participate in the regulation of the inflammatory
process by suppressing the production of pro-inflammatory cytokines, such as IL1 and
TNF. In addition, they also inhibit the synthesis of integrins in the vascular endothelium
(Dinarello, 2000). Anti-inflammatory cytokines act to dampen the pro-inflammatory-
induced response in an adaptive, time-dependent manner (Akaike et al., 1996, Kawada et
al., 2003, Schmitz et al., 2005). They also induce the production of glucocorticoids that
function as immunomodulatory hormones (Silverman et al, 2005). Consequently, during
acute infections the time course for anti-inflammatory genes or the production of their
proteins often lags behind the pro-inflammatory cytokine response signals.
Tumor necrosis factor-α
Tumor necrosis factor (TNF) also known as TNFα is a prototypical inflammatory
cytokine that was identified in 1975 as an endotoxin-induced serum glycoprotein that
caused necrosis of tumor cells (Carswell et al., 1975). TNFα has now been associated
9

with a plethora of physiological functions both in the normal and diseased body (Perry et
al., 2002; Bertazza and Mocellin, 2008; Bradley, 2008). Many different cells in the body
can express TNFα, including microglia, astrocytes, and neurons in the central nervous
system (Breder et al., 1993; Ignatowski et al., 1997; Ohtori et al., 2004; Yan et al., 2007;
Juliet et al., 2008). TNFα is synthesized as a membrane-bound homotrimer (formed of 26
kD monomers), pro-TNF, that is cleaved by the TNFα-converting enzyme (Solomon et
al., 1999; Tracey et al., 2008). After cleavage, the soluble cytokine is released as the 17
kD form. Both trimeric forms are bioactive and may have different activities (Solomon et
al., 1999; Bradley, 2008). Membrane-bound TNFα can function as both a receptor and as
a ligand (Tracey et al., 2008).
The biological responses to TNFα are mediated by signaling through two distinct
receptors designated as TNFR1 (also known as p55) and TNFR2 (also known as p75)
(Vandenabeele et al., 1995). Although both receptors are structurally related, they differ
in their cellular expression, affinity for ligands, and signaling mechanisms (Palin et al.,
2007; Tracey et al., 2008). TNFR1 is expressed on virtually all cell types whereas
TNFR2 is usually inducible and expressed only in endothelial and immune cells
(Bertazza and Mocellin, 2008). Signaling is mediated by adapter proteins in the cell
cytoplasm that attach to the intracellular domains of the receptors. One major TNFα
activated signaling pathway leads to the activation of nuclear factor kappa-B (NF-κB), a
family of transcription factors that activates new gene transcription, whereas another
distinct signaling pathway leads to programmed cell death (Palin et al., 2008; Tracey et
al., 2008).
10
In the brain, TNFα serves as a key regulator of several pathological effects during
infectious diseases of the CNS as well as neurological, neurodegenerative, and neurotoxic
conditions (Sriram and O’Callaghan, 2007). TNFα is upregulated in the brain after
immune and inflammatory responses including those caused by infection and may
function as a neurotoxic factor or as a neuroprotector (Breder et al., 1994; Ghoshal et al.,
2007; Sergerie et al., 2007; Sriram and O’Callaghan, 2007; Tonelli et al., 2008).
Neuroprotection is exerted on neurons through both TNF receptors (Cheng et al., 1994)
and may be achieved by sustaining activation of NF-κB (Tracey et al., 2008). For
example, TNFR1 is required for the protective effects of erythropoietin in neurons of
mice subjected to ischemic injuries (Taoufik et al., 2008). Furthermore, the
neuroprotective role of TNFα has been demonstrated during viral infections of the central
nervous system such as herpes virus (Sergerie et al., 2007) and rabies (Faber et al., 2005).
In the normal brain, evidence suggests a physiological role for TNFα (Perry et al.,
2002, for review). TNFα and its receptors are expressed in different regions of the brain
including the cortex, thalamus, hypothalamus, amygdala, bed nucleus of the stria
terminalis, hippocampus, cerebellum, brainstem, and basal ganglia (Breder et al., 1993;
Gahring et al., 1996; Vitkovic et al., 2000), suggesting a role in endogenous brain
function. Furthermore, TNFα shows a diurnal biorhythm with highest concentrations
when sleep propensity is higher (discussed below), suggesting a role for TNFα in the
neuromodulation of autonomic functions (Perry et al., 2002).
11

Interleukin 1β
Interleukin 1β (IL1β) is a pro-inflammatory cytokine originally described as an
endogenous pyrogen that induced fever in rabbits (Atkins and Wood; 1955). IL1β is a
member of the interleukin 1 family (Gibson et al., 2004). The IL1 family now comprises
at least eleven different proteins (IL1F1-IL1F11) on the basis of their sequence
homology, structure and receptors they use and includes IL1α (IL1F1) IL1β (IL1F2) and
the IL1 receptor antagonist or IL1ra (IL1F3) (Allan et al., 2005; Barksby et al., 2007).
IL1β transcription may be induced by different pro-inflammatory stimuli such as
microorganisms or their products (Konsman et al., 2002) and by pro-inflammatory
cytokines including type I interferons (Brandwein, 1986), TNFα (Williams et al., 2000),
and IL1β itself (Granowitz et al., 1992; Churchill et al., 2006). Almost all nucleated cells,
including cells of the hematopoietic lineage, produce IL1β (Brough and Rothwell, 2007).
IL1β is produced as a large ~ 36 kD inactive precursor protein (pro-IL1β) that needs to
be cleaved for biological activity (Fogal and Hewett, 2008). Processing of the pro-IL1β
to its active form (17 kD protein) requires caspase-1, an enzyme that is activated by a
multiprotein complex called inflammasome (Church et al., 2008). Only a fraction of the
active cytokine is released into the extracellular space (Dinarello, 1998; Solle et al.,
2001). The release process is enhanced by the secretory stimulus of ATP signaling via the
P2X7 receptor (Solle et al., 2001; Ferrari et al., 2006). The active IL1β binds to a specific
80 kD membrane-bound receptor named IL1-receptor (IL1-R) type 1 or IL1-R1. This
complex interacts with the cytoplasm protein IL1 receptor accessory protein to form
another complex leading to the recruitment of adaptor molecules such as MyD88 and
IL1-R associated kinases (IRAK) (Fitzgerald and O’Neill, 2000). Phosphorylation of
12

IRAK mediates the recruitment of the TNF receptor-associated factor 6 (TRAF6), in turn,
this complex along with the tumor growth factor β-activated kinase (TAK1) and the TAK
binding protein 2 (TAB2) allows the activation (phosphorylation) of the inhibitor of κB
(I-κB) kinase or IKK (Barksby et al., 2007; O’Neill and Greene, 1998). IKK activation
produces the phosphorylation and degradation of I-κB, leading to the release of NF-κB,
which translocates into the nucleus (O’Neill and Greene, 1998; Trinchieri and Sher,
2007). IL1β also can bind to the IL1-R2, a receptor that lacks an intracellular signaling
domain and consequently no signaling is activated. The IL1R2 functions as a decoy
receptor (Colotta et al., 1993); i.e., it binds the ligand and prevents it from associating
with the signaling receptor (Allan et al., 2005).
IL1β functions as an important neuromodulator in both the normal brain (Kronfol and
Remick, 2000; Vitkovic et al., 2000) and in pathological conditions (Gibson et al., 2004;
Allan et al., 2005; Simi et al., 2007). IL1β is constitutively expressed in the central
nervous system (Tabarean et al., 2006) by microglia, astrocytes, oligodendrocytes,
endothelial cells, and neurons at both mRNA and protein levels (Gibson et al., 2004; Simi
et al., 2007; Fogal and Hewett, 2008). The expression of IL1β in the brain is upregulated
in response to experimental or clinical insults, such as injuries (Allan et al., 2005),
neurodegeneration (Simi et al., 2007), and infections (Lundkvist et al., 1999; Bluthe et
al., 2000; Sergerie et al., 2007).
Production of cytokines in influenza-induced infection
Production of cytokines is also part of the murine immune response against influenza
virus infections (Hennet et al., 1992; Conn et al., 1995). Bronchoalveolar lavages (BAL)
13

from mice infected with PR8 showed the presence of IL1 and TNFα at 2 days PI;
furthermore, similar results are observed in vitro after viral challenge of alveolar
macrophages (Vacheron et al., 1990). Kinetic studies of cytokine production after
influenza infection demonstrate that, in BAL from mice infected with PR8, TNFα
increases from 24h PI and reaches the peak of production at 36 h PI. IL1 increases are
observed from 24h with the peak of production at 48h (Hennet et al., 1992). An increase
of IL1α and antiviral activity (perhaps type I IFN) is observed in serum of mice infected
IN with influenza (Kurokawa et al., 1996). Survivorship is improved and lesion
development in the lungs is attenuated in mice that receive a single dose of an anti-TNFα
polyclonal antibody at the time of virus challenge suggesting a detrimental role for this
cytokine in response to infection (Peper and Van Campen, 1995). However, studies using
IL1R1 deficient mice infected with influenza PR8 demonstrate that IL1α and/or
IL1β activity is necessary to reduce the mortality rate after infection (Schmitz et al.,
2005). Intranasal inoculation with influenza in IL1β-KO mice also demonstrates a
protective role for IL1β that is evident by an increased survival rate after the challenge in
the wild type compared to the transgenic mice (Kozak et al., 1995).
The CNS is able to establish an innate immune response and to produce pro-
inflammatory cytokines in response to both viral and synthetic dsRNA (Rempel et al.,
2005). By 48 h PI, IL1β mRNA increases in the brain stem after intranasal inoculation
with influenza (Chen et al., 2004). Also, in mice IN infected with PR8, levels of mRNA
for IL1β and TNFα are up regulated in the HT 38 h after inoculation (Alt et al., 2007).
Furthermore, after in vitro challenge of mouse microglia and astrocytes with a human
strain of H1N1 influenza virus an increase expression of IL1β, IL6 and TNFα mRNA
14

and proteins is observed at 6 h post challenge. Finally, the production of cytokines is
significantly higher when the cells are stimulated with a neurotropic avian-derived strain
of influenza (Wang et al., 2008).
Cytokines and the thermoregulatory response
Thermoregulatory responses to systemic inflammation are often determined by the
development of either fever or hypothermia (Romanovsky et al., 2005), or both (Leon,
2004). Fever is part of the APR and can be induced by a large number of compounds,
including bacterial and viral antigens (Luheshi, 1998; Cartmell et al., 1999; Deak et al.,
2005). Cytokines are produced in response to immunological stimulus and they have an
important role as endogenous pyrogens (Conti et al., 2004). The history of cytokines and
fever started about 50 years ago with the demonstration of a neutrophil-released protein,
or leukocyte pyrogen, which induced fever in rabbits and circulated in animals during
fevers of different etiology (Atkins and Wood, 1955; Dinarello, 1996). The heat-labile
protein was then called an “endogenous pyrogen” by Atkins and Wood (1955). This
endogenous pyrogen was later purified, characterized and cloned (Auron et al., 1984). It
consists of two polypeptides with the same molecular weight but different electrical
charges that were then renamed as IL1β and IL1α (Dinarello, 1996). Since then many
studies have been completed that demonstrate the role of IL1β during fever. For example,
intraperitoneal and intracerebroventricular (ICV) injection of recombinant IL1β in rats
induces a significant increase in body temperature in a dose-dependent manner (Anforth
et al., 1998). Furthermore, fever responses after LPS injection are attenuated in IL1β
knockout (KO) compared to wild type mice (Kozak et al., 1995). In an experiment with
15

rats using adenovirus vectors, fever responses are reduced if animals are pretreated with a
recombinant IL1ra (Cartmell et al., 1999), which functions as a competitive receptor
antagonist to block binding of IL1α and IL1β to the IL1-R1, thus preventing IL1RI
activation and inhibiting the biological actions of IL1 (Hallegua and Weisman, 2002).
TNFα is detectable early in the circulation after LPS injection and it is also
considered an endogenous pyrogen (Dinarello et al., 1986; Zetterstrom et al., 1998).
Intraperitoneal injection of mice with TNFα increases temperature for at least 4 h
(Zetterstrom et al., 1998; Chida and Iwakura, 2007). Similar results are observed in
rabbits after ICV injection with human recombinant TNFα (hrTNFα) (Kapas et al.,
1992). However, TNFα also has cryogenic or antipyretic properties (Gourine et al., 2000;
Leon 2004). Intraperitoneal injection of rats with hrTNFα reduces LPS-induced fever, an
antipyretic effect that is abrogated when the animals are pretreated with hrTNF soluble
receptor (Klir et al., 1994). Similar results are observed in TNFα double receptor-KO
mice studies where the wild type group has a reduced febrile response to LPS compared
to the KO group (Leon et al., 1997). These results suggest that the thermoregulatory
response to immunological stimuli such as LPS is biphasic in nature and that cytokines
modulate such responses by acting as endogenous pyrogens or cryogens (Leon, 2004).
In contrast to influenza infection in humans and other mammals, in mice the observed
thermoregulatory response is hypothermia instead of hyperthermia (Kluger et al., 1991;
Klein et al., 1992; Fang et al., 1995). Hypothermia during influenza infection is a
regulated response (Klein et al., 1992) that may function as a survival mechanism to
reduce the metabolic demands of the response to the infection (Leon, 2004). When given
access to thermal gradients, influenza infected mice seek cooler temperatures during the
16

later days of infection when hypothermia is more dramatic (Klein et al., 1992).
Furthermore, influenza-infected mice show hypothermia even in warm environments
(30oC) (Jhaveri et al., 2007).
Cytokines and sleep
Cytokines have an important role in normal physiological functions, such as in sleep
regulation (Krueger et al., 2001). Several cytokines have the capacity to enhance non-
rapid eye movement sleep (NREMS); e.g. the pro-inflammatory cytokines IL1α, IL1β,
IL6, IFNα, IFNγ, TNFα, and TNFβ (for review; Krueger et al., 2001; Krueger and Majde,
2003). Two cytokines studied extensively in their relationship with sleep are IL1β and
TNFα (Opp, 2005). IL1β and TNFα are constitutively expressed in brain and in rats they
have a diurnal variation in their mRNA and protein levels with highest concentrations
correlating with highest sleep propensity (Bredow et al., 1997; Taishi et al., 1998).
Furthermore, after sleep deprivation the increase in NREMS is associated with an
increase in IL1β and TNFα expression (Takahashi et al., 1997; Taishi et al., 1998;
Krueger et al., 2001).
The sleep promoting actions of IL1β were initially demonstrated in rabbits. Central
administration of IL1β enhanced NREMS in this species (Krueger et al., 1984). Further,
ICV injection with an IL1R fragment, an IL1β inhibitor, reduces sleep (Takahashi et al.,
1995). In rats enhanced NREMS occurs after ICV injection of low doses of IL1β (Opp et
al., 1991). In contrast, anti-IL1β antibodies or the IL1ra reduces spontaneous sleep (Obal
et al., 1990). Mice display a robust increase in NREMS and suppression of REMS after
intraperitoneal injection with IL1β (Fang et al., 1998). The somnogenic effects of IL1β
17

are abrogated in IL1-R1 knock out mice (Fang et al., 1998). Exogenous administration of
IL1β also increases NREMS in other species such as cats (Susic and Totic, 1989) and
monkeys (Friedman et al., 1995). These results suggest a role for IL1β in the regulation
of physiological sleep (Obal et al., 1990).
The somnogenic effects of TNFα were first described after ICV inoculation with
recombinant TNFα in rabbits (Shoham et al., 1987). Intravenous or ICV administration
of exogenous TNFα enhances duration and intensity of NREMS and decreases REMS in
this species (Shoham et al., 1987; Kapas and Krueger, 1992). The use of anti-TNFα
antibodies or the TNFα soluble receptor attenuates spontaneous sleep and reduces the
sleep rebound after sleep deprivation (Takahashi et al., 1996; Krueger et al., 2001). In
rats, peripheral administration of TNFα increases NREMS (Kubota et al., 2001).
Unilateral microinjection of TNFα into the preoptic area of the anterior HT increased
NREMS and brain temperature in a dose-dependent manner (Kubota et al., 2002). After
intraperitoneal injection with TNFα, mice show a dose-dependent increase in NREMS.
This effect is not observed in TNFR1-KO mice that have significantly less baseline sleep
than the controls (Fang et al., 1997). Finally, an increase in NREMS is observed in sheep
after ICV injection of TNFα (Dickstein et al., 1999). These results suggest that TNFα
also has a role in the regulation of physiological sleep (Krueger and Majde, 2003).
The sleep regulatory roles of IL1β and TNFα are closely related to each other
(Baracchi and Opp, 2008). For example, IL1-type 1 receptor/TNFR1- double KO mice
have a reduced NREMS rebound (compared to wild type) and do not exhibit a REMS
rebound in response to sleep deprivation (Baracchi and Opp, 2008). In TNFR1 KO mice
that are non-responsive to TNFα, the injection of IL1β increases the NREMS response
18

suggesting a degree of independence in their somnogenic actions (Fang et al., 1997).
Similarly, the IL1- type 1 receptor KO mice increase NREMS and decrease REMS after
administration of TNFα (Fang et al., 1998). Downstream effectors responsible for IL1β
and TNFα-induced sleep include adenosine, nitric oxide (NO), nerve growth factor and
growth hormone releasing hormone (GHRH), suggesting that both cytokines can promote
sleep via similar mechanisms (Krueger et al., 2001).
Murine olfactory bulb organization and its possible interaction with the influenza
virus
One potential pathway for influenza virus access to the CNS is via the olfactory bulb
(OB) after viral IN inoculation (Park et al., 2002, Studahl, 2003). The olfactory system
begins at the olfactory epithelium, a pseudostratified epithelium that contains cilia
embedded in the mucus of the nasal cavity, peripheral processes (olfactory rods),
sustentacular cells and receptor cell bodies. The olfactory epithelium is the only place in
the body where unmyelinated nerve terminals are in direct contact with the environment
(Brodal, 2004, Iwasaki et al., 2004, Mori et al., 1999). These primary olfactory neurons
send unmyelinated axons that form the olfactory nerve (ON), the first cranial nerve,
which passes through the cribriform plate to the OB where the neurons synapse with
second order neurons. The olfactory receptor neurons (ORN) contain surface
glycoproteins that include D-galactosyl and sialic acid components (Allen and Akeson,
1985) that are thought to be recognition sites for the influenza HA protein and necessary
to initiate cell infection (Smith, 1952, Steinhauer and Skehel, 2002). This suggests that
the ORN may be capable of viral uptake.
19

Another possibility is that the virus found in the ON is located in the specialized cells
called olfactory ensheathing cells (OEC). Bundles of the olfactory nerve axons are
wrapped by these OEC in place of Schwann cells. In adult mice the OEC are localized in
the olfactory nerve (ON) and the GL of the OB (Heredia et al., 1998). These cells are
immunoreactive (IR) to neuropeptide Y, protein S100 and vimectin. These cells also
contain the polysialic acid containing molecule as well as the neural-cell adhesion
molecule or NCAM (Ramon-Cueto and Avila, 1998, Hisaoka et al., 2004). Therefore
these cells might be able to capture the viral antigen by endocytosis and transport it along
the ON. The ON is a possible route for different viruses to reach the CNS and produce
infection (Iwasaki et al., 2004, Reiss et al., 1998, Mori et al., 2005).
Selective removal of the OB using surgical bulbectomy or chemical deafferentation
prior to intranasal inoculation with mouse hepatitis virus prevents the spread of this
neurotropic virus into the brain (Barnett and Perlman, 1993). Using a recombinant
construct of the rhabdovirus, vesicular stomatitis virus, expressing the reporter gene
green fluorescent protein (GFP) demonstrates the virus presence as early as 2 days post
IN infection in the olfactory nerves within the OB, particularly in the axons that
terminated in the glomeruli of the OB (van den Pol et al., 2002). These data provide
evidence that the olfactory nerve pathway is used by different viruses to reach the CNS.
Neurotropic strains of influenza virus, such as the recombinant influenza A WSN/33,
were used to study the olfactory route of neuroinvasion (Mori et al., 2005). Intranasal
inoculation of 2 day old mice with a recombinant strain of influenza (avian-derived
H7N1 X human-derived H3N2) results in virus spread to the brain using the olfactory and
the trigeminal pathways as evidenced by the presence of viral antigens in the OBs and in
20

fibers and neurons of the trigeminal nerve and ganglion. This effect is not abrogated even
in the presence of passive neutralizing anti-influenza antibodies (Reinacher et al., 1983).
After IN inoculation of mice with an H5N1 strain of the virus isolated from a human case
after the outbreak of chicken and human influenza in Hong Kong in 1997, the viral
antigen is observed in the OB, the vagus and the trigeminal ganglia, suggesting that the
virus reaches the brain using the afferent fiber of such nerves following replication in the
respiratory epithelium (Park et al., 2002). Mori et al. (1999) suggested that after the virus
is injected into the OB, it replicates in OB neurons and from there spreads to different
structures within the brain including the anterior olfactory nucleus, medial habenular
nucleus, paraventricular thalamic nucleus, dorsal raphe and locus coeruleus. Within 4
days after the IN inoculation of 7 day old mice with a neurotropic strain of the virus, the
viral antigen was observed in the ORN and extended into the ON layer of the OB
(Aronsson et al., 2003). When immunodeficient mice (which lack the recombination
activating gene 1 involved in the recombination process to generate antibodies and T cell
receptors) of the same age are used, the presence of viral antigen is found along the
olfactory pathway, including the anterior olfactory nucleus, the piriform cortex (Pir), the
taenia tecta and groups of neurons in the hypothalamus and the upper brainstem. Wild
type mice survive the infection and the virus antigen is present only in the ORN and the
OB. These results demonstrate that the immune system is important in controlling the
infection and limiting the virus spread to the rest of the brain.
The olfactory pathway
In the GL, processes from the ORN establish synaptic contacts with dendrites of the
21
mitral cell neurons and tufted cells. These cells send their axons along the lateral
olfactory tract to the olfactory cortex, including the Pir and the olfactory tubercle (Tu)
(Price et al; 1991; Brodal, 2004; Suzuki and Bekkers, 2007). The Pir, along with the
accessory olfactory nucleus, sends projections to the feeding regulatory area of the
posterolateral hypothalamus (Price et al., 1991; Josephson et al; 1997; Russell et al.,
2001). Projections from the OB also reach the anterior and the posterolateral nuclei of the
amygdala (Price, 2003; Ubeda-Banon et al., 2007). The information received from the
olfactory input is relayed to the basal (BLA) and then to the central (CeA) nuclei of the
amygdala (LeDoux, 2007). CeA connects with the lateral hypothalamus through the stria
terminalis and sends projections to the reticular formation, vagal nuclei and to the medial
preoptic area (Price, 2003; Wang and Swann., 2006), a site involved in both thermo- and
sleep regulation (Roth et al., 2006; Baker et al., 2005; Saper et al., 2005). Indirect
connections to the hypothalamus are suggested by the specific increase in the number of
Fos IR cells in this brain region in response to olfactory stimuli (Hurtazo and Paredes,
2006). The hypothalamic arcuate nucleus (Arc) lies along the ventrolateral border of the
third ventricle and above to the median eminence and plays an important role in the
regulation of food intake, energy balance and body weight (Bouret et al., 2004). The Arc
receives projections from the medial preoptic area (Magoul et al., 1993) and sends
projections to almost all the nuclei in the hypothalamus as well as to the brain stem (Cone
et al., 2001). Arc projections include the lateral hypothalamus, the medial preoptic area
and posterolateral hypothalamus all of which receive direct or indirect projections from
the olfactory cortex (Price et al., 1991; Price, 2003).
22

Propagation of the cytokine signals through the brain
Cytokines such as TNFα or IL1β often induce the production of each other and
themselves as well as diffusible second messengers, including NO, prostaglandins and
adenosine. These messengers are induced in part via the activation of the transcription
factor NF-κB (Grilli and Memo, 1999; Vitkovic et al., 2000). For instance, one of the
major signaling pathways involved in NO production in response to treatment with TNFα
is mediated through serine/threonine protein kinases, such as protein kinase A, protein
kinase C, and calcium/calmodulin-dependent protein kinase (Tripathi and Sodhi, 2008).
Activation of neurons to express TNFα and IL1β in different parts of the brain in
response to an initial central stimulus (disease or lesions) may involve cell to cell
communication through the release of nucleotides (Inoue et al., 2007). Neurons express
both ATP receptors (Koizumi et al., 2005) and adenosine receptors (Liu and Gao, 2006).
Activation of microglia and astrocytes induces the secretion of ATP that serves as a
gliotransmitter that binds to the P2 receptors on the neurons and modulates neuronal
activity (Zhang et al., 2007). This mechanism has been observed for astrocyte-neuron,
astrocyte-microglia and microglia-neuron communication (Inoue et al., 2007). In
particular this mechanism is very important for IL1 processing and release from cells
(Solle et al., 2001; Ferrari et al., 2006). IL1β secretion is greater when glial cells are
stimulated with LPS and ATP compared to untreated controls (controls using only LPS or
only ATP), suggesting a possible synergism between the immune stimuli and ATP
(Mingam et al., 2008). Furthermore, P2X7 KO mice have attenuated LPS-induced
expression of IL1β and TNFα mRNA expression in the hypothalamus (Mingam et al.,
2008). Stimulation of microglia with ATP through the P2X7 receptor increases the
23

production of TNFα and increases the neuroprotective effect of TNF in neuron-microglia
cocultures treated with glutamate (Suzuki et al., 2004).
Adenosine, a purine nucleoside, has a role in the control of specific functions in the
CNS in both physiological and pathophysiological conditions (Hasko et al., 2005).
Interaction of adenosine and its receptors is involved in brain regulated functions such as
sleep and arousal, locomotion, cognition and memory, neuroprotection, neuronal
degeneration, pain and neuronal maturation (Ribeiro et al., 2002). Adenosine is also
involved in the regulation of the cerebral blood flow, especially during neuronal
activation (Jakovcevic and Harder, 2007; Shi et al., 2008). In astrocytes, adenosine
stimulates their proliferation (astrogliosis) and increases their secretory functions (Hasko
et al., 2005). Activation of the adenosine receptor 1 (A1) in astrocytes enhances the
secretion of nerve growth factor and S-100β protein both involved in neuronal
differentiation and survival (Ciccarelli et al., 1999). Furthermore, adenosine stimulates
astrocytes through the A2 receptor to produce IL6, serving as a mechanism of damage
control for the brain (Schwaninger et al., 2000). In neurons, IL1β reduces glutamate
transmission, an effect that is inhibited when the A1 is blocked, suggesting that specific
effects of IL1β on neurons are regulated via adenosine-dependent pathways (Luk et al.,
1999).
24

References
Akaike, T., Noguchi, Y., Ijiri, S., Setoguchi, K., Suga, M., Zheng, Y., Dietzschold, B., Maeda, H (1996). Pathogenesis of influenza virus-induced pneumonia: involvement of both nitric oxide and oxygen radicals. Proc Natl Acad Sci U S A. 93, 2448-2453.
Allan, S., Tyrrell, P., Rothwell, N (2005). Interleukin-1 and neuronal injury. Nat Rev
Immunol. 5, 629-640. Allen, W. and Akeson, R (1985). Identification of a cell surface glycoprotein family of
olfactory receptor neurons with a monoclonal antibody. J Neurosci. 5, 284-296. Alt, J., Obal, F., Traynor, T., Gardi, J., Majde, J., Krueger, J (2003). Alterations in EEG
activity and sleep after influenza viral infection in GHRH receptor-deficient mice. J Appl Physiol. 95, 460-468.
Alt, J., Bohnet, S., Taishi, P., Durika, D., Obal, F., Traynor, T., Majde, J., Krueger, J
(2007). Influenza virus-induced glucocorticoid and hypothalamic and lung cytokine mRNA responses in dwarf lit/lit mice. Brain Behav. Immun. 21, 60-67.
Anforth, H., Bluthe, R., Bristow, A., Hopkins, S., Lenczowski, M., Luheshi, G., Lundkvist, J., Michaud, B., Mistry, Y., Van Dam, A., Zhen, C., Dantzer, R., Poole,
S., Rothwell, N., Tilders, F., Wollman, E (1998). Biological activity and brain actions of recombinant rat interleukin-1alpha and interleukin-1beta. Eur Cytokine Netw. 9, 279-288.
Applequist, S., Wallin, R., Ljunggren, H (2002). Variable expression of Toll-like receptor
in murine innate and adaptive immune cell lines. Int Immunol. 14,1065-1074. Aronsson, F., Robertson, R., Ljunggren, H., Kristensson, K (2003). Invasion and
persistence of the neuroadapted influenza virus A/WSN/33 in the mouse olfactory system. Viral immunol. 16, 415-423.
Atkins, E., Wood, W (1955). Studies on the pathogenesis of fever. I. The presence of
transferable pyrogen in the blood stream following the injection of typhoid vaccine. J Exp Med. 101, 519-528.
Auron, P., Webb, A., Rosenwasser, L., Mucci, S., Rich, A., Wolff, S., Dinarello, C
(1984). Nucleotide sequence of human monocyte interleukin 1 precursor cDNA. Proc Natl Acad Sci U S A. 81, 7907-7911. Baigent, S., McCauley, J (2003). Influenza type A in humans, mammals and birds:
determinants of virus virulence, host-range and interspecies transmission. Bioassays, 25, 657-671.
25

Baker, F., Shah, S., Stewart, D., Angara, C., Gong, H., Szymusiak, R., Opp, M., McGinty, D (2005). Interleukin 1beta enhances non-rapid eye movement sleep and increases c-Fos protein expression in the median preoptic nucleus of the hypothalamus. Am J Physiol Regul Integr Comp Physiol. 288, R998-R1005.
Baracchi, F., Opp, M (2008). Sleep-wake behavior and responses to sleep deprivation of
mice lacking both interleukin-1beta receptor 1 and tumor necrosis factor-alpha receptor 1. Brain Behav Immun.
Barksby, H., Lea, S., Preshaw, P., Taylor, J (2007). The expanding family of interleukin-
1 cytokines and their role in destructive inflammatory disorders. Clin Exp Immunol. 49, 217-225.
Barnett, E., Perlman, S (1993). The olfactory nerve and not the trigeminal nerve is the
major site of CNS entry for mouse hepatitis virus, strain JHM. Virology, 194,185-91. Basset, C., Holton, J., O'Mahony, R., Roitt, I (2003). Innate immunity and pathogen-host
interaction. Vaccine, 1:21 Suppl 2:S12-23. Bertazza, L., Mocellin, S (2008). Tumor necrosis factor (TNF) biology and cell death. Front Biosci. 13, 2736-2743. Bluthé, R., Layé, S., Michaud, B., Combe, C., Dantzer, R., Parnet, P (2000). Role of
interleukin-1beta and tumor necrosis factor-alpha in lipopolysaccharide-induced sickness behavior: a study with interleukin-1 type I receptor-deficient mice. Eur J Neurosci. 12, 4447-4456.
Bouret, S., Draper, S., Simerly, R (2004). Formation of projection pathways from the
arcuate nucleus of the hypothalamus to hypothalamic regions implicated in the neural control of feeding behavior in mice. J Neurosci. 24, 2797-805.
Bradley, J (2008). TNF-mediated inflammatory disease. J Pathol. 214, 149-160. Bradshaw, G., Schlesinger, R., Schwartz, C (1989). Effects of cell differentiation on
replication of A/WS/33, WSN, and A/PR/8/34 influenza viruses in mouse brain cell cultures: biological and immunological characterization of products. J Virol. 63, 1704-1714.
Brandwein, S (1986). Regulation of interleukin 1 production by mouse peritoneal
macrophages. Effects of arachidonic acid metabolites, cyclic nucleotides, and interferons.J Biol Chem. 261, 8624-8632.
Breder, C., Tsujimoto, M., Terano, Y., Scott, D., Saper, C (1993). Distribution and
characterization of tumor necrosis factor-alpha-like immunoreactivity in the murine central nervous system. J Comp Neurol. 337, 543-567.
26

Breder, C, Hazuka, C, Ghayur, T, Klug, C, Huginin, M, Yasuda, K, Teng, M, Saper, C (1994). Regional induction of tumor necrosis factor alpha expression in the mouse brain after systemic lipopolysaccharide administration. Proc Natl Acad Sci U S A. 91,11393-11397.
Bredow, S., Guha-Thakurta, N., Taishi, P., Obál, F.., Krueger, J (1997). Diurnal
variations of tumor necrosis factor alpha mRNA and alpha-tubulin mRNA in rat brain. Neuroimmunomodulation, 4, 84-90. Brodal, P (2004). The central nervous system structure and function. 3rd edition. Oxford
University Press. Brough, D., Rothwell, N (2007). Caspase-1-dependent processing of pro-interleukin-
1beta is cytosolic and precedes cell death. J Cell Sci. 120(Pt 5), 772-781. Bsibsi, M., Rayid, R., Gveric, D., van Noort, J (2002). Broad expression of Toll-like
receptors in the human central nervous system. J Neuropathol Exp Neurol. 11, 1013-1021.
Carswell, E., Old, L., Kassel, R., Green, S., Fiore, N., Williamson, B (1975). An
endotoxin-induced serum factor that causes necrosis of tumors. Proc Natl Acad Sci USA. 72, 3666-3670.
Cartmell, T., Southgate, T., Rees, G., Castro, M., Lowenstein, P., Luheshi, G (1999).
Interleukin-1 mediates a rapid inflammatory response after injection of adenoviral vectors into the brain. J Neurosci. 19, 1517-1523.
Centers for disease control and prevention (CDC). June 2005. Atlanta, USA.
http://www.cdc.gov/flu/ Chen, L., Duricka, D., Nelson, S., Mukherjee, S., Bohnet, S., Taishi, P., Majde, J.,
Krueger, J (2004). Influenza virus-induced sleep responses in mice with targeted disruptions in neuronal or inducible nitric oxide synthases. J Appl Physiol. 97, 17-28.
Cheng, B., Christakos, S., Mattson, M (1994). Tumor necrosis factors protect neurons
against metabolic-excitotoxic insults and promote maintenance of calcium homeostasis. Neuron, 12, 139-153.
Chida, D., Iwakura, Y (2007). Peripheral TNFalpha, but not peripheral IL-1, requires
endogenous IL-1 or TNFalpha induction in the brain for the febrile response. Biochem Biophys Res Commun. 364, 765-770.
Church, L., Cook, G., McDermott, M (2008). Primer: inflammasomes and interleukin
1beta in inflammatory disorders. Nat Clin Pract Rheumatol. 4, 34-42.
27

Churchill, L., Taishi, P., Wang, M., Brandt, J., Cearley, C., Rehman, A., Krueger, J (2006). Brain distribution of cytokine mRNA induced by systemic administration of interleukin-1β or tumor necrosis factor α. Brain Res. 1120: 64-73.
Ciccarelli, R., Di Iorio, P., Giuliani, P., D'Alimonte, I., Ballerini, P., Caciagli, F.,
Rathbone, M (1999). Rat cultured astrocytes release guanine-based purines in basal conditions and after hypoxia/hypoglycemia. Glia, 25, 93-98.
Colotta, F., Re, F., Muzio, M., Bertini, R., Polentarutti, N., Sironi, M., Giri, J., Dower, S., Sims, J., Mantovani, A (1993). Interleukin-1 type II receptor: a decoy target for
IL-1 that is regulated by IL-4. Science, 261, 472-475. Cone RD, Cowley MA, Butler AA, Fan W, Marks DL, Low MJ. (2001) The arcuate
nucleus as a conduit for diverse signals relevant to energy homeostasis. Int J Obes Relat Metab Disord, 25 Suppl 5:S63-S67.
Conn, C., McClellan, J., Maassab, H., Smitka, C., Majde, J., Kluger, M (1995). Cytokines
and the acute phase response to influenza virus in mice. Am J Physiol. 268(1 Pt 2), R78-R84.
Conti, B., Tabarean, I., Andrei, C., Bartfai, T (2004). Cytokines and fever. Front Biosci.
9, 1433-1449. Deak, T., Bordner, K., McElderry, N., Barnum, C., Blandino, P., Deak, M., Tammariello, S (2005). Stress-induced increases in hypothalamic IL-1: a systematic
analysis of multiple stressor paradigms. Brain Res Bull. 64, 541-556. Dickstein, J., Moldofsky, H., Lue, F., Hay, J (1999). Intracerebroventricular injection of
TNF-alpha promotes sleep and is recovered in cervical lymph. Am J Physiol. 276, R1018-R1022.
Dinarello, C., Cannon, J., Wolff, S., Bernheim, H., Beutler, B., Cerami, A., Figari, I., Palladino, M., O'Connor, J (1986). Tumor necrosis factor (cachectin) is an
endogenous pyrogen and induces production of interleukin 1. J Exp Med. 163, 1433-1450.
Dinarello, C (1996). Thermoregulation and the pathogenesis of fever. Infect Dis Clin
North Am.10, 433-449. Dinarello, C (1998). Interleukin-1, interleukin-1 receptors and interleukin-1 receptor
antagonist. Int Rev Immunol. 16, 457-499. Dinarello, C (2000). Proinflammatory cytokines. Chest, 118, 503-508. Faber, M., Bette, M., Preuss, M., Pulmanausahakul, R., Rehnelt, J., Schnell, M.,
28

Dietzschold, B., Weihe, E (2005). Overexpression of tumor necrosis factor alpha by a recombinant rabies virus attenuates replication in neurons and prevents lethal infection in mice. J Virol. 79, 15405-15416.
Fang, J., Sanborn, C., Renegar, K., Majde, J., Krueger, J (1995). Influenza viral
infections enhance sleep in mice. Proc Soc Exp Biol Med. 210, 242-252. Fang, J., Wang, Y., Krueger, J (1997). Mice lacking the TNF 55 kDa receptor fail to
sleep more after TNFalpha treatment. J Neurosci. 17, 5949-5955. Fang, J., Wang, Y., Krueger, J (1998). Effects of interleukin-1 beta on sleep are mediated
by the type I receptor. Am J Physiol. 274, R655-R660. Ferrari, D., Pizzirani, C., Adinolfi, E., Lemoli, R., Curti, A., Idzko, M., Panther, E., Di Virgilio, F (2006). The P2X7 receptor: a key player in IL-1 processing and release. J Immunol. 176, 3877-3883. Erratum in: J Immunol. 2007, 179, 8569. Fitzgerald, K., O'Neill, L (2000). The role of the interleukin-1/Toll-like receptor
superfamily in inflammation and host defence. Microbes Infect. 2, 933-943. Flint, S., Enquist, L., Racainello, V., Skalka, A (2004). Principles of Virology. 2nd
edition. ASM press. Washington DC. Fogal, B., Hewett, S (2008). Interleukin-1beta: a bridge between inflammation and
excitotoxicity? J Neurochem. Fokkens, W., Scheeren, R (2000). Upper airway defense mechanisms. Paediatr Resp Rev.
1, 336-341. Friedman, E., Boinski, S., Coe, C (1995). Interleukin-1 induces sleep-like behaviour and
alters call structure in juvenile rhesus macaques. Am J Primatol. 35, 145-153. Gahring, L., Carlson, N., Kulmar, R., Rogers, S (1996). Neuronal expression of tumor
necrosis factor alpha in the murine brain. Neuroimmunomodulation, 3, 289-303. Gibson, R., Rothwell, N., Le Feuvre, R (2004). CNS injury: the role of the cytokine IL-1. Vet J. 168, 230-237. Ghoshal, A., Das, S., Ghosh, S., Mishra, M., Sharma, V., Koli, P., Sen, E., Basu, A
(2007). Proinflammatory mediators released by activated microglia induce neuronal death in Japanese encephalitis. Glia, 55, 483-496.
Gourine, A., Rudolph, K., Leon, L., Kluger, M (2000). Effect of interleukin-11 on body
temperature in afebrile and febrile rats. Neuroimmunomodulation, 8, 8-12. Granowitz, E., Clark, B., Vannier, E., Callahan, M., Dinarello, C (1992). Effect of
interleukin-1 (IL-1) blockade on cytokine synthesis: I. IL-1 receptor antagonist
29

inhibits IL-1-induced cytokine synthesis and blocks the binding of IL-1 to its type II receptor on human monocytes. Blood, 79, 2356-2363.
Grilli, M., Memo, M (1999). Possible role of NF-kappaB and p53 in the glutamate-
induced pro-apoptotic neuronal pathway. Cell Death Differ. 6, 22-27. Guillot, L., Le Goffic, R., Bloch, S., Escriou, N., Akira, S., Chignard, M., Si-Tahar, M
(2005). Involvement of toll-like receptor 3 in the immune response of lung epithelial cells to double-stranded RNA and influenza A virus. J Biol Chem. 280, 5571-5580.
Hallegua, D., Weisman, M (2002). Potential therapeutic uses of interleukin 1 receptor
antagonists in human diseases. Ann Rheum Dis. 61, 960-967. Hartshorn, K., Sastry, K., White, M., Anders, E., Super, M., Ezekowitz, R., Tauber, A
(1993). Human mannose-binding protein functions as an opsonin for influenza A viruses. J Clin Invest. 91, 1414-1420.
Haskó, G., Pacher, P., Vizi, E., Illes, P (2005). Adenosine receptor signaling in the brain
immune system. Trends Pharmacol Sci. 26, 511-516. Hennet, T., Ziltener, H., Frei, K., Peterhans, E (1992). A kinetic study of immune
mediators in the lungs of mice infected with influenza A virus. J Immunol. 149, 932-939.
Heredia, M., Gascuel, J., Ramon-Cueto, A., Santacana, M., Avila, J., Masson, C.,
Valverde, F (1998). Two novel monoclonal antibodies (1.9.E and 4.11.C) against olfactory bulb ensheathing glia. Glia, 24, 352-364.
Hisaoka, T., Morikawa, Y., Kitamura, T., Senba, E (2004). Expression of a member of
tumor necrosis factor receptor superfamily, TROY, in the developing mouse brain. Brain Res Dev Brain Res. 143, 105-109.
Hurtazo, H., Paredes, R (2005). Olfactory preference and Fos expression in the accessory
olfactory system of male rats with bilateral lesions of the medial preoptic area/anterior hypothalamus. Neuroscience, 135, 1035-1044.
Ignatowski, T., Noble, B., Wright, J., Gorfien, J., Heffner, R., Spengler, R (1997).
Neuronal-associated tumor necrosis factor (TNF alpha): its role in noradrenergic functioning and modification of its expression following antidepressant drug administration. J Neuroimmunol. 79, 84-90.
Inoue, K., Koizumi, S., Tsuda, M (2007). The role of nucleotides in the neuron-glia
Communications responsable for the brain functions. J Neurochem. 102, 1447-1458. Iwasaki, T., Itamura, S., Nishimura, H., Sato, Y., Tashiro, M., Hashikawa, T., Kurata, T
(2004). Productive infection in the murine central nervous system with avian influenza virus (H5N1) after intranasal inoculation. Acta Neuropathol. 108, 485-492.
30
Jakovcevic, D., Harder, D (2007). Role of astrocytes in matching blood flow to neuronal
activity. Curr Top Dev Biol. 79, 75-97. Janeway, C., Travers, P., Walport, M., Shlomchik, M (2001). Immunobiology. 5th
edition. Garland Publishing. New York. Jhaveri, K., Trammell, R., Toth, L (2007). Effect of environmental temperature on sleep,
locomotor activity, core body temperature and immune responses of C57BL/6J mice. Brain Behav Immun. 21, 975-987. Johnson, R., Mims, C (1968). Pathogenesis of viral infections of the nervous system. N
Engl J Med. 278, 23-30. Johnson, R(1998). Viral infections of the nervous system. 2nd edition. Lippincott-Raven
Publishers. New York. Josephson, E., Padgett, M., Buxton, D (1997). The lateral and medial compartments of
the olfactory tubercle and their relation to olfactory-related input as determined by artificial neural network. Brain Res. 744, 253-271.
Juliet, P., Mao, X., Del Bigio, M (2008). Proinflammatory cytokine production by
cultured neonatal rat microglia after exposure to blood products. Brain Res. 1210, 230-239.
Kapás, L, Krueger, J (1992). Tumor necrosis factor-beta induces sleep, fever, and
anorexia. Am J Physiol. 263(3 Pt 2), R703-R707. Kapás, L., Hong, L., Cady, A., Opp, M., Postlethwaite, A., Seyer, J., Krueger, J (1992). Somnogenic, pyrogenic, and anorectic activities of tumor necrosis factor-alpha and
TNF-alpha fragments. Am J Physiol. 263(3 Pt 2), R708-R715. Kaufmann, S., Sher, A., Ahmed, R (2002). Immunology of infectious diseases. ASM
press. Washington DC. Kawada, J., Kimura, H., Ito, Y., Hara, S., Iriyama, M., Yoshikawa, T., Morishima, T
(2003). Systemic cytokine responses in patients with influenza-associated encephalopathy. J Infect Dis. 188, 690-698.
Kawai, T., Akira, S (2006). Innate immune recognition of viral infection. Nat Immunol.
7, 131-137. Klein, M., Conn, C., Kluger, M (1992). Behavioral thermoregulation in mice inoculated
with influenza virus. Physiol Behav. 52, 1133-1139.
31

Klir, J., McClellan, J., Kluger, M (1994). Interleukin-1 beta causes the increase in anterior hypothalamic interleukin-6 during LPS-induced fever in rats. Am J Physiol. 266, R1845-R1848.
Kluger, M (1991). Fever: role of pyrogens and cryogens. Physiol Rev. 71, 93-127. Koizumi, S., Fujishita, K., Inoue, K (2005). Regulation of cell-to-cell communication
mediated by astrocytic ATP in the CNS. Purinergic Signal, 1, 211-217. Konsman, J., Parnet, P., Dantzer, R (2002). Cytokine-induced sickness behavior:
mechanisms and implications. Trends Neurosc. 25, 154-159. Kozak, W., Zheng, H., Conn, C., Soszynski, D., van der Ploeg, L., Kluger, M (1995).
Thermal and behavioral effects of lipopolysaccharide and influenza in interleukin-1 beta-deficient mice. Am J Physiol. 269(5 Pt 2), R969-R977.
Kronfol, Z., Remick, D (2000). Cytokines and the brain: implications for clinical
psychiatry. Am J Psychiatry. 157, 683-694. Krueger, J., Walter, J., Dinarello, C., Wolff, S., Chedid, L (1984). Sleep-promoting
effects of endogenous pyrogen (interleukin-1). Am J Physiol. 246(6 Pt 2), R994-R999.
Krueger, J., Obal, F., Fang, J., Kubota, P., Taishi, P (2001). The role of cytokines in sleep
regulation. Ann NY Acad Sci. 933, 211-221. Krueger, J., Majde, J (2003). Humoral links between sleep and the immune system. Ann
NY Acad Sci. 992, 9-20. Kubota, T., Fang, J., Guan, Z., Brown, R., Krueger, J (2001). Vagotomy attenuates tumor
necrosis factor-alpha-induced sleep and EEG delta-activity in rats. Am J Physiol Regul Integr Comp Physiol. 280, R1213-R1220.
Kubota, T., Li, N., Guan, Z., Brown ,R., Krueger, J (2002). Intrapreoptic microinjection
of TNF-alpha enhances non-REM sleep in rats. Brain Res. 932, 37-44. Kurokawa, M., Imakita, M., Kumeda, C., Shiraki, K (1996). Cascade of fever production
in mice infected with influenza virus. J Med Virol. 50, 152-158. LeDoux, J (2007). The amygdala. Current Biology. 17, R868-R874.
Leon, L., Kozak, W., Peschon, J., Kluger, M (1997). Exacerbated febrile responses to LPS, but not turpentine, in TNF double receptor-knockout mice. Am J Physiol. 272(2 Pt 2), R563-R569.
32

Leon, L (2004). Hypothermia in systemic inflammation: role of cytokines. Front Biosci. 9, 1877-1888.
Liu, Z., Gao, X (2006). Adenosine inhibits activity of hypocretin/orexin neurons via A1
receptor in the lateral hypothalamus: a possible sleep-promoting effect. J Neurophysiol. 97, 837-848.
Luheshi, G (1998). Cytokines and fever. Mechanisms and sites of action. Ann N Y Acad
Sci. 856,:83-89. Luk, W., Zhang, Y., White, T., Lue, F., Wu, C., Jiang, C., Zhang, L., Moldofsky, H
(1999). Adenosine: a mediator of interleukin-1beta-induced hippocampal synaptic inhibition. J Neurosci.19, 4238-4244. Lundkvist, J., Sundgren-Andersson, A., Tingsborg, S., Ostlund, P., Engfors, C., Alheim, K., Bartfai, T., Iverfeldt, K., Schultzberg, M (1999). Acute-phase responses in
transgenic mice with CNS overexpression of IL-1 receptor antagonist. Am J Physiol. 276, R644-R651.
Magoul R, Onteniente B, Benjelloun W, Tramu G.(1993) Tachykinergic afferents to the
rat arcuate nucleus. A combined immunohistochemical and retrograde tracing study. Peptides. 4(2):275-86.
Maines, T., Lu, X., Erb, S., Edwards, L., Guarner, J., Greer, P., Nguyen, D., Szretter, K.,
Chen, L., Thawatsupha, P., Chittaganpitch, M., Waicharoen, S., Nguyen, D., Nguyen, T., Nguyen, H., Kim, J., Hoang, L., Kang, C., Phuong, L., Lim, W., Zaki, S., Donis, R., Cox N., Katz, J., Tumpey, T (2005). Avian influenza (H5N1) viruses isolated from humans in Asia in 2004 exhibit increased virulence in mammals. J Virol. 79,11788-11800.
Majde, J (2000). Viral double-stranded RNA, cytokines, and the flu. J Interferon
Cytokine Res. 20, 259-272. Maricich, S., Neul, J., Lotze, T., Cazacu, A., Uyeki, T., Demmler, G., Clark, G (2004).
Neurologic complications associated with influenza A in children during the 2003-2004 influenza season in Houston, Texas. Pediatrics, 114, 626-633.
Mingam, R., De Smedt, V., Amédée, T., Bluthé, R., Kelley, K., Dantzer, R., Layé, S
(2008). In vitro and in vivo evidence for a role of the P2X7 receptor in the release of IL-1 beta in the murine brain. Brain Behav Immun. 22, 234-244. Mori, I., Diehl, A., Ashok, C., Ljunngren, H., Kristensson, K (1999). Selective targeting
of habenular, thalamic midline and monoaminergic brainstem neurons by neurotropic influenza A virus in mice. J Neurovirol. 5, 335-362.
33

Mori, I., Nishiyama, Y., Yokochi, T., Kimura, Y (2005). Olfactory transmission of neurotropic viruses. J Neurovirol. 11, 129-137.
Naeve, C., Hinshaw, V., Webster, R (1984). Mutations in the hemagglutinin receptor-
binding site can change the biological properties of an influenza virus. J Virol. 51, 567-569.
Nicholson, K., Wood, J., Zambon, M (2003). Influenza. Lancet, 362, 1733-1745. Obal, F., Opp, M., Cady, A., Johannsen, L., Postlethwaite, A., Poppleton, H., Seyer, J., Krueger, J (1990). Interleukin 1 alpha and an interleukin 1 beta fragment are
somnogenic. Am J Physiol. 259, R439-R446. Ohtori, S., Takahashi, K., Moriya, H., Myers, R (2004). TNF-alpha and TNF-alpha
receptor type 1 upregulation in glia and neurons after peripheral nerve injury: studies in murine DRG and spinal cord. Spine, 29, 1082-1088.
Okumura, A., Nakano, T., Fukumoto, Y., Higuchi, K., Kamiya, H., Watanabe, K.,
Morishima, T (2005). Delirious behavior in children with influenza: its clinical features and EEG findings. Brain Dev. 27, 271-274.
Olson, J., Miller, S (2004). Microglia initiate central nervous system innate and adaptive
immune responses through multiple TLRs. J Immunol. 173, 3916-3924. O'Neill, L., Greene, C (1998). Signal transduction pathways activated by the IL-1
receptor family: ancient signaling machinery in mammals, insects, and plants. J Leukoc Biol. 63, 650-657. Opp, M., Obal, F., Krueger, J (1991). Interleukin 1 alters rat sleep: temporal and dose-
related effects. Am J Physiol. 260, R52-R58. Opp, M (2005). Cytokines and sleep. Sleep Med Rev. 9, 355-364. Owens, T., Babcock, A., Millward, J., Toft-Hansen, H (2005). Cytokine and chemokine
inter-regulation in the inflamed or injured CNS. Brain Res Brain Res Rev. 48, 178-184.
Oxford, J (2000). Influenza A pandemics of the 20th century with special reference to
1918: virology, pathology and epidemiology. Rev Med Virol. 10, 119-133. Palin, K., Bluthé, R., McCusker, R., Moos, F., Dantzer, R., Kelley, K (2007). TNF alpha-
induced sickness behavior in mice with functional 55 kD TNF receptors is blocked by central IGF-I. J Neuroimmunol. 187, 55-60.
34

Palin, K., McCusker, R., Strle, K., Moos, F., Dantzer, R., Kelley, K (2008). Tumor necrosis factor-alpha-induced sickness behavior is impaired by central administration of an inhibitor of c-jun N-terminal kinase. Psychopharmacology, 197, 629-635.
Park, C., Ishinaka, M., Takada, A., Kida, H., Kimura, T., Ochiai, K., Umemura, T (2002).
The invasion routes of neurovirulent A/Hong Kong/483/97 (H5N1) influenza virus into the central nervous system after respiratory infection in mice. Arch Virol. 147, 1425-1436.
Peper, R., Van Campen, H (1995). Tumor necrosis factor as a mediator of inflammation
in influenza A viral pneumonia. Microb Pathog. 19, 175-183. Perry, S., Dewhurst, S., Bellizzi, M., Gelbard, H (2002). Tumor necrosis factor-alpha in
normal and diseased brain: Conflicting effects via intraneuronal receptor crosstalk? J Neurovirol. 8, 611-624. Prehaud, C., Prehaud, C., Megret, F., Lafage, M., Lafon, M (2005). Virus infection
switches TLR-3 -positive human neurons to become strong producers of beta interferon. J Virol. 79, 12893-12904.
Price, J., Slotnick, B., Revial, M (1991). Olfactory projections to the hypothalamus. J
Comp Neurol. 306, 447-461. Price, J (2003). Comparative aspects of amygdala connectivity. Ann N Y Acad Sci. 985,
50-58. Ramon-Cueto, A., Avila, J (1998). Olfactory ensheathing glia: properties and function.
Brain Res Bull. 46, 175-187. Reading, P., Miller, J., Anders, E (2000). Involvement of the mannose receptor in
infection of macrophages by influenza virus. J Virol. 74, 5190-5197. Regnier-Vigouroux, A (2003). The mannose receptor in the brain. Int Rev Cytol. 226,
321-342. Reinacher, M., Bonin, J., Narayan, O., Scholtissek, C (1983). Pathogenesis of
neurovirulent influenza A virus infection in mice. Route of entry of virus into brain determines infection of different populations of cells. Lab Invest. 49, 686-692.
Reiss, C., Plakhov, I., Komatsu, T (1998). Viral replication in olfactory receptor neurons
and entry into the olfactory bulb and brain. Ann N Y Acad Sci. 855, 751-761. Rempel, J., Quina, L., Blakely-Gonzales, P., Buchmeier, M., Gruol, D (2005). Viral
induction of central nervous system innate immune responses. J Virol. 79, 4369-4381. Ribeiro, J., Sebastião, A., de Mendonça, A (2002). Adenosine receptors in the nervous
system: pathophysiological implications. Prog Neurobiol. 68, 377-392.
35
Romanovsky, A., Almeida, M., Aronoff, M., Ivanov, A., Konsman, J., Steiner, A., Turek,
F (2005). Fever and hypothermia in systemic inflammation: recent discoveries and revisions. Front. Biosci. 10, 2193-2216.
Roth, J., Rummel, C., Barth, S., Gerstberger, R., Hübschle, T (2006). Molecular aspects
of fever and hyperthermia. Neurol Clin. 24, 421-439. Russell, S., Small, C., Dakin, C., Abbott, C., Morgan, D., Ghatei, M., Bloom, S (2001).
The central effects of orexin-A in the hypothalamic-pituitary-adrenal axis in vivo and in vitro in male rats. J Neuroendocrinol. 13, 561-566.
Saper, C., Scammell, T., Lu, J (2005). Hypothalamic regulation of sleep and circadian
rhythms. Nature, 437, 1257-1263. Schlesinger, R., Husak, P., Bradshaw, G., Panayotov, P (1998). Mechanisms in natural
and experimental neuropathogenicity of influenza virus: evidence and speculation. Adv Virus Res. 50, 289-379.
Schmitz, N., Kurrer, M., Bachmann, M., Kopf, M (2005). Interleukin-1 is responsible for
acute lung immunopathology but increases survival of respiratory influenza virus infection. J Virol. 79, 6441-6448.
Schwaninger, M., Petersen, N., Prinz, S., Sallmann, S., Neher, M., Spranger, M (2000).
Adenosine-induced expression of interleukin-6 in astrocytes through protein kinase A and NF-IL-6. Glia, 31, 51-58.
Scumpia, P., Kelly, K., Reeves, W., Stevens, B (2005). Double-stranded RNA signals
antiviral and inflammatory programs and dysfunctional glutamate transport in TLR3-expressing astrocytes. Glia, 52, 153-162.
Sergerie, Y., Rivest, S., Boivin, G (2007). Tumor necrosis factor-alpha and interleukin-1
beta play a critical role in the resistance against lethal herpes simplex virus encephalitis. J Infect Dis. 196, 853-860.
Shi, Y., Liu, X., Gebremedhin, D., Falck, J., Harder, D., Koehler, R (2008). Interaction
of mechanisms involving epoxyeicosatrienoic acids, adenosine receptors, and metabotropic glutamate receptors in neurovascular coupling in rat whisker barrel cortex. J Cereb Blood Flow Metab. 28, 111-125.
Shinya, K., Shimada, A., Ito, T., Otsuki, K., Morita, T., Tanaka, H., Takada, A., Kida, H.,
Umemura, T (2000). Avian influenza virus intranasally inoculated infects the central nervous system of mice through the general afferent nerve. Arch Virol. 145, 187-195.
36

Shoham, S., Davenne, D., Cady, A., Dinarello, C., Krueger, J (1987). Recombinant tumor necrosis factor and interleukin 1 enhance slow-wave sleep. Am J Physiol. 253, R142-R149.
Sidorenko, Y., Reichl, U (2004). Structured model of influenza virus replication in
MDCK cells. Biotechnol Bioeng. 88, 1-14. Silverman, S., Pearce, B., Biron, C., Miller, A (2005). Immune modulation of the
hypothalamic-pituitary-adrenal (HPA) axis during viral infection. Viral Immunol. 18, 41-78.
Simi, A., Tsakiri, N., Wang, P., Rothwell, N (2007). Interleukin-1 and inflammatory
neurodegeneration. Biochem Soc Trans. 35(Pt 5), 1122-1126. Smith, W (1952). The structural and functional plasticity of influenza virus. Lancet.
I(18), 885-891. Solle, M., Labasi, J., Perregaux, D., Stam, E., Petrushova, N., Koller, B., Griffiths, R., Gabel, C (2001). Altered cytokine production in mice lacking P2X(7) receptors. J Biol Chem. 276, 125-132. Solomon, K., Pesti, N., Wu, G., Newton, R (1999). Cutting edge: a dominant negative
form of TNF-alpha converting enzyme inhibits proTNF and TNFRII secretion. J mmunol. 163, 4105-4108.
Sriram, K., O'Callaghan, J (2007). Divergent roles for tumor necrosis factor-alpha in the
brain. J Neuroimmune Pharmacol. 2, 140-153. Steinhauer, D., Skehel, J (2002). Genetics of influenza viruses. Annu Rev Genet. 36, 305-
332. Studahl, M (2003). Influenza virus and CNS manifestations. J Clinic Virol. 28, 225-232. Sugaya, N (2002). Influenza-associated encephalopathy in Japan. Semin Pediatr Infect
Dis. 13:79-84. Susić, V., Totić, S (1989). "Recovery" function of sleep: effects of purified human
interleukin-1 on the sleep and febrile response of cats. Metab Brain Dis. 4, 73-80. Suzuki, T., Hide, I., Ido, K., Kohsaka, S., Inoue, K., Nakata, Y (2004). Production and
release of neuroprotective tumor necrosis factor by P2X7 receptor-activated microglia. J Neurosci. 24, 1-7.
Suzuki, N., Bekkers, J (2007). Inhibitory interneurons in the piriform cortex. Clin Exp
Pharmacol Physiol. 34, 1064-1069.
37

Tabarean, I., Korn, H., Bartfai, T (2006). Interleukin-1beta induces hyperpolarization and modulates synaptic inhibition in preoptic and anterior hypothalamic neurons. Neuroscience, 141, 1685-1695.
Taishi, P., Chen, Z., Obál, F, Hansen, M., Zhang, J., Fang, J., Krueger, J (1998). Sleep-
associated changes in interleukin-1beta mRNA in the brain. J Interferon Cytokine Res. 18, 793-798.
Takahashi, S., Kapás, L., Fang, J., Krueger, J (1995). An anti-tumor necrosis factor
antibody suppresses sleep in rats and rabbits. Brain Res. 690, 241-244. Takahashi, S., Kapás, L., Krueger, J (1996). A tumor necrosis factor (TNF) receptor
fragment attenuates TNF-alpha- and muramyl dipeptide-induced sleep and fever in rabbits. J Sleep Res. 5, 106-114.
Takahashi, S., Fang, J., Kapás, L., Wang, Y., Krueger, J (1997). Inhibition of brain
interleukin-1 attenuates sleep rebound after sleep deprivation in rabbits. Am J Physiol. 273, R677-R682.
Taoufik, E., Petit, E., Divoux, D., Tseveleki, V., Mengozzi, M., Roberts, M., Valable, S., Ghezzi, P., Quackenbush, J., Brines, M., Cerami, A., Probert, L (2008). TNF receptor
I sensitizes neurons to erythropoietin- and VEGF-mediated neuroprotection after ischemic and excitotoxic injury. Proc Natl Acad Sci U S A. 105, 6185-6190.
Taylor, J., Grossberg, S (1998). The effects of interferon-alpha on the production and
action of other cytokines. Semin oncol. 25 (suppl 1), 23-29. Tonelli, L., Holmes, A., Postolache, T (2008). Intranasal immune challenge induces sex-
dependent depressive-like behavior and cytokine expression in the brain. Neuropsychopharmacology, 33, 1038-1048.
Toth, L., Rehg, J., Webster, R (1995). Strain differences in sleep and other
pathophysiological sequelae of influenza virus infection in naive and immunized mice. J Neuroimmunol. 58, 89-99.
Tracey, D., Klareskog, L., Sasso, E., Salfeld, J., Tak, P (2008). Tumor necrosis factor
antagonist mechanisms of action: a comprehensive review. Pharmacol Ther. 117, 244-279.
Treanor J (2004). Influenza vaccine--outmaneuvering antigenic shift and drift. N Engl J
Med. 350, 218-220. Trinchieri, G., Sher, A (2007). Cooperation of Toll-like receptor signals in innate
immune defence. Nat Rev Immunol. 7, 179-190.
38

Tripathi, A., Sodhi, A (2008). Prolactin-induced production of cytokines in macrophages in vitro involves JAK/STAT and JNK MAPK pathways. Int Immunol. 20, 327-336.
Ubeda-Bañon, I., Novejarque, A., Mohedano-Moriano, A., Pro-Sistiaga, P., de la Rosa-
Prieto, C., Insausti, R., Martinez-Garcia, F., Lanuza, E., Martinez-Marcos, A (2007). Projections from the posterolateral olfactory amygdala to the ventral striatum: neural basis for reinforcing properties of chemical stimuli. BMC Neurosci. 8:103-113.
Vacheron, F., Rudent, A., Perin, S., Labarre, C., Quero, A., Guenounou, M (1990).
Production of interleukin 1 and tumor necrosis factor activities in bronchoalveolar washings following infection of mice by influenza virus. J Gen Virol. 71( Pt 2), 477-479.
Vandenabeele, P., Declercq, W., Beyaert, R., Fiers, W (1995). Two tumour necrosis
factor receptors: structure and function. Trends Cell Biol. 5, 392-399. van den Pol, A., Dalton, K., Rose, J (2002). Relative neurotropism of a recombinant
rhabdovirus expressing a green fluorescent envelope glycoprotein. J Virol. 76, 1309-1327.
Vitkovic, L., Konsman, J., Bockaert, J., Dantzer, R., Homburger, V., Jacque, C (2000).
Cytokine signals propagate through the brain. Mol Psych. 5, 604-615. Wang, J., Swann, M (2006). The magnocellular medial preoptic nucleus I. Sources of
afferent input. Neuroscience, 141, 1437-1456. Wang, G., Zhang, J., Li, W., Xin, G., Su, Y., Gao, Y., Zhang, H., Lin, G., Jiao, X., Li, K
(2008). Apoptosis and proinflammatory cytokine responses of primary mouse microglia and astrocytes induced by human H1N1 and avian H5N1 influenza viruses. Cell Mol Immunol. 5, 113-120.
Ward, A (1997). Virulence of influenza A virus for mouse lung. Virus genes, 14, 187-
194. White, D., Fenner, F (1994). Medical Virology. 4th edition, Academic Press, San Diego.
489-499. Williams, R., Marinova-Mutafchieva, L., Feldmann, M., Maini, R (2000). Evaluation of
TNF-alpha and IL-1 blockade in collagen-induced arthritis and comparison with combined anti-TNF-alpha/anti-CD4 therapy. J Immunol. 165, 7240-7245.
Wright, P., Webster, R (2001). In: Fields Virology. Vol 2 Chapter 47. Lippincott
Williams & Wilkins. New York.
39
Yan, M., Xia, C., Cheng, C., Shao, X., Niu, S., Liu, H., Shen, A (2007). The role of TNF-alpha and its receptors in the production of Src-suppressed C kinase substrate by rat primary type-2 astrocytes. Brain Res. 1184, 28-37.
Zambon, M (2001). The pathogenesis of influenza in humans. Rev med virol. 11, 227-
241. Zetterström, M., Sundgren-Andersson, A., Ostlund, P., Bartfai, T (1998). Delineation of
the proinflammatory cytokine cascade in fever induction. Ann N Y Acad Sci. 856, 48-52.
Zimmer, H., Riese, S., Regnier-Vigourox, A (2003). Functional characterization of
mannose receptor expressed by immunocompetent mouse microglia. Glia, 42, 89-100.
Zhang, X., Chen, Y., Wang, C., Huang, L (2007) Neuronal somatic ATP release triggers
neuron-satellite glial cell communication in dorsal root ganglia. Proc Natl Acad Sci USA. 104, 9864-9869.
40

CHAPTER II
DETECTION OF MOUSE-ADAPTED HUMAN INFLUENZA VIRUS IN THE
OLFACTORY BULBS OF MICE WITHIN HOURS AFTER INTRANASAL
INFECTION
Jeannine A. Majde1, Stewart G. Bohnet1, Georgeann A. Ellis2, Lynn Churchill1, Victor
Leyva-Grado1, Melissa Wu1, Eva Szentirmai1, Abdur Rehman1 and James M. Krueger1
1Department of Veterinary and Comparative Anatomy, Pharmacology and Physiology,
Washington State University, Pullman, WA 99164; 2Department of Biological Sciences,
College of Sciences and Mathematics, Auburn University, Auburn, AL 36849
41

Abstract
Influenza pneumonitis causes severe systemic symptoms in mice, including
hypothermia and excess sleep. The association of extrapulmonary virus, particularly
virus in the brain, with the onset of such disease symptoms has not been investigated.
Mature C57BL/6 male mice were infected intranasally with mouse-adapted human
influenza viruses (PR8 or X-31) under inhalation, systemic or no anesthesia. Core body
temperatures were monitored continuously by radio-telemetry, and tissues (lung, brain,
olfactory bulb, spleen and blood) were harvested at the time of onset of hypothermia (13-
24 h post-infection) or at 4 or 7 h post-infection (PI). Whole RNA from all tissues was
examined by one or more of three RT-PCR procedures using H1N1 nucleoprotein (NP)
primers for minus polarity RNA (genomic or vRNA) or plus polarity RNA (replication
intermediates). Selected cytokines were assayed at 4, 7 and 15 h in the olfactory bulb
(OB). Minus and plus RNA strands were readily detected in OBs as early as 4 h PI by
nested RT-PCR. Anesthesia was not required for viral invasion of the OB. Cytokine
mRNAs were also significantly elevated in the OB at 7 and 15 h PI in infected mice. In
contrast, controls receiving boiled virus expressed only input vRNA and that only in
lung. Immunohistochemistry demonstrated localization of H1N1 and NP antigens in
olfactory nerves and the glomerular layer of the OB. Therefore a mouse-adapted human
influenza viral strain, not known to be neurotropic, was detected in the mouse OB within
4 h PI where it appeared to induce replication intermediates and cytokines.
42

Introduction
Many respiratory and intestinal viral infections are marked by abrupt onset of fever,
somnolence and malaise, commonly termed the ‘flu,’ within 2-3 days following infection.
There is little evidence in the majority of cases that such viruses replicate outside the
mucosal surfaces that they target, although their systemic symptoms can be quite severe.
It is assumed that acute viral symptoms are a consequence of cytokine release from
infected target tissues acting upon the brain, although evidence for this assumption is
minimal.
Influenza virus is among the respiratory viruses thought to be restricted to the upper
respiratory tract in classical human ‘flu’ and to the entire respiratory tract in more severe
influenzal pneumonitis. However viremia does occur in mild human influenza, although
it can only be detected prior to onset of clinical symptoms using classical virus isolation
techniques (Stanley and Jackson, 1966). Furthermore, clinical observations made during
the influenza pandemics of 1918 (Kristensson, 2006) and 1957-58 [reviewed (Schlesinger
et al., 1998; Ward, 1996)] indicate that influenza virus can invade the brain in certain
lethal infections. Psychiatric sequellae to influenza are also seen (Kristensson, 2006). In
the last ten years, influenza-associated encephalitis/encephalopathy has been diagnosed
relatively frequently in Japanese children (Kristensson, 2006; Sugaya, 2002), but no
particular viral strain has been implicated. A review of 84 hospitalized children in
Taiwan with documented influenza A reported that 31% had neurological symptoms
(Wang et al., 2003); influenza A is more commonly seen in children with neurological
involvement than is influenza B (Romero and Newland, 2003). Viral RNA is
43

occasionally detected in cerebral spinal fluid by the reverse transcriptase polymerase
chain reaction (RT-PCR) in encephalopathy patients (Fujimoto et al., 1998; Steininger et
al., 2003). Japanese case reports have led to a greater awareness of these neurological
complications of influenza, with the consequence that adult and pediatric cases in Europe
(Rantalaiho et al., 2001; Steininger et al., 2003) and pediatric cases in the United States
(Maricich et al., 2004; Weitkamp et al., 2004) have been recognized. More recent
studies have detected influenza-associated neurological complications, primarily seizures,
in 4 pediatric cases per 100,000 person-years; risk factors include neurological or
neuromuscular diseases (Newland et al., 2007). Studies in Finland suggest that 4-7% of
human viral encephalitides are associated with influenza infections (Rantalaiho et al.,
2001).
Infections of mice with mouse-adapted human strains of influenza virus by the
intranasal (IN) route are also assumed to be restricted to the respiratory tract, although
viremia with the most commonly employed human strain, mouse-adapted A/PR/8/34
H1N1 (PR8), can be detected with sensitive methods within the first 24 h post-infection
(PI) (Frankova and Rychterova, 1975; Ishida et al., 1959; Mori et al., 1995). Mouse
central nervous system (CNS) infections with human strains have been primarily studied
using the neurovirulent WSN or NWS strains derived by serial intracerebral (IC)
passages in mice (Ward, 1996). These strains are studied using the IC route in adult mice
or the IN route in neonates (Schlesinger et al., 1998); WSN does not appear to invade the
brain when inoculated by the IN route in immunocompetent adult mice (Garcia-Sastre et
al., 1998a). Other studies of influenza infections of the mouse brain have employed
avian strains or avian recombinants that are intrinsically neurotropic as well as
44

neurovirulent in susceptible birds and mammals (Schlesinger et al., 1998). Neurotropism
in mice is also a notable feature of human isolates of avian H5N1 viruses from Hong
Kong in 1997 (Tanaka et al., 2003) and Southeast Asia in 2004 (Maines et al., 2005).
In order to clarify the role of extrapulmonary virus in the viral ‘flu’ syndrome (or
acute phase response), we have employed one-step RT-PCR, or the more sensitive two-
step nested RT-PCR (nPCR) or real-time quantitative PCR (qPCR) techniques to detect
both minus polarity (genomic vRNA) and plus polarity (replication intermediates) PR8
nucleoprotein (NP) RNA. RNA was extracted from tissues collected from mature male
C57BL/6 mice infected IN with PR8 or X-31 mouse-adapted human H1N1 influenza A
strains, with or without anesthesia. Tissues were harvested at or near the onset of
hypothermia, the earliest quantifiable manifestation of systemic influenzal disease in
mice (Fang et al., 1995), or at 4 or 7 h PI when no symptoms were perceptible. PCR
analyses were performed in lung, whole brain minus intact olfactory bulb (OB), isolated
intact OB, spleen and blood from infected mice or from controls inoculated with heat-
inactivated virus. In addition, cytokine mRNA expression was examined by qPCR in
selected 4, 7 and 15 h OB samples. Following detection of viral RNA in the OB by
nPCR, we employed immunohistochemistry (IHC) to detect viral antigens in the OB at
15 h PI. To our knowledge this study represents the first demonstration of neurotropism
of a human influenza virus in immunologically mature mice within the first 15 h PI. The
results reported here may provide a biological basis for the severe systemic symptoms
associated with influenza infections as well as influenza-associated neuropathologies.
45

Materials and methods
Mice
Specific pathogen-free male C57BL/6 mice (Taconic Farms, Germantown, NY, or
Jackson Laboratory, Bar Harbor, ME), 10 to 14 weeks of age at the time of inoculation,
were maintained in AAALAC-approved animal quarters under veterinary supervision.
The procedures employed were approved by the Washington State University
Institutional Animal Use and Care Committee. After two weeks quarantine, mice were
housed in standard plastic cages with filter tops and maintained at 29 ± 2°C [the
thermoneutral zone for mice that allows full expression of stimulus-induced temperature
changes (Hoffman-Goetz and Keir, 1985)] in a closed environmental chamber on a 12:12
hr light/dark cycle.
Viruses and virus preparation
PR8 influenza virus was purified from specific pathogen-free (SPF) egg allantoic
fluid using endotoxin-free reagents and titered as described in (Chen et al., 2004). The
virus stock was shown to be free of detectable endotoxin or mycoplasma contamination
(Chen et al., 2004). In one experiment the X-31 strain of influenza A [a reassortant
between PR8 and A/Aichi/68 (H3N2) (Lee et al., 2001)] in allantoic fluid from SPF eggs
was employed. X-31 expresses H3N2 surface genes but contains the internal genome
segments of PR8, including the NP. X-31 requires about 10-fold more virus to kill mice
in the same time-frame as PR8 (Price et al., 2000).
46

Inoculation procedures
PR8-infected mice received 2.5 x 10⁶ TCID50 purified PR8 (high dose, lethal in 4-5
days PI) in Dulbecco’s PBS, or two 10-fold dilutions of this virus inoculum. X-31
infected mice virus received 1.5 x 10⁶ TCID50 of crude virus. All control mice received
virus that was heat-inactivated using one of two incubation techniques: a 56°C water bath
for 30 min or submersion in a boiling water bath for 15-25 min (boiled virus).
Inoculations were performed within an hour of light onset.
For IN inoculations under anesthesia, either light methoxyflurane (Metofane,
Schering-Plough Animal Health, Union, NJ) inhalation (INH) anesthesia or
intraperitoneal (IP) ketamine/xylazine (K/X) (Chen et al., 2004) were used.
Anesthetized mice were hand-held in a semi-recumbent position and inoculated with 50
μl volumes delivered slowly to the nostrils (25 μl per nostril) with a 100 μl micropipette.
Unanesthetized mice were restrained in a 50 ml conical plastic tube with the tip removed
to provide access to the nose and inoculated as described above. After inoculation
unanesthetized mice were held in a recumbent position for one min. Control animals
received the same volume of high dose virus that was heat inactivated by one of the two
methods described above, except in the body temperature studies where infected mice
were compared against untreated mouse baseline data.
Body temperature measurements
At least one week prior to infection, mice (6/group) were implanted intraperitoneally
with 0.5 g VM-FM radio transmitters (Mini-Mitter, Inc., Sunriver, OR) capable of
monitoring body temperature and locomotor activity through receivers under the
47

individual cages. Temperature data from individually housed mice were collected at 6
min intervals and processed using the VitalView data acquisition system (Mini-Mitter,
Inc.); each data point in Fig. 1 is an average of 10 values collected over 1 h.
Tissue sampling
A total of 127 boiled virus controls and 131 live PR8 inoculated mice were sampled
for RT-PCR analysis. Tissues (lung, blood, spleen, intact OB, or whole brain with only
the caudal root of the OB∗) were harvested at the time of onset of hypothermia (drop in
body temperature of 1°C or more of at least two animals in the group compared to
baseline temperatures at that time of day, cf. Fig. 1). In mice not monitored for
temperature change, tissues were harvested at 14 or 15 hr PI. Lungs and OBs from high
dose PR8-infected mice were also harvested at 4 and 7 hr PI prior to onset of
hypothermia. For molecular analysis mice were exsanguinated by open cardiac puncture
under Metofane anesthesia and tissues were harvested into liquid nitrogen (taking care to
clean the dissecting tools in dilute sodium hydroxide between each organ dissection), and
stored at -80°C for subsequent RNA extraction.
For IHC analysis OBs were harvested from whole brains taken at 15 hr after IN
inoculation under light Metofane anesthesia with high dose live PR8 or boiled PR8.
Mice under deep Metofane anesthesia were perfused transcardially with 20 ml of warm
normal saline followed by 40-60 ml of 4% Para formaldehyde in phosphate-buffered
saline (PBS). Control mice unexposed to either inoculum were perfused in a similar ∗ Our dissection methods for removing the brain or OB changed over time; early experiments where whole brain was examined were not dissected in a manner that reliably removed the rostral OB with olfactory nerve roots together with the caudal regions of the brain from cortex through the brain stem. Studies involving the OB per se were performed with intact OBs where the olfactory nerves were dissected away from the cribriform plate.
48

manner. Whole brains, including intact OBs, were removed, allowed to post-fix for 2 hr,
and then immersed in 20% sucrose overnight. The brains were then frozen in crushed dry
ice and stored at -80 ºC until sectioned.
RNA isolation for RT-PCR procedures
Total RNA was extracted from frozen tissues except blood for RT-PCR and nPCR
using TRIzol reagent (Invitrogen, Carlsbad, CA, Cat. No. 15596-018) according to the
manufacturer’s recommended protocol. Total RNA was extracted from whole blood
samples (approximately 0.7 ml) using the SV Total RNA Isolation System (Promega,
Cat. No. Z3100, Madison, WI) following the manufacturer’s protocol. Alternatively,
RNA from blood was extracted using the RiboPure-Blood kit (Ambion, Austin, TX)
according to the manufacturer’s instruction.
Primers Employed
Primers used for NP RT-PCR, nPCR, and qPCR studies are listed in Table 3. Primer
sequences used for qPCR analysis of IL1β, TNFα, OAS-1A and Mx1 are reported in
(Traynor et al., 2004). Our NP primers were examined to determine if their products
would include the human protein that shares sequence homology with influenza NP
(Cooper, Jr. et al., 1996); the PCR products of our NP primers do not include this
potentially confounding region.
49

Detection of viral genes by RT-PCR and nPCR analysis
One-step RT-PCR and two-step nPCR procedures were adapted from the methods of
Mori, et al., 1995. Two nPCR methods were employed, which differed primarily with
respect to the amount of cDNA template used. Method 1 used ten-fold more cDNA
template for the first step and five-fold less for the second step than Method 2.
Copy number analysis
Viral RNA was isolated from a sucrose-gradient-purified PR8 preparation using
Trizol (Invitrogen). Viral RNA (0.25 μg) was reverse transcribed with primers
complementary to the 5’ or 3’ ends using superscript II (Invitrogen). Additional
cysteines were ligated to the 5’ primer region to increase the Tm in order to make the
primers useful for PCR amplification. cDNA was PCR amplified with the sense and anti-
sense primers and the products cloned into pCR 4.2 TOPO vector (Invitrogen Catalog #
K4575-01). Plasmids were linearized with Not-I or Spe-I restriction enzymes. Plus and
minus GS-5 RNA was amplified with MEGAscript® T7 or MEGAscript® T3 kits
(Ambion) using the manufacturer’s instructions. RNA was purified with MEGAclear™
Kit (Ambion). Approximately 100 μg of RNA was obtained per 1 μg of linearized
plasmid. RNA was mixed with yeast tRNA (0.2 μg/ml in 10 mM Tris, 1 mM EDTA
buffer, pH = 7.6) prior to 10-fold serial dilutions to establish a standard curve. Nested
PCR Method 1 was shown to detect as few as 18 copies of viral RNA/μg tRNA, both
minus and plus strands. Method 2 detected 1800 copies of plus and 18,000 copies of
minus strand RNA/μg tRNA.
50

Quantification of RNA transcripts by qPCR
Five μL of cDNA (12.5 ng of total lung RNA) or 5 μL of cDNA (25 ng of total brain
RNA) were amplified by PCR using NP and cyclophilin primers provided in Table 1 or
cytokine primers provided in (Traynor et al., 2004). The total reaction volume was 25
µL containing 0.2 µM sense and anti-sense primers, 12.5 μL Platinum qPCR Supermix-
UDG (Invitrogen, Carlsbad, CA), a 1:100,000 dilution of SYBR green (Molecular
Probes, Eugene, OR), and a 1:100,000 dilution of Fluorescein Calibration Dye (Bio-Rad
Laboratories, Hercules, CA). QPCR was performed and analyzed as described in
(Bohnet et al., 2004). Data are expressed as fold-increase of experimental over control ±
the standard error of the mean (SEM). The Student’s t-test was used for statistical
analysis of the fold-increase data and p < 0.05 was considered to indicate a statistically
significant difference.
Olfactory bulb immunohistochemistry
Coronal 30 μm frozen sections of the OB were cut and stained by the
immunoperoxidase procedures described in (Churchill et al., 2005) using
diaminobenzidine as a chromophore. Viral antigen studies were performed with either
the mouse monoclonal PR8-reactive anti-influenza virus A H1N1 antibody (Chemicon,
Temecula, CA, catalog # MAB8261, lot # 24050638, dilution 1:100) or the mouse
monoclonal anti-influenza N1 NP antibody (Chemicon catalog # MAB8257F-5, lot
#0506002204, dilution 1:100) as the first antibody. The second antibody for viral antigen
studies was biotinylated horse anti-mouse IgG (1:500; Vector Labs, catalog # BA2001,
lot # N0109, Burlingame, CA) with 2% normal horse serum as a blocking agent. Control
51

sections were treated with the antibody to mouse IgG but no primary antibody. No
specific immunoreactivity was observed in the control sections where the primary
antibody was omitted. Rostral portions of the OB were examined at various
magnifications and photographed using a Leica DMLB microscope and a Spot camera. .
52

Results
Body temperature response to PR8
We and others have demonstrated that a rapid fall in body temperature occurs early
after lethal influenza infection of mice (Conn et al., 1995; Fang et al., 1995). In our
model the time of onset of hypothermia was observed in order to ascertain the time at
which the mice manifested influenza symptoms following infection with various doses of
PR8. Precipitous hypothermia began at 11-13 h PI (three experiments, n = 20) in mice
given 2.5 x 10⁶ median tissue culture infection doses (TCID50) of PR8 (the highest dose
of PR8 employed) inoculated IN under Metofane anesthesia (representative experiment
Fig. 2.1). The body temperature continued to decline steadily until it reached about 32°C
on day 4 (data not shown), at which point the animals began to die (Wong et al., 1997).
Ten-fold dilutions of virus induced a qualitatively similar pattern of hypothermia
beginning at 23.5 h and 25.2 h, respectively (data not shown). Based on these
observations, mice infected with 2.5 x 10⁶ TCID50 PR8 were harvested at 15 h to assure
that all animals were manifesting hypothermia, or at 4 or 7 h PI prior to the onset of
hypothermia. Mice infected with 1.5 x 10⁶ TCID50 X-31 under Metofane anesthesia were
harvested at 14 h PI after onset of hypothermia.
Viral RNA detection using heat-inactivated virus
The standard procedure for inactivating virus at 56°C for 30 min did not reliably
eliminate detection of hemagglutinin (HA) plus strand RNA in lung as determined by
one-step RT-PCR (data not shown). Thus heat inactivation in subsequent experiments
53

was conducted by suspending the virus preparation in a boiling water bath for 15-25 min.
The more intense heat inactivation procedure eliminated the detection by nPCR Method 1
or Method 2 of nucleoprotein (NP) plus strand in all lung samples regardless of whether
lungs were harvested at 4, 7, or 15 h PI (data not shown). Neither RNA strand was
detected by any PCR method in the OBs of 66 mice inoculated with boiled virus (e.g.,
Table 2.1) nor was either RNA strand detected in spleen, blood or whole brain (data not
shown) in mice challenged with the boiled virus. In contrast, the HA minus strand was
detected by RT-PCR in 5/6 infected lungs at 13 h PI and the NP minus strand was
detected in 2/3 infected lungs using nPCR Method 1 at 12 h PI in mice challenged with
2.5 x 10⁶ TCID50 of PR8 under Metofane anesthesia (data not shown). There was no
detection by nPCR Method 1 of NP minus or plus strand RNA in any tissue obtained
from 6/6 mice unexposed to the virus, boiled or live (data not shown).
Viral RNA detection by nPCR in whole brain (lacking an intact OB)
An early experiment using one-step RT-PCR and primers for the PR8 hemagglutinin
(Table 2.3) detected minus strand in 2/6 whole brain samples harvested at 13 h (data not
shown). Subsequent experiments with whole brains employed the more sensitive two-
step nPCR procedure (Method 1) and established primers for PR8 NP (Table 2.3). Whole
brain was positive at hypothermia onset for both NP RNA strands in a majority of
samples from mice receiving high dose PR8 using nPCR Method 1 (10/12 minus strand;
8/12 plus strand). Both NP plus and minus strands were detected sporadically using the
lower PR8 doses as well (3/12 minus strand; 4/12 plus strand) in mice sampled at the
54

time of hypothermia onset. X-31 NP minus and plus strand RNA were also detectable by
nPCR Method 1 in 3/3 samples of whole brain harvested at 14 h PI.
Viral RNA detection in the intact OB
We examined the OB for NP expression in a series of mice infected with high dose
PR8. OBs yielded positive nPCR Method 2 signals (e.g., Tables 2.1 and 2.2) in most
mice sampled at 4, 7 or 15 h PI, regardless of the anesthesia protocol employed. The NP
minus strand was more consistently detected than NP plus strand using either method of
nPCR (Tables 2.1 and 2.2); NP plus strand was never detected in the absence of NP
minus strand in the OB. Nested PCR Method 1 increased the frequency of NP detection
in OB over Method 2 (Table 2.2), especially at 4 h PI. In qPCR analyses, a few mice
expressed 100-fold the NP level (both strands) seen in other mice in the same experiment,
suggesting highly variable invasion of the OB by PR8 in quantitative terms (data not
shown).
Effects of different anesthesia protocols on OB invasion by virus
The frequency of viral NP expression in the intact OB using nPCR Method 2 for mice
anesthetized or unanesthetized during infection is shown in Table 2.1. These nPCR data
obtained from OBs sampled at 4, 7 or 15 h PI, indicate that OB invasion by PR8 (minus
strand) is not substantially enhanced by inhalation anesthesia, though plus strand
expression is less consistent in the IP-anesthetized mice (Table 2.1). In unanesthetized
mice, 5/6 OB samples obtained at 7 h PI were positive for viral RNA (Table 2.1),
indicating that anesthesia was not required for viral invasion of the OB.
55
Comparison of viral RNA detection in OB and somatosensory cortex
Somatosensory cortex (SCtx), which lacks direct projections from the olfactory bulb,
was examined for viral RNA by nPCR Method 2 (Table 2.2). Positive signal (minus
strand only) was detected in only 1/6 mice at 4 h PI and no other animals at 7 or 15 h PI.
In contrast, the same method applied to the OBs of the same mice detected minus strand
in 12/16 mice and plus strand in 5/16 mice at the various time periods PI (Table 2.2).
Viral RNA detection by nPCR in lung, blood and spleen
In mice challenged IN with live PR8, both NP strands were detected at 4 h PI by
nPCR Method 2 in 16/16 lungs infected under either inhalation (n=6), IP
ketamine/xylazine (K/X) (n=6) anesthesia, or no anesthesia (n=4) (data not shown but
same mice as used for Tables 2.1 and 2.2). Similarly, in another experiment, lungs in
12/12 mice challenged with live PR8 were positive using PCR Method 1 for both RNA
strands when lungs were harvested at the time of hypothermia onset (data not shown). In
yet another experiment, mice infected with live X-31 were also positive for both strands
in 3/3 lung samples harvested at 14 h PI.
In the mice represented in Table 2.1, whole blood and spleens were negative for
viral NP RNA at all time periods using nPCR Method 2 with the exception of one spleen
sampled at 15 h PI (Table 2.2). However, when PCR Method 1 was used, viral NP RNA
was sporadically detected in both blood and spleen at the time of hypothermia onset,
regardless of the dose of virus employed (data not shown). Detection frequency was
similar at 4, 7 and 15 h PI in a second experiment where nPCR Method 1 was used
56

(Table 2.2). Mice positive for NP in blood did not correlate with the mice positive for
NP in spleen. NP minus strand detection was more frequent in the OB than in blood,
spleen or SCtx (Table 2.2).
Using copy number analysis, nPCR Method 1 was shown to detect as few as 18
copies of viral RNA/μg tRNA, both minus and plus strands, while the lowest level of
detection by nPCR Method 2 was 1,800 copies of plus and 18,000 copies of minus strand
RNA/μg tRNA. The relative sensitivity of the two methods is consistent with our
detection frequency findings.
Cytokine mRNA detection in the OB
Expression of mRNAs for two pro-inflammatory cytokines [interleukin-1 beta (IL1β)
and tumor necrosis factor alpha (TNFα)] and two enzymes efficiently induced by type I
interferons (IFNs) [2’,5’ oligoadenylate synthetase 1a (OAS) and myxovirus resistance-1
GTPase (Mx1)] was evaluated. These two enzymes are sensitive markers for type I IFN
expression (Samuel, 2001). The results from three experiments are shown in Figure 2.2.
No cytokine or enzyme mRNAs were elevated at 4 h PI. IL1β and TNFα mRNA levels
also were not elevated at 7 h PI, but both cytokine mRNAs were significantly up-
regulated at 15 h PI (Figure 2.2). Significant up-regulation of both IFN-induced enzymes
occurred at both 7 h and 15 h PI (Figure 2.2). We were unable to reliably detect the most
common type I IFNs themselves in the OB at 7 or 15 h PI using IFNα consensus primers
that detect all IFNα isoforms or with IFNβ primers (Traynor et al 2004) (data not shown).
57
OB Immunohistochemistry at 15 h PI
A large number of cells intensively stained for H1N1 were seen in the olfactory
nerves and OB glomerular layer (GL) but rarely in the internal layers of the OB in mice
inoculated with live PR8 (Figures 2.3C and 2.3D). In contrast, in mice inoculated IN
with boiled PR8, very few influenza-H1N1-immunoreactive cells were evident 15 h PI
(Figures 2.3A and 2.3B). A similar distribution of stain was seen when OBs were
reacted with an anti N1 NP antibody in infected mice (Figures 2.3G and 2.3H) or control
mice (Figures 2.3E and 2.3F).
58

Discussion
Our results confirm and extend the studies of Mori et al. (1995) using PR8 in mice,
but we have examined the brain when objective illness is first detected at 13 to 15 hr
(Figure 2.1), or well before detectable illness at 4 h or 7 h PI, rather than at 5 days when
the infection is advanced. We show by RT-PCR that virus is undergoing at least partial
replication (expression of the NP plus strand) in brain and in the intact OB (Tables 2.1,
2.2), and that expression of the IFN-induced enzyme transcripts is up-regulated in the OB
by 7 h and 15 h (Figure 2.2). IL1β and TNFα mRNAs are both significantly up-regulated
at 15 h PI in infected OBs (Figure 2.2) when symptoms are apparent.
The IHC analysis at 15 h PI indicates that an antibody to H1N1 (reported to bind to
PR8, and presumably reactive with a viral surface protein) and an antibody to N1 NP
stains cells mainly within the glomerular layer (GL) of the OB as well as cells within the
olfactory nerves (Figure 2.3). The stained cells morphologically resemble microglial
cells. Preliminary data also indicate that these microglia-like cells are IL1β-
immunoreactive, and thus they may be the source of that cytokine in the OB that we
demonstrated by qPCR at 15 h (Figure 2.2).
Our heat-inactivation studies also extend those of Bussfeld et al. (1998), who have
demonstrated that virus heated at 56°C for 30 min (a commonly employed heat
inactivation regimen) is capable of cytokine induction and that boiling the virus for 15
min eliminates cytokine induction. Our nPCR data indicated that virus heated to 56°C
for 30 min is still capable of at least partial replication in that plus strand was often
detected in the lung. Boiling the virus eliminated the plus strand expression in the lung
59
and gave consistently negative findings in the OB when examined by nPCR and qPCR,
as well as negative cytokine mRNA induction and negative IHC findings.
It is noted that the intact OB is often not collected in studies of viral neurotropism (as
was the case in our initial studies) and the rostral portion of the OB may not be included
in whole brain analyses. To acquire the intact OB along with the bulk of the mouse brain
the olfactory nerves must be carefully cut along the cribriform plate, which is not always
done. From our results it would appear that the OB is an important brain region for
analysis of IN infections, regardless of whether the agent is defined as neurotropic.
Further, examination of the OB with extremely sensitive techniques such as nPCR earlier
than is traditionally done (usually no earlier than 2-3 days PI) can be informative as
abortive viruses may not be detectable after one replication cycle even though they may
induce cytokines in situ.
Viremia has been reported early in mouse PR8 infections (Frankova and Rychterova,
1975; Ishida et al., 1959; Mori et al., 1995), and we sporadically saw viral NP RNA in
whole blood and spleen by nPCR as early as 4 h PI (Table 2.2). Therefore, residual blood
as a source of the PCR signals in the brain must be considered. Virus may enter the
blood by penetrating the fenestrated endothelium of the olfactory mucosa following IN
inoculation (Schlesinger et al., 1998). From the blood the virus may potentially traverse
the blood-brain barrier via extracellular channels (Banks, 2004). However, blood sources
are unlikely in view of the focal distribution of the viral antigen in a very circumscribed
area of the rostral OB as visualized by IHC (Figure2.3) and the very infrequent detection
of viral RNA in the SCtx (Table 2.2), a brain region lacking direct neural projections
from the OB. Instead, viral antigen localization within the olfactory nerves and at the site
60

of the first synapse of those nerves (the GL) strongly points to invasion of the OB by PR8
via the olfactory nerve. Olfactory nerves have some unique anatomical features (Mori et
al., 2005), discussed below, that may promote viral transport.
Olfactory nerve transport of virus has been demonstrated by two established
mechanisms: the axonal transport pathway and the olfactory epithelial pathway (Dahlin et
al., 2000). Mouse hepatitis virus (Barnett and Perlman, 1993), vesicular stomatitis virus
(Huneycutt et al., 1994), herpes simplex (Johnson, 1964) and large protein complexes
(Thorne et al., 1995) can enter the OB via axonal transport through olfactory receptor
neurons (Mori et al., 2005). Axonal transport would allow influenza virus to move a
distance of about 8 mm in 4 h assuming the transport speed is similar to that of herpes
virus (Maratou et al., 1998); the length of the olfactory receptor axons in the mouse is
likely to be less than 8 mm and thus this pathway may be relevant to our observations.
Axonal transport would be consistent with the dense localization of viral antigen in the
GL (Figure 2.3B) where the first synapse of olfactory neurons takes place.
The olfactory epithelial pathway is relevant when a virus enters into the nasal lamina
propria (Dahlin et al., 2000). From this tissue layer the virus can enter the perineural
space of nerves projecting to the subarachnoid space of the OB and other regions of the
brain. Herpes virus can use both axonal transport and perineural transport simultaneously
(Johnson, 1964).
A newly discovered route to the GL, which has been demonstrated to permit passive
transport of ultrafine carbon particulates in the size range (100 nm) of viruses
(Oberdorster et al., 2004), are the channels formed by a fibroblastic sheath surrounding
the network of olfactory ensheathing cells that wrap olfactory nerve fascicles (Li et al.,
61

2005). Transport of carbon particles to the OB via these channels was detected as early
as day 1 post challenge (Oberdorster et al., 2004). Viruses have not yet been
demonstrated to enter the brain via these channels.
The model that we have constructed based on these observations is as follows: Virus
enters the upper nasal cavity and binds to the olfactory receptor dendritic cilia that
probably bear the sialic acid viral receptor (Allen and Akeson, 1985); the virus is then
rapidly taken up by the olfactory receptor neurons by endocytosis and is transported by
axonal flow to the glomeruli, where the axon terminates in a synapse. Virions and/or viral
proteins detected by our mouse H1N1 and NP antibodies as well as viral RNA are
released into the synaptic cleft, perhaps by exocytosis. After release into the extracellular
environment, these viral products are taken up by resident microglia or other glial cells.
The glial cells are thus activated to produce cytokines such as IL1β in response to viral
RNA, which in turn initiate the APR by acting upon the hypothalamus. Investigations are
ongoing to resolve all involved cell types, the cytokines induced in them, and the other
suppositions underlying this model.
Our studies have not yet examined whether PR8 influenza virus can be detected
within the trigeminal nerve, vagus nerve or other demonstrated routes of viral nerve
transport from the respiratory system (Johnson and Mims, 1968; Park et al., 2002). Some
neurotropic viruses are selective as to which nerves are employed for transport [for
instance, CNS invasion by mouse hepatitis virus is restricted to the olfactory nerve
(Barnett et al., 1993)] where other viruses such as the herpes viruses may employ
numerous nerves to invade the CNS (Barnett et al., 1993).
62
While conclusive studies of the route of PR8 transport to the OB will require a more
extensive time series and finer resolution of virus, our observations suggest that PR8 can
be considered neurotropic but not progressively neurovirulent. This conclusion is
compatible with the absence of neuropathology seen by Iwasaki et al. in PR8 infected
mice (Iwasaki et al., 2004) and the general lack of neurological symptoms observed in
mice infected IN with PR8. Cytokines such as those that we detect by qPCR are likely to
be induced by the viral RNA [single-stranded and/or double-stranded (Diebold et al.,
2004)] that we detect in the OB by both nPCR and qPCR. Neural pathways from the OB
to the hypothalamus (Aronsson et al., 2003) could conceivably result in OB-synthesized
cytokines activating the hypothalamus to induce the viral APR in the absence of actual
hypothalamic infection or the action of cytokines made in the respiratory tree.
Because we detect viral RNA in the OB by 4 hr, the signal we detect is likely to
derive from input virus. Therefore, a functional Mx enzyme that inhibits influenza virus
replication (Haller et al., 1980) is not present in our mice (or most inbred strains) and is
unlikely to affect OB invasion, although its absence may affect cytokine induction and
viral replication. Similarly, the NS1 gene that blocks IFN induction (Garcia-Sastre et al.,
1998b), which is present in both viral strains that we have used, would not be expected to
affect passive viral invasion although it also may affect cytokine induction and viral
replication. Pre-existing antibody may also inhibit CNS invasion. The effects of these
viral and host factors on viral invasion of the OB are under investigation.
Clearly the vast majority of human influenza infections or live virus vaccinations do
not lead to clinical neuropathology, and if the virus routinely invades the human brain,
the brain’s defense mechanisms (and/or influenza’s replication properties in neural
63
tissues) nearly always eliminates progressive infection. Perhaps the most intriguing
possibility raised by these findings is that the severe systemic symptoms associated with
pandemic influenzal infections may reflect direct cytokine induction in the brain resulting
from viral invasion via nerves, rather than, or in addition to, localized cytokine induction
in the respiratory tree. Closer scrutiny of the brain following IN infections with viruses
not known to be neurotropic may help us to better understand systemic viral illness.
In summary, in these studies we have demonstrated influenza viral RNA in
extrapulmonary tissues of mature mice, including the intact OB, as early as 4 hr PI
following IN infection. Viral RNA expression in the OB was accompanied by cytokine
induction as early as 7 hr PI. Detection of the NP plus strand in many samples suggested
that virus is undergoing at least partial replication in the OB. IHC methods indicated that
viral antigen is primarily localized to the olfactory nerve and glomerular layers of the
OB, probably in glial cells, at 15 hr PI. Anesthesia was not required for viral invasion of
the OB, and all boiled-virus controls were negative for viral RNA and cytokine mRNA
expression. Our basic observations were confirmed using two viral strains, primers for
two different viral genes, three distinct RT-PCR methodologies, and two distinct virus-
specific monoclonal antibodies over the course of these studies. Thus, we have
demonstrated rapid invasion of the brain by mouse-adapted influenza virus, apparently
via olfactory nerves. Determining the relevance of these findings to human influenza
encephalopathy/encephalitis or influenza symptoms will require examination of
appropriate clinical specimens using virus-detection techniques of comparable sensitivity.
64

References
Allen, W., Akeson, R (1985). Identification of a cell surface glycoprotein family of olfactory receptor neurons with a monoclonal antibody. J Neurosci. 5, 284-296.
Aronsson, F., Robertson, B., Ljunggren, H., Kristensson, K (2003). Invasion and persistence of the neuroadapted influenza virus A/WSN/33 in the mouse olfactory system. Viral Immunol. 16, 415-423.
Banks, W (2004). Are the extracellular pathways a conduit for the delivery of therapeutics to the brain? Curr Pharmaceut Design. 10, 1365-1370.
Barnett, E., Cassell, M., Perlman, S (1993). Two neurotropic viruses, herpes simplex virus type 1 and mouse hepatitis virus, spread along different neural pathways from the main olfactory bulb. Neurosci. 57, 1007-1025.
Barnett, E., Perlman, S (1993). The olfactory nerve and not the trigeminal nerve is the major site of CNS entry for mouse hepatitis virus, strain JHM. Virol. 194, 185-191.
Bohnet, S., Traynor, T., Majde, J., Kacsoh, B., Krueger, J (2004). Mice deficient in the interferon type I receptor have reduced REM sleep and altered hypothalamic hypocretin, prolactin and 2',5'-oligoadenylate synthase expression. Brain Res. 1027, 117-125.
Bussfeld, D., Kaufmann, A., Meyer, R., Gemsa, D., Sprenger, H (1998). Differential mononuclear leukocyte attracting chemokine production after stimulation with active and inactivated influenza A virus. Cell Immunol. 186, 1-7.
Chen, L., Duricka, D., Nelson, S., Mukherjee, S., Bohnet, S., Taishi, P., Majde, J., Krueger, J (2004). Influenza virus-induced sleep responses in mice with targeted disruptions in neuronal or inducible nitric oxide synthases. J Appl Physiol. 97, 17-28.
Churchill, L., Yasuda, K., Yasuda, T., Blindheim, K., Falter, M., Garcia-Garcia, F., Krueger, J (2005). Unilateral cortical application of tumor necrosis factor α induces asymmetry in Fos- and interleukin-1β-immunoreactive cells within the corticothalamic projection. Brain Res 1055: 15-24.
Conn, C., McClellan, J., Maassab, H., Smitka, C., Majde, J., Kluger, M (1995). Cytokines and the acute phase response to influenza virus in mice. Am J Physiol. 268, R78-R84.
Cooper, J., Carcelen, R., Culbreth, R (1996). Effects of influenza A nucleoprotein on polymorphonuclear neutrophil function. J Infect Dis. 173, 279-284.
Dahlin, M., Bergman, U., Jansson, B., Bjork, E., Brittebo, E (2000). Transfer of dopamine in the olfactory pathway following nasal administration in mice. Pharmaceut Res. 17, 737-742.
65

Diebold, S., Kaisho, T., Hemmi, H., Akira, S., Reis e Sousa, C (2004). Innate antiviral responses by means of TLR7-mediated recognition of single-stranded RNA. Science, 303, 1529-1531.
Fang, J., Sanborn, C., Renegar, K., Majde, J., Krueger, J (1995). Influenza viral infections enhance sleep in mice. Proc Soc Exp Biol Med. 210, 242-252.
Frankova, V., Rychterova, V (1975). Inhalatory infection of mice with influenza A0/PR8 virus. II. Detection of the virus in the blood and extrapulmonary organs. Acta Virologica, 19, 35-40.
Fujimoto, S., Kobayashi, M., Uemura, O., Iwasa, M., Ando, T., Katoh, T., Nakamura, C., Maki, N., Togari, H., Wada, Y (1998). PCR on cerebrospinal fluid to show influenza-associated acute encephalopathy or encephalitis. Lancet, 352: 873-875.
Garcia-Sastre, A., Durbin, R., Zheng, H., Palese, P., Gertner, R., Levy, D., Durbin, J (1998a). The role of interferon in influenza virus tissue tropism. J Virol. 72, 8550-8558.
Garcia-Sastre, A., Egorov, A., Matassov, D., Brandt, S., Levy, D., Durbin, J., Palese, P., Muster, T (1998b). Influenza A virus lacking the NS1 gene replicates in interferon-deficient systems. Virol. 252, 324-330.
Haller, O., Arnheiter, H., Lindenmann, J. Gresser, I (1980). Host gene influences sensitivity to interferon action selectively for influenza virus. Nature, 283, 660-662.
Hoffman-Goetz, L., Keir, R (1985). Fever and survival in aged mice after endotoxin challenge. J Gerontol. 40, 15-22.
Huneycutt, B., Plakhov, I., Shusterman, Z., Bartido, S., Huang, A., Reiss, C., Aoki, C (1994). Distribution of vesicular stomatitis virus proteins in the brains of BALB/c mice following intranasal inoculation: an immunohistochemical analysis. Brain Res. 635, 81-95.
Ishida, N., Kosaka, Y., Sasaki, H (1959). Studies on experimental influenza in mice. III. Early distribution of 32P labeled virus in organs of mice after administration from three different routes. J Exp Med. 71, 163-170.
Iwasaki, T., Itamura, S., Nishimura, H., Sato, Y., Tashiro, M., Hashikawa, T., Kurata, T (2004). Productive infection in the murine central nervous system with avian influenza virus A (H5N1) after intranasal inoculation. Acta Neuropathol (Berl). 108, 485-492.
Johnson, R., Mims, C (1968). Pathogenesis of viral infections of the nervous system. N Engl J Med. 278, 23-30.
Johnson, R (1964). The pathogenesis of herpes virus encephalites: I. Virus pathways to the nervous system of suckling mice demonstrated by fluorescent antibody staining. J Exp Med. 119, 343-356.
66

Kristensson, K (2006). Avian influenza and the brain--Comments on the occasion of resurrection of the Spanish flu virus. Brain Res Bull. 68, 406-413.
Lee, K., Youn, J., Kim, H., Seong, B (2001). Identification and characterization of mutations in the high growth vaccine strain of influenza virus. Arch Virol. 146, 369-377.
Li, Y., Field, P., Raisman, G (2005). Olfactory ensheathing cells and olfactory nerve fibroblasts maintain continuous open channels for regrowth of olfactory nerve fibres. Glia, 52, 245-251.
Maines, T., Lu, X., Erb, S., Edwards, L., Guarner, J., Greer, P., Nguyen, D., Szretter, K., Chen, L., Thawatsupha, P., Chittaganpitch, M., Waicharoen, S., Nguyen, D., Nguyen, T., Nguyen, H., Kim, J., Hoang, L., Kang, C., Phuong, L., Lim, W., Zaki, S., Donis, R., Cox, N., Katz, J., Tumpey, T (2005). Avian influenza (H5N1) viruses isolated from humans in Asia in 2004 exhibit increased virulence in mammals. J Virol. 79, 11788-11800.
Maratou, E., Theophilidis, G., Arsenakis, M (1998). Axonal transport of herpes simplex virus-1 in an in vitro model based on the isolated sciatic nerve of the frog Rana ridibunda. J Neurosci Methods, 79, 75-78.
Maricich, S., Neul, J., Lotze, T., Cazacu, A., Uyeki, T., Demmler, G., Clark, G (2004). Neurologic complications associated with influenza A in children during the 2003-2004 influenza season in Houston, Texas. Pediatrics, 114, e626-e633.
Mori, I., Komatsu, T., Takeuchi, K., Nakakuki, K., Sudo, M., Kimura, Y (1995).Viremia induced by influenza virus. Microb Pathogen. 19, 237-244.
Mori, I., Nishiyama, Y., Yokochi, T., Kimura, Y (2005). Olfactory transmission of neurotropic viruses. J Neurovirol, 11, 129-137.
Newland, J., Laurich, V., Rosenquist, A., Heydon, K., Licht, D., Keren, R., Zaoutis, T., Watson, B., Hodinka, R., Coffin, S (2007). Neurologic complications in children hospitalized with influenza: Characteristics, incidence, and risk factors. J Pediatr. 150, 306-310.
Oberdorster, G., Sharp, Z., Atudorei, V., Elder, A., Gelein, R., Kreyling, W., Cox, C (2004). Translocation of inhaled ultrafine particles to the brain. Inhalation Tox. 16, 437-445.
Park, C., Ishinaka, M., Takada, A., Kida, H., Kimura, T., Ochiai, K., Umemura, T (2002). The invasion routes of neurovirulent A/Hong Kong/483/97 (H5N1) influenza virus into the central nervous system after respiratory infection in mice. Arch Virol, 147, 1425-1436.
67

Price, G., Gaszewska-Mastarlarz, A., Moskophidis, D (2000).The role of alpha/beta and gamma interferons in development of immunity to influenza A virus in mice. J Virol. 74, 3996-4003.
Rantalaiho, T., Farkkila, M., Vaheri, A., Koskiniemi, M (2001). Acute encephalitis from 1967 to 1991. J Neurol Sci. 184, 169-177.
Romero, J., Newland, J (2003). Viral meningitis and encephalitis: traditional and emerging viral agents. Semin Pediatr Infect Dis. 14, 72-82.
Schlesinger, R., Husak, P., Bradshaw, G., Panayotov, P (1998). Mechanisms involved in natural and experimental neuropathogenicity of influenza viruses: evidence and speculation. Adv Virus Res. 50, 289-379.
Stanley, E., Jackson, G (1966). Viremia in Asian influenza. Trans Assoc Am Physicians, 79, 376-387.
Steininger, C., Popow-Kraupp, T., Laferl, H., Seiser, A., Godl, I., Djamshidian, S., Puchhammer-Stockl., E (2003). Acute encephalopathy associated with influenza A virus infection. Clin Infect Dis. 36, 567-574.
Sugaya, N (2002). Influenza-associated encephalopathy in Japan. Sem Pediat Infect Dis. 13, 79-84.
Tanaka, H., Park, C., Ninomiya, A., Ozaki, H., Takada, A., Umemura, T., Kida, H (2003). Neurotropism of the 1997 Hong Kong H5N1 influenza virus in mice. Vet Microbiol. 95, 1-13.
Thorne, R., Emory, C., Ala, T., Frey, W (1995). Quantitative analysis of the olfactory pathway for drug delivery to the brain. Brain Res. 692, 278-282.
Traynor, T., Majde, J., Bohnet, S., Krueger, J (2004). Intratracheal double-stranded RNA plus interferon-gamma: A model for analysis of the acute phase response to respiratory viral infections. Life Sci. 74, 2563-2576.
Wang, Y., Huang, Y., Chang, L., Kao, H., Lin, P. Huang, C., Lin, T (2003). Clinical characteristics of children with influenza A virus infection requiring hospitalization. J Microbiol Immunol Infection, 36, 111-116.
Ward, A (1996). Neurovirulence of influenza A virus. J Neurovirol. 2, 139-151.
Weitkamp, J., Spring, M., Brogan, T., Moses, H., Bloch, K., Wright, P (2004). Influenza A virus-associated acute necrotizing encephalopathy in the United States. Pediatr Infect Dis J. 23, 259-263.
Wong, J., Saravolac, E., Clement, J., Nagata, L (1997). Development of a murine hypothermia model for study of respiratory tract influenza virus infection. Lab Anim Sci, 47, 143-147.
68

Table 2.1 Frequency of NP Detection by nPCR in Olfactory Bulbs Using Different
Anesthesia Protocols
Hours Post-
Infection of
Tissue
Harvest
Anesthesia
Used
Boiled PR8
Minus Strand
# Positive/
# Mice Tested
Boiled PR8
Plus Strand
# Positive/
# Mice Tested
Live PR8
Minus Strand
# Positive/
# Mice Tested
Live PR8
Plus Strand
# Positive/
# Mice Tested
4 INH 0/6 0/6 6/6 6/6
7 INH 0/6 0/6 6/6 5/6
15 INH 0/6 0/6 6/6 2/6
4 IP 0/6 0/6 3/6 0/6
7 IP 0/4 0/4 3/4* 2/4*
15 IP 0/6 0/6 6/6 3/6
7 None 0/6 0/6 5/6* 4/6*
Data show the frequency of detection of minus or plus strand NP RNA using Method 2 in
olfactory bulbs harvested at 4, 7 or 15 h post-infection using either Metofane inhalation
anesthesia (INH), intraperitoneal ketamine/xylazine anesthesia (IP) or no anesthesia
(None). Boiled virus columns represent control mice, while live PR8 columns represent
infected mice. Ratios marked with an asterisk (*) indicate that a single mouse was
negative for both minus and plus strands.
69

Table 2.2 Comparison of Frequency of PR8 NP Detection in Various Tissues Using
Method 1 or Method 2 nPCR
Hours Post-
Infection of
Tissue
Harvest
Tissue
Sampled
Method 1
Minus Strand
Method 1
Plus Strand
Method 2
Minus Strand
Method 2
Plus Strand
4 h Spleen 1/6 0/6 0/6 0/6
7 h Spleen 0/4 0/4 0/4 0/4
15 h Spleen 2/6 4/6 1/6 0/6
4 h Blood 2/3* 2/3* 0/6 0/6
7 h Blood 3/6 3/6 0/6 0/6
15 h Blood 2/3* 2/3* 0/6 0/6
4 h OB 6/6 2/6 3/6 0/6
7 h OB 3/4 3/4 3/4 2/4
15 h OB 6/6 2/6 6/6 3/6
4 h SCtx ND† ND 1/6 0/6
7 h SCtx ND ND 0/4 0/4
15 h SCtx ND ND 0/6 0/6
70

Data compare the frequency of detection of minus or plus strand NP RNA using either
Method 1 or Method 2 nPCR on the same cDNA samples from various tissues [spleen,
blood, olfactory bulb (OB) or somatosensory cortex (SCtx)] harvested at 4, 7 or 15 h
post-infection using intraperitoneal ketamine/xylazine anesthesia . All mice were
challenged with live PR8. Ratios marked with an asterisk (*) indicate that inadequate
cDNA was available from 3 of the mice to repeat with Method 1. † ND--Not done
71

Table 2.3 Primer Sequences for RT-PCR and nPCR Analysis
Gene Product
Size (bp)
Bases
Spanned Sequence 5’-3’ Refs.
HA Sense 524 1-31 ACGCATCAATGCATGAGTGTAACACGA AGTG
Lab§
HA Anti-sense 1366-1400 GATTCTTCACATTTGAGTCATGGA AAT CCAGAGTC
Lab§
NP1 Sense* 1097 301-320 GGGAAAGATCCTAAGAAAAC (Mori
et al.,
NP2 Anti-sense* 1398-1379 TGCACTTTCCATCATCCTTA (Mori
et al.,
NP3 Sense† 450 649-668 AATGATCGGAACTTCTGGAG (Mori
et al.,
NP4 Anti-sense† 1098-1079 CTTCGTCCCTTTGATGAAGC (Mori
et al.,
NP5 Sense‡ 98 669-688 GGGTGAGAATGGACGAAAAA Lab§
NP6 Anti-sense‡ 764-745 TCCATCATTGCTTTTTGTGC Lab§
NP 5’ terminus
sense 1570 1-20 CCAGCAAAAGCAGGGTAGATAA Lab§
NP 3’ terminus
anti-sense 1546-1565 CCCAGTAGAAACAAGGGTATTTT Lab§
Cyclophilin A
Sense 430 90-113 GTCTCCTTCGAGCTGTTTGCAGAC Lab§
Cyclophilin A
Anti-sense 497-519 GTCCACAGTCGGAGATGGTGATC Lab§
*PR8 NP primers used for cDNA synthesis for RT-PCR and first step (external) nPCR
72

†PR8 NP primers used for second step (internal) nPCR
‡PR8 NP primers used for qPCR
§Primers developed in our laboratory using the criteria described in Materials and
Methods
73

Figure 2.1 Body temperature curves of mice (n = 6) unexposed to virus
(baseline) or infected IN with 2.5 x 10⁶ TCID50 PR8 influenza virus under Metofane.
Error bars denote SEM.
74

Cytokine and IFN-Induced Enzyme Expression
4h 7h 15h 4h 7h 15
h 4h 7h 15h 4h 7h 15
h0
5
10
15
20
25
30
35
40
45
50
55
*
*
*
**
*
**
IL1β TNFα OAS1a Mx1
Fold
-Incr
ease
Figure 2.2 Olfactory bulb cytokine and IFN-induced enzyme mRNA qPCR data from 3
experiments (corrected for boiled virus control values) at 4 hr (n = 6), 7 hr (n = 11) and
15 hr (n = 15). All mice were inoculated IN with 2.5 x 10⁶ TCID50 PR8 under Metofane
anesthesia. The X axis shows the cytokine/enzyme evaluated and the time-point at which
the mouse was killed PI. Error bars denote SEM. Asterisks denote statistically
significant differences (* p < 0.05; ** p < 0.001).
75

76

Figure 2.3 Photomicrographs of OB coronal sections from mice killed 15 hr PI after IN
challenge stained either for H1N1 influenza A (frames A-D) or for N1 NP (frames E-H).
Mice receiving boiled virus are shown in frames A, B, E, and F. Mice receiving live PR8
are shown in frames C, D, G and H. Arrows in frames C, D, G and H indicate some of
the stained cells in the GL while arrow heads point to some of the stained cells in the ON
layer. The scale bar for lower magnification pictures (frames A, C, E and G) is 0.2 mm;
for higher magnification pictures (frames B, D, F and H) the scale bar is 0.025 mm.
(Abbreviations: M, mitral cell layer; EPL, external plexiform layer; GL, glomerular layer;
ON, olfactory nerve.)
77

CHAPTER III
INFLUENZA VIRUS AND CYTOKINE-IMMUNOREACTIVE CELLS IN
THE MURINE OLFACTORY BULB AFTER INTRANASAL INOCULATION
Victor H. Leyva-Grado, Lynn Churchill, Melissa Wu, Jeannine A. Majde and James
M. Krueger
Department of Veterinary and Comparative Anatomy, Pharmacology and Physiology,
Washington State University, Pullman, WA 99164
78

Abstract
We previously demonstrated that viral RNA and cytokine mRNAs are elevated in the
olfactory bulb (OB) by the time of illness onset (15 h post intranasal challenge) in mice
infected with influenza virus. The human viral strain used in these studies is not
neurovirulent or known to invade the brain. In this study, we mapped expression of
cytokine and viral antigens in infected and boiled virus control mouse OBs obtained 15 h
post inoculation using immunohistochemistry. Influenza viral antigen-immunoreactive
(IR) cells were found in the olfactory nerve and glomerular layer (GL) and to a lesser
extent in the external plexiform layer (EPL) of the OB. Double labeling demonstrated
that viral antigen co-localized with a macrophage marker, F4/80, and an astrocyte
marker, GFAP, but not with a neuronal nuclear protein, NeuN. In controls and virus-
infected mice, cells expressing tumor necrosis factor alpha (TNFα) or interleukin-1 beta
(IL1β) immunoreactivity were detected in the GL, EPL and mitral cell layer (ML). TNFα
immunoreactivity co-localized with NeuN-IR cells while IL1β immunoreactivity co-
localized with GFAP-IR and F4/80-IR as well as with NeuN-IR cells. The number of
TNFα-IR neuron-like cells increased in the EPL and the ML of infected mice, and the
number of IL1β-IR neuron-like cells increased in the EPL of infected mice compared to
controls that received boiled virus. These results demonstrate that influenza viral antigens
are localized in glia within the OB and that TNFα and IL1β are up-regulated in glia
and/or neurons of live influenza virus-exposed mice at 15 h post intranasal infection.
79

Introduction
The only mucosal surface where neurons are in direct contact with the environment is
the olfactory epithelium lining the nasal cavities (Mori et al., 2005). These exposed
olfactory neurons, protected only by a layer of mucus, provide a potential pathway for
microorganisms to infect the brain. In fact, the olfactory nerve pathway is a route for
central nervous system (CNS) invasion by various neurotropic viruses (Reiss et al., 1998;
Iwasaki et al., 2004; Mori et al., 2005), including neurotropic strains of the avian
influenza virus (Reinacher et al., 1983; Mori et al., 1995; Park et al., 2002). In contrast,
non-neurotropic human strains of influenza virus are believed to be confined to the
respiratory tract following intranasal (IN) infection (Ward, 1997).
The mouse-adapted human strain of influenza A (A/Puerto Rico/8/34, H1N1,
abbreviated PR8) has no known neurotropic properties in adult mice as determined by
immunofluorescence (Johnson and Mims, 1968; Schlesinger et al., 1998) and histological
methods (Iwasaki et al., 2004), although virus can be demonstrated in the brain by
sensitive molecular methods five days post IN infection (Mori et al., 1995). If PR8 is
directly inoculated into the brain it is neurovirulent in neonatal mice but not in
immunologically mature mice (Schlesinger et al., 1998). Nonetheless, the PR8-mouse
model remains a useful model for studying influenza virus-induced, cytokine-induced
acute phase response (Conn et al., 1995; Hennet et al., 1992). In recent studies (Majde et
al., 2007), we demonstrated the presence of PR8 replication intermediates (both minus
and plus viral RNA strands) in the olfactory bulb (OB) within 4 h after IN inoculation in
adult mice. These unexpected results indicate that this mouse-adapted human strain of
80

influenza virus is able to rapidly reach the CNS and at least partially replicate within the
OB. Moreover, after PR8 infection, transcripts for pro-inflammatory cytokines such as
interleukin 1β (IL1β) and tumor necrosis factor-α (TNFα) were also significantly up-
regulated in the OB within 15 h after IN inoculation with live virus, the time-frame for
onset of hypothermia in these mice (Majde et al., 2007). In contrast, viral RNA was not
detected in OBs collected from mice inoculated IN with boiled PR8. Collectively, these
data indicate that after IN inoculation live PR8 influenza virus rapidly reached the OB
and increased cytokine mRNA levels, although the cell types harboring the virus and
producing the cytokines remain to be determined.
Cytokines are hypothesized to be responsible in part for the systemic symptoms
comprising the acute phase response (APR), or ‘flu’ syndrome, observed in influenza
infections (Conn et al., 1995). These symptoms include changes in body temperature,
locomotor activity and sleep patterns (Conn et al., 1995; Fang et al., 1995; Toth et al.,
1995; Opp, 2005). Cytokines such as TNFα and IL1β are directly involved in the
systemic inflammatory response (Dinarello, 2000) and in associated constitutional
symptoms (Majde and Krueger, 2005). Production of cytokines is also part of the mouse
immune response against influenza virus infections. Studies using type I IL1 receptor-
deficient mice infected with influenza virus demonstrate that an IL1-related ligand for
this receptor is necessary to increase the survival rate in infected mice (Schmitz et al.,
2005). Using IL1β- and IL6-deficient mice also demonstrates a role for these cytokines
in the APR to PR8 influenza virus infection (Kozak et al., 1995; Kozak et al., 1997). In
mice infected IN with PR8, levels of mRNA for IL1β and TNFα are upregulated in the
lung and the hypothalamus (HT) 38 h after inoculation (Alt et al., 2007). Additionally,
81

an increase in the serum of IL1α and antiviral activity (perhaps type I IFN) occurs in
mice infected IN with influenza (Kurokawa et al., 1996). IN infection results in viral
replication in the upper and lower respiratory tract that is accompanied by an increase in
cytokine production, including TNFα, IL1α, IL1β, IL6, and IFNγ (Hennet et al., 1992;
Conn et al., 1995). However, it remains to be established whether the cytokines that act
on the brain to induce the APR are produced in the brain or if they are made systemically
and then reach the brain through the blood or other routes. Both mechanisms may be
involved (Hopkins, 2007).
To better understand the pathophysiology of the APR, in this study we determined the
type of cells involved using immunohistochemistry (IHC) of the OBs of immunologically
mature C57BL/6 male mice taken 15 h after IN inoculation with live or boiled PR8 virus.
Quantitative analyses of the number of cytokine-immunoreactive (IR) cells in different
layers of the OB (GL, EPL and ML) were performed to determine if viral infection
increased the number of IL1β- or TNFα-IR cells compared to boiled virus controls.
Using double labeling with cell type markers and cell morphology we determined which
cell types in the OB expressed viral or cytokine antigens.
82
Material and Methods
Animals
Twelve C57BL/6 male mice were purchased from Jackson Laboratories (Bar Harbor,
ME) at 4-6 weeks of age and quarantined. They were used in the experiments when they
were 8-12 weeks of age. After arrival, animals were housed in 48 x 25 x 16 cm
polypropylene cages with filter tops to minimize intercurrent infections. Food and water
were provided ad libitum. Mice were maintained on a 12:12 h light:dark cycle at an
ambient temperature of 24° ± 1° C. Institutional guidelines for the care and use of
research animals were followed and protocols were approved by the Washington State
University Institutional Animal Care and Use Committee.
Virus
Influenza (A/Puerto Rico/8/34, H1N1) virus was supplied by Specific Pathogen-Free
Avian Supply (SPAFAS, North Franklin, CT) where the virus was propagated in specific
pathogen-free (SPF) chicken embryos and allantoic fluid was harvested using pyrogen-
free materials. The virus was purified by sucrose-gradient sedimentation using pyrogen-
free materials and the stock was tested for endotoxin and mycoplasma (negative), and
titered in Madin Darby canine kidney cells as previously described (Chen et al., 2004).
IN inoculation procedure
Mice were inoculated at light onset. The mice (n=12) were inoculated IN by
delivering 25 μl to each nostril using a 100 µl micropipette under light methoxyflurane
83

(Metofane, Schering-Plough Animal Health, Union, NJ) inhalation anesthesia. Infected
mice (n=6) received 2.5 x 10⁶ TCID50 purified PR8 diluted in Dulbecco’s phosphate
buffered saline (DPBS). Control mice (n=6) received the same diluted virus that was
heat-inactivated prior to the inoculation by suspending the sample in boiling water for 25
min (boiled virus).
Tissue collection
Mice were returned to their home cages after virus inoculation. At 15 h post-
inoculation under deep Metofane anesthesia the animals were perfused intracardially with
warm saline (0.9% NaCl) containing 0.004% of heparin (Celsus laboratories, Cincinnati
OH) followed by 35 ml of cold 4% paraformaldehyde in phosphate-buffered saline
(PBS). Perfusion was performed using a Masterflex pump model 7014-20 (Cole-Parmer,
USA) using a 21 G needle at a flow rate of 2.0 ml/min. Brains were carefully removed
from the cribriform plate to maintain an intact OB. Brains were placed in ice-cold 4%
phosphate-buffered formaldehyde to post-fix for 6 h, and then were sunk in 20% sucrose
overnight. The OBs were separated from the rest of the brain, frozen in crushed dry ice,
and stored at -80° C until sectioned.
Immunohistochemistry (IHC)
OBs were processed in pairs using OBs from a mouse inoculated with live virus and
OBs from another mouse inoculated with boiled virus. Tissue sections of both sides of
the OB were processed as previously reported (Churchill et al., 2005; Majde et al., 2007).
84

Single labeling for light microscopy (DAB staining)
Adjacent tissue sections were incubated with one of the following antibodies; anti-
influenza A H1N1 virus monoclonal antibody produced in mice (Chemicon International,
Temecula, CA, catalog # MAB8621, dilution 1:100), mouse anti-influenza nucleoprotein
(NP) monoclonal antibody (Chemicon, catalog # MAB8257, dilution 1:100), rabbit anti-
recombinant mouse IL1β (Chemicon, catalog # AB1413, dilution 1:100), goat anti-
recombinant rat TNFα [17 kD secreted form, R&D, Minneapolis MN, catalog # AF-510,
dilution 0.5 μg/ml], and rat anti-mouse F4/80 [a macrophage marker that also stains
microglia in the OB (Mori et al., 2005), Serotec, catalog # MCA497GA, dilution 1:100].
The secondary antibodies were biotinylated horse anti-mouse, anti-rat or anti-goat IgG or
biotinylated goat anti-rabbit IgG (Vector Laboratories, Burlingame, CA, dilution 1:500).
Sections were stained using diaminobenzidine as a chromophore (DAB kit, Vector,
catalog # SK4100).
Antibody specificity
The antibodies used in this experiment have been used in previous experiments and
tested for specificity [McQuillin et al., 1985; Walls et al., 1986 (anti-viral antigens); Mori
et al., 2005; Stichel and Luebbert, 2007 (F4/80 and TNF); Barbe et al., 2003 (IL1]. In
addition, we confirmed IL1β and TNFα antibody specificity by several additional
methods. (1) We omitted the primary antibody during the immunohistochemistry
procedure. (2) Next, pre-absorption experiments were done by overnight incubation of
the primary antibody with its target cytokine recombinant rat TNFα ( R&D systems
catalog # RT-510 ) or recombinant mouse IL1β (R&D systems catalog # 401-ML/CF) at
85

a molar ratio of 1:45 . The primary antibodies were incubated with the appropriate
recombinant protein for 24 h at 4oC. After the incubation the product was centrifuged at
10,000 g for 15 min and the supernatant was used for incubation with sections (Eriksson
et al., 1991). (3) In a third set of specificity experiments, we used OB tissues from non-
infected TNFα knock out (KO) (Jackson Laboratories, stock #: 005540) or IL1β KO
mice (a gift from Dr Kerry O’Banion, University of Rochester) according to the IHC
described in section 2.5.1. (4) Western blot analyses for TNFα and IL1β were performed
as previously described (Szentirmai et al., 2007) using mouse OBs to demonstrate
antibody recognition of the two forms of TNFα and IL1β. Briefly, samples were
homogenized, the homogenates were centrifuged at 10,000 g for 10 min at 4°C, and the
supernatants were collected. Sample protein concentration was determined by the DC
Protein Assay Kit (Pierce, Rockford, IL). Twenty micrograms of total protein was
separated by electrophoresis through a denaturing 4-15% SDS polyacrylamide gel, and
the proteins were transferred to a nitrocellulose membrane. The membranes were blocked
in 5% milk and then bathed in a 1:150 dilution of goat anti-rat TNFα (R&D systems) or
1:1000 dilution of mouse anti-IL1β antibody (Chemicon) in 5% nonfat dry milk/tween
tris-buffered saline (TTBS) overnight at 4°C. After three washes in TTBS, the
nitrocellulose membranes were incubated in either a 1:4,000 dilution of horse anti-goat
HRP conjugated secondary antibody (TNFα) or a 1:4,000 dilution goat anti-rabbit
horseradish peroxidase (HRP) conjugated secondary antibody (IL1β). Immunoreactive
protein was detected by the enhanced chemiluminescence detection reagent (ECL kit)
according to manufacturer's instructions (GE Healthcare Bio-Sciences Corp, Piscataway,
NJ), and bands were visualized by exposure to autoradiographic film Cruz Marker (Santa
86
Cruz Biotechnology, Santa Cruz, CA). Molecular weight standards were used to identify
the molecular weights of the bands. (5) Finally, in previous work using rats and a TNFα
small interfering (si)RNA, we demonstrated that a TNFα siRNA reduced mRNA levels
and TNFα-immunoreactivity in the brain using the same antibody we used for our
experiments (Taishi et al., 2007).
To confirm the specificity of the TNFα antibody used, omission of the primary TNFα
antibody eliminated the immunoreactivity in the OB sections (data not shown). Pre-
absorption of the primary antibody with the recombinant TNFα protein, blocked the
staining in both WT and KO mice (Figures 3.1C and 3.1D). TNFα immunoreactivity
was observed in neuronal-like cells in the OB of TNFα wild-type mice (WT) but not in
the OB of the TNFα-KO mice (Figures 3.1A and 3.1B). Western blot analysis showed a
17 kD band for the recombinant protein (Figure 3.2) and a 26 kD band in the OB protein
extracts; the molecular weight of membrane-associated TNFα is 26 kD (Solomon et al.,
1999).
To confirm the specificity of the IL1β antibody used, OB sections were processed
without the primary IL1β antibody; such sections showed no immunoreactivity. After
pre-absorption with the recombinant protein, the immunoreactivity was greatly reduced
but not completely blocked (Figure 3.3C). IHC for IL1β showed intensely stained IL-1β-
IR cells in the EPL and GL (Figure 3.3A). These IL1β-IR cells were not observed in the
EPL or GL of the OB from the IL1β KO mice (Figure 3.3B). Western blot analyses of
OB protein extracts demonstrated the presence of a 17 kD band for the recombinant
protein and a 37 kD band, which is the molecular weight of pro-IL1 (Deak et al., 2005)
87

(Figure 3.4). Pre-absorption treatment with the respective recombinant protein prior to
Western blot completely eliminated the presence of these bands (Figures 3.2 and 3.4).
Double labeling for confocal microscopy
After immersion in 3% blocking serum [a combination of normal chicken serum
(NCS) and normal donkey serum (NDS)] for 1 h, adjacent sections were incubated with a
mixture of the anti-influenza A H1N1 (Chemicon, 1:100) and F4/80 (Serotec, 1:100) or
rabbit anti-mouse GFAP (an astrocyte marker; Chemicon, catalog # MAB360, dilution
1:1000) antibodies prepared in 2% serum (NDS and NCS) at 4°C for 3 days. For double
labeling with the anti-mouse NeuN nuclear protein-neuronal marker (Chemicon, catalog
# MAB377, dilution 1:1000) we used a polyclonal goat anti-H1N1 antibody (Fitzgerald
Industries International, Inc., Concord, MA, catalog # 20IG23, dilution 1:100). Also,
adjacent sections were incubated in rabbit anti-mouse IL1β (Chemicon, dilution 1:100) in
combination with mouse anti-rat F4/80 (Serotec, dilution 1:100; Serotec), mouse anti-
NeuN (Chemicon, dilution 1:1000) or rabbit anti-mouse GFAP (Chemicon, dilution
1:1000) antibodies. Finally, some OB sections were incubated with goat anti-rat TNFα
(R&D systems, dilution 0.5 μg/ml) and anti-mouse NeuN (Chemicon, dilution 1:1000)
antibodies. After incubation, the samples were washed with PBS and then were
incubated in the dark for 2 h at room temperature with secondary antibodies using a
combination of Alexa Fluor 488 chicken anti-rat (Invitrogen, Carlsbad CA, catalog #
A21470, dilution 1:500), anti-rabbit (catalog # A21441) or anti-goat (catalog # A11055)
plus Alexa Fluor 555 donkey anti-mouse (A31570) for the sections with virus antibodies,
and a combination of Alexa Fluor 488 chicken anti-rat, anti-rabbit or anti-mouse (catalog
88
# A21200) plus Alexa Fluor 568 goat anti-rabbit [catalog # A11011 (for the sections with
the IL1β antibodies)] or donkey anti-goat [catalog # 11057 (for the sections with TNFα
antibodies)]. After incubation the sections were washed and then mounted on gelatin-
coated slides, dried, and cover slipped with fluorescent hard set mounting medium (Vecta
shield, Vector, catalog # H1400).
Image preparation
For DAB sections, images were captured with a Spot camera and software
(Diagnostic Instruments Inc., Sterling Heights MI), in a Leica DMLB microscope, before
being transferred into Adobe Photoshop CS2 (Adobe Systems Inc., San Jose, CA).
Adobe Photoshop was used only for brightness and contrast adjustments to produce the
photographs used in the quantitative analysis. For the fluorescence IHC, double-stained
sections were analyzed using a confocal laser scanning microscope (Zeiss LSM-510,
Oberkochen, Germany) equipped with an AxioCam HR digital camera (Zeiss). Confocal
microscope pictures were taken using the Argon 488 nm laser for Alexa fluor 488 and the
HeNe 543 nm laser for Alexa fluor 568. Single plane with full resolution was used for
each fluorescent channel.
Quantitative analyses
The number of IR-cells was determined using a transparent template with a
rectangular box that measured 0.25 mm by 0.5 mm (TNFα) for photographs taken at 20X
or 0.20 mm by 0.22 mm (IL1 and F4/80) for photographs taken at 40X in 6 different
fields from several sections of the rostral OB. For mitral cell layer (ML) quantification,
89

the rectangle was 0.1 mm by 0.5 mm for the 20X photographs and 0.04 mm by 0.20 mm
for the 40X photographs. The analyzed areas were selected based on preliminary studies
that showed the presence of viral and F4/80-IR cells in the olfactory nerve (ON) and the
GL. Consequently, viral proteins (H1N1 and NP) and F4/80-immunoreactivity were
evaluated in both ON and the GL by photographing every third field of view within these
two layers. Also, preliminary data for the cytokines indicated that cytokine-
immunoreactivity was mainly observed in the GL and the EPL; therefore, 6 fields were
selected from these regions in the OB. The templates were placed over digital images
prepared by photography using the 20X (TNF) or the 40X (IL1) objectives of a Leica
DMLB microscope. An individual blinded to the experiment treatment completed the
quantification. The total number of IR cells was averaged within the 6 different fields for
each mouse and then was statistically analyzed using a paired Student’s t-test. The data
were expressed as mean ± the standard error of the mean. A p-value of 0.05 or less was
considered statistically significant. Additionally, IR-cells were divided according to their
morphology and size into two groups: glial cells [ramified cells between 5-15 microns in
size that showed the immunoreactivity both in the cell body (< 5 microns) and in the
ramifications] or neurons (non-ramified cells or cells with one or two branches between
10-30 microns in size that mainly showed immunoreactivity in the cell body) and then
quantified as above.
90
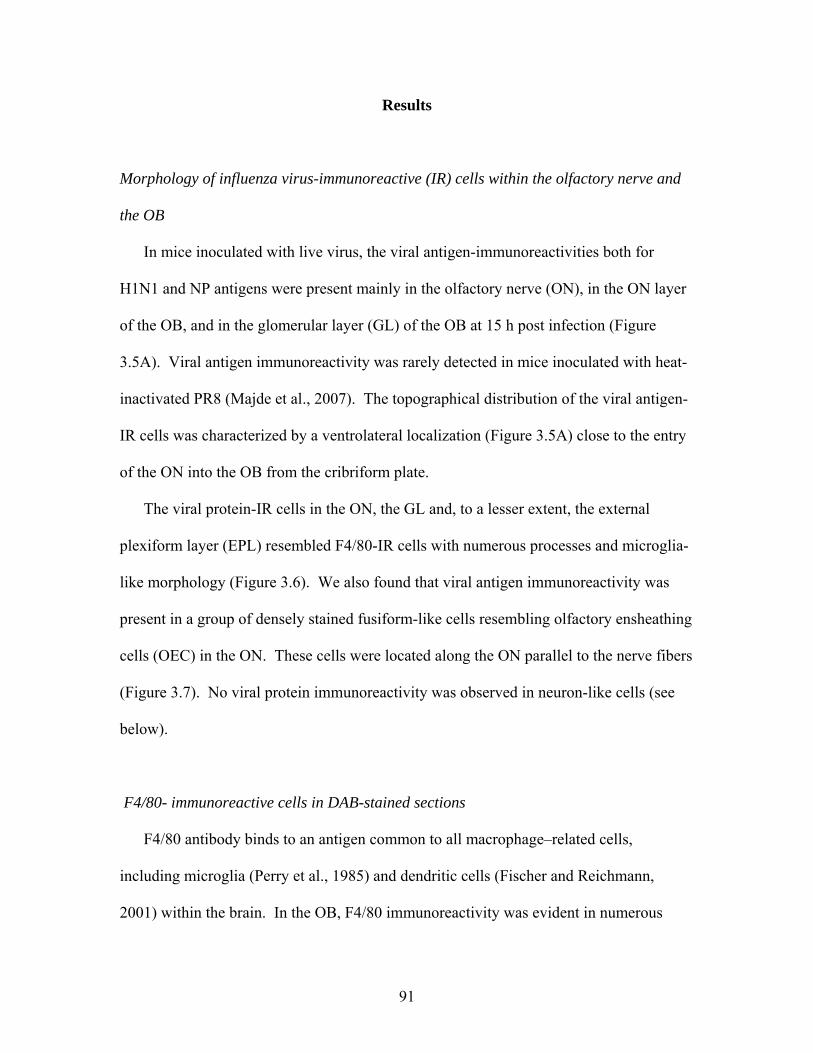
Results
Morphology of influenza virus-immunoreactive (IR) cells within the olfactory nerve and
the OB
In mice inoculated with live virus, the viral antigen-immunoreactivities both for
H1N1 and NP antigens were present mainly in the olfactory nerve (ON), in the ON layer
of the OB, and in the glomerular layer (GL) of the OB at 15 h post infection (Figure
3.5A). Viral antigen immunoreactivity was rarely detected in mice inoculated with heat-
inactivated PR8 (Majde et al., 2007). The topographical distribution of the viral antigen-
IR cells was characterized by a ventrolateral localization (Figure 3.5A) close to the entry
of the ON into the OB from the cribriform plate.
The viral protein-IR cells in the ON, the GL and, to a lesser extent, the external
plexiform layer (EPL) resembled F4/80-IR cells with numerous processes and microglia-
like morphology (Figure 3.6). We also found that viral antigen immunoreactivity was
present in a group of densely stained fusiform-like cells resembling olfactory ensheathing
cells (OEC) in the ON. These cells were located along the ON parallel to the nerve fibers
(Figure 3.7). No viral protein immunoreactivity was observed in neuron-like cells (see
below).
F4/80- immunoreactive cells in DAB-stained sections
F4/80 antibody binds to an antigen common to all macrophage–related cells,
including microglia (Perry et al., 1985) and dendritic cells (Fischer and Reichmann,
2001) within the brain. In the OB, F4/80 immunoreactivity was evident in numerous
91

ramified cells with microglia-like morphology; these cells had a topographic distribution
similar to viral antigen-IR cells (Figure 3.5C). F4/80-IR cells were most densely
distributed in the GL with occasional F4/80-stained cells also seen in the ON layer and
the EPL (Figure 3.5C). The morphology of the F4/80-IR cells in the GL was altered by
the live PR8 infection; the processes were shorter, thicker and more densely stained with
F4/80 antibody (Figures 3.8B and 3.8D) in comparison with F4/80-stained cells in the GL
from the mice inoculated with boiled virus (Figures 3.8A and 3.8C). Further, the cell
bodies of the F4/80-IR cells from the mice inoculated with live virus (Figure 3.8B)
appeared to be more densely stained relative to cell bodies in boiled-virus control cells.
The F4/80-IR cells in the infected mouse OB were morphologically similar to activated
microglia (Perry, 1994). The number of F4/80-IR cells in the GL was not statistically
different at 15 h post inoculation between mice inoculated with live virus (17.4 ± 1.7) and
those inoculated with boiled virus (17.9 ± 2.0, p =0.72). These data suggest that the
microglia-like cells were resident and not migrating into the OB in response to infection.
Co-localization of viral antigen with F4/80 staining using confocal microscopy
H1N1 viral antigen frequently co-localized with the macrophage marker F4/80 within
microglia-like cells in the GL (Figure 3.9A). F4/80 positive cells were also observed in
the ON and EPL layers. However, co-localization of F4/80 antigen with the H1N1 viral
antigen in the ON and EPL layers was not as frequent as within the GL.
92
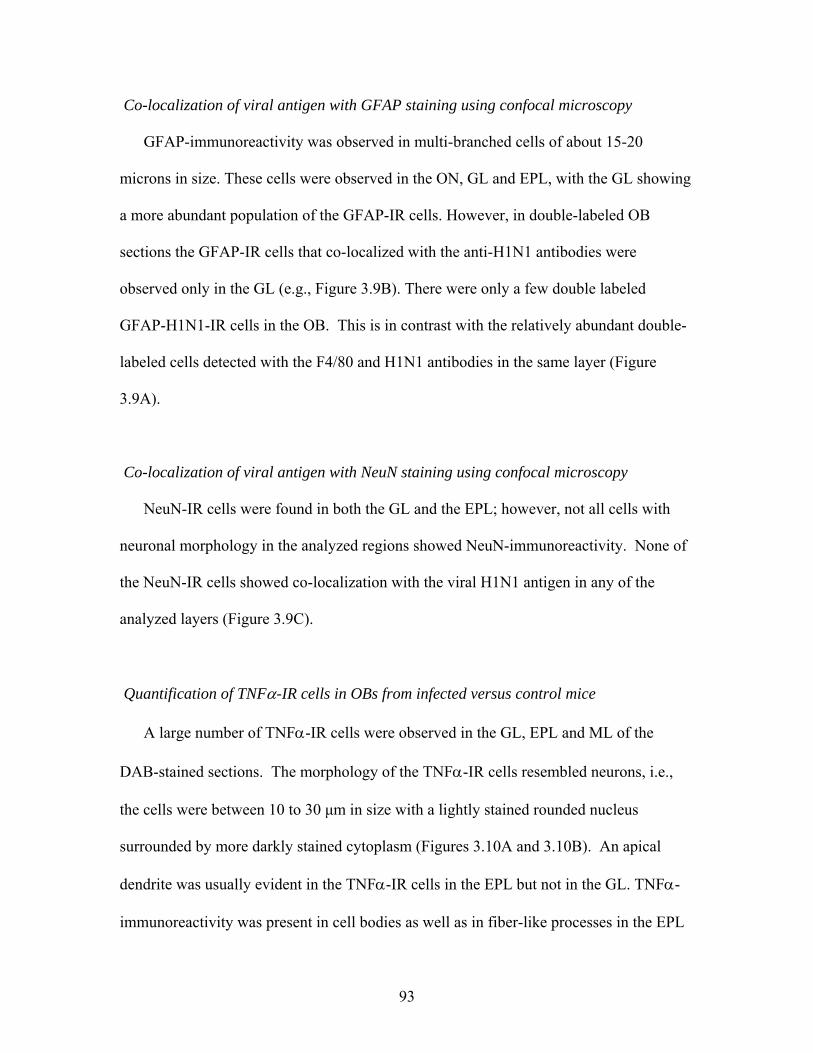
Co-localization of viral antigen with GFAP staining using confocal microscopy
GFAP-immunoreactivity was observed in multi-branched cells of about 15-20
microns in size. These cells were observed in the ON, GL and EPL, with the GL showing
a more abundant population of the GFAP-IR cells. However, in double-labeled OB
sections the GFAP-IR cells that co-localized with the anti-H1N1 antibodies were
observed only in the GL (e.g., Figure 3.9B). There were only a few double labeled
GFAP-H1N1-IR cells in the OB. This is in contrast with the relatively abundant double-
labeled cells detected with the F4/80 and H1N1 antibodies in the same layer (Figure
3.9A).
Co-localization of viral antigen with NeuN staining using confocal microscopy
NeuN-IR cells were found in both the GL and the EPL; however, not all cells with
neuronal morphology in the analyzed regions showed NeuN-immunoreactivity. None of
the NeuN-IR cells showed co-localization with the viral H1N1 antigen in any of the
analyzed layers (Figure 3.9C).
Quantification of TNFα-IR cells in OBs from infected versus control mice
A large number of TNFα-IR cells were observed in the GL, EPL and ML of the
DAB-stained sections. The morphology of the TNFα-IR cells resembled neurons, i.e.,
the cells were between 10 to 30 μm in size with a lightly stained rounded nucleus
surrounded by more darkly stained cytoplasm (Figures 3.10A and 3.10B). An apical
dendrite was usually evident in the TNFα-IR cells in the EPL but not in the GL. TNFα-
immunoreactivity was present in cell bodies as well as in fiber-like processes in the EPL
93

(Figures 3.10C and 3.10D). The morphologies of the TNFα−IR cells were similar in
infected and control mice. There was, however, a significant increase in the number of
TNFα-IR cells in the EPL from live virus-inoculated mice (19.7 ± 1.1) compared with
the same layer in the EPL from boiled virus-inoculated mice (15.7 ± 1.0, p = 0.005)
(Figure 3.11A). In both groups, the TNFα-IR cells were mainly observed in the
superficial one-third of the EPL, adjacent to the GL. TNFα-IR cells in the ML also
increased significantly in mice inoculated with live virus (16.0 ± 1.3) in comparison with
control mice (12.8 ± 1.3, p=0.003) (Figure 3.11A). However, there was no significant
difference in the number of TNFα-IR cells in the GL of mice inoculated with live virus
(34.7 ± 2.4) compared with mice inoculated with boiled virus (33.7 ± 2.2, p=0.23)
(Figure 3.11A). Double labeling of the OB with a combination of anti-TNFα and anti-
NeuN antibodies confirmed that TNRα-immunoreactivity was localized in the cytoplasm
of neurons labeled with NeuN in the nucleus (Figure 3.12A).
Quantification of IL1β-IR cells in OBs from infected versus control mice
IL1β-IR cells were detected in the GL and the EPL. Some IL1β-IR cells
morphologically resembled neurons (as described above for TNFα-IR cells) and glia [i.e.,
ramified cells between 5-15 microns in size that showed several darkly-stained
projections with a small dark nucleus (Figure 3.13)]. There was a significant increase in
the number of IL1β-IR neuron-like cells in the EPL of mice inoculated with live virus
(20.2 ± 1.8) in comparison with mice inoculated with boiled virus (15.8 ± 2.3, p = 0.006)
(Figure 3.11B). Similar to TNFα-immunoreactivity, IL1β-IR neuron-like cells in the
94

EPL were mainly observed in the superficial two-thirds of the EPL. The number of
IL1β-IR neuron-like cells did not significantly change in either the GL (live 42.8 ± 2.5;
boiled 38 ± 4.0; p = 0.072) nor in the ML (live 13.7 ±1.2; boiled 12.3 ± 0.7; p = 0.09)
(Figure 3.11B). The number of IL1β-IR glial-like cells within the various OB layers was
similar in live virus and control groups and consequently significant differences between
the two groups were not found (data not shown). Adjacent sections processed for double
labeling with the cytokine antibody and cell markers confirmed that IL1β-
immunoreactivity co-localized with NeuN (Figure 3.12B) in the GL and EPL and with
GFAP (Figure 3.12C) or F4/80 (data not shown) in the GL.
95

Discussion
The primary result described herein is that in the GL and the EPL glia-like cells,
positive for F4/80-immunoreactivity and GFAP-immunoreactivity, harbor the viral
antigen at 15 h after IN infection with PR8 influenza virus. The majority of these cells
appeared morphologically similar to microglia. Microglia originate from a myeloid
lineage (CD45+ bone marrow precursor) that enters the brain during embryonic
development (Santambrogio et al., 2001). This cell population comprises about 20 % of
all cells in the brain parenchyma and is usually found in a resting state (Hauwel et al.,
2005; Banati, 2003). Microglial cells are considered to be immune-effector cells in the
brain (Guillemin and Brew, 2004) with the capability to clear viruses and virus-infected
cells (Hauwel et al., 2005). Additionally, we found that viral protein-immunoreactivity
also co-localized with the astrocyte marker GFAP, suggesting that these cells also take up
the virus after its entrance into the GL. Similarly, infection of astrocytes has been
demonstrated during West Nile (Diniz et al., 2006) and herpes viral infections (Aravalli
et al., 2006).
F4/80-IR OB cells in mice receiving live virus were morphologically distinct from
those F4/80-IR cells of mice inoculated with boiled virus. The thicker and shorter
processes, as well as the darkly stained cell bodies, suggest that the cells are likely
activated. After viral or bacterial infections microglia are rapidly activated as indicated
by a change in the morphology of the cells as well as the expression of phagocytosis
markers (Kumaraswamy et al., 2006; Lehnardt et al., 2006; Ghoshal et al., 2007; Lemstra
et al., 2007). Morphological changes include an augmentation in the size of cell bodies
96

with thicker processes and darker immuno-staining (Deng et al., 2006) similar to that
reported here. These morphological changes observed during viral infections may be
induced by the accumulation of viral double-stranded (ds)RNA (Guillot et al., 2005) in
the form of replication intermediates and its binding to Toll-like receptor (TLR)3 in
microglia (Town et al., 2006), as discussed below. The number of F4/80-IR cells did not
significantly change after infection with live virus, thereby suggesting that the F4/80-IR
cells were resident microglia and not dendritic cells or macrophages migrating from the
blood (Perry et al., 1985; Deshpande et al., 2007). Microglia-like cells that stain for both
F4/80 and CD11c, a dendritic cell marker, are resident in the brain (Fischer and
Reichmann, 2001; Santambrogio et al., 2001, Bulloch et al., 2008) and are activated
during the process of neuroinflammation (Deshpande et al., 2007) and aging (Stichel and
Luebbert, 2006). Furthermore, the topographical distribution of the viral antigen and
F4/80 immunoreactivity in the region of the OB nearest to the entry site of the ON
resembles the topographical localization of these dendritic cells (Bulloch et al., 2008).
Consequently it is possible that some of the virus-IR cells may in fact be resident
dendritic cells.
The pathway used by PR8 to reach the OB after IN inoculation remains unknown, but
as with other viruses and proteins, may include the axonal transport pathway or the
perineural space pathway (Dahlin et al., 2000). The endings of the olfactory receptor
neurons are located in the nasal olfactory epithelium. These neurons project unbranched
axons to the OB where they synapse with mitral and tufted neurons in specialized
glomeruli located in the GL (Walz et al., 2006). The olfactory receptor neurons express
surface glycoproteins that include D-galactosyl and sialic acid components (Allen and
97

Akeson, 1985). These substances are likely recognition sites for the influenza HA
protein and are necessary to initiate cell infection (Smith, 1951; Steinhauer and Skehel,
2002), suggesting that the olfactory receptor neurons may take up the virus and
translocate it to the OB via axonal transport. Studies with neurotropic viruses such as
mouse hepatitis virus suggest that the ON is necessary for the virus to reach the brain
after IN inoculation (Barnett and Perlman, 1993). However, with our approach we were
unable to observe viral protein-IR in the ON nerve fibers.
On the other hand, we did observe that the viral proteins were present in large ON
fusiform cells resembling olfactory ensheathing cells. These cells wrap the axons of the
olfactory receptor neurons and with the ON fibroblasts form channels that cross the
cribriform plate and terminate in the glomeruli (Li et al., 2005; Vincent et al., 2005).
Recent studies using ultra fine carbon (Oberdorster et al., 2004) or ultra fine manganese
oxide particles (Elder et al., 2006) demonstrated that nanoparticles less than 100 nm in
diameter translocate from the nasal epithelium to the OB using these olfactory
ensheathing cell channels. Further, these nanoparticles induced a local increase in the
OB of TNFα mRNA and protein (Elder et al., 2006). Olfactory ensheathing cells
phagocytize degenerating axons (Li et al., 2005) and are activated by the presence of
bacterial lipopolysaccharide and the synthetic dsRNA, poly I:C, to activate nuclear factor
kappa B (Vincent et al., 2007). Even though there is no direct evidence that viruses
employ olfactory endothelial cell channels after IN inoculation, their size range is similar
to that of the nanoparticles described above. Further, our results showing the presence of
viral protein-immunoreactivity in the putative olfactory ensheathing cells suggest that this
perineural pathway may be involved in the transport of the influenza virus to the OB.
98

Much of our knowledge regarding the expression and distribution of cytokines in the
CNS has been generated with IHC studies (Sweitzer et al., 2001; Mausset-Bonnefont et
al., 2003). However one of the limitations of this technique is antibody specificity and
reproducibility of the staining (Sweitzer et al., 2001). In the present study, we confirmed
the specificity of our antibodies by different tests including the omission of the primary
antibody, preabsorption with specific recombinant cytokines, the use of OB tissue from
TNFα KO and IL1β KO mice, and Western blot analyses. Furthermore, we previously
conducted studies that relied on the nucleic acid sequence of TNFα mRNA to reduce
TNFα protein levels; this procedure also reduced the specific TNFα immunoreactivity in
brain sections using the same antibody that we used for our studies (Taishi et al., 2007).
To address the reproductibility issue of the technique, we paired OBs from mice that
were challenged with boiled or live virus using the same DAB solutions and times of
incubation for each pair. This allowed us to evaluate the number of cells in a semi-
quantitative manner.
The second major finding described herein was the presence of enhanced cytokine–IR
cell numbers after viral challenge. Double labeling showed that cytokines co-localized
with GFAP (IL1β), F4/80 (IL1β) and NeuN (TNFα and IL1β)-IR cells in the OB. Pro-
inflammatory cytokines such as TNFα and IL1β are expressed in microglia and astrocytes
under physiological and pathological conditions (Konsman et al., 2002; Owens et al.,
2005). Consequently, we acknowledge the possibility that cytokines released by glial
cells may be taken up into nearby neurons. However, neurons also produce pro-
inflammatory cytokines in response to pathological conditions and even activate the
microglia to become antigen-presenting cells (Liu et al., 1994; Ohtori et al., 2004; Yang
99

et al., 2004; Figiel and Dzwonek, 2007). Furthermore, our findings of TNFα- and IL1β-
immunoreactivity in neurons confirm prior results demonstrating neuronal expression of
these cytokines (Bandtlow et al., 1990; Breder et al., 1993; Breder et al., 1994;
Ignatowski et al., 1997; Lim and Brunjes, 1999; Gao et al., 2000; Acarin et al., 2000; Ji et
al., 2005; Figiel and Dzwonek, 2006; Mao et al., 2006; Kwon et al., 2008)
The increase in the number of cells expressing TNFα and IL1β proteins in the OB in
response to live virus extends our previous observations of an increase in TNFα and IL1β
mRNAs in the OB (Majde et al., 2007). The differences in distribution of cytokine-IR
cells in the GL, EPL and the ML may represent sequential events within the OB.
Previously, we reported that viral RNA, both minus and plus strand, is strongly expressed
in the OB as early as 4 h post-inoculation, suggesting the virus enters the OB sometime
before 4 h. At 15 h post-inoculation the virus has had time to complete its first
replication cycle (7-8 h) and to complete or nearly complete its second replication cycle
within the OB. The differences in cytokine expression within the OB layers may reflect
the dynamics of virus distribution or that of its dsRNA replication intermediates that we
previously demonstrated (Majde et al., 1998). Additionally, it is likely that the activated
microglia-like cells in the GL release cytokines, which may in turn activate the
production of cytokine proteins in the mitral and tufted cells within the inner layers of the
OB.
Cytokine induction by influenza virus occurs in response to both viral genomic
single-stranded (ss) RNA recognized by TLR7 (Diebold et al., 2004) and viral dsRNA
recognized by TLR3 (Schulz et al., 2005). Viral dsRNA is spontaneously released from
dying influenza virus-infected cells (Majde et al., 1998). Since both glial cells and
100

neurons bear TLR3 (Bsibsi et al., 2002; Jackson et al., 2006), it is possible that the
dsRNA released by dying microglia is activating other glia and neurons to produce
cytokines that, among other functions, activate neighboring cells or cells in distant tissues
to initiate the immune response (Watkins and Maier, 2005). Similarly, in the event that
some influenza particles are degraded in the cytosol by cellular proteases, the viral
ssRNA may interact with the TLR7 to induce cellular activation (Diebold et al., 2004).
Cytokines such as TNFα and IL1β are associated with the APR, including the
induction of sleep and variations in body temperature and motor activity (Kent et al.,
1992; Krueger and Majde, 2003). It has not been established as to whether the APR is
induced by cytokines produced in the brain and/or by cytokines produced in the
periphery. The OB has direct connections with several structures in the brain including
the anterior olfactory nucleus, the piriform cortex, the olfactory tubercle, the taenia tecta,
the amygdala, and the bed nucleus of the stria terminalis (BNST) (Shipley et al., 2004;
Wang and Swann, 2006). Moreover, there are indirect connections between the OB and
hypothalamus through the olfactory tubercle, the taenia tecta, the amygdala and the
BSNT (McGregor et al., 2004; Gelez and Fabre-Nys, 2006). We found that both TNFα-
and IL1β-IR cells in the EPL were located primarily in the superficial two-thirds of the
EPL. This region of the EPL is mainly populated with middle tufted cells. These cells are
morphologically and functionally distinct from mitral cells and project their axons
primarily to the anteromedial regions of the olfactory cortex (Schoenfeld et al., 1985;
Nagayama et al., 2004). The presence of these neuronal connections suggests a route by
which OB cytokines can communicate with the hypothalamus to induce the APR. In fact,
preliminary results showed a significant increase in the number of TNFα-IR and IL1β-IR
101

cells in specific regions of the primary olfactory cortex (piriform cortex and olfactory
tubercle) and central amygdala, and in the number of IL1β-IR cells in the hypothalamus
(arcuate nucleus) of mice 15 h after IN inoculation with live virus (Leyva-Grado et al.,
see Chapter IV). Additional preliminary data showed that transection of the olfactory
nerve delays the onset of IN influenza virus-induced hypothermia by 13 hours (Leyva-
Grado et al., see Chapter IV). These results strengthen the idea that the cytokines
produced by the OB may have an effect on the behavioral and immunological changes
observed in rodents after being challenged IN with an infectious agent.
Previously we showed that mRNA for the interferon-induced enzyme 2’-5’-
oligoadenylate synthetase (OAS) is upregulated in the OB of PR8-IN challenged mice
(Majde et al., 2007). Preliminary IHC studies using brain tissues obtained from the mice
used in this study indicate the presence of OAS-IR cells in the GL and EPL. Further,
there was a significant increase (p< 0.01) in OAS-IR cells in the GL and EPL in cells
resembling glia but not in cells resembling neurons (p>0.1). However, the quality of the
OAS-IHC was insufficient to allow firm conclusions as to the identity of OAS-IR cell
type and changes in OAS-IR cell numbers.
Human influenza strains are not recognized as neurotropic, though influenza-
associated encephalopathies are seen with increasing frequency (Majde et al., 2007).
PR8 infection of mouse embryo brain cell cultures transiently increases
hemagglutinin (HA) and neuraminidase (NA) proteins in both astrocytes and neurons in
vitro (Bradshaw et al., 1989). We were not able to demonstrate the co-localization of
viral proteins within neurons using the neuronal marker NeuN by double labeling.
However, recent studies (Kumar and Buckmaster, 2007; Parrish-Aungst et al., 2007)
102

indicated that the neuronal marker NeuN did not label all OB neurons, leaving open the
possibility that in vivo neurons could take up viral protein and/or virus. Most studies of
H1N1 influenza virus in the brain have used neurovirulent strains, such as WSN, derived
by serial passages in the brain via intracerebral inoculation (Schlesinger et al., 1998).
Although it is generally thought that intracerebral-inoculated PR8 does not replicate in
the brain, all of those studies were conducted using large doses of virus; such doses
promote the formation of incomplete virus ending in an abortive infection (Cairns, 1951).
When lower doses of PR8 are employed, the virus undergoes complete replication in the
brain for one or two cycles (Cairns, 1951). However, there is no evidence indicating that
this strain of influenza is able to replicate in neurons even at low doses. Together, our
results suggest that 15 h after infectious challenge the virus does not localize to neurons
at levels detectable by our methods, although the virus is found in glial cells. These cells
may be the source of the PR8 replication intermediates in the OB reported previously
(Majde et al., 2007). The majority of virus-IR cells were observed in the ON and GL
suggesting that the virus was taken up by glial cells before it could reach the deeper
layers of the OB by 15 h post IN infection.
In conclusion, the results presented here indicate that PR8 influenza virus localizes to
glia and induces the production of pro-inflammatory cytokines in the GL, the EPL and
the ML by neurons and/or glial cells. This response may play a significant role in the
activation of the APR observed during influenza virus infection.
103

References
Acarin, L., González, B., Castellano, B., 2000. Neuronal, astroglial and microglial cytokine expression after an excitotoxic lesion in the immature rat brain. Eur. J. Neurosci. 12, 3505-3520.
Allen, W., Akeson, R., 1985. Identification of a cell surface glycoprotein family of
olfactory receptor neurons with a monoclonal antibody. J. Neurosci. 5, 284-296. Alt, J., Bohnet, S., Taishi, P., Durika, D., Obal, F., Traynor, T., Majde, J., Krueger, J.,
2007. Influenza virus-induced glucocorticoid and hypothalamic and lung cytokine mRNA responses in dwarf lit/lit mice. Brain Behav. Immun. 21, 60-67.
Aravalli, R., Hu, S., Rowen, T., Gekker, G., Lokensgard, J., 2006. Differential apoptotic
signaling in primary glial cells infected with herpes simplex virus 1. J. Neurovirol. 12, 501-510.
Banati, R., 2003. Neuropathological imaging: in vivo detection of glial activation as a
measure of disease and adaptive change in the brain. Brit. Med. Bull. 65, 121-131. Bandtlow, C., Meyer, M., Lindholm, D., Spranger, M., Heumann, R., Thoenen, H., 1990.
Regional and cellular codistribution of interleukin 1β and nerve growth factor mRNA in the adult rat brain: possible relationship to the regulation of nerve growth factor synthesis. J. Cell Biol. 111, 1701-1711.
Barbe, M., Barr, A., Gorzelany, I., Amin, M., Gaughan, J., Safadi, F., 2003. Chronic
repetitive reaching and grasping results in decreased motor performance and widespread tissue responses in a rat model of MSD. J. Orthop. Res. 21, 167-176.
Barnett, E., Perlman, S., 1993. The olfactory nerve and not the trigeminal nerve is the
major site of CNS entry for mouse hepatitis virus, strain JHM. Virology, 194, 185-191.
Bsibsi, M., Ravid, R., Gveric, D., van Noort, J., 2002. Broad expression of Toll-like
receptors in the human central nervous system. J. Neuropathol. Exp. Neurol. 61, 1013-1021.
Bradshaw, G., Schlesinger, R., Schwartz, C., 1989. Effects of cell differentiation on
replication of A/WS/33, WSN, and A/PR/8/34 influenza viruses in mouse brain cell cultures: biological and immunological characterization of products. J. Virol. 63, 1704-1714.
Breder, C., Tsujimoto, M., Terano, Y., Scott, D., Saper, C., 1993. Distribution and
characterization of tumor necrosis factor-alpha-like immunoreactivity in the murine central nervous system. J. Comp. Neurol. 337, 543-567.
104

Breder, C., Hazuka, C., Ghayur, T., Klug, C., Huginin, M., Yasuda, K., Teng, M., Saper C (1994). Regional induction of tumor necrosis factor alpha expression in the mouse brain after systemic lipopolysaccharide administration. Proc. Natl. Acad. Sci. 91,11393-11397.
Bulloch, K., Miller, M., Toth, J., Milner, T., Gottfried-Blackmore, A., Waters, E.,
Kaunzner, U., Lindquist, R., Nussenzweig, M., Steinman, R., McEwen, B., 2008. CD11c/EYFP transgene illuminates a discrete network of brain dendritic cells within the embryonic, neonatal, adult and injured mouse brain. J. Comp. Neurol. 508, 687-710.
Cairns, H., 1951. The growth of influenza viruses and Newcastle disease virus in mouse
brain. Br. J. Exp. Pathol. 32, 110-117. Chen, L., Duricka, D., Nelson, S., Mukherjee, S., Bohnet, S., Taishi, P., Majde, J.,
Krueger, J., 2004. Influenza virus-induced sleep responses in mice with targeted disruptions in neuronal or inducible nitric oxide synthases. J. Appl. Physiol. 97, 17-28.
Churchill, L., Yasuda, K., Yasuda, T., Blindheim, K., Falter, M., Garcia-Garcia, F.,
Krueger, J., 2005. Unilateral cortical application of tumor necrosis factor-α induces asymmetry in Fos- and interleukin-1β-immunoreactive cells within the corticothalamic projection. Brain Res. 1055, 15-24.
Conn, C., McClellan, J., Maassab, H., Smitka, C., Majde, J., Kluger, M., 1995. Cytokines
and the acute phase response to influenza virus in mice. Am J Physiol, 268, R78-R84. Dahlin, M., Bergman, U., Jansson, B., Bjork, E., Brittebo, E., 2000. Transfer of dopamine
in the olfactory pathway following nasal administration in mice. Pharm. Res. 17, 737-742.
Deak, T., Bordner, K., McElderry, N., Barnum, C., Blandino, P Jr., Deak, M.,
Tammariello, S., 2005. Stress-induced increases in hypothalamic IL-1: a systematic analysis of multiple stressor paradigms. Brain Res. Bull. 30, 541-556.
Deng, X., Bertini, G., Xu, Y., Bentivoglio, M., 2006. Cytokine-induced activation of glial
cells in the mouse brain is enhanced at advanced age. Neuroscience, 141, 645-661. Deshpande, P., King, I., Segal, B., 2007. Cutting Edge: CNS CD11c+ cells from mice
with encephalomyelitis polarize Th17 cells and support CD25+CD4+ T cell-mediated immunosuppression, suggesting dual roles in the disease process. J. Immunol. 178, 6695-6699.
Diebold, S., Kaisho, T., Hemmi, H., Akira, S., Reis e Sousa, C., 2004. Innate antiviral
responses by means of TLR7-mediated recognition of single-stranded RNA. Science, 303, 1529-1531.
105

Dinarello, C., 2000. Proinflammatory cytokines. Chest, 118, 503-508. Diniz, J., DaRosa, A., Guzman, H., Xu, F., Xiao, S., Popov, V., Vasconcelos, P., Tesh,
R., 2006. West Nile virus infection of primary mouse neuronal and neuroglial cells: the role of astrocytes in chronic infection. Am. J. Trop. Med. Hyg. 75, 691-696.
Elder, A., Gelein, R., Silva, V., Feikert, T., Opanashuk, L., Carter, J., Potter, R.,
Maynard, A., Ito, Y., Finkelstein, J., Oberdorster, G., 2006. Translocation of inhaled ultrafine manganese oxide particles to the central nervous system. Environ. Health Perspect. 114, 1172-1178.
Eriksson, C., Van Dam, A., Lucassen, P., Bol, J., Winblad, B., Schultzberg, M
(1999).Immunohistochemical localization of interleukin-1beta, interleukin-1 receptor antagonist and interleukin-1beta converting enzyme/caspase-1 in the rat brain after peripheral administration of kainic acid. Neuroscience, 93, 915-930.
Fang, J., Sanborn, C., Renegar, K., Majde, J., Krueger, J., 1995. Influenza viral infections
enhance sleep in mice. Proc. Soc. Exp. Biol. Med. 210, 242-252. Figiel, I., Dzwonek, K., 2007. TNFα and TNF receptor 1 expression in the mixed
neuronal-glial cultures of hippocampal dentate gyrus exposed to glutamate or trimethyltin. Brain Res. 1131, 17-28.
Fischer, H., Reichmann, G., 2001. Brain dendritic cells and macrophages/microglia in
central nervous system inflammation. J. Immunol. 166, 2717-2726. Gao, Y., Ng, Y., Lin, J., Ling, E., 2000. Expression of immunoregulatory cytokines in
neurons of the lateral hypothalamic area and amygdaloid nuclear complex of rats immunized against human IgG. Brain Res. 859, 364-368.
Gelez, H., Fabre-Nys, C., 2006. Neural pathways involved in the endocrine response of
anestrous ewes to the male or its odor. Neuroscience, 140, 791-800. Ghoshal, A., Das, S., Ghosh, S., Mishra, M., Sharma, V., Koli, P., Sen, E., Basu, A.,
2007. Proinflammatory mediators released by activated microglia induces neuronal death in Japanese encephalitis. Glia, 55, 483-496.
Guillemin, G., Brew, B., 2004. Microglia, macrophages, perivascular macrophages and
periycytes: a review of function and identification. J. Leuk. Biol. 75, 388-397. Guillot, L., Le Goffic, R., Bloch, S., Escriou, N., Akira, S., Chignard, M., Si-Tahar, M.,
2005. Involvement of Toll-like receptor 3 in the immune response of lung epithelial cells to double-stranded RNA and influenza A virus. J. Biol. Chem. 280, 5571-5580.
Hauwel, M., Furon, E., Canova, C., Griffiths, M., Neal, J., Gasque, P., 2005. Innate
(inherent) control of brain infection, brain inflammation and brain repair: the role of
106
microglia, astrocytes, "protective" glial stem cells and stromal ependymal cells. Brain Res. Rev. 48, 220-233.
Hennet, T., Ziltener, H., Frei, K., Peterhans, E., 1992. A kinetic study of immune
mediators in the lungs of mice infected with influenza A virus. J. Immunol. 149, 932-939.
Hopkins, S., 2007. Central nervous system recognition of peripheral inflammation: a
neural, hormonal collaboration. Acta Biomed. 78, Suppl 1, 231-247. Ignatowski, T., Noble, B., Wright, J., Gorfien, J., Heffner, R., Spengler, R., 1997.
Neuronal-associated tumor necrosis factor (TNF alpha): its role in noradrenergic functioning and modification of its expression following antidepressant drug
administration. J. Neuroimmunol. 79, 84-90. Iwasaki, T., Itamura, S., Nishimura, H., Sato, Y., Tashiro, M., Hashikawa, T., Murata, T.,
2004. Productive infection in the murine central nervous system with avian influenza virus (H5N1) after intranasal inoculation. Acta Neuropathol. 108, 485-492.
Jackson, A., Rossiter, J., Lafon, M., 2006. Expression of Toll-like receptor 3 in the
human cerebellar cortex in rabies, herpes simplex encephalitis, and other neurological diseases. J. Neurovirol. 12, 229-234.
Ji, J., Dheen, S., Kumar, S., He, B., Tay, S., 2005. Expressions of cytokines and
chemokines in the dorsal motor nucleus of the vagus nerve after right vagotomy. Brain. Res. Mol. Brain Res. 142, 47-57.
Johnson, R., Mims, C., 1968. Pathogenesis of viral infections of the nervous system. N. Engl. J. Med. 278, 23-30.
Kent, S., Bluthe, R., Kelley, K., Dantzer, R., 1992. Sickness behavior as a new target for
drug development. Trends Pharmacol. Sci. 13, 24-28. Konsman, J., Parnet, P., Dantzer, R., 2002. Cytokine-induced sickness behavior:
mechanisms and implications. Trends Neurosci. 25, 154-159. Kozak, W., Zheng, H., Conn, C., Soszynski, D., Van Der Ploeg, L., Kluger, M., 1995.
Thermal and behavioral effects of lipopolysaccharide and influenza in interleukin-1 beta-deficient mice. Am. J. Physiol. 269, R969-R977.
Kozak, W., Poli, V., Soszynski, D., Conn, C., Leon, L., Kluger, M., 1997. Sickness
behavior in mice deficient in interleukin-6 during turpentine abscess and influenza pneumonitis. Am. J. Physiol. 272, R621-R630.
Krueger, J., Majde, J., 2003. Humoral links between sleep and the immune system. Ann.
NY Acad. Sci. 992, 9-20.
107
Kumar, S., Buckmaster, P., 2007. Neuron-specific nuclear antigen NeuN is not detectable in gerbil substantia nigra pars reticulata. Brain Res. 1142, 54-60.
Kumaraswamy, G., Fu, M., Docherty, J., 2006. Innate and adaptive host response during
the initial phase of herpes simplex virus encephalitis in the neonatal mouse. J. Neurovirol. 12, 365-374.
Kurokawa, M., Imakita, M., Kumeda, C., Shiraki, K., 1996. Cascade of fever production
in mice infected with influenza virus. J. Med. Virol. 50, 152-158. Kwon, M., Seo, Y., Lee, J., Lee, H., Jung, J., Jang, J., Park, S., Suh, H., 2008. The
repeated immobilization stress increases IL-1beta immunoreactivities in only neuron, but not astrocyte or microglia in hippocampal CA1 region, striatum and paraventricular nucleus. Neurosci. Lett. 430, 258-263.
Lehnardt, S., Henneke, P., Lien, E., Kasper, D., Volpe, J., Bechmann, I., Nitsch, R.,
Weber, J., Golenbock, D., Vartanian, T., 2006. A mechanism for neurodegeneration induced by group B streptococci through activation of the TLR2/MyD88 pathway in microglia. J. Immunol. 177, 583-592.
Lemstra, A., Groen In't Woud, J., Hoozemans, J., van Haastert, E., Rozemuller, A.,
Eikelenboom, P., van Gool, W., 2007. Microglia activation in sepsis: a case-control study. J. Neuroinflammation doi 4:4, 10.1186/1742-2094-4-4.
Li, Y., Field, P., Raisman, G., 2005. Olfactory ensheathing cells and olfactory nerve
fibroblasts maintain continuous open channels for regrowth of olfactory nerve fibres. Glia, 52, 245-251.
Lim, J., Brunjes, P., 1999. Activity-dependent regulation of interleukin-1 beta
immunoreactivity in the developing rat olfactory bulb. Neuroscience, 93,371-374. Liu, T., Clark, R., McDonell, P., Young, P., White, R., Barone, F., Feuerstein, G., 1994.
Tumor necrosis factor-alpha expression in ischemic neurons. Stroke, 25, 1481-1488. Majde, J., Guha-Thakurta, N., Chen, Z., Bredow, S., Krueger, J., 1998. Spontaneous
release of stable viral double-stranded RNA into the extracellular medium by influenza virus-infected MDCK epithelial cells: implications for the viral acute phase response. Archives Virol. 143, 2371-2380.
Majde, J., Krueger, J., 2005. Links between the innate immune system and sleep. J.
Allergy Clin. Immunol. 116, 1188-1198.
Majde, J., Bohnet, S., Ellis, G., Churchill, L., Leyva-Grado, V., Wu, M., Szentirmai E.,
Rehman A., Krueger, J., 2007. Detection of mouse-adapted human influenza viruses in the olfactory bulbs of mice within hours after intranasal inoculation. J. Neurovirol. 13, 399-409.
108

Mao, M., Hua, Y., Jiang, X., Li, L., Zhang, L., Mu, D., 2006. Expression of tumor
necrosis factor alpha and neuronal apoptosis in the developing rat brain after neonatal stroke. Neurosci. Lett. 403, 227-232.
Mausset-Bonnefont, A., de Sèze, R., Privat, A., 2003. Immunohistochemistry as a tool
for topographical semi-quantification of neurotransmitters in the brain. Brain Res. Protoc.10, 148-155.
McGregor, I., Hargreaves, G., Apfelbach, R., Hunt, G., 2004. Neural correlates of cat
odor-induced anxiety in rats: Region-specific effects of the benzodiazepine midazolam. J. NeuroSci. 24, 4134-4144.
McQuillin, J., Madeley, C., Kendal, A., 1985. Monoclonal antibodies for the rapid
diagnosis of influenza A and B virus infections by immunofluorescence. Lancet, II, 911-914.
Mori, I., Komatsu, T., Takeuchi, K., Nakakuki, K., Sudo, M., Kimura, Y., 1995. Viremia
induced by influenza virus. Microbiol. Pathog. 19, 237-244. Mori, I., Nishiyama, Y., Yokochi, T., Kimura, Y., 2005. Olfactory transmission of
neurotropic viruses. J. Neurovirol. 11, 129-137. Nagayama, S., Takahashi, Y., Yoshihara, Y., Mori, K., 2004. Mitral and tufted cells
differ in the decoding manner of odor maps in the rat olfactory bulb. J. Neurophysiol. 91, 2532-2540.
Oberdorster, G., Sharp, Z., Atudorei V., Elder, A., Gelein, R., Kreyling, W., Cox, C.,
2004. Translocation of inhaled ultrafine particles to the brain. Inhal. Toxicol. 16, 437-445.
Ohtori, S., Kazuhisa, T., Hideshige, M., Myers, R., 2004. TNF-α and TNF-α receptor
type 1 upregulation in glia and neurons after peripheral nerve injury. Spine, 29, 1082-1088.
Opp, M., 2005. Cytokines and sleep. Sleep Med. Rev. 9, 355-364. Owens, T., Babcock, A., Millward, M., Toft-Hansen, H., 2005. Cytokine and chemokine
inter-regulation in the inflamed or injured CNS. Brain Res. Rev. 48, 178-184. Park, C., Ishinaka, M., Takada, A., Kida, H., Kimura, T., Ochiai, K., Umemura, T., 2002.
The invasion routes of neurovirulent A/Hong Kong/483/97 (H5N1) influenza virus into the central nervous system after respiratory infection in mice. Arch. Virol. 147, 1425-1436.
109

Parrish-Aungst, S., Shipley, M., Erdelyi, F., Szabo, G., Puche, A., 2007. Quantitative analysis of neuronal diversity in the mouse olfactory bulb. J. Comp. Neurol. 501, 825-836.
Perry, V., Hume, D., Gordon, S., 1985. Immunohistochemical localization of
macrophages and microglia in the adult and developing mouse brain. Neuroscience, 15, 313-326.
Perry, V., 1994. Modulation of microglia phenotype. Neuropathol. Appl. Neurobiol. 20,
177. Reinacher, M., Bonin, J., Narayan, O., Scholtissek, C., 1983. Pathogenesis of
neurovirulent influenza A virus infection in mice. Route of entry of virus into brain determines infection of different populations of cells. Lab. Invest. 49, 686-692.
Reiss, C., Plakhov, I., Komatsu, T., 1998. Viral replication in olfactory receptor neurons
and entry into the olfactory bulb and brain. Ann. NY Acad. Sci. 855, 751-761. Santambrogio, L., Belyanskaya, S., Fischer, F., Cipriani, B., Brosnan, C., Ricciardi-
Castagnoli, P., Stern, L., Strominger, J., Riese, R., 2001. Developmental plasticity of CNS microglia. Proc. Natl. Acad. Sci. 98, 6295-6300.
Schlesinger, R., Husak, P., Bradshaw, G., Panayotov, P., 1998. Mechanisms in natural
and experimental neuropathogenicity of influenza virus: evidence and speculation. Adv. Virus Res. 50, 289-379.
Schmitz, N., Kurrer, M., Bachmann, M., Kopf, M., 2005. Interleukin-1 is responsible for
acute lung immunopathology but increases survival of respiratory influenza virus infection. J. Virol. 79, 6441-6448.
Schoenfeld, T., Merchand, J., Macrides, M., 1985. Topographic organization of tufted
cell axonal projections in the hamster main olfactory bulb: an intralobular associational system. J. Comp. Neurol. 235, 503-518.
Schulz, O., Diebold, S., Chen, M., Naslund, T., Nolte, M., Alexopoulou, L., Azuma, Y.,
Flavell, R., Liljestrom, P., Reis e Sousa, C., 2005.Toll-like receptor 3 promotes cross-priming to virus-infected cells. Nature, 433, 887-892.
Shipley, M., Ennis, M., Puch, A., 2004. Olfactory system. In: Paxinos, G. (Editor), The
Rat Nervous System. Third edition. Elsevier, San Diego, pp. 922-964. Smith, W., 1951. The structural and functional plasticity of influenza virus. Lancet, I,
885-891. Solomon, K., Pesti, N., Wu, G., Newton, R., 1999. Cutting edge: a dominant negative
form of TNF-alpha converting enzyme inhibits proTNF and TNFRII secretion.
110

J. Immunol. 163, 4105-4108. Steinhauer, D., Skehel, J., 2002. Genetics of influenza viruses. Annu. Rev. Genet. 36,
305-332. Stichel, C., Luebbert, H., 2007. Inflammatory processes in the aging mouse brain:
Participation of dendritic cells and T-cells. Neurobiol. Aging, 28, 1507-1521. Szentirmai, E., Kapás, L., Sun, Y., Smith, R., Krueger, J., 2007. Spontaneous sleep and
homeostatic sleep regulation in ghrelin knockout mice. Am. J. Physiol. Regul. Integr. Comp. Physiol. 293, R510-R517.
Sweitzer, S., Arruda, J., DeLeo, J., 2001. The cytokine challenge: methods for the
detection of central cytokines in rodent models of persistent pain. In: Kruger, L. (Editor), Methods in pain research. CRC Press, New York, pp. 109-132.
Taishi, P., Churchill, L., Wang, M., Kay, D., Davis, C., Guan, X., De, A., Yasuda, T.,
Liao, F., Krueger, J., 2007. TNFalpha siRNA reduces brain TNF and EEG delta wave activity in rats. Brain Res. 1156, 125-132.
Toth, L., Rehg, J., Webster, R., 1995. Strain differences in sleep and other
pathophysiological sequelae of influenza virus infection in naive and immunized mice. J. Neuroimmunol. 58, 89-99.
Town, T., Jeng, D., Alexopoulou, L., Tan, J., Flavell, R., 2006. Microglia recognize
double-stranded RNA via TLR3. J. Immunol. 176, 3804-3812. Ubink, R., Halasz, N., Zhang, X., Dagerlind, A., Hökfelt, T (1994). Neuropeptide
tyrosine is expressed in ensheathing cells around the olfactory nerves in the rat olfactory bulb. Neuroscience, 60, 709-726.
Van Reeth, K., 2000. Cytokines in the pathogenesis of influenza. Vet. Microbiol. 74,109-
116. Vincent, A., West, A., Chuah, M., 2005. Morphological and functional plasticity of
olfactory ensheathing cells. J. Neurocytol. 34, 65-80. Vincent, A., Choi-Lundberg, D., Harris, J., West, A., Chuah, M., 2007. Bacteria and
PAMPs activate nuclear factor kappaB and Gro production in a subset of olfactory ensheathing cells and astrocytes but not in Schwann cells. Glia, 55, 905-916.
Walls, H., Harmon, M., Slagle, J., Stocksdale, C., Kendall, A., 1986. Characterization
and evaluation of monoclonal antibodies developed for typing influenza A and influenza B viruses. J. Clin. Microbiol. 23, 240-245.
111

Walz, A., Omura, M., Mombaerts, P., 2006. Development and topography of the lateral olfactory tract in the mouse: Imaging by genetically encoded and injected fluorescent markers. J. Neurobiol. 66, 835-846.
Wang, J., Swann, J., 2006.The magnocellular medial preoptic nucleus I. Sources of
afferent input. Neuroscience, 141, 1437-1456. Watkins, L., Maier, S., 2005. Immune regulation of central nervous system functions:
from sickness responses to pathological pain. J. Intern. Med. 257, 139-155. Ward, A., 1997. Virulence of influenza A virus for mouse lung. Virus genes, 14, 187-
194. Yang, L., Blumbergs, P., Jones, N., Manavis, J., Sarvestani, G., Ghabriel, M., 2004. Early
expression and cellular localization of proinflammatory cytokines interleukin-1beta, interleukin-6, and tumor necrosis factor-alpha in human traumatic spinal cord injury. Spine, 29, 966-971.
112
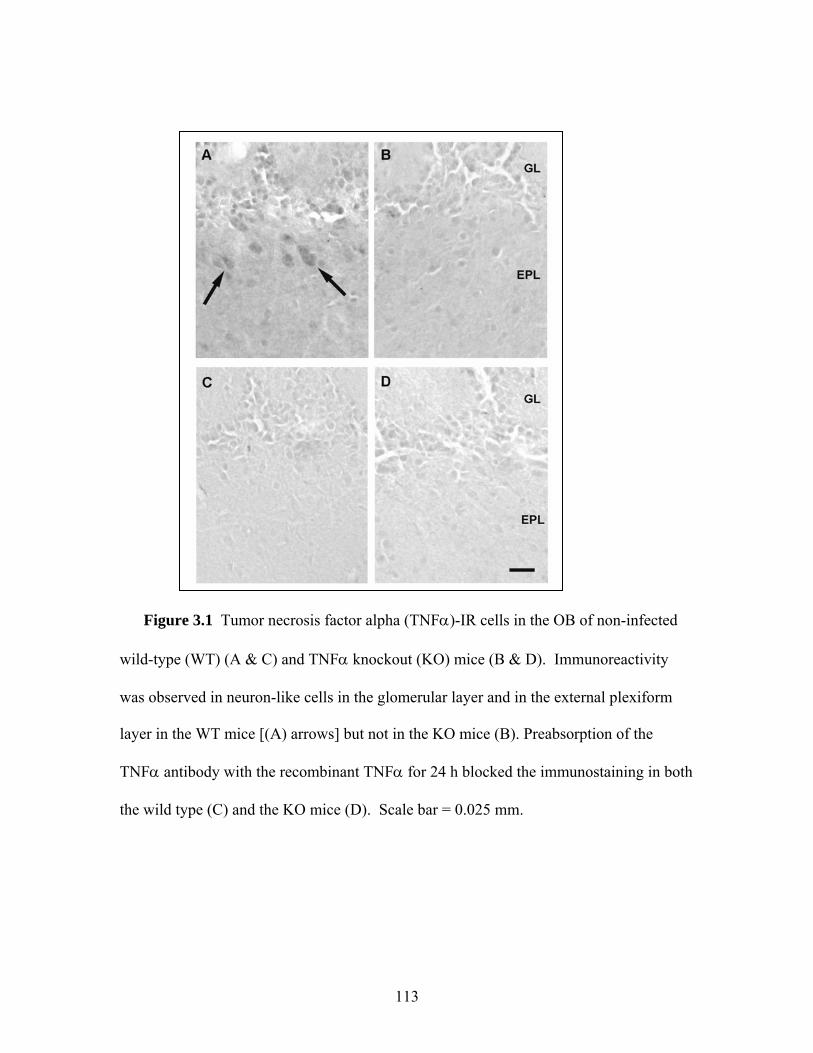
Figure 3.1 Tumor necrosis factor alpha (TNFα)-IR cells in the OB of non-infected
wild-type (WT) (A & C) and TNFα knockout (KO) mice (B & D). Immunoreactivity
was observed in neuron-like cells in the glomerular layer and in the external plexiform
layer in the WT mice [(A) arrows] but not in the KO mice (B). Preabsorption of the
TNFα antibody with the recombinant TNFα for 24 h blocked the immunostaining in both
the wild type (C) and the KO mice (D). Scale bar = 0.025 mm.
113

Figure 3.2 Western blot analysis of TNFα antibody alone and combined with
olfactory bulb protein extracts. Recombinant rat TNFα (rrTNF) is evident as a 17 kD
band (left panel, left side), while the TNFα band combined with the OB extracts is a 26
kD band (left panel, right side). Pre-absorption treatment with rrTNF prior to running the
Western blots eliminated the presence of both bands (right panel).
114

Figure 3.3 Interleukin-1 beta (IL1β)-IR cells in the OB of non-infected IL1β WT (A
& C) and KO mice (B & D). Immunoreactivity was observed in neuron-like cells in the
glomerular layer (GL) and the external plexiform layer (EPL) in the WT mice (A) but not
in the KO mice (B). Preabsorption of the IL1β antibody with the recombinant IL1β for
24 h substantially reduced the immunostaining in the WT (C) and KO (D) mice. Scale bar
= 0.025 mm.
115

Figure 3.4 Western blot analysis of IL1β antibody alone and combined with
olfactory bulb protein extracts. Recombinant mouse IL1β (rmIL1) is evident as a 17 kD
band (left panel, left side), while the IL1β band combined with OB extracts occurs at 37
kD (left panel, right side). Pre-absorption treatment with rmIL1 prior to performing the
Western blot eliminated the presence of both bands (right panel).
116

Figure 3.5 Distribution of viral protein and F4/80 immunoreactivity within cross-
sections of the whole olfactory bulb (OB). Viral H1N1 immunoreactivity is mainly
present in the olfactory nerve (ON) and glomerular layer (GL) with less detectable
immunoreactivity in deeper layers such as the external plexiform layer (EPL). The H1N1
immunoreactivity is largely concentrated in the ventro-(V) lateral (L) area of the OB (A)
A schematic representation of the OB section in (A). Each dot represents 2 H1N1-IR
cells (B). F4/80 immunoreactivity in the olfactory bulb showed a similar pattern of
distribution to the one observed for the viral antigen (C) Scale bar= 0.2mm. Mitral layer
(ML), medial surface (M), and dorsal surface (D).
117

Figure 3.6 Morphological comparison of immunoreactivity in OB sections of mice
inoculated with live PR8 using F4/80 antibody (A), viral H1N1 antibody (B) and viral
nucleoprotein (NP) antibody (C) respectively. Viral protein-IR cells (B and C) showed
similar shape and size to the F4/80-IR cells (A), including several darkly stained
processes. Scale bar = 0.01mm.
118

Figure 3.7 Photomicrograph of H1N1-immunoreactivity in the olfactory nerve of a
mouse inoculated with live PR8. Arrows designate fusiform cells running along the
nerve fibers. These H1N1-IR cells resemble olfactory ensheathing cells (Ubink et al.,
1994). An arrow head illustrates H1N1-IR in a glia-like cell. Scale bar = 0.025mm.
119
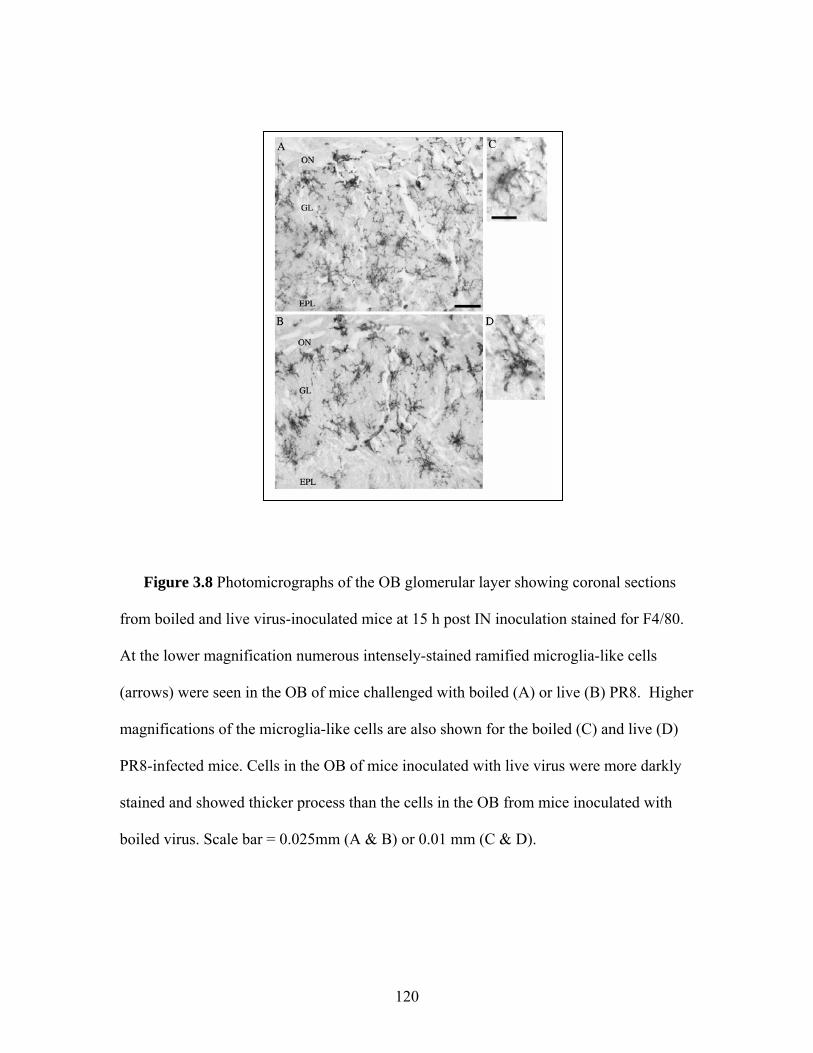
Figure 3.8 Photomicrographs of the OB glomerular layer showing coronal sections
from boiled and live virus-inoculated mice at 15 h post IN inoculation stained for F4/80.
At the lower magnification numerous intensely-stained ramified microglia-like cells
(arrows) were seen in the OB of mice challenged with boiled (A) or live (B) PR8. Higher
magnifications of the microglia-like cells are also shown for the boiled (C) and live (D)
PR8-infected mice. Cells in the OB of mice inoculated with live virus were more darkly
stained and showed thicker process than the cells in the OB from mice inoculated with
boiled virus. Scale bar = 0.025mm (A & B) or 0.01 mm (C & D).
120

Figure 3.9 Confocal photomicrographs of H1N1-IR cells and cellular
markers in the OB of mice inoculated with live PR8 at 15 h post inoculation. Yellow
arrows indicate co-localization, while white arrows indicate single-labeled cells. Viral
H1N1-immunoreactivity (red) co-localized with F4/80-immunoreactivity, suggesting that
microglia-like cells (green) in the GL take up virus (A). Viral H1N1-immunoreactivity
(red) co-localized with some cells expressing the astrocyte marker GFAP (green) in the
GL, suggesting that astrocytes in the GL also take up virus (B). Double-labeling with
anti-viral H1N1 antibodies (green) and the neuronal marker NeuN (red) in adjacent
sections of the OB did not show co-localization of the virus within neurons in the GL (C).
Scale bar = 0.02mm (A & C) or 0.01mm (B).
121

Figure 3.10 Tumor necrosis factor alpha (TNFα)-IR cells in the OB of mice
inoculated with live PR8. Immunoreactivity was observed in neuron-like cells in the
external plexiform layer (EPL) (A).. TNFα-IR was also observed in the long neuronal
projections of mitral cells in the EPL (B). Scale bar = 0.025 mm.
122

Figure 7
*
GL EPL ML
TNF-
IR c
ells
GL EPL ML
IL1-
IR c
ells
0
10
20
30
40
50
Boiled Live
*
B: Interleukin 1-β
50
Boiled Live
10
20
30
40
*
0
A: Tumor necrosis factor-α
Figure 3.11 (A) The number of TNFα-IR cells increased in the EPL and the ML of
the OB in mice inoculated with live virus in comparison with mice inoculated with boiled
virus. No significant changes were observed in the GL. An asterisk (*) indicates a
significant difference (p< 0.05) using the paired Student’s t test. The area used for TNFα
quantification in the GL and EPL was 0.125 mm2 and for the ML was 0.05mm2. (B) The
number of neuron-like IL1β-immunoreactive cells was significantly different between
mice inoculated with live or boiled PR8 only in the EPL. An (*) indicates significant
differences (p<0.05). The area used for quantification in the GL and EPL was 0.144 mm2
and for the ML was 0.008 mm2.
123

Figure 3.12 Confocal photomicrographs of cytokines and cellular markers in the OB
of PR8-infected mice. Yellow arrows indicate co-localization, while white arrows
indicate single-labeled cells. Two cells showing double-labeling (yellow arrows) with
TNFα (red) and NeuN (green) indicate the presence of TNFα in the cytoplasm of some
juxtaglomerular neurons in the external plexiform layer. Some cells only showed TNFα-
immunoreactivity (white arrow) (A). IL1β-immunoreactivity (red) co-localized with one
cell also labeled with NeuN (green) in the external plexiform layer, demonstrating that
IL1β was present in neurons (yellow arrow) (B). Some cells in the glomerular layer
labeled with IL1β (red) also expressed GFAP (green) indicating the presence of IL1β in
astrocytes of the OB (C). Scale bar = 0.02 mm (A & C) or 0.01mm (B).
124
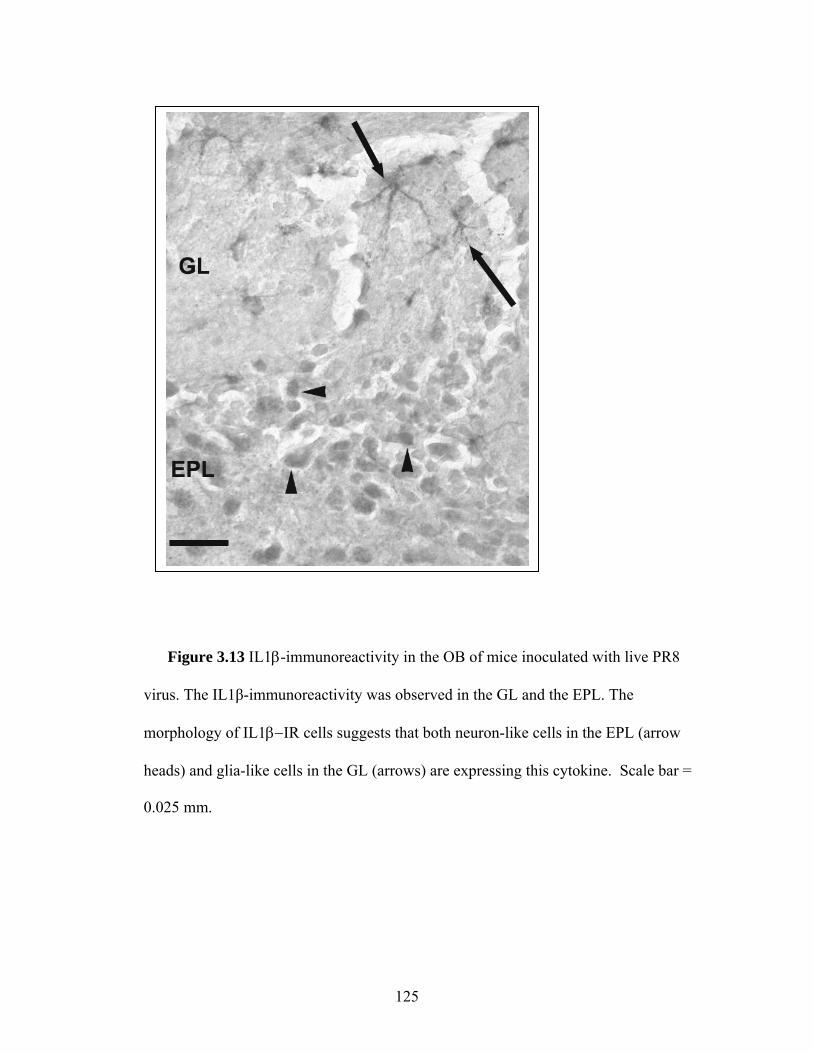
Figure 3.13 IL1β-immunoreactivity in the OB of mice inoculated with live PR8
virus. The IL1β-immunoreactivity was observed in the GL and the EPL. The
morphology of IL1β−IR cells suggests that both neuron-like cells in the EPL (arrow
heads) and glia-like cells in the GL (arrows) are expressing this cytokine. Scale bar =
0.025 mm.
125
CHAPTER IV
THE OLFACTORY NERVE PATHWAY HAS A ROLE IN THE ACUTE
PHASE RESPONSE TO INTRANASAL INOCULATION WITH INFLUENZA
VIRUS
Victor H. Leyva-Grado, Lynn Churchill, Timothy J. Williams, Jeannine A. Majde,
Joseph Harding and James M. Krueger
Department of Veterinary and Comparative Anatomy, Pharmacology and Physiology,
Washington State University, Pullman, WA 99164
126

Abstract
Mouse-adapted human influenza virus is detectable in the olfactory bulbs of mice
within hours after intranasal challenge and is associated with enhanced local cytokine
mRNA and protein levels. To determine whether signals from the olfactory nerve
influence the unfolding of the acute phase response (APR), we surgically transected the
olfactory nerve in mice prior to influenza infection. We then compared the responses of
olfactory nerve-transected (ONT) mice to those recorded in sham-operated control mice.
ONT did not change baseline body temperature (Tb); however, the onset of virus-induced
hypothermia was delayed for about 13 h in the ONT mice. Locomotor activity, food
intake and body weights of the two groups were similar. At 15 h post-challenge fewer
viral antigen-immunoreactive (IR) cells were observed in the olfactory bulb (OB) of ONT
mice compared to sham controls. The number of tumor necrosis factor alpha (TNFα)-
and interleukin 1 beta (IL1β)-IR cells in ONT mice was also reduced in the OBs
compared to sham controls. In separate experiments, we examined brain regions
connected to the OB. Mice were inoculated with live or boiled (control) virus and
sacrificed 10 or 15 h later. The number of TNFα- and IL-1β-IR cells increased in the
piriform cortex (Pir), olfactory tubercle (Tu) and central amygdala (CeA) at 15 h but not
in mice sacrificed at 10 h after viral challenge. In the hypothalamic arcuate nucleus (Arc),
the number of IL-1β-IR, but not TNFα-IR, cells also increased at 15 h but not at 10 h. No
significant differences were observed in the basolateral amygdala (BLA) for TNFα or
IL1β at either 10 h or 15 h. No viral antigen immunoreactivity was observed in the Pir,
Tu, CeA, BLA or Arc. These results suggest that the olfactory nerve pathway is
important for the initial pathogenesis of the influenza-induced APR.
127

Introduction
Cytokines such as tumor necrosis factor α (TNFα) and interleukin 1β (IL1β) are
prominent mediators of the acute phase response (APR) (Bluthe et al., 2000). In influenza
virus-infected mice, the APR includes enhanced sleep accompanied by reduced body
temperature, locomotor activity and food intake (Kent et al., 1992; Fang et al., 1995; Toth
et al., 1995; Swiergiel et al., 1997; Schmitz et al., 2005; Szretter et al., 2007). Some
facets of the APR manifest within 15 h post-inoculation (PI) (Fang et al., 1995).
Previously, we showed that TNFα and IL1β olfactory bulb (OB) transcripts are up-
regulated within 15 h after intranasal (IN) challenge with influenza virus A (H1N1
PR8/34, abbreviated PR8 (Majde et al., 2007). Additionally, at 15 h PI the number of OB
TNFα and IL1β immunoreactive (IR) cells is enhanced (Leyva-Grado et al., see chapter
III). The APR is posited to be regulated, in part, by hypothalamic cytokines (Kent et al.,
1992, Opp, 2005; Alt et al., 2007). In fact, by 38 h post-influenza viral inoculation,
hypothalamic IL1β and TNFα mRNAs are up-regulated (Alt et al., 2007). However, our
previous studies of influenza-infected mice suggest that OB cytokines could also
potentially play a role in the APR.
The amygdala influences the APR via the hypothalamic-pituitary-adrenal axis (Xu et
al., 1999; Lin et al., 2004). Specifically, activation of the central amygdala (CeA), as
evidenced by an increase of c-Fos or of cytokines such as TNFα and IL1β, occurs after
immunological challenges in rodents, including herpes virus infection (Ben-Hur, 1996),
lipopolysaccharide (LPS) (Frenois et al., 2007) and enterotoxins (Rossi-George et al.,
2005). Similarly, increases in c-Fos-IR cells are observed in CeA following systemic
128
IL1β injection (Xu et al., 1999). After systemic or local injections with LPS or IL1β, c-
Fos-IR cells increase in the hypothalamic arcuate nucleus (Arc) (Reyes and Sawchenko,
2002; Scarlett et al., 2007). The Arc plays a role in sleep regulation, food intake, energy
balance and body weight (Obal and Krueger, 2003; Bouret et al., 2004) and may also
have a role in the APR (Reyes and Sawchenko, 2002). Such data indicate that the
amygdala and hypothalamus (HT) are involved in the APR.
Projections from the OB also reach the amygdala at the anterior cortical nucleus and
the posterolateral cortical amygdala (Price, 2003; Ubeda-Bañon et al., 2007). In addition,
the basolateral amygdala (BLA) and CeA receive indirect connections from the OB
through the olfactory tubercle (Tu) and piriform cortex (Pir) and through the anterior and
posterolateral amygdala (Johnson et al., 2000; LeDoux, 2007). The Tu and Pir are also
indirectly connected to the Arc through the lateral hypothalamus (Lin et al., 2004; Price
et al., 1991) and medial preoptic area (Chiba and Murata, 1985). This anatomical
relationship of the olfactory pathway with centers involved in the APR and the early
increased expression of TNFα and IL1β in the OB after IN influenza infection led us to
hypothesize that the olfactory pathway is important in early APR ontogenesis.
In the present study, therefore, the olfactory nerve was transected at the level of the
cribriform plate prior to viral infection. We then evaluated body temperature (Tb),
locomotor activity and food intake responses and quantified the number of TNFα and
IL1β-IR cells in the OB of olfactory-nerve transected (ONT) mice. We also evaluated
TNFα and IL1β immunoreactivity in the Pir, Tu, amygdala and Arc at 10 h (before APR
onset) and at 15 h [after onset of hypothermia (see Chapter II)] after IN inoculation with
129

influenza PR8. We demonstrate a role for the ON in the APR and that the number of
TNFα- or IL1β-IR cells was time-dependently enhanced in the olfactory pathway.
130
Material and Methods
Animals
C57BL/6 male mice were purchased from Jackson Laboratories (Bar Harbor, ME) at
4-6 weeks of age. After arrival, animals were housed in 48 x 25 x 16 cm polypropylene
cages with filter tops to minimize intercurrent infections. Food (rodent chow Purina
5001) and water were provided ad libitum. Mice were maintained on a 12:12 h light:dark
cycle at an ambient temperature of 24° ± 1°C. They were used in the experiments when
they were 8-12 weeks of age and their body weights were between 26-30 grams.
Experiment I. ONT
A total of 52 mice were used and divided into groups as follows; 14 mice received the
ONT and live virus challenge; 12 mice received the sham surgery and live virus
challenge; and 8 mice received sham surgery and boiled virus challenge (n=8). For food
intake and body weight analyses, subsets (n=5 per group) of these same mice were used.
For immunohistochemistry (IHC) studies of ONT mice, two groups of separate mice
were inoculated with live virus, one with ONT (n=6) and the other with sham surgery
(n=6). These mice were also used in a task to test the latency to find buried food. An
additional group of mice were used for the histological analysis to test the effectiveness
of ONT (n=4) and compared with sham mice (n=2).
131
Experiment II. IHC analysis in the olfactory pathway
Two groups of mice (total 24) were used in this experiment. One group was
sacrificed at 10 h PI after receiving boiled (n=6) or live (n=6) virus and another group
was sacrificed at 15 h PI after receiving boiled (n=6) or live (n=6) virus. Institutional
guidelines for the care and use of research animals were followed and protocols were
approved by the Washington State University Institutional Animal Care and Use
Committee.
Virus
Allantoic fluid containing PR8 influenza virus prepared under pyrogen-free
conditions was purchased from Specific Pathogen-Free Avian Supply (SPAFAS, North
Franklin, CT). The virus was purified by sucrose-gradient sedimentation using pyrogen-
free materials and the stock was tested for endotoxin and mycoplasma (both were
negative), and titered in Madin-Darby canine kidney cells as previously described (Chen
et al., 2004).
IN inoculation procedure
Mice were inoculated IN at light onset by delivering 25 μl to each nostril using a 100
µl micropipette under light methoxyflurane (Metofane, Schering-Plough Animal Health,
Union, NJ) inhalation anesthesia. Mice received either live virus: 2.5 x 10⁶ TCID50
purified PR8 suspended in Dulbecco’s phosphate buffered saline (DPBS) or boiled virus
(same amount of virus after being heat inactivated in boiling water for 25 min).
132

Surgical procedure for ONT
The surgical procedure was adapted from Yee and Constanzo (1995). Briefly, mice
were anesthetized using intraperitoneal (IP) ketamine (87 mg/kg) and xylazine (13
mg/kg) prepared in pyrogen-free saline (0.1 ml/10 g body weight each). A skin incision
was made at the midline over the anterior skull and nasal bones. A small section of the
frontal bones was removed with a dental drill to expose the dorsal surface of the OBs. A
microdissecting knife (blade 3.0 mm; Roboz surgical instruments, Gaithersburg, MD)
was inserted between the OB and the cribriform plate to cut all the olfactory axons
projecting from the nasal cavity. Sham animals received identical surgical exposure of
the OB as the experimental mice except the blade was not used to cut the nerve.
Following surgery, mice were allowed to recover for 7 days, and then challenged with
PR8 virus on day 10 post-surgery.
Effectiveness of the ONT
In a separate experiment, we tested the mice for their latency in finding buried food
to determine whether mice could detect odorants after the ONT. Briefly, mice (n=12)
were trained for three consecutive days to find a sugar cube randomly buried under
approximately 1 inch of pine shavings. The mouse was removed from the test cage after
eating the food or after 5 min. Mice were tested on days 5 and 7 after surgery. The
average time to find the sugar cube was significantly higher in the mice with ONT (n=6)
compared to the sham group (n=6) (sham 79.21 ± 7.9 sec; ONT 166.83 ± 30.55 sec,
p=0.02). Results indicate the effectiveness for the ONT surgery was approximately 85%
[1 out of 6 mice fell outside 2 standard deviations (Glantz, 2002)].
133

The brains from six additional mice (ONT=4; sham=2) were examined histologically
for ON connections between the olfactory epithelium and the forebrain using light
microscopy on hematoxylin-eosin stained sections. Mice were killed 3 days after surgery;
they were not infected. Primary fibers connecting the olfactory epithelium with the
forebrain were not evident in the four ONT mice but were in the sham mice (Figure 4.1).
Body temperature and motor activity analyses
During the sham or ONT operations, radio transmitters (XM-FH, Minimitter, Bend,
OR) were implanted into the peritoneum of mice. Then individual cages (1 mouse/cage)
were placed on telemetry receivers (TR-3000, Minimitter) and Tb and locomotor activity
were recorded using VitalView data acquisition software (Minimitter). After recovery
from surgery, baseline data were collected for 2 days and then the mice were challenged
with live (12 sham, 14 ONT) or boiled (8 sham) PR8 virus. Temperature and activity
values were collected every 6 min and averaged over 60 min for each animal (Traynor et
al., 2004) for 6 days after viral challenge. Activity values on the baseline day were
averaged across the entire 24-h recording period for each mouse separately to obtain a
reference value. Hourly activity data on each experimental day were expressed as a
percentage of this reference value (Kapas et al., in review).
Food intake and body weight
Food intake and body weights (5 sham, 5 ONT) were determined daily for six days
starting on the day of inoculation. Food consumption was determined by weighing the
food pellets one hour before dark onset. The weight of each mouse was recorded at the
134
same time. Body weight values are expressed as percentage of the initial body weight
(Szretter et al., 2007).
Brain collection
Under deep isoflurane anesthesia the animals were perfused with warm saline (0.9%
NaCl) containing 0.004% of heparin (Celsus laboratories, Cincinnati OH) followed by 35
ml of cold paraformaldehyde in phosphate-buffered saline (PBS). Brains were carefully
removed from the skull and postfixed for 6 h at 4o C and then sunk in 20% sucrose
overnight. The brains were frozen in crushed dry ice, and stored at -80° C until sectioned.
For the ONT-IHC studies, mice were killed at 15 h PI. For the IHC studies of the
olfactory pathway mice were killed at 10 h (prior to hypothermia onset) or at 15 h PI
(after the time of hypothermia onset).
Immunohistochemistry (IHC)
IHC was performed as previously described (Churchill et al., 2005; Majde et al.,
2007). Brain sections were processed in pairs and adjacent coronal tissue sections were
cut at 30 μm thickness and floated onto PBS.
Antibody and labeling specificity testing
The anti-TNFα and anti-IL1β antibodies used in this experiment were previously
tested for specificity (Leyva-Grado et al., see chapter III). For this experiment, we
135

incubated sections without the primary antibody or with pre-absorbed antibody (using
specific recombinant cytokines as done previously); both procedures blocked the
immunoreactivity. We also examined midbrain sections from TNFα and IL1β knockout
mice; these mice lacked TNFα or IL1β immunoreactivity using the procedures described
herein.
DAB staining for IHC single labeling
Adjacent tissue sections were incubated with one of the following antibodies; mouse
anti-influenza A H1N1 virus monoclonal antibody (Chemicon International/Millipore,
Temecula, CA, dilution 1:100), rabbit anti- recombinant mouse IL1β (Millipore, dilution
1:100) and goat anti-recombinant rat TNFα (R&D, Minneapolis MN, dilution 0.5
μg/ml). The sections were developed in 3, 3’- diaminobenzidine tetrahydrochloride
(DAB kit, Vector) as a chromophore.
Double labeling
Preliminary results indicated that TNFα and IL1β immunoreactivities were present in
cells that resemble neurons. To determine whether cytokines localized in neurons, double
labeling for TNFα or IL1β plus NeuN was performed. After immersion in 3% blocking
serum [a combination of normal chicken serum (NCS) and normal donkey serum (NDS)]
for 1 h, adjacent sections were incubated with a mixture of goat anti-rat TNFα (R&D
systems, dilution 1:100) or rabbit anti-mouse IL1β (Chemicon, dilution 1:100), in
combination with mouse anti- nuclear protein NeuN (Chemicon, dilution 1:1000). After
incubation, the samples were washed and then incubated in the dark for 2 h at room
136

temperature with secondary antibodies (dilution 1:500) using a combination of Alexa
Fluor 488 chicken anti-mouse (Invitrogen, Carlsbad CA,) plus donkey anti-goat (for the
sections with TNFα antibodies) or Alexa Fluor 488 chicken anti-rabbit (for the sections
with the IL1β antibodies) plus Alexa Fluor 555 donkey anti-mouse. After incubation, the
sections were washed and then mounted on gelatin-coated slides, dried, and cover slipped
with fluorescent hard set mounting medium (VectaShield, Vector Laboratories, Inc,
Burlingame, CA).
Image preparation and quantitative analyses
Images were captured with a Spot camera and software (Diagnostic Instruments Inc.,
Sterling Heights MI), in a Leica DMLB microscope. The number of IR-cells in the OB of
mice that received ONT in Experiment I was determined as previously described (Leyva-
Grado et al., see Chapter III). For Experiment II, the number of IR-cells was determined
using a rectangular box that measured 0.15 mm by 0.35 mm (Pir and Tu); 0.15 mm by
0.075 mm (Arc) or a circle with a radius of 0.100mm (CeA). Three different sections for
each area in each mouse were analyzed. An individual blinded to the experiment
treatment completed the quantification.
Statistical analyses
To compare body temperature and activity, three way ANOVA was used; surgery
was the between factor and days and hours within the day, the repeated factors.
For the food intake and body weight among the ONT, sham and boiled groups two-way
ANOVA was used (between factor: surgery, repeated factor: day). When ANOVA
137

showed significance, post hoc comparisons were performed using the Student-Newman-
Keuls test or Student's t-test. For IHC, the total number of IR cells was statistically
analyzed using a paired Student’s t-test to compare experimental and control samples for
each brain. The data were expressed as mean ± the standard error of the mean. A p-value
equal or lower than 0.05 was considered significant.
138
Results
Experiment I.
Body temperature and locomotor activity
There were no significant differences in baseline Tbs between the ONT and the sham
operated mice over the 12:12 h light-dark cycle [Figure 2 (hours -24 to 0); F (1, 24) = 1.2,
p= 0.32]. Mice in both groups had higher Tbs during the night and lower Tbs during their
inactive day period (Figure 4.2). After viral challenge, both groups of mice became
hypothermic compared to their respective baseline values [Figure 4.2; F (1, 36) = 2.15,
p<0.01]. However, on day one PI, Tbs in ONT mice were significantly higher when
compared to Tbs in the sham mice between 15 and 27 h PI (p< 0.05). After 28 h PI, Tbs
were not significantly different (p> 0.05) between the two groups.
The baseline locomotor activity responses were not significantly different between the
ONT and the sham mice over the 12:12 h light-dark cycle [Figure 4.3 (hours -24 to 0); F
(1, 20) = 0.86, p= 0.36]. Activity was higher during the night and lower during the day
(Figure 4.3). After influenza challenge, there was a transient increase in activity of about
4 h in both groups (Figure 4.3). After the initial increase in activity, locomotor activity
fell in both ONT and sham groups compared to their baseline values [F (1, 20) = 32.16,
p< 0.01]. This reduced activity continued until the end of recording. No significant
differences in activity were observed between the ONT and sham groups after viral
infection [Figure 4.3; F (1, 20) = 0.46, p= 0.50].
139

Food intake and body weight
There was a significant treatment effect on both food intake [Figure 4.4A; F (2, 12)
= 7.25, p<0.01] and body weight [Figure 4.4B; F (2, 12) = 22.03, p<0.01] among the
three treatment groups. The Student-Newman-Keuls posthoc comparison test revealed
that both food intake and body weights of the mice that received boiled virus did not
change over time and values were significantly higher than those measured in the live
virus-treated groups on day 2 post-challenge. There were no significant differences in
food intake or body weights between the infected ONT and sham groups that received the
live virus.
Mortality rate
There were no differences in the percentage of deaths between the two groups of mice
inoculated with live virus (ONT or sham). Mice started dying on day 5 after infection
with more than 70% of the deaths occurring between day 5 and day 8 PI [ONT 71% (10
out of 14 mice) and sham 75% (9 out of 12 mice)]. None of the mice inoculated with
boiled virus died.
Immunohistochemistry of OBs from ONT and sham mice.
Viral antigen immunoreactivity. H1N1 immunoreactivity was mainly present in the
olfactory nerve (ON) and in the glomerular layer (GL) of the OB, and was observed in
both the ONT mice (Figures 4.5A and 4.5B) and the sham mice (Figures 4.5C and 4.5D).
The number of H1N1-IR cells was significantly reduced in the GL of the ONT group
(8.4± 1.47) when compared with the sham group [18.7 ± 3.69; p=0.02 (Figure 4.6)].
140

TNFα and IL1β immunoreactivities. TNFα- and IL1β-IR cells were evident 15 h PI in
the GL and external plexiform layer (EPL) of the OB from infected sham mice,
confirming our earlier report from studies of unoperated mice (Leyva-Grado et al., see
Chapter III). In infected ONT mice, the number of TNFα- (Figure 4.7A) and IL1β-IR
cells (Figure 4.7B) was significantly reduced in the EPL when compared with the sham
group [TNFα (ONT 14 ± 1.15; sham 20 ± 2.4; p=0.05); IL1β (ONT 12 ± 2.4; sham 15.3
± 1.3; p=0.05)]. In ONT mice, the number of TNFα-IR cells in the GL was less than the
corresponding number in sham mice (27± 6.1 versus 45 ± 5.5) but these differences only
showed a trend toward significance [p=0.08 (Figure 4.7A)]. The number of IL1β-IR cells
did not significantly change in the GL of the ONT group (31± 3.71) when compared with
the sham group [31 ± 3.51; p=0.73 (Figure 4.7B)].
Experiment II
Immunohistochemistry of midbrains from intact mice sacrificed at 10 or 15 h PI.
Viral antigen immunoreactivity. No H1N1 or NP viral antigen immunoreactivity was
found in the Pir, Tu, the amygdala or Arc either at 10 h or at 15 h PI.
TNFα immunoreactivity. In the Pir at 10 h PI, the number of TNFα-IR cells in mice
treated with live virus (15 ± 2.22) was not significantly different from the number found
in mice treated with boiled virus (12 ± 1.87, p= 0.2) (Figure 4.8). By 15 h PI there was a
significant increase in the number of TNFα-IR cells in the Pir of live virus-inoculated
mice (40 ± 6.86) compared with the same region from boiled virus-inoculated mice (31 ±
141
4.76, p = 0.04) (Figure 4.8). In the Pir, the majority of the TNFα-IR cells were located in
layer II (Figure 4.9). Similarly, in the Tu at 10 h PI, there was no significant difference in
the number of TNFα-IR cells between the groups receiving live virus (24 ± 4.99) and
boiled virus (25.5 ± 7.32, p= 0.57) (Figure 4.8). In contrast, at 15 h PI the number of
TNFα-IR cells increased in the mice inoculated with live virus (43± 2.48) compared to
control mice (31 ± 3.71, p= 0.02) (Figure 4.8). TNFα-immunoreactivity was mainly
located in the dense cell layer (DCL) of the Tu (Figure 4.9). In the BLA at 10 h PI,
there was also no significant difference in the number of TNFα-IR cells between mice
that received boiled virus (5 ± 1.52) and mice that received live virus (6 ± 2.01, p=0.28)
(Figure 4.8). Similarly, at 15 h PI, there were no significant differences between the mice
inoculated with live virus (19 ± 2.6) compared with mice inoculated with boiled virus (16
± 2.7, p=0.18) (Figure 4.8). In the CeA at 10 h PI, live virus inoculation did not alter the
number of TNFα-IR cells [boiled (11 ± 1.18) and live (13 ± 1.6, p=0.6)]. In contrast, by
15 h PI an increase in the number of TNFα-IR cells was observed in the CeA (live virus:
34 ± 2.12; boiled virus: 30 ± 1.42, p=0.05) (Figure 4.8). Finally, in the Arc, no significant
differences between the boiled virus- and the live virus-inoculated groups were observed
in the number of TNFα-IR cells either at 10 h PI (p= 0.57) or at 15 h PI (p= 0.23) (Figure
4.8).
IL1β immunoreactivity. In the Pir at 10 h PI, there was no significant difference in the
number of IL1β-IR cells between live virus- inoculated mice (44 ± 6.91) and mice that
received boiled virus (45 ± 7.61, p= 0.46) (Figure 4.10). By 15 h PI, however, the number
142

of IL1β-IR cells in the Pir significantly increased (58 ± 3.27 versus 49 ± 3.12, p = 0.02)
(Figure 4.10). IL1β immunoreactivity was mainly observed in layer II of the Pir (Figure
9). Similarly, in the Tu at 10 h PI, there was no significant difference in the number of
IL1β-IR cells between the live virus-inoculated mice (29 ± 5.93) and the boiled virus-
inoculated mice (34 ± 10.9, p= 0.65). However, at 15 h PI the number of IL1β-IR cells
increased in mice inoculated with live virus (36 ± 2.68) when compared with the same
region in control mice (28 ± 2.71, p= 0.04) (Figure 4.10). IL1β immunoreactivity was
observed in cells located in the DCL of the Tu (Figure 4.9). In the BLA at 10 h PI, there
was no significant difference in the number of IL1β-IR cells between mice that received
boiled virus (20 ± 3.13) and mice that received live virus (20 ± 2.3, p=0.39) (Figure
4.10). By 15 h PI, however, the number of IL1β-IR cells in mice inoculated with live
virus (25 ± 2.1) was higher compared with the corresponding number in boiled virus-
inoculated mice (21 ± 1.4) but these differences only showed a trend toward significance
(p=0.06) (Figure 4.10). In the CeA at 10 h PI, no significant differences were observed
between the mice that received boiled virus (23 ± 4.73) and the mice that received live
virus (24 ± 5.21, p=0.7) (Figure 4.10). However, by 15 h PI the number of IL1β-IR cells
in the CeA was significantly higher in live virus-inoculated mice (38 ± 1.64) compared to
the boiled virus-inoculated mice (33 ± 1.40, p= 0.03) (Figure 4.10). Finally, in the Arc at
10 h PI, there was no significant increase in the number of IL1β-IR cells in the live virus-
inoculated mice (34 ± 3.8) compared to the boiled virus-inoculated mice (32 ± 7.44, p=
0.43). In contrast, by 15 h PI, a significant increase in the number of IL1β-IR cells was
observed (live virus 56 ± 6.29 versus boiled virus 44 ± 2.67, p= 0.03) (Figure 4.10).
143

Double labeling. Both TNFα and IL1β immunoreactivity co-localized with NeuN in the
examined areas. Figure 4.11 shows an example of co-localization in the CeA for TNFα
and NeuN (Figure 4.11 A) and IL-1β and NeuN (Figure 4.11 B).
144

Discussion
The transection of the olfactory nerve at the level of the cribriform plate 10 days prior
to intranasal inoculation with influenza PR8 affected the APR by delaying the onset of
hypothermia for about 13 h. Furthermore, this surgical procedure also reduced the
number of OB TNFα- and IL1β-IR cells at 15 h PI after influenza viral challenge,
suggesting that the ON serves as a cytokine-activation pathway.
Hypothermia, rather than fever, is usually observed in mice in response to challenge
with influenza virus, regardless of the virus dose (Conn et al., 1995; Toth et al., 1995;
Traynor et al., 2007). In rodents with systemic inflammation, hypothermia functions as an
adaptive mechanism that correlates with enhanced protection and survival (Leon, 2004).
Influenza virus-induced hypothermia is a regulated response in the sense that infected
mice choose cool ambient temperatures even during the advance stage of the disease
when hypothermia is more evident (Klein et al., 1992). Furthermore, influenza-infected
mice show hypothermia even in warm environments (30 oC) (Jhaveri et al., 2007).
Current results showing the delay of the hypothermic response for about 13 h in mice that
received the ONT are consistent with the idea that the ON is involved very early in the
onset of hypothermia. However, this delay in the onset of hypothermia did not affect the
survival rate after the infection. Hypothermia, like fever, is mediated by cytokines such as
TNFα, IL-1β and interferons (Leon, 2004; Traynor et al., 2007).
145

TNFα and IL1β are associated with the initiation of the APR after influenza
infection, acting in the brain regions responsible for regulation of temperature, sleep,
food intake and sickness behavior (Hennet et al., 1992; Fang et al., 1995; Van Reeth,
2000; Schmitz et al., 2005). We found that the number of TNFα and IL1β−ΙR cells was
reduced in the EPL of the OB in the mice that received the ONT in comparison with the
sham group. Primary olfactory neuronal axons synapse in the EPL with dendrites of
second-order neurons such as the tufted cells (Astic and Saucier, 2001). Tufted cells,
along with the mitral cells in turn, extend axons to different regions of the brain.
Although, the mechanisms involved in the reduction of the number of cells expressing
TNFα and IL1β are not clear, current results clearly indicate that some signal from the
ON hastens the early expression of TNFα and IL1β in the OB.
The reduced locomotor activity observed in mice after influenza challenge (Conn et
al., 1995; Toth et al., 1995) was confirmed in the current studies after inoculation with
live PR8. However, we did not find significant differences between the ONT and Sham
groups, suggesting that the ON is not involved in the locomotor activity response after
the virus challenge. Consistent with our findings, no significant changes in locomotor
activity are observed as an effect of the ONT in uninfected animals (Harding and Wright,
1979; Yee and Constanzo, 1995; Astic and Saucier, 2001).
The reduced body weight and food intake after virus challenge was also consistent
with prior findings (Conn et al., 1995; Swiergiel et al., 1997). The fact that we found no
significant differences between the ONT and the Sham groups suggests that the ON is not
essential to induce changes in food intake and body weight responses to influenza
challenge. Previous studies in uninfected rodents also show that the ONT does not affect
146
normal food intake and body weight parameters (Yee and Constanzo, 1995; Yee and
Rawson, 2000). Since Tb, locomotor activity, food intake and body weight during the
APR are all thought to be regulated in part via enhanced cytokine production, current
results of only Tb being affected by the ONT indicate that the importance of the ON and
OB cytokines induced after influenza challenge is limited to hypothermia. The reason
why this would be the case is not known. Perhaps the hypothermic-responsive brain
regions are more sensitive to the olfactory input than the brain regions regulating
locomotor activity or food intake.
The olfactory system has the capacity to undergo neurogenesis and continuously
replace its primary olfactory neurons (Harding and Wright, 1979; Yee and Constanzo,
1995; Yee and Rawson, 2000). The olfactory receptor neurons (ORNs) are replaced when
cells undergo normal aging, nerve injury or following toxic chemical exposure. After the
ONT, an extended neuronal degeneration occurs within the first 2 days post-surgery
(Holcomb et al., 1995; Astic and Saucier, 2001). Immediately after the injury, a
proliferative response starts to replace the lost ORN (Constanzo et al., 2006). Restoration
of the olfactory mediated behavior is achieved within 20 to 30 days after surgery
(Harding and Wright, 1979; Yee and Constanzo, 1995). In our experiments we infected
the mice 10 days after the ONT. We use this time frame because we wanted the mice to
recover from the surgery before the infection. Furthermore, the expression and transport
within the ORN of carnosine and the olfactory marker protein (both markers of mature
ORN) do not start until between 15 and 45 days after surgery (Wright and Harding, 1982;
Constanzo et al., 2006). It is possible, that by the time of infection and in the days
following some cells have already reestablished connections with the OB. Accordingly,
147

the conclusions drawn for our transaction experiment regarding the role of the primary
olfactory tract and the secondary OB projections likely underestimate the importance of
this pathway.
The second major finding described herein was the presence of enhanced cytokine–IR
cell numbers after viral challenge in brain regions such as Pir, Tu, CeA and Arc. Studies
using bilateral lesions of the CeA demonstrate that herpes simplex virus-1 induced fever
and increased locomotor activity are attenuated in rats with a lesioned CeA compared
with a sham group (Weidenfeld et al., 2005). Furthermore, after systemic injections with
LPS (Konsman et al., 1999) or IL1β (Day et al., 1999) CeA c-fos mRNA and protein
expression increase in the CeA indicating activation in response to antigen-induced
stimulation (Sagar et al., 1995) and suggesting a role for the CeA in the regulation of the
APR (Weidenfeld et al., 2005). Our results are consistent with this idea because we found
that the number of TNFα and IL1β-IR cells increased in the CeA in response to viral
challenge.
The number of IL1β-IR cells also increased in the Arc after viral challenge.
Proinflammatory stimuli such as IL1β or LPS given systemically enhance the expression
of the neuronal activity marker c-Fos in the Arc (Bluthe et al., 2000; Reyes and
Sawchenko, 2002; Scarlett et al., 2007), thereby showing the activation of cells in this
area in response to the immune challenge. Our results are consistent with those findings
to the extent that after viral challenge the cells in the Arc are activated as evidenced by an
increase in the production of cytokines such as IL1β. After IP injection with
Staphylococcus enterotoxin, there is an increase in c-Fos-IR cells in the Arc that is not
observed in TNFα KO mice or when an anti-TNFα antibody is used (Rossi-George et al.,
148

2005). However, we only saw limited TNFα immunoreactivity in the Arc and the number
of TNFα-IR cells was not different between the mice inoculated with boiled virus and the
mice inoculated with live virus.
The Arc is close to the median eminence, a circumventricular organ (CVO). It is thus
possible that IL1β response in the Arc may be to signals of blood origin. CVOs are
highly vascularized structures that lie outside the blood brain barrier (Rivest et al., 2000)
and have cells that express cytokine receptors as well as toll-like receptors (Hopkins,
2007). Peritoneal injection of bacterial LPS increases IL1β (Konsman et al., 1999) and
TNFα (Breder et al., 1994) in CVOs. After influenza PR8 challenge, virus is sporadically
detected in blood (Mori et al., 1995; Majde et al., 2007) suggesting the possibility that
this source of virus stimulates Arc production of IL1β. Another possibility is that
cytokines of peripheral origin (e.g. lungs) signal the brain through afferent nerves such as
the vagal nerves that project to the nucleus tractus solitarius (NTS) in the caudal
brainstem and from the NTS through the afferent fibers that project to the Arc (Hansen et
al., 1998; Goehler et al., 2000; Kubota et al., 2001; Matsuda et al., 2004; Wieczorek et
al., 2005). For example, vagotomy blocks intraperitoneal IL1β-induced up regulation of
hypothalamic IL1β transcripts (Hansen et al., 1998).
Influenza PR8 is considered a neurotropic, but not neurovirulent, strain of virus
(Majde et al., 2007), and consequently the spread of this virus in the brain is unexpected.
In this study we were not able to observe viral antigen immunoreactivity in any of the
midbrain regions. This is consistent with previous studies by Iwasaki et al. (2004) who
did not observe viral antigen immunoreactivity in the central nervous system of PR8
infected mice. Other studies using a different non-neuroadapted strain of influenza and
149

inoculation directly into the brain parenchyma also showed that the virus fails to spread
beyond the injection site (Stevenson et al., 1997; Stevenson et al., 2002). These results
suggest that the increase in cytokines we observed in the midbrain is not directly induced
by viral antigens. Furthermore, after intranasal inoculation with a neurovirulent strain of
influenza, the virus replicates in the olfactory epithelium and spreads to the OB with no
further replication or spread of the virus to other regions of the brain. However, in
immunodeficient mice lacking the recombination activating gene 1 (necessary for
maturation of B and T lymphocytes) the virus persists in the OB for as long as 65 days PI
and spreads to different regions of the brain such as the primary olfactory cortex, raphe
nucleus and hypothalamus (Aronsson, et al., 2003). Results suggest that replication and
spread of the virus beyond the OB is controlled in part by innate immune factors in the
OB including microglia activation as we reported previously (Leyva-Grado et al., see
Chapter III).
TNFα and IL1β induce each others and their own production (Vitkovic et al., 2000;
Silverman et al., 2005). A possible mechanism involved in neuronal expression of TNFα
and IL1β along the olfactory pathway may involve cell to cell communication through
the release of nucleotides (Inoue et al., 2007). In response to the presence of the virus
there is likely an increase in neuronal activity (perhaps the ORNs in the olfactory
epithelium) that, in turn, is associated with release of adenosine triphosphate (ATP). ATP
binds to the P2 receptors on glial cells and stimulates the release of cytokines from these
cells (Domercq et al., 2006; Stock et al., 2006). Glial-released cytokines such as TNFα
and IL1β, as well as ATP, are considered gliotransmitters that likely stimulate nearby
neuronal TNFα and IL1β production.
150

In conclusion, our findings indicate that the surgical transection of the ON delays the
onset of hypothermia for 13 h and decreases the number of TNFα- and IL1β-IR cells in
the OB 15 h after PR8 inoculation, thereby strongly suggesting a role for the ON pathway
in the initial pathogenesis of influenza infection. Further, the enhancement of the number
of TNFα- and IL1β-IR cells in different regions of the olfactory pathway; i.e., Pir, Tu
(part of the olfactory cortex), CeA and Arc at 15 h but not at 10 h PI in intact mice
suggest that the activation of the different regions in this pathway is time dependant.
Finally, we found that the cytokine-producing cells in these regions are mainly neurons
suggesting that these cells are actively involved in the response to brain disturbances
caused by the virus challenge. Together, these data suggest a role for the olfactory
pathway in the activation of the APR after influenza infection that is mediated by the
increase in cytokines production.
151

References
Alt, JA, Bohnet, S, Taishi, P, Durika, D, Obal, F, Traynor, T, Majde, JA, Krueger, JM (2007). Influenza virus-induced glucocorticoid and hypothalamic and lung cytokine mRNA responses in dwarf lit/lit mice. Brain Behav. Immun. 21, 60-67.
Aronsson, F., Robertson, R., Ljunggren, H., Kristensson, K (2003). Invasion and
persistence of the neuroadapted influenza virus A/WSN/33 in the mouse olfactory system. Viral immunol. 16, 415-423.
Astic, L and Saucier, D (2001). Neuronal plasticity and regeneration in the olfactory
system of mammals: morphological and functional recovery following olfactory bulb deafferentation. Cell Mol. Life Sci. 58, 538-545.
Ben Hur, T, Rosenthal, J, Itzik, A, Weidenfeld, J (1996).Adrenocortical activation by
herpes virus: involvement of IL-1 beta and central noradrenergic system. Neuroreport. 7, 927-931.
Bluthé RM, Layé S, Michaud B, Combe C, Dantzer R, Parnet P (2000). Role of
interleukin-1beta and tumour necrosis factor-alpha in lipopolysaccharide-induced sickness behaviour: a study with interleukin-1 type I receptor-deficient mice.
Eur J Neurosci. 12, 4447-4456. Bouret, S, Draper, S, Simerly, R (2004). Formation of projection pathways from the
arcuate nucleus of the hypothalamus to hypothalamic regions implicated in the neural control of feeding behavior in mice. J Neurosci, 24,2797-2805.
Breder, C, Hazuka, C, Ghayur, T, Klug, C, Huginin, M, Yasuda, K, Teng, M, Saper, C
(1994). Regional induction of tumor necrosis factor alpha expression in the mouse brain after systemic lipopolysaccharide administration. Proc Natl Acad Sci U S A. 91,11393-11397.
Chen, L, Duricka, D, Nelson, S, Mukherjee, S, Bohnet, S, Taishi, P, Majde, JA, Krueger,
JM (2004). Influenza virus-induced sleep responses in mice with targeted disruptions in neuronal or inducible nitric oxide synthases. J Appl Physiol, 97, 17-28.
Chiba T, Murata Y. (1985) Afferent and efferent connections of the medial preoptic area
in the rat: a WGA-HRP study. Brain Res Bull. 14, 261-272. Churchill, L., Yasuda, K., Yasuda, T., Blindheim, K., Falter, M., Garcia-Garcia, F.,
Krueger, J., 2005. Unilateral cortical application of tumor necrosis factor-α induces asymmetry in Fos- and interleukin-1β-immunoreactive cells within the corticothalamic projection. Brain Res. 1055, 15-24.
152

Conn C, McClellan J, Maassab H, Smitka C, Majde J, Kluger M (1995). Cytokines and the acute phase response to influenza virus in mice. Am J Physiol. 268, R78-R84.
Constanzo, R., Perrino, L., Kobayashi, M (2006). Response of matrix metalloproteinase-9
to olfactory nerve injury. Neuroreport, 17, 1787-17891. Day, H., Curran, E., Watson, S., Akil, H (1999). Distinct neurochemical populations in
the rat central nucleus of the amygdala and bed nucleus of the stria terminalis: evidence for their selective activation by interleukin-1beta. J Comp Neurol. 413, 113-128.
Domercq, M., Brambilla, L., Pilati, E., Marchaland, J., Volterra, A., Bezzi, P (2006). P2Y1 receptor-evoked glutamate exocytosis from astrocytes: control by tumor
necrosis factor-alpha and prostaglandins. J Biol Chem. 281, 30684-30696. Fang, J, Sanborn, C, Renegar K, Majde J, Krueger, J (1995). Influenza viral infections
enhance sleep in mice. Proc Soc Exp Biol Med. 210, 242-252. Frenois, F., Moreau, M., O'Connor, J., Lawson, M., Micon, C., Lestage, J., Kelley, K., Dantzer, R., Castanon, N (2007). Lipopolysaccharide induces delayed
FosB/DeltaFosB immunostaining within the mouse extended amygdala, hippocampus and hypothalamus, that parallel the expression of depressive-like behavior. Psychoneuroendocrinology, 32, 516-531.
Glantz, S (2002). Primer of Biostatistics. 5th edition. McGrawHill, USA. Goehler, L., Gaykema, R., Hansen, M., Anderson, K., Maier, S., Watkins, L (2000). Vagal immune-to-brain communication: a visceral chemosensory pathway. Auton
Neurosci. 85, 49-59. Hansen, M., Taishi, P., Chen, Z., Krueger J (1998). Vagotomy blocks the induction of
interleukin-1beta (IL-1beta) mRNA in the brain of rats in response to systemic IL-1beta. J Neurosci. 18, 2247-2253.
Harding, J., Wright, J (1979).Reversible effects of olfactory nerve section on behaviour
and biochemistry in mice. Brain Res Bull. 4, 17-22. Hennet T, Ziltener HJ, Frei K, Peterhans E (1992). A kinetic study of immune mediators
in the lungs of mice infected with influenza A virus. J Immunol. 149, 932-939. Holcomb, J., Mumm, J., Calof, A (1995). Apoptosis in the neuronal lineage of the mouse
olfactory epithelium: regulation in vivo and in vitro. Dev Biol. 172, 307-323. Hopkins, SJ (2007). Central nervous system recognition of peripheral inflammation: a
neural, hormonal collaboration. Acta Biomed 78 Suppl, 1, 231-247.
153

Inoue, K., Koizumi, S., Tsuda (2007). The role of nucleotides in the neuron-glia communication responsible for brain functions. J Neurochem. 102, 1447-1458.
Iwasaki, T, Itamura, S, Nishimura, H, Sato, Y, Tashiro, M, Hashikawa, T, Murata, T
(2004). Productive infection in the murine central nervous system with avian influenza virus (H5N1) after intranasal inoculation. Acta Neuropathol, 108, 485-492.
Jhaveri, K., Trammell, R., Toth, L (2007) Effect of environmental temperature on sleep,
locomotor activity, core body temperature and immune responses of C57BL/6J mice. Brain Behav Immun. 21, 975-987. Johnson, D., Illing, K., Behan, M., Haberly, L (2000). New features in connectivity in
piriform cortex visualized by intracellular injection of pyramidal cells suggest that “primary” olfactory cortex function like “association” cortex in other sensory systems. J Neurosci. 20, 6974-6982.
Kapás, L., Bohnet, s., Traynor, T., Majde, J., Szentirmai, E., Magrath, P., Taishi, P.,
Krueger, J. Spontaneous and influenza virus-induced sleep are altered in TNF-α double-receptor deficient mice. (In review).
Kent, S, Bluthe, R, Kelley, K, Dantzer, R (1992). Sickness behavior as a new target for
drug development. Trends Pharmacol Sci, 13, 24-28. Klein, M, Conn, C, Klueger, M (1992). Behavioral thermoregulation in mice inoculated
with influenza virus.Physiol Behav, 52,1133-1139. Konsman JP, Kelley K, Dantzer R (1999). Temporal and spatial relationships between
lipopolysaccharide-induced expression of Fos, interleukin-1beta and inducible nitric oxide synthase in rat brain.Neuroscience, 89, 535-548.
Kubota, T., Fang, J., Guan, Z., Brown, R., Krueger, J (2001). Vagotomy attenuates tumor
necrosis factor-alpha-induced sleep and EEG delta-activity in rats. Am J Physiol Regul Integr Comp Physiol. 280, R1213-R1220.
LeDoux, J (2007). The amygdala. Current Biology. 17, R868-R874. Leon, L (2004). Hypothermia in systemic inflammation: role of cytokines. Front Biosci.
9, 1877-1888. Leyva-Grado, V, Churchill, L, Wu, M, Majde, J, Krueger, J. Influenza virus- and
cytokine-immunoreactive cells increase in the murine olfactory bulb after intranasal inoculation. See Chapter III.
Lin, L., York, D ( 2004). Amygdala enterostatin induces c-Fos expression in regions of
hypothalamus that innervate the PVN. Brain res. 1020, 147-153.
154

Majde, JA, Bohnet, S, Ellis, G, Churchill, L, Leyva-Grado, V, Wu, M, Szentirmai E, Rehman A, Krueger, JM (2007). Detection of mouse-adapted human influenza viruses in the olfactory bulbs of mice within hours after intranasal inoculation. J Neurovirol, 13, 399-409.
Matsuda, K, Park, C., Sunden, Y., Kimura T., Ochiai, K., Kida, H., Umemura, T
(2004).The vagus nerve is one route of transneural invasion for intranasally inoculated influenza a virus in mice. Vet Pathol 41,101-107.
Mori, I., Komatsu, T., Takeuchi, K., Nakakuki, K., Sudo, M., Kimura, Y (1995). Viremia
induced by influenza virus. Microbiol Pathog. 19, 237-244. Obal, F Jr, Krueger, J (2003). Biochemical regulation of non-rapid-eye-movement sleep. Front Biosci, 8, d520-d550. Opp, M (2005). Cytokines and sleep. Sleep Med Rev, 9, 355-364. Price, J., Slotnick, B., Revial, M (1991). Olfactory projections to the hypothalamus. J
Comp Neurol. 306, 447-461. Price, J (2003). Comparative aspects of amygdala connectivity. Ann N Y Acad Sci. 985,
50-58. Reyes, T., Sawchenko, P (2002). Involvement of the arcuate nucleus of the hypothalamus
in interleukin-1-induced anorexia. J Neurosci. 22, 5091-9. Rivest, S., Lacroix, S., Vallières, L., Nadeau, S., Zhang, J., Laflamme, N (2000). How
the blood talks to the brain parenchyma and the paraventricular nucleus of the hypothalamus during systemic inflammatory and infectious stimuli. Proc Soc Exp Biol Med. 223, 22-38.
Rossi-George, A., Urbach, D., Colas, D., Goldfarb, Y., Kusnecov, A (2005). Neuronal,
endocrine, and anorexic responses to the T-cell superantigen staphylococcal enterotoxin A: dependence on tumor necrosis factor-alpha. J Neurosci. 25, 5314-5322.
Sagar, S., Price, K., Kasting, N., Sharp, F (1995). Anatomic patterns of Fos
immunostaining in rat brain following systemic endotoxin administration. Brain Res. Bull. 36, 381–392.
Scarlett, J., Jobst, E., Enriori, P., Bowe, D., Batra, A., Grant, W., Cowley, M., Marks, D
(2007). Regulation of central melanocortin signaling by interleukin-1 beta. Endocrinology. 148, 4217-4225.
155

Schmitz, N., Kurrer, M., Bachmann, M., Kopf, M., (2005). Interleukin-1 is responsible for acute lung immunopathology but increases survival of respiratory influenza virus infection. J Virol. 79, 6441-6448.
Silverman, S., Pearce, B., Biron, C., Miller, A (2005). Immune modulation of the
hypothalamic-pituitary-adrenal (HPA) axis during viral infection. Viral Immunol. 18, 41-78.
Stevenson, P., Freeman, S., Bangham, C., Hawke, S (1997). Virus dissemination through
the brain parenchyma without immunologic control. J Immunol. 159,1876-1884. Stevenson, P., Austyn, J., Hawke, S (2002). Uncoupling of virus-induced inflammation
and anti-viral immunity in the brain parenchyma. J Gen Virol. 83,1735-1743. Stock, C., Schilling, T., Schwab, A., Eder, C (2006). Lysophosphatidylcholine stimulates
IL-1beta release from microglia via a P2X7 receptor-independent mechanism. J Immunol.177, 8560-8568.
Swiergiel, A., Smagin, G., Dunn, A (1997). Influenza virus infection of mice induces
anorexia: comparison with endotoxin and interleukin-1 and the effects of indomethacin. Pharmacol Biochem Behav. 57, 389-396.
Szretter, K., Gangappa, S., Lu, X., Smith, C., Shieh, W., Zaki, S., Sambhara, S., Tumpey,
T., Katz, J (2007). Role of host cytokine responses in the pathogenesis of avian H5N1 influenza viruses in mice. J Virol. 81, 2736-2744.
Toth, L., Rehg, J., Webster, R (1995). Strain differences in sleep and other pathophysiological sequelae of influenza virus infection in naive and immunized
mice. J Neuroimmunol. 58, 89-99. Traynor, T., Majde, J., Bohnet, S., Krueger, J (2004). Intratracheal double-stranded RNA
plus interferon-gamma: a model for analysis of the acute phase response to respiratory viral infections. Life Sci. 74, 2563-2576.
Traynor, T, Majde, J, Bohnet, S, Krueger, J (2007). Interferon type I receptor-deficient mice have altered disease symptoms in response to influenza virus. Brain Beh
Immun. 21, 311-322. Ubeda-Bañon, I., Novejarque, A., Mohedano-Moriano, A., Pro-Sistiaga, P., de la Rosa-
Prieto, C., Insausti, R., Martinez-Garcia, F., Lanuza, E., Martinez-Marcos, A (2007). Projections from the posterolateral olfactory amygdala to the ventral striatum: neural basis for reinforcing properties of chemical stimuli. BMC Neurosci. 8:103.
Van Reeth, K (2000). Cytokines in the pathogenesis of influenza. Vet Microbiol. 74, 109-
116.
156

Vitkovic, L., Konsman, J., Bockaert, J., Dantzer, R., Homburger, V., Jacque, C (2000). Cytokine signals propagate through the brain. Mol Psych. 5, 604-615.
Weidenfeld, J., Itzik, A., Goshen, I., Yirmiya, R., Ben-Hur, T (2005). Role of the central
amygdala in modulating the pituitary-adrenocortical and clinical responses in experimental herpes simplex virus-1 encephalitis. Neuroendocrinology, 81,267-272.
Wieczorek, M., Swiergiel, A., Pournajafi-Nazarloo, H., Dunn, A (2005). Physiological
and behavioral responses to interleukin-1beta and LPS in vagotomized mice. Physiol Behav. 85, 500-511.
Wright, J., Harding, J (1982).Recovery of olfactory function after bilateral bulbectomy.
Science, 216, 322-324. Xu, Y., Day, T., Buller, K (1999). The central amygdala regulates hypothalamic-
pituitary-adrenal axis responses to systemic interleukin-1β administration. Neurosc. 94, 175-183.
Yee, K., Constanzo, R (1995). Restoration of olfactory mediated behavior after olfactory
bulb deafferentation. Physiol Behavior, 58, 959-968. Yee, K., Rawson, N (2000). Retinoic acid enhances the rate of olfactory recovery after
olfactory nerve transection. Develop Brain Res. 124, 129-132.
157

Figure 4.1 Photomicrographs of sagital sections of the olfactory epithelium showing
their connectivity with the olfactory bulb. (A) A sagital section showing the axons of the
olfactory receptor neurons connecting with the glomerular layer of the olfactory bulb in a
mouse that received a sham surgery. (B) A sagital section showing that the connectivity
between the axons and the olfactory bulb is lost after the olfactory nerve transaction
surgery. The scale bar is 0.02 mm. OE, olfactory epithelium; ON, olfactory nerve; GL,
glomerular layer.
158

Hours-24 -12 0 12 24 36 48
Bod
y Te
mpe
ratu
re (C
o )
32
33
34
35
36
37
38ONT (n=14)SHAM (n=12)
Inoculation
*
*
Figure 4.2 Time course of body temperature changes in ONT or sham mice following
intranasal inoculation with influenza virus. The mice with a transected olfactory nerve
(ONT) delay their hypothermia response to influenza virus by 13 h. Data points represent
the means +/- SEM at 1 hour intervals. * represents significant differences, p<0.05
between the ONT and the sham groups. The solid horizontal bars along the abscissa mark
the 12 h dark periods.
159

Hours
Nor
mal
ized
Act
ivity
0
50
100
150
200
250
300
350 ONT(n=14)SHAM (n=12)
0-12-24 12 24 36 48
Inoculation
Figure 4.3 Locomotor activity responses to PR8 challenge in ONT or sham mice.
Data points represent the means +/- SEM at 1 hour intervals. No significant differences
were observed between the olfactory nerve transected (ONT) and the Sham groups. After
live viral challenge, activity increased for about 4 h compared with the same time of the
baseline day. It then decreased below baseline values in both groups. The second day
after viral challenge, activity remained below baseline levels. The solid horizontal bars
along the abscissa mark the 12 h dark periods.
160

0
1
2
3
4
5
6
7
0 1 2 3 4 5 6
Time post-infection (Days)
Food
inta
ke (g
/day
)
BOILED (n=5)ONT (N=5)SHAM (N=5)
*
70
80
90
100
0 1 2 3 4 5 6
Time post-infection (Days)
Body
wei
ght (
% o
f ini
tial b
ody
weig
ht)
BOILED (n=5)ONT (n=5)SHAM (n=5)
*
B
A
Figure 4.4 Food intake and body weight following intranasal inoculation with
influenza virus in ONT or sham mice. Food intake (A) and weight (B) were determined
for 6 days. (A) Data points represent the food consumption for the 24 h previous to the
measurement. A decrease in food intake was observed in the ONT and sham groups that
received live virus compared to the sham mice that received the boiled virus. (B) Data
points represent the percentage of body weight in relationship to the initial body weight
161

(day of virus challenge or day 0). Mice inoculated with live virus (ONT and sham) lost
weight when compared with the sham mice that received boiled virus. (*) represents
significant differences, p<0.05 between the ONT and the sham groups compared to the
boiled group.
162
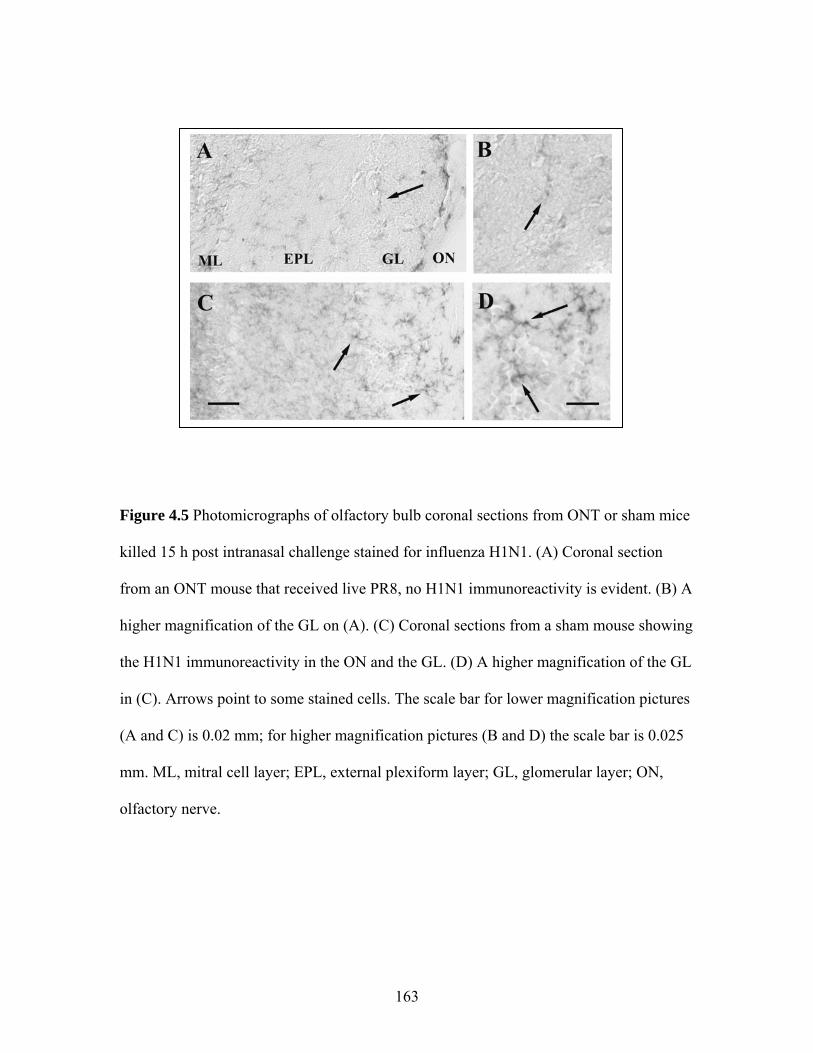
Figure 4.5 Photomicrographs of olfactory bulb coronal sections from ONT or sham mice
killed 15 h post intranasal challenge stained for influenza H1N1. (A) Coronal section
from an ONT mouse that received live PR8, no H1N1 immunoreactivity is evident. (B) A
higher magnification of the GL on (A). (C) Coronal sections from a sham mouse showing
the H1N1 immunoreactivity in the ON and the GL. (D) A higher magnification of the GL
in (C). Arrows point to some stained cells. The scale bar for lower magnification pictures
(A and C) is 0.02 mm; for higher magnification pictures (B and D) the scale bar is 0.025
mm. ML, mitral cell layer; EPL, external plexiform layer; GL, glomerular layer; ON,
olfactory nerve.
163

H1N
1-IR
cel
ls
0
5
10
15
20
25sham ONT *
Figure 4.6 Quantitative analyses of the number of the viral antigen H1N1-
immunoreactive (IR) cells in the OB of ONT or sham mice inoculated with live virus.
One group of mice had their olfactory nerves transected (ONT) prior to the challenge
(n=6), the other group received a sham surgery (n=6). The number of H1N1-IR cells was
significantly different between the two groups. Mice were inoculated with virus 10 days
subsequent to olfactory nerve transaction. (*) indicates p<0.05.
164

GL EPL
TNF α
-IR c
ells
0
10
20
30
40
50
60ONT SHAM
*
A
GL EPL
IL-1
β-IR
cel
ls
0
10
20
30
40
50
60ONT SHAM
*
B
165

Figure 4.7 Quantitative analyses of the number of TNFα- and IL1β-immunoreactive
(IR) cells in the OB of ONT or sham mice inoculated with live virus. One group of mice
had their olfactory nerves transected (ONT) prior to the challenge (n=6), the other group
received a sham surgery (n=6). The number of TNFα-IR (A) and IL1β-IR cells (B) cells
was significantly different between the two groups in the external plexiform layer (EPL).
No significant differences were observed in the glomerular layer (GL). Mice were
inoculated with virus 10 days subsequent to olfactory nerve transaction.(*) indicates
p<0.05.
166

Pir-10 Pir-15 Tub-10 Tub-15 BLA-10 BLA-15 CeA-10 CeA-15 Arc-10 Arc-15
TNFα
-IR c
ells
0
20
40
60
80Boiled Live
* **
Figure 4.8 The number of TNFα- immunoreactive (IR) cells in the piriform cortex
(Pir), the olfactory tubercle (Tu), the basolateral amygdala (BLA), the central amygdala
(CeA) and the hypothalamic arcuate nucleus (Arc) at 10 h and 15 h after intranasal
inoculation with influenza virus. At 10 h post inoculation no significant differences
between the two groups were observed in any of the regions. At 15 h, the number of
TNFα-IR cells increased in Pir, Tu and CeA in mice inoculated with live virus compared
to the mice that received boiled virus. No significant changes were observed in the BLA
or Arc. (*) indicates a significant difference (p< 0.05). The area used for TNFα
quantification in the Pir and Tu was 0.053 mm2, the BLA and the CeA was 0.012 mm2
and the Arc was 0.03 mm2.
167
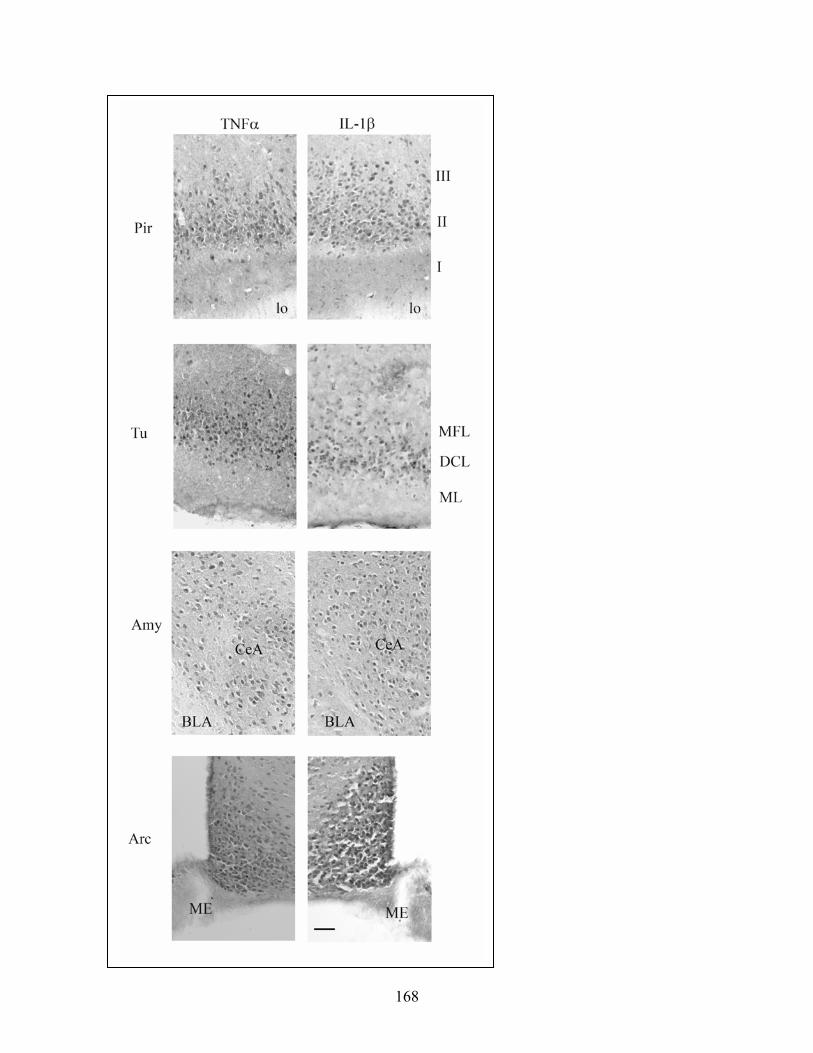
168

Figure 4.9 Distribution of the TNFα- and IL1β- immunoreactive (IR) cells in the
piriform cortex (Pir), olfactory tubercle (Tu) amygdala (Amy) and the hypothalamic
arcuate nucleus (Arc) at 15 h after intranasal inoculation with live PR8 influenza virus.
In the Pir, IR cells for both cytokines were observed in the layer II; in the Tu, TNFα and
IL-1β-IR cells were located in the dense cell layer (DCL). Both the central amygdala
(CeA) and basolateral amygdala (BLA) also showed immunoreactivity for TNFα and
IL1β. Scale bar= 0.05 mm. Abbreviations: lo (lateral olfactory tract), ML (molecular
layer), MFL (multiform layer), ME (median eminence).
169

Pir-10 Pir-15 Tub-10 Tub-15 BLA-10 BLA-15 CeA-10 CeA-15 Arc-10 Arc-15
IL-1
β-IR
cel
ls
0
20
40
60
80Boiled Live
*
* *
*
Figure 4.10 Quantitative analyses of the number of IL-1β- immunoreactive (IR) cells
in the piriform cortex (Pir), the olfactory tubercle (Tu), the basolateral amygdala (BLA),
the central amygdala (CeA) and the hypothalamic arcuate nucleus (Arc) at 10 h and 15 h
after intranasal inoculation with influenza virus. At 10 h post inoculation no significant
differences between the two groups were observed in any of the analyzed regions. At 15
h, the number of IL-1β-IR cells increased in Pir, Tu, CeA and Arc in mice inoculated
with live virus compared to those that received boiled virus. No significant changes were
observed in BLA. (*) indicates a significant difference (p< 0.05). The area used for IL-1β
quantification in the Pir and Tu was 0.053 mm2, the BLA and the CeA was 0.012 mm2
and the Arc was 0.03 mm2.
170
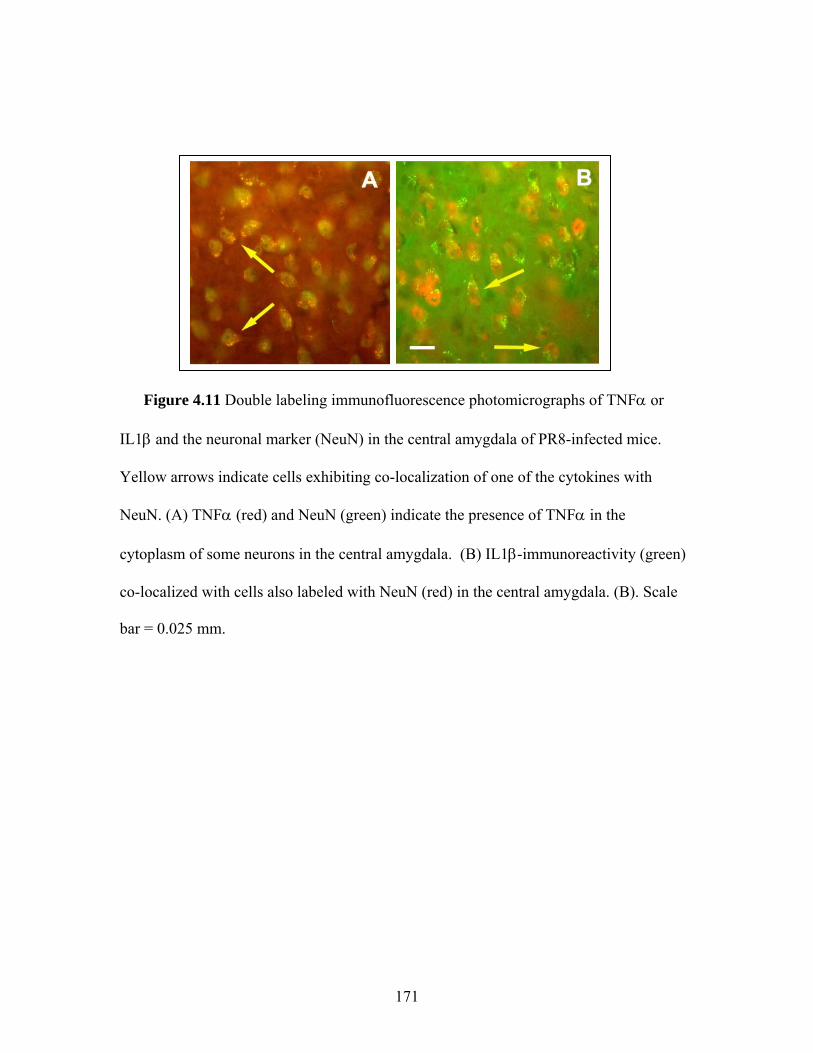
Figure 4.11 Double labeling immunofluorescence photomicrographs of TNFα or
IL1β and the neuronal marker (NeuN) in the central amygdala of PR8-infected mice.
Yellow arrows indicate cells exhibiting co-localization of one of the cytokines with
NeuN. (A) TNFα (red) and NeuN (green) indicate the presence of TNFα in the
cytoplasm of some neurons in the central amygdala. (B) IL1β-immunoreactivity (green)
co-localized with cells also labeled with NeuN (red) in the central amygdala. (B). Scale
bar = 0.025 mm.
171

CHAPTER V
GENERAL DISCUSSION
The experiments detailed in this dissertation describe one of the potential mechanisms
involved in the genesis of the influenza virus-induced acute phase response (APR). In this
chapter, the major findings of this thesis work will be briefly summarized and discussed
in the broader context of the pathogenesis of the APR.
Data presented in chapter II demonstrate that after intranasal inoculation with
influenza virus, the virus localizes and partially replicates in the olfactory bulb (OB) of
the brain. This is remarkable because most human mouse-adapted strains of influenza are
thought to replicate only in the respiratory tract (Hennet et al., 1992; Ward, 1997).
Although Mori et al. (1995), did show the presence of the virus in the brain at day 5 post
infection (PI), when the clinical signs of disease are advanced, we found genomic RNA
as well as replication intermediates in the brain as early as 4 h PI. One of the hallmarks of
influenza infection in mice is the presence of hypothermia (Hennet et al., 1992; Conn et
al., 1995). The hypothermia peak is between 13 and 15 h PI (chapters II and IV; Toth et
al., 1995; Fang et al., 1995). This physiological response at 13-15 h PI may be caused by
the presence of the virus in the OB at 4 h after inoculation.
Within hours of exposure, the viral antigen was found in the olfactory nerve (ON), the
glomerular layer (GL), and, to a lesser extent, in the external plexiform layer (EPL) of the
OB. It was localized in microglia and astrocytes, but not in neurons (Chapter III).
Microglial cells are the resident macrophages of the CNS that function as part of the
172

mechanisms of immune defense against microorganisms and injury (Hanisch and
Kettenmann, 2007). During the immune response to an insult, astrocytes participate by
promoting neuroinflammation through NF-κB-dependant pathways and by restoring
brain homeostasis (Farina et al., 2007). In agreement with my results, previous studies
show that PR8 localization in the CNS is restricted to glial cells (Bradshaw et al., 1989;
Wang et al., 2008). Results also suggested that PR8 goes at least through a partial
replication in the OB as previously demonstrated in mouse brain cell cultures (Bradshaw
et al., 1989).
One of the main effects observed in response to the presence of the virus in the OB
was the production of cytokines as evidenced by an increase in TNFα- and IL1β- mRNA
(chapter II) and TNFα- and IL1β- IR cells (chapter III). An increase in cytokines,
particularly pro-inflammatory cytokines, is a hallmark of the initial immune response to
the presence of microorganisms (Dantzer et al., 2008). In the CNS, microglia, astrocytes,
oligodendrocytes and neurons may express and produce cytokines in response to the
presence of a microorganism. Also neuroimmunomodulatory signals, such as cytokines
or gliotranmitters (ATP or glutamate), may be produced by microglia and astrocytes,
which first recognize the presence of the attack (Konsman et al., 2002; Liu et al., 1994;
Ohtori et al., 2004; Owens et al., 2005). Our studies confirm that microglia, astrocytes
and neurons in the OB are able to respond to the presence of the virus by increasing the
synthesis and expression of both TNFα and IL1β.
The increased expression of cytokines also extended to other regions of the brain
(chapter IV). We found an increase in the number of TNFα and IL1β-immunoreactive
cells in different regions that receive direct or indirect input from the OB, including the
173

CeA and the Arc. The amygdala is involved in the APR; in particular the CeA mediates
the neuroendocrine, febrile and behavioral responses to HSV-1 infection (Weidenfeld et
al., 2005). The Arc is involved in different physiological activities, including energy
homeostasis and food intake. Anorexia is considered part of the sickness behavior
response (Konsman and Dantzer, 2001) and it is observed during infection (Reyes and
Sawchenko, 2002). The mechanism of how the OB cytokines communicate with the
different regions in the brain to induce cytokine expression has not been completely
elucidated but may include signaling through adenosine or ATP (Hasko et al., 2005;
Inoue et al., 2007).
The ON pathway plays an important role in the expression of hypothermia following
an influenza virus challenge. Mice that received an olfactory nerve transection (ONT)
show a 13 h delay in the onset of hypothermia compared to sham-operated mice (chapter
IV). The ON pathway is used by several viruses to reach the brain after intranasal
inoculation (Barnett and Perlman, 1993; Becker, 1995; Park et al., 2002). The ON
transport of virus may be accomplished by axonal transport or by an olfactory epithelial
pathway (Dahlin et al., 2000). Furthermore, the presence of channels formed by olfactory
ensheathing cells and ON fibroblasts that surround the ON (Li et al., 2005) may be
another pathway used by the virus to reach the OB. Our data suggests that the virus
enters through the olfactory ensheathing cells, but we have not completed the electron
microscopic analyses to prove which particular pathway is used by the PR8 strain in our
model. However, my results clearly indicate that transection of the ON pathway delays
the onset of hypothermia.
174

In summary, our results indicate that the PR8 strain of influenza virus that was
considered a non-neurotropic strain is indeed a neurotropic strain without neurovirulent
characteristics. The virus is able to reach the OB very early after intranasal inoculation
and colocalizes within microglia and astrocytes. The presence of the virus induces the
production of cytokines such as TNFα and IL1β in the OB as well as in specific regions
of the brain that receive direct or indirect connection from the OB. We also conclude that
the ON plays a very important role in the manifestation of the APR following the
challenge with influenza virus. Overall, the results presented in this thesis elucidate in
part the possible mechanism involved in the pathogenesis of the APR in influenza
infected mice.
175

References
Barnett, E., Perlman, S (1993). The olfactory nerve and not the trigeminal nerve is the major site of CNS entry for mouse hepatitis virus, strain JHM. Virology, 194, 185-191.
Becker, Y (1995). HSV-1 brain infection by the olfactory nerve route and virus latency
and reactivation may cause learning and behavioral deficiencies and violence in children and adults: a point of view. Virus Genes, 10, 217-226.
Bradshaw, G., Schlesinger, R., Schwartz, C (1989). Effects of cell differentiation on
replication of A/WS/33, WSN, and A/PR/8/34 influenza viruses in mouse brain cell cultures: biological and immunological characterization of products. J Virol. 63, 1704-1714.
Conn, C., McClellan, J., Maassab, H., Smitka, C., Majde, J., Kluger, M (1995). Cytokines
and the acute phase response to influenza virus in mice. Am J Physiol. 268(1 Pt 2), R78-R84.
Dahlin, M, Bergman, U, Jansson, B, Bjork, E, Brittebo, E (2000). Transfer of dopamine
in the olfactory pathway following nasal administration in mice. Pharm Res. 17, 737-742.
Dantzer, R., O'Connor, J., Freund, G., Johnson, R., Kelley, K (2008). From inflammation
to sickness and depression: when the immune system subjugates the brain. Nat Rev Neurosci. 9, 46-56.
Fang, J., Sanborn, C., Renegar, K., Majde, J., Krueger, J (1995). Influenza viral
infections enhance sleep in mice. Proc Soc Exp Biol Med. 210, 242-252. Farina, C., Aloisi, F., Meinl, E (2007). Astrocytes are active players in cerebral innate
immunity. Trends Immunol. 28, 138-145. Hanisch, U., Kettenmann, H (2007). Microglia: active sensor and versatile effector cells
in the normal and pathologic brain. Nat Neurosci. 10, 1387-1394. Haskó, G., Pacher, P., Vizi, E., Illes, P (2005). Adenosine receptor signaling in the brain
immune system. Trends Pharmacol Sci. 26, 511-516. Hennet, T., Ziltener, H., Frei, K., Peterhans, E (1992). A kinetic study of immune
mediators in the lungs of mice infected with influenza A virus. J Immunol. 149, 932-939.
176

Inoue, K., Koizumi, S., Tsuda (2007). The role of nucleotides in the neuron-glia communication responsible for brain functions. J Neurochem. 102, 1447-1458.
Konsman, J., Parnet, P., Dantzer, R (2002). Cytokine-induced sickness behavior:
mechanisms and implications. Trends Neurosci. 25, 154-159. Konsman, J., Dantzer, R (2001). How the immune and nervous systems interact during
disease-associated anorexia. Nutrition, 17, 664-668. Li, Y., Field, P., Raisman, G (2005). Olfactory ensheathing cells and olfactory nerve
fibroblasts maintain continuous open channels for regrowth of olfactory nerve fibres. Glia, 52, 245-251.
Liu, T., Clark, R., McDonell, P., Young, P., White, R., Barone, F., Feuerstein, G (1994).
Tumor necrosis factor-alpha expression in ischemic neurons. Stroke, 25, 1481-1488. Mori, I., Komatsu, T., Takeuchi, K., Nakakuki, K., Sudo, M., Kimura, Y (1995). Viremia
induced by influenza virus. Microb Pathog. 19, 237-244. Ohtori, S., Kazuhisa, T., Hideshige, M., Myers, R (2004). TNF-α and TNF-α receptor
type 1 upregulation in glia and neurons after peripheral nerve injury. Spine, 29, 1082-1088.
Owens, T., Babcock, A., Millward, M., Toft-Hansen, H (2005). Cytokine and chemokine
inter-regulation in the inflamed or injured CNS. Brain Res. Rev. 48, 178-184. Park, C., Ishinaka, M., Takada, A., Kida, H., Kimura, T., Ochiai, K., Umemura, T (2002).
The invasion routes of neurovirulent A/Hong Kong/483/97 (H5N1) influenza virus into the central nervous system after respiratory infection in mice. Arch Virol. 147, 1425-1436.
Reyes, T., Sawchenko, P (2002). Involvement of the arcuate nucleus of the hypothalamus
in interleukin-1-induced anorexia. J Neurosci. 22, 5091-5099. Toth, L., Rehg, J., Webster, R (1995). Strain differences in sleep and other
pathophysiological sequelae of influenza virus infection in naive and immunized mice. J Neuroimmunol. 58, 89-99.
Wang, G., Zhang, J., Li, W., Xin, G., Su, Y., Gao, Y., Zhang, H., Lin, G., Jiao, X., Li, K
(2008). Apoptosis and proinflammatory cytokine responses of primary mouse microglia and astrocytes induced by human H1N1 and avian H5N1 influenza viruses. Cell Mol Immunol. 5, 113-120.
Ward, A (1997). Virulence of influenza A virus for mouse lung. Virus genes, 14, 187-
194.
177

178
Weidenfeld, J., Itzik, A., Goshen, I., Yirmiya, R., Ben-Hur, T (2005). Role of the central amygdala in modulating the pituitary-adrenocortical and clinical responses in experimental herpes simplex virus-1 encephalitis. Neuroendocrinology, 81, 267-272.