Embed Size (px)
Citation preview
Network Optimization using AIMMS in the Analytics & Visualization Era
Dr. Ovidiu Listes
Senior Consultant
AIMMS Analytics and Optimization
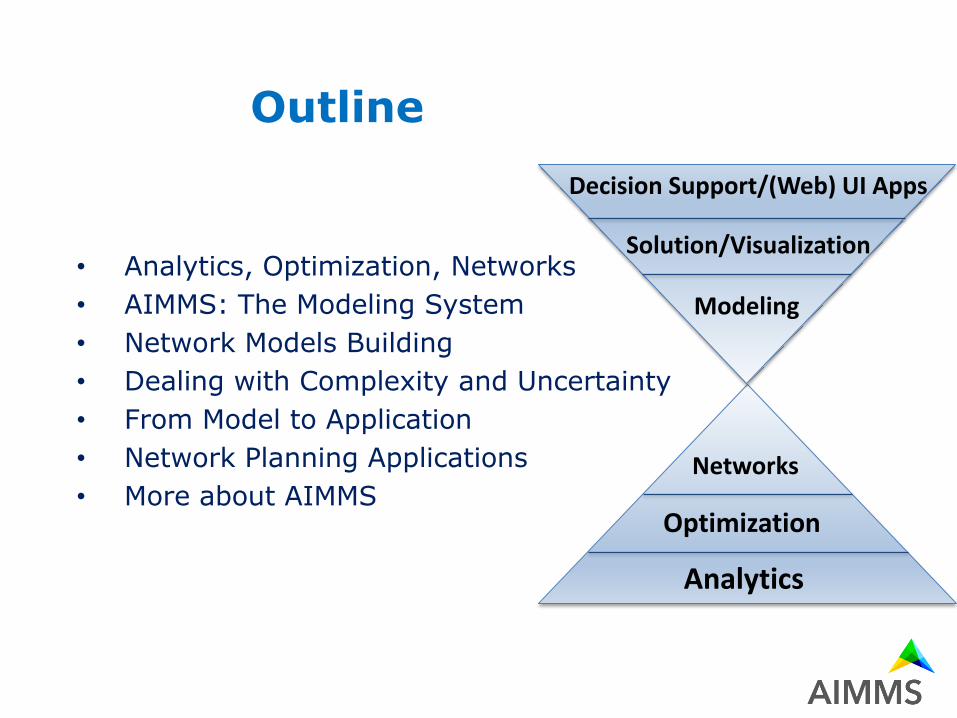
• Analytics, Optimization, Networks
• AIMMS: The Modeling System
• Network Models Building
• Dealing with Complexity and Uncertainty
• From Model to Application
• Network Planning Applications
• More about AIMMS
Analytics
Optimization
Networks
Decision Support/(Web) UI Apps
Solution/Visualization
Modeling
Outline
Analytics, Optimization, Networks
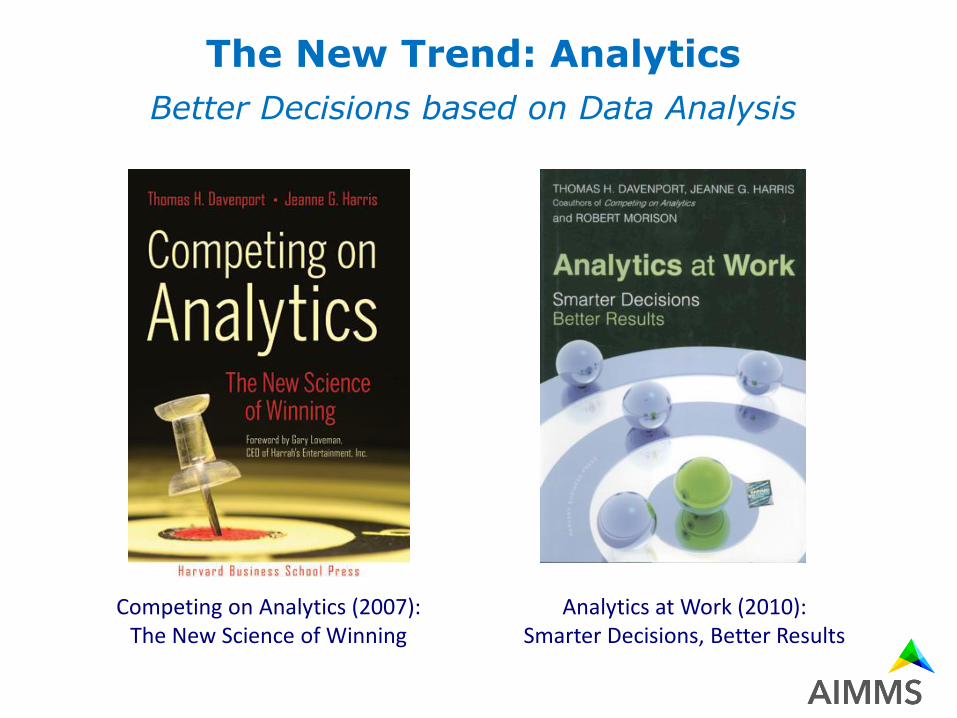
The New Trend: Analytics
Better Decisions based on Data Analysis
Analytics at Work (2010): Smarter Decisions, Better Results
Competing on Analytics (2007): The New Science of Winning
Getting the Optimization Edge
Competitive advantage through Optimization
Why do some companies become industry leaders, while others never rise to the top?
… these companies posses an ability to make complex decisionsfaster, more accurately, and more consistently than their competition
… because they are big users of Optimization!
The Field of Network Flows
Optimization based on the Network concept
Fundamental field in Analytics, Operations Research & Optimization
… solid theory
… rich collection of algorithms
… vast area of applications
… eventually using
Modeling & Optimization!
AIMMS: The Modeling System
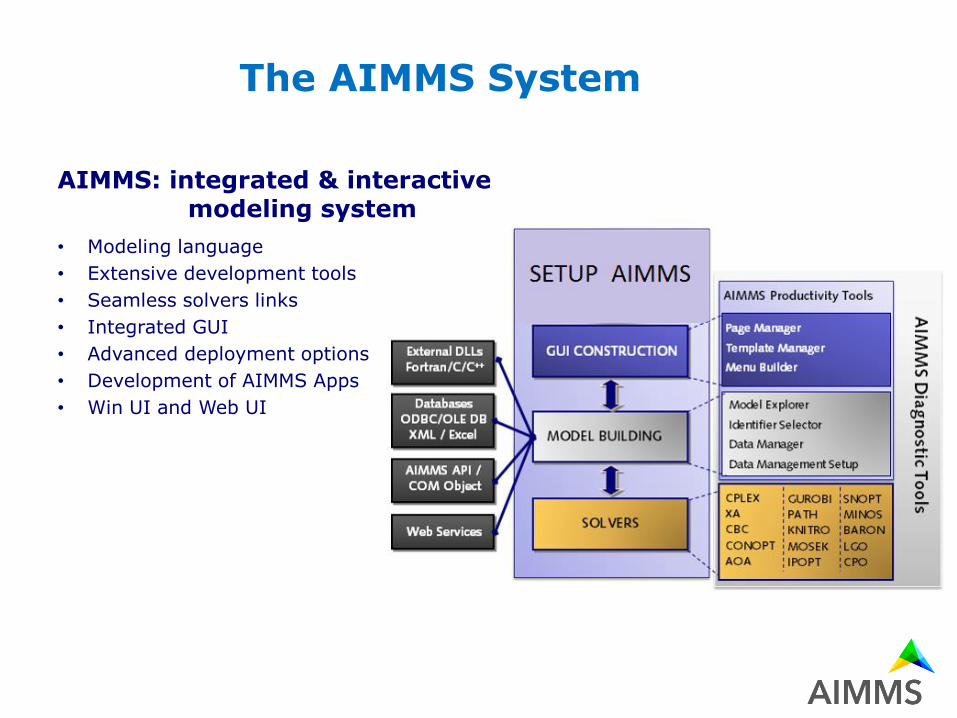
AIMMS: integrated & interactive modeling system
• Modeling language
• Extensive development tools
• Seamless solvers links
• Integrated GUI
• Advanced deployment options
• Development of AIMMS Apps
• Win UI and Web UI
The AIMMS System
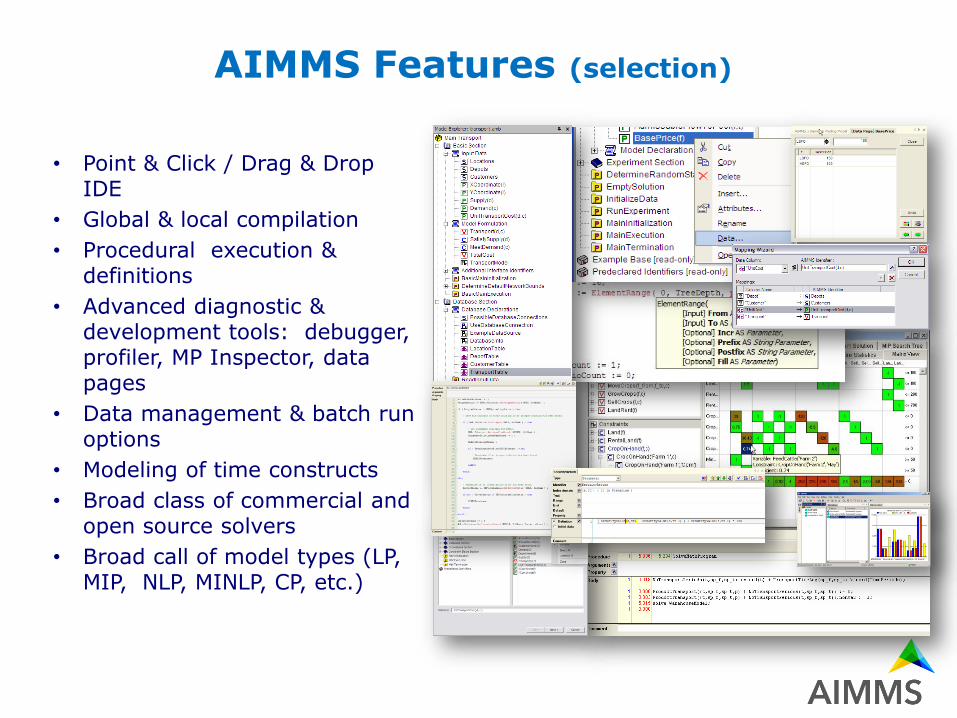
AIMMS Features (selection)
• Point & Click / Drag & Drop IDE
• Global & local compilation
• Procedural execution & definitions
• Advanced diagnostic & development tools: debugger, profiler, MP Inspector, data pages
• Data management & batch run options
• Modeling of time constructs
• Broad class of commercial and open source solvers
• Broad call of model types (LP, MIP, NLP, MINLP, CP, etc.)
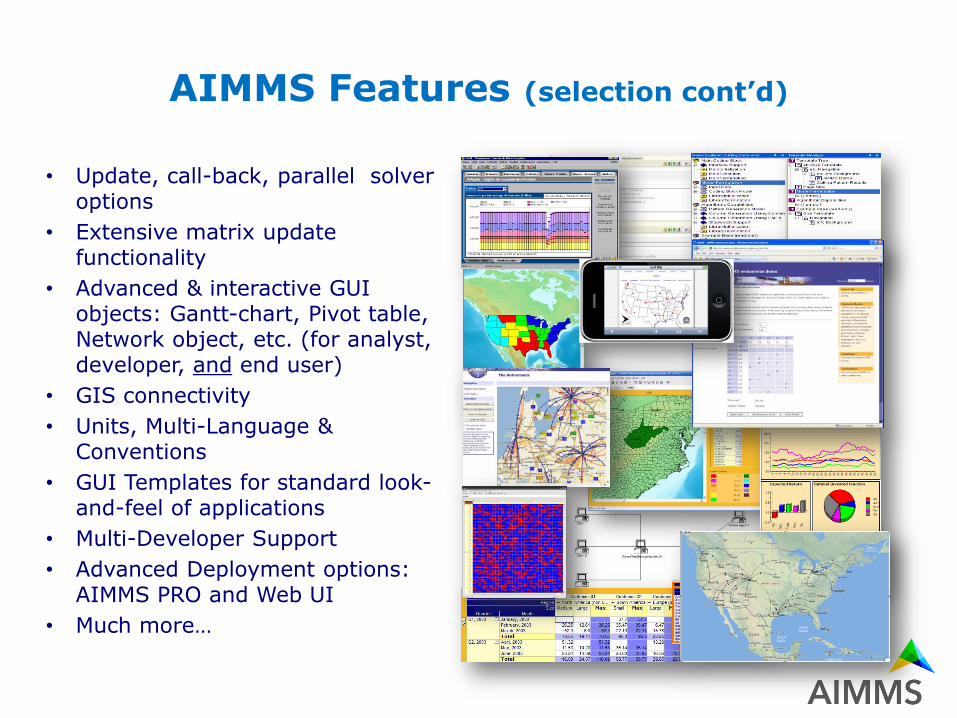
AIMMS Features (selection cont’d)
• Update, call-back, parallel solver options
• Extensive matrix update functionality
• Advanced & interactive GUI objects: Gantt-chart, Pivot table, Network object, etc. (for analyst, developer, and end user)
• GIS connectivity
• Units, Multi-Language & Conventions
• GUI Templates for standard look-and-feel of applications
• Multi-Developer Support
• Advanced Deployment options: AIMMS PRO and Web UI
• Much more…
Network Models Building
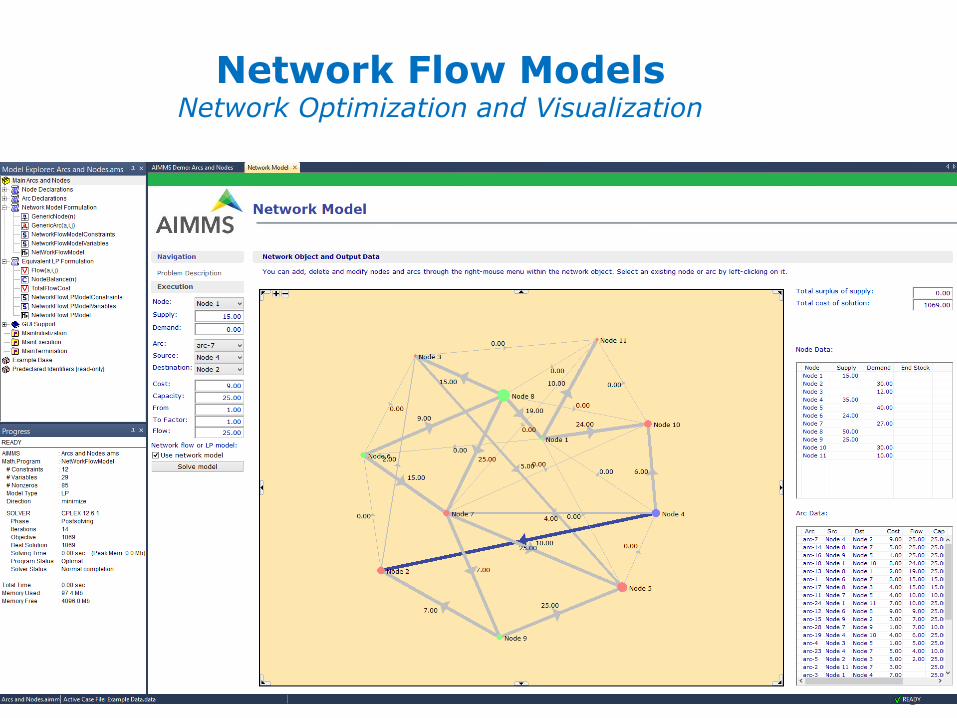
Network Flow ModelsNetwork Optimization and Visualization
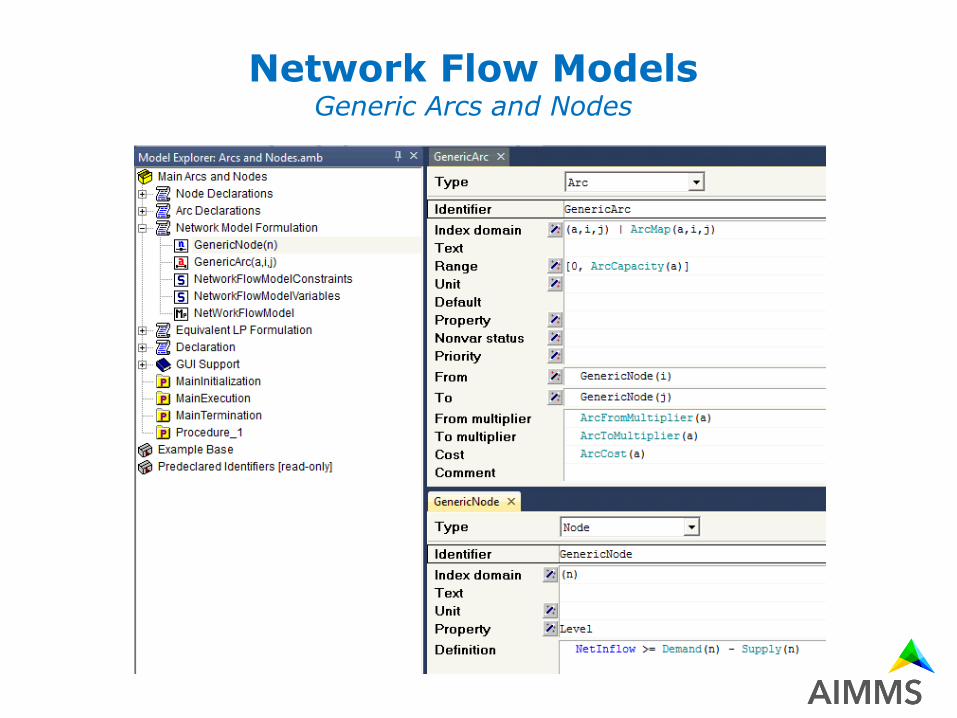
Network Flow ModelsGeneric Arcs and Nodes
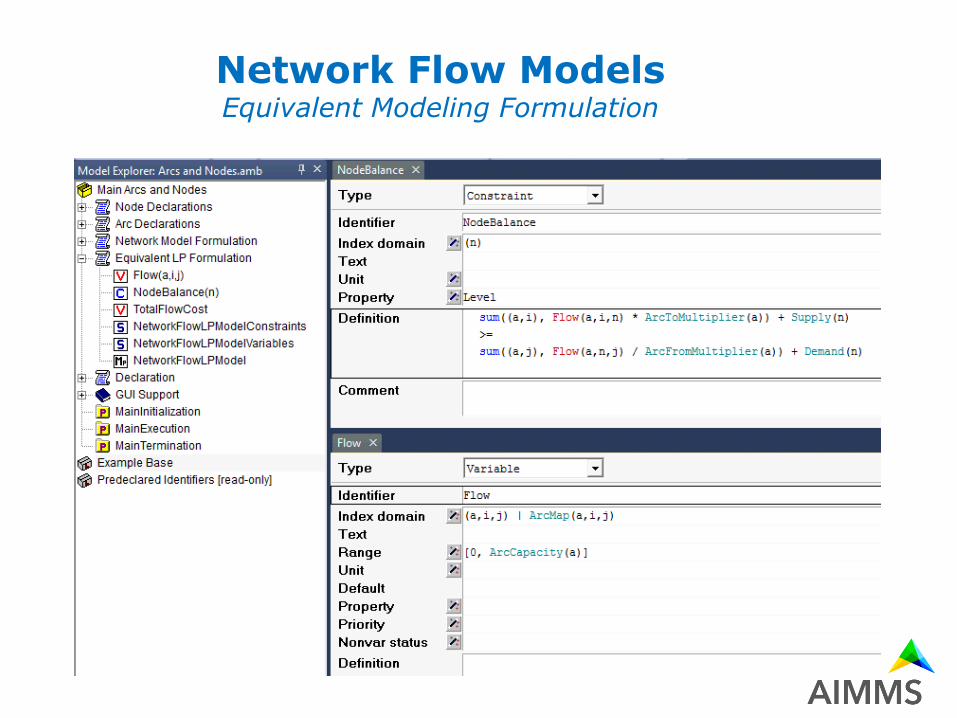
Network Flow ModelsEquivalent Modeling Formulation

Facility Location Models
Network Optimization and Visualization
Facility Location Models
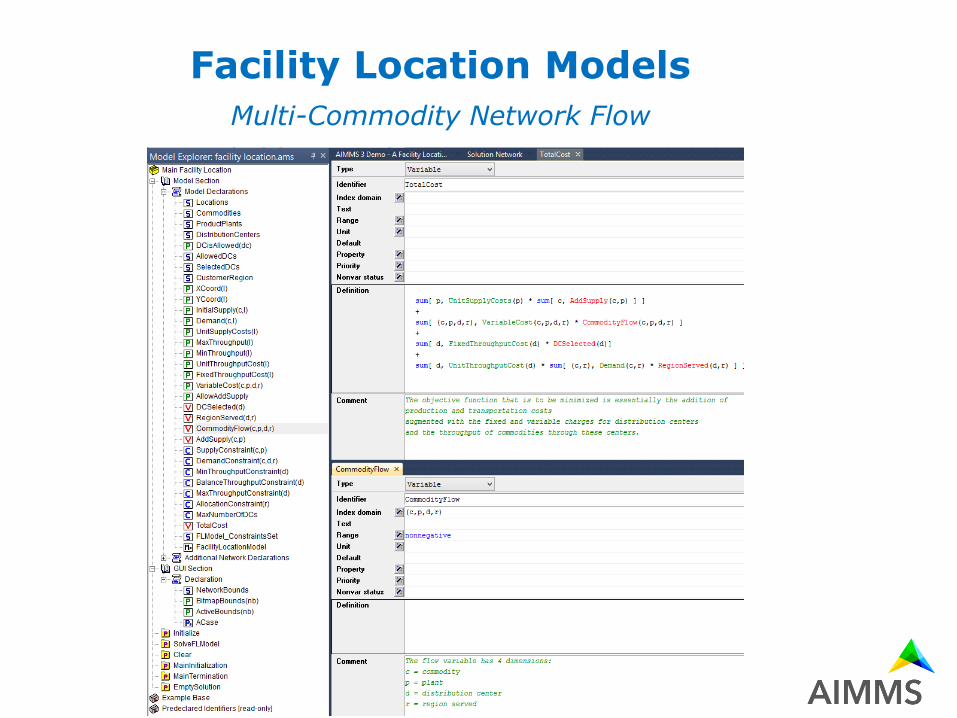
Multi-Commodity Network Flow
Facility Location Models
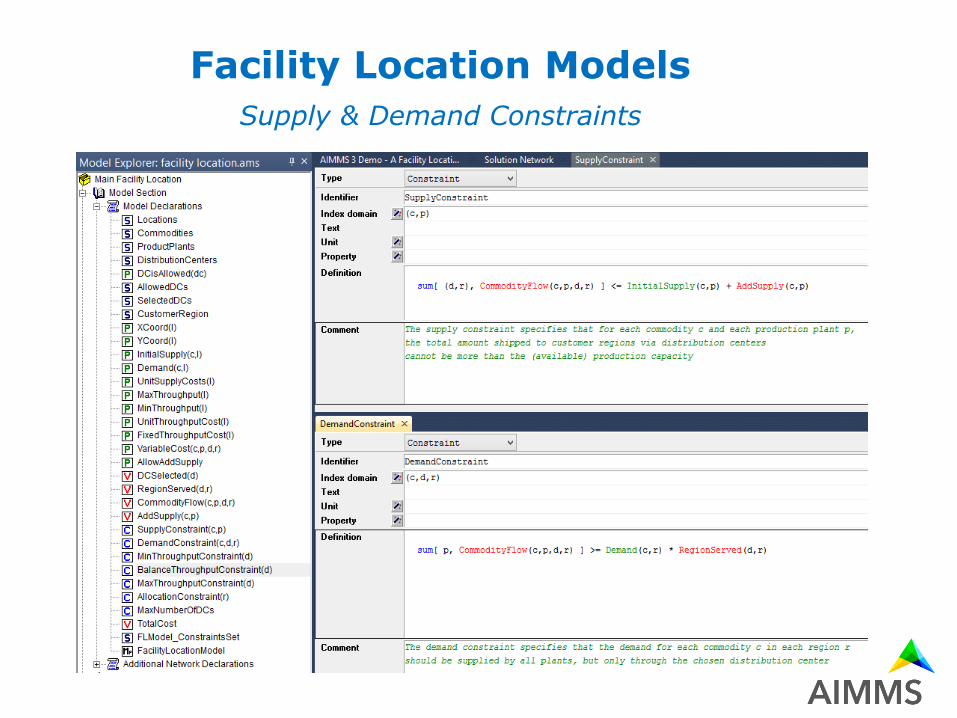
Supply & Demand Constraints
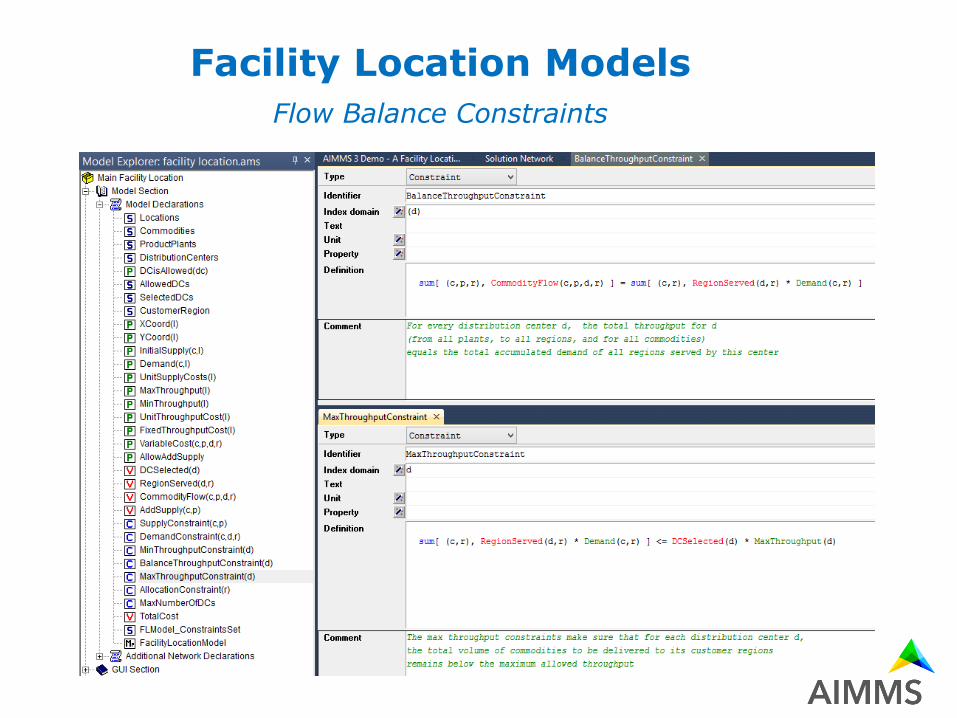
Facility Location Models
Flow Balance Constraints
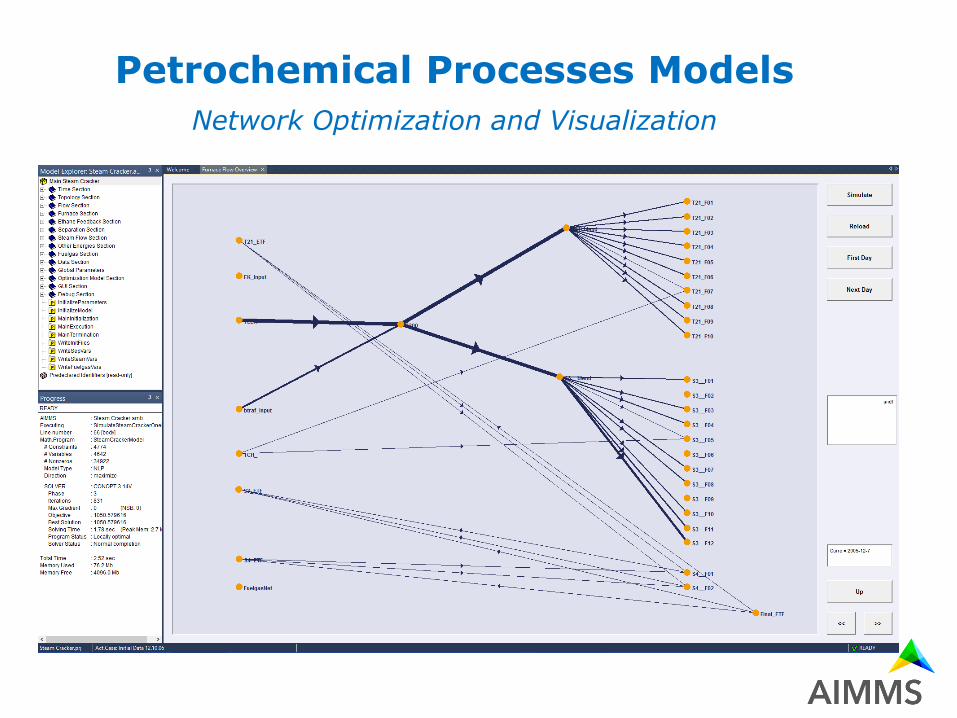
Petrochemical Processes Models
Network Optimization and Visualization
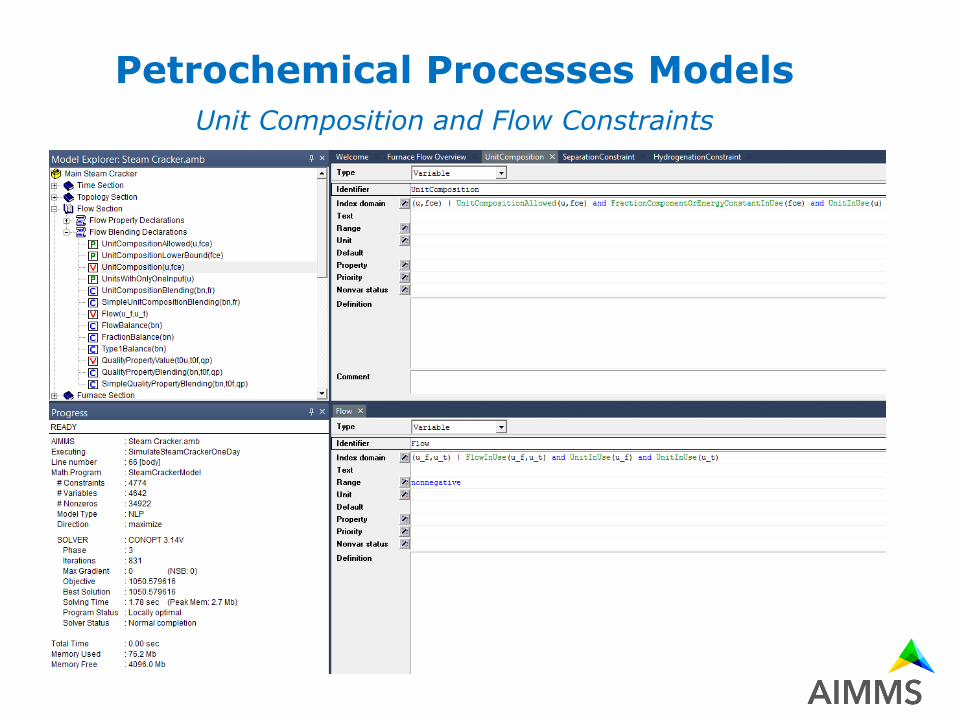
Petrochemical Processes Models
Unit Composition and Flow Constraints
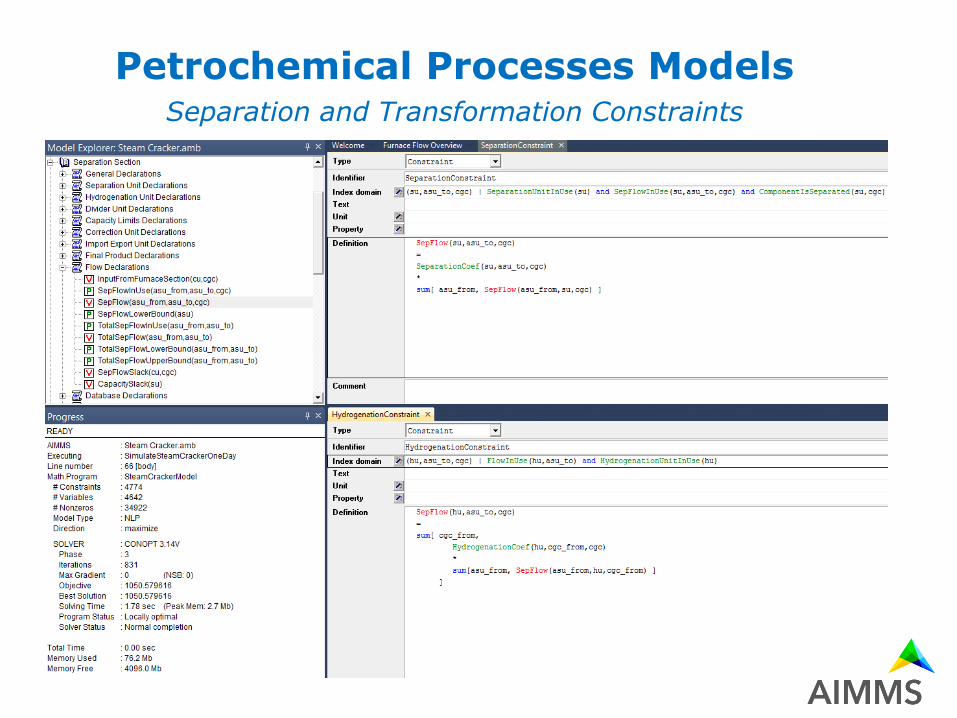
Petrochemical Processes ModelsSeparation and Transformation Constraints

Dealing with
Complexity and Uncertainty

Production and Distribution Model
Multi-dimensional Network Data
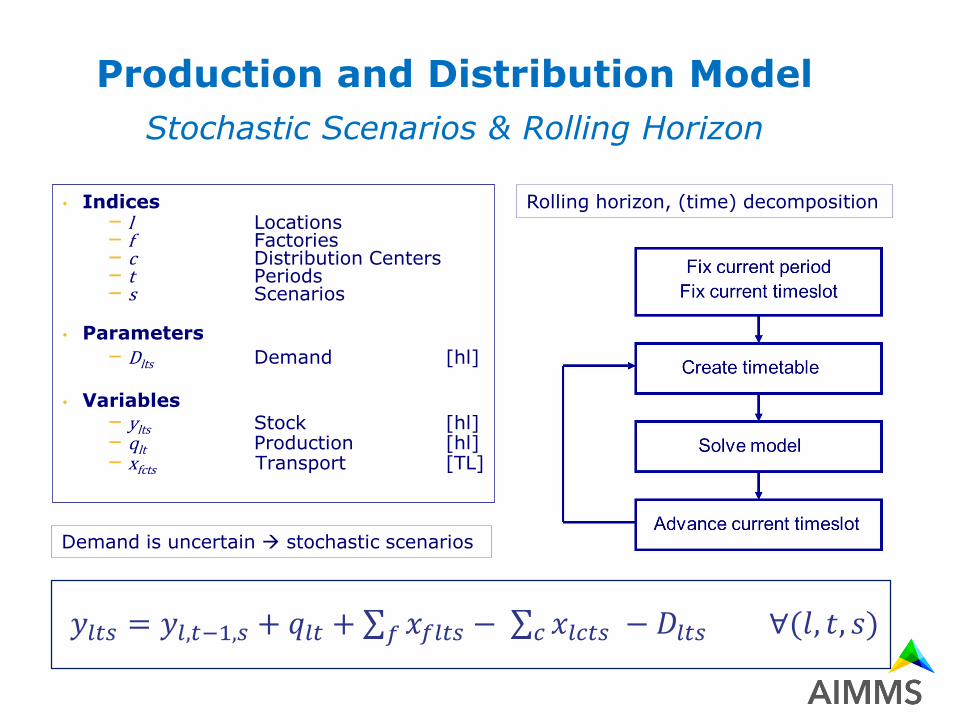
• Indices– l Locations– f Factories– c Distribution Centers– t Periods– s Scenarios
• Parameters
– Dlts Demand [hl]
• Variables– ylts Stock [hl]– qlt Production [hl]– xfcts Transport [TL]
Demand is uncertain stochastic scenarios
Rolling horizon, (time) decomposition
Production and Distribution Model
Stochastic Scenarios & Rolling Horizon
𝑦𝑙𝑡𝑠 = 𝑦𝑙,𝑡−1,𝑠 + 𝑞𝑙𝑡 + 𝑓 𝑥𝑓𝑙𝑡𝑠 − 𝑐 𝑥𝑙𝑐𝑡𝑠 − 𝐷𝑙𝑡𝑠 ∀(𝑙, 𝑡, 𝑠)
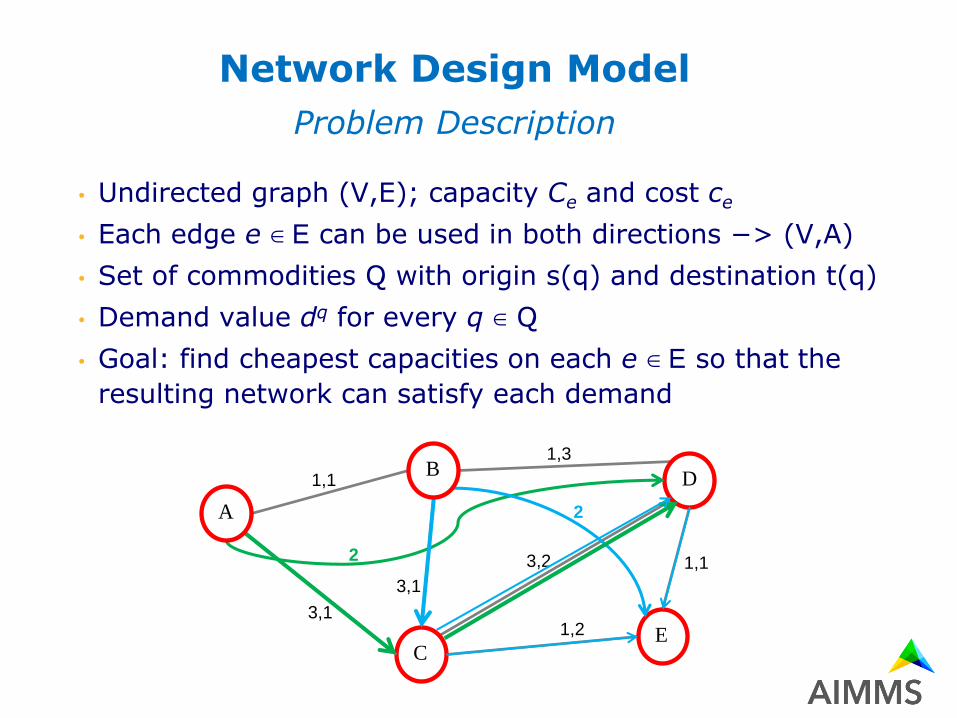
Network Design Model
Problem Description
• Undirected graph (V,E); capacity Ce and cost ce
• Each edge e ∈ E can be used in both directions −> (V,A)
• Set of commodities Q with origin s(q) and destination t(q)
• Demand value dq for every q ∈ Q
• Goal: find cheapest capacities on each e ∈ E so that the
resulting network can satisfy each demand
1,1
3,1
1,3
3,1
1,1
1,2
D
EC
3,2
2
2
A
B
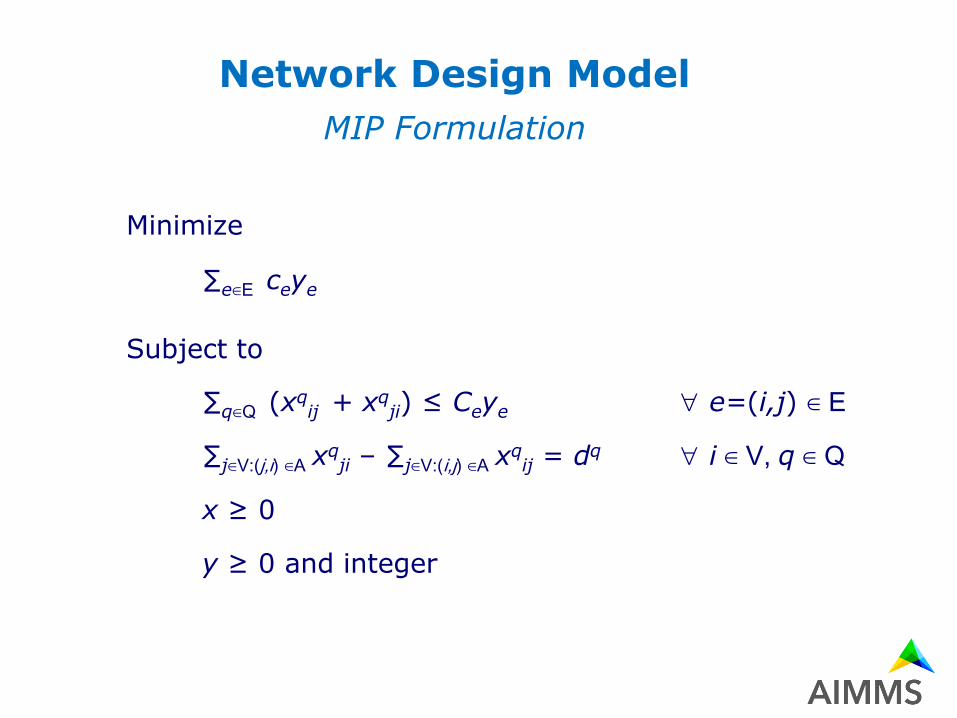
Network Design Model
MIP Formulation
Minimize
∑e∈E ceye
Subject to
∑q∈Q (xqij + xq
ji) ≤ Ceye e=(i,j) ∈ E
∑j∈V:(j,i) ∈A xqji – ∑j∈V:(i,j) ∈A xq
ij = dq i ∈ V, q ∈ Q
x ≥ 0
y ≥ 0 and integer
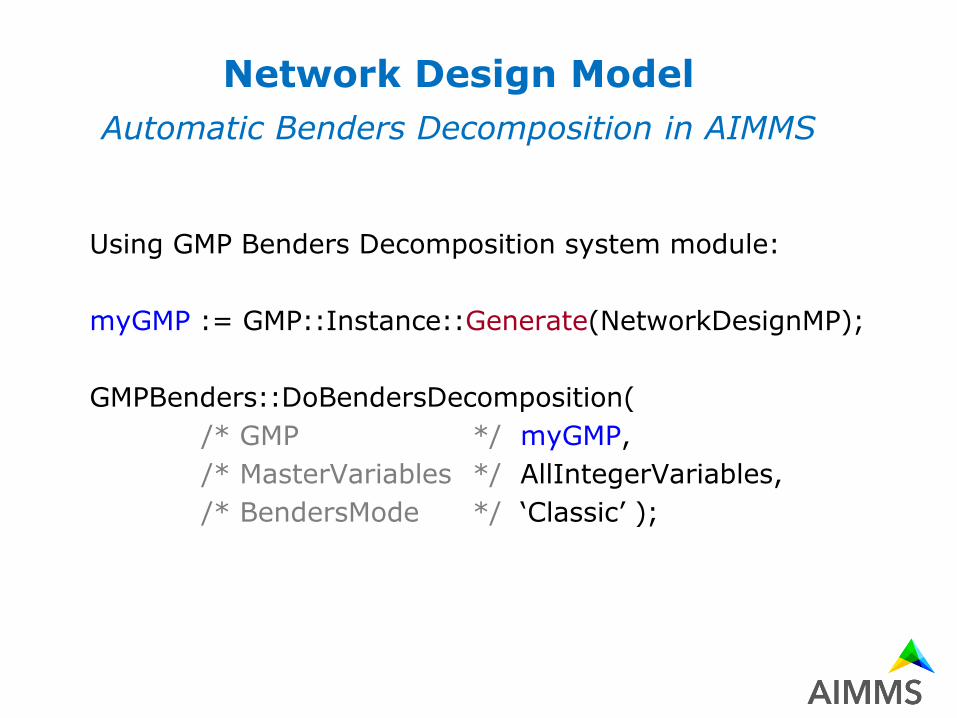
Network Design Model
Automatic Benders Decomposition in AIMMS
Using GMP Benders Decomposition system module:
myGMP := GMP::Instance::Generate(NetworkDesignMP);
GMPBenders::DoBendersDecomposition(
/* GMP */ myGMP,
/* MasterVariables */ AllIntegerVariables,
/* BendersMode */ ‘Classic’ );
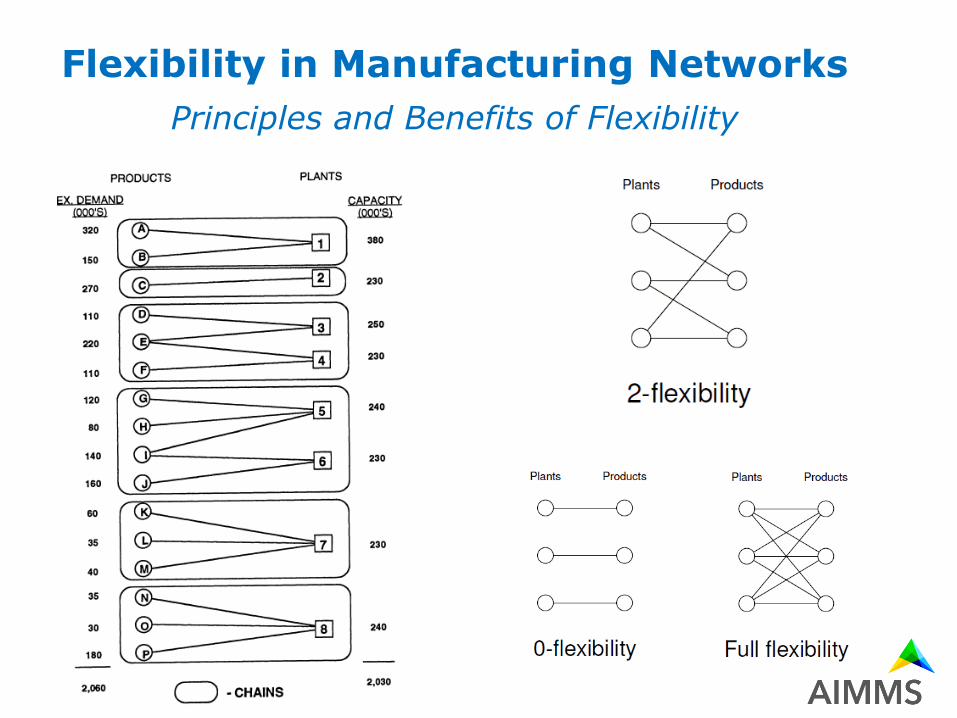
Flexibility in Manufacturing Networks
Principles and Benefits of Flexibility
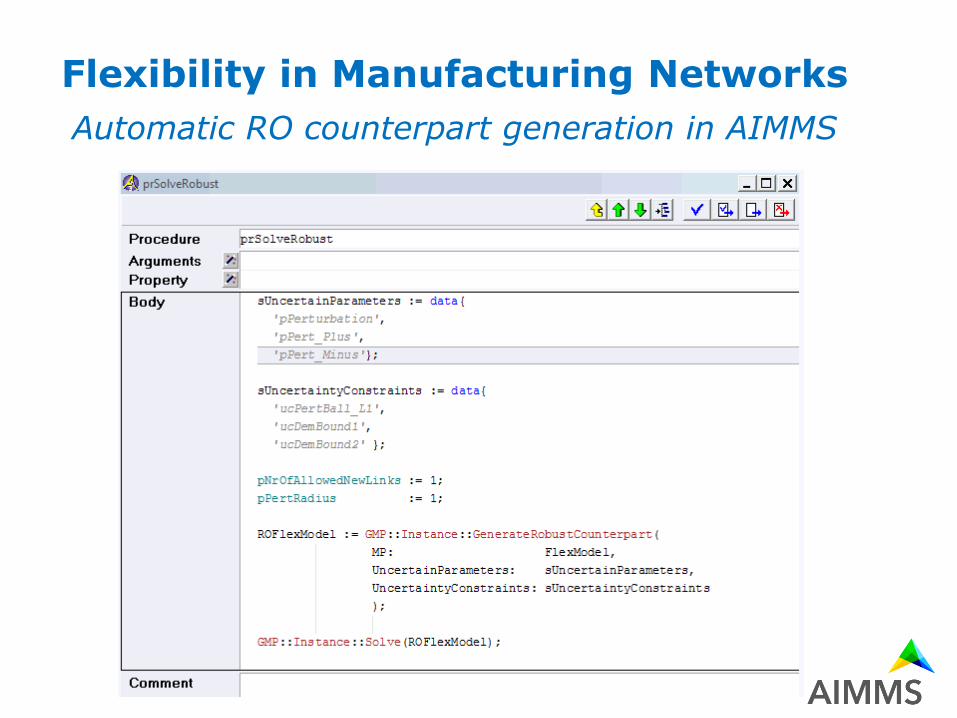
Flexibility in Manufacturing Networks
Automatic RO counterpart generation in AIMMS
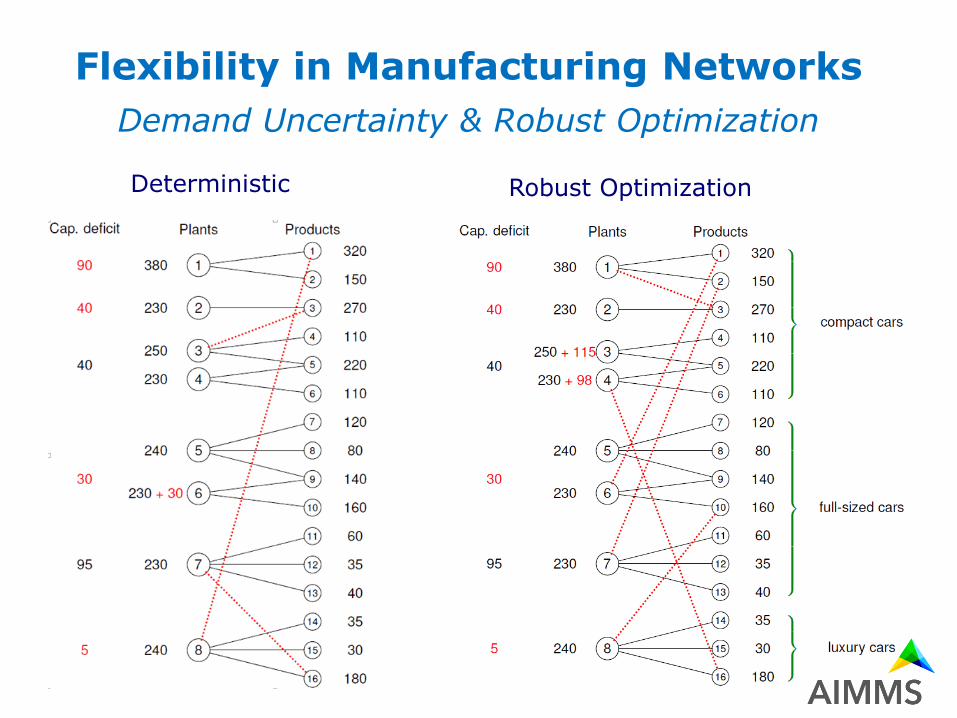
Flexibility in Manufacturing Networks
Demand Uncertainty & Robust Optimization
Deterministic Robust Optimization

From Model to Application
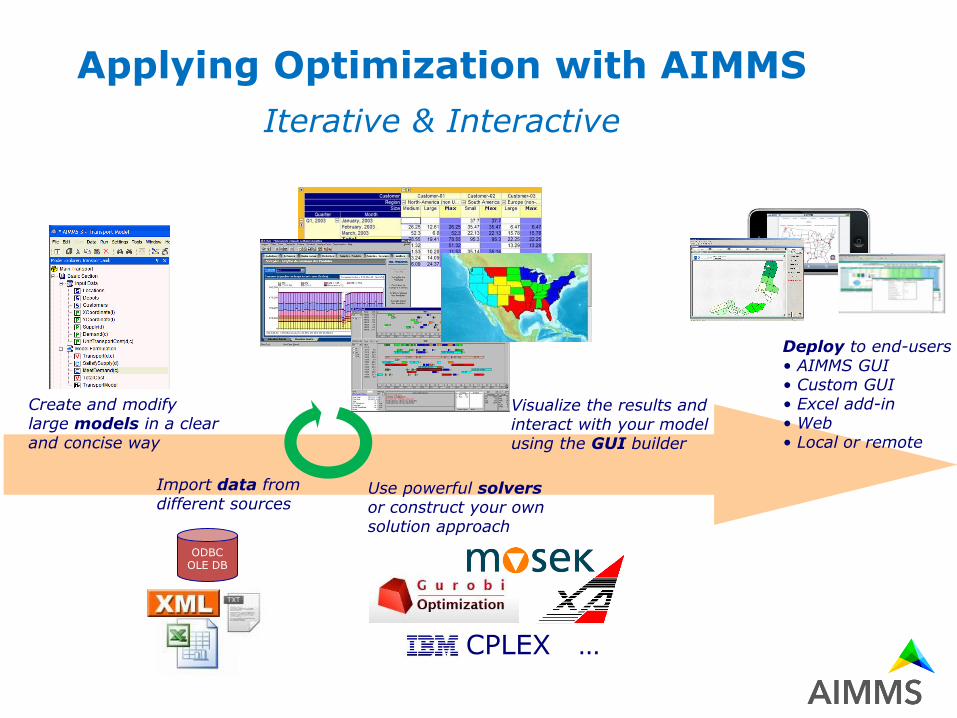
Applying Optimization with AIMMS
Iterative & Interactive
Visualize the results and interact with your modelusing the GUI builder
Deploy to end-users• AIMMS GUI• Custom GUI• Excel add-in • Web• Local or remote
Use powerful solversor construct your ownsolution approach
Import data fromdifferent sources
Create and modifylarge models in a clearand concise way
CPLEX …
ODBCOLE DB
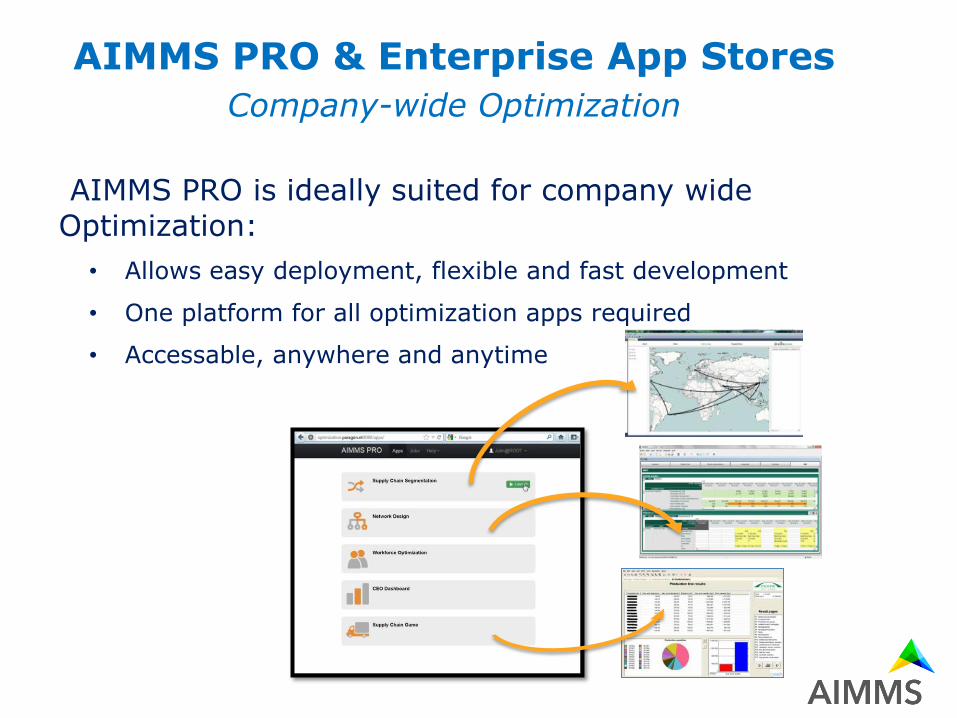
AIMMS PRO is ideally suited for company wide
Optimization:
• Allows easy deployment, flexible and fast development
• One platform for all optimization apps required
• Accessable, anywhere and anytime
AIMMS PRO & Enterprise App Stores
Company-wide Optimization
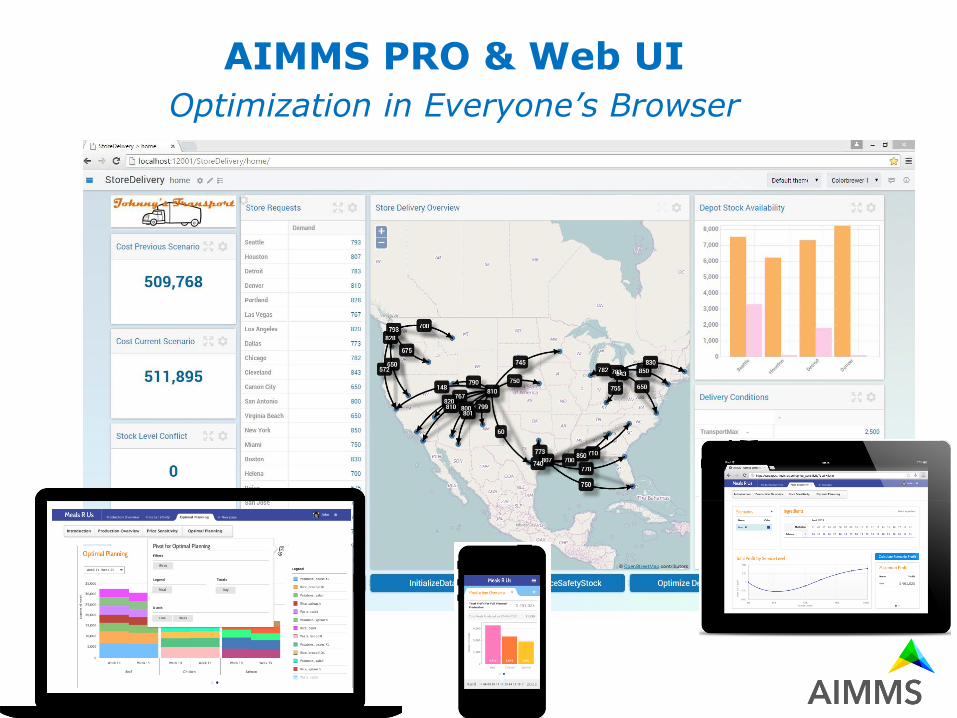
AIMMS PRO & Web UI
Optimization in Everyone’s Browser

Network Planning Applications
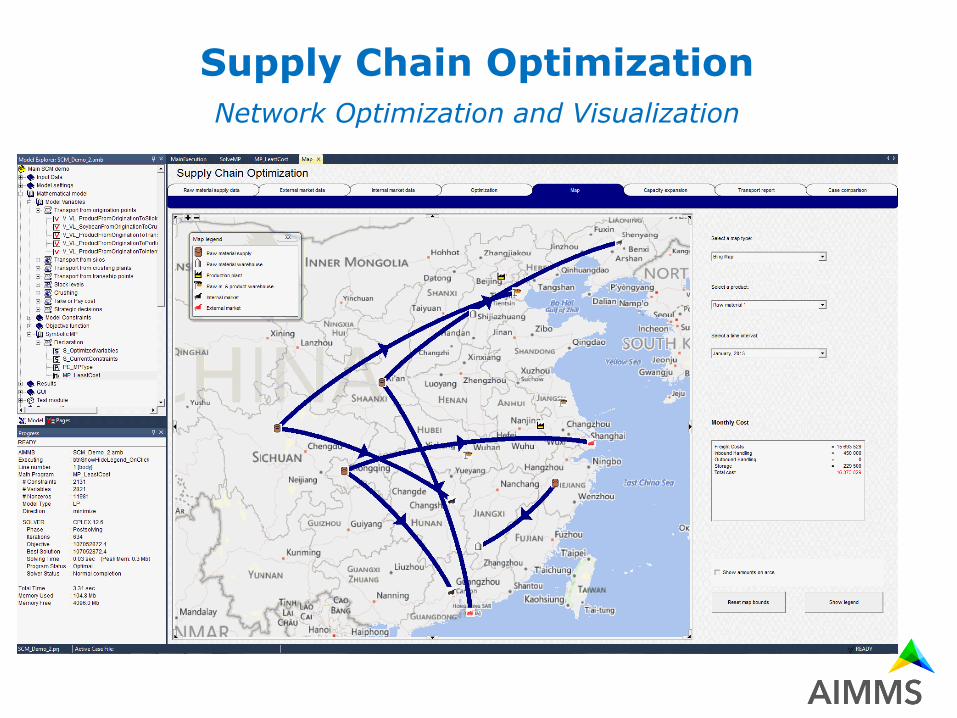
Supply Chain Optimization
Network Optimization and Visualization
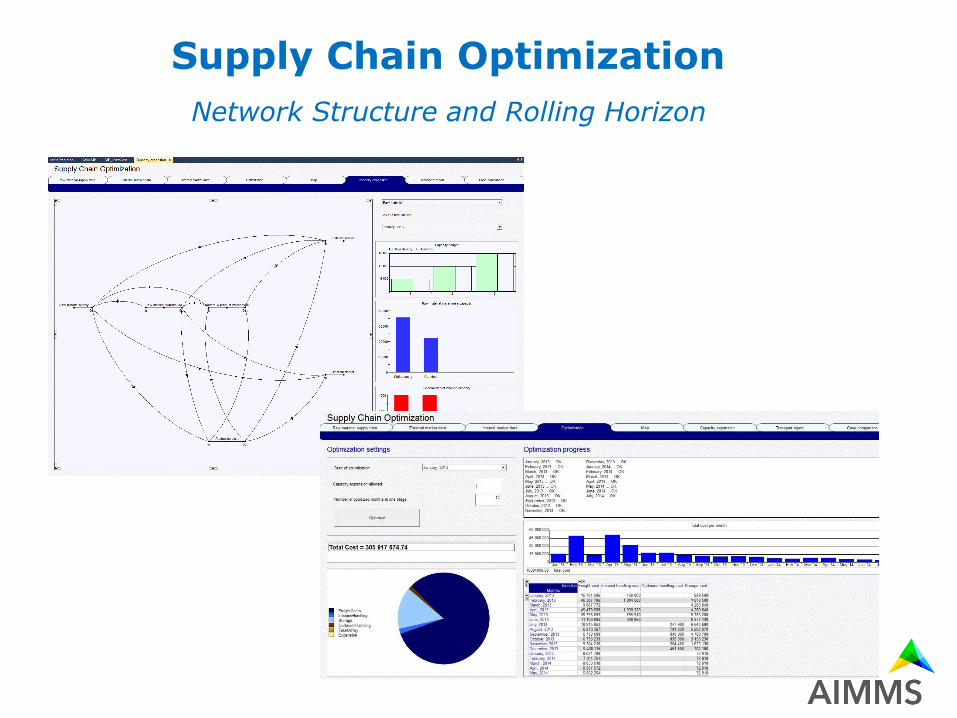
Supply Chain Optimization
Network Structure and Rolling Horizon
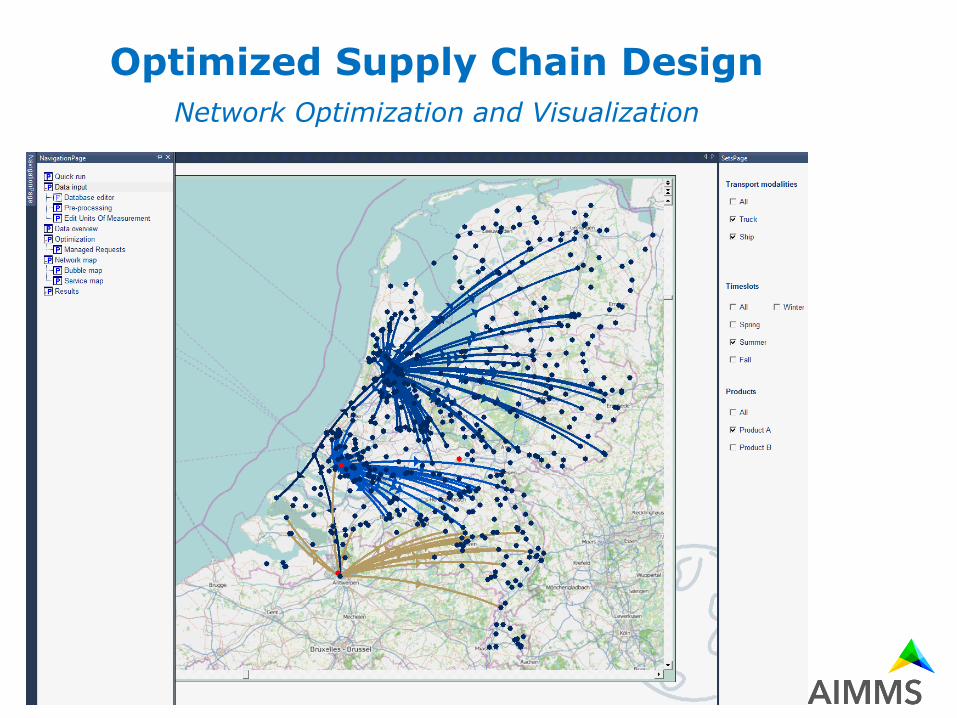
Optimized Supply Chain Design
Network Optimization and Visualization
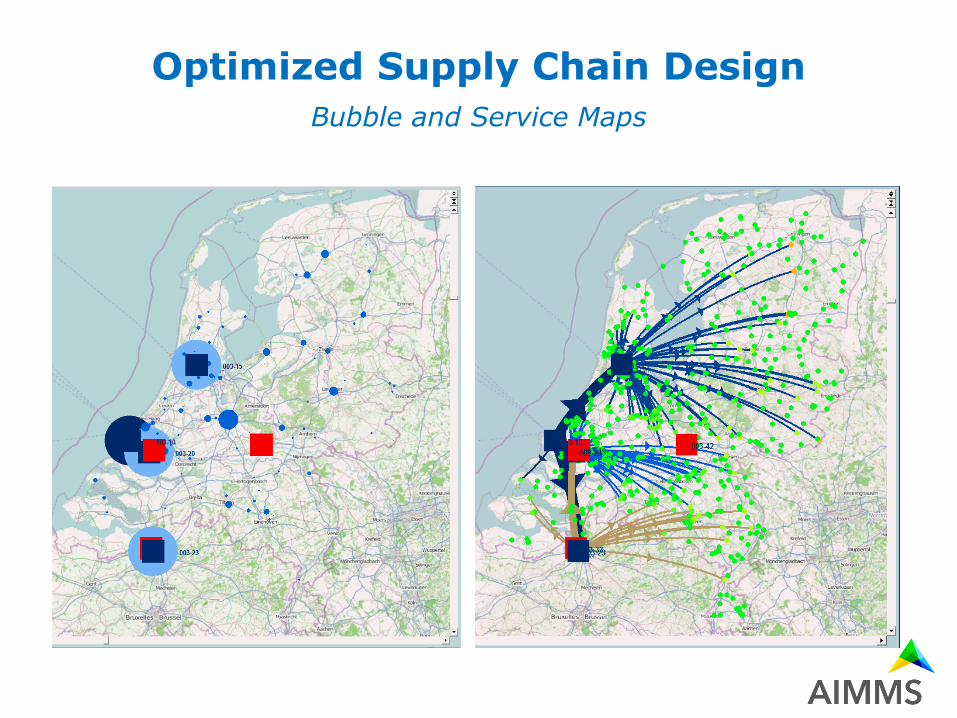
Optimized Supply Chain Design
Bubble and Service Maps
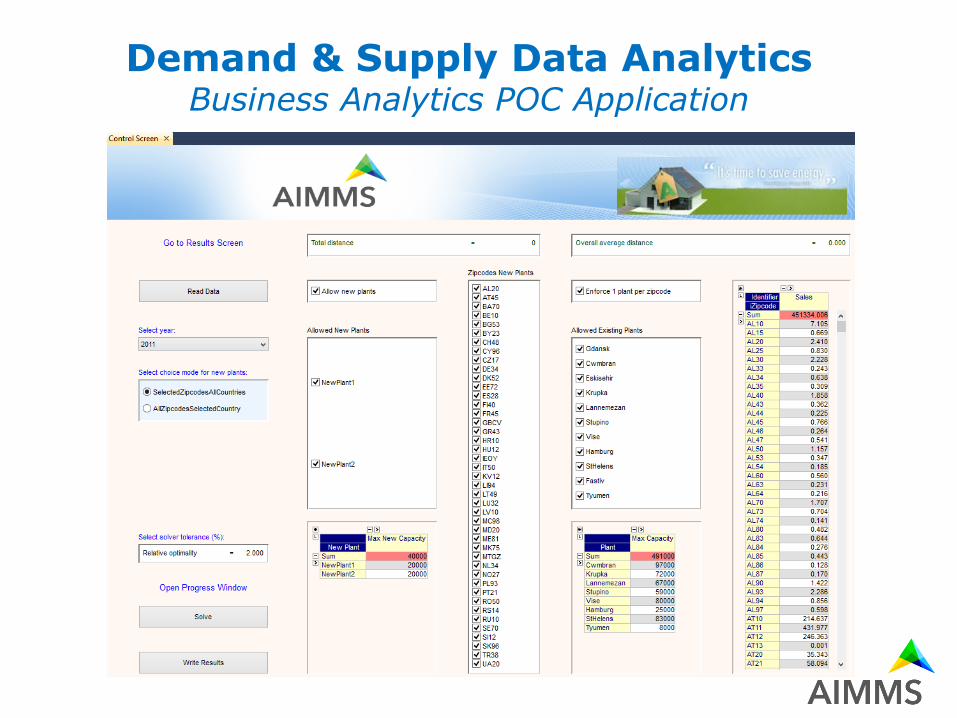
Demand & Supply Data AnalyticsBusiness Analytics POC Application
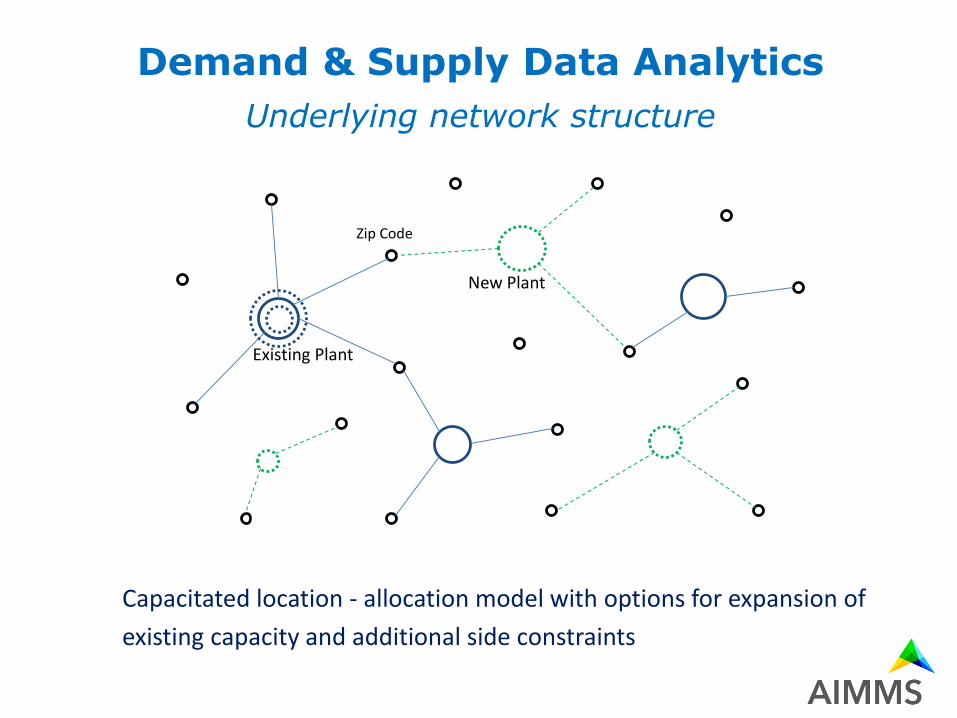
Existing Plant
New Plant
Zip Code
Capacitated location - allocation model with options for expansion of
existing capacity and additional side constraints
Demand & Supply Data Analytics
Underlying network structure
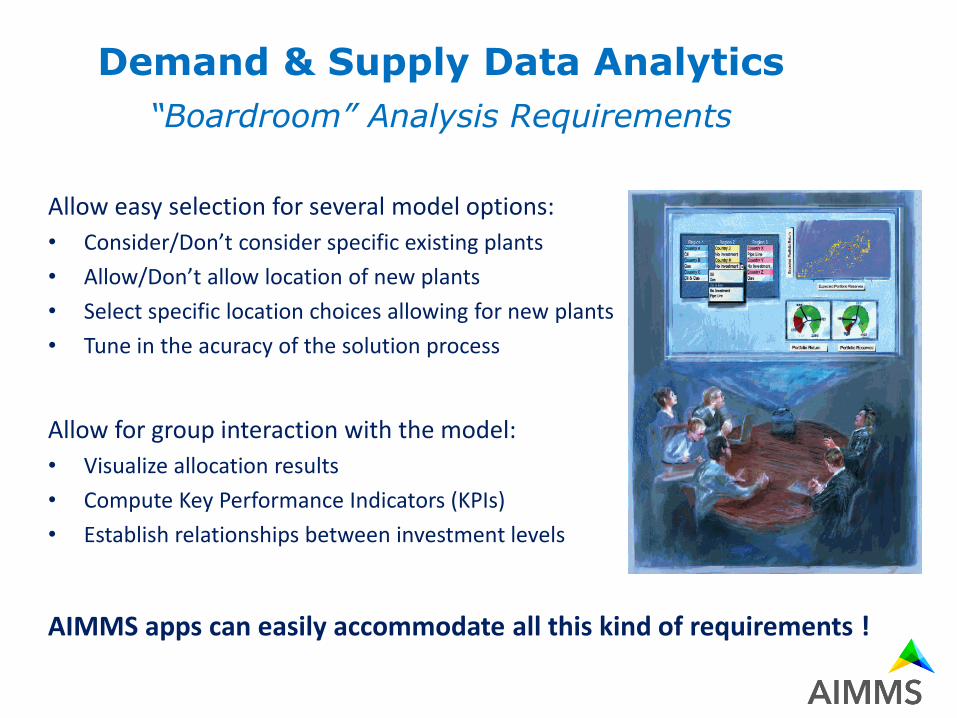
Allow easy selection for several model options:
• Consider/Don’t consider specific existing plants
• Allow/Don’t allow location of new plants
• Select specific location choices allowing for new plants
• Tune in the acuracy of the solution process
Allow for group interaction with the model:
• Visualize allocation results
• Compute Key Performance Indicators (KPIs)
• Establish relationships between investment levels
AIMMS apps can easily accommodate all this kind of requirements !
Demand & Supply Data Analytics
“Boardroom” Analysis Requirements

More about AIMMS…
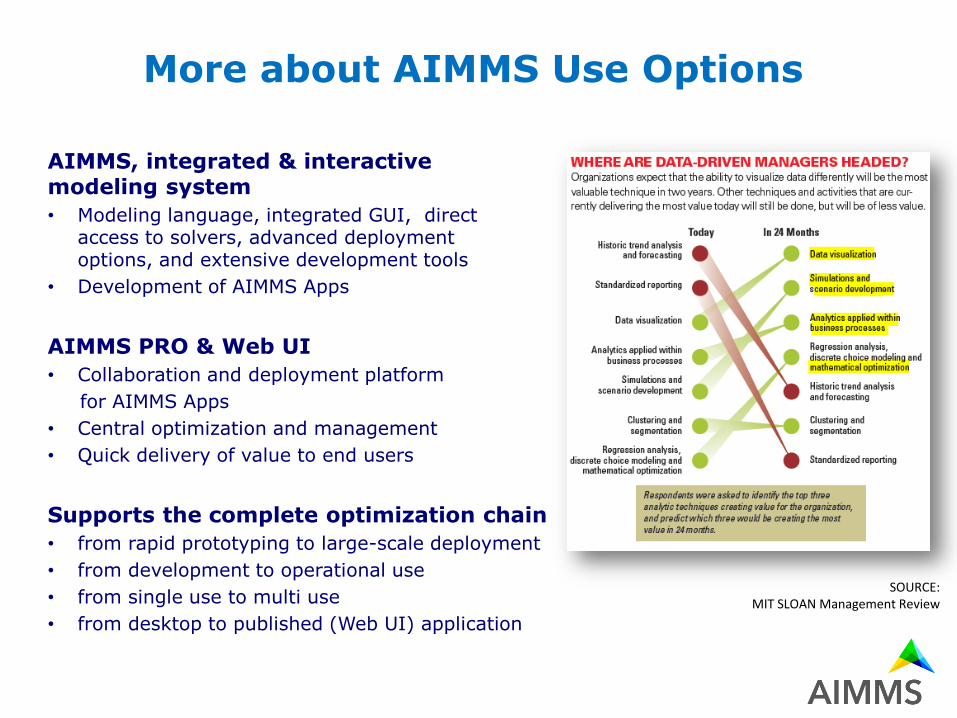
More about AIMMS Use Options
AIMMS, integrated & interactive modeling system
• Modeling language, integrated GUI, direct access to solvers, advanced deployment options, and extensive development tools
• Development of AIMMS Apps
AIMMS PRO & Web UI
• Collaboration and deployment platform
for AIMMS Apps
• Central optimization and management
• Quick delivery of value to end users
Supports the complete optimization chain
• from rapid prototyping to large-scale deployment
• from development to operational use
• from single use to multi use
• from desktop to published (Web UI) application
SOURCE: MIT SLOAN Management Review

Next AIMMS Webinar
The next webinar in this series:
“The AIMMS Presolver” will be presented by Marcel Hunting,
AIMMS Optimization Specialist
Join us on July 15, 2015 at
5 PM CET / 8 AM PDT / 11 AM EDT