Embed Size (px)
Citation preview
HAL Id: hal-02921382https://hal.archives-ouvertes.fr/hal-02921382
Submitted on 25 Aug 2020
HAL is a multi-disciplinary open accessarchive for the deposit and dissemination of sci-entific research documents, whether they are pub-lished or not. The documents may come fromteaching and research institutions in France orabroad, or from public or private research centers.
L’archive ouverte pluridisciplinaire HAL, estdestinée au dépôt et à la diffusion de documentsscientifiques de niveau recherche, publiés ou non,émanant des établissements d’enseignement et derecherche français ou étrangers, des laboratoirespublics ou privés.
Network Mesh Nanostructures in Cross-LinkedPoly(Dimethylsiloxane) Visualized by AFM
Viktoriia Drebezghova, Hubert Gojzewski, Ahmed Allal, Mark Hempenius,Corinne Nardin, G. Julius Vancso
To cite this version:Viktoriia Drebezghova, Hubert Gojzewski, Ahmed Allal, Mark Hempenius, Corinne Nardin, et al..Network Mesh Nanostructures in Cross-Linked Poly(Dimethylsiloxane) Visualized by AFM. Macro-molecular Chemistry and Physics, Wiley-VCH Verlag, 2020, pp.2000170. �10.1002/macp.202000170�.�hal-02921382�

2000170 (1 of 7)
www.mcp-journal.de
© 2020 The Authors. Published by Wiley-VCH GmbH
A three dimensional molecular network forms in cross-linking provided that condi-tions for gelation are fulfilled.[7]
PDMS can form regular molecular networks when, e.g., siloxane chains with end-functions (such as vinyl termi-nated PDMS) and methylhydrosilane-dimethylsiloxane copolymer cross-linkers are reacted in Pt catalyzed hydrosilylation reactions, e.g., for use as dynamic cell culture substrata.[8] Commercial PDMS materials that belong to different grades of products with the generic name “Sylgard” (such as the grade Sylgard 184 investigated in this study) of Dow-Corning are often
used as substrates, e.g., in microcontact printing as stamps, in adhesion studies, or as components of microfluidic devices.[9–12] Commercial PDMS Sylgard 184 “kits” contain nanosilica fillers (see Supporting Information), so it is also of importance to extract these and explore possible structural differences that may exist between “pristine” and “extracted” materials.
Cross-link density and average molar mass of the network chains between covalent network junctions are fundamental structural parameters to characterize molecular networks. Their values can be determined by various methods, such as equilibrium swelling, mechanical modulus, or measuring sol-vent thermodynamic activity by applying the Flory–Rehner equation.[13] “Voids” at the nanometer length scale between network polymer chains are usually referred to as “mesh,” while the mesh size (correlation length) is usually considered as an average distance between cross-linking junctions (see Scheme 1). The typical size range for meshes varies from a few nm to tens of nm.[14] Molecular networks containing these meshes usually exhibit structural heterogeneity displaying inhomogeneous network junction density, dangling chain ends, loops, and network junction shortcuts (Scheme 1). Polymer net-work heterogeneities have been studied by various scattering techniques.[15] Results unveiled that depending on the cross-linking chemistry, molecular networks usually display complex and heterogeneous structures at the molecular scale.[16]
PDMS networks often serve as models in fundamental physical studies of elastomer molecular network theories due to their rather regular and controlled molecular struc-ture.[17] As PDMS has a low glass transition temperature, the starting chains prior to cross-linking maintain their high flex-ibility between the cross-link junctions. PDMS is chemically inert, is biocompatible, and is of relatively low cost, thus it has also been intensively used in biomedical applications and
Full PaPer
Network Mesh Nanostructures in Cross-Linked Poly(Dimethylsiloxane) Visualized by AFM
Viktoriia Drebezghova, Hubert Gojzewski, Ahmed Allal, Mark A. Hempenius, Corinne Nardin,* and G. Julius Vancso*
V. Drebezghova, Prof. A. Allal, Prof. C. NardinUniversite de Pau et des Pays de l’AdourE2S UPPACNRSIPREMTechnopôle Hélioparc2 avenue du Président Angot, Pau 64053, FranceE-mail: [email protected]. Drebezghova, Dr. H. Gojzewski, Dr. M. A. Hempenius, Prof. G. J. VancsoMaterials Science and Technology of PolymersFaculty of Science and TechnologyUniversity of TwenteDrienerlolaan 5, Enschede NB 7522, The NetherlandsE-mail: [email protected]
The ORCID identification number(s) for the author(s) of this article can be found under https://doi.org/10.1002/macp.202000170.
DOI: 10.1002/macp.202000170
Mesh network structures are visualized by peak force tapping atomic force microscopy on cross-linked poly(dimethylsiloxane) (PDMS) at the nanometer length scale. The images directly capture network mesh structures with mesh diameter values, from 10 to 16 nm at the free surface of PDMS. Perpendicular to the free surface, in cross-sectional areas exposed by cryo-fracturing, similar mesh structures are observed. When exposed to uniaxial stress, the circular mesh features become elongated, showing network deformation at the nanoscale, as a result of mechanical stress. Following Soxhlet solvent extraction the mesh-like appearance remains unchanged, but mesh diameter values decrease, which are attributed to the removal of non-crosslinked chains and silica filler.
1. Introduction
Due to the presence of silicon in the main chain and the resulting unusual, and useful properties, silicon containing polymers, including polysiloxanes, polysilanes, and polyferrocenylsilanes have been the subject of intensive research and have found appli-cations in a broad range of technological fields.[1–3] Poly siloxanes, in particular poly(dimethylsiloxane)s (PDMS) have been the most researched class of Si containing polymers, and have found also the most widespread commercial use.[2,4–6] As is well known, molecular structures of elastomers consist of polymer network chains cross-linked chemically using, e.g., chemical agents.
© 2020 The Authors. Published by Wiley-VCH GmbH. This is an open access article under the terms of the Creative Commons Attribution License, which permits use, distribution and reproduction in any medium, provided the original work is properly cited.
Macromol. Chem. Phys. 2020, 2000170

2000170 (2 of 7)
www.advancedsciencenews.com www.mcp-journal.de
© 2020 The Authors. Published by Wiley-VCH GmbH
soft lithography (microcontact printing).[4] While the surface of PDMS is hydrophobic, and features chains with significant surface dynamics at RT, various treatments like UV-ozone expo-sure can render it hydrophilic,[17] with a gradual hydrophobic recovery,[11,18] depending on the treatment dose.
Albeit PDMS surfaces have been characterized in numerous studies across the length scales, until now real space images showing the expected mesh structure, to our knowledge, have not been reported. We believe that if continuing progress is to be made in the science of polymer networks, direct nanoscale observations of molecular mesh structures in PDMS (and other) elastomers, as a function of molecular composition are needed. Direct visualization of mesh deformation if the elastomer is put under mechanical stress would also be useful, as it can help ana-lyze network deformation models (e.g., affine deformation) and their applicability. Additionally, mesh size distributions and their possible heterogeneities within the bulk of elastomers, in com-parison with characteristics of the cross-linked surface in direct contact with air, would complement the analysis of structure and properties of PDMS for surface related applications.
To tackle these challenges, we embarked upon systematic studies using high resolution atomic force microscopy (AFM) in the peak force quantitative nanomechanical mapping (PF-QNM) mode to directly obtain quantitative information of the elastomer mesh morphology at the nanometer length scale. It has been shown that this imaging mode can provide superior resolution when compared with traditional tapping mode AFM imaging, and can yield nanographs with molecular scale details.[19] In this article we discuss the first results of our AFM network research aiming at PDMS network morphology observed with mesh reso-lution. Additionally, we demonstrate mesh deformation by direct imaging, using PDMS networks under uniaxial mechanical stress.
A few AFM working modes have been used and discussed in the literature to visualize neat Sylgard 184 PDMS surfaces at length scales covering the micrometer and nanometer domains.[11,20–28] In all references free surfaces of Sylgard were observed to be smooth and featureless, and no resolution of the postulated mesh molecular structure has been reported. Similar featureless surfaces were observed in studies providing images of other PDMS elastomers.[29,30]
2. Results and Discussion
First, we examined the nanometer scale morphology of the PDMS surfaces with different cross-linker concentrations (2.5, 5, 20, and 25 wt%) by AFM. AFM measurements were performed on free PDMS surfaces that were cross-linked in direct contact with air. Four representative height images for each cross-linker concentration are shown in Figure 1. For each image a quantitative height profile is also displayed, scaled to the same height value, to allow for a comparison. For the lowest cross-linker concentration (2.5 wt%) images lacked sharp con-trast, and showed some surface roughness with a hint to the
Macromol. Chem. Phys. 2020, 2000170
Scheme 1. Illustration of a mesh structure of cross-linked PDMS. The mesh size (ξ) defined here as the average length between cross-links is on the order of 10 nm. Dangling chains and free chains are also shown.
Figure 1. AFM height images of the free PDMS surfaces prepared at varied cross-linker concentrations: a) 2.5, b) 5, c) 20, and d) 25 wt%. The scan area is 500 × 500 nm2 for all images. The height-profiles are represented below the nanographs; the profiles were taken along the white lines. µMasch cantilevers as specified in the Experimental Section were used.

2000170 (3 of 7)
www.advancedsciencenews.com www.mcp-journal.de
© 2020 The Authors. Published by Wiley-VCH GmbH
presence of some porous microstructure. For 5 wt% cross-linker the apparent surface roughness increased and the con-trast of the surface features captured became sharper. For the two highest cross-linker concentrations, sharp contrast and a morphology showing a nanoporous appearance were observed. For the quantitative analysis of the surface structures, average pore size and pore size distribution, porosity (surface coverage), and roughness values were estimated from AFM images taken at five different spots for each sample. These data are presented in Figure 2 and Tables 1 and 2.
Mesh size distributions were estimated using the ImageJ image processing software (version 1.50b). Each distribution presented in Figure 2 was determined from 200 pores analyzed. The distribution histograms were smoothed using 3-point moving averages. Size distributions on free (in the first raw) and cryofractured (in the second raw) PDMS surfaces were fitted with unimodal and bimodal Gaussian distribution func-tions, respectively. The surface porosity was determined as the ratio of the area occupied by pores determined from AFM images to the total area of the image.
The mean pore size (diameter) values observed were in the range of 15–16 nm, with an increasing surface coverage (Table 1) and RMS surface roughness (Table 2) as a function of the increasing cross-linker concentration. We identify the porous morphology as images of the heterogeneous mesh-like network structure. As the cross-linker concentration increases, network chain mobility decreases, which contributes to sharp-ening of the contrast of the mesh features captured on the images. We propose that within the mesh interior dangling chains and chemically uncross-linked chains provide a mechan-ically softer environment, allowing for a somewhat higher penetration of the AFM tip that is scanned at constant applied normal force (peak force). This presumption is supported by quantitative AFM PF-QNM imaging (see Figure S2, Supporting Information). We must note at this juncture that mesh struc-tures could not be visualized when using standard tapping mode for imaging (see Figure S3, Supporting Information).
The question, however, arises: to what extent can one assume that the entire bulk volume of the elastomer exhibits a nanoporous morphology? In order to tackle this issue, we
Macromol. Chem. Phys. 2020, 2000170
Figure 2. a–c) Pore size distribution on the free and d–f) cryofractured PDMS surfaces with cross-linker concentration as histograms. The distributions were fitted with Gaussians (red curves). The coefficient of determination for the fitting, R2, is shown as well.
Table 1. Mean size and surface coverage of pores on free and cryofractured PDMS surfaces. Mean standard deviation is shown as well.
Cross-linker concentration [wt%] Free PDMS surface Cryofractured PDMS surface
Mean pore size [nm] Surface coverage [%] Mean pore size [nm] Surface coverage [%]
1st peak 2nd peak
5 15.1 ± 5.1 11 ± 1 9.3 ± 1.2 13.1 ± 3.8 7 ± 1
20 16.5 ± 5.8 22 ± 4 9.6 ± 2.3 17.0 ± 4.2 34 ± 4
25 16.0 ± 5.3 33 ± 3 11.9 ± 2.9 19.3 ± 2.7 40 ± 3

2000170 (4 of 7)
www.advancedsciencenews.com www.mcp-journal.de
© 2020 The Authors. Published by Wiley-VCH GmbH
cryofractured (liquid N2 bath) PDMS specimens obtained at three different cross-linker concentrations in the direc-tions perpendicular to the surface. Optical microscopy (OM) images of the cryofractured specimens are displayed in Figure 3a–c. The OM micrographs were obtained by the AFM’s OM, showing also the silhouette of the AFM can-tilever located above the surface. The AFM scanned areas here represent planes that are perpendicular to the original surface that was cross-linked in contact with air. The sample containing 2.5 wt% of the cross-linker was too adhesive to be successfully imaged, although we used cantilevers with a higher spring constant (Olympus).
The appearance of the nanoporous morphology observed is similar to the images captured at the top free surface of the
sample, which was cross-linked in contact with air. Again, we attribute the presence of the nanopores to network meshes of softer interior, surrounded by cross-linked (and less mobile) network chains (or bundles of network chains). Thus we con-clude that cross-linked PDMS exhibits nanoporous morphology throughout the entire material, due to the presence of mole-cular meshes. We also quantified the mesh size distribution, the surface coverage, and the RMS surface coverage of the cryofractured specimens in the cross-section of the elastomer films (see Figure 2 and Tables 1 and 2). It is interesting to note that the size distributions for the samples shown in Figure 2 appeared to be bimodal (in some cases even showing three maxima), with mean values of 9–12 and 13–19 nm, depending on the cross-linker concentration. We attribute the bimodal appearance to inhomogeneous network density, i.e., the local distribution of cross-linking junctions is inhomogeneous due to fluctuation of concentration during mesh network forma-tion.[14] Large topological inhomogeneity occurs often within a scale of 10–100 nm in polymer networks.[31,32]
We then considered the question of mesh deformation cap-tured in situ under uniaxial stress. To this end, specimens were elongated, the stress maintained, and the surface of the mate-rial under stress was imaged. We expected that if the pores are indeed related to molecular meshes, they would deform with the bulk deformation. A fundamental question to be tackled
Macromol. Chem. Phys. 2020, 2000170
Table 2. RMS surface roughness (Rq) values of free and cryofractured PDMS surfaces. Mean standard deviation is shown as well.
Cross-linker concentration [wt%]
RMS Roughness Rq [nm]
Free PDMS surface Cryofractured PDMS surface
2.5 4.4 ± 0.4 –
5 4.8 ± 0.4 11.8 ± 0.7
20 8.6 ± 0.1 8.4 ± 0.8
25 8.9 ± 0.3 8.1 ± 0.4
Figure 3. Optical images of the cryofractured PDMS surfaces with different cross-linker concentrations: a) 5, b) 20, and c) 25 wt%. d–f) AFM height images were taken at scan areas of 500 × 500 nm2. The height-profiles are represented below the AFM scans; the profiles were taken along the white lines. Olympus cantilevers as specified in the Experimental Section were used.

2000170 (5 of 7)
www.advancedsciencenews.com www.mcp-journal.de
© 2020 The Authors. Published by Wiley-VCH GmbH
can be whether this deformation is affine or not. The schematic of the experiment and AFM images are displayed in Figure 4. PDMS with 20 wt% of cross-linker (5:1 base: cross-linking agent ratio) was stretched to 40% above its original length and the free sample surface was imaged using a Dimension Icon AFM. The sample was elongated before being fixed under stress and placed on the solid sample support without air gap between specimen and sample support.
As is obvious in Figure 4, the nanopores, attributed to net-work meshes, were deformed in the direction of the applied stress. The mean aspect ratio of ellipsoid shaped nano-pores was determined by measurements of the length of the major and minor axes by calculating their ratio, for 10 indi-vidual pores in the AFM images, captured at 90° scan angle (Figure 3e). The average aspect ratio obtained in this way had a value of 1.8 ± 0.3. This value is somewhat higher than the overall macroscopic stretch ratio of the sample (which was 1.4). The deformation was not homogeneous across the specimen due to clamping effects. The difference between mesh aspect ratio following deformation and overall stretch ratio is rational-ized by noting that the scanned area was in the specimen sec-tion, which experienced higher deformation, away from the clamps. There is however a visible relationship between mac-roscopic elongation of the sample and mesh deformation at the nanometer length scale. In order to rule out the possibility that the mesh deformations captured were related to AFM scanning artifacts, the scanning angle was also varied. We found that by
varying the scan angle (0°, 45°, and 90°), the elongated nano-pores were rotating with the rotation of the scan direction, indi-cating the absence of a possible scan direction related imaging artifact.
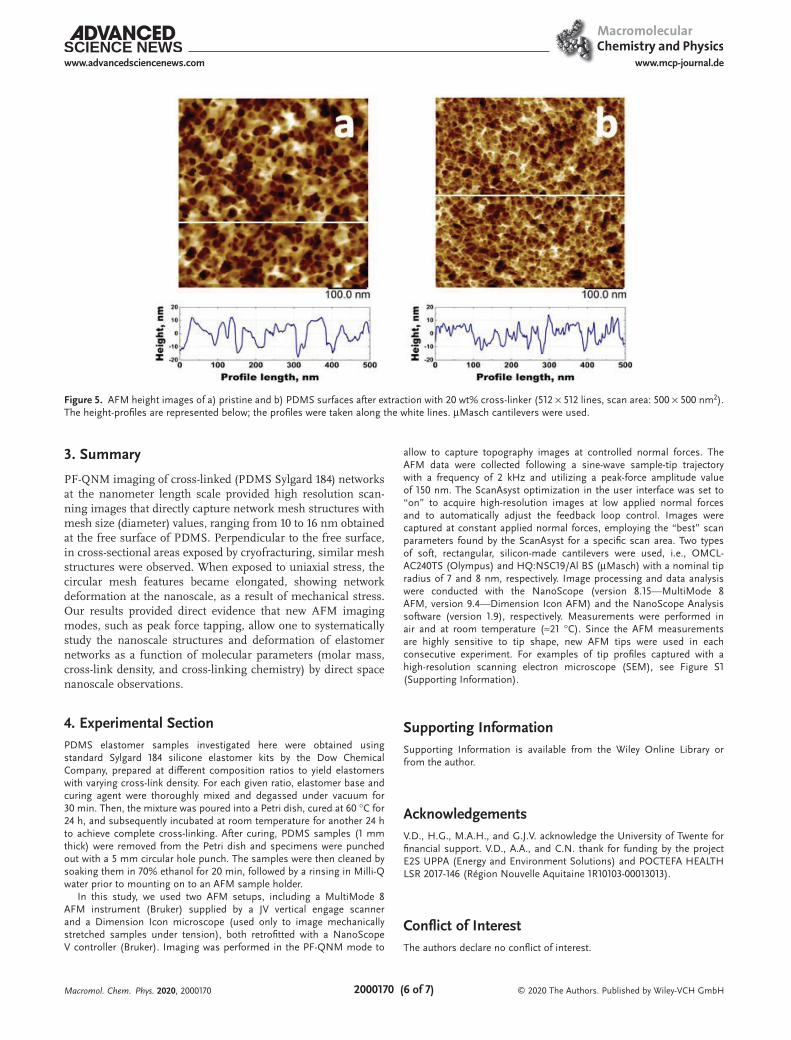
Finally, we tackled the question of possible morphology changes prior to, and following removal of free PDMS chains and silica fillers using Soxhlet extraction. A PDMS sample with 20 wt% of cross-linker was extracted in acetone/n-hexane (1:1 mixing ratio) for 48 h at 6 cycles h−1 (over 250 wash cycles). The swollen sample was then dried in a vacuum oven at 80 °C for 24 h. The mass of the PDMS sample was measured using a high precision scale before the extraction and following the drying step. The mass of the extracted residue was 5% of the total mass of the cross-linked specimen. We then imaged the surface morphology of the extracted PDMS surface and compared with the unextracted PDMS surface with the same cross-linker concentration. Two representative AFM height images prior to, and following extraction are shown in Figure 5. The appearance of the samples and the mesh-like morphology remain unaffected by extraction. The surfaces of the extracter samples appear somewhat smoother, while the apparent mesh size decreases during the extraction. The mesh size decreased following extraction from an average value of (16.5 ± 5.8) nm, for the pristine PDMS surface, to (13.5 ± 4.0) nm. We interpret the mesh size reduction by the leaching out of PDMS chains that were not covalently bound to the network, thus causing a mesh relaxation.
Macromol. Chem. Phys. 2020, 2000170
Figure 4. a) Schematic of stretching for imaging of PDMS under mechanical stress, b) OM micrograph of the top of an AFM cantilever (µMasch) in close proximity (about 20 µm) above the stretched PDMS surface, c–e) AFM images of free sample surface taken at exactly the same location at different scanning angles, i.e., 0°, 45°, and 90°. The scanning area is 250 × 250 nm2. White arrows indicate the direction of sample elongation, white dashed circles show the same spot in all the images.
2000170 (6 of 7)
www.advancedsciencenews.com www.mcp-journal.de
© 2020 The Authors. Published by Wiley-VCH GmbHMacromol. Chem. Phys. 2020, 2000170
3. Summary
PF-QNM imaging of cross-linked (PDMS Sylgard 184) networks at the nanometer length scale provided high resolution scan-ning images that directly capture network mesh structures with mesh size (diameter) values, ranging from 10 to 16 nm obtained at the free surface of PDMS. Perpendicular to the free surface, in cross-sectional areas exposed by cryofracturing, similar mesh structures were observed. When exposed to uniaxial stress, the circular mesh features became elongated, showing network deformation at the nanoscale, as a result of mechanical stress. Our results provided direct evidence that new AFM imaging modes, such as peak force tapping, allow one to systematically study the nanoscale structures and deformation of elastomer networks as a function of molecular parameters (molar mass, cross-link density, and cross-linking chemistry) by direct space nanoscale observations.
4. Experimental SectionPDMS elastomer samples investigated here were obtained using standard Sylgard 184 silicone elastomer kits by the Dow Chemical Company, prepared at different composition ratios to yield elastomers with varying cross-link density. For each given ratio, elastomer base and curing agent were thoroughly mixed and degassed under vacuum for 30 min. Then, the mixture was poured into a Petri dish, cured at 60 °C for 24 h, and subsequently incubated at room temperature for another 24 h to achieve complete cross-linking. After curing, PDMS samples (1 mm thick) were removed from the Petri dish and specimens were punched out with a 5 mm circular hole punch. The samples were then cleaned by soaking them in 70% ethanol for 20 min, followed by a rinsing in Milli-Q water prior to mounting on to an AFM sample holder.
In this study, we used two AFM setups, including a MultiMode 8 AFM instrument (Bruker) supplied by a JV vertical engage scanner and a Dimension Icon microscope (used only to image mechanically stretched samples under tension), both retrofitted with a NanoScope V controller (Bruker). Imaging was performed in the PF-QNM mode to
allow to capture topography images at controlled normal forces. The AFM data were collected following a sine-wave sample-tip trajectory with a frequency of 2 kHz and utilizing a peak-force amplitude value of 150 nm. The ScanAsyst optimization in the user interface was set to “on” to acquire high-resolution images at low applied normal forces and to automatically adjust the feedback loop control. Images were captured at constant applied normal forces, employing the “best” scan parameters found by the ScanAsyst for a specific scan area. Two types of soft, rectangular, silicon-made cantilevers were used, i.e., OMCL-AC240TS (Olympus) and HQ:NSC19/Al BS (µMasch) with a nominal tip radius of 7 and 8 nm, respectively. Image processing and data analysis were conducted with the NanoScope (version 8.15—MultiMode 8 AFM, version 9.4—Dimension Icon AFM) and the NanoScope Analysis software (version 1.9), respectively. Measurements were performed in air and at room temperature (≈21 °C). Since the AFM measurements are highly sensitive to tip shape, new AFM tips were used in each consecutive experiment. For examples of tip profiles captured with a high-resolution scanning electron microscope (SEM), see Figure S1 (Supporting Information).
Supporting InformationSupporting Information is available from the Wiley Online Library or from the author.
AcknowledgementsV.D., H.G., M.A.H., and G.J.V. acknowledge the University of Twente for financial support. V.D., A.A., and C.N. thank for funding by the project E2S UPPA (Energy and Environment Solutions) and POCTEFA HEALTH LSR 2017-146 (Région Nouvelle Aquitaine 1R10103-00013013).
Conflict of InterestThe authors declare no conflict of interest.
Figure 5. AFM height images of a) pristine and b) PDMS surfaces after extraction with 20 wt% cross-linker (512 × 512 lines, scan area: 500 × 500 nm2). The height-profiles are represented below; the profiles were taken along the white lines. µMasch cantilevers were used.

2000170 (7 of 7)
www.advancedsciencenews.com www.mcp-journal.de
© 2020 The Authors. Published by Wiley-VCH GmbHMacromol. Chem. Phys. 2020, 2000170
Keywordselastomers, mesh deformation, mesh nanostructures, peak force AFM, poly(dimethylsiloxane)
Received: May 14, 2020Revised: July 11, 2020
Published online:
[1] M. A. Brook, Silicon in Organic, Organometallic, and Polymer Chem-istry, Wiley, New York 2000.
[2] J. E. Mark, H. R. Allcock, R. West, Inorganic Polymers, 2 ed., Oxford University Press, Oxford 2005.
[3] R. L. N. Hailes, A. M. Oliver, J. Gwyther, G. R. Whittell, I. Manners, Chem. Soc. Rev. 2016, 45, 5358.
[4] J. C. McDonald, D. C. Duffy, J. R. Anderson, D. T. Chiu, H. Wu, O. J. A. Schueller, G. M. Whitesides, Electrophoresis 2000, 21, 27.
[5] M. P. Wolf, G. B. Salieb-Beugelaar, P. Hunziker, Prog. Polym. Sci. 2018, 83, 97.
[6] S. J. Benight, C. Wang, J. B. H. Tok, Z. Bao, Prog. Polym. Sci. 2013, 38, 1961.
[7] P. J. Flory, J. Am. Chem. Soc. 1941, 63, 3083.[8] M. Mayer, R. Rabindranath, J. Börner, E. Hörner, A. Bentz,
J. Salgado, H. Han, H. Böse, J. Probst, M. Shamonin, G. J. Monkman, G. Schlunck, PLoS One 2013, 8, 76196.
[9] I. D. Johnston, D. K. McCluskey, C. K. L. Tan, M. C. Tracey, J. Micro-mech. Microeng. 2014, 24, 035017.
[10] R. N. Palchesko, L. Zhang, Y. Sun, A. W. Feinberg, PLoS One 2012, 7, 51499.
[11] A. Oláh, H. Hillborg, G. J. Vancso, Appl. Surf. Sci. 2005, 239, 410.
[12] A. Mata, A. J. Fleischman, S. Roy, Biomed. Microdevices 2005, 7, 281.[13] Z. Tan, R. Jaeger, G. J. Vancso, Polymer 1994, 35, 3230.[14] K. Saalwächter, S. Seiffert, Soft Matter 2018, 14, 1976.[15] S. Seiffert, Prog. Polym. Sci. 2017, 66, 1.[16] F. Di Lorenzo, S. Seiffert, Polym. Chem. 2015, 6, 5515.[17] K. Efimenko, W. E. Wallace, J. Genzer, J. Colloid Interface Sci. 2002,
254, 306.[18] H. Hillborg, N. Tomczak, A. Olàh, H. Schönherr, G. J. Vancso, Lang-
muir 2004, 20, 785.[19] A. Bahrami, C. Bailly, B. Nysten, Polymer 2019, 165, 180.[20] G. A. Diaz-Quijada, D. D. M. Wayner, Langmuir 2004, 20, 9607.[21] D. J. Guo, H. M. Han, W. Jing, S. J. Xiao, Z. D. Dai, Colloids Surf., A
2007, 308, 129.[22] C. De Menezes Atayde, I. Doi, Phys. Status Solidi C 2010, 7, 189.[23] R. Jellali, J. L. Duval, E. Leclerc, Mater. Sci. Eng., C 2016, 65, 295.[24] Z. Qian, D. Ross, W. Jia, Q. Xing, F. Zhao, Bioact. Mater. 2018, 3,
167.[25] S. Pinto, P. Alves, C. M. Matos, A. C. Santos, L. R. Rodrigues,
J. A. Teixeira, M. H. Gil, Colloids Surf., B 2010, 81, 20.[26] M. Dirany, L. Dies, F. Restagno, L. Léger, C. Poulard, G. Miquelard-
Garnier, Colloids Surf., A 2015, 468, 174.[27] H. Huang, I. Dobryden, P. A. Thorén, L. Ejenstam, J. Pan,
M. L. Fielden, D. B. Haviland, P. M. Claesson, Compos. Sci. Technol. 2017, 150, 111.
[28] T. Li, Y. Zhuo, V. Håkonsen, S. Rønneberg, J. He, Z. Zhang, Coatings 2019, 9, 602.
[29] I. Keranov, T. G. Vladkova, M. Minchev, A. Kostadinova, G. Altankov, P. Dineff, J. Appl. Polym. Sci. 2009, 111, 2637.
[30] G. Liu, W. S. Hung, J. Shen, Q. Li, Y. H. Huang, W. Jin, K. R. Lee, J. Y. Lai, J. Mater. Chem. A 2015, 3, 4510.
[31] Y. Gu, J. Zhao, J. A. Johnson, Trends Chem. 2019, 1, 318..[32] Y. Gu, J. Zhao, J. A. Johnson, Angew. Chem., Int. Ed. 2020, 59, 5022.