Embed Size (px)
Citation preview
BioEnergy Policy BriefBioEnergy Policy Brief
Apri lApri l 2010 2010
Research reported in this Briefing Paper was based in part on USDA CSREES grant #2008-‐34620-‐19065, titled “Policy Analysis for a National Secure & Sustainable Food, Fiber, Forestry, and Energy Program.” Views expressed herein do not necessarily reflect those of Auburn University, Texas AgriLife Research, or USDA.
Other Bioenergy Briefing Papers are available at: https://sites.auburn.edu/academic/ag/group/bioenergy/_layouts/viewlsts.aspx?BaseType=1
Net Energy Balance for Ethanol from Irrigated Corn in the High Plains of Texas
Emily K. Seawright, Ron D. Lacewell, Naveen Adusumilli, C. Robert Taylor, M. Edward Rister
Executive Summary
The National Biofuels Action Plan, drawing on mandates and funding in the Energy Independence and Security Act (EISA) of 2007, the Food, Conservation, and Energy Act (FCEA) of 2008, and other Federal legislation, lays out an ambitious plan for replacing imported oil with biofuels derived from plant matter. Biofuel production from first-generation technology, primarily ethanol from corn, has increased dramatically in recent years, now accounting for about 12 billion gallons annually. Since it takes energy—fossil fuel in particular—to grow, harvest, transport and distill ethanol, a critical policy question is the net energy gain with corn ethanol. How many billion gallons of fossil fuel equivalent (BTU’s) does it take to produce 12 billion gallons of ethanol, and is there a net energy gain?
Estimates of the net energy balance for corn ethanol vary widely. Pimentel estimated that it takes 29% more energy to produce a gallon of corn ethanol than the energy in a gallon of ethanol.1 A more comprehensive analysis by USDA found a 34% net energy gain,2 rising to 67% after accounting for co-product energy credits.3 The consensus is that dryland production of corn results in a net energy gain of 30-70%, depending on soil productivity, production practices, and distillation technology.
Studies of the net energy balance of corn ethanol are generally for all corn produced in the U.S. Irrigated corn accounts for only about 12 million of 86 million acres of corn planted in the U.S. Because substantial fossil fuel energy goes into pumping and applying irrigation water, the net energy balance may not be as favorable for irrigated corn as for dryland corn. A related policy concern is that growing irrigated corn for ethanol further stresses fresh water sources and can lead to a further decline in groundwater.
The High Plains is primarily land irrigated from the Ogallala Aquifer in Texas, New Mexico, Oklahoma, and Colorado. This region is typically characterized by limited rainfall (18-22 inches), little surface water, and mainly flat to slightly-sloped land. Crops grown on the High Plains include corn, cotton, sorghum, soybeans, and wheat, among others. Due to the semi-arid environment of the region, irrigation is used to assist in plant growth and production where water is available. Water for irrigation is pumped from the Ogallala Aquifer, typically with pumps running on natural gas or electricity. Approximately 81% of the water is within 400 feet of the surface, but depth varies depending on the location and previous water
1 Pimentel, David. 2003. “Ethanol Fuels: Energy Balance, Economics, and Environmental Impacts are Negative.” Natural
Resources Research, 12(2): 127-34. Pimentel, David, and Tad W. Patzek. 2005. “Ethanol Production Using Corn, Switchgrass, and Wood; Biodiesel Production Using Soybean and Sunflower.” Natural Resources Research, 14(1): 65-76.
2 Shapouri, Hossein, James A. Diffield, and Michael Wang. 2002. “The Energy Balance of Corn Ethanol: An Update.” Office of Energy Policy and New Uses, United States Department of Agriculture, Washington, D.C.
3 Hosein Shapouri and Andrew McAloon. “The 2001 Net Energy Balance of Corn-Ethanol, USDA/Agricultural Research Service (ARS). See also, Wang and Dan Santini, “Corn-Based Ethanol Does Indeed Achieve Energy Benefits,” Center for Transportation Research, Argonne National Laboratory, February 15, 2000.

BioEnergy Policy BriefBioEnergy Policy Brief
Apri lApri l 2010 2010
Research reported in this Briefing Paper was based in part on USDA CSREES grant #2008-‐34620-‐19065, titled “Policy Analysis for a National Secure & Sustainable Food, Fiber, Forestry, and Energy Program.” Views expressed herein do not necessarily reflect those of Auburn University, Texas AgriLife Research, or USDA.
Other Bioenergy Briefing Papers are available at: https://sites.auburn.edu/academic/ag/group/bioenergy/_layouts/viewlsts.aspx?BaseType=1
removal.4 This paper examines the net energy balance of ethanol produced using irrigated corn grown with water pumped from the Ogallala Aquifer on the Texas High Plains (Figure 1).
Texas High Plains irrigated corn yields typically average approximately 200 bushels per acre. To achieve this yield, high inputs of seed, insecticide, herbicide, nitrogen and phosphorus fertilizer, machinery, fuel, and irrigation water are required. The cost of pumping water depends on lift (distance from water in the aquifer to the surface). Since pumping lift varies across the Ogallala, net energy balance for alternative pumping depths of 250, 350, and 450 feet are estimated. Use of both electricity and natural gas to power irrigation pumps for center pivot systems are considered. Additionally, a co-product credit of 15,400 BTUs per gallon of ethanol5 for Distiller Dried Grains with Solubles (DDGS) is included as a direct substitute for corn in the calculations. Although DDGS are direct substitutes in the calculations, they actually have a lower energy value than corn.6 Details on the analysis are presented in an Appendix.
On a per gallon of ethanol basis, the energy balance at a lift of 350 feet and a PSI of 25 was a (negative) balance of -11,859 BTUs per gallon of ethanol for the center pivot sprinkler irrigation system using a natural gas powered pump, representing a net energy loss of 15.6%. At a PSI of 45, the net energy balance per gallon was -15,442, or a net energy loss of 20.3%. Figure 2 compares the net energy balance for alternative irrigation systems and pumping depths, assuming water pressure of 25 psi. Net energy losses increase for higher pump pressures. Pumping with electricity results in lower energy use than do the three scenarios with natural gas. Although the energy balance is more favorable with electricity, a disincentive exists for using electricity, as it has a higher price compared to the price of natural gas. Pumping with electricity costs about $12.00 per acre inch of water, while pumping with natural gas costs approximately $7.75 per acre inch, depending on lift, pump efficiency, and price of fuel.7
4 Masud, Sharif M., and Ronald D. Lacewell. 1990. “Energy, Water, and Economic Savings of Improved Production Systems
on the Texas High Plains.” Technical Article 25155. Texas Agricultural Experiment Station, College Station, TX. 5 Batal, Amy B. 2009. “How Much DDGS for Poultry? Even with Constraints, Distiller's Dried Grains with Solubles (DDGS) is an Acceptable Feed Ingredient that Can be Used to Feed Poultry.” Feed Management, May/June: 22-‐23. http://www.feedmanagement-‐digital.com/feedmanagement/20090506/#pg24. (accessed March 15, 2010).
6 Wang, Michael and Dan Santini. 2000. “Corn-based Ethanol Does Indeed Achieve Energy Benefits.” Center for Transportation Research, Argonne National Laboratory, Argonne, IL.
7 Natural gas is the predominate fuel for irrigation on the High Plains. Large irrigation pumps typically use natural gas; small pumps may initially be powered by natural gas, however, once the saturated thickness becomes limited and well yields decline, farmers generally choose to switch to submersible electric pumps. Access to natural gas pipelines and/or power lines also impact the type of engine used to power an irrigation pump.
Figure 1. Map of Texas High Plains Region modified from Texas Online (2002).8

BioEnergy Policy BriefBioEnergy Policy Brief
Apri lApri l 2010 2010
Research reported in this Briefing Paper was based in part on USDA CSREES grant #2008-‐34620-‐19065, titled “Policy Analysis for a National Secure & Sustainable Food, Fiber, Forestry, and Energy Program.” Views expressed herein do not necessarily reflect those of Auburn University, Texas AgriLife Research, or USDA.
Other Bioenergy Briefing Papers are available at: https://sites.auburn.edu/academic/ag/group/bioenergy/_layouts/viewlsts.aspx?BaseType=1
Naturally, the greater the pumping lift and pressure of the system, the greater the energy going into corn production. It is notable that all scenarios presented in this study, based on Pimentel (2003) conversion BTU values, more energy is used to convert corn into ethanol than to produce and haul the corn to the grain elevator.
Increased irrigation due to the ethanol mandate will also contribute to a decline of groundwater in the Ogallala where many areas have little to no recharge. In addition, with greater pumping lift resulting due to the mining of the aquifer, there is an increase in pumping costs for irrigation of traditional cotton, wheat, and food crops. Although there is a negative energy balance, ethanol from irrigated corn partially converts a stationary fuel (natural gas or electricity) to a mobile fuel, a consideration that may be relevant to bioenergy policy. High Plains irrigated corn in Texas requires 289,127 BTUs per bushel of corn to produce and convert corn to ethanol, compared to dryland production of corn for ethanol in the Midwest, which requires 209,773 BTUs per bushel of corn. Pumping water substantially increases the energy necessary to produce corn, reducing the energy efficiency of ethanol as a fuel. Thus, irrigated corn produced with natural gas in the High Plains as an ethanol feedstock would result in a negative net energy balance. In every scenario evaluated in this study, net energy balance (without a co-product credit) was negative; however, with inclusion of a co-product energy credit, the scenarios using electricity to power pumps are positive.
8 Texas Online. 2002. “The High Plains Region.” Texas Online: Window on State Government.
<http://www.window.state.tx.us/ecodata/regional/highplains/map.html> (accessed February 19, 2009).
-‐30%
-‐20%
-‐10%
0%
10%
Center Pivot, Natural Gas
Center Pivot, Strip Till,
Natural Gas
Center Pivot, Electricity
Furrow, Natural Gas
Net Ene
rgy Ba
lance (%
)
Fig. 2. Net Energy Balance for Irrigated Corn by System and Pumping Depth, 25 PSI
250'
350'
450'

BioEnergy Policy BriefBioEnergy Policy Brief
Apri lApri l 2010 2010
Research reported in this Briefing Paper was based in part on USDA CSREES grant #2008-‐34620-‐19065, titled “Policy Analysis for a National Secure & Sustainable Food, Fiber, Forestry, and Energy Program.” Views expressed herein do not necessarily reflect those of Auburn University, Texas AgriLife Research, or USDA.
Other Bioenergy Briefing Papers are available at: https://sites.auburn.edu/academic/ag/group/bioenergy/_layouts/viewlsts.aspx?BaseType=1
Appendix: Parameters and Assumptions
Texas AgriLife Extension Service (2009a; 2009b) crop enterprise budgets are used as the basis for corn yield and the associated quantity of inputs used. Studies by Pimentel (2003) and Pimentel and Patzek (2005) are used to calculate BTU energy for insecticide, herbicide, labor, fertilizer,8 and machinery. Additionally, energy requirements for seed are drawn from Shapouri, Duffield, and Wang (2002), and energy amounts for natural gas, electricity, gasoline, and diesel are taken from the Oak Ridge National Laboratory (2009). These per-unit BTU amounts are then used in conjunction with the input quantities specified in the enterprise crop budgets9 to determine the total BTUs required to produce an acre of corn on the High Plains. Additionally, BTUs for the remaining inputs to produce ethanol are drawn from Pimentel (2003). These include corn transport, water, stainless steel, steel, cement, coal, and electricity.10
The crop budgets include a center pivot sprinkler irrigation system with wells powered by natural gas and alternatively by electricity, a strip till budget (using center pivots and natural gas), and furrow irrigation (using natural gas). The amount of natural gas and electricity used were calculated for each budget using the assumed lift (or distance from the aquifer to the surface) of 250, 350, and 450 feet,11 and a pressure per square inch (psi) of 25 and 4512 (Masud and Lacewell 1990; Adusumilli and Almas 2006). Equations from Lacewell and Collins (1986) were used to determine the amount of natural gas and electricity used for irrigation:
Natural Gas: 1,000 cubic feet = [(2.31*PSI) + Lift)] * [0.11427/(PE*DE)] * (0.002544/EE); and
Electricity: kWh = [(2.37*PSI) + Lift] * (0.101141/PE); where:
PE = pump efficiency = 0.65; DE = drive efficiency = 0.97; EE = engine efficiency = 0.23; PSI = pressure per square inch; kWh = kilowatt hours; and Lift = feet from static groundwater level to the surface.
BTUs for irrigation and remaining inputs were summed for each scenario of corn production and combined with the BTUs for conversion of corn to ethanol to obtain estimated total input BTUs. The total BTUs of production and conversion were then subtracted from the output BTUs of ethanol from corn to obtain the net energy balance. The energy for one gallon of ethanol is calculated assuming 2.8 gallons of ethanol are produced per bushel of corn (Dhuyvetter, Kastens, and Schroeder 2008). The number of bushels per acre ranges from 180 to 210 bushels. Total gallons of ethanol per acre are multiplied by the 76,000 BTU output per gallon of ethanol (U.S. Energy Information Administration 2002; Shapouri, Duffield, and Wang 2002) to obtain the total BTU output per acre. The energy used to produce and convert corn is subtracted from per acre energy produced as ethanol.
8 Calculations for the BTUs for anhydrous ammonia were made using Gellings and Parmenter (2004) estimates of 35,000-
40,000 cubic feet of natural gas per ton of fertilizer. 9 Quantities for the amount of diesel and gasoline used are also taken from Pimental and Patzek (2005), as these inputs are not
included for harvest and haul in the enterprise crop budgets. 10 Included in the energy conversion of inputs is the amount of energy necessary to produce the inputs of stainless steel, steel,
and cement (Pimentel 2003; Slesser and Lewis 1979). 11 The scenario that evaluates production at a lift of 350 feet is used as the base scenario. The remaining lifts are considered
sensitivity scenarios and account for variation within the water table of the Ogallala Aquifer. 12 Furrow irrigation was only calculated with a PSI of 25, as this form of irrigation requires low pressure to pump and distribute
water to the crop, although application efficiency is typically less than a center pivot system (Lacewell and Collins 1989).

BioEnergy Policy BriefBioEnergy Policy Brief
Apri lApri l 2010 2010
Research reported in this Briefing Paper was based in part on USDA CSREES grant #2008-‐34620-‐19065, titled “Policy Analysis for a National Secure & Sustainable Food, Fiber, Forestry, and Energy Program.” Views expressed herein do not necessarily reflect those of Auburn University, Texas AgriLife Research, or USDA.
Other Bioenergy Briefing Papers are available at: https://sites.auburn.edu/academic/ag/group/bioenergy/_layouts/viewlsts.aspx?BaseType=1
The result is added to the co-product credit13 to obtain net energy per acre. The net energy per acre from ethanol is divided by the total gallons of ethanol per acre to calculate the net BTUs per gallon of ethanol. The results for the base scenario (350 feet lift) are reported below; figures for the remaining results are presented at the end of this report in Figures 8-11 and are to be interpreted in a similar fashion. Distribution of Inputs For all cases in the sprinkler irrigation scenario using natural gas, diesel fuel BTUs were 1.23 million per acre, anhydrous ammonia used 2.26 million BTUs per acre, nitrogen used 2.25 million BTUs per acre, and phosphorus used 0.45 million BTUs per acre. Inputs for the remaining types of corn production using natural gas (i.e., strip till, and furrow) are similar to those of the natural gas center pivot system. Electricity is similar, but the enterprise budgets indicate no anhydrous ammonia is used in this scenario, only nitrogen fertilizer. Figure 3 presents the distribution of these inputs for the center pivot, natural gas scenario. The BTUs for irrigation varied with different pumping lifts and different pressures. At a lift of 350 feet, irrigation used 18.59 million BTUs per acre at 25 PSI, and 20.70 million BTUs per acre at 45 PSI.
13 The co-product credit in Wang and Santini (2000) is based on the energy input requirement of corn. These authors also
suggest that different calculations of the co-product credit could yield higher results. It is noteworthy, however, that Distiller Dried Grains with Solubles (co-product of corn ethanol production) are not a direct substitute of corn and have a 17% lower energy value than corn (Batal 2009).
2.7% 1.3%
7.8% 1.6%
7.8%
4.2%
1.7%
1.3% 71.7%
Fig. 3. DistribuFon of Inputs for Center Pivot, Natural Gas Corn ProducFon
Seed
InsecIcide/Herbicide
NH3
P
N
Diesel
Gasoline
Operator/Hand Labor
Center Pivot
NH3
BioEnergy Policy BriefBioEnergy Policy Brief
Apri lApri l 2010 2010
Research reported in this Briefing Paper was based in part on USDA CSREES grant #2008-‐34620-‐19065, titled “Policy Analysis for a National Secure & Sustainable Food, Fiber, Forestry, and Energy Program.” Views expressed herein do not necessarily reflect those of Auburn University, Texas AgriLife Research, or USDA.
Other Bioenergy Briefing Papers are available at: https://sites.auburn.edu/academic/ag/group/bioenergy/_layouts/viewlsts.aspx?BaseType=1
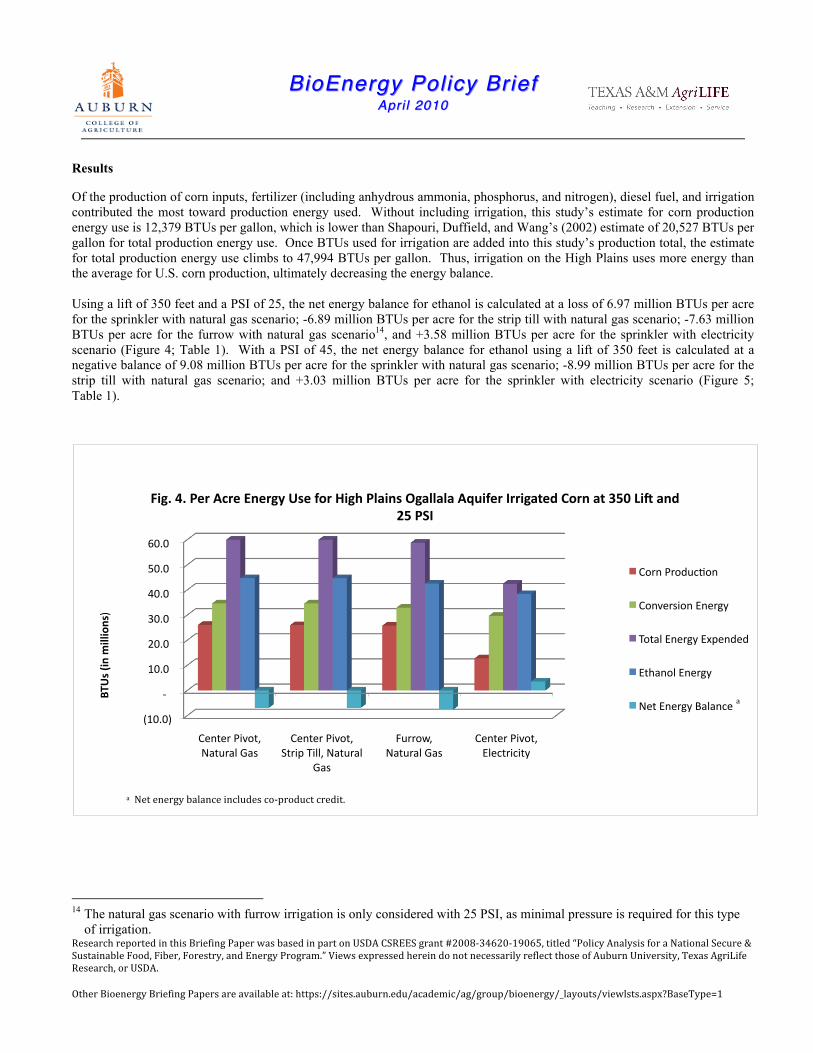
Results
Of the production of corn inputs, fertilizer (including anhydrous ammonia, phosphorus, and nitrogen), diesel fuel, and irrigation contributed the most toward production energy used. Without including irrigation, this study’s estimate for corn production energy use is 12,379 BTUs per gallon, which is lower than Shapouri, Duffield, and Wang’s (2002) estimate of 20,527 BTUs per gallon for total production energy use. Once BTUs used for irrigation are added into this study’s production total, the estimate for total production energy use climbs to 47,994 BTUs per gallon. Thus, irrigation on the High Plains uses more energy than the average for U.S. corn production, ultimately decreasing the energy balance. Using a lift of 350 feet and a PSI of 25, the net energy balance for ethanol is calculated at a loss of 6.97 million BTUs per acre for the sprinkler with natural gas scenario; -6.89 million BTUs per acre for the strip till with natural gas scenario; -7.63 million BTUs per acre for the furrow with natural gas scenario14, and +3.58 million BTUs per acre for the sprinkler with electricity scenario (Figure 4; Table 1). With a PSI of 45, the net energy balance for ethanol using a lift of 350 feet is calculated at a negative balance of 9.08 million BTUs per acre for the sprinkler with natural gas scenario; -8.99 million BTUs per acre for the strip till with natural gas scenario; and +3.03 million BTUs per acre for the sprinkler with electricity scenario (Figure 5; Table 1).
14 The natural gas scenario with furrow irrigation is only considered with 25 PSI, as minimal pressure is required for this type
of irrigation.
(10.0)
-‐
10.0
20.0
30.0
40.0
50.0
60.0
Center Pivot, Natural Gas
Center Pivot, Strip Till, Natural
Gas
Furrow, Natural Gas
Center Pivot, Electricity
BTUs (in
millions)
Fig. 4. Per Acre Energy Use for High Plains Ogallala Aquifer Irrigated Corn at 350 LiR and 25 PSI
Corn ProducIon
Conversion Energy
Total Energy Expended
Ethanol Energy
Net Energy Balance a
a Net energy balance includes co-‐product credit.

BioEnergy Policy BriefBioEnergy Policy Brief
Apri lApri l 2010 2010
Research reported in this Briefing Paper was based in part on USDA CSREES grant #2008-‐34620-‐19065, titled “Policy Analysis for a National Secure & Sustainable Food, Fiber, Forestry, and Energy Program.” Views expressed herein do not necessarily reflect those of Auburn University, Texas AgriLife Research, or USDA.
Other Bioenergy Briefing Papers are available at: https://sites.auburn.edu/academic/ag/group/bioenergy/_layouts/viewlsts.aspx?BaseType=1
Table 1. Total Energy Expended, Ethanol Energy, and Net Energy Per Acre in the Texas High Plains for the Farming Methods at 250, 350, and 450 feet Lift and 25 and 45 PSI (in millions), 2010.
350 Feet Lift-25 PSI 350 Feet Lift-45 PSI CPNGa CPSTNGb Fc CPEd CPNGa CPSTNGb CPEd
Total Energy Expended
60.7 60.6 58.8 42.5 62.8 62.7 43.0
Ethanol Energy 44.7 44.7 42.6 38.3 44.7 44.7 38.3 Net Energye (7.0) (6.9) (7.6) 3.6 (9.1) (9.0) 3.0
250 Feet Lift-25 PSI 250 Feet Lift-45 PSI CPNGa CPSTNGb Fc CPEd CPNGa CPSTNGb CPEd
Total Energy Expended
56.2 56.1 53.4 41.3 58.3 58.2 41.9
Ethanol Energy 44.7 44.7 42.6 38.3 44.7 44.7 38.3 Net Energye (2.4) (2.3) (2.2) (4.8) (4.5) (4.4) (4.2)
450 Feet Lift-25 PSI 450 Feet Lift-45 PSI CPNGa CPSTNGb Fc CPEd CPNGa CPSTNGb CPEd
Total Energy Expended
65.3 65.2 64.2 43.7 67.4 67.3 44.2
Ethanol Energy 44.7 44.7 42.6 38.3 44.7 44.7 38.3 Net Energye (11.5) (11.4) (13.0) (2.4) (13.6) (13.6) (1.9) a CPNG = Center Pivot, Natural Gas b CPSTNG = Center Pivot, Strip Till, Natural Gas c F = Furrow, Natural Gas
d CPE = Center Pivot, Electricity e Net Energy includes co-product credit.
(10.0)
-‐
10.0
20.0
30.0
40.0
50.0
60.0
70.0
Center Pivot, Natural Gas
Center Pivot, Strip Till, Natural Gas
Center Pivot, Electricity
BTUs (in
millions)
Fig. 5. Per Acre Energy Use for High Plains Ogallala Aquifer Irrigated Corn at 350 LiR and 45 PSI
Corn ProducIon
Conversion Energy
Total Energy Expended
Ethanol Energy
Net Energy Balance
BioEnergy Policy BriefBioEnergy Policy Brief
Apri lApri l 2010 2010
Research reported in this Briefing Paper was based in part on USDA CSREES grant #2008-‐34620-‐19065, titled “Policy Analysis for a National Secure & Sustainable Food, Fiber, Forestry, and Energy Program.” Views expressed herein do not necessarily reflect those of Auburn University, Texas AgriLife Research, or USDA.
Other Bioenergy Briefing Papers are available at: https://sites.auburn.edu/academic/ag/group/bioenergy/_layouts/viewlsts.aspx?BaseType=1
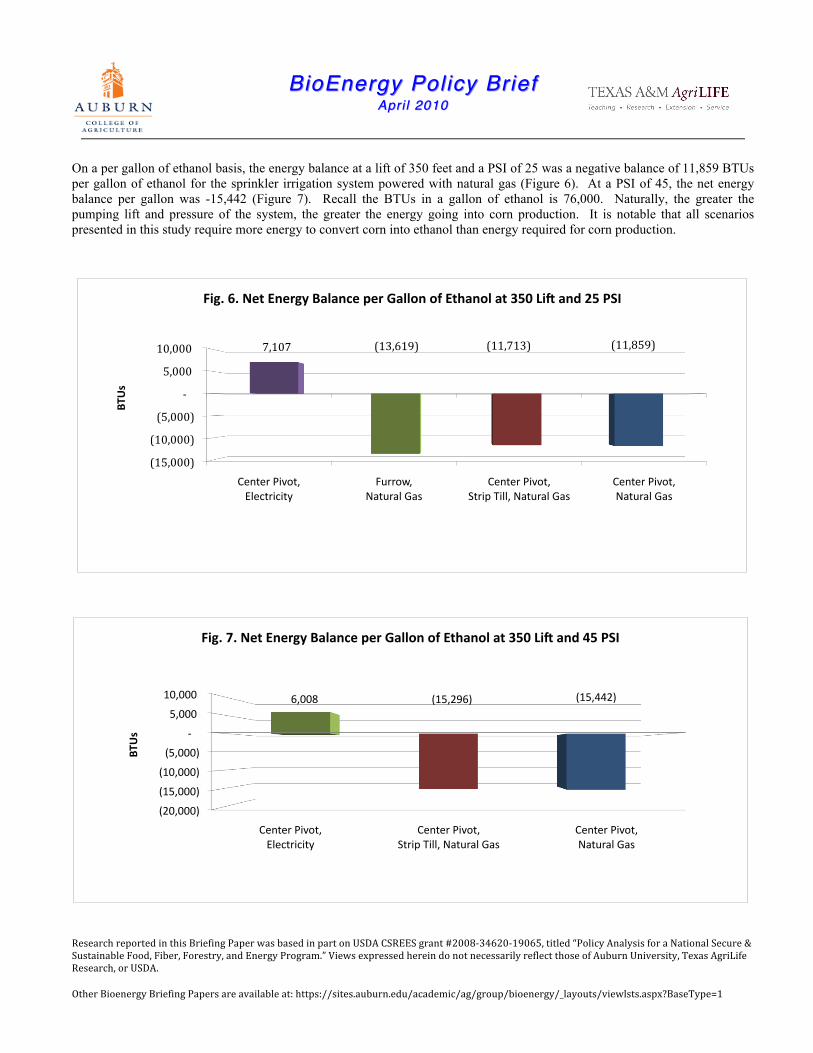
On a per gallon of ethanol basis, the energy balance at a lift of 350 feet and a PSI of 25 was a negative balance of 11,859 BTUs per gallon of ethanol for the sprinkler irrigation system powered with natural gas (Figure 6). At a PSI of 45, the net energy balance per gallon was -15,442 (Figure 7). Recall the BTUs in a gallon of ethanol is 76,000. Naturally, the greater the pumping lift and pressure of the system, the greater the energy going into corn production. It is notable that all scenarios presented in this study require more energy to convert corn into ethanol than energy required for corn production.
Center Pivot, Natural Gas
Center Pivot, Strip Till, Natural Gas
Furrow, Natural Gas
Center Pivot, Electricity
(15,000)
(10,000)
(5,000)
-‐
5,000
10,000 (11,859) (11,713) (13,619) 7,107
BTUs
Fig. 6. Net Energy Balance per Gallon of Ethanol at 350 LiR and 25 PSI
Center Pivot, Natural Gas
Center Pivot, Strip Till, Natural Gas
Center Pivot, Electricity
(20,000)
(15,000)
(10,000)
(5,000)
-‐
5,000
10,000 (15,442) (15,296) 6,008
BTUs
Fig. 7. Net Energy Balance per Gallon of Ethanol at 350 LiR and 45 PSI
BioEnergy Policy BriefBioEnergy Policy Brief
Apri lApri l 2010 2010
Research reported in this Briefing Paper was based in part on USDA CSREES grant #2008-‐34620-‐19065, titled “Policy Analysis for a National Secure & Sustainable Food, Fiber, Forestry, and Energy Program.” Views expressed herein do not necessarily reflect those of Auburn University, Texas AgriLife Research, or USDA.
Other Bioenergy Briefing Papers are available at: https://sites.auburn.edu/academic/ag/group/bioenergy/_layouts/viewlsts.aspx?BaseType=1
Electricity
Overall, the scenarios with electricity resulted in lower energy use for production and conversion than did the three scenarios with natural gas. The best possible scenario occurred in the sprinkler irrigation scenario using electricity, 250 feet lift, and 25 PSI. This scenario resulted in a net energy balance of 4.75 million BTUs per acre (Table 1). While the BTU balance is more favorable with electricity, a disincentive exists for using electricity, as it has a higher price compared to the price of natural gas (i.e., $12.00/ac-in for electricity compared to $7.75/ac-in for natural gas, resulting in a difference in production costs of $85.00/ac or $0.425/bu for 200 bu/ac irrigated corn), is not as easily accessible as natural gas pipelines, and is not used to power the large irrigation pumps. Thus, more natural gas is used on the Texas High Plains than electricity, despite electricity’s positive energy balance.
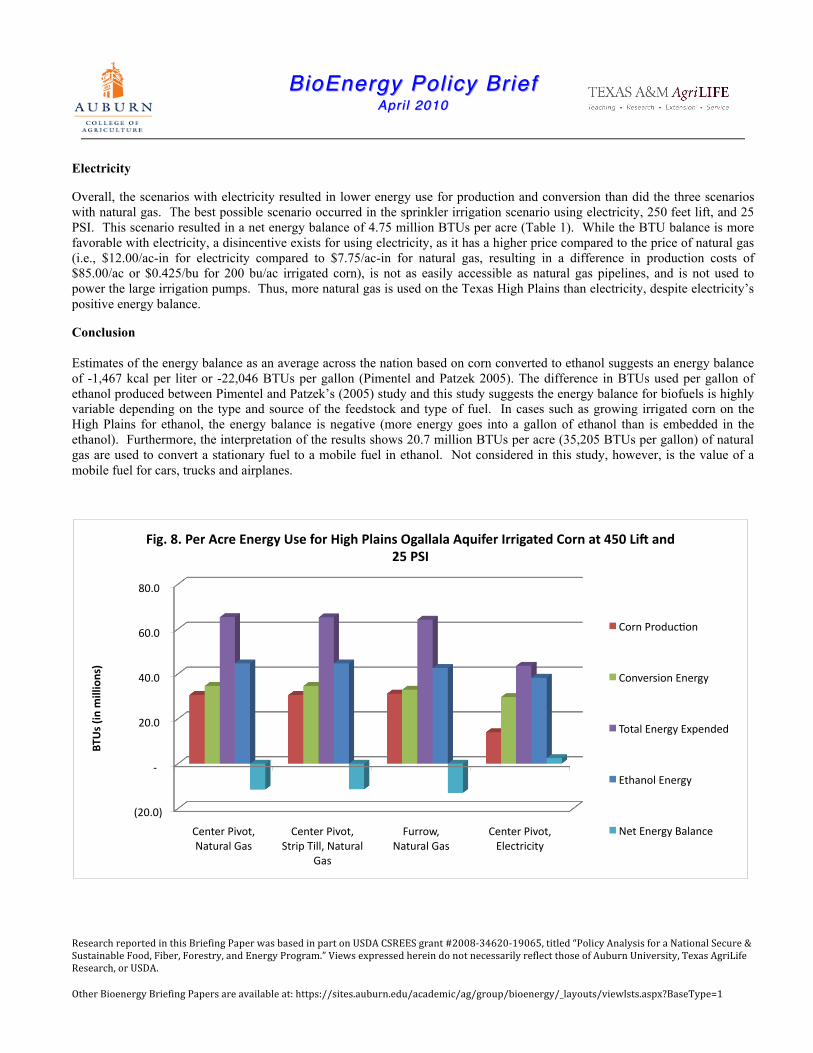
Conclusion Estimates of the energy balance as an average across the nation based on corn converted to ethanol suggests an energy balance of -1,467 kcal per liter or -22,046 BTUs per gallon (Pimentel and Patzek 2005). The difference in BTUs used per gallon of ethanol produced between Pimentel and Patzek’s (2005) study and this study suggests the energy balance for biofuels is highly variable depending on the type and source of the feedstock and type of fuel. In cases such as growing irrigated corn on the High Plains for ethanol, the energy balance is negative (more energy goes into a gallon of ethanol than is embedded in the ethanol). Furthermore, the interpretation of the results shows 20.7 million BTUs per acre (35,205 BTUs per gallon) of natural gas are used to convert a stationary fuel to a mobile fuel in ethanol. Not considered in this study, however, is the value of a mobile fuel for cars, trucks and airplanes.
(20.0)
-‐
20.0
40.0
60.0
80.0
Center Pivot, Natural Gas
Center Pivot, Strip Till, Natural
Gas
Furrow, Natural Gas
Center Pivot, Electricity
BTUs (in
millions)
Fig. 8. Per Acre Energy Use for High Plains Ogallala Aquifer Irrigated Corn at 450 LiR and 25 PSI
Corn ProducIon
Conversion Energy
Total Energy Expended
Ethanol Energy
Net Energy Balance

BioEnergy Policy BriefBioEnergy Policy Brief
Apri lApri l 2010 2010
Research reported in this Briefing Paper was based in part on USDA CSREES grant #2008-‐34620-‐19065, titled “Policy Analysis for a National Secure & Sustainable Food, Fiber, Forestry, and Energy Program.” Views expressed herein do not necessarily reflect those of Auburn University, Texas AgriLife Research, or USDA.
Other Bioenergy Briefing Papers are available at: https://sites.auburn.edu/academic/ag/group/bioenergy/_layouts/viewlsts.aspx?BaseType=1
(20.0)
-‐
20.0
40.0
60.0
80.0
Center Pivot, Natural Gas
Center Pivot, Strip Till, Natural Gas
Center Pivot, Electricity
BTUs (in
millions)
Fig. 9. Per Acre Energy Use for High Plains Ogallala Aquifer Irrigated Corn at 450 LiR and 45 PSI
Corn ProducIon
Conversion Energy
Total Energy Expended
Ethanol Energy
Net Energy Balance

BioEnergy Policy BriefBioEnergy Policy Brief
Apri lApri l 2010 2010
Research reported in this Briefing Paper was based in part on USDA CSREES grant #2008-‐34620-‐19065, titled “Policy Analysis for a National Secure & Sustainable Food, Fiber, Forestry, and Energy Program.” Views expressed herein do not necessarily reflect those of Auburn University, Texas AgriLife Research, or USDA.
Other Bioenergy Briefing Papers are available at: https://sites.auburn.edu/academic/ag/group/bioenergy/_layouts/viewlsts.aspx?BaseType=1
(10.0)
-‐
10.0
20.0
30.0
40.0
50.0
60.0
Center Pivot, Natural Gas
Center Pivot, Strip Till, Natural
Gas
Furrow, Natural Gas
Center Pivot, Electricity
BTUs (in
millions)
Fig. 10. Per Acre Energy Use for High Plains Ogallala Aquifer Corn at 250 LiR and 25 PSI
Corn ProducIon
Conversion Energy
Total Energy Expended
Ethanol Energy
Net Energy Balance

BioEnergy Policy BriefBioEnergy Policy Brief
Apri lApri l 2010 2010
Research reported in this Briefing Paper was based in part on USDA CSREES grant #2008-‐34620-‐19065, titled “Policy Analysis for a National Secure & Sustainable Food, Fiber, Forestry, and Energy Program.” Views expressed herein do not necessarily reflect those of Auburn University, Texas AgriLife Research, or USDA.
Other Bioenergy Briefing Papers are available at: https://sites.auburn.edu/academic/ag/group/bioenergy/_layouts/viewlsts.aspx?BaseType=1
(10.0)
-‐
10.0
20.0
30.0
40.0
50.0
60.0
Center Pivot, Natural Gas
Center Pivot, Strip Till, Natural Gas
Center Pivot, Electricity
BTUs (in
millions)
Fig. 11. Per Acre Energy Use for High Plains Ogallala Aquifer Irrigated Corn at 250 LiR and 45 PSI
Corn ProducIon
Conversion Energy
Total Energy Expended
Ethanol Energy
Net Energy Balance

BioEnergy Policy BriefBioEnergy Policy Brief
Apri lApri l 2010 2010
Research reported in this Briefing Paper was based in part on USDA CSREES grant #2008-‐34620-‐19065, titled “Policy Analysis for a National Secure & Sustainable Food, Fiber, Forestry, and Energy Program.” Views expressed herein do not necessarily reflect those of Auburn University, Texas AgriLife Research, or USDA.
Other Bioenergy Briefing Papers are available at: https://sites.auburn.edu/academic/ag/group/bioenergy/_layouts/viewlsts.aspx?BaseType=1
Literature Cited
Adusumilli, Naveen C., and Lal K. Almas. 2006. “Energy Cost Comparisons of Center Pivot Systems in the Northern Texas High Plains.” Presentation. Universities Council on Water Resources, Boise, Idaho.
Batal, Amy B. 2009. “How Much DDGS for Poultry? Even with Constraints, Distiller's Dried Grains with Solubles (DDGS) is an Acceptable Feed Ingredient that Can be Used to Feed Poultry.” Feed Management, May/June: 22-23. http://www.feedmanagement-digital.com/feedmanagement/20090506/#pg24. (accessed March 15, 2010).
Dhuyvetter, Kevin C., Terry L. Kastens, and Ted C. Schroeder. 2008. “Ethanol Industry–Impact on Corn and DGS Production.” TriState Dairy Short Course. Department of Agricultural Economics, Kansas State University, Manhattan, KS. <http://www.agmanager.info/energy/TriStateDairyShortcourse%28Jan2008%29-2.pdf> (accessed March 28, 2010).
Gellings, Clark W., and Kelly E. Parmenter. 2004. “Energy Efficiency in Fertilizer Production and Use.” In Efficient Use and Conservation of Energy, Eds. Clark W. Gellings and Kornelis Blok, in Encyclopedia of Life Support Systems (EOLSS). Developed under the auspices of the UNESCO, Oxford, UK: Eolss Publishers. <http://www.eolss.net/ebooks/Sample%20Chapters/C08/E3-18-04-03.pdf> (accessed March 3, 2010).
Lacewell, Ronald D., and Glenn S. Collins. 1986. “Energy Inputs on Western Groundwater Irrigated Areas.” In Energy and Water Management in Western Irrigated Agriculture, edited by Norman K. Whittlesey, 155-76. Boulder: Westview Press.
Masud, Sharif M., and Ronald D. Lacewell. 1990. “Energy, Water, and Economic Savings of Improved Production Systems on the Texas High Plains.” Technical Article 25155. Texas Agricultural Experiment Station, College Station, TX.
Pimentel, David. 2003. “Ethanol Fuels: Energy Balance, Economics, and Environmental Impacts are Negative.” Natural Resources Research, 12(2): 127-34.
Pimentel, David, and Tad W. Patzek. 2005. “Ethanol Production Using Corn, Switchgrass, and Wood; Biodiesel Production Using Soybean and Sunflower.” Natural Resources Research, 14(1): 65-76.
Slesser, Malcolm, and Chris Lewis. 1979. Biological Energy Resources. New York: Halsted Press.
Shapouri, Hossein, James A. Duffield, and Michael Wang. 2002. “The Energy Balance of Corn Ethanol: An Update.” Office of Energy Policy and New Uses. United States Department of Agriculture, Washington, D.C.
Oak Ridge National Laboratory. 2009. “Bioenergy Conversion Factors.” Bioenergy Feedstock Development Programs at Oak Ridge National Laboratory. <http://bioenergy.ornl.gov/papers/misc/energy_conv.html> (accessed January 6, 2010).
Texas AgriLife Extension Service. 2009a. “2009 Texas Crop and Livestock Budgets; District 1.” Texas AgriLife Extension Service website. < http://agecoext.tamu.edu> (accessed January 6, 2010).
Texas AgriLife Extension Service. 2009b. “2009 Texas Crop and Livestock Budgets; District 2.” Texas AgriLife Extension Service website. < http://agecoext.tamu.edu> (accessed January 6, 2010).
U.S. Energy Information Administration. 2002. “Potential Supply Impacts of Removal of 1-Pound RVP Waiver.” U.S. Energy Information Administration, Independent Statistics and Analysis, Office of Oil and Gas. <http://www.eia.doe.gov/oiaf/servicerpt/fuel/pdf/question7.pdf> (accessed March 3, 2010).
Wang, Michael, and Dan Santini. 2000. “Corn-Based Ethanol Does Indeed Achieve Energy Benefits.” Center for Transportation Research, Argonne National Laboratory, Argonne, IL.