Embed Size (px)
Citation preview

Neste
Capital Markets Day 15 September 2015
London

Agenda
12:30 Growing ambitions Matti Lievonen, CEO
13:00 Baltic Sea champion Matti Lehmus, EVP, Oil Products
Antti Tiitola, EVP, Oil Retail
14:00 Break
14:20 Global renewable growth Kaisa Hietala, EVP, Renewable Products
Tuomas Hyyryläinen, SVP, Strategy and
New Ventures
15:20 Healthy financials supporting growth
ambition
Jyrki Mäki-Kala, CFO
15:45 General Q&A
16:00 Concluding remarks Matti Lievonen, CEO
16:15 Cocktails
15 September 2015 Capital Markets Day 2

Disclaimer
The following information contains, or may be deemed to contain, “forward-looking statements”. These
statements relate to future events or our future financial performance, including, but not limited to,
strategic plans, potential growth, planned operational changes, expected capital expenditures, future
cash sources and requirements, liquidity and cost savings that involve known and unknown risks,
uncertainties and other factors that may cause Neste Corporation’s or its businesses’ actual results,
levels of activity, performance or achievements to be materially different from those expressed or
implied by any forward-looking statements. In some cases, such forward-looking statements can be
identified by terminology such as “may,” “will,” “could,” “would,” “should,” “expect,” “plan,” “anticipate,”
“intend,” “believe,” “estimate,” “predict,” “potential,” or “continue,” or the negative of those terms or other
comparable terminology. By their nature, forward-looking statements involve risks and uncertainties
because they relate to events and depend on circumstances that may or may not occur in the future.
Future results may vary from the results expressed in, or implied by, the following forward-looking
statements, possibly to a material degree. All forward-looking statements made in this presentation are
based on information presently available to management and Neste Corporation assumes no obligation
to update any forward-looking statements. Nothing in this presentation constitutes investment advice
and this presentation shall not constitute an offer to sell or the solicitation of an offer to buy any
securities or otherwise to engage in any investment activity.
15 September 2015 Capital Markets Day 3

15 September 2015 Capital Markets Day 4
Speakers
Matti Lievonen
(born 1958)
President & CEO, Chair of the Neste Executive Board
B.Sc. (Eng.), eMBA.
President & CEO since 2008.
Joined the company in 2008. Served as President of the Fine and Speciality Papers Division at UPM-Kymmene
Corporation, and in a number of other senior positions at UPM (1986–2008), and prior to that at ABB. Member of
UPM-Kymmene’s Executive Board 2002–2008. Chair of the Board of Nynas AB. Vice Chair of the Board of the
Chemical Industry Federation of Finland. Member of the Board of SSAB AB. Chair of the Supervisory Board of
Ilmarinen Mutual Pension Insurance Company and Member of the Advisory Board of National Emergency
Supply Agency. Member of the Supervisory Board of The Finnish Fair Corporation.
Jyrki Mäki-Kala
(born 1961)
Chief Financial Officer
M.Sc. (Econ.)
Member of the Neste Executive Board since 2013.
Joined the company in 2013. Responsible for the Group’s financial management, investor relations, and risk
management. Chair of the Board of Directors of Neste Jacobs. Served in various business and corporate
financial positions at Kemira (2005–2013). Previously worked for Finnish Chemicals.

15 September 2015 Capital Markets Day 5
Speakers
Matti Lehmus
(born 1974)
Executive Vice President, Oil Products
M.Sc. (Eng.), eMBA.
Member of the Neste Executive Board since 2009.
Joined the company in 1997. Responsible for the Oil Products business area. Previously served as Executive
Vice President of the Oil Products and Renewables business area (2011–2014), Executive Vice President of
the Oil Products business area (2009–2010), Vice President of the Base Oils business in the Specialty
Products Division (2007–2009), Vice President of Oil Refining Business Development (2007) and Gasoline
Exports and Trading Manager (2004–2007) in the Oil Refining Division. Vice Chair of the Board of the Finnish
Petroleum & Biofuels Association.
Kaisa Hietala
(born 1971)
Executive Vice President, Renewable Products
M.Sc.(Physics), Finland and M.Sc.(Env.Sc.), UK
Member of the Neste Executive Board since 2014.
Joined the company in 1998. Responsible for the Renewable Products business area. Served in several
positions at Neste, most recently as Vice President of the Renewable Fuels business (2011–2014), Vice
President of Supply in Singapore (2009–2011), Commercial Director in Singapore (2008), and Feedstock
Manager in the Renewable Fuels Business operations (2006-2008).

15 September 2015 Capital Markets Day 6
Speakers
Antti Tiitola
(born 1967)
Executive Vice President, Oil Retail
Commercial college graduate
Member of the Neste Executive Board since 2014.
Joined the company in October 2014. Responsible for Oil Retail Business Area in Finland and the Baltic Rim.
Served previously as Senior Vice President in Passenger traffic division of VR-Group ltd (2012–2014),
Managing Director of Lidl Finland (2000–2011), and in several marketing related positions in Örum Oy Ab
(1992–2000). Member of the Board of Broman Group Oy, Raisio Oyj, and Verkkokauppa.com Oyj. Member of
the Board of Finnish Petroleum & Biofuels Association, and German-Finnish Chamber of Commerce.
Tuomas Hyyryläinen
(born 1977)
Senior Vice President, Strategy and New Ventures
M.Sc. (Econ.)
Member of the Neste Executive Board since 2012.
Joined the company in 2012. Responsible for strategy, New Ventures, Market Intelligence, and M&A
operations. Previously served as Vice President for Strategy at F-Secure and served in various strategy- and
business development-related positions at Nokia. Member of the Board of Directors of Nynas AB.

Growing ambitions Matti Lievonen, President & CEO

15 September 2015 Capital Markets Day 8
Our vision
Creating responsible choices every day

On track with our promises
15 September 2015 Capital Markets Day 9
Focusing on
strategy Enhancing
competitiveness Creating growth
Outsourcing non-core assets:
• Kilpilahti electricity grid
company sold
• Powerplant joint venture
• Outsourcing of shipping
operations finalized
• Outsourcing of hydrogen
unit
• SDA unit investment in
Porvoo
• Isomerization unit completed
• Converting Porvoo and
Naantali refineries to
operate as one entity
• Organizational restructuring
• Reduced production costs
• Reduced fixed costs
• Capacity increase in
Renewable Products
• Progress and new openings
in biochemicals, e.g.
cooperation with Total
Fluides
• Low-sulphur bunker fuel
introduced
• Bio-LPG unit under
construction in Rotterdam
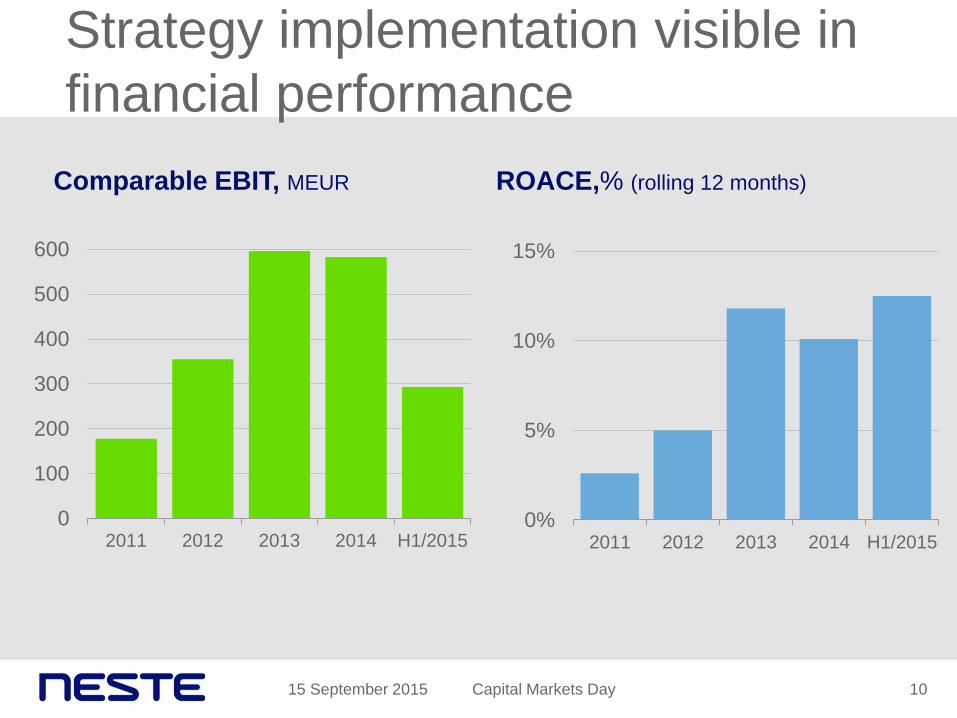
Strategy implementation visible in
financial performance
15 September 2015 Capital Markets Day 10
0%
5%
10%
15%
2011 2012 2013 2014 H1/2015
Comparable EBIT, MEUR
ROACE,% (rolling 12 months)
0
100
200
300
400
500
600
2011 2012 2013 2014 H1/2015

Strong cash flow supported by
over EUR 1 billion EBITDA
11
Comparable EBITDA, MEUR
0
200
400
600
800
1,000
1,200
2011 2012 2013 2014 H1/2015*
* rolling 12 months as of 30 June 2015
15 September 2015 Capital Markets Day

Outperforming the peers
15 September 2015 Capital Markets Day 12
*Peer group: ERG, Hellenic Petroleum, Lotos, MOL, Motor Oil Hellas, PKN Orlen, Saras, Tesoro, Tupras, Valero Energy
Relative share price
peer group* index average
50
100
150
200
250
300
Jan-13 Jul-13 Jan-14 Jul-14 Jan-15 Jul-15
Neste
Peer group
+ 132%
+ 39%

15 September 2015 Capital Markets Day 13
Current supporting trends in the market
Strong gasoline
margin
US EPA’s
volume
proposal to add
predictability on
biofuel markets
EU has set new
GHG emission
and renewable
energy targets
for 2030
Oil product
demand
recovered
Lower crude oil
price improving
refining
profitability
Stronger US
dollar
15 September 2015 Capital Markets Day 14
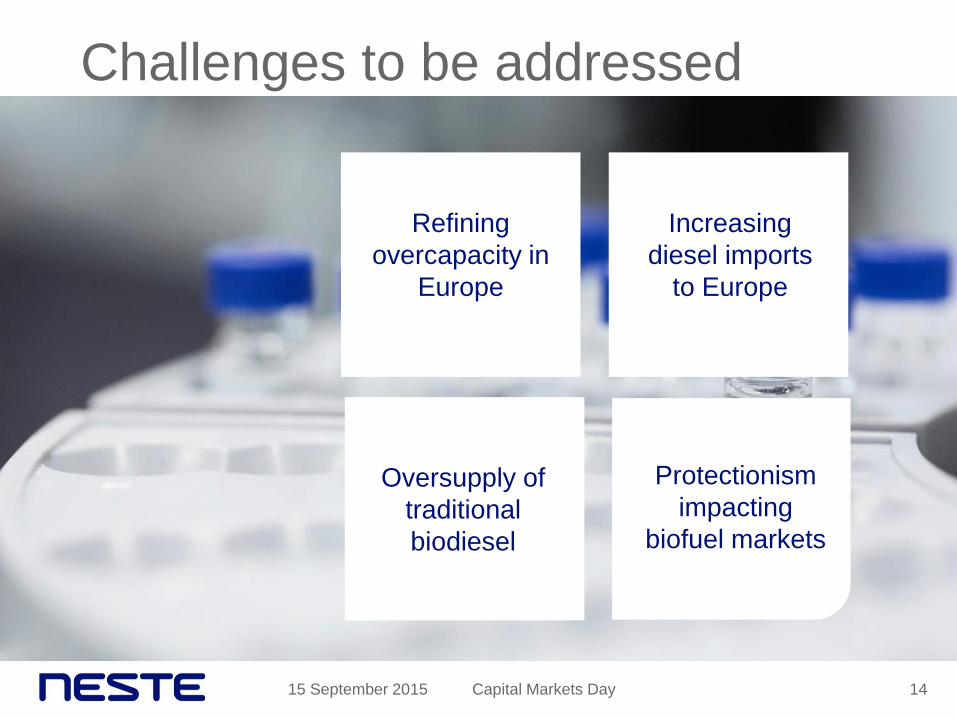
Challenges to be addressed
Increasing
diesel imports
to Europe
Oversupply of
traditional
biodiesel
Refining
overcapacity in
Europe
Protectionism
impacting
biofuel markets

Competitive advantages underpin
our success in changing markets
15 September 2015 Capital Markets Day 15
• Complex capacity and high
conversion
• Logistical advantage
• Ability to offer renewable fuel
solutions to meet regulatory
and market requirements
• Feedstock optimization ability
• Technology know-how
• Supply chain and
sustainability excellence
• Commercial excellence
• Optimization across the
value chain
• Product creation and go-to-
market capabilities
Current advantages New advantages required

Moving forward with strategic objectives
15 September 2015 Capital Markets Day 16
• Competitive advantage from
integrated value chain
• Refinery long-term
competitiveness
• Operational performance
step change
• Focus on existing core
markets within traffic fuels
• Leverage NEXBTL platform
for growth in new markets
and applications
Baltic Sea
champion
Global renewable
growth

15 September 2015 Capital Markets Day 17
Current Neste 2020
Refinery
configuration
and efficiency
Strategy implementation creating
value growth
Feedstock
flexibility
Customers
and new
businesses

Consistent cash allocation strategy
Optimizing
leverage
Paying out
favorable
dividends
Investing in
productivity and
opportunities for
growth
15 September 2015 Capital Markets Day 18

15 September 2015 Capital Markets Day 19
Short-term outlook
• Reference refining margin has
continued strong and current
forward prices indicate
reasonably high margin levels for
Q4 as well.
• Renewable Products’ reference
margin has improved as result of
healthier European market.
• Porvoo refinery back at high
utilization after major turnaround.
• Renewable diesel refineries
running at high production rates.
• Neste is adjusting the way it
gives guidance to be in line with
industry practice.
• Neste will continue to provide
information on short-term market
outlook and its own operational
performance.
• Neste will discontinue providing
numerical result guidance from
the beginning of 2016.

Strategic objectives creating growth
and shareholder value
Baltic Sea
champion
Global
renewable
growth
20 15 September 2015 Capital Markets Day

Baltic Sea champion Matti Lehmus, EVP, Oil Products
Antti Tiitola, EVP, Oil Retail

Baltic Sea champion - Our ambition
22 Capital Markets Day
Value growth by
stepping up operational
performance and
refinery asset
productivity
Customers’ preferred
choice with unique
offering of fossil and
renewable solutions
15 September 2015
Leading provider of low carbon solutions
in the Baltic Sea markets

Baltic Sea champion
Oil Products - Rising ambition for asset
productivity and customer value growth

Delivering on targets
Asset development
implementation
• Major turnaround in
Porvoo completed as
planned in Q2/2015
• One refinery operating
model implemented
• Production costs
decreased to level of
3.5 USD/bbl
Performance
improvement focusing on
costs and availability
Baltic Sea market
position
• Isomerization investment
completed mid-2015
• Outsourcing of
electricity grid completed
• Decisions made on
strategic investments to
increase refinery
competitiveness
• Baltic Sea sales volumes
slightly decreased
• New products and
services launched e.g.
low-sulphur marine fuels
• Cross-business
cooperation increased
15 September 2015 Capital Markets Day 24

Solid profitability in various market
conditions
25
0
100
200
300
400
2011 2012 2013 2014 H1/2015
Comparable EBIT, MEUR
0
5
10
15
20
2011 2012 2013 2014 H1/2015
Comparable RONA*, %
*rolling 12 months
15 September 2015 Capital Markets Day

15 September 2015 Capital Markets Day 26
Several market trends supporting
our refining business in 2015
EUR/USD
exchange rate
Strong oil
product
demand growth
Lower crude oil
price level

40
50
60
70
80
90
100
110
120
Jan-13 Jul-13 Jan-14 Jul-14 Jan-15 Jul-15
Lower crude oil price supporting refining
margins through reduced cost
27
Brent crude oil price, USD/bbl
15 September 2015 Capital Markets Day
Impact of 50 USD/bbl decrease in crude oil price to
refining margin of a complex NWE refiner
Reduction of freights, in particular for
export refiners
Reduction of production utility costs,
in particular for complex refiners with
high energy and hydrogen consumption
Impact on refining margin
0.6-0.8 USD/bbl
2. Freight costs 0.1-0.2 USD/bbl
1. Utility costs 0.5-0.6 USD/bbl

Lower crude oil price has driven
greater product demand growth Total product demand growth by region* Gasoline vs. diesel demand growth
(year-on-year)
0.0% 0.5% 1.0% 1.5% 2.0%
Gasoline
Diesel
07/2014-12/2015*
01/2011-06/2014
15 September 2015 Capital Markets Day
* Forecast for 2015-2016
Source: Pira, WoodMackenzie
0.4%
2.8%
1.8%
-1.9%
2.1%
0.8%
5.1% 4.9%
3.0%
1.0%
2.0%
-4%
-2%
0%
2%
4%
6%
2014vs2013 2015vs2014 2016vs2015
USA Western Europe China Global
28

Increased demand outlook improves
refined product balance
15 September 2015 Capital Markets Day 29
-1000
-500
0
500
1000
1500
2000
2014 2015 2016 2017
CDU additions Announced refinery closures
Net capacity additions Demand Growth
Global refining capacity and demand growth, kbpd
Source: International Energy Agency (IEA)

Neste reference margin has been very
strong in 2015
30
0
2
4
6
8
10
2011 2012 2013 2014 2015
Neste reference margin
Reference margin averages
2011 USD 4.4/bbl
2012 USD 7.4/bbl
2013 USD 4.8/bbl
2014 USD 4.7/bbl
H1/2015 USD 8.1/bbl
Neste reference margin, USD/bbl
15 September 2015 Capital Markets Day

Focus on strengthening additional
margin
15 September 2015 31 Capital Markets Day
0
5
10
15
2012 2013 2014 2015
Neste reference margin Additional margin
Neste total refining margin, USD/bbl Additional margin
averages
2012 USD 2.7/bbl
2013 USD 4.8/bbl
2014 USD 5.1/bbl
H1/2015 USD 3.2/bbl*
* Impacted by the Porvoo major turnaround
in Q2/2015 and lower crude price level
compared to 2014
Crude oil price level impact on additional margin:
+/- USD 50 /bbl change
impacts additional margin by +/- USD 1/bbl

Unchanged target of higher than
5 USD/bbl additional margin
15 September 2015 Capital Markets Day
Focus on production
costs, availability and
safety performance
Focus on managing
baseload capex and
high-return productivity
investments
Focus on solutions to
our customers in the
Baltic Sea area
Operational
performance
improvement
Asset
development
Market position
development
32

85%
90%
95%
100%
2011 2012 2013 2014 Q1/2015
Availability improvement to support
additional margin growth
Capital Markets Day 33
Oil Products’ operational availability* 2011-15, %
15 September 2015
0
2
4
6
8
2012 2013 2014 H1/2015
Oil Products’ Process Safety Event Rate (PSER)
(*excluding annualized major turnaround impacts)
• PSER level reduced to < 3.5 after 2012
• Systematic implementation of improved
process risk management procedure to
drive decrease in process safety event
rate
1% unit increase in availability corresponds
to approx. 15 MEUR profit impact
• Average 94% during 2012-14
• Preventive maintenance program
launched to improve refinery availability
• Continued baseload maintenance
investments to maintain infrastructure

EUR 0.1/bbl change in production
cost corresponds to 10 MEUR/a
EBIT impact
Focusing on production costs
– good level achieved in early 2015 Production costs
Porvoo and Naantali refineries, USD/bbl
4.3 4.4 4.8
5.0
3.5
0
2
4
6
2011 2012 2013 2014 Q1/2015
Capital Markets Day 34 15 September 2015
• Utility costs impacted by
lower energy costs
• Systematic energy efficiency
improvement
• Higher availability supporting
maintenance cost control

Asset development program addresses
market trends and drives additional margin
Naantali
configuration change
(mid-2017)
CAPEX 60 MEUR
Expected payback < 5 years
Porvoo residue cracker
feed pre-treatment (SDA)
(mid-2017)
CAPEX 200 MEUR
Expected payback < 4 years
15 September 2015 Capital Markets Day 35
Increasing crude oil flexibility
and fuel oil conversion to
diesel
Decreasing production
costs and maintenance
capex level
Converting naphtha and
other streams to high
quality gasoline
components
Porvoo
isomerization
(mid-2015)
CAPEX 80 MEUR
Expected payback < 3 years

One Refinery concept integrates Porvoo and
Naantali refineries to drive competitiveness
36 Capital Markets Day
Naantali
+400 kton/a VGO
+500 kton/a other components
Naantali configuration change
• Closing of some process units
• Increasing feedstock transfers to
Porvoo
• Lower operating costs
Porvoo
SDA
Production Line 4
Reduction of VGO import
need by 350 kton/a
Middle distillate output up
100 kton/a
HFO output down 300
kton/a
SDA investment at Porvoo
(Pretreatment unit for PL4)
• Higher conversion ratio and
longer turnaround cycle in PL4
• Reduced need of VGO imports
• Reduced heavy fuel oil output
• Increased crude flexibility
15 September 2015

65% 72%
27% 25%
8% 3%
0%
20%
40%
60%
80%
100%
Before After
VGO
Others
Urals
Asset development program enables a step
change in feedstock flexibility and conversion
15 September 2015 37
Capital Markets Day
8% 6%
50% 52%
31% 31%
11% 11%
0%
20%
40%
60%
80%
100%
Before After
Others
Gasoline
Middledistillates
Fuel oil
Feedstock and product balance in a typical market before and after announced investments
Feed, % Product yield, %

Asset development program also focuses
on optimization of capital employed
Outsourcing of
shipping
15 September 2015 Capital Markets Day 38
Outsourcing of selected
utility infrastructure
• Porvoo electricity grid sold to
InfraVia in Q1/2015
• Outsourcing of 100 MEUR
hydrogen unit investment - over-
the fence agreement with Aga-
Linde in Q2/2014
Outsourcing of power
plant
modernization to JV
• Project targeted to
be implemented as
JV with Borealis and
Veolia with expected
investment >300
MEUR
• Outsourcing of
strategic shipping
fleet mid-2014
• Ship divestment
program
completed mid-
2015
Capex priorization process implemented
Outsourcing or
divesting non-
core assets
Rigorous
management of
maintenance
capex
Targeting to reduce baseload maintenance capex by 5%
over the maintenance cycle
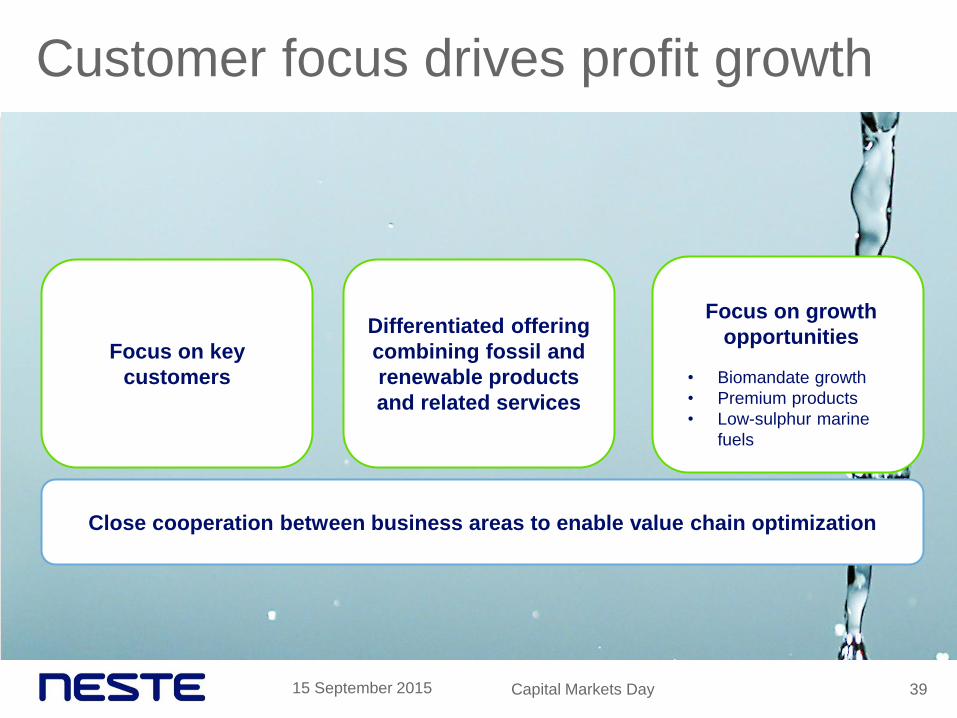
Customer focus drives profit growth
15 September 2015 39 Capital Markets Day
Focus on key
customers
Differentiated offering
combining fossil and
renewable products
and related services
Focus on growth
opportunities
• Biomandate growth
• Premium products
• Low-sulphur marine
fuels
Close cooperation between business areas to enable value chain optimization

Baltic Sea champion
Oil Retail – Becoming the customers’
preferred choice

Baltic Sea champion - Our ambition
41
Value growth by
stepping up operational
performance and
refinery asset
productivity
Customers’ preferred
choice with unique
offering of fossil and
renewable solutions
Leading provider of low carbon solutions
in the Baltic Sea markets
Capital Markets Day 15 September 2015

• Very good
progress in
captive sales in
the Baltics
• New bunker
business opened
successfully from
the beginning of
2015
• Network
investment
continuing; several
new stations
opened in 2015
• Pipeline created to
manage strategic
network portfolio
Delivering on targets
42
Superior
sales and
marketing
Fast and
convenient
customer
experience
Stronger
network Maximizing
captivity
• New organizational
structure from April
to serve customers
better in all markets
• New customer
acquisition model in
use since February
2015; 1000 new
SME customers
• Logistics renewal
resulted in
significant cost
savings from
mid-2015
• Backcourt
development
project started in
Finland, roll-out
in 2016-17
15 September 2015 Capital Markets Day

High returns on light assets
43
0
20
40
60
80
2011 2012 2013 2014 H1/2015
Comparable EBIT, MEUR
0
10
20
30
40
2011 2012 2013 2014 H1/2015
Comparable RONA*, %
*rolling 12 months
15 September 2015 Capital Markets Day

44
Diesel-driven market growth
15 September 2015 Capital Markets Day
Finland
• Overall road transpor-
tation remains flat
• Longer term growth in
diesel
• Tight pricing continues
in both B2B and B2C
Russia
• Current sluggish
economy effects
demand
• Volatile ruble
Baltics
• Good GDP growth has
positive impact on
demand
• Upward trend in diesel
• Changes in competitor
structure

45
Focusing on strategy implementation
Continuous
network
development,
active sales,
and targeted
marketing
Differentiation
through
premium
product
development
Strong offering
with renewed
backcourt
concept
Taking full
advantage of
bunker market
potential
Growing captive
volumes and
optimized group
value creation
Leading brand
position in
Northwest
Russia
15 September 2015 Capital Markets Day

Well on track with Baltic Sea
champion strategy
15 September 2015 Capital Markets Day
Performance
improvement
and asset
development
Baltic Sea
market position
development
Maximizing
value chain
potential
46

Global renewable
growth Kaisa Hietala, EVP, Renewable Products
Tuomas Hyyryläinen, SVP, Strategy and New Ventures

Global renewable growth - Our ambition
48 Capital Markets Day
Maintain global leadership
in renewable diesel
market
Develop significant
business from non-traffic
fuel markets by end of the
decade
15 September 2015
Growth in global renewable feedstock-
based markets

Competitive advantage through
unique value chain
49 Capital Markets Day
Global supply
chain
Drop-in
solutions for
customers
Flexible
feedstock
supply
15 September 2015
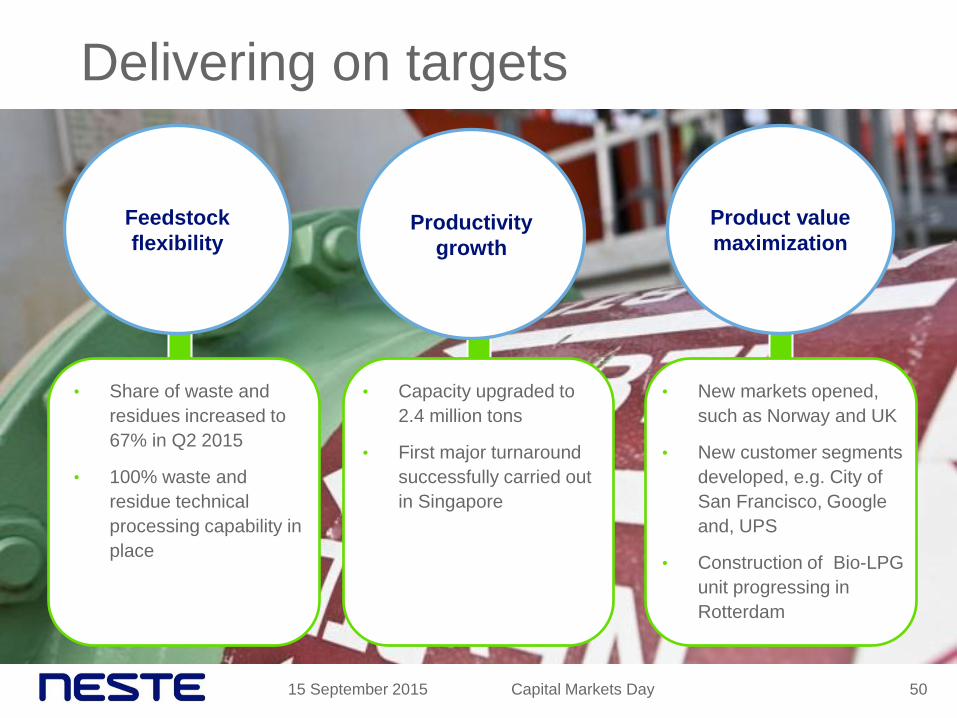
Delivering on targets
15 September 2015 50 Capital Markets Day
• Share of waste and
residues increased to
67% in Q2 2015
• 100% waste and
residue technical
processing capability in
place
Feedstock
flexibility Productivity
growth
• Capacity upgraded to
2.4 million tons
• First major turnaround
successfully carried out
in Singapore
Product value
maximization
• New markets opened,
such as Norway and UK
• New customer segments
developed, e.g. City of
San Francisco, Google
and, UPS
• Construction of Bio-LPG
unit progressing in
Rotterdam

Solid business profitability
-200
0
200
400
2011 2012 2013 2014 H1/ 2015
Comparable RONA*, % Comparable EBIT, MEUR
-10
-5
0
5
10
15
20
2011 2012 2013 2014 H1/2015
Capital Markets Day 51 15 September 2015
* rolling 12 months

Protectionism
impacting free
trade of biofuels
15 September 2015 Capital Markets Day 52
Positive progress in biofuel markets
Overcapacity in
first generation
biodiesel
remains
100% pure
HVO gaining
more approvals
and winning
markets
Feedstock price
volatility
continues
Positive
regulatory
developments
in key markets
GHG criteria
widely
introduced for
new segments
like municipality
fleets
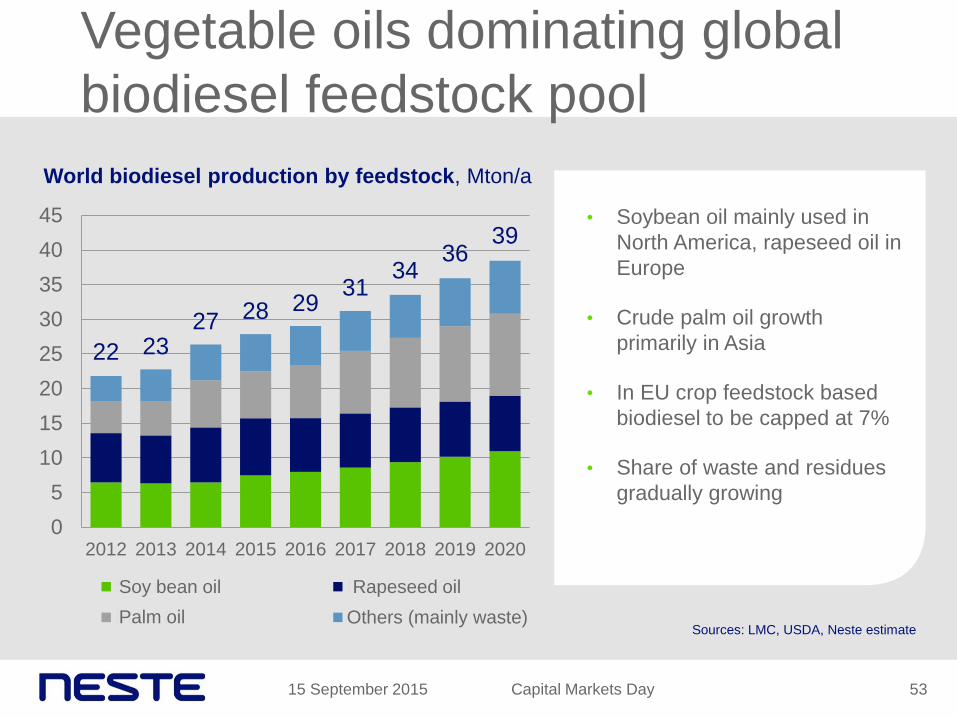
Vegetable oils dominating global
biodiesel feedstock pool
World biodiesel production by feedstock, Mton/a
Capital Markets Day 53
• Soybean oil mainly used in
North America, rapeseed oil in
Europe
• Crude palm oil growth
primarily in Asia
• In EU crop feedstock based
biodiesel to be capped at 7%
• Share of waste and residues
gradually growing
15 September 2015
22 23 27 28 29
31 34
36 39
0
5
10
15
20
25
30
35
40
45
2012 2013 2014 2015 2016 2017 2018 2019 2020
Soyoil Rapeseed Oil
Palm Oil Others (mainly waste)
Soy bean oil
Palm oil
Rapeseed oil
Sources: LMC, USDA, Neste estimate

Feedstock price volatility continues
Capital Markets Day 54
* Including $70/ton freight
• Vegetable oil prices often
move as one complex
• Food demand and
oleochemical use driving
longer term price trends
• Regional weather patterns
and crop outlooks cause
global price volatility
• Oil price development sets
limits for palm oil and
animal fat use for energy
15 September 2015
400
600
800
1,000
1,200
1,400
Jan-13 Jul-13 Jan-14 Jul-14 Jan-15 Jul-15
Soybean Rapeseed Palm oil Animal fat
Vegetable oil and animal fat prices*, USD/ton

Waste and residues availability
supports Neste’s feedstock strategy
Global feedstock availability, Mton/a
Capital Markets Day 55
• Currently waste and residue
volumes suitable for Neste
approx. 20 million tons
• Increasing availability further
by expanding processing
capability towards lower
quality waste and residue
• Latest additions to Neste’s
waste and residue pool are
used cooking oils, low-quality
animal fats, and sludge oils
15 September 2015
0
10
20
30
40
50
60
Wastes &residues
Rapeseedoil
Soybeanoil
Palm oil
Sources: IMCD, Oil World, Ecofys, Neste estimates

Global biodiesel demand and
supply in balance
0
10
20
30
Europe NorthAmerica
SouthAmerica
Asia andOceania
Supply
Demand
Biodiesel demand, supply, and capacity 2015,
million tons
56 15 September 2015 Capital Markets Day
Sources: Licht, EIA, Eurostat, Kingsman
• EU biodiesel production
capacity 26 Mton/a; utilization
rate 45-50% in 2015
• US biodiesel production
capacity 7 Mton/a; utilization
rate approx. 70% in 2015
• Biodiesel utilization rates
trending up as demand
increases
• Consolidation and closures
over the past years have
reduced real capacity
Capacity

Reference margins have room for
improvement FAME vs. Palm oil price differential, USD/ton
Capital Markets Day 57
0
100
200
300
400
500
2013 2014 2015
15 September 2015
SME vs. Soybean oil price differential, USD/ton
0
200
400
600
800
2013 2014 2015
• Feedstock price volatility and
feedstock availability impact
margins
• Difference between summer and
winter biodiesel grades creates
seasonal volatility in Europe
• Integrated animal feed producers
and independent biodiesel
producers have different
economics
• US Blender’s Tax Credit (BTC) is
an additional margin element
(on-off)

Positive development in regulation
58 Capital Markets Day
EUROPE
Regulation up to 2020
• 10% overall target firmly in
place
• Final ILUC directive agreed in
April 2015 – 7% cap for crop-
based biofuels
Longer term outlook
• EU committed to 40% GHG
reduction and renewable
energy target of 27% by 2030
US
Regulation up to 2017
• EPA’s proposal for biomass-based
diesel 1.6 Bgal in 2014 with 0.1
Bgal annual growth until 2017
• Reintroduction of BTC uncertain
Longer term outlook
• RFS targets firmly in place until
2022
• State policies and incentives,
especially in California, expected
to have more significance
15 September 2015

Emerging local competition provides
further support for biofuels
59 Capital Markets Day
Emerging HVO competitors
ENI
• Conversion of Venice
refinery to HVO
production plant
completed in 2014
• Planned conversion of
Gela refinery to HVO
production plant
TOTAL
• Conversion of La
Mede refinery to HVO
production by 2017
• Conversion of Dunkirk
refinery by 2017 (not
HVO)
PREEM
• Plan to double biofuel
production in 2015
UPM
• Commercial
production of HVO
from tall oil in Finland
since Q1/2015
Total potential capacity approx. 2 Mton/a
15 September 2015

Leveraging global platform for
strong additional margin
0
200
400
600
800
Q1/14 Q2/14 Q3/14 Q4/14 Q1/15 Q2/15
Additional margin
Reference margin
Renewable Products margins, USD/ ton
Capital Markets Day 60 15 September 2015

Driving additional margin increase
Capital Markets Day 61 15 September 2015
Feedstock
flexibility Productivity
growth
Product value
maximization
Increase production
capacity to 2.6 million
tons by 2017
Expand feedstock mix
to even lower grades of
waste and residues e.g.
animal fats
Further expand to new
customer segments e.g.
fleets, municipalities,
and aviation

Most potential long-term
opportunities in traffic fuels
62 Capital Markets Day
Heavy traffic Aviation Military use
• Diesel not easily replaced
with electric vehicles,
particularly in long haul
fleets
• Standardization of paraffinic
fuels will increase potential
for 100% and other high
blends
• Aviation expected to grow
significantly and the
industry is committed to
GHG reduction targets
• Biodiesel not feasible in
aviation
• Global jet fuel market 260
Mton/a in 2014
• Requirement for long shelf-
life beneficial for HVO
relative to biodiesel
• Strong security of supply
argument
• E.g. US has ambitious
targets for bio in military use
15 September 2015

Capital Markets Day 63
New high value adding go-to-market
models
15 September 2015
Retailers and distributors
• 100% HVO diesel available
under customers’ own brands in
selected European markets, such
as Austria and Sweden, as well as
in California
• NEXBTL offers significant GHG
reduction opportunities for fleets
and municipalities
• UPS, Google, and City of San
Francisco have chosen
renewable diesel
Fleets and municipalities

64 Capital Markets Day
Maintain global leadership
in renewable diesel
market
Develop significant
business from non-traffic
fuel markets by end of the
decade
15 September 2015
Growth in global renewable feedstock-
based markets
Global renewable growth - Our ambition

Growth
outside traffic fuels Tuomas Hyyryläinen,
SVP, Strategy and New Ventures

Ambition to grow in bio-based
chemicals, distillates, and plastics
15 September 2015 66
NEXBTL
renewable
diesel
NEXBTL
renewable
aviation fuel
NEXBTL
renewable
propane
NEXBTL
for bio-based
chemicals
Capital Markets Day

15 September 2015
Idea of ’drop-in’ turned into another
sound business opportunity
67
9 billion
USD
Bio-solvents market is expected to
reach USD 9 billion and over
3 million tons by 2020.
Capital Markets Day

Addressing the biggest value-adding
applications with distinct advantages
15 September 2015 68
Lubes Paints and
coatings Pharma Adhesives Printing
inks
Capital Markets Day

15 September 2015
Two major partnerships announced in
bio-based solvents and technical fluids
Capital Markets Day
Neste and Total Fluides to
cooperate on bio-based
solvents and technical
fluids
Neste and HCS Group to
form an extensive
partnership for renewable
distillates
69

15 September 2015
Significant business potential in
bioplastics when done right
70
10
billion
USD
Market size of selected biopolymer
application areas by 2018
Capital Markets Day

Solution to make biopolymer that is
identical to fossil polymers
15 September 2015 Capital Markets Day 71

Plastic has become a symbol of waste.
When people talk about
plastic they talk about a
cheap, throwaway culture
of waste.
Capital Markets Day 15 September 2015 72

Major actions are necessary to make our
resources last in the future
Capital Markets Day 15 September 2015 73

Our solution is easy to integrate into existing operations.
What we offer would
not require changes
to the existing
equipment or add
complexity to
process.
15 September 2015 Capital Markets Day 74

Global warming potential of
polymers can be clearly reduced
15 September 2015 75
-3
-2
-1
0
1
2
3
4
PE fossil PE NEXBTL PP fossil PP NEXBTL ABS fossil ABSNEXBTL
*Calculated based on average data
Global warming potential (GWP) 100 for selected polymers,
kgCO2e/kg
Variation between
feedstocks
Variation
between sources
Capital Markets Day

15 September 2015
New business model for Neste
Enhanced
continuity
through
cooperation
with
customers
Entering
non-regulated
markets
Capital Markets Day
Partnerships
with leading
brand owners
Create
optionality for
NEXBTL
volumes for
future growth
76

15 September 2015 77
Making new applications a significant
part of our renewables business
Capital Markets Day
20% by 2020

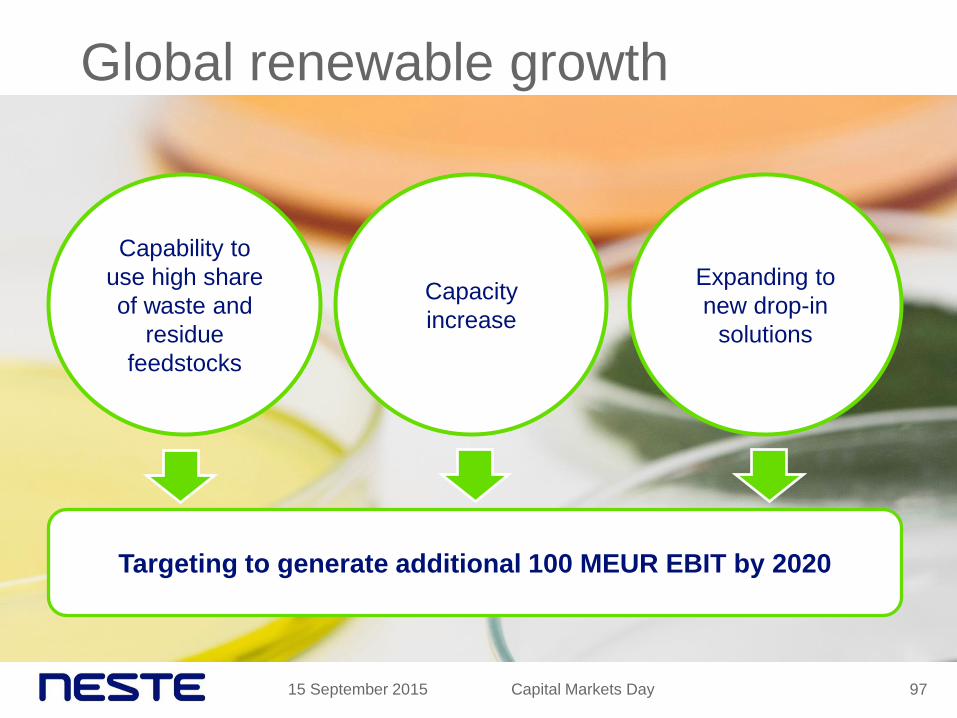
Global renewable growth
Capital Markets Day 78 15 September 2015
Targeting to generate additional 100 MEUR EBIT by 2020
Capability to
use high share
of waste and
residue
feedstocks
Capacity
increase
Expanding to
new drop-in
solutions

Healthy
financials
supporting growth
ambition Jyrki Mäki-Kala, CFO

Visible improvement in financial
performance
156
740
0
200
400
600
800
2011 H1/2015*
Capital Markets Day 80
Comparable EBIT, MEUR
2.6%
12.5%
0%
5%
10%
15%
2011 H1/2015*
ROACE, %
0.35
0.65
0.00
0.20
0.40
0.60
0.80
1.00
2011 2014
Dividend per share, EUR
589 542
0
200
400
600
2011 2014
Net working capital, MEUR
4.1
1.7
0
1
2
3
4
2011 H1/2015*
Net debt/ Comparable EBITDA
* rolling 12 months
15 September 2015

45.7% 43.2%
30.0%
37.9% 40.3%
0%
10%
20%
30%
40%
50%
2011 2012 2013 2014 H1/ 2015
2.6%
5.0%
11.8%
10.1%
12.5%
0%
5%
10%
15%
2011 2012 2013 2014 H1/2015*
ROACE, %
81
Quantum leap in ROACE
15 September 2015
Target 15%
* rolling 12 months
Target range 25-50%
Leverage, %
Capital Markets Day

2011 Profitability improvement Capital employed H1 2015*
Profitability improvement shown
clearly in ROACE change
15 September 2015 82
2.6%
12.5%
Change in ROACE between 2011 – H1 2015
* rolling 12 months
Capital Markets Day

On track to reach 15% ROACE target
83
Progress in last 12 months
15 September 2015
Areas of improvement
• Growth in all businesses
• Performance improvement in all
areas
• Continuous working capital
management
• Focused capital expenditures
• Fixed asset management
• Capacity creep in Renewable Products,
isomerization and long-term asset
development in Oil Products
• Lower fixed costs, ERP decision
• Higher additional margins
• Stable net working capital and inventory
management
• One Refinery Concept introduced
• Porvoo major turnaround 2015
• Asset restructuring; outsourcing of
shipping, Porvoo electricity grid, power
plant, and new hydrogen unit
Capital Markets Day

Key topics on CFO’s agenda
84
Strong
balance sheet
Focused
performance
management
Solid free cash
flow
15 September 2015
• Capex with good
returns
• Fixed costs
management
• Process
development (ERP)
• Net working capital
management
• Capex
management
• Asset restructuring
• P&L and capital
employed
management
• Tax management
• Optimal debt
structure
Capital Markets Day

Strong EBITDA providing basis for good
cash flow
85
Comparable EBITDA and EBIT, MEUR
0
200
400
600
800
1,000
1,200
2011 2012 2013 2014 H1/2015*
ComparableEBIT
ComparableEBITDA
* rolling 12 months as of 30 June 2015
15 September 2015 Capital Markets Day

+ USD 50/ton
Sensitivity impact on EBIT
15 September 2015 86
80 85 90 95 100
Annual change in IFRS EBIT*,
MEUR
*EUR/USD exchange rate 1.10
Neste refining margin
Renewable Products’
refining margin
EUR/USD rate change
+ 1 USD/bbl
- 10%
Crude oil price - USD 10/bbl
- 100 MUSD in IFRS EBIT through
inventory valuation losses
+ 30 MUSD in IFRS EBIT due to lower
costs of utilities and freights
+ 50 MUSD decrease in net working
capital
- 20 MUSD decrease in free cash flow
Capital Markets Day

0
100
200
300
400
500
2011 2012 2013 2014 2015 2016
Near-term investments focusing on
growth and productivity
87
Capex, MEUR
Maintenance
Growth and productivity
Porvoo turnaround
Estimate
15 September 2015 Capital Markets Day

Cash 1 Jan2015
IFRSEBITDAH1/2015
NWCchange
and others
Interestsand taxes
CAPEXand
turnaround2015
Sales ofassets
Dividend New debt Cash 30June 2015
Expecting stronger cash flow for
second half of 2015
88 15 September 2015
397
397
MEUR
+ Cash flow improvement
in H2/2015
246
+
+
Capital Markets Day

Net working capital to decrease by
unwinding contango storages
15 September 2015 89
-1500
-1000
-500
0
500
1000
1500
2011 2012 2013 2014 June2015
Net working capital items,
MEUR
Receivables
Inventories
Payables
0
5
10
15
20
25
0
200
400
600
800
1000
2011 2012 2013 2014 June2015*
NWC, end of period NWC days
Net working capital,
MEUR and days outstanding
* rolling 12 months as of 30 June 2015
Capital Markets Day

Good liquidity position
15 September 2015 90
0
100
200
300
400
500
600
700
2015 2016 2017 2018 2019 2020 2021+
Maturity profile, MEUR
*as of 30 June 2015
Liquidity
• Total liquidity 2,447 MEUR*
• Cash 397 MEUR
• Unused possibilities facilities
2,050 MEUR
• Current interest rate 3.4%*
• No financial covenants in
Group’s existing loan
agreements
• We continue to actively follow
capital market opportunities
including possible 2016 and/or
2017 bond buy-back
Capital Markets Day

About 50% of free float owned by
non-Finnish shareholders
15 September 2015 91
10
15
20
25
30
Jan11 Jan12 Jan13 Jan14 Jan15
Share of non-Finnish owners, %
50.1 %
26.6 %
12.3 %
11.0 % State of Finland
Non-Finnishshareholders
Finnishinstitutions
Finnishhouseholds
Ownership structure as of June 30, 2015
Capital Markets Day

Pay out from comparable net profit, % Dividends paid, MEUR
105%
54%
34% 41%
0%
50%
100%
150%
2011 2012 2013 2014
92
90 97
167 166
0
50
100
150
200
2011 2012 2013 2014
€0.35
per
share
€0.38
per
share
Dividend policy maintained -
at least 1/3 of comparable net profit
€0.65
per
share
15 September 2015
€0.65
per
share
Capital Markets Day

93 15 September 2015
Favorable
dividend
distribution
Capital Markets Day
Growth
Healthy financials as an enabler

Concluding
remarks
Matti Lievonen, President & CEO

Strategic objectives creating growth
and shareholder value
Baltic Sea
champion
Global
renewable
growth
95 15 September 2015 Capital Markets Day

Well on track with Baltic Sea
champion strategy
15 September 2015 Capital Markets Day
Performance
improvement
and asset
development
Baltic Sea
market position
development
Maximizing
value chain
potential
96
Global renewable growth
Capital Markets Day 97 15 September 2015
Targeting to generate additional 100 MEUR EBIT by 2020
Capability to
use high share
of waste and
residue
feedstocks
Capacity
increase
Expanding to
new drop-in
solutions

98 15 September 2015
Favorable
dividend
distribution
Capital Markets Day
Growth
Healthy financials as an enabler

15 September 2015 Capital Markets Day 99
Our vision
Creating responsible choices every day

Abbreviations
15 September 2015 Capital Markets Day 100
ABS Acrylonitrile butadiene styrene
B2B Business to business
B2C Business to consumers
BBL Barrel
BTC Blender's Tax Credit in the US
CAPEX Capital expenditure
CDU Crude distillation unit
EPA US Environmental Protection Agency
ERP Enterprise Resource Planning
FAME Fatty Acid Methyl Ester, biodiesel
GDP Gross domestic product
GHG Greenhouse gas
GWP Global warming potential
HVO Hydrotreated vegetable oil
ILUC Indirect Land-Use Change
JV Joint venture
KBPD Thousand barrels per day
KTPA Thousand tons per year
LPG Liquefied petroleum gas
NWC Net working capital
NWE Northwest Europe
PE Polyethylene
PP Polypropylene
PSER Process Safety Event Rate (per million hours worked)
RFS Renewable Fuel Standard in the US
ROACE Return on average capital employed after tax
RONA Return on net assets
SDA Solvent deasphalting unit
SME Small and medium-sized enterprises
SME Soybean Methyl Ester, biodiesel
VGO Vacuum gasoil