Embed Size (px)
Citation preview
Biology of Human Tumors
Neoadjuvant Chemotherapy Modulates theImmune Microenvironment in Metastases ofTubo-Ovarian High-Grade Serous CarcinomaSteffen B€ohm1,2, Anne Montfort1, Oliver M.T. Pearce1, Joanne Topping1,Probir Chakravarty3, Gemma L.A. Everitt1, Andrew Clear1, Jackie R. McDermott1,4,Darren Ennis1,5, Thomas Dowe1, Amanda Fitzpatrick2, Elly C. Brockbank6,Alexandra C. Lawrence6, Arjun Jeyarajah6, Asma Z. Faruqi4, Iain A. McNeish1,5,Naveena Singh4, Michelle Lockley1,2, and Frances R. Balkwill1
Abstract
Purpose: The purpose of this study was to assess the effect ofneoadjuvant chemotherapy (NACT) on immune activation instage IIIC/IV tubo-ovarian high-grade serous carcinoma (HGSC),and its relationship to treatment response.
Experimental Design: We obtained pre- and posttreatmentomental biopsies and blood samples from a total of 54 patientsundergoing platinum-based NACT and 6 patients undergoingprimary debulking surgery. We measured T-cell density andphenotype, immune activation, and markers of cancer-relatedinflammation using IHC, flow cytometry, electrochemilumines-cence assays, and RNA sequencing and related our findings to thehistopathologic treatment response.
Results: There was evidence of T-cell activation in omentalbiopsies after NACT: CD4þ T cells showed enhanced IFNgproduction and antitumor Th1 gene signatures were increased.T-cell activation was more pronounced with good response to
NACT. The CD8þ T-cell and CD45ROþ memory cell density inthe tumor microenvironment was unchanged after NACT butbiopsies showing a good therapeutic response had significantlyfewer FoxP3þ T regulatory (Treg) cells. This finding was sup-ported by a reduction in a Treg cell gene signature in post-versus pre-NACT samples that was more pronounced in goodresponders. Plasma levels of proinflammatory cytokinesdecreased in all patients after NACT. However, a high propor-tion of T cells in biopsies expressed immune checkpoint mole-cules PD-1 and CTLA4, and PD-L1 levels were significantlyincreased after NACT.
Conclusions: NACT may enhance host immune responsebut this effect is tempered by high/increased levels of PD-1,CTLA4, and PD-L1. Sequential chemoimmunotherapy mayimprove disease control in advanced HGSC. Clin Cancer Res;22(12); 3025–36. �2016 AACR.
IntroductionThe aim of this study was to determine the influence of
neoadjuvant chemotherapy (NACT) on the immune microenvi-ronment in peritoneal metastases of high-grade serous ovariancancer (HGSC). Early peritoneal and pleural spread is a featureof HGSC with a majority of patients presenting with FIGO stageIIIC and stage IV disease (1).
Platinum-based chemotherapy is the only backbone medicalfirst-line treatment approved for HGSC in the past 30 years andalthough most patients respond initially, resistance eventuallydevelops in a majority of them. Peritoneal metastases are fre-quently the site of relapse and eventually lead to bowel obstruc-tion that contributes to death in many patients (2, 3).
In patients with stage IIIC or IV disease who are not suitablefor primary debulking surgery (PDS), three cycles of platinum-based NACT followed by interval debulking surgery (IDS) andadjuvant chemotherapy is an accepted alternative approach.This is equally effective while potentially associated with lowermorbidity (4, 5) although there is a need for internationalconsensus criteria for patient selection in this approach.
There is good evidence that HGSC has the potential to be animmunogenic tumor, and activated T cells have been character-ized in the tumormicroenvironment and ascitic fluid (6, 7). Thereis an association between increased tumor-infiltrating leukocyte(TIL) density and longer survival (8, 9) and TIL subpopulationsrecognize shared tumor antigens, gene products from somaticmutations, as well as amplified or aberrant genes (10, 11).Mutation frequency also correlated with an immune cell cytolyticactivity transcriptional signature in ovarian cancer databases (12).However, TILs in HGSC biopsies are often suppressed or func-tionally exhausted, and immunotherapies, until recently, have
1Barts Cancer Institute, Queen Mary University of London, London,United Kingdom. 2Medical Oncology, Barts Health NHS Trust, London,United Kingdom. 3Bioinformatics Core, The Francis Crick Institute,London, United Kingdom. 4Department of Pathology, Barts HealthNHSTrust, London, UnitedKingdom. 5WolfsonWohl Cancer ResearchCentre, Institute of Cancer Sciences, University of Glasgow, Glasgow,United Kingdom. 6Gynaecological Oncology, Barts Health NHS Trust,London, United Kingdom.
Note: Supplementary data for this article are available at Clinical CancerResearch Online (http://clincancerres.aacrjournals.org/).
Corresponding Author: Frances R. Balkwill, Barts Cancer Institute, Centre forCancer and Inflammation, Queen Mary University of London, CharterhouseSquare, London EC1M 6BQ, United Kingdom. Phone: 4420-7882-3851; Fax:4420-7882-3585; E-mail: [email protected]
doi: 10.1158/1078-0432.CCR-15-2657
�2016 American Association for Cancer Research.
ClinicalCancerResearch
www.aacrjournals.org 3025
on May 29, 2018. © 2016 American Association for Cancer Research. clincancerres.aacrjournals.org Downloaded from
not yet had a major impact on patients with advanced chemore-sistant disease (10, 11, 13).
Recent studies in animal cancer models have shown how theimmune system plays an important role in the response tosome cancer chemotherapies, inducing an "immunogenic" celldeath, presentation of neoantigens, and an increase in acuteinflammatory and tumor-destructive responses (14–16). Fur-thermore, recent mouse cancer experiments showed the efficacyof blocking the PD-1/PD-L1 axis following paclitaxel chemo-therapy (17). The ability to sample HGSC biopsies at diagnosisand after NACT during surgery gives us an opportunity to askwhether similar responses occur in a clinical setting and if theydo, whether this provides a rationale for introducing immu-notherapy after NACT rather than in relapsed disease. Wetherefore studied a cohort of 54 women with stage IIIC andstage IV HGSC receiving NACT, as well as 6 women whounderwent surgery before chemotherapy. Using transcriptionaland protein analyses of prospectively collected metastatic peri-toneal (omental) specimens, as well as plasma samples, weinvestigated the effects of platinum-based NACT on theimmune microenvironment in patients and compared this totheir response to chemotherapy as assessed by a recentlypublished prognostic histologic score (18).
Materials and MethodsPatients and samples
Institutional review board approval was granted for the BartsGynae Tissue Bank to collect and store biologic material andclinical information. Patients were treated at St. Bartholomew'sCancer Centre (London, UK) between 2010 and 2015 and gavewritten informed consent. Clinical parameters were collectedusing tissue repository databases and chart review.
Omental metastases and plasma samples from 54 FIGO stageIIIC and IV HGSC patients were collected prospectively beforeand after platinum-based NACT (details of patients and treat-ment are shown in Supplementary Table S1) and analyzed inimmunohistochemical, flow cytometric, and transcriptomicexperiments. Surgery was usually performed between 3 and4 weeks after the last NACT. Samples from an additional 6patients with FIGO stage IIIC and IV HGSC who underwentPDS were used in the flow cytometry and RNAseq studiesdescribed below (Supplementary Table S2). These sampleswere matched to the NACT cohort in terms of amount of tumorand stroma in the biopsy, pretreatment levels of plasma cyto-kines, age, and stage. Inflammatory cytokine levels were mea-
sured in paired pre- and post-NACT plasma samples of 23patients and 22 plasma samples were from healthy femalevolunteers (median age 47.5 years; range 32–64 years). Sup-plementary Table S3 lists the numbers of samples that wereused in each of the analyses.
The response to chemotherapy was assessed in IDS biopsiesusing a chemotherapy response score (CRS) that separates thepatients into three major subgroups (18). CRS1 samples showminimal response to chemotherapy, CRS2, "poor" responders,have easily identifiable malignant cells in the omentum afterNACT and CRS3, "good" responders, usually show extensiveregression-associated fibroinflammatory changes with absent orminimal numbers of malignant cells (18).
Formalin-fixed paraffin embedded tumor biopsiesPretreatment omental or peritoneal biopsies were obtained at
diagnostic laparoscopy or diagnostic core biopsy. Sections of4-mmthickness weremounted on glass slides. Blocks of omentumremoved at IDS after NACT, were reviewed by a pathologistaccording to the ICCR guidelines (19). Blocks representing thearea of worst response were selected and used to construct tissuemicroarrays (TMA) with a 1-mm core size and up to 6 cores perpatient sample.
Fresh tumor biopsiesOmental biopsies were collected in the operating theatre from
untreated patients undergoing PDSor diagnostic laparoscopy andfrom patients undergoing IDS after NACT and fresh-frozen sam-ples were histologically matched to FFPE specimens of the samepatient by hematoxylin and eosin review.
Blood samplesSodium heparin blood (BD Vacutainer Systems) was immedi-
ately placed on ice within one week before NACT and within 2weeks before IDS. The minimum time after the last cycle ofchemotherapy was 3 weeks. After centrifugation, plasma frompatients and controls was snap frozen and stored at �80�C.
Extraction of stroma vascular fractionFresh omental biopsies were subjected to mechanical dissec-
tion and enzymatic treatment. Briefly, the tissue was dissectedwith a scalpel, incubated in RPMI medium (Gibco) containing5% FBS, 1 mg/mL Collagenase D from clostridium histolyticum(Roche) and 25 mg/mL DNAse (Roche) at 37�C under agitationfor 40 minutes. The extract was then filtered through a 70-mmpore strainer; red blood cells were lysed (eBioscience) and thestroma vascular fraction (SVF) was frozen for later FACS anal-yses or freshly restimulated in vitro for intracellular cytokinestaining.
Flow cytometry analysesSVFs and peripheral blood mononuclear cells (PBMC) were
stained for flow cytometry analyses in PBS containing 2.5%BSA and 2 mmol/L EDTA for 30 minutes at 4�C. The followingmarkers were used: CD45 APC efluor780 (eBioscience), CD3BV650 (Biolegend), CD3 PE (eBioscience), CD4 PerCP-Cy5.5(eBioscience), CD8 APC (eBioscience), CD8 FITC (eBioscience),PD-1 BV421 (Biolegend), CTLA4 PE (Biolegend), CD69 APC(eBioscience), and CD25 PECy7 (eBioscience). Viability of thecells was assessed by staining with the fixable viability dye (FVD)
Translational Relevance
This research using samples from ovarian cancer patientsshows that three to four cycles of platinum-based chemother-apy alters the functional orientation, activation status, anddensity of certain T-cell subsets in a tumor microenvironmentand reduces systemic levels of tumor-promoting cytokines.The results suggest that the effects of immunotherapymight beenhanced if given after chemotherapy, potentially improvingdisease control in patients with advanced HGSC and othercancer types.
B€ohm et al.
Clin Cancer Res; 22(12) June 15, 2016 Clinical Cancer Research3026
on May 29, 2018. © 2016 American Association for Cancer Research. clincancerres.aacrjournals.org Downloaded from
eFluor506 (eBioscience) or DAPI (Sigma). Appropriate Fluores-cenceMinusOne (FMO) controls were used in these experiments.
Staining for Foxp3þ T regulatory (Treg) cells was performedusing the Human Treg Kit (eBioscience) containing CD45 eFluor780, CD4 FITC/CD25APC, FOXP3 PE, and the isotype control forFoxp3. Viability of the cells was assessed with FVD eFluor450(eBioscience).
To study the production of IL10 and IFNg by omental T cellsfrom pre- and posttreatment patients, 2.5 � 106 cells fromthe extracted SVF were restimulated in vitro in RPMI 10% FBS,50 ng/mL phorbol 12-myristate 13-acetate (PMA; Sigma) and1 mg/mL ionomycin (Sigma) for 5 hours at 37�C, 5% CO2. Afterthe first hour of restimulation 10 mg/mL Brefeldin A (Sigma) wasadded to the culture. After restimulation, cells were stained forCD4 PerCP-Cy5.5 (eBioscience), CD8 FITC (eBioscience), andFVD450 (eBioscience) in PBS 2.5%BSAþ 2mmol/L EDTA for 20minutes at 4�C. Cells were then washed, fixed for 20 minutes atroom temperature with the Fixation Buffer (eBioscience), per-meabilized with the Permeabilization Buffer (eBioscience), andstained with anti-human IL10 PE (eBioscience) and IFNg PECy7(eBioscience) for 20 minutes at room temperature. Correspond-ing isotype controls for IL10 and IFNg were used to generate FMOcontrols. Stained samples were analyzed using an LSRFortessa cellanalyzer (BD Biosciences) and data were analyzed with FlowJo9.4.6 (Treestar Inc.).
IHCFFPE-embedded tissue sections were dewaxed and rehydrated.
Antigen retrieval was performed using a pressure cooker and acitrate-based antigen unmasking solution (Vector Laboratories)followed by staining in an autostainer (Dako) using an ultrasen-sitive HRP Polymer Kit (Biogenex). The following antibodies wereused: CD8 cloneC8/144B (Dako), FOXP3 clone 236A/E7 (Abcam),CD45RO clone UCLH (Dako), PD-L1 clone SP142 (Spring Biosci-ence/Roche). Negative controls were isotype matched.
Immune cell quantification on digitalized slidesImmunohistochemically stained slides were scanned at 20�
with a Pannoramic Flash Scanner (3D Histech). Images of 5 areasrepresenting the entire biopsy of paired pre–post NACT sampleswere taken with an area of 0.58 mm2 per high-power field(Pannoramic software, 3D Histech).Intraepithelial cells (withintumor islets) and intrastromal cells were counted independentlyby three investigators, including one histopathologist, blinded forclinical information. Each HPF was scored as 0, 1þ, 2þ, 3þ, or 4þfor tumor (within or direct contact with the epithelial component)and stromal regions. The cut-off was based on the typical density ofthese cell populations in HGSC omentum and prior joint discus-sion of the investigators (CD8 and CD45RO: no cells, 1–10, 11–60, 61–150, >150 per HPF, respectively. FOXP3: no cells, 1–10,11–40, 41–100, >100 per HPF, respectively). The average score ofall HPFs of one slide of one investigator was added to thecorresponding scores of the other two and then divided by three.
Scoring of PD-L1 expressionPD-L1 was scored by a study pathologist using the criteria
described in ref. (20). Briefly, samples were scored for PD-L1expression on tumor-infiltrating immune cells, which includedmacrophages, dendritic cells, and lymphocytes. Specimens weregiven a score of 0–3 if <1%, 1%–<5%, 5%–<10%, and �10% ofcells were positive for PD-L1.
Plasma cytokine analysisCytokines were measured by electrochemiluminescence
multiplex assay (V-Plex, Meso Scale Discovery) on a SectorImager (Meso Scale Discovery) according to the manufacturer'sprotocol. The detection range for the assays was as follows:TNFa: 0.076–311 pg/mL; IL8: 0.133–546 pg/mL; IL6: 0.369–749 pg/mL; IFNg : 0.369–1,510 pg/mL; IL10: 0.076–313 pg/mL;IL17: 1.38–5,670 pg/mL.
RNA isolationTotal RNA was isolated from frozen whole tissue using the
RNeasy Kit (Qiagen) following the manufacturer's instructions.Briefly, whole tissue was homogenized in RLT lysis buffer, passedthrough a QIAshredder (Qiagen), and then purified on the minispin columns, including the on-column DNAse treatment toremove any remaining DNA. The purified total RNA was thenanalyzed by Bioanalyzer 2100 expert (Agilent) as per manufac-turer's instructions. RIN numbers between 9.9 and 8.0 wereobtained.
Transcriptomic analysisRNA Sequencing was performed by Oxford Gene Technology
using the Illumina HiSeq2500 platform and generated approxi-mately 42 million 101 base-pair paired end reads per sample.Sequenced reads were mapped to Human RefSeq genes archivedin the Illumina iGenomes resource (http://support.illumina.com/sequencing/sequencing_software/igenome.html) using RSEM(version 1.2.4; ref. 21) in dUTP strand–specific mode. As part ofthe RSEM pipeline, bowtie (version 0.12.7) (22) was used toperform the mapping stage. Subsequent mapped read countingwas performed using RSEM. Differentially expressed genes wereidentified with the EdgeR package (23) using Bioconductor (ver-sion 2.7; www.bioconductor.org), running on R (version 2.12.1;R-REF). Genes with logCPM > 0 and FDR <0.05 were judged to bedifferentially expressed. Immunologic signatures that represent cellstates and perturbations within the immune system were extractedfromMsigdb (24) and used to perform GSEA with default settingscomparing pairwise comparisons. GSEA analysis on pre and postNACT samples, were interrogated using the MSigDB C7 immuno-logic collection available from the Broad Institute (Cambridge,MA). This consisted of 1,910 signatures, which comprise approx-imately 200 genes per signature. Signatures were considered sig-nificant if the corrected FDR q value was <0.05. Heatmaps shownin Figs. 3 and 4 are truncated to show only the genes identified ascontributing to the enrichment score.
Availability of data and materialsFASTQ data files supporting the RNASeq analysis have been
uploaded to NCBI GEO database GSE71340.
Statistical analysisFor continuous variables that were approximately normal or
normally distributed, mean and SEM are shown and t testwas conducted. For ordinal variables, Mann–Whitney test orWilcoxon matched-pairs signed rank test were applied and Krus-kal–Wallis test was used in addition to perform multiple groupcomparisons.
Progression-free survival (PFS) was calculated from the dateof first NACT to progression or death (whichever came first)using GCIG CA-125 criteria for biochemical progression.
Neoadjuvant Chemotherapy and Tumor Immunity
www.aacrjournals.org Clin Cancer Res; 22(12) June 15, 2016 3027
on May 29, 2018. © 2016 American Association for Cancer Research. clincancerres.aacrjournals.org Downloaded from
Overall survival (OS) was calculated from the date of first NACTto death from HGSC. Survival functions were estimated usingthe Kaplan–Meier method and the log-rank test was applied.
ResultsResponse to chemotherapy in the study cohort
Samples from a total of 54 patients receiving NACT and 6patients who had surgery prior to chemotherapy were used inthe experiments in this article. Supplementary Table S3 sum-marizes the sample numbers used in each set of experiments. Asdescribed above, the response to chemotherapy was assessed inthe IDS biopsies using the CRS (18). CRS1 samples showminimal response to chemotherapy, CRS2, "poor" responders,have easily identifiable malignant cells in the omentum afterNACT and CRS3, "good" responders, usually show extensiveregression-associated fibroinflammatory changes with absent
or minimal numbers of malignant cells (18). None of the IDSsamples in our experiments, by chance and due to prevalence,scored as CRS1. "Good responder" patients with samplesscored as CRS3 had significantly improved progression-freesurvival (P ¼ 0.002) and OS (P ¼ 0.03) compared with "poorresponder" patients whose biopsies scored as CRS2 (Supple-mentary Fig. S1).
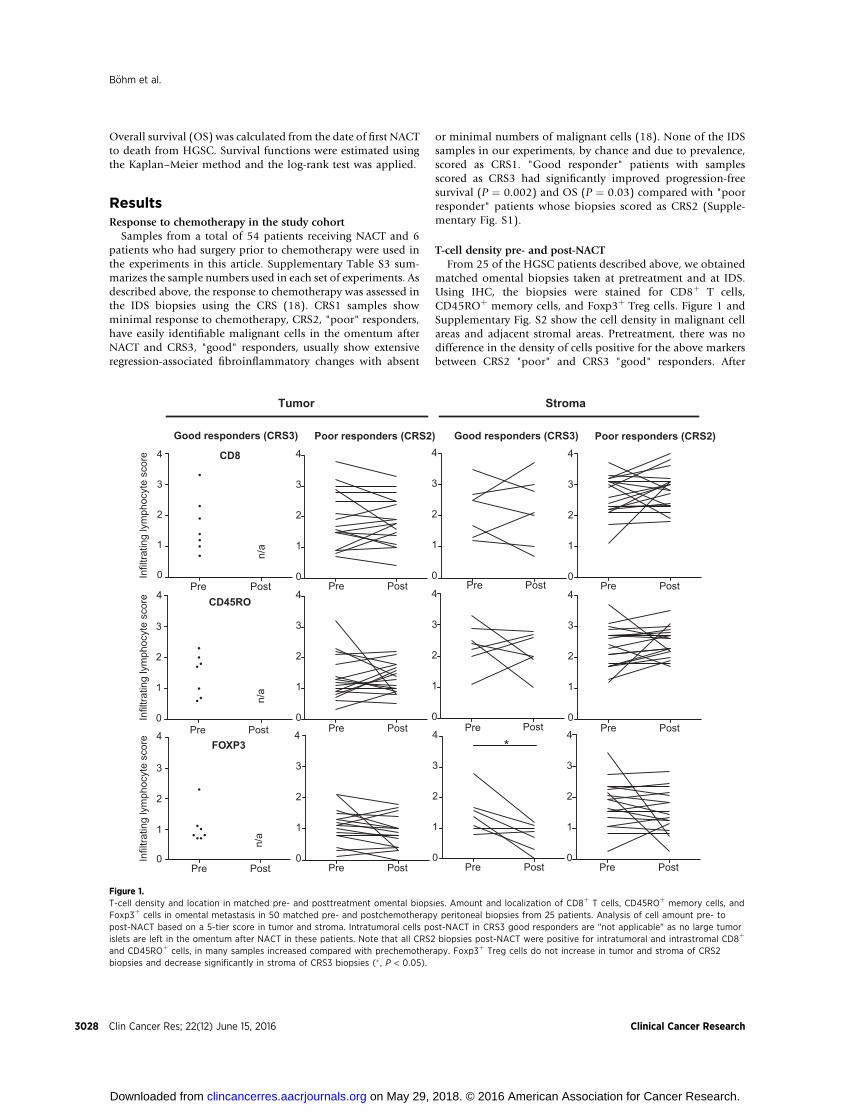
T-cell density pre- and post-NACTFrom 25 of the HGSC patients described above, we obtained
matched omental biopsies taken at pretreatment and at IDS.Using IHC, the biopsies were stained for CD8þ T cells,CD45ROþ memory cells, and Foxp3þ Treg cells. Figure 1 andSupplementary Fig. S2 show the cell density in malignant cellareas and adjacent stromal areas. Pretreatment, there was nodifference in the density of cells positive for the above markersbetween CRS2 "poor" and CRS3 "good" responders. After
Pre Post0
1
2
3
4
0
1
2
3
4
Pre Post0
1
2
3
4
Pre Post0
1
2
3
4
0
1
2
3
4
Pre Post0
1
2
3
4
Pre Post0
1
2
3
4
Pre Post0
1
2
3
4
Good responders (CRS3) Poor responders (CRS2)
Tumor Stroma
Pre Post0
1
2
3
4
Pre Post0
1
2
3
4
Pre Post0
1
2
3
4
0
1
3
4
2
FOXP3
CD45RO
CD8
Pre Post
Good responders (CRS3) Poor responders (CRS2)
n/a
Pre Post
n/a
n/a
*Pre Post
Infil
tratin
g ly
mph
ocyt
e sc
ore
Infil
tratin
g ly
mph
ocyt
e sc
ore
Infil
tratin
g ly
mph
ocyt
e sc
ore
Figure 1.T-cell density and location in matched pre- and posttreatment omental biopsies. Amount and localization of CD8þ T cells, CD45ROþ memory cells, andFoxp3þ cells in omental metastasis in 50 matched pre- and postchemotherapy peritoneal biopsies from 25 patients. Analysis of cell amount pre- topost-NACT based on a 5-tier score in tumor and stroma. Intratumoral cells post-NACT in CRS3 good responders are "not applicable" as no large tumorislets are left in the omentum after NACT in these patients. Note that all CRS2 biopsies post-NACT were positive for intratumoral and intrastromal CD8þ
and CD45ROþ cells, in many samples increased compared with prechemotherapy. Foxp3þ Treg cells do not increase in tumor and stroma of CRS2biopsies and decrease significantly in stroma of CRS3 biopsies (� , P < 0.05).
B€ohm et al.
Clin Cancer Res; 22(12) June 15, 2016 Clinical Cancer Research3028
on May 29, 2018. © 2016 American Association for Cancer Research. clincancerres.aacrjournals.org Downloaded from
NACT, there were still marked infiltrates of CD8þ T cells andCD45ROþ memory cells in the stroma and again no differencebetween CRS2 or CRS3 biopsies. CD8þ T cells and CD45ROþ
memory cells in the malignant cell areas of CRS2 biopsiesremained at high levels; in fact, CD8þ cell density increasedin approximately 50% of patients and the tumor:stroma ratioof CD8þ and CD45ROþ cells in individual patients was essen-tially unchanged pre- and postchemotherapy in the CRS2biopsies (Supplementary Fig. S3).
In contrast, there was a significant decline in the density ofFoxp3þ cells in the stromal areas of the CRS3 "good" responderbiopsies afterNACT(P¼0.02)but therewasno significant changein the CRS2 biopsies (Fig. 1). As Foxp3 is a marker of immuno-suppressive Treg cells, we next asked whether NACT increasedT-cell activation.
Evidence for T-cell activation after NACTWe assessed the phenotype of the T cells in the HGSC
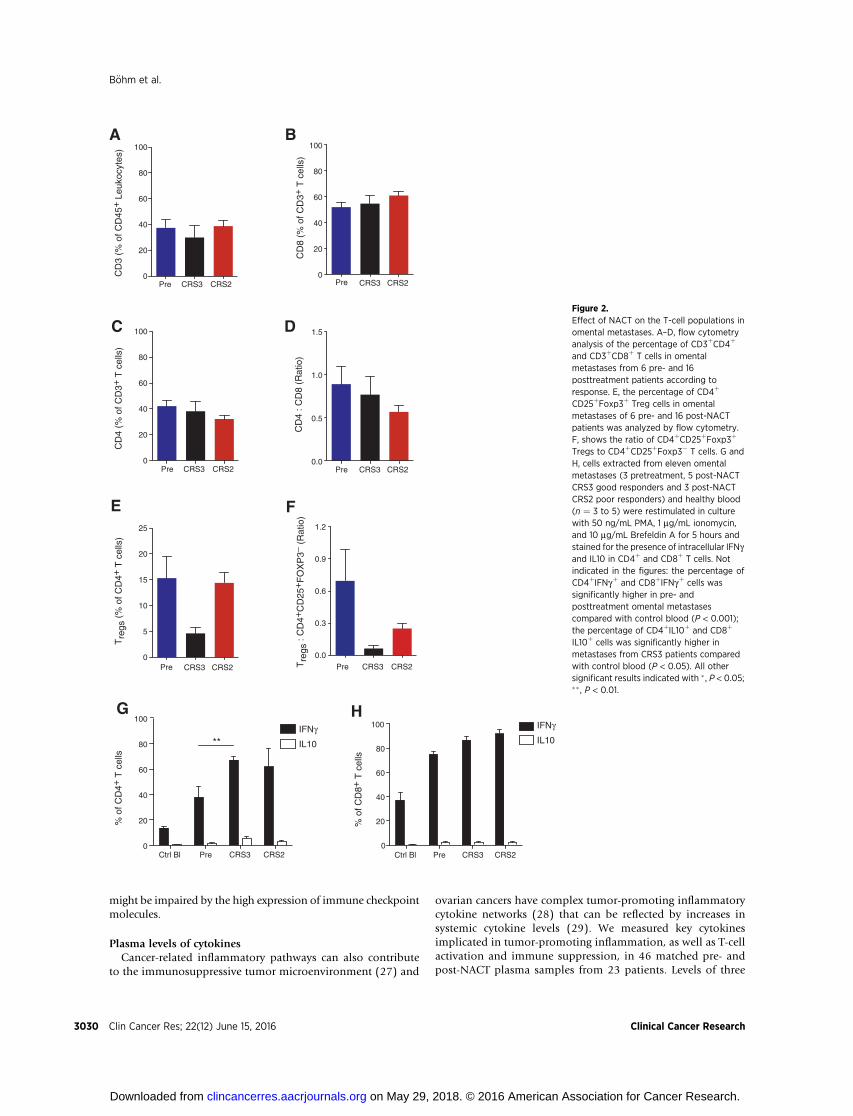
omental metastases by flow cytometry analysis of TILs from22 of the HGSC biopsies. As it was not possible to obtainsufficient material for flow cytometry from diagnostic biopsiesfor pretreatment samples in these experiments, to assess pre-treatment T-cell phenotypes, we used six samples obtained atprimary debulking and two laparoscopic biopsies obtainedbefore NACT. In agreement with the results in Fig. 1, thepercentage of CD3þ cells in the CD45þ leukocyte populationdid not change pre- or post-NACT, irrespective of response tochemotherapy (Fig. 2A). Likewise, there were no significantchanges in CD8þ, CD4þ T cells, or CD4:CD8 ratio (Fig. 2B–D).A subpopulation of the CD4þ T cells was CD25þ Foxp3þ
suggesting they were T regulatory cells. When comparingCRS2 and CRS3 patients, we observed a decrease in the per-centage of CD4þ T cells that were CD25þFoxp3þ in the CRS3biopsies (P ¼ 0.015, Mann–Whitney test; Fig. 2E), againsupporting the results in Fig. 1. The ratio of CD4þCD25þ
Foxp3þ cells to CD4þCD25þFoxp3� cells also decreased inpost-NACT CRS3 and CRS2 biopsies compared with pretreat-ment, and the difference between CRS2 and CRS3 was signif-icant (P ¼ 0.03, Mann–Whitney test; Fig. 2F). When applying acorrection for multiple group comparison, the differenceswere not deemed significant [P ¼ 0.06 (Fig. 2E) and P ¼0.09 (Fig. 2F), Kruskal–Wallis test].
We next studied the functional ability of the T cells in thebiopsies to produce IFNg as a marker of T-cell activation andantitumor response, and IL10 as a marker of immunosuppres-sion. Cells extracted from eleven HGSC omental samples, as wellas PBMCs from healthy control women (n ¼ 3–5), were stimu-lated in vitro and then stained for intracellular IFNg and IL10(Fig. 2G and H). A significantly higher proportion of omentalCD4þ andCD8þ T cells were able to produce IFNg comparedwithperipheral T cells from healthy controls. When compared withpretreatment biopsies, post-NACT CRS3 patients had a signifi-cantly higher proportion of IFNgþ CD4þ T cells (P ¼ 0.002,Fig. 2G). No significant difference in the proportion of IL10-producing CD4þ and CD8þ T cells was observed between pre-and post-NACT samples (Fig. 2G and H).
Gene set enrichment analysis of immune gene signaturespre- and post-NACT
We extracted total RNA from 20 of the HGSC omentalmetastasis biopsies for which we had sufficient material and
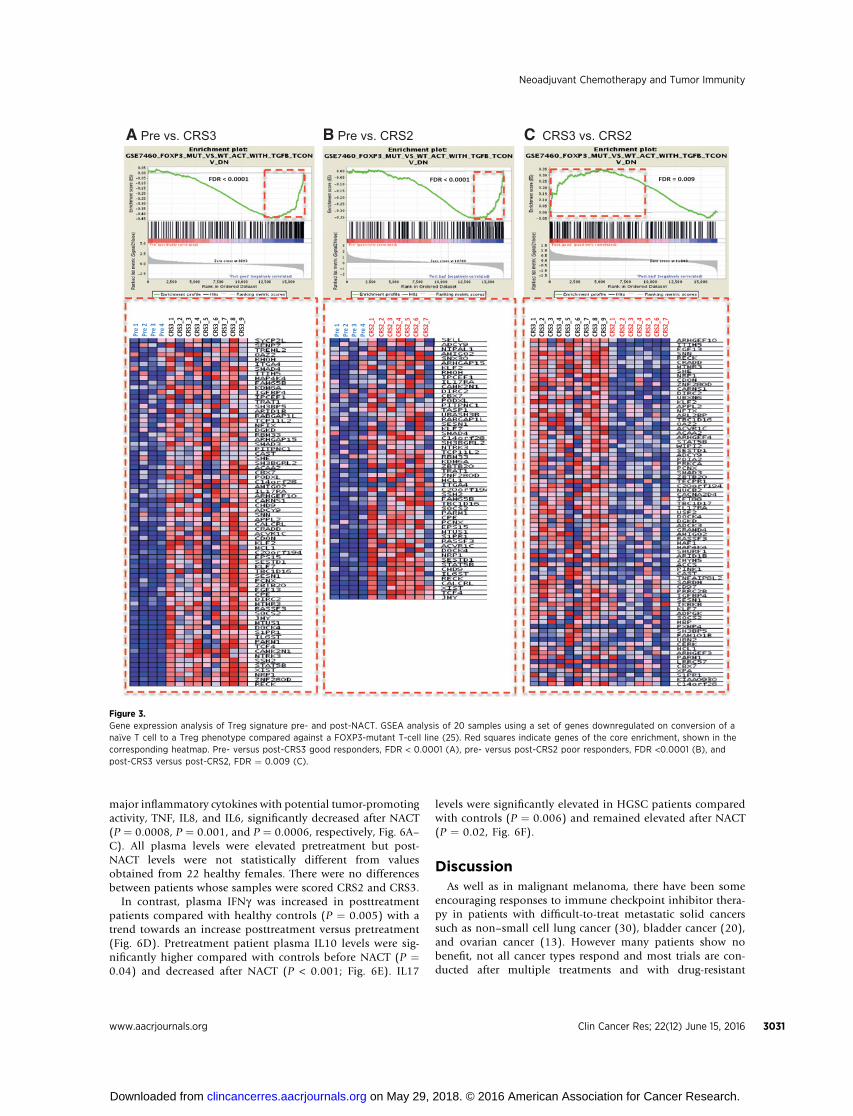
analyzed gene expression by RNAseq. Nine samples were fromCRS3 good responders post-NACT and 7 from CRS2 poorresponders. For pretreatment samples, we used two biopsiesfrom stage IIIC or IV HGSC patients undergoing PDS and twobiopsies obtained from patients before NACT as describedin Fig. 2. Gene set enrichment analysis (GSEA) was conducted.Changes to immune cell phenotypes from both the adaptiveand innate pathways were seen when comparing CRS3 to CRS2samples, and individually (CRS2 or CRS3) to pre-NACT sam-ples. In particular, changes associated with T-cell phenotypewere found to have the highest significance (lowest FDRvalue). In agreement with the results in Figs. 1 and 2, wefound that the FOXP3-associated Treg cell gene signatures weredifferentially regulated in pre- versus post-NACT patients.FOXP3-regulated genes whose expression is decreased follow-ing differentiation to a Treg phenotype (25) were enriched inpretreatment versus both CRS2 and CRS3 post-NACT biopsies(Fig. 3A and B). We also observed an enrichment of this genesignature in CRS2 poor responder biopsies compared withCRS3 biopsies (Fig. 3C).
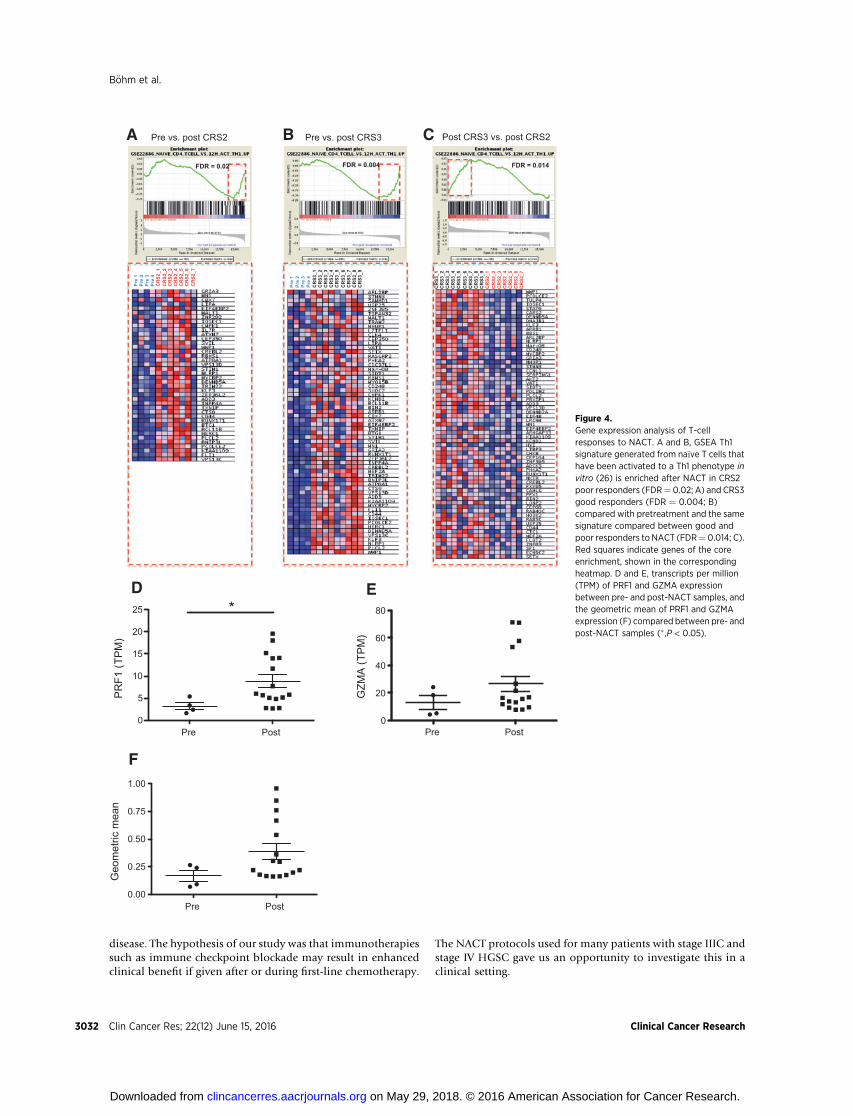
Further GSEA analysis revealed an increase in expression ofT helper 1 (Th1)-associated genes after NACT in both poor(CRS2) and good (CRS3) responders (Fig. 4A and 4B). The geneset used contained genes that were experimentally upregulatedwhen na€�ve T cells were activated to a Th1 phenotype in vitro(26). We also noted that the Th1 phenotype was enriched inCRS3 patients compared with CRS2 (Fig. 4C). Meta-analysis ofTCGA data has identified GZMA (encoding granzyme A) andPRF1 (encoding perforin 1) as specifically coexpressed bycytotoxic T cells (12). We compared gene expression levels forboth markers within our dataset (Fig. 4D–F). There was atendency for both genes to be upregulated in the post-NACTversus pretreatment samples and the difference with PRF1 wassignificant (P ¼ 0.03; Fig. 4D and E). The geometric mean ofboth genes (Fig. 4F) again showed a tendency towards upre-gulation post-NACT. These experiments suggest that NACTreduced Treg cell activity in HGSC metastases while increasingT-cell activation and Th1 responses and these effects were mostprofound in the CRS3 good responder patients. We next askedwhether the potential for efficient host antitumor immuneresponses was influenced by immune checkpoint molecules.
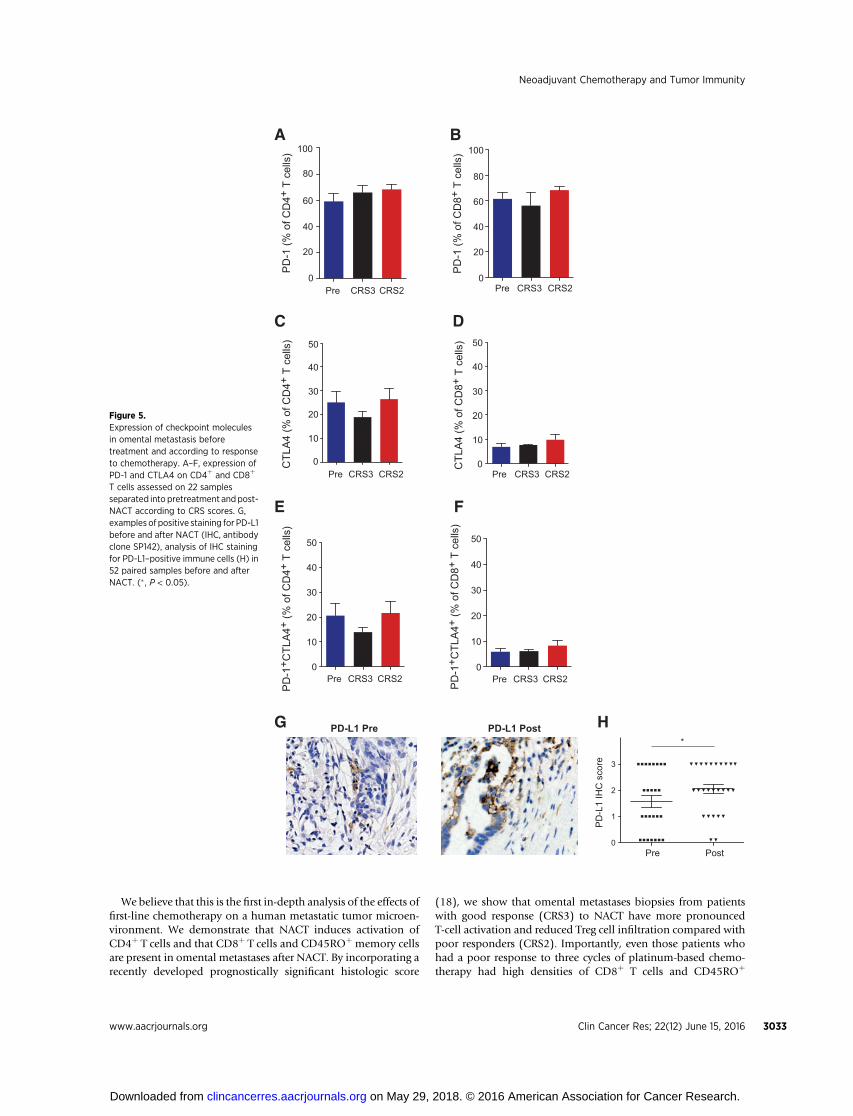
The effect of NACT on immune checkpoint moleculesMore than 60% of CD4þ and CD8þ T cells in omental
metastases from 6 pre- and 16 post-NACT patients expressedthe immune checkpoint molecule programmed cell death-1(PD-1) as assessed by flow cytometry (Fig. 5A and B). Between15% and 30% of the CD4þ cells and 5% to 10% of the CD8þ
cells expressed CTL-associated protein 4, CTLA4, in 22 biopsies(Fig. 5C and D) and most of the CTLA4þ T cells coexpressedPD-1 (Fig. 5E and F).
Immunohistochemical staining showed that the PD-1 ligandPD-L1 was frequently associated with the immune cell com-partment of the HGSC tumor microenvironment. Using anantibody developed for anti-PD-L1 clinical trials (clone SP142)and a scoring method on immune cells (20) we found thatPD-L1 protein was significantly increased in post-NACT com-pared with pre-NACT biopsies irrespective of response to treat-ment in paired pre- and post-NACT biopsies of 26 patients (P ¼0.03, Fig. 5G andH and Supplementary Fig. S4). Hence, potentialbeneficial effects of chemotherapy in stimulating T-cell activation
Neoadjuvant Chemotherapy and Tumor Immunity
www.aacrjournals.org Clin Cancer Res; 22(12) June 15, 2016 3029
on May 29, 2018. © 2016 American Association for Cancer Research. clincancerres.aacrjournals.org Downloaded from
might be impaired by the high expression of immune checkpointmolecules.
Plasma levels of cytokinesCancer-related inflammatory pathways can also contribute
to the immunosuppressive tumor microenvironment (27) and
ovarian cancers have complex tumor-promoting inflammatorycytokine networks (28) that can be reflected by increases insystemic cytokine levels (29). We measured key cytokinesimplicated in tumor-promoting inflammation, as well as T-cellactivation and immune suppression, in 46 matched pre- andpost-NACT plasma samples from 23 patients. Levels of three
Pre CRS3 CRS20
20
40
60
80
100
CD
3 (%
of C
D45
+ L
euko
cyte
s)
Pre0
20
40
60
80
100
Pre0
20
40
60
80
100
Pre0
5
10
15
20
25
Ctrl Bl Pre
CD
8 (%
of C
D3+
T c
ells
)
CD
4 (%
of C
D3+
T c
ells
)T
regs
(%
of C
D4+
T c
ells
)
A B
E F
G H
Pre0.0
0.5
1.0
1.5
CD
4 : C
D8
(Rat
io)
PreTre
gs :
CD
4+C
D25
+F
OX
P3−
(R
atio
)
C D
0
20
40
60
80
100IFNγ
IL10
IFNγ
IL10**
% o
f CD
4+ T
cel
ls
0
20
40
60
80
100
Ctrl Bl Pre
CRS3 CRS2
CRS3 CRS2
CRS3 CRS2
CRS3 CRS2
CRS3 CRS2
CRS3 CRS2 CRS3 CRS2
% o
f CD
8+ T
cel
ls
0.0
0.3
0.6
0.9
1.2
Figure 2.Effect of NACT on the T-cell populations inomental metastases. A–D, flow cytometryanalysis of the percentage of CD3þCD4þ
and CD3þCD8þ T cells in omentalmetastases from 6 pre- and 16posttreatment patients according toresponse. E, the percentage of CD4þ
CD25þFoxp3þ Treg cells in omentalmetastases of 6 pre- and 16 post-NACTpatients was analyzed by flow cytometry.F, shows the ratio of CD4þCD25þFoxp3þ
Tregs to CD4þCD25þFoxp3� T cells. G andH, cells extracted from eleven omentalmetastases (3 pretreatment, 5 post-NACTCRS3 good responders and 3 post-NACTCRS2 poor responders) and healthy blood(n ¼ 3 to 5) were restimulated in culturewith 50 ng/mL PMA, 1 mg/mL ionomycin,and 10 mg/mL Brefeldin A for 5 hours andstained for the presence of intracellular IFNgand IL10 in CD4þ and CD8þ T cells. Notindicated in the figures: the percentage ofCD4þIFNgþ and CD8þIFNgþ cells wassignificantly higher in pre- andposttreatment omental metastasescompared with control blood (P < 0.001);the percentage of CD4þIL10þ and CD8þ
IL10þ cells was significantly higher inmetastases from CRS3 patients comparedwith control blood (P < 0.05). All othersignificant results indicated with � , P < 0.05;�� , P < 0.01.
B€ohm et al.
Clin Cancer Res; 22(12) June 15, 2016 Clinical Cancer Research3030
on May 29, 2018. © 2016 American Association for Cancer Research. clincancerres.aacrjournals.org Downloaded from
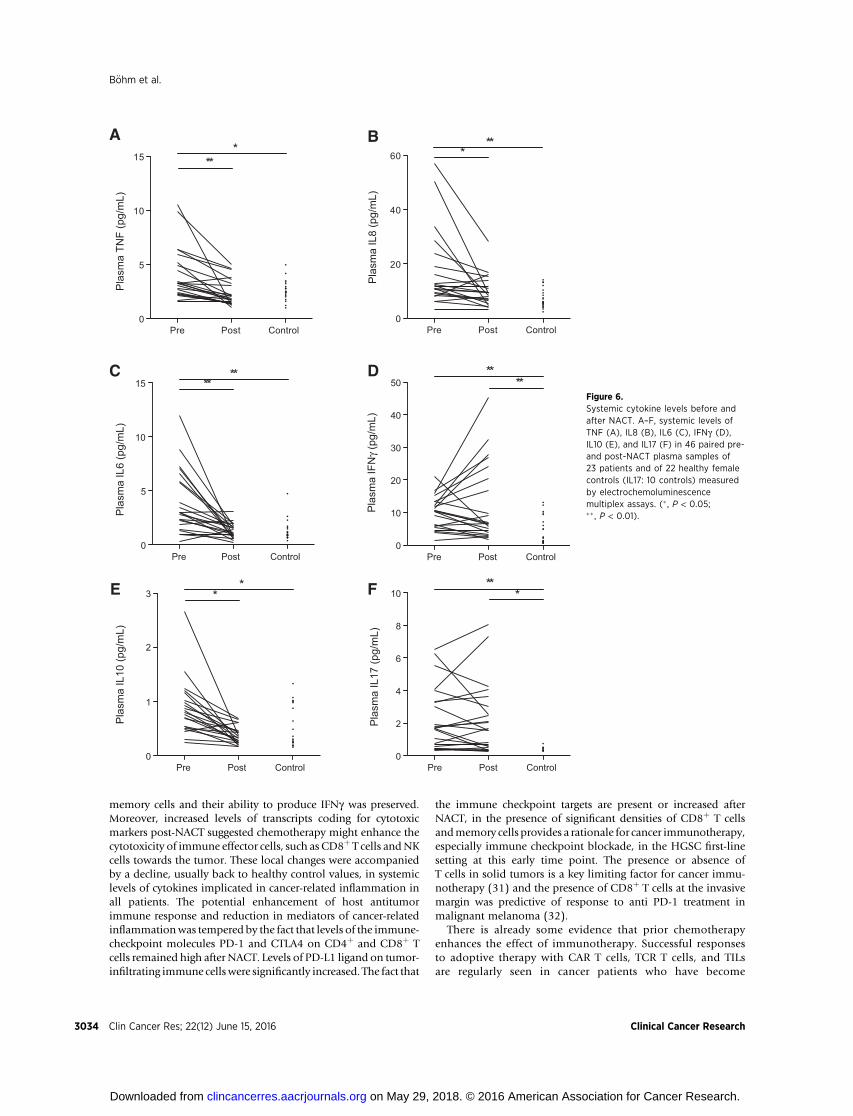
major inflammatory cytokines with potential tumor-promotingactivity, TNF, IL8, and IL6, significantly decreased after NACT(P ¼ 0.0008, P ¼ 0.001, and P ¼ 0.0006, respectively, Fig. 6A–C). All plasma levels were elevated pretreatment but post-NACT levels were not statistically different from valuesobtained from 22 healthy females. There were no differencesbetween patients whose samples were scored CRS2 and CRS3.
In contrast, plasma IFNg was increased in posttreatmentpatients compared with healthy controls (P ¼ 0.005) with atrend towards an increase posttreatment versus pretreatment(Fig. 6D). Pretreatment patient plasma IL10 levels were sig-nificantly higher compared with controls before NACT (P ¼0.04) and decreased after NACT (P < 0.001; Fig. 6E). IL17
levels were significantly elevated in HGSC patients comparedwith controls (P ¼ 0.006) and remained elevated after NACT(P ¼ 0.02, Fig. 6F).
DiscussionAs well as in malignant melanoma, there have been some
encouraging responses to immune checkpoint inhibitor thera-py in patients with difficult-to-treat metastatic solid cancerssuch as non–small cell lung cancer (30), bladder cancer (20),and ovarian cancer (13). However many patients show nobenefit, not all cancer types respond and most trials are con-ducted after multiple treatments and with drug-resistant
CRS3
_1CR
S3_2
CRS3
_3CR
S3_4
CRS3
_5CR
S3_6
CRS3
_7CR
S3_8
CRS3
_9CR
S2_1
CRS2
_2CR
S2_3
CRS2
_4CR
S2_5
CRS2
_6CR
S2_7
FDR = 0.009
Pre 1
Pre 2
CRS3
_1
Pre 3
CRS3
_2
Pre 4
CRS3
_3CR
S3_4
CRS3
_5CR
S3_6
CRS3
_7CR
S3_8
CRS3
_9
Pre 1
Pre 2
Pre 3
Pre 4
CRS2
_1CR
S2_2
CRS2
_3CR
S2_4
CRS2
_5CR
S2_6
CRS2
_7
FDR < 0.0001 FDR < 0.0001
A Pre vs. CRS3 B Pre vs. CRS2 C CRS3 vs. CRS2
Figure 3.Gene expression analysis of Treg signature pre- and post-NACT. GSEA analysis of 20 samples using a set of genes downregulated on conversion of ana€�ve T cell to a Treg phenotype compared against a FOXP3-mutant T-cell line (25). Red squares indicate genes of the core enrichment, shown in thecorresponding heatmap. Pre- versus post-CRS3 good responders, FDR < 0.0001 (A), pre- versus post-CRS2 poor responders, FDR <0.0001 (B), andpost-CRS3 versus post-CRS2, FDR ¼ 0.009 (C).
Neoadjuvant Chemotherapy and Tumor Immunity
www.aacrjournals.org Clin Cancer Res; 22(12) June 15, 2016 3031
on May 29, 2018. © 2016 American Association for Cancer Research. clincancerres.aacrjournals.org Downloaded from
disease. The hypothesis of our study was that immunotherapiessuch as immune checkpoint blockade may result in enhancedclinical benefit if given after or during first-line chemotherapy.
The NACT protocols used for many patients with stage IIIC andstage IV HGSC gave us an opportunity to investigate this in aclinical setting.
A
CR
S3_1
CR
S3_2
CR
S3_3
CR
S3_4
CR
S3_5
CR
S3_6
CR
S3_7
CR
S3_8
CR
S3_9
CR
S2_1
CR
S2_2
CR
S2_3
CR
S2_4
CR
S2_5
CR
S2_6
CR
S2_7
FDR = 0.02
Pre
1Pr
e 2
CR
S3_1
Pre
3
CR
S3_2
Pre
4
CR
S3_3
CR
S3_4
CR
S3_5
CR
S3_6
CR
S3_7
CR
S3_8
CR
S3_9
Pre
1Pr
e 2
Pre
3Pr
e 4
CR
S2_1
CR
S2_2
CR
S2_3
CR
S2_4
CR
S2_5
CR
S2_6
CR
S2_7
FDR = 0.004 FDR = 0.014
Pre vs. post CRS2 Pre vs. post CRS3 Post CRS3 vs. post CRS2B C
Pre Post0
5
10
15
20
25 *
Pre Post0.00
0.25
0.50
0.75
1.00
Geo
met
ric m
ean
D
F
Pre Post0
20
40
60
80
E
PR
F1 (T
PM)
GZM
A (T
PM)
Figure 4.Gene expression analysis of T-cellresponses to NACT. A and B, GSEA Th1signature generated from na€�ve T cells thathave been activated to a Th1 phenotype invitro (26) is enriched after NACT in CRS2poor responders (FDR¼ 0.02; A) and CRS3good responders (FDR ¼ 0.004; B)compared with pretreatment and the samesignature compared between good andpoor responders to NACT (FDR¼ 0.014; C).Red squares indicate genes of the coreenrichment, shown in the correspondingheatmap. D and E, transcripts per million(TPM) of PRF1 and GZMA expressionbetween pre- and post-NACT samples, andthe geometric mean of PRF1 and GZMAexpression (F) compared between pre- andpost-NACT samples (� ,P < 0.05).
B€ohm et al.
Clin Cancer Res; 22(12) June 15, 2016 Clinical Cancer Research3032
on May 29, 2018. © 2016 American Association for Cancer Research. clincancerres.aacrjournals.org Downloaded from
We believe that this is the first in-depth analysis of the effects offirst-line chemotherapy on a human metastatic tumor microen-vironment. We demonstrate that NACT induces activation ofCD4þ T cells and that CD8þ T cells and CD45ROþ memory cellsare present in omental metastases after NACT. By incorporating arecently developed prognostically significant histologic score
(18), we show that omental metastases biopsies from patientswith good response (CRS3) to NACT have more pronouncedT-cell activation and reduced Treg cell infiltration compared withpoor responders (CRS2). Importantly, even those patients whohad a poor response to three cycles of platinum-based chemo-therapy had high densities of CD8þ T cells and CD45ROþ
0
20
40
60
80
100
PD
-1 (%
of C
D4+
T c
ells
)
0
10
20
30
40
50
0
20
40
60
80
100
0
10
20
30
40
50
A B
E
DC
PD-L1 PostPD-L1 Pre
0
1
2
3
Pre Post
PD
-1 (%
of C
D8+
T c
ells
)
Pre CRS3 CRS2Pre CRS3 CRS2C
TLA
4 (%
of C
D4+
T c
ells
)
CTL
A4
(% o
f CD
8+ T
cel
ls)
Pre CRS3 CRS2 Pre CRS3 CRS2
*
PD
-L1
IHC
sco
re
0
10
20
30
40
50
PD
-1+ C
TLA
4+ (%
of C
D4+
T c
ells
)
PD
-1+ C
TLA
4+ (%
of C
D8+
T c
ells
)
Pre CRS3 CRS20
10
20
30
40
50
Pre CRS3 CRS2
G
F
H
Figure 5.Expression of checkpoint moleculesin omental metastasis beforetreatment and according to responseto chemotherapy. A–F, expression ofPD-1 and CTLA4 on CD4þ and CD8þ
T cells assessed on 22 samplesseparated into pretreatment andpost-NACT according to CRS scores. G,examples of positive staining for PD-L1before and after NACT (IHC, antibodyclone SP142), analysis of IHC stainingfor PD-L1–positive immune cells (H) in52 paired samples before and afterNACT. (� , P < 0.05).
Neoadjuvant Chemotherapy and Tumor Immunity
www.aacrjournals.org Clin Cancer Res; 22(12) June 15, 2016 3033
on May 29, 2018. © 2016 American Association for Cancer Research. clincancerres.aacrjournals.org Downloaded from
memory cells and their ability to produce IFNg was preserved.Moreover, increased levels of transcripts coding for cytotoxicmarkers post-NACT suggested chemotherapy might enhance thecytotoxicity of immune effector cells, such as CD8þ T cells andNKcells towards the tumor. These local changes were accompaniedby a decline, usually back to healthy control values, in systemiclevels of cytokines implicated in cancer-related inflammation inall patients. The potential enhancement of host antitumorimmune response and reduction in mediators of cancer-relatedinflammationwas tempered by the fact that levels of the immune-checkpoint molecules PD-1 and CTLA4 on CD4þ and CD8þ Tcells remained high after NACT. Levels of PD-L1 ligand on tumor-infiltrating immune cells were significantly increased. The fact that
the immune checkpoint targets are present or increased afterNACT, in the presence of significant densities of CD8þ T cellsandmemory cells provides a rationale for cancer immunotherapy,especially immune checkpoint blockade, in the HGSC first-linesetting at this early time point. The presence or absence ofT cells in solid tumors is a key limiting factor for cancer immu-notherapy (31) and the presence of CD8þ T cells at the invasivemargin was predictive of response to anti PD-1 treatment inmalignant melanoma (32).
There is already some evidence that prior chemotherapyenhances the effect of immunotherapy. Successful responsesto adoptive therapy with CAR T cells, TCR T cells, and TILsare regularly seen in cancer patients who have become
Pre Post Control0
5
10
15**
**
Pla
sma
IL6
(pg/
mL)
Pre Post Control0
20
40
60**
*
Pla
sma
IL8
(pg/
mL)
Pre Post Control0
5
10
15*
**
Pla
sma
TNF
(pg/
mL)
Pre Post Control0
1
2
3*
*
Pla
sma
IL10
(pg/
mL)
Pre Post Control0
2
4
6
8
10**
*
Pla
sma
IL17
(pg/
mL)
Pre Post Control0
10
20
30
40
50**
**P
lasm
a IF
Nγ
(pg/
mL)
A
FE
D
B
CFigure 6.Systemic cytokine levels before andafter NACT. A–F, systemic levels ofTNF (A), IL8 (B), IL6 (C), IFNg (D),IL10 (E), and IL17 (F) in 46 paired pre-and post-NACT plasma samples of23 patients and of 22 healthy femalecontrols (IL17: 10 controls) measuredby electrochemoluminescencemultiplex assays. (� , P < 0.05;�� , P < 0.01).
B€ohm et al.
Clin Cancer Res; 22(12) June 15, 2016 Clinical Cancer Research3034
on May 29, 2018. © 2016 American Association for Cancer Research. clincancerres.aacrjournals.org Downloaded from
chemotherapy-resistant. In terms of ovarian cancer, there wereresponses to IL2 immunotherapy in patients who had becomeresistant to platinum therapy (33), while in a first-line study,chemotherapy plus IFNg 1-b immunotherapy showed adecreased OS compared with chemotherapy alone (34). Thishighlights the need for careful monitoring of patients duringcombination chemotherapy.
The relative contribution of platinum versus taxane to theimmunostimulatory effects seen in our study is an open ques-tion because almost all patients received the combinationtherapy. Experimental studies suggest that cisplatin does notinduce immunogenic cell death (ICD; ref.35) but carboplatinand docetaxel produce partial features of ICD (36). Chemo-therapy can also activate the host immune system by severalother mechanisms (37) such as increased presentation ofneoantigens. Chemotherapy before immunotherapy is of par-ticular interest since efficacy of PD-1 blockade has recently beenshown to correlate with neoantigen burden in non–small celllung cancer (38).
In ovarian cancer, there are conflicting results relating to theprognostic impact of Treg cells (39, 40). Our data obtained attranscriptional, protein, and cellular level showa reduced Treg cellsignature and density after NACT is most apparent in biopsies oftumors classified as CRS3 good responders, providing evidencefor a link between chemotherapy efficiency and Treg density. Inaddition to reduced Tregs after NACT in good responders, weobserved by flow cytometry a shift of the Foxp3� populationtowards increased CD25 expression, again most pronounced ingood responders. This population has been shown to have an"exhausted" phenotype that could effectively been reversed usingan anti-PD-1mAb (41).We suggest that blocking the PD-1/PD-L1axis is a way to inhibit Treg cell function and enhance theantitumor effectiveness of the CD4þCD25þ T cells. Future workin larger cohorts may reveal insights into functionally differentsubsets of Treg cells with potentially different prognostic andpredictive value (42, 43).
There ismuch evidence that cancer-related inflammation is alsotumor promoting (44) although clinical trials that target inflam-matory mediators or cells are not as advanced as some otherimmunotherapy approaches (27, 34). As the adaptive immuneresponse is heavily dependent on innate immunity, inhibitingsome of the tumor-promoting immunosuppressive actions of theinnate immune system might enhance the potential of immu-notherapies that activate a nascent antitumor response. It istherefore encouraging that NACT had a significant impact onsystemic levels of three key inflammatory cytokines in our study.TNF and IL6 are major players in the complex cytokine networksthat drive tumor progression in ovarian cancer (28, 29, 45).Elevated IL6 produced by malignant cells was a cause of para-neoplastic thrombocytosis inHGSC patients (29) and plasma IL8correlated with tumor burden and treatment response across arange of human and experimental cancers (45). The observationthat all three cytokines decrease to normal plasma levels after
NACT further suggests that this is a favorable time to introduceimmunotherapy, taken with the finding of an increase in the Th1cytokine IFNg in the patient plasma.
In summary, we have been able to study the human tumormicroenvironment at the transcriptomic, proteomic and cellularlevel at a key site of cancer dissemination and under conditionsthat reflect current practice of patient care—the disease at diag-nosis and after NACT. Our results suggest that NACT opens awindow of opportunity for immunotherapies such as immunecheckpoint blockade for patients with different levels of responseto chemotherapy. We conclude that incorporation of immu-notherapies into postchemotherapy treatment options could beof benefit for prolonged disease control in patients with advancedHGSC and, if confirmed, in patients with other cancer types.
Disclosure of Potential Conflicts of InterestNo potential conflicts of interest were disclosed.
Authors' ContributionsConception and design: S. B€ohm, I.A. McNeish, F.R. BalkwillDevelopment of methodology: S. B€ohm, A. Montfort, N. SinghAcquisition of data (provided animals, acquired and managed patients,provided facilities, etc.): S. B€ohm, A. Montfort, O.M.T. Pearce, J. Topping,G.L.A. Everitt, A. Clear, D. Ennis, T. Dowe, A. Fitzpatrick, E.C. Brockbank,A. Lawrence, A. Jeyarajah, I.A. McNeish, M. LockleyAnalysis and interpretation of data (e.g., statistical analysis, biostatistics,computational analysis): S. B€ohm, A. Montfort, O.M.T. Pearce, J. Topping,P. Chakravarty, J.R.McDermott, A. Faruqui, I.A.McNeish,N. Singh, F.R. BalkwillWriting, review, and/or revision of the manuscript: S. B€ohm, A. Montfort,O.M.T. Pearce, J. Topping, D. Ennis, T. Dowe, A. Fitzpatrick, E.C. Brockbank,A.C. Lawrence, A. Jeyarajah, A. Faruqui, I.A. McNeish, M. Lockley, N. Singh,F.R. BalkwillAdministrative, technical, or material support (i.e., reporting or organizingdata, constructing databases): S. B€ohm, J. Topping, A. Clear, A.C. Lawrence,A.Z. Faruqui, M. LockleyStudy supervision: F.R. BalkwillOther (scoring of tissue microarrays): N. Singh
AcknowledgmentsThe authors thank the patients for donating samples to the Barts Gynae
Tissue Bank and the doctors and nurses at St. Bartholomew's GynaecologicalCancer Centre for their support. The authors thank Dr. Dhafir Al Okati, QueensHospital, Romford andDr. Konstantinos Giaslakiotis, Whipps Cross UniversityHospital (London, UK) for providing biopsy samples for the study. The authorsalsowish to thankDr. Ian Said, BartsHealthNHSTrust andGeorge Elia, AndrewOwen, and Dr. Linda Hammond, Barts Cancer Institute, for technical support.
Grant SupportThis research was funded by Swiss Cancer League (BIL KLS-2883-02-2012),
the European Research Council (ERC322566), Cancer Research UK (A16354),and Barts and The London Charity (467/1307).
The costs of publication of this articlewere defrayed inpart by the payment ofpage charges. This article must therefore be hereby marked advertisement inaccordance with 18 U.S.C. Section 1734 solely to indicate this fact.
Received November 5, 2015; revised January 29, 2016; accepted February 1,2016; published online June 15, 2016.
References1. Vaughan S, Coward J, Bast Jr RC, Berchuck A, Berek JS, Brenton JD, et al.
Rethinking ovarian cancer: recommendations for improving outcomes.Nat Rev Cancer 2011;11:719–25.
2. Tan DS, Agarwal R, Kaye SB. Mechanisms of transcoelomic metastasis inovarian cancer. Lancet Oncol 2006;7:925–34.
3. Jayson GC, Kohn EC, Kitchener HC, Ledermann JA. Ovarian cancer. Lancet2014;384:1376–88.
4. Vergote I, Trope CG, Amant F, Kristensen GB, Ehlen T, Johnson N, et al.Neoadjuvant chemotherapy or primary surgery in stage IIIC or IV ovariancancer. N Engl J Med 2010;363:943–53.
Neoadjuvant Chemotherapy and Tumor Immunity
www.aacrjournals.org Clin Cancer Res; 22(12) June 15, 2016 3035
on May 29, 2018. © 2016 American Association for Cancer Research. clincancerres.aacrjournals.org Downloaded from
5. Kehoe S, Hook J, Nankivell M, Jayson GC, Kitchener H, Lopes T, et al.Primary chemotherapy versus primary surgery for newly diagnosedadvanced ovarian cancer (CHORUS): an open-label, randomised, con-trolled, non-inferiority trial. Lancet 2015;386:249–57.
6. Ioannides CG, Platsoucas CD, Rashed S, Wharton JT, Edwards CL, Freed-man RS. Tumor cytolysis by lymphocytes infiltrating ovarian malignantascites. Cancer Res 1991;51:4257–65.
7. Kooi S, Zhang HZ, Patenia R, Edwards CL, Platsoucas CD, Freedman RS.HLA class I expression on human ovarian carcinoma cells correlates withT-cell infiltration in vivo andT-cell expansion in vitro in low concentrationsof recombinant interleukin-2. Cell Immunol 1996;174:116–28.
8. Zhang L, Conejo-Garcia JR, Katsaros D, Gimotty PA,MassobrioM, RegnaniG, et al. Intratumoral T cells, recurrence, and survival in epithelial ovariancancer. N Engl J Med 2003;348:203–13.
9. Webb JR, Milne K, Watson P, Deleeuw RJ, Nelson BH. Tumor-infiltratinglymphocytes expressing the tissue resident memory marker CD103 areassociated with increased survival in high-grade serous ovarian cancer. ClinCancer Res 2014;20:434–44.
10. Nelson BH. New insights into tumor immunity revealed by the uniquegenetic and genomic aspects of ovarian cancer. Curr Opin Immunol 2015;33:93–100.
11. Zsiros E, Tanyi J, Balint K,Kandalaft LE. Immunotherapy for ovarian cancer:recent advances and perspectives. Curr Opin Oncol 2014;26:492–500.
12. Rooney MS, Shukla SA, Wu CJ, Getz G, Hacohen N. Molecular and geneticproperties of tumors associated with local immune cytolytic activity. Cell2015;160:48–61.
13. Hamanishi J, Mandai M, Ikeda T, Minami M, Kawaguchi A, Murayama T,et al. Safety and antitumor activity of anti-PD-1 antibody, nivolumab, inpatients with platinum-resistant ovarian cancer. J Clin Oncol 2015;33:4015–22
14. Vacchelli E, Aranda F, Eggermont A, Galon J, Sautes-Fridman C, Cremer I,et al. Trial Watch: Chemotherapy with immunogenic cell death inducers.Oncoimmunology 2014;3:e27878.
15. Menger L, Vacchelli E, Adjemian S, Martins I, Ma Y, Shen S, et al. Cardiacglycosides exert anticancer effects by inducing immunogenic cell death.Sci Transl Med 2012;4:143ra99.
16. MichaudM,Martins I, Sukkurwala AQ, Adjemian S,Ma Y, Pellegatti P, et al.Autophagy-dependent anticancer immune responses induced by chemo-therapeutic agents in mice. Science 2011;334:1573–7.
17. Peng J, Hamanishi J, Matsumura N, Abiko K, Murat K, Baba T, et al.Chemotherapy induces programmed cell death-ligand 1 overexpressionvia the nuclear factor-kappab to foster an immunosuppressive tumormicroenvironment in ovarian cancer. Cancer Res 2015;75:5034–45.
18. Bohm S, Faruqi A, Said I, Lockley M, Brockbank E, Jeyarajah A, et al.Chemotherapy response score: development and validation of a systemto quantify histopathologic response to neoadjuvant chemotherapyin tubo-ovarian high-grade serous carcinoma. J Clin Oncol 2015;33:2457–63.
19. McCluggage WG, Judge MJ, Clarke BA, Davidson B, Gilks CB, Hol-lema H, et al. Data set for reporting of ovary, fallopian tube andprimary peritoneal carcinoma: recommendations from the Interna-tional Collaboration on Cancer Reporting (ICCR). Mod Pathol 2015;28:1101–22.
20. Powles T, Eder JP, Fine GD, Braiteh FS, Loriot Y, Cruz C, et al. MPDL3280A(anti-PD-L1) treatment leads to clinical activity in metastatic bladdercancer. Nature 2014;515:558–62.
21. Li B, Dewey CN. RSEM: accurate transcript quantification from RNA-Seqdata with or without a reference genome. BMC Bioinformat 2011;12:323.
22. Langmead B, Trapnell C, Pop M, Salzberg SL. Ultrafast and memory-efficient alignment of short DNA sequences to the human genome.Genome Biol 2009;10:R25.
23. RobinsonMD,McCarthyDJ, SmythGK. edgeR: a Bioconductor package fordifferential expression analysis of digital gene expression data. Bioinfor-matics 2010;26:139–40.
24. SubramanianA, TamayoP,Mootha VK,Mukherjee S, Ebert BL,GilletteMA,et al. Gene set enrichment analysis: A knowledge-based approach forinterpreting genome-wide expression profiles. Proc Natl Acad Sci 2005;43:15545–50.
25. Hill JA, Feuerer M, Tash K, Haxhinasto S, Perez J, Melamed R, et al. Foxp3transcription-factor-dependent and -independent regulation of the regu-latory T cell transcriptional signature. Immunity 2007;27:786–800.
26. Abbas AR, BaldwinD,Ma Y, OuyangW, Gurney A, Martin F, et al. Immuneresponse in silico (IRIS): immune-specific genes identified from a com-pendium of microarray expression data. Gen Immun 2005;6:319–31.
27. Crusz SM, Balkwill FR. Inflammation and cancer: advances andnew agents.Nat Rev Clin Oncol 2015;12:584–596.
28. Kulbe H, Chakravarty P, Leinster DA, Charles KA, Kwong J, Thompson RG,et al. A dynamic inflammatory cytokine network in the human ovariancancer microenvironment. Cancer Res 2012;72:66–75.
29. Stone RL, Nick AM, McNeish IA, Balkwill F, Han HD, Bottsford-Miller J,et al. Paraneoplastic thrombocytosis in ovarian cancer. N Engl J Med2012;366:610–8.
30. Brahmer J, Reckamp KL, Baas P, Crino L, Eberhardt WE, Poddubskaya E,et al. Nivolumab versus docetaxel in advanced squamous-cell non-small-cell lung cancer. N Engl J Med 2015;373:123–35.
31. Melero I, Rouzaut A, Motz GT, Coukos G. T-cell and NK-cell infiltrationinto solid tumors: a key limiting factor for efficacious cancer immuno-therapy. Cancer Discov 2014;4:522–6.
32. Tumeh PC, Harview CL, Yearley JH, Shintaku IP, Taylor EJ, Robert L, et al.PD-1 blockade induces responses by inhibiting adaptive immune resis-tance. Nature 2014;515:568–71.
33. Vlad AM, Budiu RA, Lenzner DE, Wang Y, Thaller JA, Colonello K, et al. Aphase II trial of intraperitoneal interleukin-2 in patients with platinum-resistant or platinum-refractory ovarian cancer. Cancer Immunol Immun-other 2010;59:293–301.
34. Alberts DS, Marth C, Alvarez RD, Johnson G, Bidzinski M, Kardatzke DR,et al. Randomized phase 3 trial of interferon gamma-1b plus standardcarboplatin/paclitaxel versus carboplatin/paclitaxel alone for first-linetreatment of advanced ovarian and primary peritoneal carcinomas: resultsfrom a prospectively designed analysis of progression-free survival. Gyne-col Oncol 2008;109:174–81.
35. Martins I, Kepp O, Schlemmer F, Adjemian S, Tailler M, Shen S, et al.Restoration of the immunogenicity of cisplatin-induced cancer cell deathby endoplasmic reticulum stress. Oncogene 2011;30:1147–58.
36. Bezu L, Gomes-de-Silva LC, Dewitte H, Breckpot K, Fucikova J, Spisek R,et al. Combinatorial strategies for the induction of immunogenic celldeath. Front Immunol 2015;6:187.
37. Inoue H, Tani K. Multimodal immunogenic cancer cell death as a conse-quence of anticancer cytotoxic treatments. Cell Death Differentiation2014;21:39–49.
38. Rizvi NA, Hellmann MD, Snyder A, Kvistborg P, Makarov V, Havel JJ, et al.Cancer immunology. Mutational landscape determines sensitivity to PD-1blockade in non-small cell lung cancer. Science 2015;348:124–8.
39. Curiel TJ, Coukos G, Zou L, Alvarez X, Cheng P, Mottram P, et al. Specificrecruitment of regulatory T cells in ovarian carcinoma fosters immuneprivilege and predicts reduced survival. Nat Med 2004;10:942–9.
40. Leffers N, GoodenMJ, de Jong RA,HoogeboomBN, tenHoor KA,HollemaH, et al. Prognostic significance of tumor-infiltrating T-lymphocytes inprimary and metastatic lesions of advanced stage ovarian cancer. CancerImmunol Immunother 2009;58:449–59.
41. deLeeuw RJ, Kroeger DR, Kost SE, Chang PP, Webb JR, Nelson BH. CD25identifies a subset of CD4(þ)FoxP3(-) TIL that are exhausted yet prog-nostically favorable in human ovarian cancer. Cancer Immunol Res2015;3:245–53.
42. Abbas AK, Benoist C, Bluestone JA, Campbell DJ, Ghosh S, Hori S, et al.Regulatory T cells: recommendations to simplify the nomenclature.Nat Immunol 2013;14:307–8.
43. Mantovani A, Allavena P, Sica A, Balkwill F. Cancer-related inflammation.Nature 2008;454:436–44.
44. Coward J, KulbeH, Chakravarty P, Leader D, Vassileva V, Leinster DA, et al.Interleukin-6 as a therapeutic target in human ovarian cancer. Clin CancerRes 2011;17:6083–96.
45. SanmamedMF,Carranza-RuaO,AlfaroC,OnateC,Martin-Algarra S, PerezG, et al. Serum interleukin-8 reflects tumor burden and treatment responseacross malignancies of multiple tissue origins. Clin Cancer Res 2014;20:5697–707.
Clin Cancer Res; 22(12) June 15, 2016 Clinical Cancer Research3036
B€ohm et al.
on May 29, 2018. © 2016 American Association for Cancer Research. clincancerres.aacrjournals.org Downloaded from
2016;22:3025-3036. Clin Cancer Res Steffen Böhm, Anne Montfort, Oliver M.T. Pearce, et al. Serous CarcinomaMicroenvironment in Metastases of Tubo-Ovarian High-Grade Neoadjuvant Chemotherapy Modulates the Immune
Updated version
http://clincancerres.aacrjournals.org/content/22/12/3025
Access the most recent version of this article at:
Material
Supplementary
http://clincancerres.aacrjournals.org/content/suppl/2016/07/16/22.12.3025.DC1
Access the most recent supplemental material at:
Cited articles
http://clincancerres.aacrjournals.org/content/22/12/3025.full#ref-list-1
This article cites 45 articles, 13 of which you can access for free at:
Citing articles
http://clincancerres.aacrjournals.org/content/22/12/3025.full#related-urls
This article has been cited by 4 HighWire-hosted articles. Access the articles at:
E-mail alerts related to this article or journal.Sign up to receive free email-alerts
Subscriptions
Reprints and
To order reprints of this article or to subscribe to the journal, contact the AACR Publications Department at
Permissions
Rightslink site. Click on "Request Permissions" which will take you to the Copyright Clearance Center's (CCC)
.http://clincancerres.aacrjournals.org/content/22/12/3025To request permission to re-use all or part of this article, use this link
on May 29, 2018. © 2016 American Association for Cancer Research. clincancerres.aacrjournals.org Downloaded from