Embed Size (px)
Citation preview
Neighborhood Early Warning System (NEWS)
Tanisha Anderson, Nellie Becker, Julie Darnton, & Yong-Jun Shin
Community and Economic Development Program Policy Report • 2004
Community and Economic Development Program, School for Planning, Design, and Construction
Michigan State University
Neighborhood Early Warning System (NEWS) TABLE OF CONTENTS
Definition of the Problem 2 Methods of Analysis 5 Review of the literature 5 Programs Identified 5 Website Analysis 5 Interviews with Key Informants 5 Website Analysis and Evaluation 6 Quality of Information 6 Ease of Use 6 Accessibility 6 Table 1: Website Evaluation: Scaled Assessment 7 Other Assessments 7 Data Compiled 8 Users of Data 8 Tracks Users 8 How Data is Compiled & Number of Data Providers 8 Funders 8 Maps 9 Is it NEWS? 9 Table 2: Website Evaluation: Program Characteristics 9 Case Studies 10 Baltimore 10 Minneapolis 15 Los Angeles 19 Recommendations 24 1. Scale 25 Figure 1: An Illustration of Scale 26 2. Scope 27 Figure 2: An Illustration of Scope 27 3. Budgeting and Operating Costs 27 4. Locations 28 5. Technology Needed 28 6. Policies and Data Gathering 28 7. Accessibility 28 Conclusion 29 Appendices Appendix A: Webpages from Baltimore, Minneapolis, and Los Angeles 31 Appendix B: Contact Information 34 Appendix C: Funding Sources 35 Appendix D: Description of Acronyms 37

Neighborhood Early Warning Systems (NEWS)
By Tamisha Anderson, Nellie Becker, Julie Darnton, & Yong-Jun Shin
Definition of the Problem The Michigan Land Use Leadership
Council (MLULC) Report outlines the need for a Neighborhood Early Warning System as a means of controlling urban blight. The neighborhood early warning system is mentioned as part of the Recommendations section of Chapter 4 of the report (“Principles and Recommendations for Urban Revitalization”), recommendation #3 under the heading of “Public/Private Support for Livable Communities”:
3. The state should support public and private efforts to create and maintain “livable” urban areas where people want to live, work, invest and grow a business, learn, shop, and recreate and where there is a range of equitable housing options for all income levels by:
c) Encouraging efforts to control urban blight through:
(1) Determining the applicability of neighborhood early warning information systems used in other states to address blight in Michigan urban areas and funding demonstration projects that apply the principles of programs identified as successful1
In the process of investigating “programs in other states,” we sought information through Internet searching and to find out where these programs were located. The MLULC
1 Michigan Land Use Leadership Council Report found on the Internet at: http://www.michiganlanduse.org/finalreport.htm
Report does not answer two very important questions: What is meant by blight? And What is a Neighborhood Early Warning System? Blight
Urban blight can be defined in many ways. Use of an Internet search engine offers some different ideas about blight. It is a term that is understood in common sense terms but rarely adequately defined. Communities that are seeking to reduce the number of billboards and the proliferation of outdoor advertising cite “blight” as their major concern. One must be careful to specify “urban blight” because blight is also an agricultural term, which connotes disease, i.e. potato blight. Some might call areas that have “some negative financial impact on adjoining property or on a neighborhood because it is dangerous, vacant, or out of use.”2 Legal definitions also exist, such as this definition of blight or blighted areas from the Mississippi Code of 1972:
“‘Blighted area’ shall mean an area which by reason of the presence of a substantial number of slum deteriorated or deteriorating structures, predominance of defective or inadequate street layout, faulty lot layout in relation to size, adequacy accessibility or usefulness, unsanitary or unsafe conditions, deterioration of site or other improvements, diversity of ownership, tax or special assessment delinquency exceeding the
2 From article “Fighting Blight or Trashing Property Rights” found at: http://www.mackinac.org/article.asp?ID=3538
Michigan State University Community and Economic Development Program 2004 Policy Report 1801 W. Main Street, Lansing, MI 48915 www.cedp.msu.edu
2

fair value of the land, defective or unusual conditions of title, or the existence of conditions which endanger life or property by fire and other causes, or any combination of such factors, substantially impairs or arrests the sound growth of a municipality, retards the provision of housing accommodations or constitutes an economic or social liability and is a menace to the public health, safety, morals or welfare in it present condition and use.” 3
This definition is remarkably thorough and covers divergent symptoms of urban decay. Overall, it defines areas as blighted in relation to deterioration and inadequacy, characterized by unsanitary or unsafe conditions for inhabitants, as harmful to the economic or social structure of an area, and as a public menace.
The designation of a property as “blighted” carries some additional implications. Traditionally, that description was used to designate areas for urban renewal. Using the “right of eminent domain” the government could decide the fate of blighted property. Property condemned as blighted could then be demolished and cleared to make way for new development.4 Early city planners knew the importance of healthy communities that were free from blight. Poor planning of urban areas can lead to blighted properties with negative effects on the surrounding neighborhood. This blight leads to problems of public health and safety, compromises the
3 From the Mississippi Code of 1972 SEC 45-35-3 Definitions. Found online at: http://mscode.com/free/statutes/43/035/0003.htm 4 From “blight and eminent domain” found at: http://www.columbia.edu/itc/architecture/bass/newrochelle/extra/emin_dom.html
general welfare of the residents and can hamper future development in the area.5
Michigan has its share of blighted areas. The core cities of Michigan such as Detroit, Flint, Saginaw, Lansing, Grand Rapids, Pontiac, as well as smaller cities and inner ring suburbs around the state, have areas that might fit parts of the definition of blight. The US Census of 2000 reports that 82.2% of the population of Michigan lives inside the metropolitan areas of the state.6 Urban blight affects people throughout a metropolitan area. Whether if affects people individually is subjective, but many communities are affected by reduced economic activity in and around blighted areas. It is not difficult to see that blight becomes a “push factor” adding to the continuing sprawl of urban areas. A brief examination of mobility literature informs us that pressures to move such as low satisfaction with neighborhood quality, neighborhood safety and housing quality as well as employment decisions can be offset by ties to the community, improved neighborhood quality and better housing amenities.7 NEW Systems can be an effective tool to target resources to fight blight in specific areas before too much disinvestment occurs.
5 From Bettman (ed) (1946) “Brief in Euclid Zoning Case” pp. 174-176 of City and Regional Planning Papers Harvard City Planning Studies XIII 6 Census data from http://factfinder.census.gov. The percentage was found by dividing the total population inside metropolitan areas by the total population of Michigan. 7 Kirschenbaum, Alan. (1983). Sources of Neighborhood Residential Change: A micro-level Analysis. Social Indicators Research, 12, 183-198.
Michigan State University Community and Economic Development Program 2004 Policy Report 1801 W. Main Street, Lansing, MI 48915 www.cedp.msu.edu
3

Neighborhood Early Warning System (NEWS)
Neighborhood Early Warning System (NEWS) is not a warning system in the sense of an alarm system. There are no flashing lights or areas that are automatically brought to the users’ attention through a “warning”. We have also found similar “early warning systems” have begun appearing as a part of efforts to address terror threats and homeland security. This is not what a neighborhood early warning system is designed to do. The Neighborhood Knowledge Los Angeles site explains the rational behind NEWS:
“Some time before neighborhoods and buildings decay physically, they decay financially. Due to financial problems or ill intentions, property owners may stop paying property taxes, utilities, or other bills before their properties become actual neighborhood problems.”8
A site found for a proposal by CURA at
University of Minnesota described the process: “Emerging network technologies have combined city and county property related data -- value, condition, ownership, tax status, etc. -- into what have been called Neighborhood Early Warning Systems (NEWS).”9 Through our investigation of similar projects we interviewed Peter Haas, the administrator of the Center for Neighborhood Technology’s (CNT) Chicago NEWS site, who gave us insight into the history of the Chicago system. Our research indicates that this is the first Neighborhood Early Warning System in the
8http://nkla.sppsr.ucla.edu/Master.cfm?Page=Introduction/main.cfm 9http://freenet.msp.mn.us/city/nbhd-tc/1999/9903/0028.html
country. Mr. Haas explained that in the late 1980s a task force was established to address housing abandonment. Citizens in Chicago were interested in stopping the demolition of homes in their neighborhood but had difficulty tracking down all of the information that was necessary to take action. The Freedom of Information Act of 1966 ensures that citizens will have access to public records at their cost. The concerned citizens however, found it difficult to get all the information needed because they would have make separate requests at each office that collected data, and there was no way to know what properties were at risk before they were slated for demolition. CNT sought to make this process easier by providing a database where all of the information was compiled. This was later made available on the Internet. 10
There are many websites that provide information on communities and neighborhoods. What distinguishes Neighborhood Early Warning Systems from data democratization websites is the inclusion of property specific data that would help users track disinvestment and decline. This data includes: delinquent payments on the property—tax and water liens, records of code violations or inspections, building permits, fires, tax sales, and data about ownership of the property. NEWS websites allow users to search for specific properties—either as a way of checking on problem properties or as a way of empowering tenants to keep an eye on their landlords. Users of NEWS can also search for defined neighborhood areas to monitor these effects in their community.
10From Interview with Peter Haas of CNT via phone 9/18/03 5:00pm EST
Michigan State University Community and Economic Development Program 2004 Policy Report 1801 W. Main Street, Lansing, MI 48915 www.cedp.msu.edu
4

Method of Analysis Review of Literature – The Search for NEWS programs
An initial search for examples of NEWS programs was conducted to gather a more accurate picture of the variety of programs that are in use across the United States. The first attempt at searching for a true Neighborhood Early Warning System resulted in little success. The search was then expanded to include programs that appear to be similar to a true Neighborhood Early Warning System, such as programs that are internet based, contain large amounts of neighborhood data on a particular locale, and are useful to the community and its members.
After expanding the search to include NEWS-similar types of programs, a list of specific cities was chosen, and their programs further examined. Eight cities were highlighted, each with a slightly different program in place. Web site assessments were completed for each of the eight programs. From the website assessments, three “model” programs were chosen to be further assessed, specifically for the relevance of each of these programs for implementation in the state of Michigan. Programs Identified
A Website Assessment was completed for the following seven U.S. cities/metropolitan areas. The titles of the programs assessed are also listed.
Cleveland, OH CleveInfo
New Orleans, LA Greater New Orleans Community Data Center
Chicago, IL Chicago Information Technology – (CITy │News)
Los Angeles, CA Neighborhood Knowledge Los Angeles (NKLA)
Baltimore, MD The Alliance
Minneapolis, MN Minneapolis Neighborhood Information System (MNIS)
Providence, RI The Providence Plan – Neighborhood Profiles
Website Analysis
Website analysis was conducted to help better understand characteristics of a particular city’s program. This information will help to determine if a similar program is suitable for the state of Michigan. The eight previously mentioned programs have websites that were analyzed. The data gathered from the websites has been put into a chart for quick assessment. Two methods of analysis were used to determine the effectiveness of each program: a scaled assessment system, which evaluates the website on quantity of information, ease of use, accessibility; and an informative/descriptive assessment which evaluates the NEWS program based on key characteristics such as the types of data compiled, and the users of the system. The three cities used in the case study were chosen based on their results from this analysis (see Table 1 next page). Interviews with Key Informants
A major data collecting tool that was useful in gathering specific information about NEWS programs is interviews with key informants. Contacts were established based on the websites that were most like a Neighborhood Early Warning System. Email and telephone interviews were the primary mode of contact. The contacts for
Michigan State University Community and Economic Development Program 2004 Policy Report 1801 W. Main Street, Lansing, MI 48915 www.cedp.msu.edu
5

the Baltimore, Los Angeles, and Minneapolis programs were asked questions during the interviews on topics such as: history of the program, staffing, funding, how the information for the system is gathered, and who uses the program. The interview questions were based upon the six key elements outlined in the Case Study (see case study, p. 10). Website Analysis and Evaluation
The first half of the website analysis involves a scaled assessment on three criteria: Quantity of Information, Ease of Use, and Accessibility. These items are assessed on a scale of 1-4, with 1 being the highest/best rating and 4 being the lowest/worst rating. Each city is rated independent of one another, meaning more than one city can have the same rating. Quantity of Information
This element of the website analysis is concerned with the amount of information available to the user. For instance, a website with an excellent rating would have numerous statistics for the type of data being examined. Often the data is further broken down into subsections. Examples of subsections for the “Housing” category may be: building permits, demolition permits, and houses with code violations. Some sites had more subsection data available, and this is reflected in the score for this category. Ease of Use
This category refers to how easily the website is to operate. For instance, are clear instructions given to fine the data you want? Can a person of all computer skill levels navigate the site? Is the data displayed in a manner that is easy to interpret? All of these
types of issues are assessed in the “Ease of Use” category. Accessibility
This section of the website assessment deals specifically with the ability for people to have access to the site, providing that they have Internet access. Once the website is displayed, can a first-time user get data results? The biggest obstacles to accessibility are requirements such as “membership” or “log-ins”. Some cities have programs that require the user to be a member in their program. Others require a free user-name and password log-in requirement, which is available to the user after registration. The programs that scored the highest in this category were sites that anyone could extract data from, regardless of their residency or membership with a particular organization. For example, a person in Michigan could research and find data for New Orleans, Louisiana in just a few steps on the Internet11.
11 From New Orleans website: http://www.gnocdc.org/index.html
Michigan State University Community and Economic Development Program 2004 Policy Report 1801 W. Main Street, Lansing, MI 48915 www.cedp.msu.edu
6

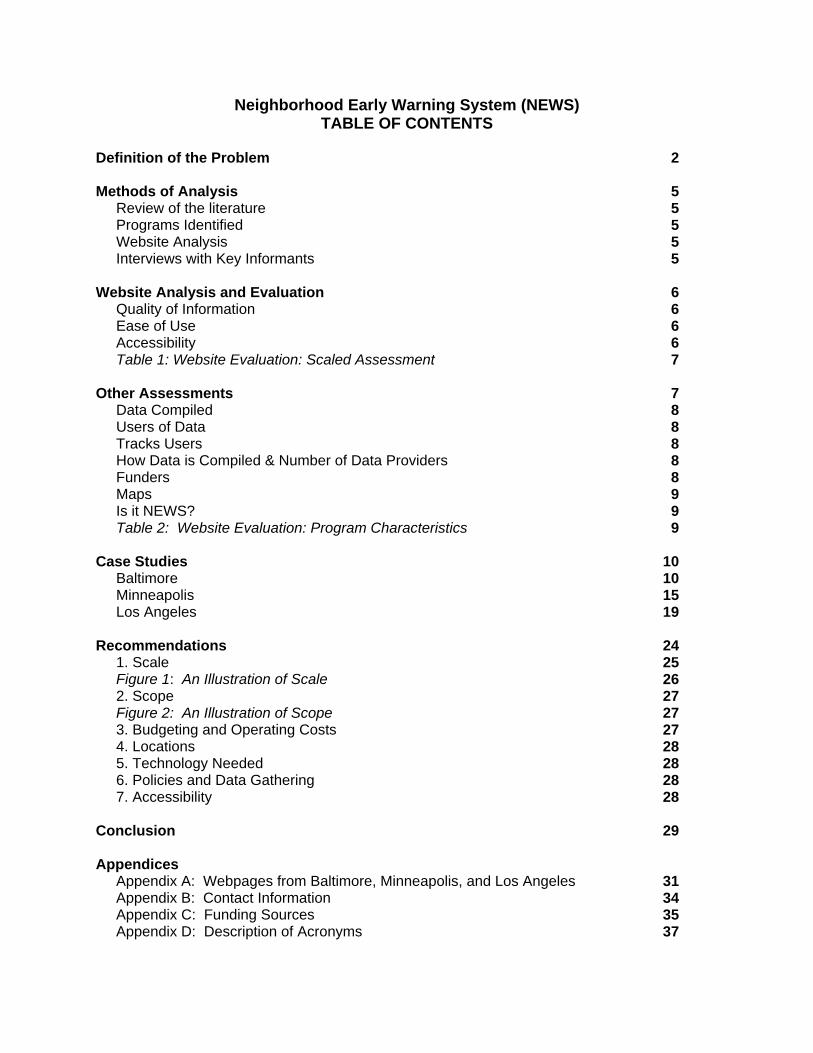
Table 1: Website Evaluation: Scaled Assessment
Quantity of Info Ease of Use Accessibility Cleveland 1 2 1 New Orleans 2 1 1 Scale of 1 - 4 Chicago 2 1 1 1 Excellent Los Angeles 1 1 2 2 Good Baltimore 1 1 1 3 Fair Minneapolis n/a n/a 4 4 Poor Providence 2 1 1 n/a Note: Due to lack of access granted (during available research time) the Minneapolis site was not able to be personally evaluated.
Table 1 represents the initial website evaluation for seven cities that have a NEWS-type
program. The results were tabulated based upon exclusively upon experience with the websites; additional data is not assessed at this point. Assessments scores are independent of each program, which can result in cities have similar scores.
The scores for Table 1 are a good indication of how user-friendly and informative the Neighborhood Early Warning System program should be for that particular city. The programs with plenty of information available are Cleveland, Los Angeles, and Baltimore. Los Angeles and Baltimore programs have websites that are easily navigable.
When analyzing the “Accessibility” category, it is important to note that a score of 1 [excellent] may not be what all programs are striving for. Los Angeles requires registration for user names and passwords, which may be helpful for security of the site as well as tracking who uses the system.
The Minneapolis system received a poor
score for accessibility due to the fact that a user of the system must be a part of a Minneapolis neighborhood organization, pay a moderate fee, or have special permission to access the site. Throughout the research process, despite multiple attempts, website access was not granted for this particular program. Other Assessments
The second half of the website analysis is concerned with more website specific
factors that are not assessable using the 1-4 ranking system. There are a couple of reasons for this; each program has its own specific focus, giving it a variety of characteristics that are not necessarily comparable to other programs. Also, the quantity of data, funding, or data providers is not the focus for Table 2. Table 2 is useful for examining the particular characteristics of the program and website. It should give a basic understanding of the scope of the program, the financial supporters, and users of system. The characteristics that have been
Michigan State University Community and Economic Development Program 2004 Policy Report 1801 W. Main Street, Lansing, MI 48915 www.cedp.msu.edu
7

examined are: Data Compiled, Users of Data, Tracks Users, How Data is Compiled, Number of Data Providers, and Funding. Each of these categories was examined to determine exactly what type of NEWS system would be most appropriate for Michigan. Data Compiled
This category is used to describe exactly what type of data can be found on the site. A Neighborhood Early Warning System is a program that is designed to include a variety of data, and most cities use the data they feel would give them the most accurate assessment of their neighborhoods. The most common kinds of data being used were divided into five data types. Housing includes basic data such as number of houses, type of houses, condition, values, and also related information such as building permits and housing code violations. Economic Indicators describes data such as median income (broken into various demographic groups), business establishment information, and tax data. Social Indicators are any type of data that includes crime, health issues, and education (although it is possible to find education statistics in economic data as well). Demographic data is primarily U.S. Census based, and includes population figures, statistics on race, age, and gender. Data that does not necessarily fit any of the previous four categories is listed as “Other.” Users of Data
This category describes the types of people that are using the program. Neighborhood Organizations are the first type of group mentioned by most of these websites. Other types of program users are Government employees; those conducting
Research (on an individual level or for a group); Students, usually at the university level; and the General Public. Registered users are those that either need to be a member of the program or log-in using a username and password, as described in the Accessibility category (see page 6). Tracks Users
This category is simply identifying those programs that have the ability to know exactly who is using their system. Los Angeles is the only program to have a formal tracking system, through a log-in. There are other ways for the program to track the users, but these are in the form of voluntary “feedback” system such as emails. How Data is Compiled and Number of Data Providers
These two related categories discuss, in general, where the program is getting their statistical data, and from how many different sources. Some programs rely heavily on the U.S. Census, while others collect primary data which may not be available anywhere else in that form, such as location of dirty alleys or nearest supermarkets. Funding
This section categorizes the types of funding the program is using. Initial start-up cost, payroll for staff, website design and data updating are all expenses that are paid for by various types of funding. Grants are the primary form of funding. Federal Government, State Government, and City/Local Governments can supply funding in the form of grants. Independent, for-profit organizations include money that is donated to the program from (mostly local) businesses. Non-profit groups also donate money to NEWS programs. In some cases,
Michigan State University Community and Economic Development Program 2004 Policy Report 1801 W. Main Street, Lansing, MI 48915 www.cedp.msu.edu
8

the program is designed with support from local colleges or universities. These programs may receive what is noted as “University funds”. Maps
This category states if the website uses a mapping component. Usually the maps are designed to identify the area that is being examined. They can also be used to show the results of data searches, for instance, mapping where day care centers are in a specific neighborhood.
Is It NEWS? This column states whether or not the
program has positively identified itself as being a true Neighborhood Early Warning System. As mentioned earlier, not all programs are described as NEWS, but are very similar type of programs currently in use. This assessment is based on information provided either on the website or via contacts. It is not our own person assessment of the program.
Table 2: Website Evaluation: Program Characteristics
Data
Complied Users of
Data Tracks Users
How Data is
Compiled
Number of Data
Providers Funding Maps Is It
NEWS? Cleveland HESDO NGSRP NO G 20+ FCN YES NO New Orleans HESDO NGSRP NO GN 7 FNU YES NO Chicago H n/a NO G 7 N NO YES Los Angeles HDO Reg YES GP 8 FCINU YES YES Baltimore HESDO NGSRP NO GNP 16 FSCINU YES NO Minneapolis H Reg NO GN 5 FNU YES NO Providence HESD NGSRP NO G 1 FSCINU YES NO Data Compiled Users of Data How Data is Complied H = Housing N = Neighborhood Organization G = Government based E = Economic Indicators G = Government N = Non-Profits S = Social Indicators S = Students P = Program (primary) D = Demographics R = Research Collected Data O = Other data P = General Public Reg = Registered Users Only Is It NEWS? Funding -Based Upon Own Program F= Federal Government I = Independent For Profit Corporation Description S = State Government N = Independent Non-profit Group C = City/local Government U = University Funds
Michigan State University Community and Economic Development Program 2004 Policy Report 1801 W. Main Street, Lansing, MI 48915 www.cedp.msu.edu
9

As shown in Table 2, programs can thrive with a variety of resources. Case Studies were chosen for programs that intrigued further investigation; perhaps one of these programs is what is appropriate for Michigan. The Baltimore, Minneapolis, and Los Angeles programs were chosen as case studies. Each was chosen for different reasons. Baltimore was chosen due to the high scores noted on Table 1, and its use of multiple sources of data and funding noted on Table 2. The Baltimore program did not identify itself as a NEWS program, however. The Los Angeles program is NEWS by its own definition, only 2 programs have noted so (Table 2). They also have a variety of funding and a great mapping system on its website, making it an additional choice for further study. Minneapolis was chosen as a case study because of its uniqueness. It has a very specific scope (“Data Compiled”, Table 2) and a thorough registration process. This program seems to have been created for very specific reasons, which warrants further investigation.
Case Study
Three programs were selected from the initial eight to be the basis of a case study. Baltimore, Los Angeles, and Minneapolis were programs that were most suitable for further study. The case study involves a more in-depth examination of the program, its design, and success. Six key elements were examined for each case study:
• History/Overview of the program • Users/Tracking • Data sources and Updating • Funding and Staffing
• Design/Layout and I.T. Infrastructure
• Limitations Case Study: Baltimore Baltimore Neighborhood Indicators Alliance: http://www.bnia.org/ Overview of BNIA
BNIA consists of diverse groups from city agencies, community organizations, businesses, educational institutions, nonprofit organizations to residents. The Alliance builds on and coordinates the related work of citywide nonprofit organizations, city and state government, neighborhoods, foundations, businesses and universities to support and strengthen the principle and practice of well informed decision making for change toward strong neighborhoods and a thriving city by providing accessible data and information.12
While each affiliated organization continues in its own way to promote this principle, their work is coordinated and mobilized through involvement with the Alliance to move this principle forward in a more comprehensive and powerful away focusing on supporting neighborhood improvement and serving the neighborhoods of Baltimore City.13
In 1998, the Annie E. Casey Foundation approached the Association of Baltimore Area Grantmakers (ABAG) to explore the interest in Baltimore for developing a neighborhood indicators initiative, mirroring those in other cities across the country involved in the National Neighborhood Indicators Partnership.
12 http://www.bnia.org/about/index.html 13 http://www.bnia.org/about/index.html
Michigan State University Community and Economic Development Program 2004 Policy Report 1801 W. Main Street, Lansing, MI 48915 www.cedp.msu.edu
10

That initial exploration lead to a year-long planning process resulting in the gathering of several citywide nonprofit groups, neighborhoods, foundations and city government who created the Alliance. These founders hired the Alliance's current director in June of 2000 to implement the initiative.
Since that time, the Alliance has grown to coordinate, mobilize and build on the work of many additional groups and organizations, many of whom are highlighted throughout the Alliance's first publication - the Vital Signs for Baltimore Neighborhoods Report, and include the endorsers and participants in the Baltimore Neighborhood Vital Signs Project.14
Users/Target Population
The Alliance as a partner in the National Neighborhood Indicators Partnership (NNIP), which is a collaborative effort by the Urban Institute and local partners to further the development and use of neighborhood information systems in local policymaking and community, built in late 1996, and funded jointly by the Annie E. Casey and Rockefeller Foundations, 15
fosters the democratization of information concentrating on facilitating the direct practical use of data by city and community leaders. The Alliance shares with partner cities lessons learned, successes, and strive to establish a core set of neighborhood indicators across the country to help understand the conditions in our neighborhoods. The Alliance currently displays data only within the boundaries of the city of Baltimore.16 However, the user is anyone who can use the website.
14 http://www.bnia.org/about/index.html 15 http://www.urban.org/nnip/about.html 16 http://www.bnia.org/about/index.html
Data Sources and Updating The data consist of each neighborhood
cluster of demographics; household and family, income and poverty; labor force and educational attainment; occupation; welfare; housing city service requests; youth participation; children and families; neighborhood economic development/workforce development; community based; education; health; transportation; public safety, crime and violence; environment; libraries; cultural-city centers; recreation; community initiatives; family support; major grocery stores; major pharmacies; banks; post offices; recycling drop-off centers; political statistical boundaries.17
Five Community Statistical Areas are clusters of Baltimore neighborhoods created along census tracts, since statistical data is generally only available at this level. This clustering was necessary for the creation of statistical profiles, since most of the 260 neighborhoods in Baltimore City do not have boundaries that fall along census tracts. These boundaries were created for display purposes only, and should not be confused with neighborhood boundaries designated by the Baltimore City Planning Department or the neighborhoods themselves.18
The site also includes a wealth of information such as (1) Percent of all businesses that are more than four years old with 50 employees or less in 2001, (2) Number of people entering drug treatment in 2001, (3) Racial Diversity Index-2000, and (4) Number of inmates in state prisons in Baltimore City in 2002, etc.
There are 16 data provider partners in 2003: Baltimore City CitiStat Program,
17 http://www.bnia.org/data/inventory.html 18 http://www.bnia.org/data/index.html
Michigan State University Community and Economic Development Program 2004 Policy Report 1801 W. Main Street, Lansing, MI 48915 www.cedp.msu.edu
11

Baltimore City Department of Planning, Baltimore City Department of Housing and Community Development, Baltimore City Geographic Information Systems (GIS) Enterprise Group, Baltimore City Health Department, Baltimore City Police Department, Baltimore Ecosystem Study (BES), Baltimore Metropolitan Council (BMC), Baltimore City Data Collaborative, Empower Baltimore Management Corporation, Governor's Office of Children, Youth, and Families (OCYF), Maryland State Department of Planning-State Data Center, Mayor's Office of Information Technology, Parks & People Foundation, Regional Information Center, and University of Baltimore-Jacob France Institute.19
Several entities worked to develop this map, and continue to use it for their work. The Data Collaborative is one example. Each of the data provider partners has in-house methods to verify their own data. Alliance staff also checks data items and are extremely careful to properly document any errors or additional considerations for each data item.20
The Alliance and the organizations involved use Geographic Information Systems (GIS) technology to create maps that display the data on a variety of levels, including census block group and census tract levels. It is a powerful tool that planners, architects, and others have used in their respective fields that the Alliance staff brings to neighborhoods.21 Items are updated in the "One Stop Shop" every few months. Data items are updated in accordance with the normal data collection and processing schedule designated by each data provider
19 http://www.bnia.org/about/workgroups.html
20 http://www.bnia.org/faq.html 21 http://www.bnia.org/faq.html
partner. The Data Inventory includes information about when each data item is updated. In sum, through this website, the user can:22
• Access data about Baltimore and its neighborhoods. The "One Stop Shop" for Baltimore neighborhood data is available on this website and in the Alliance office. Data are displayed in a user friendly, accessible way using the latest in GIS mapping technology. Data are available to neighborhood groups and their partners about neighborhood conditions in Baltimore.
• Access training on understanding and using data and indicators strategically and effectively through the Alliance's Technical Assistance and Training Strategy.
• Access more information about the Baltimore's Neighborhood Vital Signs, outcome-based indicators to measure progress toward a shared vision and outcomes for strong neighborhoods and a thriving, vital city and download the baseline report, or starting point, from which the Alliance will measure the ups and downs (trends) of our neighborhoods' Vital Signs, enabling us, as a city of neighborhoods, to celebrate the success, learn from the failures and hold one another accountable for the efforts to rejuvenate the city.23
22 http://www.bnia.org/about/index.html 23 http://www.bnia.org/vitalsigns/index.html
Michigan State University Community and Economic Development Program 2004 Policy Report 1801 W. Main Street, Lansing, MI 48915 www.cedp.msu.edu
12

Funding and Staffing The budget for the whole site per year is
$350,000 that includes staff, technology and the Vital Signs Project. The donations from partners that provide technical assistance on specific projects the budget would be more like $500,000-$750,000. They accept no funding from the city or state governments to maintain their independence and also because of the negative profile of government in Baltimore.24
There are specific organizations that invest time and energy into the development of the Alliance's work. Each serves on one or more of our working groups - the Coordinating Committee, the Vital Signs Steering Committee, the Technical Assistance and Training Work Group, Data Providers, and Access Points. More than 250 neighborhoods, nonprofits, businesses and business groups, city agencies, policy makers, and others have signed on to support the Vital Signs, expressing their desire and support for making decisions to ensure the Vital Signs move in the right direction over time.25
• Director: As Director, Ms. Ramos coordinates and manages the work of the Alliance partner organizations to develop, implement and maintain the comprehensive resources the Alliance provides. As Director, Ms. Ramos initiates and oversees the various projects in which the Alliance is currently engaged. Ms. Ramos also fundraises; writes reports; hires and supervises staff, interns and consultants; assists with data acquisition and interpretation;
24 Phone interview by Julia A. Darnton with Ms. Odette T. Ramos December 3, 2003 at 9:17am EDT 25 http://www.bnia.org/about/workgroups.html
develops budget and maintains internal accounting, works with the Coordinating Committee, initiates and maintains strategic partnerships, staffs the Alliance Work Groups, and in general mobilizes the Alliance partners to work together.
• GIS/Data Manager and Analyst: Mr. Armstrong manages the GIS mapping system, coordinates and develops the enhancements of the mapping system, supervises the IT/data interns and maintains the Alliance website. He works with and coordinates the efforts of the Alliance's Data Provider Partners, as well as performs and coordinates data analysis for the Alliance's initiatives including the Vital Signs Project, assists in data acquisition, and fulfills individual data or service requests from partners and community members.
• Administrative Assistant: Ms. Daniel manages the Alliance office, supports the Alliance staff, coordinates meetings and events, works one-on-one with individuals, acts as a troubleshooter, and works on a variety of projects.
Information Technology Infrastructure and System Design
The software that BNIA uses for the interactive mapping is an ESRI program—ArcGIS 8.0 and they will soon be upgrading to ArcIMS to provide more data for people. The Alliance was using something called Axiom Map to start. This helped them to introduce GIS data to Baltimore and to get residents excited about what BNIA had to offer. They do not operate their own server. The Alliance has a dedicated server that is
Michigan State University Community and Economic Development Program 2004 Policy Report 1801 W. Main Street, Lansing, MI 48915 www.cedp.msu.edu
13

theirs through a contracted company. The security of the server is better, and they have the technical know-how to keep the system operating. BNIA also benefits from cost sharing by having the server in a different company.26
The data come from the city and are based on incidents that are confirmed by the city. They use a base map from the city that includes some assets in the city such as schools and libraries, but they have created data of pharmacies and grocery stores in their office. The Alliance confirmed the locations of these stores from the Yellow Pages.27
BNIA does not have parcel level data and are legally prevented from doing this. They do not need the legal trouble that comes with parcel data and that data at this level are suspect because it is based on dated information. The Alliance does not have volunteers but rely on their partners to get much of their information. Occasionally, they have interns that do specific work for them, but it is difficult to get volunteer staff because the project demands highly specific technical skills. They get some assistance from local colleges/universities: especially Towson University and the University of Maryland Baltimore County Urban Planning Department if they have skills in GIS.28
The "One Stop Shop" for data provides data about Baltimore and its neighborhoods in a user-friendly way. It is available through the Alliance office and on this
26 Phone interview by Julia A. Darnton with Ms. Odette T. Ramos December 3, 2003 at 9:17am EDT 27 Phone interview by Julia A. Darnton with Ms. Odette T. Ramos December 3, 2003 at 9:17am EDT 28 Phone interview by Julia A. Darnton with Ms. Odette T. Ramos December 3, 2003 at 9:17am EDT
website using an innovative interactive mapping tool. Access Points throughout the city are established in order to provide greater access to the Alliance's resources for those who do not have internet access or need assistance in using them. These Access Points currently include the public branch libraries, some community centers, and some job training centers.29
Technical Assistance and Training Strategy offers training on accessing, understanding, and using data, indicators, and the Vital Signs to enhance long-term neighborhood improvement efforts. This strategy implements a one-of-a-kind curriculum through the much training the Alliance provides. Participants come to understand what data and indicators are, how to interpret what data show, and how to use data, indicators and the Vital Signs effectively to make well informed decisions about goals and priorities, strategic policy changes, community building and organizing activities, and planning toward long-term neighborhood improvement. Trainings are delivered through 4 main avenues at local technology centers 4 times a year. Workshops integrated into current community building, organizing, and leadership trainings such as the Citizens Planning and Housing Association's (CPHA) Leadership Institute and Citizen Action Days, the Baltimore Neighborhood Collaborative, and Morgan State University's Urban Research Institute, and others. The curriculum contains workshops and activities that can be tailored to a variety of audiences and skill levels, and adapted to fit the goals and interests of the audience.30
29 http://www.bnia.org/about/index.html 30 http://www.bnia.org/training/index.html
Michigan State University Community and Economic Development Program 2004 Policy Report 1801 W. Main Street, Lansing, MI 48915 www.cedp.msu.edu
14

In addition, there are 9 technical assistance and training groups in 2003: Baltimore City Department of Planning, Baltimore Neighborhood Collaborative, Cherry Hill 2000, Citizens Planning and Housing Association, East Baltimore Data Group, Maryland Center for Community Development, Morgan State University Center for Community Development, Institute for Urban Research, Neighborhood Design Center (NDC), and University of Maryland at College Park Urban Studies and Planning Department.31
Limitations
Most of all, BNIA has an advantage of providing the data for the residents who don’t have computer-access by using access points to distribute the resources. In addition, it is easy to access much information via the web-site by providing such graphic information as interactive mapping system. However, it is difficult to evaluate whether BNIA, as a neighborhood early warning system, affects to prevent urban blight. If BNIA develops a self-evaluation system, it will help them polish their services to a great extent.
Case Study: Minneapolis Minneapolis Neighborhood Information Systems: http://www.npcr.org/MNIS.html
Initiated in 1999, the Minneapolis
Neighborhood Information System (MNIS) was originally conceived as an early warning system that would predict and prevent housing abandonment by tracking key indicators, such as: unpaid taxes,
31 http://www.bnia.org/about/workgroups.html
housing code violations and delinquent utility bills.32 It was believed that the collection of this data would allow neighborhood organization critical time to intervene before a family could lose their home.33
Although the concept of a Neighborhood Early Warning System continues to be a visible goal of MNIS, the program has shifted its focus to the application of geographic information systems (GIS) for community revitalization.34 Currently, the program does not have a functional Early Warning System application, however, it is one of the City of Minneapolis’ project goals that it hopes to release via the Internet sometime early in 2004.35
It is the goal of Minneapolis Neighborhood Information Systems to improve relationships between neighborhoods and city staff through neighborhood involvement in project development and data quality measures.36 They are striving to bring neighborhood organizations together to share ideas and experiences in regards to data, mapping, and GIS.37 The program wants to provide a tool that can be used to better inform housing strategies, plans, and evaluations.38 Additionally, MNIS wants to make their system an integral part of neighborhood organizations’ day-to-day work practices.39
The Minneapolis Neighborhood Information System is a collaborative
32 http://www.cura.umn.edu/programs/MNIS.html 33 http://www.cura.umn.edu/programs/MNIS.html 34 http://www.cura.umn.edu/programs/MNIS.html 35 From Interview with Jeff Matson, of Minneapolis Neighborhood Information System of the University of Minnesota via email (Nov 12, 2003) 36 http://www.npcr.org/MNIS.html 37 http://www.npcr.org/MNIS.html 38 http://www.npcr.org/MNIS.html 39 http://www.npcr.org/MNIS.html
Michigan State University Community and Economic Development Program 2004 Policy Report 1801 W. Main Street, Lansing, MI 48915 www.cedp.msu.edu
15

capacity-building effort intended to meet he needs of community-based organizations by providing access to property data that can inform community revitalization efforts and housing intervention and investment strategies. MNIS partners with the City of Minneapolis, the Neighborhood Revitalization Program, select Minneapolis neighborhood organizations, and the Center for Urban and Regional Affairs (CURA). Moreover, an academic consortium of nine colleges and universities within the city are involved in the NPCR (Neighborhood Planning For Community Revitalization) program.40
Minneapolis Neighborhood Information System requires an agreement with participating neighborhood organizations, which states41:
1. Active participation on the Steering Committee by a designated representative.
2. To contribute to the costs of MNIS. 3. Adoption of an "Acceptable Use
Agreement" for data developed by the Steering Committee.
4. Execution of a "Conditional Use License Agreement" with Hennepin County for electronic data provided by the County.
5. Commitment to develop the capacity of the organization's use of property data through participation in training and research projects.
6. Adoption of a board resolution authorizing participation in MNIS subject to these terms.
Target Population The objective of Minneapolis
Neighborhood Information Systems is to target neighborhood organizations and other
40 http://www.npcr.org/ 41 http://www.npcr.org/MNISneighagree.html
community non-profits. The use of the data download site is open to the public, but is more or less used by neighborhood organizations, city staff, and University researchers.42
Participating neighborhood groups receive training, project assistance, GIS expertise, and access to property information.43 The neighborhood organizations are provided the opportunity to share their ideas about GIS projects and housing strategies with other neighborhoods.44 MNIS deems neighborhood organizations as instrumental partners to the design, development, and implementation of its projects. Data Sources
Most of the data, for the city’s site, comes from the City Administrative Offices (planning, assessor, inspections). They provide data in a user-friendly format that allows for maximum use and functionality by neighborhood organizations.45 The program also makes us of the data collected by the U.S. Census Bureau. Additionally, site administrators have tried to obtain information from local police departments and school districts; however, they do not currently have a formal data sharing agreement with them.
Neighborhoods will be able to incorporate local data with city and county data, and produce maps of past and current housing programs, housing conditions, and areas at-risk. It is anticipated that these tools will allow neighborhood organizations
42 From Interview with Jeff Matson, of Minneapolis Neighborhood Information System of the University of Minnesota via email (Nov 12, 2003) 43 http://www.cura.umn.edu/programs/MNIS.html 44 http://www.npcr.org/MNIS.html 45 http://www.npcr.org/MNIS.html
Michigan State University Community and Economic Development Program 2004 Policy Report 1801 W. Main Street, Lansing, MI 48915 www.cedp.msu.edu
16

to track the health of their neighborhood’s housing supply and target resources and strategies for addressing housing deterioration problems accordingly. The tools provided are an attempt at assisting community organizations with community planning and the prevention of housing deterioration and abandonment. Funding / Staffing
The Minneapolis Neighborhood Information Systems is funded by a three-year grant, in the amount of $500k, from the Technology Opportunities Program (TOP), of the U.S. Department of Commerce.46 In addition, they have other organizations that contribute less than $10k per year, such as the Minneapolis Foundation, the University of Minnesota, and the Neighborhood Revitalization Program.47
The University, which acts as the project coordinator, devotes one full-time staff member and a few part-time graduate students.48 Also, the City of Minneapolis’ Information Technology Department has 3-4 people working on the project part-time, approximately 10 hours or less per week.49
Design Layout / IT Structure
The Internet technology structure, of the Minneapolis Neighborhood Information System, requires a web browser to get access to the data and view the NEWS, 46 From Interview with Jeff Matson, of Minneapolis Neighborhood Information System of the University of Minnesota via email (Nov 12, 2003) 47 From Interview with Jeff Matson, of Minneapolis Neighborhood Information System of the University of Minnesota via email (Nov 12, 2003) 48 From Interview with Jeff Matson, of Minneapolis Neighborhood Information System of the University of Minnesota via email (Nov 12, 2003) 49 From Interview with Jeff Matson, of Minneapolis Neighborhood Information System of the University of Minnesota via email (Nov 12, 2003)
when functional.50 Once the data is downloaded, GIS software (ArcGIS, ArcExplorer), or database software (Excel, Access) is required to make use of the data.51 Program administrators used technology grants to purchase computers and software for their twelve participating neighborhoods. They also purchased a large-format plotter for printing poster-size maps.52 Furthermore, the data from the site is synced nightly with city databases, which allows their users to access the data one day after city employees have entered it.53 Administrators are doing many things with the data collected, although they are doubtful that the data has a direct effect on blight at this time.54 Nevertheless, indirectly, they noted that much of the work that they perform: informing citizens, identifying opportunities for revitalization, tracking problem properties and empowering community organizations, combats blight.55 Strengths and Challenges
This project has the potential to change many aspects of how neighborhood
50 From Interview with Jeff Matson, of Minneapolis Neighborhood Information System of the University of Minnesota via email (Nov 12, 2003) 51 From Interview with Jeff Matson, of Minneapolis Neighborhood Information System of the University of Minnesota via email (Nov 12, 2003) 52 From Interview with Jeff Matson, of Minneapolis Neighborhood Information System of the University of Minnesota via email (Nov 12, 2003) 53 From Interview with Jeff Matson, of Minneapolis Neighborhood Information System of the University of Minnesota via email (Nov 12, 2003) 54 From Interview with Jeff Matson, of Minneapolis Neighborhood Information System of the University of Minnesota via email (Nov 12, 2003) 55 From Interview with Jeff Matson, of Minneapolis Neighborhood Information System of the University of Minnesota via email (Nov 12, 2003)
Michigan State University Community and Economic Development Program 2004 Policy Report 1801 W. Main Street, Lansing, MI 48915 www.cedp.msu.edu
17

organizations function.56 There can be many positive effects, such as neighborhoods having instant access to housed data, which saves time spent calling various city agencies.57 “Neighborhoods are also now starting to add powerful visual aids (maps) to reports, meetings, and other work activities that can have a great affect on their constituents and help explain neighborhood activities.”58 Some other benefits include, but are not limited to:
Benefits of Membership59
• Opportunity to be part of a nationally recognized and awarded research project focusing on partnerships, data sharing, and capacity building
• Participate in a results oriented project that seeks to become a tool that furthers the goals of neighborhood organizations
• Access to regularly updated property data from the City in an organized and user-friendly format
• Training and support in the use of data, GIS software, analysis, and map production for use in reports, plan evaluations, and meeting presentations
• GIS software purchased and installed by MNIS staff (cost approx. $1,200)
• Trainings/classes provided by MNIS ($300+ per year)
• Potential to attend local/national conferences ($500-$1,000)
56 http://www.npcr.org/MNISaccomplish.html 57 http://www.npcr.org/MNISaccomplish.html 58 http://www.npcr.org/MNISaccomplish.html 59 http://www.npcr.org/MNISmemcriteria.html
Benefits to Neighborhoods60
• Participants are part of a results oriented project which seeks to become a tool for furthering the goals of neighborhood organizations
• Access to regularly updated property data from the City in an organized and user-friendly format
• Training and support in the use of data, analysis techniques, map production, and GIS software
• Ability to add maps, charts, and tables to neighborhood reports, plan evaluations, and for presentations at meetings
• Ability to share experiences and project ideas with other Minneapolis neighborhoods
• Direct input on the design of cutting-edge software applications and access to technology which has the potential to change the way neighborhood organizations work
• Potential for training and access to City GIS applications
• Opportunity to partner in research projects involving University staff and students looking to study neighborhood issues
• Participating neighborhoods are also potentially able to receive the following
o Latest version of GIS software package ($1,200)
o Ability to attend local and national conferences ($500-1,000)
o Ability to attend University classes in GIS ($300-500)
However, this system does have some limitations. It has an extensive membership requirement, which can deter organizations from utilizing its services, such as:
60 http://www.npcr.org/MNISbenefits.html
Michigan State University Community and Economic Development Program 2004 Policy Report 1801 W. Main Street, Lansing, MI 48915 www.cedp.msu.edu
18

Membership Requirements61
• Neighborhood Board must annually pass a resolution authorizing participation in MNIS, which includes the following:
o Board and Staff have read and agreed to Acceptable Use Policy
o Authorize a representative and alternate to represent the organization on the MNIS the Steering Committee
o Above named representative shall report back to Board on MNIS activities
• Neighborhoods shall agree to contribute toward the costs of MNIS ($250/yr.) Original six neighborhoods exempt for next three years (2002-2004)
• Active participation at Steering Committee Meetings. Neighborhoods missing two consecutive meetings or three in a calendar year will not receive data/project assistance and will have to petition for reinstatement
• Neighborhoods must complete at least one project/map per quarter
• Neighborhoods shall file quarterly use report with MNIS coordinator
Expectations of Participating Neighborhoods62
• Active participation in capacity building efforts, which include:
o Attending training sessions o Developing GIS projects for
neighborhood use o Occasional attendance at city
meetings, conferences, and expositions to present, discuss, and/or display neighborhood GIS projects
61 http://www.npcr.org/MNISmemcriteria.html 62 http://www.npcr.org/MNISmemcriteria.html
• Participants will work towards incorporating MNIS in day-to-day work activities
This type of enforcement on participation can be seen as a positive, to those who have developed the program, because it ensures that neighborhood organizations take an active role in the fight against urban blight. However, it can also be viewed as a negative to the neighborhood organizations that may not have the funds or manpower to commit to this level of participation. Additionally, a limitation to the review of this website is the fact that it was unable to be accessed, which prevented viewing the type of data collected. Case Study: Los Angeles Neighborhood Knowledge Los Angeles: http://www.nkla.sppr.ucla.edu Overview and History of NKLA
The Neighborhood Knowledge Los Angeles (NKLA) website is a comprehensive information site for the City of Los Angeles that is “dedicated to helping prevent housing and neighborhood conditions from deteriorating.” Established in 1995, NKLA has continued to evolve to meet the growing need for information about property and housing conditions in the city of Los Angeles. The website is currently supported by the Advanced Policy Institute (API) which is a part of the School of Public Policy and Social Research at the University of California at Los Angeles (UCLA). “NKLA has benefited greatly from its association with UCLA . . . giving NKLA a higher profile, attracting funding, and having access to technical resources on the
Michigan State University Community and Economic Development Program 2004 Policy Report 1801 W. Main Street, Lansing, MI 48915 www.cedp.msu.edu
19

campus.”63 The project was begun to address issues of community development in two Los Angeles neighborhoods. One of the community drafted projects sought to rehabilitate a dilapidated property. The challenges encountered in this effort were the inspiration to discover the conditions that would have indicated earlier what property was at risk in the city. A student researcher investigated the problem and discovered the efforts of Chicago’s Center for Neighborhood Technology and the Neighborhood Early Warning System. A proposal and prototype of the website was presented to Los Angeles Housing Department as “an alternative form of policy research” and the project was approved and funded through block funds. The goals were to aid policy and housing research but also to make the system accessible to the community. NKLA has sought to expand specifically in the area of community use throughout its history. 64
Due to an allied program on slum housing, the data from the city Department of Building Safety (the division responsible for code enforcement) was incorporated into the website. With help from the University as well as partners such as ESRI (which provided mapping software) and Local Initiatives Support Commission (LISC), the NKLA continues to innovate. In 1998, a new grant was sought from the US Department of Commerce’s Telecommunications Information Infrastructure Assistance Program to
63 “A Political and Technical How-To Kit” published on the NKLA website at: http://nkla.sppsr.ucla.edu/Master.cfm?Page=HowToKit/main.cfm&Page2=Political.cfm#3 64 http://nkla.sppsr.ucla.edu/Master.cfm?Page=History/Main.cfm
“transform the NKLA Neighborhood Early Warning System into a mechanism for electronic monitoring on neighborhood conditions, moving towards “real time” updates of information.” This will help citizens closely monitor factors affecting their neighborhoods such as code violations, inspections and improvements. More recently, NKLA’s outreach has involved youth in the community to “describe those spaces important to them and their community, using Internet technologies” as part of the Interactive Asset Mapping Los Angeles Project (IAMLA). 65 Outreach has also sought to train community members about what information can be accessed from the website and is comprehensive and responsive to differing computer and Internet skill levels. 66
The program has been so successful that communities from around the country contact the website and request information about how to set up a similar program in their community—prompting NKLA to create a new resource on their website: A How-To Kit that gives information on both the political and technical resources necessary to get similar programs started. The website is seeking to expand its geographic data area to Los Angeles County as well as beginning a Neighborhood Knowledge California website (NKCA) in the future.
65 http://nkla.sppsr.ucla.edu/Master.cfm?Page=History/Main.cfm 66 From “Final Project Report to Technology Opportunities Program (TOP)” submitted by UCLA API available on the web at: http://nkla.ucla.edu/help/translator/FinalTOPReport_API.pdf
Michigan State University Community and Economic Development Program 2004 Policy Report 1801 W. Main Street, Lansing, MI 48915 www.cedp.msu.edu
20

Target Population and Usage Statistics NKLA’s website is available to any user
willing to register. Registration is free through the website and only requires some information about the user. This is a means of tracking use of the system and by getting user feedback about the system. “In addition to its utility in property and neighborhood research, it has been used for community organizing/advocacy, personal use and as stimulation for new projects and ideas.”67 City government officials and non-profits use the site as a resource for the statistics that are necessary on a regular basis. NKLA has become an exemplar for how to make helpful information available to communities and stakeholders for people around the country. Their tracking of users has shown an increase in the percentage users identifying as community residents. Their survey data has also shown that the new asset mapping data is becoming a focus of users rather than purely as a means of checking on community problems.68 Data Sources and Updating
Data is provided from eight different government databases with room for more information as it becomes available. Currently data on code enforcement complaints and inspections, building permits, contract nuisance abatement, tax delinquency, water liens, at-risk properties, properties that are part of the Housing Inspection Program (HIP) and if the HIP is delayed are all available. In addition, NKLA
67 “NKLA Final Project Report to Technology Opportunities Program (TOP), Submitted by UCLA Advanced Policy Institute, available on the internet at: http://nkla.ucla.edu/help/translator/FinalTOPReport_API.pdf 68 http://nkla.sppsr.ucla.edu/HowToKit/print.cfm
has demographic data is available including race/ethnic data and median income from the 2000 Census. The data is available from the different departments that “own” the data. 69
The How-To Kit on the website offers some strategies about getting access to that data. Similar to reports from Chicago, data from the Assessor’s office of the county is sold and is a major source of revenue for that county department. For that reason, the data cannot be made available for free and the UCLA researchers agreed to only use a “narrow strip” of the data. The Assessor’s data is valuable because each property parcel has a unique identifier that is used by NKLA.
These property identifiers form a “backbone” that helps link all data to a specific address. This makes the incorporation and updating of data much easier. Data is also codified with information about census tract, zip code and city council district and searches can be run by these identifiers or at the individual property level. In addition, new information about community assets is being added. The data and the site include GIS mapping capabilities that are customizable.
Data is updated at the most frequent opportunity available on varying schedules bi-weekly, monthly, quarterly, or bi-annually through electronic transfer of the information (e-mail) to NKLA. The data is then linked to the property backbone so that it is standardized. This has made data updating quick and easy to accomplish.
The mapping component of the website has made it increasingly accessible because
69 http://nkla.sppsr.ucla.edu/HowToKit/print.cfm and http://nkla.sppsr.ucla.edu/DataMaps/LANews/Master.cfm
Michigan State University Community and Economic Development Program 2004 Policy Report 1801 W. Main Street, Lansing, MI 48915 www.cedp.msu.edu
21

it allows the user to “analyze data in the context of the larger neighborhood” and is more dynamic than tables of information. Urban planners who understand the underlying issues at stake developed the site and this has “helped [them] organize the data and design an interface that is useful for [their] users.” 70 [See sample pages of the website in appendix D]
The site does include instruction on how to use and access data and data mapping tools. The project also does community outreach around the data and computing technology. They have supported community efforts to get computer labs and recently have trained community residents in data collection. As part of the previously mentioned I am LA program, community youth are gathering data about assets in the community. The assets are defined by the project participants and include: churches, non-profit organizations, job training and economic development locations, health care, housing and education. These are then linked to the property identifiers and appear as icons on maps.71
Funding and Staffing NKLA had three waves of funding that
helped get them started. Initial funding came from the US Department of Housing and Urban Development in the form of a $30,000 grant. This grant helped with research and a first “beta” site. The Los Angeles Housing Department (LAHD) then granted $29,000 to continue and expand the project. In 1996, the US Department of
70 http://nkla.sppsr.ucla.edu/HowToKit/print.cfm 71 From “Final Project Report to Technology Opportunities Program (TOP)” submitted by UCLA API available on the web at: http://nkla.ucla.edu/help/translator/FinalTOPReport_API.pdf
Commerce granted them $100,000 as part of the Telecommunications Information Infrastructure Assistance Program (TIIAP), which is now called the Technology Opportunity Program to “further website development and [expand] outreach activities.” 72 In 1998, the project was granted $500,000 in a three-year grant from TOP. This grant attracted matching funds from LAHD ($25,000 for data integration), the FannieMae Foundation ($200,000 targeted to outreach), and Microsoft Corporation ($75,000 for I AM LA). Funds are also generated through contract work for the city of Los Angeles.73
As has been mentioned before, the website is part of the Advanced Policy Institute of UCLA. The project was created by a professor and a student in the Urban Planning Department and continues to be operated and expanded internally. [Waiting for a response from these people about staffing and volunteer/paid part-time/paid full-time status]
Technology Infrastructure and Design/Layout
On one side, to access the website, a user must have access to the Internet and an Internet browser. The web address is: http://nkla.sppsr.ucla.edu/index.cfm. On the creation and maintenance side, access to an Internet server is necessary. The more functions the site has the more space is necessary. NKLA is operated off its own server (a Dell PowerEdge 2300 Server), which cost approximately $16,000 to purchase. The server uses Windows NT and the web server is Microsoft Internet Information Server is the Web server. Tools
72 http://nkla.sppsr.ucla.edu/HowToKit/print.cfm 73 http://nkla.sppsr.ucla.edu/HowToKit/print.cfm
Michigan State University Community and Economic Development Program 2004 Policy Report 1801 W. Main Street, Lansing, MI 48915 www.cedp.msu.edu
22

that make website operations easier are also recommended by NKLA’s How-To Kit. In order to have an interactive website, more advanced programming tools such as Cold Fusion software (Allaire Corporation) are used. A separate server is dedicated to housing the accumulated data. NKLA uses a Microsoft SQL Server, although simpler and more common tools such as Microsoft Access could be used. The software that aids Internet Mapping portion of NKLA is GIS software from ESRI (developers of ArcGIS). The How-To Kit offers more detail about all technical matters and they estimate their costs for development of the website as $76,600 (for labor) and $26,400 (for hardware and software). [The How-To Kit is careful to point out that many factors affect costs such as: “existing infrastructure, geographical scope and quality of existing data.”]74
The website is accessible to “the lowest common denominator in terms of computer capacity.”75 For that reason, older web browsers can access a text-only version of the site, the site doesn’t require large downloads, and works with slow modem connections. Los Angeles has a large population of Spanish speaking people, so the entire site is available in Spanish and users can switch from Spanish to English without any difference in content. The site is adaptable and ready for growth by keeping a large quantity of memory available. 76
This website is well designed and easy to navigate. The layout is logical and intuitive, in other words the placement of things made sense and were easy to
74 http://nkla.sppsr.ucla.edu/HowToKit/print.cfm 75 http://nkla.sppsr.ucla.edu/HowToKit/print.cfm 76 http://nkla.sppsr.ucla.edu/HowToKit/print.cfm
understand. Users first select from a menu choosing between Spanish and English as well as a choice for a text-only version of the site. The only portion of the site that requires a password is the information under the “Data & Maps” menu. Other menus on this second screen include: “Introduction”, “What’s New?”, “Applications”, “Links”, “Search” (self-explanatory), and “Help”. In addition users can “Contact NKLA” through a web form to ask questions or offer comments. Throughout the site, links to those that fund the program, and other various web sites, are offered. The “Introduction” offers a comprehensive history, instructions for using the site, as well as a Project Narrative and Description as submitted to the National Telecommunication Information Administration. The “What’s New?” page lists the recent accomplishments of NKLA and has an archive of five years of information about the site. At the time of this writing (November 2003) the most recent entry was dated April 1, 2003. Each listing of news contains links to some other page or website. The page for “Data & Maps” requires a login. After logging in, the user is offered data through I AM LA, asset mapping; the Maproom, offers different data maps; LANews, allows the user to search for a specific property, a zip code, census tract or council district, and the Policy Room, which allows a query to be run. The Policy Room offers the user the chance to get all the information for properties in a specific area, or to gather information about areas based on information in the database. The “Applications” page gives some examples of how the site is being used. There is room for much more to be added to this page. This would require other groups to add their
Michigan State University Community and Economic Development Program 2004 Policy Report 1801 W. Main Street, Lansing, MI 48915 www.cedp.msu.edu
23

information. The next page, “Links” provides access to other sites related to community development and housing—most of these sites are relevant to California. The menu for “Help” is indeed helpful. It includes Frequently Asked Questions, a Glossary, Publications, instructions for Using NKLA, Property Data Guide, the NKLA How-To Kit, NKLA Tenant Guide (a resource for apartment residents), “Behind in Your Property Taxes?” (a resource for property owners with unpaid bills), and a link to Community Technology Centers (a list of places to access the Internet and training).77
Strengths and Challenges
Even though NKLA is the best example of a Neighborhood Early Warning System (and more) we found, it does have some limitations. Those are enumerated below. On a positive note, the website is easy to access and use. The mapping component helps to illustrate data very effectively.
1. Few low-income people use the Internet.
Although NKLA has made efforts to bridge the digital divide by providing training for using the Internet, the reality is that few low-income people would access this service. NKLA acknowledges this: “Internet access is highest . . . among people with higher levels of income and education. This certainly coincides with our experience of working in low-income neighborhoods of Los Angeles, where the majority of residents have never used the Web, or even a computer, because its costs are often outside their reach.”78 Access is one aspect but not the only thing to consider according to the
77 http://nkla.sppsr.ucla.edu/index.cfm
78 http://nkla.sppsr.ucla.edu/HowToKit/print.cfm
How-To Kit. A recent study cited in the How-To Kit indicates that most Internet content is biased toward those already using it. “NKLA seeks to provide content that is meaningful for those residents of low-income neighborhoods, and we have seen in our training programs that participants are most motivated to use new information tools like NKLA when they are able to find information that can help them in their personal and professional lives.”79
2. The futures of funding and political climates are uncertain.
NKLA seems to have been blessed with grants and other funding but the funding future is never assured. One concern of the website operators is that public information is being privatized. The operators indicate that they will continue to show the benefits of accessible data.
3. Currently, the project only includes the City of Los Angeles.
There are plans to expand the site but information only covers the city. Parts of the city may have more in common with at-risk suburbs and may face disinvestment as well. Moving toward this expansion will help bridge this gap. Recommendations
We have found through our investigation that Neighborhood Early Warning Systems exist at different levels of 1) scale (geographic coverage) and 2) scope of data (what information is available). In terms of scale, we are looking a creating a site for an entire state’s at-risk urban areas, something that has not been done yet, although NKLA has gotten a grant from the TOP to create a system for the entire state of California
79 http://nkla.sppsr.ucla.edu/HowToKit/print.cfm
Michigan State University Community and Economic Development Program 2004 Policy Report 1801 W. Main Street, Lansing, MI 48915 www.cedp.msu.edu
24

(NKCA). The NKLA team has the benefit of learning from their experience in creating the first site and the understanding of what is necessary for the project to be successful in expansion. For that reason, our team is providing three options in terms of scale for the beginning of the project: A) one city with the option later to expand to the state, B) multiple locations—perhaps the core cities with the option to expand to more cities, and C) the core cities plus other at-risk urban areas such as older suburbs and smaller cities such as Benton Harbor. These options will be explained in more detail below.
1. Scale The more area that the project covers the
more data sources there are and the quantity of even a small number of data variables multiplies geometrically. Figure 1 shows how a platform could be built to expand neighborhood early warning systems in Michigan.
A. One city. This model would allow Michigan to build a platform for an eventual expansion to the rest of the cities of Michigan as they simultaneously assess the use and applicability of the project to Michigan residents. We have a good idea about the technological and budgetary requirements that are necessitated by this option.
The dimension of scope deals specifically with what information is a priority for the system. Our team has been persuaded that a system can be successful at each different level of scope, but that an increase in data offers users more opportunity to have a dynamic understanding of their neighborhood and city. The three levels of scope are A) basic, B) advanced, and C) Comprehensive (an amalgam of best practices) which will also be explained in more detail. In addition to the concerns of scale and scope there are allied issues such as 3) budget and funding options, 4) location and technology needed, 5) policy and data gathering, and 6) control of access. Each of these issues affects the other and must be considered together.
B. Multiple cities. A concurrent establishment of the site in more than one city in the state. The possibility exists for NEWS systems to begin in the eleven core cities of Michigan.
C. The Core Cities Plus. The MLULC recommended this program as a way of reducing blight in urban areas of the state. However, starting with this quantity of data is ambitious and costs will increase. The economy of scale would be reduced because of the potential problems that come with gathering data from a huge number of municipal governments.
Michigan State University Community and Economic Development Program 2004 Policy Report 1801 W. Main Street, Lansing, MI 48915 www.cedp.msu.edu
25
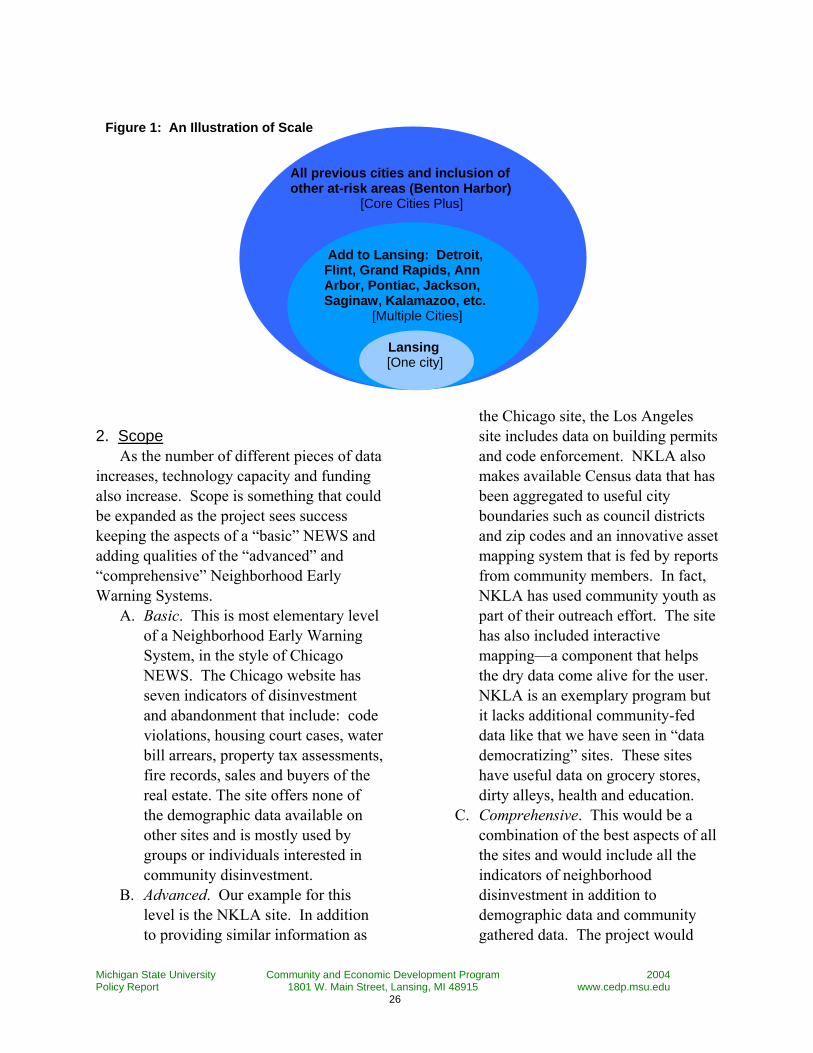
Figure 1: An Illustration of Scale
All previous cities and inclusion of other at-risk areas (Benton Harbor)
[Core Cities Plus]
Add to Lansing: Detroit, Flint, Grand Rapids, Ann Arbor, Pontiac, Jackson, Saginaw, Kalamazoo, etc. [Multiple Cities]
Lansing [One city]
2. Scope
As the number of different pieces of data increases, technology capacity and funding also increase. Scope is something that could be expanded as the project sees success keeping the aspects of a “basic” NEWS and adding qualities of the “advanced” and “comprehensive” Neighborhood Early Warning Systems.
A. Basic. This is most elementary level of a Neighborhood Early Warning System, in the style of Chicago NEWS. The Chicago website has seven indicators of disinvestment and abandonment that include: code violations, housing court cases, water bill arrears, property tax assessments, fire records, sales and buyers of the real estate. The site offers none of the demographic data available on other sites and is mostly used by groups or individuals interested in community disinvestment.
B. Advanced. Our example for this level is the NKLA site. In addition to providing similar information as
the Chicago site, the Los Angeles site includes data on building permits and code enforcement. NKLA also makes available Census data that has been aggregated to useful city boundaries such as council districts and zip codes and an innovative asset mapping system that is fed by reports from community members. In fact, NKLA has used community youth as part of their outreach effort. The site has also included interactive mapping—a component that helps the dry data come alive for the user. NKLA is an exemplary program but it lacks additional community-fed data like that we have seen in “data democratizing” sites. These sites have useful data on grocery stores, dirty alleys, health and education.
C. Comprehensive. This would be a combination of the best aspects of all the sites and would include all the indicators of neighborhood disinvestment in addition to demographic data and community gathered data. The project would
Michigan State University Community and Economic Development Program 2004 Policy Report 1801 W. Main Street, Lansing, MI 48915 www.cedp.msu.edu
26

have a robust outreach component and could utilize community members as data gatherers. The use of hand held personal data organizers (PDAs) would be an easy way for data gatherers to note actual neighborhood conditions. The site could have an interactive mapping component that allowed users to create layered maps of face blocks, larger neighborhood areas, and cities
as a whole. In addition the site could monitor access through a password system. This could also help to track usage or request information about how the site is being used. Although the comprehensive scope represents the best practices of all the websites we have reviewed, we feel that smaller systems are easy expanded if the possibility for an increase is built into the design of the system.
3. Budget and Funding Options The decisions in these first two areas
will have an effect on the budget and funding, the amount of technology needed and the scope of the policy and access to data. The larger the geographic area, the more expensive a system is to operate. Also, the more data the system has, the more expensive it is because more data must be purchased (at cost), stored, and disseminated. Including things like maps and graphics also increase the amount of memory that is needed to operate the site.
This is why we outline the options of starting small and expanding to cover a larger area. Only one staff member is in charge of the CNT Chicago site, from data gathering to web design and the technology costs are not as great as NKLA because the site lacks a mapping component. Information about the funding of NKLA is available, but no real breakdown of the budget past what is offered in the How-To Kit on the site. However, our prediction is that a comprehensive site will cost more
Comprehensive—all of “Advanced” level plus more data gathered by community members, mapping of more data and layered maps, a more robust outreach effort—a combination of best practices (the most costly and complex option)
Advanced System—all of “Basic” level plus census demographics, and interactive mapping of data and community outreach (more costly and complex than “basic” and the option to expand)
Basic System—code compliance data (inspections & violations), water liens, tax assessment and liens, & property ownership data (a platform to expand)
Figure 2: An Illustration of Scope
Michigan State University Community and Economic Development Program 2004 Policy Report 1801 W. Main Street, Lansing, MI 48915 www.cedp.msu.edu
27

than a site that covers only one city and offers only disinvestment data.
Every site we have found has gotten funding from sources other than the city or state that the site is operating in, coming from federal government Federal grant programs such as the U.S. Department of Commerce’s TOP, or from non-profit institutions such as FannieMae Foundation. Each site lists the sources of funding and there are many. Appeals could be made to numerous Michigan companies and foundations for support. At this time we cannot offer a range of costs based on scope and scale because detailed budget data was limited and are specific to Michigan’s efforts. [For more information on funding sources, see Appendix B.] 4. Locations and Technology Needed
When we talk about locations, we mean what agency would house the system. Since it is proposed by the state, it could be argued that a state agency should house the program. However, many other programs have begun in universities (Minneapolis, Los Angeles, etc.). The university location for the NEWS brings many benefits such as technological sophistication, status and name recognition, and availability of student labor. This is a good model for Michigan to follow especially because Michigan State University is a land grant university whose mission includes outreach to communities. Locating at a university also offers a technological infrastructure that would mean funding for expensive servers might not be necessary.
The NKLA How-To Kit, outlined in the case study of NKLA, covers a lot of the needs of starting a NEW System. Just a complexity of scale and scope add to the budget, they also add to the amount of
memory needed to store such data. More “amenities”, such as mapping, will require more server space and data storage capacity. 5. Policies and Data Gathering
According to the Michigan Land Use Leadership Council Report, one of the challenges facing Michigan is the number of municipal governments and the multiple layers of government that exist in particular areas. There are more than 1,800 units that can affect planning and land use. This means there are an enormous number of data collecting governments, making data gathering more challenging and time consuming.80 Every level of government that collects unique data would submit data to the system. In order to succeed, the state government must ensure local governments understand the reasons for data collection and compilation. 6. Accessibility
System guidelines should address the amount of data that will be available to the average user and what data requires controlled access. Many systems investigated by our team control access to certain data through a password while at the same time allowing free access to other data. Others sites require users to register as a means of tracking usage, not as a mechanism of control. Finally, there are some sites for which any user has access to all data. The type of data available and concerns of citizens and locales must inform decisions about accessibility. Sensitive data about crime and health, and even assessed values can be sensitive for certain areas and
80 http://www.michiganlanduse.org/MLULC_FINAL_REPORT_0803.pdf p.17
Michigan State University Community and Economic Development Program 2004 Policy Report 1801 W. Main Street, Lansing, MI 48915 www.cedp.msu.edu
28

may require controls. Areas may not want to make certain data available because of security concerns. A thorough process of creating priorities and goals for the system should take place. The communities involved must decide the accessibility of the site. Conclusion
The question remains, can neighborhood early warning systems control blight? Like any tool, it is only as good as its application. Usage is difficult to gauge unless a site actively seeks feedback, requires a registration or through participation guidelines. Metro Tenants Association uses the Chicago site for tenants’ rights advocacy, however, access to the site is not controlled or monitored so the site administrators have no way of knowing what unintended consequences are produced.81 The Los Angeles site (NKLA) attributes improvements in the city to the new information they made available. “With the advent of NKLA, city staff, politicians, and advocates became much more cognizant of the need for regularized code inspection. This led to the creation of the Systematic Code Enforcement Program that stipulates that all properties in the city of Los Angeles must be inspected at least once every three years. . . . The [Los Angeles Housing Department] estimates that this program has led to property improvements that total over $150M.”82 NKLA’s efforts at outreach have helped low-income tenants advocate for
81 From Interview with Peter Haas of CNT via phone 9/18/03 5:00pm EST 82 From “Final Project Report to Technology Opportunities Program (TOP)” submitted by UCLA API available on the web at: http://nkla.ucla.edu/help/translator/FinalTOPReport_API.pdf
improved code inspection of rental properties, and have “aided in specific neighborhood planning and organizing efforts.”83 Michigan cities could see the goals of NEWS met and also see some unintended positive consequences including: the benefit of increased access to data for social researchers concerned with neighborhoods and cities as a whole and help to community non-profit corporations in applying for grants and tracking progress of their efforts.
This brief has given options for the scope of a neighborhood early warning system both on a geographic level (Scale) and a quantity of data (Scope). There are any numbers of combinations of these and we have also tried to outline other dimensions that will be affected, so that the best fit for Michigan can be chosen. If none of the options are chosen and a neighborhood early warning system is not established, Michigan’s urban areas will operate just as they are today. The disinvestment and decay that has created racially segregated and poverty concentrated cities will continue. Attempts to address blight will be made more difficult in the absence of NEWS that provides information to stop disinvestment before it starts. Urban areas will continue to sprawl to avoid blighted areas, consuming Michigan’s agricultural land and open space. A Neighborhood Early Warning System alone will not be the key to solving all these problems. Neighborhood Early Warning Systems allow users to look at data and understand a more complete picture of their
83 From “Final Project Report to Technology Opportunities Program (TOP)” submitted by UCLA API available on the web at: http://nkla.ucla.edu/help/translator/FinalTOPReport_API.pdf
Michigan State University Community and Economic Development Program 2004 Policy Report 1801 W. Main Street, Lansing, MI 48915 www.cedp.msu.edu
29

community. This alone would transform the way people see problems in their community—as part of an integrated system. However you name it—urban blight, decay or disinvestment—these are complex
problems urban communities are facing. Information accentuates the ability of citizens, civil servants and public servants to create solutions to the challenges of at-risk urban areas.
Michigan State University Community and Economic Development Program 2004 Policy Report 1801 W. Main Street, Lansing, MI 48915 www.cedp.msu.edu
30

Appendix A: Webpages from Baltimore, Minneapolis, and Los Angeles
Michigan State University Community and Economic Development Program 2004 Policy Report 1801 W. Main Street, Lansing, MI 48915 www.cedp.msu.edu
31

Michigan State University Community and Economic Development Program 2004 Policy Report 1801 W. Main Street, Lansing, MI 48915 www.cedp.msu.edu
32

Michigan State University Community and Economic Development Program 2004 Policy Report 1801 W. Main Street, Lansing, MI 48915 www.cedp.msu.edu
33

Appendix B: Contact Information
Baltimore Baltimore Neighborhood Indicators Alliance 100 E. 23rd Street Baltimore, MD 21218 Tel: 410-235-0944 Email: [email protected] http://www.bnia.org/ Chicago Mr. Peter M. Haas, Ph.D. Technical Information Manager Center for Neighborhood Technology Email: [email protected] http://www.newschicago.org Cleveland CleveInfo Email: [email protected] http://www.cleveinfo.net Los Angeles http://nkla.sppsr.ucla.edu Minneapolis Mr. Jeffery K. Matson Associate Program Director Minneapolis Neighborhood Information System Center for Urban and Regional Affairs University of Minnesota 612-822-8146 http://www.npcr.org/MNIS.html New Orleans Greater New Orleans Community Data Center 2515 Canal Street New Orleans, Louisiana 70119 Tel: 504-588-5872 Fax: 504-584-3719 Email: [email protected] http://www.gnocdc.org/index.html Providence The Providence Plan 56 Pine Street, Suite 3B Providence, RI 02903 Tel: 401-455-8880 Fax: 401-331-6840 http://www.provplan.org/nprof
Michigan State University Community and Economic Development Program 2004 Policy Report 1801 W. Main Street, Lansing, MI 48915 www.cedp.msu.edu
34

Appendix C: Funding Sources
Private & Corporate Contributors American Academy of Pediatrics Annie E. Casey Foundation BankBoston Charitable Foundation Brown University Bryant College Citizens Bank of Rhode Island Community Development Training Institute Fleet Bank Charitable Foundation Greater Providence Chamber of Commerce Health & Education Leadership for Providence (HELP) Home Depot Lila Wallace-Reader’s Digest Fund Merck Family Fund Northeast and Islands Regional Educational Laboratory (LAB) Pacific Gas & Electric The Pew Charitable Trusts Prince Charitable Trusts Providence College The Providence Foundation Providence Gas Company The Providence Journal Charitable Foundation Providence Washington Insurance Public Education Fund -- Providence Blueprint for Education (PROBE) The Rhode Island Foundation Rhode Island Housing & Mortgage Finance Corporation Rhode Island Service Alliance -- AmeriCorps Sam’s Club United Way of Southeastern New England The Urban Institute YouthBuild USA Neighborhood Progress, Inc. The Enterprise Foundation Baptist Community Ministries United Way for Greater New Orleans National Neighborhood Indicators Partnership (NNIP) Maremont Foundation Polk Brothers Foundation The National Telecommunication Information Administration Fannie Mae Foundation Microsoft Corporation The McKnight Foundation St. Paul Companies Neighborhood Revitalization Program Local Initiative Support Corporation (LISC) Center for Urban and Regional Affairs (CURA) Tulane University
Michigan State University Community and Economic Development Program 2004 Policy Report 1801 W. Main Street, Lansing, MI 48915 www.cedp.msu.edu
35

City Agencies & Departments Office of the Mayor Providence Department of Planning & Development Providence School Department Providence/Cranston Workforce Investment Board Cleveland Housing Network City of Cleveland City of Providence Los Angeles Housing Department Twin Cities City of Minneapolis State Agencies & Departments Department of Administration -- Statewide Planning Program Department of Children, Youth & Families Department of Elementary & Secondary Education Department of Environmental Management Department of Health Human Resource Investment Council Department of Human Services Department of Labor & Training Rhode Island Public Transit Authority (RIPTA)Rhode Island Statewide Planning Program State of Rhode Island Federal Agencies & Departments Department of Commerce Environmental Protection Agency Department of Housing & Urban Development Department of Health & Human Services Department of the Interior -- National Park Service Department of Justice Department of Transportation
Michigan State University Community and Economic Development Program 2004 Policy Report 1801 W. Main Street, Lansing, MI 48915 www.cedp.msu.edu
36

Appendix D: Description of Acronyms
BINA: Baltimore Neighborhood Indicators Alliance, name of the NEWS-type program in
Baltimore, Maryland. CNT: Center for Neighborhood Technologies, the operators of the Chicago NEWS program
CITy│News. CURA: Center for Urban and Regional Affairs, base in the University of Minnesota. GIS: Geographic Information System, HUD: The U.S. Department of Housing and Urban Development. MNIS: Minneapolis Neighborhood Information System, name of the NEWS-type program based
in Minneapolis, Minnesota. NEWS: Neighborhood Early Warning System. NKLA: Neighborhood Knowledge Los Angeles, the name for Los Angeles, California’s NEWS
program.
UCLA: University of California at Los Angeles.
Michigan State University Community and Economic Development Program 2004 Policy Report 1801 W. Main Street, Lansing, MI 48915 www.cedp.msu.edu
37


