Embed Size (px)
Citation preview
Wednesday, April 7, 2004
http://chronicle.com/daily/2004/04/2004040702n.htm
Need-Based Aid Is Biggest Influence on Students' Ability to Attend College, Report Says
By SARA HEBEL
How much money states provide their need-based aid programs plays a bigger role in influencing the college-going rates of high-school graduates than several other factors, including the cost of public-college tuition, state demographic trends, and state spending on elementary and secondary education, according to a study released by the Lumina Foundation for Education.
A 38-page report on the study, "Expanding College Access: The Impact of State Finance Strategies," recommends that states increase their spending on need-based aid to help improve college participation, especially among students from low-income families. To do so, the report promotes two strategies.
States, it says, should consider adopting policies that more closely link state-aid awards with tuition so that grants increase as tuition does. For instance, state officials should commit to providing enough money for state need-based aid programs so that the total amount of grants would at least equal one-quarter of the average public-college tuition in the state, multiplied by the state's total full-time college enrollment, the report recommends.
Alternatively, the report suggests that state and federal officials develop a collaborative approach to awarding aid. The report recommends that states and the federal government create a joint need-based aid program, under which the maximum award in each state would equal the cost of average tuition at that state's public colleges.
The report envisions that one-third of that joint program's funds would come from the federal government and the rest from states. In addition to that aid, the report recommends that the federal government offer another need-based program, which would provide a maximum award equal to the national average cost for a college student's room and board.
"Investing sufficiently in student grants represents an efficient use of tax dollars," the report says, "especially if the goal of public policy is to equalize postsecondary opportunity."
Copyright © 2004 by The Chronicle of Higher Education
Edward P. St. John, Choong-Geun Chung, Glenda D. Musoba,
Ada B. Simmons, Ontario S. Wooden and Jesse P. Mendez
Indiana Education Policy Center at Indiana University
RESEARCH REPORT
ExpandingCollege Access:
The Impact of
State Finance
Strategies

AcknowledgmentsLumina Foundation for Education funded this project. Derek V. Price (Director of HigherEducation Research), Jerry S. Davis (Vice President for Research), and Robert C. Dickeson(Senior Vice President for Research, Policy and Evaluation) of Lumina Foundation providedreviews and guidance for this study. Dave Powell, the Foundation’s Director of Publications,provided support in the editing process. The advisory panel for this project included: Derek V.Price, Jerry S. Davis, Jill Wohlford, and Deborah Bonnet (Lumina Foundation for Education),Cheryl Blanco (Western Interstate Commission for Higher Education), Brian Fitzgerald(Advisory Committee on Student Financial Assistance), Susan Kleeman (Illinois StudentAssistance Commission), Donald Heller (Center for the Study of Higher Education atPennsylvania State University), Paul Lingenfelter (State Higher Education Executive Officers),Tom Mortenson (Pell Center for the Study of Opportunity in Higher Education), Laura Perna(University of Maryland), Kenneth Redd (National Association of Student Financial AidAdministrators), Scott Thomas (Institute for Higher Education-University of Georgia), andNick Vesper (State Student Assistance Commission of Indiana). David Mundel (independentconsultant) and Deborah F. Carter (Indiana University) provided reviews of an earlier version ofthe report. The opinions expressed in this monograph are those of the authors and do notnecessarily reflect policies or positions of Lumina Foundation for Education or members ofthe project advisory panel.
Executive summary ............................................................................................................... 1
Introduction .......................................................................................................................... 4
Access research ..................................................................................................................... 5The impact of public finance strategies ....................................................................... 5Academic preparation .................................................................................................. 6The challenge ............................................................................................................... 7
The influence of state finances on college access ................................................................. 8Analyses of the impact of state finance strategies ...................................................... 10Limitations ................................................................................................................. 10Results ........................................................................................................................ 12
Coordinating state finance strategies.................................................................................. 13Option 1: Improved state policy coordination .......................................................... 13Option 2: A new federal-state partnership................................................................. 15
The costs and benefits of improved policy coordination ................................................... 16Setting a minimum standard of coordination............................................................. 16Assessing alternative strategies: Results from the simulations .................................... 17Estimated enrollment effects ...................................................................................... 17
Conclusions and implications ............................................................................................. 22
Appendices1. State indicators for demographic and financial variables .............................................. 252. The impact of state financial strategies on high school graduation rates ...................... 263. Ordinary least squares regressions ................................................................................. 29
References ........................................................................................................................... 31
Endnotes ............................................................................................................................. 35
Table of contents○ ○ ○ ○ ○ ○ ○ ○ ○ ○ ○ ○ ○ ○ ○ ○ ○ ○ ○ ○ ○ ○ ○ ○ ○ ○ ○ ○ ○ ○ ○ ○ ○ ○ ○ ○ ○ ○ ○ ○ ○ ○ ○ ○ ○ ○ ○ ○ ○ ○ ○ ○ ○ ○ ○ ○ ○ ○ ○ ○ ○ ○ ○ ○ ○
A lthough substantial attention hasbeen given to federal strategies forimproving college access, too littleattention has been given to the
impact of state finance strategies on academicpreparation and access for prepared students. Thisreport provides:
■ A review of prior access studies.■ A new conceptual model for assessing the
impact of state finance strategies.■ An analysis of the impact of state
finance strategies.■ Simulations of alternative state and federal
strategies.
Prior researchThe early economic studies of college access
documented that student financial aid had a directinfluence on enrollment. However, the oldconsensus behind this research broke down afterthe net price concept used in these studies did notadequately explain the impact of new financepolicies that influence access. In this study of theimpact of state finance strategies, we consideredthe impact of tuition, need-based grants and non-need grants as a means of measuring the multipleeffects of state finance policies on access.
Executive summary○ ○ ○ ○ ○ ○ ○ ○ ○ ○ ○ ○ ○ ○ ○ ○ ○ ○ ○ ○ ○ ○ ○ ○ ○ ○ ○ ○ ○ ○ ○ ○ ○ ○ ○ ○ ○ ○ ○ ○ ○ ○ ○ ○ ○ ○ ○ ○ ○ ○ ○ ○ ○ ○ ○ ○ ○ ○ ○ ○ ○ ○ ○ ○ ○
1
Recent research by the National Center forEducation Statistics (NCES) examined the impactof taking a college preparatory curriculum oncollege enrollment.Although advancedhigh school courses arecrucial, the definitionof preparation used byNCES overlooked therole of high schools inpreparing students forcommunity colleges,an integral part of theaccess strategy used inmany states. High school graduation serves as aproxy for community college preparedness in thisstudy, which examined the impact of publicfinance (K-12 funding and student financial aid) onhigh school graduation rates.
A new approachNew logical models for assessing the impact of
state finance strategies on academic preparationand financial access for prepared students weredeveloped. The researchers looked at these twofactors as follows:
This studyexamined the impactof public finance onhigh schoolgraduation rates.

2
■ Academic preparation: The analyses examinedthe influence of demographic contexts (e.g.,income diversity and education level in thestates), financial controls (tax rates and K-12expenditures), and higher education financestrategies (public sector tuition and grants[need-based and non-need1] two years prior tograduation) on high school graduation rates.
■ Financial access: The analyses examined theinfluence of demographic contexts, financialcontrols, system capacity of the state system(percent enrollment in community colleges andprivate colleges), and higher education financestrategies (public sector tuition, need-basedgrants and non-need grants during thefreshman year) on college enrollment by highschool graduates.
The study developed and used a state-leveldatabase of the 50 states for the 1992, 1994, 1996,1998, and 2000 fiscal years. The database wasassembled from sources compiled by NCES,National Association of State Student Grant andAid Programs (NASSGAP) and other sources.Fixed-effect regressions were used to control forstate effects on academic preparation and financialaccess.
The impact of state finance strategies
Academic preparation: Controlling for statecontexts and demographics, state finance strategies(tax rates and K-12 expenditures) were notsignificantly associated with high school gradua-tion rates. Non-need grants and public college tuition(both measured two years prior to graduation) werenegatively and significantly associated with high schoolgraduation rates. Need-based grants had a positive(non-significant2) association with high schoolgraduation rates in the fixed-effects analysis.
Financial access: College enrollment rates for highschool graduates were influenced by system
capacity and state financial strategies, controllingfor state contexts and demographic variables:
■ The percentage of full-time equivalentenrollment in public two-year colleges waspositively and significantly associated withoverall college enrollment rates for highschool graduates.
■ The percentage of full-time equivalentenrollment in private colleges was alsoassociated with higher college enrollmentrates.
■ Need-based grants had a substantial,positive influence on enrollment rates.Need-based grants had a stronger influence(i.e., larger standardized beta) than anyother financial variable in the model.
■ Non-need grants were significant andpositively associated with college enroll-ment rates by high school graduates.
Simulations of alternative strategies
These findings support arguments that statesshould coordinate need-based state grants withpublic sector tuition charges as a means ofpromoting financial access for students who areprepared for college. If states allow tuition to risedue to shortfalls in tax revenues or for otherreasons, then need-based grants should besufficient to ensure financial access. Simulationsexamine two possible strategies for expandingaccess:
■ Coordination of public sector tuitionand state grants. The first simulationestimated the effects of funding state need-based grants on a level equal (on a per-FTEbasis) to one-quarter of the public sectortuition charge, a reasonable equitystandard. If this level of coordination had beenmaintained in the 1990s, then 1.21 million morelow-income students would have had theopportunity to enroll in college across the U.S.

3
■ A new state-federal partnership. Thesecond simulation estimated the impact ofa new need-based grant (jointly funded bystates and the federal government) thatwould have been funded at a level equalingan additional one-quarter of each state’saverage public sector tuition charge (i.e.,new funds on top of existing grants). Hadthe proposed partnership been implemented in the1990s, an additional 2.55 million low-incomecollege-prepared students would have had theopportunity to enroll in the 1990s.
Conclusions
To maintain financial access for low-incomestudents, states must raise funding for need-basedgrants. If the federal government does not makeany additional investment in grants, each stateshould maintain funding for need-based grants atleast equal to one-quarter of the average tuitioncharge.
Recommendations
The states and the federal government shouldauthorize and adhere to a two-tier grant strategy.
1. The basic federal need-based grant shouldhave a maximum award equaling thenational average for room and board charges.
2. A second-tier grant program should involvestate-federal collaboration. The programshould:
• Provide a maximum need-based awardequaling public tuition (and possibly ahigher award level for private colleges).
• Be funded at an amount in each stateequaling one-quarter the average publictuition charge on an FTE basis. (Thefunding should be equal to total stateenrollment multiplied by a factorequaling one-quarter of the averagepublic tuition).
• Be funded by one-third federal fundsand two-thirds state funds.
• Require an approved plan for coordinat-ing state grants and tuition with otherstate finance strategies for highereducation, raising state grants as tuitionincreases.
• Make awards based on financial need,consistent with federal needs analyses.
• Require states to provide informationabout the grant program to all eighth-grade students who receive subsidiesfrom the Department of Agriculture’sFree and Reduced Lunch Program.

4
Introduction○ ○ ○ ○ ○ ○ ○ ○ ○ ○ ○ ○ ○ ○ ○ ○ ○ ○ ○ ○ ○ ○ ○ ○ ○ ○ ○ ○ ○ ○ ○ ○ ○ ○ ○ ○ ○ ○ ○ ○ ○ ○ ○ ○ ○ ○ ○ ○ ○ ○ ○ ○ ○ ○ ○ ○ ○ ○ ○ ○ ○ ○ ○ ○ ○
A ttaining at least some postsecondaryeducation — a degree from a two-year or four-year college — isincreasingly necessary for meaning-
ful employment (Pascarella & Terenzini, 1991;Paulsen, 2001a, 2001b). While college fundingwas considered central to expanding access duringmost of the 20th century, for the past two decadesthe debates about policies for expanding accesshave broadened to include education reform aimedat improving academic preparation for college andpostsecondary encouragement programs (King,1999; National Center for Education Statistics[NCES], 1997a; Tierney & Hagedorn, 2002). Asmore high school students take the steps toprepare for college, states will need to considerhow to make efficient use of tax dollars in effortsto expand postsecondary opportunities for low-income students, especially given the competingdemands on state tax dollars. Whether or not stateeducation reforms are successful, the concept ofequal opportunity posits that a student’s socioeco-nomic background should not affect his or heropportunity to attend college.
The Advisory Committee on Student FinancialAssistance (2002) estimated that about 4 millioncollege-qualified students from low- and moder-ate-income families would be denied access tofour-year colleges in the first decade of the 21st
century because the remaining costs of college,after loans and grants, are higher than thesestudents can afford. Given the large number ofqualified students being left behind because ofcollege prices, many states face an access chal-lenge. With the decline in the buying power offederal need-based grants over the past twodecades, states should consider altering theirfinancial strategies to ensure access for low-income, college-qualified students. The goal ofensuring access is complicated by the greatvariability in the capacity and mix of two-year andfour-year colleges across the states as well as thesignificant differences in state financial aidprograms.
The federal government and states share thegoal of expanding access for academically preparedstudents. Opportunity for college enrollment hasbeen the intent of federal need-based grant aid forfour decades. States have the primary responsibil-ity for ensuring financial access, and the decliningvalue of federal grants (Advisory Committee forStudent Financial Assistance, 2002) adds to theseverity of the access challenge facing states. Thisreport examines the impact of state financingstrategies on college access in the 1990s andproposes two cost-efficient approaches forexpanding access over the next decade.

5
T here is a long history of effort toconceptualize and measure the impactof state and federal financing strategieson college access; however, there is
little agreement about which methods are mostappropriate for this task. To build an understand-ing of the reasons why a new approach is needed,we review the uses of statistical models in highereducation policy research over the last half of thetwentieth century. This review considers: (1) earlyefforts to assess the impact of public financestrategies on access to higher education, (2) recentefforts to focus on the role and influence ofacademic preparation on the college merit process,and (3) the challenge facing policy research oncollege access.
The impact of public finance strategies
Economists began to study the impact oftuition on college enrollment in the 1960s andearly 1970s (Hansen & Weisbrod, 1969; Jackson &Weathersby, 1975; Manski & Wise, 1983;McPherson, 1978). The early studies used bothtime-series data and samples of high schoolstudents to examine the impact of price differen-tials on enrollment. Reviews of these early studiesfound that higher tuition charges reduced
enrollment rates, a finding that was often used toargue that student aid was the most efficientpossible means of promoting college access(Jackson & Weathersby,1975; Leslie & Brinkman,1988; McPherson, 1978).These early studiesinformed efforts by theNational Commission onthe Financing ofPostsecondary Education(NCFPE), which estimatedthe effects of expandingthe Pell grant program oncollege enrollment(NCFPE, 1973). TheNCFPE concluded thatneed-based grants forstudents constituted amore efficient means toexpand access than diddirect federal subsidies tocolleges and universities.
During the 1970s and 1980s, substantialprogress in research on public finance strategiesoccurred through the development of nationallongitudinal databases to study the impact ofstudent financial aid on college enrollment. Forexample, using the National Longitudinal Study of
The NCFPEconcluded thatneed-based grantsfor studentsconstituted a moreefficient means toexpand access thandid direct federalsubsidies.
Access research○ ○ ○ ○ ○ ○ ○ ○ ○ ○ ○ ○ ○ ○ ○ ○ ○ ○ ○ ○ ○ ○ ○ ○ ○ ○ ○ ○ ○ ○ ○ ○ ○ ○ ○ ○ ○ ○ ○ ○ ○ ○ ○ ○ ○ ○ ○ ○ ○ ○ ○ ○ ○ ○ ○ ○ ○ ○ ○ ○ ○ ○ ○ ○ ○

6
the High School Class of 1972 (NLS:72), Jackson(1978) and Manski and Wise (1983) found thatstudent aid expanded access for students in thehigh school class of 1972. Manski and Wise alsoexamined the impact of implementing Pell grantsand estimated that expansion of grants would
increase access to two-year colleges morethan four-year colleges.Analyses of the HighSchool and Beyond(HSB) study of thehigh school classes of1980 and 1982 foundthat student grantswere positivelyassociated withenrollment by low-
income students in the early 1980s, as they hadbeen a decade earlier (Jackson, 1988; St. John,1990, 1991; St. John & Noell, 1989).
There were also numerous attempts to developand refine price response measures based onreviews of both time-series studies and studiesusing national longitudinal databases (Heller,1997; Jackson & Weathersby, 1975; Leslie &Brinkman, 1988; McPherson, 1978). Most of theseresearchers concluded that $100 in price (tuition)differential was associated with some percentagepoint change in the college enrollment rate. Theresearch evidence was clear on this point: Low-income students were more responsive to collegeprices and student grants than were middle-incomestudents (Heller, 1997; Leslie & Brinkman, 1988).Even so, analysts have lacked a generally acceptedmethod of linking indicators of public spending onstudent financial aid with changes in collegeenrollment.
Recent analyses that considered trends infederal need-based and non-need grants, trends instate grants, and trends in school reform found acorrespondence between changes in grant fundingand college enrollment rates by high schoolgraduates during the last three decades (St. John,2003). States that maintain adequate grant aid can
equalize persistence across diverse groups (Hu &St. John, 2001; St. John, 1999). The researchliterature reinforces the importance of both stateneed-based and non-need grants on postsecondaryaccess — moreover, responses to charges (tuitionand living costs) and different types of aid havedifferent effects on different groups (Dresch, 1975;St. John & Starkey, 1995). Thus, there is still goodreason to consider the relationships betweentrends in state financial strategies and changes inpostsecondary enrollment patterns.
Academic preparation
During the past two decades many policyanalysts have focused on the role of academicpreparation for college in efforts to build a betterunderstanding of college access (Choy, 2002;Gladieux & Swail, 1999; King, 1999; NCES,1997a). Policy research on the role of academicpreparation grew out of efforts by the Reaganadministration to respond to concerns about thegap in enrollment rates between white studentsand African-American students after 1978. Theofficial reports prepared in response to thisconcern examined the relationship between theacademic courses taken in high school and collegeenrollment (Pelavin & Kane, 1988, 1990). Althoughprevious studies controlled for the impact of takinga college preparatory curriculum (e.g., Jackson,1978; St. John, 1991; St. John & Noell, 1989), theydid not examine the impact of specific high schoolcourses, such as algebra. Pelavin and Kane (1988,1990) examined the effects of taking specific mathcourses. NCES reports have also documented theassociation between academic preparation, asmeasured by high school courses, and collegeenrollment. A recent report published by theAmerican Council on Education summarizes thesestudies, concluding that academic preparationinfluences college enrollment (Choy, 2002). Thus,in addition to the effects of tuition and student aidon college enrollments, academic preparationplays an important role in postsecondary access.
States that maintainadequate grant aid
can equalizepersistence across
diverse groups.

7
The challenge
Research on college access should find abalanced approach that considers both academicpreparation and financial access for preparedstudents. Research using a balanced approach toassess the impact of state finance strategies onenrollment has been limited, but compelling. Afew studies that reanalyzed NCES reports foundthat large numbers of college-qualified studentswere left behind in the 1990s because of lowfunding for need-based grants (Advisory Commit-tee on Student Financial Assistance, 2002; St.John, 2002). Using NCES data (NELS:88), Pernaand Titus (2002) found that need-based aidinfluenced college access and concluded thatstates’ financial access policies play a central role inexpanding access.
States play a fundamental role in college accessand have the primary responsibility for providingeducation and ensuring equity in postsecondaryeducational opportunity. The policies that statesuse to finance higher education influence financialaccess (i.e., whether students who are qualified forcollege can afford to attend). States also setgraduation requirements that influence academicaccess (whether high school students are academi-cally prepared for college). The intent of thisreport is to examine the effect of state financialstrategies on college access; thus, we do notconsider variations in high school curricula ordiffering graduation requirements among states.Although we recognize that high school graduatesare not necessarily academically prepared forcollege, students who graduate from high schoolcan nonetheless enroll in community colleges andmany non-selective four-year institutions.

8
O ur model of the effects of publicfinance strategies on collegeenrollments is based on anunderstanding of social and
economic theory, research on educationalattainment,3 and research on price response andpublic finance (St. John, 2003; St. John & Paulsen,2001). This conceptual model (see Figure 1 on thenext page) recognizes that there is an educationalattainment pipeline in each state that is affected bythe public finance strategies used in the state. Theeducational attainment pipeline is influenced by:
■ Demographic context: The ethniccomposition of the state’s population andthe extent of wealth, poverty and attainededucation.4 The demographic contextrepresents the state-level equivalent ofvariables for family income and parents’education, which are frequently used instudies of college access that use indi-vidual-level data.
■ High school graduation rates: Studies ofenrollment in four-year colleges indicate itis desirable to consider the specific coursesthat students take in high school. How-ever, most states accommodate forenrollment in two-year colleges if studentsreceive a high school diploma. Given the
limitations of available data on statewidesecondary school curricula requirements,and the intent of this study to examineaccess to two-year and four-year colleges,we consider the role of high schoolgraduation rates as a proxy for minimalacademic preparation.
■ Postsecondary attainment: We use collegeenrollment rates for high school graduatesas our initial measure of educationalattainment. Ideally, measures of collegegraduation or other persistence indicatorswould provide useful information about thereturns on state investments in post-secondary education.
The systems of public finance are the primarymeans that states can use to promote educationalattainment, especially college attainment amongtheir resident populations. The system of statefinance links to the educational attainmentpipeline in several ways:
■ Tax rates: A state’s tax rate, controlling forthe wealth of the population, can influenceboth academic preparation and collegeattainment. The tax rate measure used herewas total taxes collected by a state divided
The influence of state finances on college access○ ○ ○ ○ ○ ○ ○ ○ ○ ○ ○ ○ ○ ○ ○ ○ ○ ○ ○ ○ ○ ○ ○ ○ ○ ○ ○ ○ ○ ○ ○ ○ ○ ○ ○ ○ ○ ○ ○ ○ ○ ○ ○ ○ ○ ○ ○ ○ ○ ○ ○ ○ ○ ○ ○ ○ ○ ○ ○ ○ ○ ○ ○ ○ ○

9
by the sum of personal income of the state’sresidents (from the U.S. Census Bureau).
■ School funding: The level of state fundingfor public K-12 education can be influ-enced by the wealth and tax rates in astate.5 The level of school funding couldinfluence the high school graduation ratein a state and has a direct effect on theavailability of certain high school courses.
■ Expected tuition and grants: There is acommon-sense linkage between studentexpectations about tuition and grants andtheir desire to prepare for college (St. John,2002). Therefore, there is reason to expectthat average public tuition charges andaverage state grants two years prior tograduation can influence the high schoolgraduation rate in a state.
■ Expected system capacity: Limitedopportunity can constrain access anddiscourage graduation.
■ Actual college prices: States financecollege access and persistence throughstudent grants (need-based and non-need)and tuition subsidies to public colleges. At
a given level of educational expendituresby public colleges, state subsidies to publiccolleges reduce tuition prices charged tocollege students.
In addition to public finance strategies, thecomposition of a state postsecondary education systemhas an influence on college access. Extensive two-year college systems can expand access as can theexistence of private colleges in a state. Thus, it isappropriate to control for the structure of statesystems of higher education.6 While some residentstudents enroll in out-of-state institutions, thisemigration of college students is unlikely to beinfluenced by state finance strategies unless statesprovide grant subsidies to students who enroll outof state.7
Using the conceptual model described on theprevious page (and illustrated in Figure 1 below),this report examines the impact of demographicindicators and state financial strategies on collegeenrollment rates. (A model testing the impact ofstate financial strategies on high school graduationrates is described in Appendix 2). To test thismodel, the study team developed a set of indica-
Figure 1. Framework for assessing the impact of public finance strategies on postsecondary attainment

10
tors of financial and demographic variables foreach of the 50 states for the 1992, 1994, 1996,1998, and 2000 fiscal years. All dollar amountswere adjusted to 2000 dollars. The analyses ofhigh school graduation rates used tuition andfinancial aid amounts for two years prior tograduation. This was done to reflect the financialconditions that prevailed when students in acohort were enrolled in high school and weremaking future plans. The indicators are describedin Appendix 1.
Analyses of the impact ofstate finance strategies
Analyses of state student aid programs havebeen done in a few state-level comparisons (Binder& Ganderton, 2001; Cornwell, Mustard, & Sridhar,2001; Dynarski, 2000), but this is the first study touse fixed-effects regression with multiple years ofdata on all states. Earlier state-level comparisonsindicate that state grant programs do affect collegeenrollment. This report builds on those ap-proaches. (OLS regression results are presented inAppendix 3 so readers can compare the two
analysis methods.)8 A two-step procedure was usedto estimate the impact of state finance strategieson enrollment. This method overcomes some ofthe limitations of prior efforts to simulate theimpact of changes in public finance policies onenrollment rates.9 Variables considered in theanalysis of the impact of public finance strategieson college enrollment of high school graduates arepresented in Table 1 below. The analysis of theimpact of financial strategies on college enrollmentrates follows.10
Limitations
The analyses assume current funding levels forPell grants and other types of federal aid:
■ The regression analyses assess the additionalimpact of state grants that supplement federalneed-based grant awards (Pell). Pell is awardedbased on uniform criteria across states.
■ The simulations of alternative grant strategiesalso assume that the existing federal programswill be continued at the current award levels.If a new federal-state grant program were
Table 1. Independent variables used in analysis of college enrollment rates by high school graduates
■ Demographic context1. Percent of the state population below the poverty level2. Percent of African Americans in the population3. Percent of Hispanics in the population4. Percent of other minorities in the population5. Size of the ninth-grade cohort four years prior
■ State system1. Percent public two-year institution FTE2. Percent private institution FTE
■ Financial controls (tax rate)■ Higher education finance strategies
1. Need-based grants per FTE (for first year of college eligibility)2. Non-need grants per FTE (for first year of college eligibility)3. Tuition charges weighted per FTE (for first year of college eligibility)

11
created but Pell grants were reduced, thenaccess would be reduced as a consequence ofthese reductions in Pell.11
Although we focus exclusively on the impact ofstate finance strategies on expandingpostsecondary access, there is a sound basis forassuming state investments in postsecondaryeducation would also affect student success. Forexample, a substantial body of research indicatesstate grants influence persistence. State-levelstudies have found that funding for state need-based grants helped equalize the opportunity forpersistence in Washington state (St. John, 1999)and Indiana (Hu & St. John, 2001; St. John, Hu, &Weber, 2000, 2001). Further, Indiana’s Twenty-firstCentury Scholars Program has been shown to
influence academic preparation, college enroll-ment, and college persistence for low-income highschool students (St. John, Musoba, Simmons, &Chung, 2002; St. John, Musoba, Simmons, Schmit,Chung, & Peng, 2002). In the future, the stateindicators approach used in this report should beextended to include analyses of student persistenceand degree completion.
This report provides an analysis of the impactof financial aid on postsecondary access using anew methodology. It is the first study to use fixed-effects regression with a state-level databasecomposed of state indicators. Using states as theunit of analysis provides appropriate logical andstatistical controls for simulations of the impact ofstate grant strategies on college enrollment rates.This approach provides a method of assessing the
Table 2. Fixed-effect regression: the influence of population characteristics and state finance strategies oncollege enrollment rates in the 1990s
Regression coefficient Unstand. Standard.
Percent poverty -0.462 -0.238 ***Percent African-American -1.810 -2.326Percent Hispanic -1.174 -1.316 *Percent other minorities 2.388 3.001Enrollment when the cohort was ninth grade -0.000 -0.694 *Percent of population with bachelor’s degree or higher 0.299 0.182 *
Percent public two-year institution FTE 0.211 0.328 *Percent private institution FTE 0.643 1.089 ***Tax rate (=State tax collection/personal income) -0.071 -0.015
Per-FTE need-based grant amount ($/1,000) 0.115 0.426 ***Per-FTE non-need grant amount ($/1,000) 0.089 0.204 ***Undergrad in-state tuition and fees for public system ($/1,000) 0.100 0.146
Adjusted R square 0.789N 244P-value for F test that all u
i=0 0.000
Note: *** p<0.01, ** p<0.05, * p<0.1
Sig.
12
impact of financial aid — need-based and non-need — on enrollment rates in states, controllingfor state demographic differences and the minimallevel of college preparedness.12
Results
While the first aim of this report — to measurethe effects of state finance strategies on access —may seem straightforward, it is a complex processthat is further complicated by methodologicalconsiderations. To illuminate the role of publicfinance in promoting access, the report examineshigh school graduation rates (Appendix 2) both asan indicator of the indirect effects of financialaccess on high school graduation and as anindicator of the direct effects of financial strategieson college enrollments (by high school graduates).
Table 2 illustrates the results of the statisticalanalysis of college enrollment rates. State financestrategies had a substantial and direct effect oncollege enrollment by high school graduates,controlling for demographic contexts and thestructure of higher education in the states. Onaverage, for every $1,000 of need-based grant aid,enrollment rose 11.5 percentage points. Similarly,for every $1,000 of non-need grant aid, enrollment
rose 8.9 percentage points. At the same time, statedemographics and system capacity also influencecollege enrollment. The poverty level in a statewas significant and negatively associated withcollege enrollment rates. The percentage of thepopulation with college degrees was also positivelyassociated with college enrollment rates, furtherindicating that demographic variables related tosocioeconomic status (SES) have a substantial anddirect influence on college enrollment by studentswho graduated from high school.13
The capacity of state higher education systemsalso affects postsecondary opportunity. Thepercentages of students enrolled both in commu-nity colleges and private colleges were positivelyassociated with enrollment rates in the states.14
Tax capacity was not associated with collegeenrollment.
Both need-based grants and non-need grantswere significant and positively associated withenrollment rates, although the direct effects ofneed-based grant aid were much more substantial(double the standardized beta).15 Tuition chargeswere not significantly associated with enrollment.These results suggest the most efficient way forstates to expand access is to expand need-basedgrant aid.16

for a state need-based grant program thatrepresents improved state policy coordination, and(2) a new second-tier need-based grant programfunded through a 1:2 federal:state match.
Option 1: Improved statepolicy coordination
In the 1990s, public sector tuition charges rosesubstantially as the percentage of educational costssupported by state appropriations declined (Price,2003; St. John, 2003; St.John, Simmons,Hoezee, Wooden, &Musoba, 2002). For themajority of families withchildren attendingcollege, there was atradeoff in the 1990s:Lower tax subsidies topublic higher educationmeant lower individualtaxes but higher directcosts while theirchildren were enrolledin college. In addition, higher tuitions madecollege less affordable for low-income students
13
States can realizemore efficient use oftax dollars bycoordinatingtuition and need-based grants.
T he analyses above reveal that need-based grant aid influences collegeenrollment rates for high schoolgraduates more substantially than do
non-need grants or tuition levels. In this context,states can realize more efficient use of tax dollarsby coordinating tuition and need-based grants inways that expand access, especially for low-incomestudents. During the recent federal policy debatesurrounding the reauthorization of the HigherEducation Act, some groups recommended asubstantial increase in Pell grants as a strategy forensuring financial access (Advisory Committee onStudent Financial Assistance, 2002; College Board,2003). Although the authors agree with the intentof these recommendations, which is to increaseneed-based grants, we believe it is more politicallyviable to seek better coordination of tuition levelswith need-based financial aid.
The results from these statistical models wereused to inform simulations that estimate theenrollment effects of additional federal and/or stateinvestments in postsecondary education. Thesimulations provide a useful tool to inform thefederal and state policy discourse around expand-ing access to college. These simulations considertwo distinct approaches to state and federalcollaboration on financial access: (1) a threshold
Coordinating state finance strategies○ ○ ○ ○ ○ ○ ○ ○ ○ ○ ○ ○ ○ ○ ○ ○ ○ ○ ○ ○ ○ ○ ○ ○ ○ ○ ○ ○ ○ ○ ○ ○ ○ ○ ○ ○ ○ ○ ○ ○ ○ ○ ○ ○ ○ ○ ○ ○ ○ ○ ○ ○ ○ ○ ○ ○ ○ ○ ○ ○ ○ ○ ○ ○ ○
14
(National Center for Public Policy and HigherEducation, 2002). As public sector tuitionincreases, students from the lowest-income familiesrequire corresponding grant increases to maintainaccess (Advisory Committee on Student FinancialAssistance, 2002). In this environment, states couldincrease need-based grants to ensure financialaccess given the negative impact of higher priceson college access for low-income students.
The notion that an award threshold should bedefined for grants is not new. The originallegislation for Pell grants set a maximum awardlevel, a program feature that has been carriedforward in subsequent reauthorizations of theHigher Education Act. Recently, an expert panelfor the College Board (2003) recommended thatthe Pell award should be raised to a maximum of$9,700, and the Alliance for Equity in HigherEducation (2003) recommended doubling theauthorized maximum ($5,100) within the next sixyears. While it may be desirable to increase Pellgrants, it probably is not feasible in the currentpolitical climate given current budget deficits andpolitical support for tax decreases.
Based on prior analyses (St. John 2003; St.John, Simmons, Hoezee, Wooden, & Musoba,2002), we consider one-quarter of weightedaverage tuition charges for all students in a state asthe minimum average level for state grant aid. Tothe extent that states allow tuition in public
colleges to rise due to inadequate state funding forinstitutions, they should invest a portion of taxrevenue saved in need-based grants. Given thebase provided by federal grants (including Pellgrants), this would represent a minimum thresholdfor state need-based grants if states intended tomaintain financial access when tuition increased.Very few states maintain grants at this target level(average need-based grants equaling one-quarter ofthe average tuition charge).
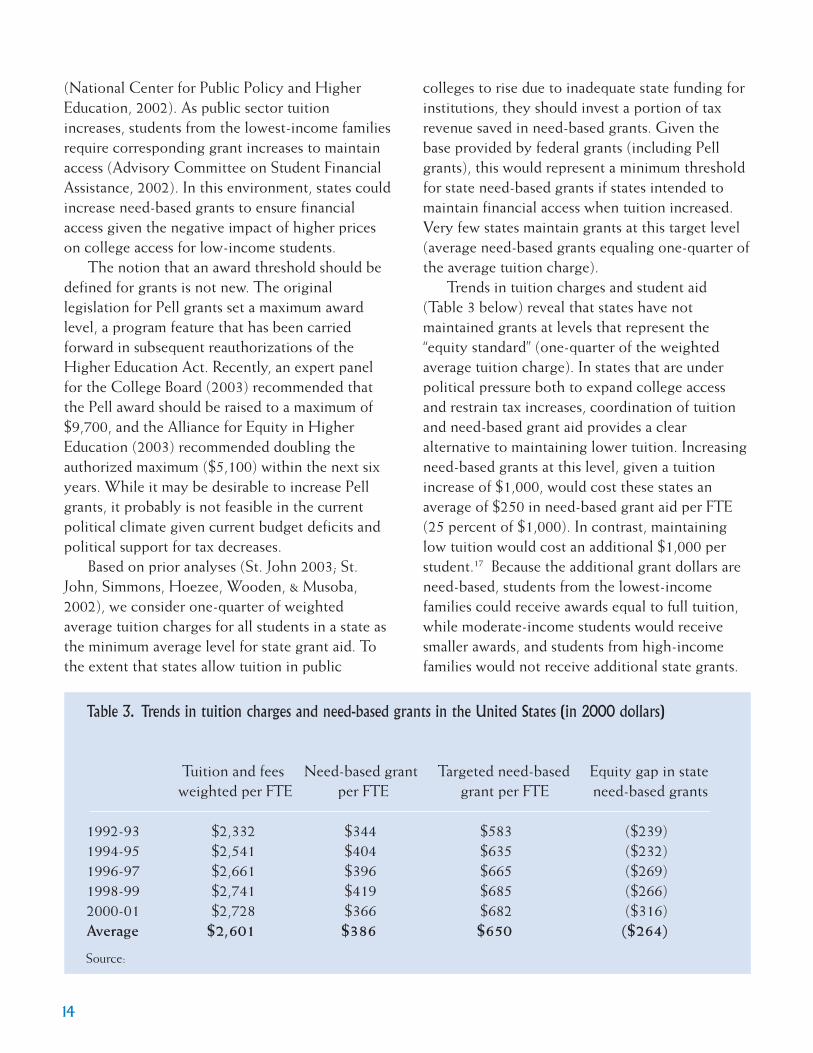
Trends in tuition charges and student aid(Table 3 below) reveal that states have notmaintained grants at levels that represent the“equity standard” (one-quarter of the weightedaverage tuition charge). In states that are underpolitical pressure both to expand college accessand restrain tax increases, coordination of tuitionand need-based grant aid provides a clearalternative to maintaining lower tuition. Increasingneed-based grants at this level, given a tuitionincrease of $1,000, would cost these states anaverage of $250 in need-based grant aid per FTE(25 percent of $1,000). In contrast, maintaininglow tuition would cost an additional $1,000 perstudent.17 Because the additional grant dollars areneed-based, students from the lowest-incomefamilies could receive awards equal to full tuition,while moderate-income students would receivesmaller awards, and students from high-incomefamilies would not receive additional state grants.
Table 3. Trends in tuition charges and need-based grants in the United States (in 2000 dollars)
Tuition and fees Need-based grant Targeted need-based Equity gap in state weighted per FTE per FTE grant per FTE need-based grants
1992-93 $2,332 $344 $583 ($239)1994-95 $2,541 $404 $635 ($232)1996-97 $2,661 $396 $665 ($269)1998-99 $2,741 $419 $685 ($266)2000-01 $2,728 $366 $682 ($316)Average $2,601 $386 $650 ($264)
Source:
15
Coordinating stateneed-based grantswith tuitionprovides a meansof making moreefficient use oftax dollars.
Coordinating state need-based grants withtuition provides a means of making more efficientuse of tax dollars while maintaining financialaccess for low-income students. The averagetuition charge increased from $2,332 in 1992-93to $2,728 in 2000-01, while the average need-based grant increased from $583 to $682. Theaverage gap between the targeted grant amountand the actual amount grew 32 percent from $239per FTE in 1992-93 to $316 per FTE in 2000-01.Of course need-based grants for students withhigh need would be at least equal to their tuition ifall states maintained this minimum targeted awardstrategy.
Option 2: A new federal-statepartnership
This option is based on a proposal by St. John(2003) to minimally raise the maximum Pell awardand encourage states to coordinate their publicfinance strategies for tuition and grants in a waythat ensures financial access for low-incomestudents.18 This proposed state-federal partnershipwould provide a new second-tier state grantequaling one-quarter of the weighted averagepublic sector tuition charges. States would berequired to fund two-thirds of the grant programbut would receive federal matching grants equal toone-third of the total new investment in need-based grants.19 States would be required tocontinue their current investment in grants torealize the new federal support, which ensures thatboth states and the federal government shareresponsibility for the new investment. Residentstudents attending in-state private colleges shouldbe eligible for the new grants.
The recommended state-federal partnershipincludes:
■ A basic federal grant: The federal govern-ment should maintain a maximum Pellaward level of about $4,500 or an amountset at the level of the average room and
board in colleges and universities in theU.S., adjusted for inflation. This amount isapproximately equal to the Pell maximumin 1980 when access was more equitable.
■ A state equalization grant: States shouldmaintain a maximum award for low-incomestudents equaling tuition charges at thepublic college they attended.20 Thisapproach would encourage states toprovide adequate aid to ensure thatfinancial access is maintained.
Put simply, if states provided need-based grantawards equaling the tuition charges of publicinstitutions for low-income students attendingthose colleges (and anequivalent amount forprivate colleges), thenfederal and state policywould be better coordi-nated. In the proposedscenario, the maximumaward of a Pell grant plusthe maximum for the stategrant would equal $8,500for the lowest-incomestudents attending publiccolleges that charged$4,000 in tuition and fees.In contrast, the highest-need students in a statewith $3,000 as the tuition for a public institutionwould receive a total of $7,500 in the two-tiergrant program. Because not all students requireneed-based grant aid, a mean award equal to one-quarter of tuition would allow for full-tuitiongrants for students with the greatest need, offsetby no awards to high-income students withoutfinancial need.

A lthough the idea of coordinatingstudent financial aid strategies has along history in policy analysis(Hansen & Weisbrod, 1969; Hearn &
Anderson, 1989, 1995; Hearn & Longanecker,1985), previous state-level analyses have not
shown clearly how best toachieve this coordination.In other words, nominimum standard forpolicy coordination hasbeen proposed. In thissection, we (1) review theconcept of a minimumstandard that is most oftenespoused in economicsand policy analysis(Paulsen, 2001b), (2)summarize the cost-benefit analysis ofimplementing thisminimum standard, and(3) consider the implica-
tions of the recommended coordination strategy.The analyses estimate costs and benefits for theaverage freshman class in the 1990s. Further data
16
analysis would be needed to estimate the full costsfor future years.
Setting a minimum standardof coordination
The idea that states should coordinate need-based aid with other public finance strategies has along history, but since a minimum standard hasnever been proposed, it has been difficult for anygroup to make reasonable judgments aboutwhether states have maintained equalpostsecondary opportunity. The concept ofaffordability used in some reports (National Centerfor Public Policy and Higher Education, 2002;2000) relates the price of college to the ability of astate’s population to pay those prices. However,states can have low tuition and still not beequitable if they do not provide adequate grant aidfor the lowest-income students.
Based on a review of trends in the financing ofpublic and private colleges, St. John (2003)recommended that states invest in need-basedgrant programs at a level equaling one-quarter ofthe average public sector tuition charge. In the
The costs and benefits ofimproved policy coordination
○ ○ ○ ○ ○ ○ ○ ○ ○ ○ ○ ○ ○ ○ ○ ○ ○ ○ ○ ○ ○ ○ ○ ○ ○ ○ ○ ○ ○ ○ ○ ○ ○ ○ ○ ○ ○ ○ ○ ○ ○ ○ ○ ○ ○ ○ ○ ○ ○ ○ ○ ○ ○ ○ ○ ○ ○ ○ ○ ○ ○ ○ ○ ○ ○
States can havelow tuition and
still not beequitable if they
do not provideadequate grant
aid for the lowest-income students.

17
1990s, private colleges typically had institutionalgrants equaling about one-quarter of tuitionrevenue. Grant aid in private colleges was oftenleveraged as a means of reaching enrollment goals(McPherson & Schapiro, 1997), an approach thatmixes merit and need in the awarding of aid(Ehrenberg, 2002; Hossler, in press). Theminimum equity standard can protect low-income,college-qualified students in periods when tuitioncharges increase. Making a sufficient investment inneed-based grant aid is necessary in most states toequalize opportunity for high- and low-incomestudents who are college-qualified.
To achieve the public policy goal of equalpostsecondary opportunity, states should balancefour goals:
■ Provide sufficient opportunity to improvecollege enrollment rates for high schoolgraduates (a structural measure of access) inquality institutions.
■ Provide sufficient student aid to equalizeopportunity for similarly prepared high-and low-income students (equity) — thisreport suggests a minimum standard forthat goal.
■ Maintain reasonable tax costs per student,as measured by tax expenditures perstudent (tax efficiency).
■ Maintain sufficient revenues per student inpublic colleges to be competitive with peerinstitutions (adequacy).
Assessing alternative strategies:Results from the simulations
The Advisory Committee on Student FinancialAssistance (2002) estimated that 4 million college-qualified students were denied financial access tofour-year colleges during the 1990s because ofinadequate need-based grants. Lee (2001) used amore conservative analysis. He estimated that140,666 college-qualified, low-income students inthe high school class of 1992 did not enroll, in
part due to shortfalls in need-based grants. If thisnumber of students were left behind each year ofthe 1990s, then 1.4 million college-qualified, low-income students would have been denied access inthat decade. Regardless of which estimate ofenrollment shortfall one uses, it is apparent that alarge number of college-qualified students wouldhave enrolled in college in the 1990s had therebeen adequate need-based student financial aid.
The next two sections of this report examinethe costs and benefits of two possible strategies formeeting the minimum equity standard:
Option 1: Improved state coordination: Thefirst option would raise the average need-basedstate grant to an amount equaling one-quarter oftuition. This increase would vary by state, but eachstate would bring its average grant up to one-quarter of public sector tuition.
Option 2: A new state-federal partnership: Inthe second option, we propose a second-tier grantprogram. This new grant would be awarded on topof any grant programs states currently offer. Thefederal government would fund one-third of thetotal cost of this new grant program. The proposalfor the $2-to-$1 match is based on the currentformula used in the federal Leveraging EducationalAssistance Partnership Program (LEAP).
Estimated enrollment effects
Table 4 on the next page presents the esti-mated enrollment effects for Option 1, improvedstate policy coordination. (The method used toestimate the enrollment effects option is summa-rized in Box 1 on Page 19.) The baseline of theenrollment effects for this option suggests that120,500 additional high school graduates wouldhave enrolled in college each year during the1990s. Thus, an additional 1.2 million new highschool graduates would have enrolled throughoutthe decade.

18
High- and low-range estimates of enrollmenteffects are also presented in Table 4 below. If for
some reason the supplyof opportunity (openingsin colleges) or number ofqualified high schoolgraduates was severelylimited, then the programcould result in a smallerincrease in collegeenrollment. However,analyses of high schoolpreparation indicatethere are ample qualifiedhigh school graduates tofill the seats if sufficientaid is available. At theother extreme, if thepercentage of college-
qualified students had been higher and there hadbeen ample postsecondary opportunity, then morestudents would probably have enrolled. The high-range estimates illustrate this type of scenario.
The analysis of the costs and effects ofcoordinating public finance strategies is alsopresented in Table 4. States would need to investan additional $533 million per year to meet theminimum threshold based on data from the 1990s.This amount represents about a 10 percentincrease in state grant programs based on the latestdata from the National Association of StateStudent Grant and Aid Programs (NASSGAP,2003). We estimate that this additional investmentwould have resulted in 1.2 million more studentsenrolling as freshmen over the decade. Accordingto the baseline estimates, the average cost wouldbe $4,400 in new grant dollars per additionalstudent enrolled across the U.S. Of course, theamount of investment necessary to reach theminimum equity standard varies substantiallyacross states.
Table 5 on Page 20 illustrates the costs andbenefits of Option 2, a proposed state-federalpartnership to fund a new second-tier state grantprogram. (For simulation methods, refer to Box 2on Page 21.) Clearly, if this partnership had existed
Table 4. Estimated costs and benefits of meeting the minimum equity standards in funding for need-basedgrant: baseline, low-range and high-range estimates
Baseline Low-range effect High-range effect
Estimate of enrollment effectsHigh school graduation Rate increase 1.0% points 1.0% points 1.0% points New graduates 38,000 38,000 38,000
College enrollment Rate increase 3.8% points 1.1% points 6.5% points New enrollment 120,500 50,000 191,000
Estimate of costsCost per new student $4,400 $10,000 $3,000Additional funding for need-based grants (in millions) $ 533 $ 498 $ 568
The amount ofinvestment
necessary to reachthe minimum
equity standardvaries
substantiallyacross states.

19
Box 1 – Estimation of costs for Option 1:Minimum equity standards in need-based state grants
The United States’ figures were estimated as follows.
■ Step 1: For each state, the average tuition (weighted by enrollment) in the 1990s was multipliedby .25, setting a new state grant standard. For the nation, the new grant standard was $650,based on an average national weighted tuition of $2,601.
■ Step 2: For each state, the actual average need-based grant in the 1990s was subtracted from thestandard for that state, producing the additional grant funding necessary for the minimum equitystandard. The national average shortfall, weighted for enrollment, was $264.
■ Step 3: Estimated increases in the rate and number of high school graduates were calculated foreach state using the regression coefficient from a model predicting high school graduation rates.The national rate of increase (1 percent) was calculated by averaging state rates. Total newgraduates (38,000) were calculated by summing state numbers.
■ Step 4: Estimated increases in the rate of college enrollment were calculated for each state usingthe regression coefficients from the model predicting college enrollment rates, taking intoconsideration the adjusted number of high school graduates from Step 3. The national rate ofincrease (3.8 percent) was calculated by averaging the rates of increase for all states. Stateincreases were summed to produce a national total of new enrollment (120,500).
■ Step 5: Program costs for each state were calculated by multiplying the new college freshmanenrollment (original freshman enrollment + increase) by the additional grant funding requiredfor the minimum equity standard (Step 2). Costs for each state were summed to produce anational total of $533.1 million.
■ Step 6: For each state, the cost per new student enrolled was calculated by dividing total costsby the number of new students. Nationally, the cost per new student enrolled was $4,400.
■ Step 7: Low- and high-range effects were produced following the same steps, but applying 95percent confidence limits around the regression coefficient for college enrollment.
NOTE: State-level profiles and calculations are available on the Indiana Education Policy Center Web site atthis URL: http://www.indiana.edu/~iepc/hepolicy/fiscalindicators.pdf

20
in the 1990s, it would have had a substantial,direct impact on enrollment. The baselineestimates indicate that, had the partnership been ineffect, 255,300 additional students would haveenrolled each year in the 1990s — 2.56 millionnew students during the decade, at a cost perstudent of about $4,800 (a total price tag of about$1.23 billion).
Table 5. Estimated costs and benefits of prospective state-federal partnership for need-based grants:baseline, low-range and high-range estimates
Baseline Low-range effect High-range effect
Estimate of enrollment effectsHigh school graduates Rate increase 2.1% points 2.1% points 2.1% points New graduates 77,000 77,000 77,000
College enrollment Rate increase 7.9% points 2.3% points 13.5% points New enrollment 255,300 106,100 404,500
Estimate of costsCost per new student $4,800 $10,400 $3,300Additional funding for need-based grants (in million $) $1,226 $1,107 $1,344 State $ 817 $ 738 $ 896 Federal $ 409 $ 369 $ 448
It is important to note, however, that the high-and low-range estimates assume no change in thecurrent number of high school graduates. If currentK-12 reform efforts (including the No Child LeftBehind Act) succeed, then more students willgraduate from high school and would be eligiblefor grants offered under such a partnership. If thereform efforts fall short of their goals, the effects ofany new aid program would be more limited.

21
Box 2 – Estimation of costs for Option 2:State-federal partnership for need-based state grants
The United States’ figures were estimated as follows.
■ Step 1: For each state, the average tuition (weighted by enrollment) in the 1990s was multipliedby .25, setting a new state grant standard. For the nation, the new grant standard was $650,based on an average national weighted tuition of $2,601.
■ Step 2: Estimated increases in the rate and number of high school graduates were calculated foreach state using the regression coefficient from a model predicting high school graduation rates.National rates of increase (2.1 percent) and total new graduates (77,000) were calculated byaveraging state rates and summing state numbers.
■ Step 3: Estimated increases in college enrollment were calculated for each state using theregression coefficient from the model predicting college enrollment rates. A national rate ofincrease (7.9 percent) was calculated by averaging the rates of increase for all states. Stateincreases were summed to produce a national total (255,300).
■ Step 4: Program costs for each state were calculated by multiplying the new college freshmanenrollment (original + increase) by $650, the state standard set in Step 1. Costs for each statewere summed to produce a national total of $1.226 billion. For each state, the federal share wasassumed to be 1/3 and the state’s share was assumed to be 2/3. Nationally, the federal share wasestimated at approximately $408.6 million and the states’ share was estimated at $817.2 million.
■ Step 5: For each state, the cost per new student enrolled was approximated by dividing totalcosts by the number of new students. The national average cost per new student enrolled was$4,800.
■ Step 6: Low- and high-range effects were produced following the same steps, but applying 95percent confidence limits around the regression coefficient for college enrollment.
NOTE: State-level profiles and calculations are available on the Indiana Education Policy Center Web site atthis URL: http://www.indiana.edu/~iepc/hepolicy/fiscalindicators.pdf

22
A lthough there has been substantialdisagreement in the policy literatureabout underlying causes of thecurrent access challenge, there is
general agreement that college access should beexpanded, especially for college-prepared, low-income students.
During the 1990s, states allowed public tuitioncharges to rise when they lacked tax revenues to
provide continuity infunding for state collegesand universities. However,funding of state need-basedgrants did not increase at arate that held harmlessstudents from low-incomeand other disadvantagedbackgrounds. This lack ofinvestment had significantnegative consequences forcollege enrollments. Thisstudy examined the effectsof state finance strategies oncollege enrollment rates anddocumented the substantial
direct influence of need-based grant aid on collegeenrollment during the 1990s (Table 2). Based onour analyses, had states coordinated increases inneed-based grants with increases in tuition, an
estimated 1.21 million additional students wouldhave enrolled in the 1990s.
Investing sufficiently in student grantsrepresents an efficient use of tax dollars, especiallyif the goal of public policy is to equalizepostsecondary opportunity. Although a state thatprovided an across-the-board new investment interms of per-FTE direct appropriations may havekept tuition at a reasonable level, the tuitionreduction resulting from the increased stateinvestment is not likely to have yielded as manynew students. Moreover, the taxpayer cost perstudent enrolled in higher education would haveincreased.
The proposed state-federal partnershiprepresents a more workable approach for improv-ing financial access for qualified students than anyof the other options now open to the federalgovernment. The cost to the federal governmentper new student enrolled would be $1,600,substantially less than other forms of federalstudent aid. For states, the new program wouldcost about $3,200 per new student, which issignificantly less than the investment necessary forstates to maintain a minimum need-based grantthreshold on their own.
The challenge facing state and federal policy isto expand access while making more efficient useof tax dollars that are available for higher educa-
Conclusions and implications○ ○ ○ ○ ○ ○ ○ ○ ○ ○ ○ ○ ○ ○ ○ ○ ○ ○ ○ ○ ○ ○ ○ ○ ○ ○ ○ ○ ○ ○ ○ ○ ○ ○ ○ ○ ○ ○ ○ ○ ○ ○ ○ ○ ○ ○ ○ ○ ○ ○ ○ ○ ○ ○ ○ ○ ○ ○ ○ ○ ○ ○ ○ ○ ○
A state-federalpartnership
represents a moreworkable
approach forimproving
financial access.
23
tion. If the United States is to meet the college-access challenge of the early 21st century, thenchanges in higher education finance are necessary.The federal government can help states meet thisaccess challenge by:
■ Providing a basic grant that meets aminimum adequacy threshold (i.e., a Pellgrant that is equal to room and board costin public colleges).
■ Initiating a new state-federal grant programthat provides tuition support for college-qualified students who have financial need.
The basic grant could be achieved by settingthe Pell maximum at the average living costs ofpublic colleges in the U.S., then indexing thegrant to inflation so there would be no incentiveto raise living costs. The maximum Pell awardsduring the past four years have been relativelyclose to this standard. Therefore this modificationto the Pell grant program would represent amodest additional investment in this crucial federalprogram.
The proposed state-federal partnership(Option 2, Page 21) would set a maximum need-based award in each state at the tuition level ofpublic colleges. Students in private colleges couldbe eligible for the maximum award, possibly with amodest tuition equalization supplement.21 Thecost-benefit analysis for this proposal indicates
that the nation would realize gains in enrollmentrates with a sufficient investment in need-basedgrant aid. This state-federal partnership wouldprovide a low-cost approach for the federalgovernment to ensure financial access for college-qualified, low-income high school graduates.
In the current context, the burden of paying forexpanding college access falls substantially onstates. In this proposed state-federal grant program,the federal government would make a modest newinvestment. States would have an incentive todevelop more economical approaches for financingthe expansion of the public and private colleges. Inaddition, the state-federal collaboration wouldhave substantially lower costs for federal taxpayersthan the widely advocated option of doubling ortripling the size of Pell grants.
Although this program may result in additionalincreases in tuition during the first few decades ofthe 21st century, the public investments in highereducation would become more efficient and moreprogressive. That is, higher-income families wouldpay the “market” price for college, while statesupport would make that price more affordable formoderate- and low-income families. It is time tomake tough choices. It simply is not possible tocontinue to reduce taxes, allow tuitions to increaseto inaccessible levels, and expand access to four-year colleges. Coordination of federal and statefinance strategies is a feasible way to meet theaccess challenge.

24
Appendices○ ○ ○ ○ ○ ○ ○ ○ ○ ○ ○ ○ ○ ○ ○ ○ ○ ○ ○ ○ ○ ○ ○ ○ ○ ○ ○ ○ ○ ○ ○ ○ ○ ○ ○ ○ ○ ○ ○ ○ ○ ○ ○ ○ ○ ○ ○ ○ ○ ○ ○ ○ ○ ○ ○ ○ ○ ○ ○ ○ ○ ○ ○ ○ ○

25
Appendix 1: State indicators for demographicand financial variables
Annual reports by NCES in the IntegratedPostsecondary Education Data System (IPEDS), aswell as supplemental analyses provided by TomMortenson at Postsecondary Education Opportu-nity, provided data for state indicators. Theindicators related to school outcomes were:
■ High school graduation rate, used as anoutcome measure (calculated from NCEShigh school graduation data and theenrollment when the cohorts were in ninthgrade).
■ College enrollment rate, used as anoutcome measure (fall enrollment reportswere used to calculate the percentage ofhigh school graduates enrolled in highereducation in the following fall22).
In addition, we used one indicator related tothe size of the K-12 population as a control forpopulation size:
■ Size of the ninth-grade cohort, used as anindependent variable to control forpopulation size (from NCES’s CommonCore of Data).
IPEDS was the primary data source for theindicators related to tuition and financial aid.Analysis of IPEDS represented a major part of thework required to complete this project, given thecomplexity of this information system.23 IPEDSwas used for information on:
■ College finances (College tuition weightedper FTE).24
■ State system and college enrollment (Fallenrollment data were used to developweights25 for financial indicators and tocalculate the percentage of FTE studentsenrolled in the various sectors of higher
education, public four-year, public two-year, and private colleges in the state.These analyses used total FTE rather thancollege freshman enrollment because thisprovided a better indicator of capacity.
The other indicators related to publicfinancing of higher education included:
■ Tax rate (state tax collection in a given yeardivided by personal income, an indicatorfrom U.S. Census Bureau, State Govern-ment Tax Collections).
■ Need-based grants adjusted per FTE. (Totalneed-based grants were derived fromNASSGAP, Annual Survey Reports anddivided by undergraduate FTE in the state.)
■ Non-need grants adjusted per FTE. (Thesum of total merit and other grants,calculated from NASSGAP, Annual SurveyReports, divided by undergraduate FTE.)
■ K-12 expenditures per FTE (NCES,National Public Education Financial Survey).
In addition, this report uses the following stateindicators, developed from other data sources:26
■ Percent poverty in the population27 (U.S.Census Bureau, Current PopulationSurvey).
■ Percent African-American (U.S. CensusBureau, Population Estimates).
■ Percent Hispanic (U.S. Census Bureau,Population Estimates).
■ Percent other minority (calculated byadding the percentages of Native Ameri-cans and Asians and dividing by the statepopulation, U.S. Census Bureau, Popula-tion Estimates).
■ Percent of the population with bachelor’sdegrees or higher28 (U.S. Census Bureau,Current Population Survey).

26
Appendix 2: The impact of state financialstrategies on high school graduation rates
As explained in the report, state financestrategies can influence high school graduates intwo ways (see Figure 1, Page 9). State funds forschool and tax rates have a direct effect. Inaddition, the tuition charges and grant aidprograms in a state two years prior to a cohort’sgraduation can influence enrollment rates becausethey influence perceptions of college affordability.
Model specificationsWhen assessing the impact of state finance
policies on high school graduation rates, it isappropriate to use linear models because theoutcomes are continuous variables. This reportpresents the results of two fixed-effect regressionanalyses of the impact of public finance policies onaccess using the state indicators data29 (seeAppendix 1). Variables considered in the regres-sion predicting high school graduation rates areshown in Table 2.1 below.
In addition to these variables, the capacity ofstate systems (number of enrollment slots in thepublic system) can constrain or expand opportu-
nity. Unfortunately, we did not have an appropri-ate indicator for total capacity of public systems.
This analysis used a fixed-effects regression.This method includes a latent variable for eachstate, so the analysis essentially controls for theunique characteristics of states.30
High school graduation ratesThe availability of financial aid has an indirect
effect on college enrollment rates because itinfluences the will of low-income students to finishhigh school (Advisory Committee on StudentFinancial Assistance, 2002; St. John, 2003).Simply put, students may drop out if they do notthink they can get the money they need to pay forcollege. By the junior year, most students havesome understanding of college affordability andavailable grant aid. If a junior has a 2.5 GPA, butthe states give grants only to students with a 3.0,then the state’s aid system could have a negativeeffect on graduation. High school graduation rateswere influenced by the demographic context ofthe state and the strategies used to finance highereducation, controlling for public finance of schools(Table 2.2 on the next page).
Table 2.1. Independent variables used in analysis of high school graduation rates
■ Demographic context1. Percent of the state population below the poverty level2. Percent of African-Americans in the population3. Percent of Hispanics in the population4. Percent of other minorities in the population5. Size of the ninth-grade cohort four years prior6. Percent of the population with a bachelor’s degree or higher
■ Financial controls1. Tax rate2. K-12 expenditures (two years before graduation)
■ Higher education finance strategies1. Need-based grants per-FTE (two years before high school graduation)2. Non-need grants per-FTE (two years before high school graduation)3. Tuition charges weighted per-FTE (two years before high school graduation)

27
Three of the demographic variables weresignificant in the fixed-effects regression analysis.The percentage of Hispanics in a state’s populationwas positively associated with high schoolgraduation. The percentage of the population thatcomprises other minorities and the percentage thathad a bachelor’s degree or higher were negativelyassociated with high school graduation rates.
The reasons why education level was nega-tively associated with high school graduation ratesare complex. Since this report provides the firststate-level study of this type, it is likely thesemethods can be improved upon. The fixed-effectsanalysis statistically controls for the state context.First, we can only speculate about the explanationsof the finding on education levels of the popula-
tion. If states import highly educated citizens, theymay have artificially depressed high schoolgraduation rates in these statistical models becausethe population with children is less well-educated(on average) than new citizens attracted to thesestates. Alternatively, an educated citizenry couldkeep educational standards high, which maydissuade low-achieving students. Second, highschool graduation rates actually declined in the1990s, which adds to the complexity of interpret-ing this finding. The decline in graduation rates ispartially attributable to the impact of stateeducation reforms.32 The impact of school reformsis “controlled for” by the state variables implicit33
in fixed-effects models. Therefore the effects ofsome reforms could confound these analyses.
Table 2.2. Fixed-effect regression: the influence of population characteristics and state finance strategieson public high school graduation rate in the 1990s
Regression coefficient Unstand. Standard.
Percent poverty 0.063 0.025Percent African-American 0.774 0.803Percent Hispanic 1.222 1.103 *Percent other minorities -5.356 -5.366 ***Enrollment when the cohort was ninth grade 0.000 0.262Percent of population with bachelor’s degree or higher -0.310 -0.151 **
Tax rate (=state tax collection/personal income) 0.100 0.015Per student K-12 expenditures ($/1,000) two years prior -0.003 -0.027
Per-FTE need-based grant amount ($/1,000) two years prior 0.031 0.094Per-FTE non-need grant amount ($/1,000) two years prior -0.061 -0.097 **Undergrad in-state tuition and fees for public system
($/1,000) two years prior -0.321 -0.371 ***
Adjusted R square 0.933N 200P-value for F test that all u
i=031 0.000
Note: *** p<0.01, ** p<0.05, * p<0.1
Sig.
28
This analysis addresses questions about theinfluence of a state’s demographic composition onhigh school graduates. The fixed-effects approachcontrols for specific state contexts in a set ofuncoded variables for the state. When thisapproach is used, the education level of thepopulation has a substantially different effect onhigh school graduation rates than we would expectfrom research on academic preparation. This resultsuggests that further research is needed on theeffects of school reform policies on high schoolgraduation rates.
Tuition charges and state grants, both measuredtwo years prior to graduation, also had an influence
on high school graduation rates. Both tuitioncharges and non-need grants were negativelyassociated with high school graduation rates.34
Need-based grants were not significant, but had apositive association with high school graduationrates.35 Higher need-based grants had a positiveassociation with high school graduation rates,36
while higher merit-based grants were negativelyassociated with graduation rates. This statisticalassociation may have occurred because studentswith low grades believe they cannot afford toattend college in their states if they do notmaintain the grade point requirements necessary toattain merit-based grants.

29
Appendix 3: Ordinary least squares regressions
This appendix presents the ordinary least squares (OLS) regression for high school graduation rates(Table 3.1) and college enrollment rates (Table 3.2). These tables are provided for comparison purposes andare discussed in the text and end notes.
Sig. Regression coefficient Unstand. Standard.
Percent poverty -0.206 -0.081Percent African-American -0.612 -0.634 ***Percent Hispanic -0.416 -0.375 ***Percent other minorities -0.118 -0.118 **Enrollment when the cohort was ninth grade -0.000 -0.063Percent of population with bachelor’s degree or higher 0.274 -0.134 **
Tax rate (=state tax collection/personal income) 0.241 0.037Per student K-12 expenditures ($/1,000) two years prior -0.013 -0.129 *
Per-FTE need-based grant amount ($/1,000) two years prior 0.102 0.311 ***Per-FTE non-need grant amount ($/1,000) two years prior -0.060 -0.097 **Undergrad in-state tuition and fees for public system
($/1,000) two years prior -0.039 -0.045
Adjusted R square 0.630N 200
Note: *** p<0.01, ** p<0.05, * p<0.1
Table 3.1. OLS regression: The influence of population characteristics and state finance strategies onpublic high school graduation rate in the 1990s

30
Table 3.2. OLS regression: The influence of population characteristics and state finance strategies oncollege enrollment rate in the 1990s
Regression coefficient Unstand. Standard.
Percent poverty -0.206 -0.081Percent African-American -0.612 -0.634 ***Percent Hispanic -0.416 -0.375 ***Percent other minorities -0.118 -0.118 **Enrollment when the cohort was ninth grade -0.000 -0.063Percent of population with bachelor’s degree or higher 0.274 -1.134 **
Tax rate (=state tax collection/personal income) 0.241 0.037Per student K-12 expenditures ($/1,000) two years prior -0.013 -0.129 *
Per-FTE need-based grant amount ($/1,000) two years prior 0.102 0.311 ***Per-FTE non-need grant amount ($/1,000) two years prior -0.060 -0.097 **Undergrad in-state tuition and fees for public system
($/1,000) two years prior -0.039 -0.045
Adjusted R square 0.630N 200
Note: *** p<0.01, ** p<0.05, * p<0.1
Sig.
31
References○ ○ ○ ○ ○ ○ ○ ○ ○ ○ ○ ○ ○ ○ ○ ○ ○ ○ ○ ○ ○ ○ ○ ○ ○ ○ ○ ○ ○ ○ ○ ○ ○ ○ ○ ○ ○ ○ ○ ○ ○ ○ ○ ○ ○ ○ ○ ○ ○ ○ ○ ○ ○ ○ ○ ○ ○ ○ ○ ○ ○ ○ ○ ○ ○
Adelman, C. (1999). Answers in the tool box:Academic intensity, attendance patterns, andbachelor’s degree attainment. Washington, DC:National Center for Education Statistics.
Advisory Committee on Student FinancialAssistance. (2002). Empty promises: The myth ofcollege access in America. Washington, DC:Advisory Committee on Student FinancialAssistance.
Alexander, K.L., & Eckland, B.K. (1974). Sexdifferences in the educational attainmentprocess. American Sociological Review, 59, 668-82.
Alexander, K.L., & Eckland, B.K. (1977). Highschool context and college selectivity:Institutional constraints in educationalstratification. Social Forces, 56(1), 166-88.
Alexander, K.L., & Eckland, B.K. (1978). Basicattainment processes: A replication andextension, 1999. Sociology of Education, 48,457-95.
Alliance for Equity in Higher Education. (2003).Policy priorities for the Higher Education Actreauthorization. Washington, DC.
Bennett, W.J. (1987). Our greedy colleges. NewYork Times, 18 February, I 31.
Berger, J.B., & Coelen, S.P. (2002). Bridges andbarriers: The impact of high stakes testing on collegeaccess. Paper presented at the Association forthe Study of Higher Education, Sacramento, CA.
Binder, M., & Ganderton, P.T. (2001). Musicalchairs in higher education: Incentive effects of theNM success scholarships. Presented at The CivilRights Project Forum on: State merit aidprograms: College access and equity, HarvardUniversity, December 2001.
Blau, P., & Duncan, O.D. (1967). The Americanoccupational structure. New York: Wiley.
Carnes, B.M. (1987). The campus cost explosion:College tuitions are unnecessarily high. PolicyReview, 40, 68-71.
Choy, S.P. (2002). Access & persistence: Findings from10 years of longitudinal research on students.Washington, DC: American Council onEducation.
College Board. (2003). Challenging times, clearchoices: An action agenda for college access andsuccess. Washington, DC.
Cornwell, C., Mustard, D.B., & Sridhar, D.J.(2001). The enrollment effects of merit-basedfinancial aid: Evidence from Georgia’s HOPEScholarship. Presented at The Civil RightsProject Forum on: State merit aid programs:College access and equity, Harvard University,December 2001.
Davis, J.S. (1997). College affordability: A closer lookat the crisis. Washington, DC: Sallie MaeEducation Institute.
32
Dresch, S.P. (1975). A critique of planning modelsfor postsecondary education: Currentfeasibility, potential relevance and a prospectusfor future research. Journal of Higher Education,46, 246-86.
Dynarski, S. (2000). Hope for whom: Financial aidfor the middle class and its impact on collegeattendance. National Bureau of EconomicResearch, Working paper 7756. Cambridge,MA: NBER.
Ehrenberg, R.G. (2002). Tuition rising: Why collegecosts so much. Cambridge: Harvard UniversityPress.
Ellwood, D., & Kane, T.J. (2000). Who is getting acollege education: Family background and thegrowing gaps in enrollment. In S. Danziger &J. Waldfogel (Eds.), Securing the future: Investingin children from birth to college. New York:Russell Sage Foundation.
Finn, C.E. (1988). Judgment time for highereducation: In the court of public opinion.Change (July/August), 35-38.
Gladieux, L.E., & Swail, W.S. (1999). Financial aidis not enough: Improving the odds for low-income and minority students. In J.E. King(Ed.), Financing a college education: How itworks, how it is changing (pp. 177-197).Phoenix, AZ: Oryx Press.
Hansen, W.L, & Weisbrod, B.A. (1969). Benefits,costs, and finance of public higher education.Chicago: Markham Pub. Co.
Hearn, J.C. (2001). Access to postsecondaryeducation: Financing equity in an evolvingcontext. In M.B. Paulsen & J.B. Smart (Eds.),The finance of higher education: Theory, research,policy & practice (pp. 419-439). New York:Agathon Press.
Hearn, J.C., & Anderson, M.S. (1989). Integratingpost-secondary education financing policies:The Minnesota model. In Robert H. Fenske(Ed.), Studying the impact of student aid oninstitutions. New Directions in InstitutionalResearch, no. 62. San Francisco: Jossey-Bass.
Hearn, J.C., & Anderson, M.S. (1995). TheMinnesota financing experiment. In Edward P.
St. John (Ed.), Rethinking tuition and student aidstrategies. New Directions for Higher Educa-tion, no. 89. San Francisco: Jossey-Bass.
Hearn, J.C., & Longanecker, D. (1985). Enrollmenteffects of alternative post-secondary pricingpolicies. Journal of Higher Education, 56(5),485-508.
Heller, D.E. (1997). Student price response inhigher education: An update to Leslie andBrinkman. Journal of Higher Education, 68, 624-659.
Hossler, D. (In press). Refinancing publicuniversities: Student enrollments, incentive-base budgeting and incremental revenue. InE.P. St. John & M.D. Parsons (Eds.), Publicfunding of higher education: Changing contexts andnew rationales. Baltimore: Johns HopkinsUniversity Press.
Hu, S., & St. John, E.P. (2001). Student persistencein a public higher education system: Under-standing racial/ethnic difference. Journal ofHigher Education, 2, 265-86.
Jackson, G.A. (1978). Financial aid and studentenrollment. Journal of Higher Education, 49,548-74.
Jackson, G.A. (1988). Did college choice changeduring the seventies? Economics of EducationReview, 7, 15-27.
Jackson, G.A., & Weathersby, G.B. (1975).Individual demand for higher education.Journal of Higher Education, 46(6), 623-52.
Jacob, B.A. (2001). Getting tough? The impact ofhigh school graduation exams. EducationalEvaluation and Policy Analysis, 23, 99-121.
King, J.E. (Ed.). (1999). Financing a collegeeducation: How it works, how it is changing.Phoenix, AZ: Oryx Press.
Lee, J.B. (2001). Access for low-income students.Presented at the National Governors Associa-tion Center for Best Practices. Washington, DC.
Leslie, L.L., & Brinkman, P.T. (1988). The economicvalue of higher education. New York: Macmillan.
Manski, C.F., & Wise, D.A. (1983). College choice inAmerica. Cambridge, MA: Harvard UniversityPress.

33
McPherson, M.S. (1978). The demand for highereducation. In D.W. Breneman & C.E. Finn, Jr.(Eds.), Public policy and private higher education(pp. 143-46). Washington, DC: BrookingsInstitution.
McPherson, M.S., & Schapiro, M.O. (1991).Keeping college affordable: Government andeducational opportunity. Washington, DC: TheBrookings Institution.
McPherson, M.S., & Schapiro, M.O. (1997). Thestudent aid game. Princeton, NJ: PrincetonUniversity Press.
Mortenson, T. (2002, June). College continuationrates for recent high school graduates 1959 to2000. Postsecondary Education Opportunity.Retrieved January 15, 2003, from http://www.postsecondary.org/ti/ti_11.asp
National Association of State Student Grant andAid Programs. (2003). 33rd Annual Survey Reporton state-sponsored student financial aid, 2001-2002 academic year. By Kristen DeSalvatore,Linda Hughes and Erika Gee. New YorkHigher Education Services Corporation.
National Center for Education Statistics. (1997a).Access to higher postsecondary education for the1992 high school graduates, NCES 98-105. ByLutz Berkner & Lisa Chavez. Project Officer:C. Dennis Carroll. Washington, DC: NCES.
National Center for Education Statistics. (1997b).Confronting the odds: Students at risk and thepipeline to higher education. NCES 98-094. ByLaura J. Horn. Project Officer: C. DennisCarroll. Washington, DC: NCES.
National Center for Education Statistics. (2000).Mapping the road to college: First-generationstudents’ math track, planning strategies, andcontext of support, NCES 2000-153. By LauraHorn & Anne-Marie Nunez. Project Officer:Larry Bobbitt. Washington, DC: NCES.
National Center for Education Statistics. (2001a).Bridging the gap: Academic preparation andpostsecondary success of first-generation students,NCES 2001-153. By Edward C. Warburton &Rosio Bugarin. Project Officer: C. DennisCarroll. Washington, DC: NCES.
National Center for Education Statistics. (2001b).Students whose parents did not go to college:Postsecondary access, persistence, and attainment.By Susan Choy. Washington, DC: NCES.
National Center for Public Policy in HigherEducation. (2002). Losing ground. San Jose, CA:National Center for Public Policy in HigherEducation.
National Center for Public Policy in HigherEducation. (2000). Measuring up. San Jose, CA:National Center for Public Policy in HigherEducation.
National Commission on the Financing ofPostsecondary Education (NCFPE). (1973).Financing postsecondary education in the UnitedStates. Washington, DC: GPO.
Pascarella, E.T., & Terenzini, P.T. (1991). Howcollege affects students. San Francisco: Jossey-Bass.
Paulsen, M.B. (2001a). The economics of humancapital and investment in higher education. InM.B. Paulsen & J.C. Smart (Eds.), The finance ofhigher education: Theory, research, policy &practice (pp. 55-94). New York: Agathon Press.
Paulsen, M.B. (2001). The economics of the publicsector: The nature of public policy in highereducation finance. In M.B. Paulsen & J.C. Smart(Eds.), The finance of higher education: Theory,research, policy & practice (pp. 95-132). NewYork: Agathon Press.
Pelavin, S.H., & Kane, M.B. (1988). Minorityparticipation in higher education. Washington,DC: Pelavin Associates.
Pelavin, S.H., & Kane, M.B. (1990). Changing theodds: Factors increasing access to college. NewYork: College Board.
Perna, L.W., & Titus, M. (2002). Understanding thebarrier to college access for students with low familyincome and low socioeconomic status: The role ofstate context. Paper presented at the 29th AnnualNASSGAP/NCHELP Student Financial AidResearch Network Conference. Denver, CO.
Price, D.V. (2003). Borrowing inequality: Race, classand student loans. Boulder, CO: Lynne Rienner.

34
St. John, E.P. (1990). Price response in enrollmentdecisions: An analysis of the high school andbeyond senior cohort. Research in HigherEducation, 31, 161-76.
St. John, E.P. (1991). What really influencesminority attendance? Sequential analyses ofthe high school and beyond sophomorecohort. Research in Higher Education, 32, 141-58.
St. John, E.P. (1993). Untangling the web: Usingprice-response measures in enrollmentprojections. Journal of Higher Education, 64,676-95.
St. John, E.P. (1994a). Prices, productivity andinvestment: Assessing financial strategies in highereducation. ASHE/ERIC Higher EducationReport, No. 3. Washington, DC: GeorgeWashington University.
St. John, E.P. (1994b). Retrenchment: A three-statestudy. Thought & Action, 10(2), 137-142.
St. John, E.P. (1995). “Hard decisions”: Retrench-ment and the faculty role. Thought & Action,11(1), 25-42.
St. John, E.P. (1999). Evaluating state grantprograms: A case study of Washington’s grantprogram. Research in Higher Education, 40(2),149-170.
St. John, E.P. (2002). The access challenge: Rethink-ing the causes of the new inequality. Policy IssueReport # 2002-01. Bloomington, IN: IndianaEducation Policy Center.
St. John, E.P. (2003). Refinancing the college dream:Access, equal opportunity, and justice for taxpay-ers. Baltimore: Johns Hopkins University Press.
St. John, E.P., Hu, S., & Weber, J. (2000). Keepingpublic colleges affordable: A study of persis-tence in Indiana’s public colleges and universi-ties. Journal of Student Financial Aid, 30(1), 21-32.
St. John, E.P., Hu, S., & Weber, J. (2001). Statepolicy and the affordability of public highereducation: The influence of state grants onpersistence in Indiana. Research in HigherEducation, 42, 401-428.
St. John, E.P., Musoba, G.D., Simmons, A.B., &Chung, C.G. (2002). Meeting the access challenge:
Indiana’s Twenty-first Century Scholars Program. NewAgenda Series, vol. 4, no. 4. Indianapolis:Lumina Foundation for Education.
St. John, E.P., Musoba, G.D., Simmons, A.B.,Schmit, J., Chung, C.G., & Peng, C-Y.J.(November, 2002). Meeting the access challenge: Anexamination of Indiana’s Twenty-first Century ScholarsProgram. Prepared for the Association for theStudy of Higher Education Annual Meeting,Sacramento, CA.
St. John, E.P., & Noell, J. (1989). The impact offinancial aid on access: An analysis of progresswith special consideration of minority access.Research in Higher Education, 30(6), 563-582.
St. John, E.P., & Paulsen, M.B. (2001). The financeof higher education: Implications for theory,research, policy, and practice. In M.B. Paulsen& J.C. Smart (Eds.), The finance of highereducation: Theory, research, policy & practice (pp.11-38). New York: Agathon.
St. John, E.P., Simmons, A.B., Hoezee, L.D.,Wooden, O.S., & Musoba, G.D. (2002). Trendsin higher education finance in Indiana compared topeer states and the U.S.: A changing context,critical issues, and strategic goals. Policy ResearchReport #02-02. Bloomington, IN: IndianaEducation Policy Center.
St. John, E.P., & Starkey, J.B. (1995). An alterna-tive to net price: Assessing the influence ofprices and subsidies on within-year persistence.Journal of Higher Education, 66(2), 156-86.
Steelman, L.C., & Powell, B. (1993). Doing theright thing: Race and parental locus ofresponsibility for funding college. Sociology ofEducation, 66(4), 223-244.
Tierney, W., & Hagedorn, L. (2002). Increasingaccess to college: Extending the possibilities for allstudents. Albany, NY: State University of NewYork Press.

35
1 The term “non-need” is used for merit andother specially directed grants that do not usefinancial need for eligibility.
2 In the ordinary least squares analysis, need-based grants had a significant and positiveassociation with graduation rates. Theserelationships are confounded by the use ofstate context variables in the fixed-effectsanalysis.
3 The measurement of the impact of socialvariables (i.e., parents’ education and income)on educational attainment is rooted insociological theory and research (Alexander &Eckland, 1974, 1977, 1978; Blau & Duncan,1967) and recent studies that examine socialcapital formation (Ellwood & Kane, 2000;Hearn, 2001; Steelman & Powell, 1993).
4 This study tested the use of both poverty ratesand income per capita. However, the twovariables were highly correlated, thereforepoverty rate was used as a predictor because itrelated more directly to the financial accessissues that were of concern in this report. Inaddition, since tax rate was used in theanalyses, we had an additional statisticalcontrol for the influence of wealth. In responseto inquiries from reviewers of an earlier versionof this analysis, the study team also tested theuse of unemployment rates as a predictor
Endnotes○ ○ ○ ○ ○ ○ ○ ○ ○ ○ ○ ○ ○ ○ ○ ○ ○ ○ ○ ○ ○ ○ ○ ○ ○ ○ ○ ○ ○ ○ ○ ○ ○ ○ ○ ○ ○ ○ ○ ○ ○ ○ ○ ○ ○ ○ ○ ○ ○ ○ ○ ○ ○ ○ ○ ○ ○ ○ ○ ○ ○ ○ ○ ○ ○
variable. However, as expected, unemploymentwas very highly correlated with poverty rate;therefore, it was not included in the finalmodel.
5 This study controls for the influence of schoolfunding, but not school reform policies. Highschool graduation rates dropped during the1990s, a period during which more stringentrequirements were implemented. Therefore, tofully assess the impact of school funding ongraduation rates, it would also be necessary toexamine the impact of school reform policies.
6 In earlier analyses the research team haddeveloped separate analyses of enrollment ratesin public two-year colleges, public four-yearcolleges, private colleges and colleges in otherstates. The project advisory committeesuggested modifying the base access model toconsider the role of system complexity, as analternative to presenting a larger number ofstatistical models. In particular, Laura Pernawas helpful in conceptualizing the role ofsystem capacity in the access models presentedin the paper.
7 The early analyses included an analysis of theimpact of state financial strategies on thepercentage of high school graduates whoenroll out of state. These analyses will bepublished separately, along with the analyses of
36
the impact of state financial strategies on thedistribution of high school graduates withinstate systems.
8 The OLS regressions provide a useful set ofanalyses for comparison purposes. The end-notes are used to provide comments on theOLS regressions in comparisons to the fixed-effect regressions.
9 Dresch (1975) was among the first to critiquesimulations that used price response measuresto predict the effects of changes in policy onenrollment. Although there was a substantialeffort after Dresch’s critique to improve themethods used to standardize price responsemeasures (Jackson & Weathersby, 1975; Leslie& Brinkman, 1988; McPherson, 1978), theseanalyses did not overcome the logicalproblems identified by Dresch. St. John (1993,1994a, 2003) has systematically tested Dresch’sassumptions, which hold up well. Thesimulation methods used in this paper carrythese efforts to the next step by using aspecially assembled state database to examinethe effects of state grants and to simulate theimpact of alternative methods of awardinggrants.
10 The analyses in Table 2 and Appendix 2 used afixed-effects regression. Appendix 3 presentsthe OLS regression for the same model.Comparisons between the two models aremade in endnotes.
11 There is a substantial body of research toindicate that access by low-income students isdirectly affected by changes in need-based aid(see reviews by Heller [1997] and St. John[2003]).
12 The readers are reminded that since thisanalysis considers the population that hasgraduated from high school, it controls for aminimum level of academic preparation.Further, high school graduation is an appropri-ate measure of preparation for enrollment incommunity colleges. While federal aid policies,including need-based and non-need grants,vary over time with changes in enrollment
rates, especially for low-income students (St.John, 2003), they cannot be used to examinethe effects of state finances. Since federalprograms have consistent award criteria acrossthe states, Pell grants and other federal aid donot substantially vary across states withinyears.
13 One difference between the OLS regressionand the fixed-effects regression is that thepercentage of African-Americans in thepopulation was positively associated withenrollment in the OLS regression. The positiveeffects noted in the OLS analyses were relatedto state contexts. Most states with largerpercentages of African-Americans in theirpopulations have historically black collegesand universities (HBCUs) in their publicsystems. The presence of HBCUs is onepossible explanation for this statistical artifact.
14 The findings were similar in the OLS analysis.15 In addition, non-need grants were not
significant in the OLS model.16 Need-based grants are efficient, not only
because of the statistical significance, but alsobecause they cost less than direct subsidies toinstitutions that benefit all students, by holdingdown tuition.
17 While it is conceivable that economies couldbe maintained by constraining expenditures, itis difficult to reduce expenditures in researchuniversities that compete nationally for the topfaculty. For a full discussion of approaches forcoordinating public finance strategies see St.John (2003).
18 Price (2003) also recommends an alternativehybrid policy of federal/state coordination thatincludes an increase in the Pell Grant linked toadditional state grants and/or a specific level ofpublic tuitions. See Borrowing inequality: race,class and student loans. Boulder, CO; LynneRienner Publishers.
19 This proposal adapts and simplifies the two-tier grant strategy proposed by St. John(2003). The initial proposal recommendedsetting the maximum of the base grant at half

37
the average cost of attending a low-cost publiccollege and limiting the second tier to twicethe first tier as a cost-control strategy. Theproposal in this paper sets the maximum forthe base grant at room and board, which wouldequal about half of total cost. The second tierin this proposal would not be limited. Rather, itwould depend on market and political forces tolimit increases (in both prices and grants).
20 The maximum award could be higher forprivate colleges, depending on state priorities.However, the minimum priority should be tocoordinate public tuition charges with need-based grants.
21 A similar approach for private college grantshas been used in Indiana, a state that madesubstantial gains in access in the 1990s (St.John, Musoba, Simmons, & Chung, 2002).
22 The study team used IPEDS, along with datareported annually by Tom Mortenson inPostsecondary Education Opportunitynewsletter and available frompostsecondary.org. Using NCES data,Mortenson calculated college continuationrates by state based on the number of highschool graduates from the Current PopulationSurvey of the Census Bureau and collegefreshmen from the IPEDS Fall Enrollment.
23 It was frequently necessary to sum informationfor campuses and states across different IPEDSdata files in order to develop appropriateindicators.
24 Education revenues and expenditures as well asstate appropriations were considered inpreliminary analyses but not included in thefinal model.
25 College tuition charges in public colleges wereweighted for each state to reflect the actualpattern of enrollment in the state. The numberof undergraduates enrolling in each publiccollege was multiplied by the undergraduatein-state tuition charge for the college, thenthese numbers were summed and divided bythe total number of undergraduates enrolling in
the state. This weighted tuition charge reflectsthe composition of enrollment in the state.
26 These indicators were generally available asstate averages. We generated these indicatorsby abstracting information from generallyavailable sources, which did not require theextensive reanalysis necessary to work with thecumbersome IPEDS databases.
27 We also examined other possible indicatorsrelated to state economic conditions, includingunemployment rates and income per capita.
28 This variable provides a logical control for theinfluence of parents’ education. There is a highcorrelation between the percentage of highschool students in a state whose parentsattended college and the percentage of thepopulation with a four-year degree or higher.We also tested the inclusions of a variable forthe percent of the population with at least ahigh school diploma and/or some college.Including this variable had no discernible effecton the results, so it was left out of the finalmodel.
29 Fixed-effects regression provides the appropri-ate method of analysis given the fact thatmultiple years (or a time series) are included inthe data set. The fixed-effects method providesa means of controlling for the state context.Don Heller, a member of the advisorycommittee, consulted with the research teamon the selection of a regression method.
30 Appendix 3 provides the ordinary least squaresregression tables for comparison with thefixed-effects regression reported in Table 2(Page 11) and Table 2.2 (Page 27).
31 The null hypothesis of the F test is that thestate-specific, fixed-effect terms are all zeros.The fixed-effect model can be judged to besignificantly different from the OLS modelwhen we reject the null hypothesis.
32 Jacob (2001) and Berger & Coelen (2002) bothfound that high school graduation rates werenegatively associated with high-stakesgraduation exams.

38
33 When the fixed-effects method of regression isused, the analysis provides a coefficient foreach state. The data reported in the tablessuppress these individual state variablesbecause they have no meaning other thanproviding a statistical control.
34 Non-need grants and tuition charges werenegatively associated with graduation rates in
the OLS analysis as well, even though tuitioncharges were not significant.
35 In the OLS regression the need-based grantamount was significant and positively associ-ated with high school graduation rates. Thismeans that state contexts reduce the measur-able effects of need-based grants.
36 These positive effects are illustrated in thesimulations presented in the paper.

About the authors
Edward P. St. John is a professor of Educational Leadership and Policy Studies at Indiana University. Hiscurrent research focuses on academic and financial access to higher education. His recent books includeRefinancing the College Dream: Access, Equal Opportunity, and Justice for Taxpayers (2003) and ReinterpretingUrban School Reform (2003).
Choong-Geun Chung is a statistician at the Indiana Education Policy Center at Indiana University. Hisresearch interests are statistical models for school reform, access and persistence in higher education, andissues in minority representation in special education.
Glenda Droogsma Musoba is a policy analyst at the Indiana Education Policy Center and a doctoralcandidate in higher education at Indiana University. Her research interests include access and equity incollege admissions, student persistence and other social justice issues.
Ada B. Simmons is associate director of the Indiana Education Policy Center. Her research focuses onschool reform and college access. She holds a doctorate in higher education from Indiana University.
Ontario S. Wooden is a doctoral candidate in the higher education program at Indiana University and aresearch associate at the Indiana Education Policy Center. His research interests include college access andchoice, higher education policy and finance, and multiculturalism and diversity in higher education.
Jesse Perez Mendez is a doctoral candidate in the higher education program at Indiana University andserved as a research associate at the Indiana Education Policy Center. His research interests include highereducation policy, education law, multicultural education, postsecondary access and state and federallegislation involving education.

Unintended Consequences of Tuition Discounting
Jerry Sheehan Davis
May 2003
Following the Mobile Student; Can We Develop the
Capacity for a Comprehensive Database to Assess
Student Progression?
Peter T. Ewell, Paula R. Schild and Karen Paulson
April 2003
Meeting the Access Challenge: Indiana’s
Twenty-first Century Scholars Program
Edward P. St. John, Glenda Droogsma Musoba,
Ada B. Simmons and Choong-Geun Chung
August 2002
Unequal Opportunity: Disparities in College
Access Among the 50 States
Samuel M. Kipp III, Derek V. Price and Jill K. Wohlford
January 2002
Hope Works: Student use of
Education Tax Credits
Barbara A. Hoblitzell and Tiffany L. Smith
November 2001
Learning in the Fast Lane: Adult Learners’ Persistence
and Success in Accelerated College Programs
Raymond J. Wlodkowski, Jennifer E. Mauldin
and Sandra W. Gahn
August 2001
Debts and Decisions: Student Loans and Their
Relationship to Graduate School and Career Choice
Donald E. Heller
June 2001
Funding the “Infostructure:” A Guide to Financing
Technology Infrastructure in Higher Education
Jane V. Wellman and Ronald A. Phipps
April 2001
Discounting Toward Disaster: Tuition
Discounting, College Finances, and Enrollments
of Low-Income Undergraduates
Kenneth E. Redd
December 2000
Also available from Lumina Foundation for Education○ ○ ○ ○ ○ ○ ○ ○ ○ ○ ○ ○ ○ ○ ○ ○ ○ ○ ○ ○ ○ ○ ○ ○ ○ ○ ○ ○ ○ ○ ○ ○ ○ ○ ○ ○ ○ ○ ○ ○ ○ ○ ○ ○ ○ ○ ○ ○ ○ ○ ○ ○ ○ ○ ○ ○ ○ ○ ○ ○ ○ ○ ○ ○ ○
®
College Affordability: Overlooked Long-Term
Trends and Recent 50-State Patterns
Jerry Sheehan Davis
November 2000
HBCU Graduates:
Employment, Earnings and Success After College
Kenneth E. Redd
August 2000
Student Debt Levels Continue to Rise
Stafford Indebtedness: 1999 Update
Patricia M. Scherschel
June 2000
Presidential Essays: Success Stories —
Strategies that Make a Difference at
Thirteen Independent Colleges and Universities
Allen P. Splete, Editor
March 2000
Are College Students Satisfied?
A National Analysis of Changing Expectations
Lana Low
February 2000
Fifty Years of Innovations in Undergraduate Education:
Change and Stasis in the Pursuit of Quality
Gary H. Quehl, William H. Bergquist and Joseph L. Subbiondo
October 1999
Cost, Price and Public Policy:
Peering into the Higher Education Black Box
William L. Stringer, Alisa F. Cunningham, with
Jamie P. Merisotis, Jane V. Wellman and Colleen T. O’Brien
August 1999
Student Indebtedness:
Are Borrowers Pushing the Limits?
Patricia M. Scherschel
November 1998
It’s All Relative: The Role of Parents in
College Financing and Enrollment
William L. Stringer, Alisa F. Cunningham,
Colleen T. O’Brien and Jamie P. Merisotis
October 1998

Lumina Foundation for Education, a private,independent foundation, strives to help peopleachieve their potential by expanding access and
success in education beyond high school. Throughresearch, grants for innovative programs andcommunication initiatives, Lumina Foundationaddresses issues surrounding access and educationalattainment — particularly among underserved studentgroups, including adult learners. Focusing on these areas, the Foundation framesissues and explores new solutions through fact-basedresearch. Because we strive to be a credible andobjective source of information on issues affectinghigher education, Lumina Foundation encouragesoriginal sponsored research. The results of that research,and therefore the content of this and other LuminaFoundation® publications, do not necessarily representthe views of the Foundation or its employees. Believing that published research may have thelongest-term impact on higher education, theFoundation publishes and disseminates articles, researchreports and books. We prefer topics and approachesthat are more practical than theoretical, and whichemphasize pragmatic tools that will assist institutionsand public policy-makers.
Additional information about the Foundation’sresearch program may be obtained from:
Dr. Robert C. DickesonSenior Vice President for Higher EducationPolicy, Research and [email protected]
Additional information about Lumina Foundation®
programs and communications may be obtained from:Susan O. ConnerExecutive Vice President andChief Operating [email protected]
Lumina Foundation for EducationP. O. Box 1806Indianapolis, IN 46206-1806800-834-5756www.luminafoundation.org
Robert C. DickesonExecutive Editor
David S. PowellDirector of Publications
Jean B. RoseCopy Editor
Natasha SwingleyDesign and Production
Printed by SPG Graphics Inc.
Lumina Foundation for EducationEditorial Advisory Board
Deborah G. BonnetSusan O. ConnerJerry S. DavisDerek V. PriceJill Wohlford
Lumina Foundation for EducationResearch Reports are published periodically byLumina Foundation for EducationP.O. Box 1806Indianapolis, IN 46206-1806
First-class postage paid at Indianapolis, Ind.Copyright © 2004Lumina Foundation for Education, Inc.All rights reserved
Send all name and address changes to:Lumina Foundation for EducationAttn: Database Manager3813 E. Winston StreetBloomington, IN [email protected]
February 2004 (2)
RESEARCH REPORT


![I T Supreme Court of the United Statessblog.s3.amazonaws.com/wp-content/uploads/2014/07/... · hair growth drugs). As the FDA has explained, “[a]lthough many of these eyelash growth](https://img.dokumen.tips/doc/110x75/5fafe1df8b84e468ea40ba8d/i-t-supreme-court-of-the-united-statessblogs3-hair-growth-drugs-as-the-fda-has.jpg)