Embed Size (px)
Citation preview

Near Infrared Spectroscopy for the Fruit Qualityanalysis
Mrs. ManishaVikasBhanuse
Research Scholar, Department of Electronics Engg.,
Shivaji University, Kolhapur, Maharashtra, India.
Prof. Dr. S. B. Patil
Dean III, JJMCOE, Jaysingpur,
Maharashtra, India
Abstract
Near infrared spectroscopy (NIR) is increasingly used during
basic research performed to better understand complex
materials encountered in agricultural, pharmaceuticals,
combustion products, astronomy etc.This method is relatively
inexpensive, rapid, non-invasive, non-destructive and is able
to measure several constituents concurrently. Therefore interest in the application of near infrared spectroscopy to
biological material Science has grown in recent times.Current
manual methods of fruit quality analysis are dominated by
near infrared analysis. This paper intends to review the basic
theory of Near Infrared (NIR) Spectroscopy and
itsapplications in the field of fruit quality analysis.
Keywords:NIR, wavelength, transmittance,
reflectance,multivariate approach, PLS, MLR etc.
Introduction
India is an agricultural nation and stands prominent
among all nations in the production of fruits & vegetables. National Horticulture Board (NHB) [12] estimated year wise
fruit production in India in terms of Thousand Million Tones
Graph 1). The fruit and vegetable sector has a vital role in
farm income enhancement, poverty alleviation, food security,
and sustainable agriculture in India. This sector, however,
suffers greatly from postharvest losses. The estimates suggest
that about 30–40% of fruits and vegetables are damaged after
leaving the farm gate. These huge postharvest losses in India
are mainly because of lack of improved technology and
instrumentation for getting right information about storage life
during ripening and transportation.
The increased awareness and sophistication of
consumers have created the expectation for improving quality
in fruits. Visual inspection of the fruits by human eyes is a
primary method of quality inspection commercially. This
method for fruit quality evaluation is time consuming, tedious,
and inherently inconsistent and the results may not be reliable
due to human errors or inexperienced technicians. Therefore a
quick and more reliablefruit quality evaluation system is
needed. In view of this, automated fruit quality analysis using
machine vision is desirable to achieve fast and objective
quality measurement.
Graph 1: Area & Production Growth Trends of fruits in
Thousand Million Tones.(Source: Indian Horticulture
Database)
Based on image processing and analysis, machine
vision using NIR spectroscopy (NIRS) is a novel technology
for recognizing objects and extracting quantitative
information from digital images[1]. It provides multi-constituent analysis with a very high level of accuracy and
precision as compared to conventional methods. Another
important advantage of near-infrared analysisis that it doesn’t
require any sample preparation or manipulation with
hazardous chemicals, solvents etc. Therecorded NIR spectra
contain a variety of chemical and physical information of the
sample to be analyzed. The biological constituents of fruits
are often complex and therefore require special mathematical
procedures for dataanalysis. This paper provides an overview
of the critical factors that are useful and necessarywhen
developing and implementing NIR spectroscopic methods for the assessment of various quality parameters of fruits.
Working Principle of NIRS
If matter is exposed to electromagnetic radiation,
(Fig. 1) e.g. infrared light, the radiation can be absorbed,
transmitted, reflected, scattered or undergo
photoluminescence.
Fig.1 Interaction of organic material with EM Radiations.
International Journal of Engineering Research and Technology. ISSN 0974-3154 Volume 10, Number 1 (2017) © International Research Publication House http://www.irphouse.com
835
The NIR spectrum consists of anumber of absorption bands
that vary in intensity due to energy absorption by
specificfunctional groups in a sample. NIRS can measure the
concentration of components having different molecular
structuressuch as protein, water, or starch in an organic material such as fruit. The NIR spectral region,from 700 to
2500 nm, lies between the visible and mid-infrared regions of
theelectromagnetic spectrum. NIR spectra consist of
overtonesand combination bands of the fundamental
frequencies in the mid-IR region. NIR energy can easily pass
through many organicsubstances due to its lowreflectivity and
low absorptivity property.
NIRS technology transfers radiation energy to
mechanical energy associated with the motion of atoms held
together by chemical bonds in a molecule.
Methodology
NIRS is much advantageous over visible (Vis) or
mid- infrared (MIR) spectroscopy. But NIR spectra are very
complex. It consists of many overlapping peaks resulting
broad bands. The chemical, physical, and structural properties
of all species present in the fruit samplemay affect the spectral
measurements. Also small sample-to-sample differences of a
sample series can causevery small spectral differences i.e. the
NIR spectral data obtained is depending on more than one
variable simultaneously and thus this data is multivariate.This
makes it difficult to interpret NIR spectra visually, assign specific features to specific chemicalcomponents or extract
information contained in the spectraeasily.Therefore it is
necessary to make use of multivariate approach for the data
analysis to filterinformation that correlates to a certain
property from a very big amount of data.
In qualitative andquantitative NIR analysis, the
relevant part from the multivariate NIR spectral data is
extractedwithout losing important information and to get rid
of unwanted information. Multivariate analysis uses
information derived frommultiple wavenumbers or
wavelengths instead of single one. And thus the calibration is
based on therelationship between the spectral variances at particular wavenumbers or wavelengthsand changes in the
concentration. Fig. 2shows the NIR reflectance spectra of
banana at different time intervals which will be useful in
determining the firmness & moisture content in it.
Fig.2: NIR spectral Variation of Banana.
The quality parameters of banana fruit such as
moisture content and firmness were measured and the values
were used for the development of prediction model using
spectral data. Prediction model between the spectral reflectance and the quality parameters (Moisture content and
firmness) of the bananas is developed by using partial least
squares (PLS) analysis. The reflectance values at 1148
wavelengths of the fruits weretaken as predicting variables X
matrix andthe quality attributes were taken as dependent
variables Y matrix[2]. The PLS models are generally used to
set up the multivariatemodel based on two data sets of the
same object/sample namely spectral and biological values.
The PLS can transform thelarge set of highly correlated
experimental data into independentlatent variables or factors.
Using PLS algorithm, the predicted value of the
attribute ofinterest is determined with the help of thewavelength scores, the number of PLS factors, and
regression coefficient. The optimal number of latent variables
forestablishing the calibration model is determined based on
thepredicted residual error sum of squares. In fact, it’s
important to select the wavelengths, which contributeto the
quality attribute of the sample. So, the highestabsolute value
of the coefficients correspond to thewavelengths obtained
from the PLS calibration model was selectedand used as the
optimal wavelengths. Then these selected optimalwavelengths
were used to establish multiple linear regressionmodels using
MATLAB. MLR can be established with the help of following expression.
Y’= 𝐴0 + [ 𝐴𝑛𝑛𝑛−1 ∗ 𝑅𝑛𝝀
where, Y’is the predicted value of the quality attribute, n is
thenumber of optimal wavelengths Ao and An are the
regression coefficients,and 𝑅𝑛𝝀is the reflectance at a
wavelength k corresponding tothe Nth term in the model.
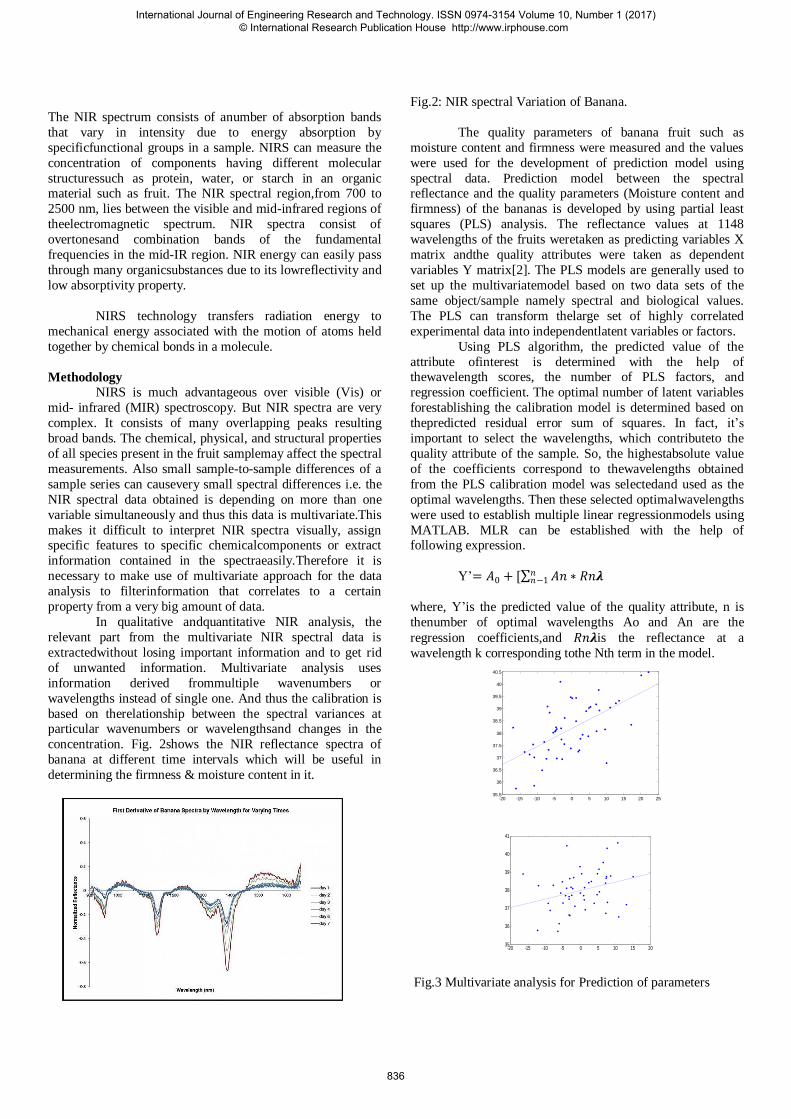
Fig.3 Multivariate analysis for Prediction of parameters
-20 -15 -10 -5 0 5 10 15 20 2535.5
36
36.5
37
37.5
38
38.5
39
39.5
40
40.5
-20 -15 -10 -5 0 5 10 15 2035
36
37
38
39
40
41
International Journal of Engineering Research and Technology. ISSN 0974-3154 Volume 10, Number 1 (2017) © International Research Publication House http://www.irphouse.com
836
Principal component analysis (PCA) is conducted on
the reflectance spectra data to determine the reliability of the
selected wavelengths representingdifferent ripening/maturity
stages [8]. The PCA transforms the acquired data set into a
new coordinatesystem with the greatest variance of the data
set projected in thefirst coordinate (also called the first principal component) andthe second greatest variance on the
second coordinate and so on.The PCA is mainly used in
dimensional reduction of the acquireddata set while retaining
the important characteristic, which contributesmost of the
variance.The average spectral reflectance in the range of 900–
1600 nmcollected from the banana fruits at different maturity
stages fromday one to day7. The banana fruits at day1, 2& 3
showed that themoisture content influenced the formation of
characteristicabsorption bands. The reflectance values were
comparatively lowerin matured fruits representing the days 4,
5, and 6 & 7 when comparedto the banana fruits representing
at early stages. Few of spectral bands showed the water contentof
the fruit, which clearly defined the variation based on
theamount of moisture available in the fruits. Since, the unripe
fruitpeel had higher moisture and correspondingly the
reflection isalso higher for the unripe fruit representing days 1
and 2. Thereflection was lower in the fruits representing the
days 3, 4,5, and 6 due to lower moisture content in the fruit
peel. The overall difference in reflection spectra of the banana
fruitsmight be due to the noticeable changes that took place
simultaneouslyduring ripening such as change in firmnessand
moisture content. The PLS calibration models were established for the
bananafruits using the average spectra of the whole spectral
range of1148 wave bands. The number of latent factors for
PLS model forpredicting the maturity stages in terms of
quality parameterswas determined by selecting the lowest
value of predicted residualerrors sum of squares (PRESS).
Conclusion:
Banana fruit quality and maturity stages were studied at
different times i.e. from day1 to day 7 by using NIR imaging
technique. The quality parameters like moisture content, and
firmness are determined and correlatedwith the spectral data. The spectral data are analyzed using the partial least square
analysis. Theoptimal wavelengths are selected using predicted
residual error sum of squares. The principal
componentanalysis is also used to test the variability of the
observed data. By using multiple linear regressions(MLR),
models were established based on the optimal wave lengths to
predict the quality attributes.
[1] Williams,P., Norris, K., 1987. Near Infrared
Technology in the Agricultural and FoodIndustries. American Association of Cereal Chemists, Inc, St.
Paul, MN.G.Y.
[2] Chandra Sekhar Nandi, BipanTudu, Maturity
Prediction System for Sorting of Harvested
Mangoes‖, IEEE transactions on instrumentation and
measurement, vol. 63, no. 7, july 2014
[3] Lu Wang ; XinTian ; Anyu Li ; Hanxiao Li,
―Machine Vision Applications in Agricultural Food
Logistics‖, IEEE transaction on Business Intelligence
and Financial Engineering (BIFE), 2013, DOI:
10.1109/BIFE.2013.28, Page(s): 125 – 129.
[4] Coker, M. ;Akgul, Y.S., ―Classification and mass
measurement of nuts using X-Ray images‖ IEEE
transaction on Signal Processing and Communications Applications Conference (SIU),
DOI: 10.1109/SIU.2013.6531359, Publication
Year:2013.
[5] Vega, F. ; Torres, M.C. ―Automatic detection of
bruises in fruit using Biospeckle techniques‖, IEEE
transaction on Image, Signal Processing, and
Artificial Vision 2013 XVIII Symposium DOI:
10.1109/STSIVA.2013.6644916, Publication Year:
2013.
[6] Lu Wang ; Anyu Li ; XinTian ―Detection of Fruit
Skin Defects Using Machine Vision System‖, IEEE
transaction on Business Intelligence and Financial Engineering BIFE, 2013 6th International
Conference on, DOI: 10.1109/BIFE.2013.11,
Publication: 2013.
[7] Janardhana, S. ; Jaya, J. ; Sabareesaan, K.J. ;
George, J. ―Computer aided inspection system for
food products using machine vision — A review‖,
IEEE transaction on Current Trends in Engineering
and Technology (ICCTET), 2013 International
Conference on DOI:
10.1109/ICCTET.2013.6675906, Publication Year:
2013. [8] Afrisal H., Faris, M., ― Portable smart sorting and
grading machine for fruits using computer vision‖,
IEEE transaction on Computer, Control, Informatics
and Its Applications (IC3INA), 2013 DOI :
10.1109/IC3INA.2013.6819151 Publication Year:
2013.
[9] Hong-Quan Dang ; Intaek Kim ; Byoung-Kwan Cho
; Kim, M.S. ―Detection of bruise damage of pear
using hyperspectral imagery‖, IEEE transaction on
Control, Automation and Systems (ICCAS),
Publication Year: 2013, Page(s): 1258 – 1260.
[10] Nandi, C.S. ; Tudu, B. ; Koley, C., ―Machine vision based automatic fruit grading system using fuzzy
algorithm‖, IEEE transaction on Control,
Instrumentation, Energy and Communication
(CIEC), 2014 DOI: 10.1109/CIEC.2014.6959043,
Publication Year: 2014 , Page(s): 26 – 30.
[11] Y. Gan and Q. Zhao, ―An effective defect inspection
method for LCD using active contour model‖, IEEE
Trans. Instrum. Meas., vol. 62, no. 9, pp. 2438–2445,
Sep. 2013.
[12] Indian Horticulture Database 2013.
International Journal of Engineering Research and Technology. ISSN 0974-3154 Volume 10, Number 1 (2017) © International Research Publication House http://www.irphouse.com
837